Pendulums Part 1 Answer Key -...
27
Amusement Park Physics With a NASA Twist EG–2003–03–010–GRC 98 Pendulums—Part 1—Answer Key Pendulums swing back and forth in a regular pattern. One back and forth movement is called a vibration. The time it takes to complete one vibration is called the period. This lab tests the effects of different lengths of string on the period of a pendulum swing. Task Test what will happen to the period of a pendulum when the length of the string changes. Hypothesis Predict how you think the string length will affect the period. (Will the period of the pendulum change when you change the length of the string?) Write your prediction here. Procedure 1. Tie the paper clip to the end of a string so that you have 1 meter of string length to work with, measuring from the middle of the paper clip. Allow enough extra string for tying. 2. Attach the top of the string to a ring stand or the edge of a table with tape so the paper clip can hang freely without touching the floor. Remeasure to make sure that the total length is 1 meter. 3. Hang the washer onto the paper clip and pull it to the side at a small angle and release. 4. Count the number of vibrations that occur in 30 seconds. A vibration is one swing out and back. 5. Do three trials and average the results. 6. Record your averages in the table on the next page. 7. Repeat steps 3 through 5, decreasing the string length by 10 centimeters each time. Continue for a total of 10 trials. 8. Make a coordinate graph of the results comparing the average number of vibrations in 30 seconds (y-axis) to the length of the pendulum string (x-axis). Don’t forget to label! Materials • Stopwatch • 1-meter string • One washer • Meter stick • Tape • Paper clip • Ring or support stand Names Date As the length of the pendulum decreases, the speed increases. Thus the period or time for each vibration decreases as the length is shortened.
Transcript of Pendulums Part 1 Answer Key -...

Amusement Park Physics With a NASA Twist EG–2003–03–010–GRC
98
Pendulums—Part 1—Answer Key
Pendulums swing back and forth in a regular pattern. Oneback and forth movement is called a vibration. The time ittakes to complete one vibration is called the period. This labtests the effects of different lengths of string on the period of apendulum swing.
TaskTest what will happen to the period of a pendulum when thelength of the string changes.
HypothesisPredict how you think the string length will affect the period.(Will the period of the pendulum change when you changethe length of the string?) Write your prediction here.
Procedure1. Tie the paper clip to the end of a string so that you have 1 meter of string length to work with, measuring from the middle of the paper clip. Allow enough extra string for tying.2. Attach the top of the string to a ring stand or the edge of a table with tape so the paper clip can hang freely without touching the floor. Remeasure to make sure that the total length is 1 meter.3. Hang the washer onto the paper clip and pull it to the side at a small angle and release.4. Count the number of vibrations that occur in 30 seconds. A vibration is one swing out and back.5. Do three trials and average the results.6. Record your averages in the table on the next page.7. Repeat steps 3 through 5, decreasing the string length by 10 centimeters each time. Continue for a total of 10 trials.8. Make a coordinate graph of the results comparing the average number of vibrations in 30 seconds (y-axis) to the length of the pendulum string (x-axis). Don’t forget to label!
Materials• Stopwatch• 1-meter string• One washer• Meter stick• Tape• Paper clip• Ring or support stand
Names Date
As the length of the pendulum decreases, the speed increases. Thus the
period or time for each vibration decreases as the length is shortened.
Amusement Park Physics With a NASA Twist EG–2003–03–010–GRC
99
Length of string 100 cm 90 cm 80 cm 70 cm 60 cm 50 cm 40 cm 30 cm 20 cm 10 cmAverage number
of vibrationsin 30 seconds
Conclusion (Write answers in complete sentences.)1. What effect does the length of string have on the period of a pendulum? Explain.
2. Name three common amusement park rides or other objects that are examples of pendulums in action.
Title:
50
40
30
20
10
00 10 20 30 40 50 60 70 80 90 100
Length, cm
Average number of vibrations versus length of a pendulum
Num
ber o
f vib
ratio
ns
Increasing string length
The shorter the length of the pendulum, the shorter the period.
Examples of pendulums are rides such as the Pirate Ship, the Mirage, the Texas Twister, Time Warp, Ocean Motion.
Some objects that are pendulums are a grandfather clock and a child’s swing.
14.9 15 16.7 17.9 19.3 21.1 23.6 27.3 33.4 47.3
Amusement Park Physics With a NASA Twist EG–2003–03–010–GRC
100
Pendulums—Part 2—Answer Key
Pendulums swing back and forth in a regular pattern. Oneback-and-forth movement is called a vibration or oscillation.The time it takes to complete one vibration is called theperiod. This lab is going to test the effects of different masseson the period of a pendulum swing.
TaskTest what will happen to the period of a pendulum when themass attached to the string changes.
HypothesisPredict how you think the mass attached to the pendulum willaffect the period. (Will the period of the pendulum changewhen you change the mass attached to the string? If so, how?Will more mass cause the period to shorten or increase?)Write your prediction here.
Procedure1. Glue Velcro® to the outside of the lid of a film canister. Attach one end of a string to the Velcro®. Use enough string so that the total length from the bottom of the film canister to the point of attachment is 60 centimeters, allowing extra string for tying.2. Tie the top of the string to a ring stand, support rod, or the edge of a table so that the canister can hang freely without touching the floor.3. Put a washer inside the canister and close the lid. Pull the canister to the side at a small angle and release.4. As the canister (with the washer inside) swings, count the number of vibrations that occur in 30 seconds. A vibration is one out and back swing.5. Do this three times and average your results.6. Record each average in the table on the next page.7. Repeat steps 3 through 5, adding another washer each time to the canister. Continue for a total of 10 trials.8. Make a coordinate graph of the results comparing number of vibrations that occur in 30 seconds (y-axis) to the number of washers (x-axis). Don’t forget to label!
Materials• Stopwatch• 60-centimeter string• Ten washers or masses• Meter stick• Tape• Film canister• Ring or support stand• Velcro®
Names Date
The period of the swing will not be affected by changing the mass.

Amusement Park Physics With a NASA Twist EG–2003–03–010–GRC
101
Conclusion (Write answers in complete sentences.)1. What effect does the mass attached to the string have on the period of a pendulum?
2. Two grandfather clocks are built at factories across town from each other. One is made of bronze and one is made of plastic. Is it possible for the two clocks to keep the same time? Explain.
Number of washers 1 2 3 4 5 6 7 8 9 10Average number
of vibrationsin 30 seconds
19 19 19 19 19 19 19 19 19 19
Title:
50
40
30
20
10
00 1 2 3 4 5 6 7 8 9 10
Number of washers, mass
Average number of vibrations versus number of washers (mass) of a pendulum
Num
ber
of v
ibra
tions
Increasing number of washers
Changing the amount of mass does not affect the period of the pendulum.
It is possible for the two clocks to keep the same time as long as their pendulums are the same length.

Amusement Park Physics With a NASA Twist EG–2003–03–010–GRC
102
Collisions—Part 1—Answer Key
TaskYou will be observing colliding marbles, which demonstrate theconservation of momentum. The momentum of a moving objectis the product of its mass and its velocity (M = mv). If all of themarbles are identical in mass and size, a moving marble willtransfer its momentum to a stationary marble when they collide.
ParameterMake sure your marbles are identical in size and mass.
Names Date
10
10cm 2 3 4 5 6 7 8 9 10 11 12 13 14 15 16 17 18 19 20 21 22 23 24 25 26 27 28 29 30
2 3 4 5 6 7 8 9 10 11 12
Materials• Plastic ruler with center groove (30 centimeters long) or similar items for tracking the marbles, such as grooved wooden molding• Eight identical marbles
Don't forget to return the marbles.
Procedure1. Place all eight marbles in the ruler groove next to and touching each other.2. Pull one of the marbles about 10 centimeters away from the rest and then push it back toward the other marbles, giving it some speed. Note what happens when the marbles collide.3. Place the marbles back at their original position and pull two marbles about 10 centimeters away from the rest. Push the two marbles together toward the other six marbles so that they collide. Note what happens after the collision.4. Repeat step 3 with three marbles, then four marbles, and finally, five marbles.
Conclusion1. When one marble bumps against the other seven, why does just one marble move away?
2. Did the other six marbles move much after the first collision? Why?
3. How many marbles moved away when you pulled three marbles back and made them collide with the remaining five marbles?4. If you were to use a twice-as-massive marble to collide with the seven other marbles of regular mass, would that cause just one marble to move away? Explain.
5. Would the end marble also move faster when one is hitting the row with a faster speed?
Momentum is conserved in elastic (frictionless) collisions. One marble impacts the other with a mass times velocitycausing another marble of the same mass to move away with the same speed as the impact speed (disregarding friction).
Momentum was transferred from the first marble through the line of marbles to the last marble.No, they did not.
Three marbles moved away and two marbles remained stationary.
No, in order for momentum to beconserved, the mass times velocity of the initial marble equals the mass times velocity of the marbles that move off. The moremassive marble would cause two (or more, depending on how massive the marble is) smaller marbles to move off slowly.
Yes,
the mass times velocity of the initial marble equals the mass times velocity of the marbles that move off. The faster the veloc-ity of the incident marble, the faster the end marble will fall off if the masses are equal.

Amusement Park Physics With a NASA Twist EG–2003–03–010–GRC
103
Collisions—Part 2—Answer Key
TaskYou will cause two moving marbles to collide and observe thedirection of the movement after collision.
ParametersMake sure your marbles are identical in size and mass.
Procedure1. Make a ramp using each of the rulers and a support, such as a board or a book.2. Place the ends of the rulers that are resting on the table facing each other separated by a 10-centimeter distance, as shown in figure 1.3. Place a marble at the top of each ruler and then release the marbles at the same time. Note and record the direction of movement after the marbles collide.
4. Move the rulers farther apart so that there is 20 centimeters between them. Place a marble at the top of each ruler. Give one of the marbles a push, and let the other marble roll without a push (one fast-moving, one slow-moving). Note and record the differences between this collision and the collision in the previous step.
5. Place one marble on the table 10 centimeters from the base end of one ruler to be a target. Place the other marble at the top of the ruler ramp, releasing it to hit the target marble. Note and record the direction of movement after the marbles collide (see fig. 2).
6. Change the direction of the rulers so that they will collide and hit perpendicular to each other. Note and record the direction of movement after the marbles collide (see fig. 3).
Names Date
Materials• Two plastic rulers with center groove (30 centimeters long) or similar items for tracking the marbles, such as grooved wooden molding• Two identical marbles• Two identical books or boards to use as ramp supports
Figure 1.
Figure 2.
Figure 3.
10 cmAfter collision, each
marble will rebound backward at the same speed.
marble should rebound back at a slower rate, and the slower marbleshould rebound at a faster rate, due to momentum transfer.
After collision, the fast-moving
target marble will move forward with the same speed as the incidentmarble, and the incident marble will stop.
After collision, the
After collision, the marbles will move off in a diagonal path to theoriginal and at a slower speed.

Amusement Park Physics With a NASA Twist EG–2003–03–010–GRC
104
Conclusion1. Describe or illustrate how the marbles moved after they collided head-on in step 3 of the procedure. Is KE conserved?
2. The marble that was pushed has more KE, because it is moving faster. After the collision, which marble has more KE?
3. Although the bumper car riders are strapped in and do not fly out of the car, their heads are relatively free to move. Two bumper cars have riders that are the same size and mass, but rider A’s car is moving faster than rider B’s car when the cars collide head-on.
a. What will be the resulting motion of each rider’s head after collision (assuming they stay attached to the bodies)?
b. What will be the resulting motion of the cars after the collision?
4. If the marble sitting still at the bottom of the ramp, in step 5 of the procedure, were twice as massive as the marble rolling down the ramp, how would the resulting movement of marbles be different than what you observed?
5. Illustrate or describe the movement of the marbles after the collision that was set up in step 6 of the procedure. Is the KE of the marbles conserved after the collision?
6. How is the direction of movement following the collision in step 7 different from that in step 8 of the procedure?
7. Remove one of the rulers, placing the other ruler so that it faces the ramp stand directly head-on. Place a marble at the top of the ruler and release it. Note the direction that the marble moves after it collides with the ramp stand (see fig. 4).
8. Move the ruler so that it is at an angle with the ramp stand so that the marble will not hit head-on, such as in a side- impact collision (see fig. 5). Note the direction that the marble moves after it collides.
9. Return the marbles to your teacher when you are finished with this activity.
Figure 4.
Figure 5.
The marbles will move off in a diagonal line from the original paths and at a slower speed. KE is not conserved.
The marble will rebound directly backwardwith the same speed of impact.
The marble will reflect off theramp stand with the same speed and angle of impact.
Each marble will move the opposite way after collision with the same speed.
The slower marble should move the opposite way with a faster speed having moreKE, and the faster one should rebound at a slower speed than its original speed, having less KE.
of the rider in the faster moving car will lose speed and therefore lose KE when rebounding. The head of theslower rider will recoil with a faster speed and thus gain KE when rebounding.
The riders have the same initial speed as the cars they are riding. The head
The faster moving car will loseKE when rebounding and transfer the momentum to the slower car, which will gain KE when rebounding.
ramp at the same angle that it hit. However, both examples illustrate the law of reflection, which states that theangle of incidence equals the angle of reflection.
Because it is twice as massive, the target marble will move more slowly than the
The marble will rebound straight back in step 7, while the marble in step 8 will reflect off the
incident marble. Thus, KE is not conserved.
KE is conserved.

Amusement Park Physics With a NASA Twist EG–2003–03–010–GRC
105
• A gap where two pieces of track do not touch each other• A run that a marble can roll the entire distance of the track (except at the gap)
2. Time five complete marble runs.3. Sketch the shape of the coaster below.4. Label the forces that are present during the marble run (include gravitational, centripetal, and frictional).5. Label energy transformations in your diagram where the potential energy and kinetic energy increases or decreases.Roller Coaster Diagram Average time for 5 trials
Marble Run—Part 1—Answer Key
TaskYou will work as a group to build a roller coaster and todiagram the forces of motion and energy transformations thatapply to the track.
Parameters1. Use 5.49 meters (18 feet) of copper pipe insulation for the track.2. Select any type of marble, but only one marble. You will be able to make one switch if you want to change marble type.3. Avoid putting tape on the surface of the track on which the marble rides.4. This is not a race, so take time to enjoy it.
Procedure1. As a group, build a roller coaster that has
• An initial hill and one additional hill• A complete loop
Names Date
Materials• Three half pieces of copper pipe insulation (gray, spongy); each piece 1.83 meters or 6 feet• Masking tape• One marble• Stopwatch• Meter stick
Don't forget to label!
2.00 seconds
Gravitational force
Frictional force Frictional forceCentripetal force
PE KE Gravitational forcePE KE
PE KE
PE KE

Amusement Park Physics With a NASA Twist EG–2003–03–010–GRC
106
Scale drawing of roller coaster: 1 block = 20 centimeters(Suggestion: Photograph your roller coaster with two meter sticks at right angles to represent theX and Y axes. Answers will vary.)
Names Date
Materials• Three half pieces of copper pipe insulation (gray, spongy); each piece 1.83 meters or 6 feet• Masking tape• One marble• Stopwatch• Meter stick• Digital camera (optional)
Make sure you leave enough time to make the scale drawing and time five marble runs.
Marble Run—Part 2—Answer Key
TaskYou will work as a group to calculate the average speed of amarble for the team’s roller coaster, and to draw the rollercoaster to scale.
Parameters1. Use 5.49 meters (18 feet) of copper pipe insulation for the track.2. Select any type of marble, but only one marble. You will be able to make one switch if you want to change marble type.3. Avoid putting tape on the surface of the track on which the marble rides.
Procedure1. As a group, build a roller coaster that has
• An initial hill and one additional hill• A complete loop• No gap• A run that a marble can roll the entire distance of the track
2. Draw a scale drawing of your roller coaster using the grid graph below.3. Time the marble from start to finish five times and calculate the average time of travel.4. Calculate the average speed of the marble. (s = d/t, where s = speed, d = distance, and t = time)

Amusement Park Physics With a NASA Twist EG–2003–03–010–GRC
107
Data and Calculations
Trial1
2
3
4
5
Average
5.49
5.49
5.49
5.49
5.49
5.49
2.68
3.06
2.78
2.70
2.72
2.79
2.03
1.78
1.96
2.02
2.00
1.95
Distance, m Time, s Speed, m/s

Amusement Park Physics With a NASA Twist EG–2003–03–010–GRC
108
Names Date
Materials• Two half pieces of copper pipe insulation (gray, spongy); each piece 1.83 meters or 6 feet• Masking tape• One marble• Stopwatch• Meter stick
Marble Run—Part 3—Answer Key
TaskYou will build a roller coaster having a 4-foot hill where themarble stays on the track at all times and then calculate theaverage speed of the marble for five trials.
Parameters1. The first hill must be at a height of 1.22 meters (4 feet) measured from the top of the first hill to the bottom of the first hill.2. The two additional hills should be as tall as possible.3. The marble must run the entire length of two pieces of track, 3.67 meters (12 feet).4. You may add turns or any side motion to the track to increase speed.5. You may try different types of marbles (small, big, heavy, and light).
Procedure1. As a group, build a roller coaster that has
• Three hills• Conditions to allow the marble to remain on the track for the entire run (the marble cannot leave the track at any point)
2. Use a stopwatch to time the marble from the beginning to the end of the track. Repeat for a total of five trials. Record the times below.3. Calculate the average speed of the marble (s=d/t). Record below.4. Draw your roller coaster on the following page and indicate the height of each hill.
Don't forget to return the marbles!
Trial1
2
3
4
5
Average
3.67
3.67
3.67
3.67
3.67
3.67
3.07
2.92
3.00
2.96
3.10
3.01
1.20
1.26
1.22
1.24
1.18
1.22
Distance, m Time, s Speed, m/s
Data and Calculations (Answers will vary.)

Amusement Park Physics With a NASA Twist EG–2003–03–010–GRC
109
Draw your coaster and label the height of each hill in centimeters. Label the four itemslisted in the conclusion below.
Conclusion1. What was the combined height of the three hills of your coaster?2. Indicate on your diagram the one location where the potential energy (PE) of the coaster is the greatest (maximum PE). Note, there can only be one of these for the entire coaster.3. Indicate on your diagram, the area of each hill where PE is decreasing and kinetic energy (KE) is increasing. (PE↓ KE↑ )4. Indicate on your diagram where the KE of the coaster is the highest (maximum KE). Note, there can only be one of these for the entire coaster. When you are finished with your drawing it should have each of the following things labeled:
• Height of each hill• Maximum PE (one only)• Areas of PE↓ KE↑• Maximum KE (one only)
184 cm (answers will vary)
Maximum PE 122 cm
41 cm
21 cm
Maximum KE
PE KE
PE KE
PE KE

Amusement Park Physics With a NASA Twist EG–2003–03–010–GRC
110
Names Date
Materials• Two half pieces of copper pipe insulation (gray, spongy); each piece 1.83 meters or 6 feet• Masking tape• One marble• Stopwatch• Meter stick
Marble Run—Part 4—Answer Key
One of the most exciting parts of a roller coaster ride is feelingweightless while traveling over a hill. If the coaster can simulatethe path of a projectile (like a ball that rolls off a table) the riderswill come close to experiencing free fall and will feel weightless.
TaskAs a group, test three different hill formations to find out theoptimal hill shape for a roller coaster.
Parameters1. Use two pieces of track. The marble must run the entire length of track.2. The marble cannot leave the track at any time from start to finish.3. You may try different types of marbles (small, big, heavy, and light), but you must use the same one for all three hills.
The starting heights will directly affect the speed of the marbles. Each hill shape is optimal for one starting level.
Level 1Level 2
Level 3
Level 1Level 2Level 3
Level 1Level 2Level 3
Hill A
Hill B
Hill C
Procedure1. Tape the two tracks together on the bottom.2. Test three different types of hills (A, B, and C) from three different starting heights (levels 1, 2, and 3). Determine which hill shape is optimal for each starting height. Level 1 is 1.0 meter, level 2 is 0.8 meter, and level 3 is 0.6 meter above the lowest point of the hill (see diagrams below). Note, the height of the middle hill shown in the diagrams are exaggerated for purposes of clarity.

Amusement Park Physics With a NASA Twist EG–2003–03–010–GRC
111
Fill in the table below according to the following descriptions:
Optimal hill—The marble is close to free fall for the longest period of time, and is softly caught atthe bottom. This is the fastest ride while still staying on the track.
Safe hill—The marble stays on the track, but is not traveling as fast as it could, nor does it remainclose to free fall for the maximum amount of time.
Unsafe hill—The marble leaves the track and possibly hits the other side of the track, or the marbledoesn’t have enough speed to go over a hill or complete a loop.
Don't forget to return the marbles!
Startingheight
Hill A Hill B Hill C
1
2
3
unsafe
unsafe
optimal
unsafe
optimal
safe
optimal
safe
safe
Conclusion1. Which hill type is optimal when starting the marble at level 1, and why do you think this is true?
2. Which hill type is optimal when starting the marble at level 2, and why do you think this is true?
3. Which hill type is optimal when starting the marble at level 3, and why do you think this is true?
4. When you ride down a roller coaster hill, does the angle of the slope of the track make a difference in the sensation that you get on the ride? Why?
Hill C because level 1 has the highest starting point and the highest middle hill requiring the most potentialenergy.
Hill B because level 2 is the middle starting point and has the midsized hill requiring a medium amountof potential energy.
Hill A because the lowest starting point has the lowest hill requiring less potential energy.
more frightening the ride, because the track is not supporting the car as much as when it is not as steep.Thus, the rider has the sensation of being in a free-fall environment.
The steeper the slope of the hill, the

Amusement Park Physics With a NASA Twist EG–2003–03–010–GRC
112
Free-Fall RidesGround Measurements—Answer Key
Stand near the ride entrance to take the following measurements:
1.
2.
3. Calculate the average speed of the ride.
Using figure 1, estimate how high the ride car actuallygoes (point A) using the scale drawing method of anglesand point of intersection. If you forgot how to do this, seethe Basic Skills section (page 31). Show your work below.
Estimate the height of point B. Calculate the distancebetween point A and point B. Show your work in the spacebelow.
a) Time the lift from the start point to the highest point (point A in fig. 1) the car travels. Time three different cars as they travel from the start point to point A. Fill in the table below.b) Time the fall from point A to point B. Stop the timer as soon as the car reaches the low point of the ride (point B in fig. 1). Don’t wait for the ride to come to a complete stop. Time three different cars as they travel from point A to point B. Fill in the table below.
A
B
Figure 1.
The height of point B, the end of the ride, isapproximately 3.6 meters above the ground.
35.4 – 3.6 = 31.8 meters
3 cm
3.4 cm
29° 20°
Time trial 1
Lift to A 7.57 s
3.45 s
7.64 s
3.61 s
7.37 s
3.59 s
7.53 s
3.55 s
31.8 m
31.8 m
4.2 m/s
8.9m/sFall fromA to B
Time trial 2 Time trial 3 Average time, s Distance using figure 1 above, m
Average speed,m/s
3.4 cm � 10 m = 34 m 1 cm
34 m + 1.4 m = 35.4 m

Amusement Park Physics With a NASA Twist EG–2003–03–010–GRC
113
Free-Fall RidesRide Measurements—Answer Key
When measuring the end of the fall, make sure that youmeasure the g’s before the ride bends away from the vertical.Always hold the accelerometer so that it is vertical, or themeasurements will not be correct.
1.
2.
3.
Take the accelerometer on the ride to measure theaccelerations (g’s) during the ride.
Complete column g in the data table below.
Indicate with an “X” which of the four locations below havea maximum kinetic energy (KE), maximum potentialenergy (PE), minimum KE, or minimum PE. There shouldbe only one X in each column. That is, there is only onelocation (either during the lift, at the top of the ride, duringthe fall, or the end of the fall) in which there is a maximumKE. Remember, KE is energy of motion and PE is energyof position.
During the lift
At the top of the ride
During the fall
End of the fall
g Maximum KE Maximum PE Minimum KE Minimum PE
X X
X X
1
1
0
0
Amusement Park Physics With a NASA Twist EG–2003–03–010–GRC
114
Roller Coasters—Initial HillGround Measurements—Answer Key
Find a coaster that has an initial hill that can be measuredusing the structure estimation method.
1.
2.
3.
4.
5.
Estimate the height of the first hill from the ground byusing the design of the structures. See the Basic Skillssection (page 31) if you have forgotten how to do it. Showyour work below.
Find the base length of the hill by stepping (see fig. 1).
Calculate the approximate hill distance by using thePythagorean theorem. (Note, this is an approximation ofthe distance down the first hill because the track is curvedat the top and bottom.) Show your work. (base2 + height2 = hill distance2)
Time the roller coaster going down the first hill from pointA to point B as shown in figure 1. Do this three times andfill in the data table below.
Calculate the average speed of the cars down the first hill.First find the average time of your three trials, and thencalculate (s = d/t). Fill in data table below.
Height
Base
Hill distance(approximate)
Figure 1.
Figure 2.
If eye level height = 1.4 meters;Fractional part = 8/10, then 1.4 meters/(8/10) = 1.75 meters(1.75 meters/structure)(6 structures) = 10.5 meters
If base of hill = 32 steps,32/39 = x/30 meters39x = (30)(32) metersx = 24.6 meters
(base)2 + (height)2 = (hill distance)2
(24.6 meters)2 + (10.5 meters)2 = (hill distance)2
hill distance = 26.7 meters
Time trial 1
From A to B 3.0 s 2.6 s 2.8 s 2.8 s 26.7 m 9.5 m/s
Time trial 2 Time trial 3 Average time, s Distance, m Speed, m/s
A
Height
Low point
Base
B
Peak
Amusement Park Physics With a NASA Twist EG–2003–03–010–GRC
115
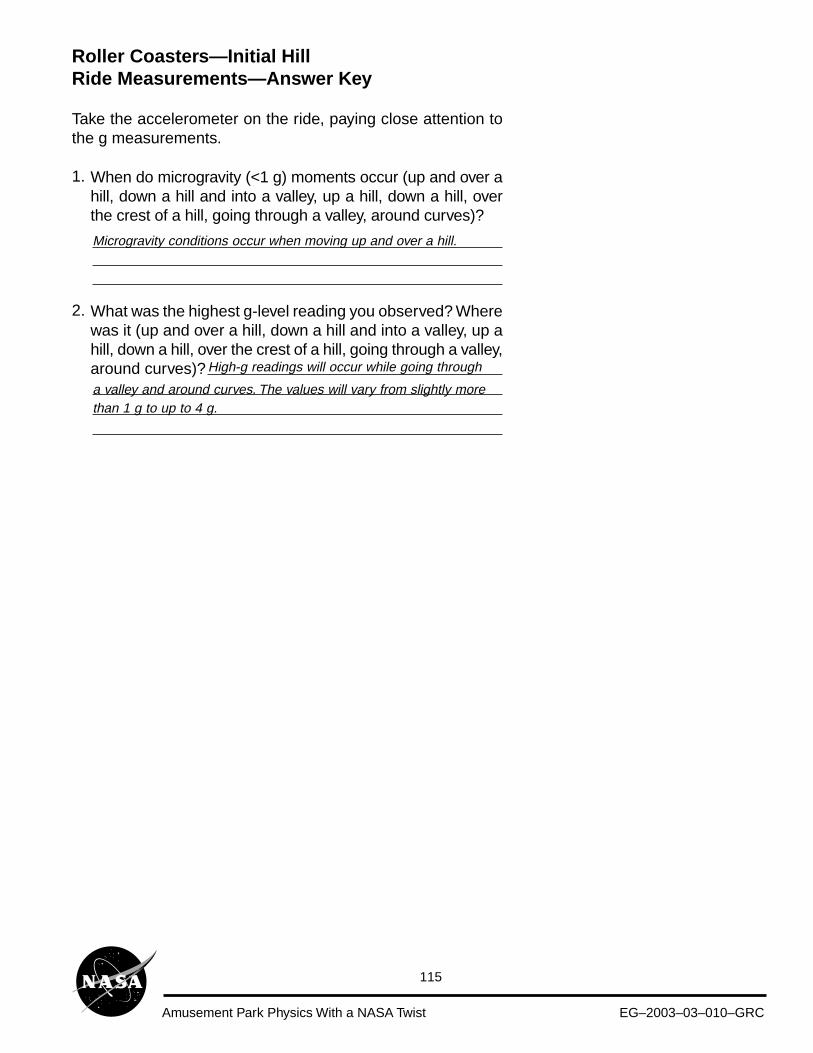
Roller Coasters—Initial HillRide Measurements—Answer Key
Take the accelerometer on the ride, paying close attention tothe g measurements.
1.
2.
When do microgravity (<1 g) moments occur (up and over ahill, down a hill and into a valley, up a hill, down a hill, overthe crest of a hill, going through a valley, around curves)?
What was the highest g-level reading you observed? Wherewas it (up and over a hill, down a hill and into a valley, up ahill, down a hill, over the crest of a hill, going through a valley,around curves)?
Microgravity conditions occur when moving up and over a hill.
a valley and around curves. The values will vary from slightly morethan 1 g to up to 4 g.
High-g readings will occur while going through

Amusement Park Physics With a NASA Twist EG–2003–03–010–GRC
116
Bumper CarsRide Measurements—Answer Key
For each collision shown below, circle the appropriate set of arrows to indicate which direction thecars and riders move immediately after impact. Assume the masses of riders A and B are equal.
A B
A B
1. Head-on collision 2. Rear-end collision
3. Side-impact collision 4. Car hits wall
Before impact
After impactCars:
a.b.c.d.
A BRiders:a.b.c.d.
no motion
no motion
no motion
no motion
A B
A B
Before impact
After impactCars:
a.b.c.d.
A BRiders:a.b.c.d.
no motion
no motion
no motion
no motion
no motion
no motion
A B
A
B
Before impact
After impactCars:
a.
b.
c.
d.
A BRiders:
a.
b.
c.
d.
no motion
A
A
Before impact
After impactCar:
a.b.c.
ARider:a.b.c. no motion
no motion

Amusement Park Physics With a NASA Twist EG–2003–03–010–GRC
117
Bumper CarsRide Measurements—Answer Key
Answer the following questions in complete sentences.
1.
2.
3.
During collision 2, is kinetic energy (KE) conserved?Explain why or why not.
In collision 3, KE is not conserved. If the total energy ofthe system is conserved, where did the KE go?
During collision 4, is KE conserved? Explain why or why not.
Although both cars end up in motion, some KE is lost. The totalenergy of the system, however, is constant, as some of the KE orenergy of motion, is changed to heat and sound. Also, the two carslock up and combine to be a unit. This unit has a large mass, thusthey end up going slower.
loss of energy due to heat and sound formed by the collision, thespeed and thus the KE of car A was transferred to car B.
Yes, KE is conserved. Except for the
There will be some loss due to heat and sound, but most of the KEis conserved as the car rebounds from the wall. The harder thesurface of the wall, the more KE is conserved.

Amusement Park Physics With a NASA Twist EG–2003–03–010–GRC
118
Roller Coasters—Floater HillsGround Measurements—Answer Key
Locate a medium-sized hill on a coaster ride.
1.
2.
3.
4.
Estimate the height of the hill from the ground to thepeak (A) by using the design of the structures. Seethe Basic Skills section (page 31) if you haveforgotten how to do this. Show your work in the box.
Use stepping to find the hill base distance B to C(low points before and after the hill).a) Your steps for 30 metersb) Number of steps takenc) Hill base distance (B to C)(Hint: Multiply the number of steps taken by 30 metersand divide this answer by the number of steps youtake for 30 meters.)
Check the ride information sign by the entrance ofthe ride to find the total distance of the coaster.a) Distance in feetb) Convert your answer to meters
Calculate the average speed of the ride. Stand bythe start and exit area. Take note of the number orcolor of the car you will time. Time the ride fromwhen the train of cars leaves the start gate until itreturns. Time three cars from start to finish. Be sureto convert the time to seconds. Fill in the tablebelow (answers will vary).
A
B C
Peak
Ground level
Show your work here.
If eye level height = 1.4 meters,fractional part = 4/10, then1.4 meters/(4/10) = 3.5 meters3.5 meters � 5 = 17.5 meters
(30 meters/39 steps)(82 steps) = 63 meters
3935 ft � 0.3048 m = 1199 meters 1 ft
39
8263
39351199
Car 1
Total ride 146 s 152 s 144 s 147 s 1199 m 8.16 m/s
Car 2 Car 3 Average time, s Total ridedistance, m
Averagespeed, m/s
17.5 m
Amusement Park Physics With a NASA Twist EG–2003–03–010–GRC
119
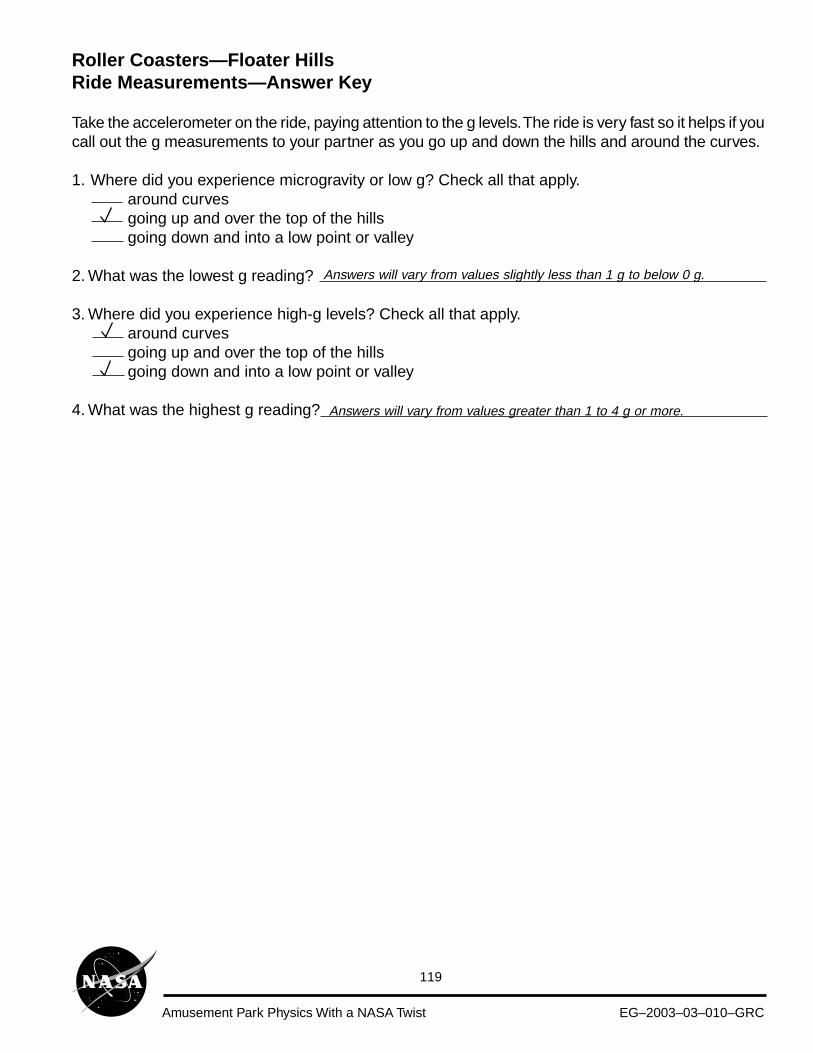
Roller Coasters—Floater HillsRide Measurements—Answer Key
Take the accelerometer on the ride, paying attention to the g levels. The ride is very fast so it helps if youcall out the g measurements to your partner as you go up and down the hills and around the curves.
1. Where did you experience microgravity or low g? Check all that apply.around curvesgoing up and over the top of the hillsgoing down and into a low point or valley
2. What was the lowest g reading?
3. Where did you experience high-g levels? Check all that apply.around curvesgoing up and over the top of the hillsgoing down and into a low point or valley
4. What was the highest g reading? Answers will vary from values greater than 1 to 4 g or more.
Answers will vary from values slightly less than 1 g to below 0 g.

Amusement Park Physics With a NASA Twist EG–2003–03–010–GRC
120
Measuring the angle of the carousel pole
Carousel pole
CarouselsGround Measurements—Answer Key
Determine the revolutions per minute (rpm) of the carousel.
1.
2.
4.
5.
Stand on the ground in front of the carousel and locate aparticular spot on the ride. Make sure that you have a way toremember that spot. Position yourself directly in front of it.
If the ride is not moving, wait until it begins and has madeseveral turns. When the point that you have selected isdirectly in front of you, start your stopwatch and keep itrunning for 5 revolutions.Total time for 5 revolutions in seconds:
Calculate the time for 1 revolution. This is called the periodof rotation of the ride. Time for 1 revolution (period ofrotation):
To find the revolutions per minute of the ride, divide 60 bythe period of rotation, since there are 60 seconds in 1minute. Revolutions per minute:
CarouselsRide Measurements
1.
2.
3.
4.
5.
There is a “lean” of the benches and on the poles that support the animals. When the ride isstationary, use your altitude tracker to determine the angle that an animal in the outer row makeswith the vertical. While holding the tracker vertically, place it against the animal’s support pole,reading the angle between the washer and the zero mark on the tracker. Angle =
Measure the angle that an animal in the inner row makes with the vertical. Angle =
Which animal has a larger angle, the one located in the inner row or the one in the outer row?
Do the same measurements on the very same animals while the ride is in motion.Inner angle: Outer angle:
How do the results of angle measurements compare when looking at stationary ride animalsversus moving ride animals? Explain your answer.
90
90 seconds/5 revolutions = 18 seconds/revolution
(60 seconds/minute)/(18 seconds/1 revolution) = 3.33 rpm
8°
3°
Outer row
0° 0°
centripetal force acting on the horses and the riders. The horses are angled inward, which is similar to bankinga road around curves. Thus, the rider is able to stay on the horse easier.
The motion of the ride (circular path) creates a

Amusement Park Physics With a NASA Twist EG–2003–03–010–GRC
121
Roller Coasters—LoopsGround Measurements—Answer Key
The loops of a roller coaster are not circles; they are calledclothoid loops. Circular loops require a higher amount ofspeed to keep the riders from falling out when they areupside down. Roller coasters use clothoid loops, which havea smaller radius at the top of the loop, and a longer radiuswhere the cars enter and exit the loop (see fig. 1).
Why do you think roller coasters use clothoid loops insteadof circular loops?
Figure 1.
Roller Coasters—LoopsRide Measurements
1.
2.
3.
Figure 2. The dashed line is a paraboliccurve.
When riding in a loop at high speeds, pay close attention towhether you feel heavier, lighter, or normal in your seat. Referto figure 2 to assist you when completing the following table(select one per row).
A rider experiences a different sensation when sitting in the frontthan sitting in the back. First, ride the coaster seated in a frontcar. Secondly, ride the coaster again seated in a back car.Finally, try sitting in the middle of the coaster. In which seatlocation did you experience faster speeds at the top of the loop?
If you had a hat on your head while riding and your hat felloff as the coaster car approached the top of the loop,which way would it go, ignoring air resistance? (Caution:Do not actually try this on the ride!)a) Draw the path of the hat by drawing an arrow on figure 2.b) Which of Newton’s laws applies to the hat when it leaves your head. State the complete law below.
for slower speeds,while still maintaining a curved path, preventing thecar and riders from falling off the track.
The smaller radius at the top of the ride allows
Location of ride Heavier Lighter Normal
Going into loop (A)
At top of loop (B)
Going out of loop (C)
X
X* X* X*
X
A
B
C
One would experience faster speeds when seated in the back.
Newton’s first law of motion: A body in motion continues in motion,in a straight line, unless acted on by an external net force.
*Note, depending on the rider’s speed atthe top of loop, all three choices herewould be correct.

Amusement Park Physics With a NASA Twist EG–2003–03–010–GRC
122
Pendulum RidesGround Measurements—Answer Key
Stand facing the ride, lined up with the center of the pendulum. See point B in the figure below.
1.
2.
3.
4.
5.
6.
Wait until the ride reaches the top of the swing (point C or D) then begin counting the number ofswings, or vibrations (C–D–C) that occur in 30 seconds. Estimate any fractional portions of theswing. Do three trials and calculate an average. Fill in the table below.
Calculate the average time for a swing/vibration by dividing 30 seconds by the average numberof swings. The average number of swings was found in number 4 above.
Explain why the pendulum ride is not actually a true pendulum that falls due to gravity.
A
B
C D
Estimate the height of point A using the “scale drawingmethod.” Show your work, including the diagram.
To determine the radius of the pendulum ride, find the distancethat point B is above the ground. Subtract this number fromthe answer found in number 1 above. Show your work.
The time of a simple pendulum’s swing can be expressed as t = 2π ,where t = time for one full swing in seconds (period), l = length ofpendulum’s radius, π ≈ 3.14, g = 9.8 meters/second2. Calculate theexpected time for one full swing (from C to D to C) for the ride. Showyour work.
2.4 cm
3 cm35° 22°
1 = 35°, 2 = 22°
2.4 cm x 10 m = 24 m
24 m + 1.4 m = 25.4 m1 cm
25.4 meters – 1.6 meters = 23.8 meters
lg
Trial 1
Number of swings/vibrations in 30 seconds
Trial 2 Trial 3 Average
3.8 3.7 3.9 3.8
30 seconds/3.8 vibrations = 7.9 seconds/vibration
The time for a true pendulum with the given radius is 10.4 seconds, while the pendulum ride was only 7.9 seconds.There are motors and other machinery that control the speed of the ride.
23.8 meters9.8 meters/second2
t = 2 � π , then t = 9.8 seconds
Amusement Park Physics With a NASA Twist EG–2003–03–010–GRC
123
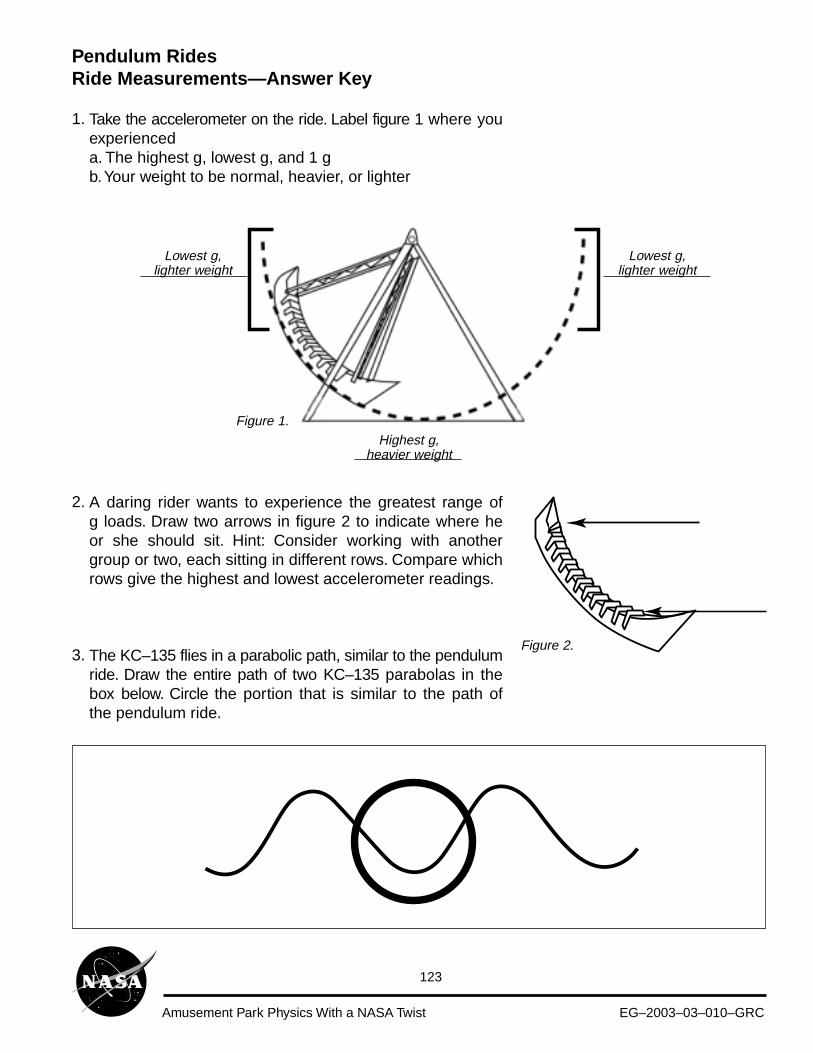
Pendulum RidesRide Measurements—Answer Key
1.
2.
3.
Take the accelerometer on the ride. Label figure 1 where youexperienceda. The highest g, lowest g, and 1 gb. Your weight to be normal, heavier, or lighter
A daring rider wants to experience the greatest range ofg loads. Draw two arrows in figure 2 to indicate where heor she should sit. Hint: Consider working with anothergroup or two, each sitting in different rows. Compare whichrows give the highest and lowest accelerometer readings.
The KC–135 flies in a parabolic path, similar to the pendulumride. Draw the entire path of two KC–135 parabolas in thebox below. Circle the portion that is similar to the path ofthe pendulum ride.
Figure 1.
Figure 2.
Lowest g,lighter weight
Highest g,heavier weight
Lowest g,lighter weight

Amusement Park Physics With a NASA Twist EG–2003–03–010–GRC
124