Hydrodynamic Modelling of the Amazon River Factors of Uncertainty

Preliminary Environmental Information Report: Appendix 16.B
Hydrodynamic modelling

Silvertown Tunnel Preliminary Environmental Information Report
Appendix 16.B: Hydrodynamic Modelling
Page 2 of 53
THIS PAGE IS LEFT INTENTIONALLY BLANK

Silvertown Tunnel Preliminary Environmental Information Report
Appendix 16.B: Hydrodynamic Modelling
Page 3 of 53
Contents
SUMMARY ................................................................................................................. 5
1. INTRODUCTION ....................................................................................... 7
1.1 Background ................................................................................................... 7
1.2 Study site ...................................................................................................... 7
1.3 Scope of work ............................................................................................... 8
2. MODEL DATA ......................................................................................... 11
2.1 Bathymetry .................................................................................................. 11
2.2 Hydrodynamics ........................................................................................... 11
3. MODEL MESH ......................................................................................... 13
3.1 Model mesh background ............................................................................. 13
3.2 Silvertown Jetty ........................................................................................... 13
4. HYDRODYNAMIC SIMULATIONS .......................................................... 17
4.1 Simulations background .............................................................................. 17
4.2 Model validation .......................................................................................... 17
5. MODEL RESULTS ................................................................................... 21
5.1 Current speed difference ............................................................................. 21
5.2 Jetty pile scour ............................................................................................ 29
6. PROPELLER SCOUR ............................................................................. 35
7. CONCLUSION ......................................................................................... 37
Scour depth evolution ........................................................................ 38 Appendix A

Silvertown Tunnel Preliminary Environmental Information Report
Appendix 16 B: Hydrodynamic Modelling
Page 4 of 53
List of Abbreviations
STEP Scour Time Evolution Predictor
PLA Port of London Authority
CD Chart Datum
S(t) Scour depth as a function of time
Glossary of Terms
Neap tide A tide just after the first or third quarters of the moon when there is least difference between high and low water.
Spring tide A tide just after a new or full moon, when there is the greatest difference between high and low water.
Froude number A dimensionless number defined as the ratio of the flow inertia to the external field.
Scour The removal of sediment as a result of fast moving water.
Hydrodynamic model Hydrodynamics is the study of the motion of fluids, in particular water. A hydrodynamic model is a tool to describe the motion of water. In this case it is 2 dimensional, depth-averaged.
MIKE21 Hydrodynamic modelling software.

Silvertown Tunnel Preliminary Environmental Information Report
Appendix 16.B: Hydrodynamic Modelling
Page 5 of 53
SUMMARY
1. A hydrodynamic model of the River Thames between Greenwich and Woolwich was created using MIKE21 Flow Model FM. This model includes tidal and river discharge boundary conditions. Four flow scenario were simulated: spring and neap tidal conditions with mean and maximum river discharge. Simulated water elevations and current speeds were validated against the HR Wallingford Thames Model and show good agreement. Two configurations of the proposed Silvertown Tunnel jetty are included in the hydrodynamic model: straight and skewed. Comparisons are made between simulations with and without the jetty structures to show the impact of the jetty piles on flow velocities. The construction of the jetty causes a reduction in flow velocity around the jetty head and a slight increase on the approach jetty towards the nearshore.
2. An assessment of scour around the jetty piles is made using the simulated velocities for the straight and skewed jetties. The method of Whitehouse1 was applied which defines the scour depth as a function of time. An adjustment factor is applied to account for cohesive sediments following the method of HR Wallingford2 . A maximum scour depth of 0.53m is calculated for the 0.6m diameter piles at the approach jetty and jetty head.
3. Scour of the river bed due to propeller wash from ships berthed at the jetty is also calculated. The depth of scour is directly related to the Froude number, associated with the propeller flux velocity. The largest vessel to be moored at the jetty is assumed to have a propeller diameter of 2.5m, minimum height of propeller axis from the bed of 2.25m and engine power of 1500kW. These conditions give a maximum equilibrium scour depth caused by propeller wash of 2.6m. An assessment of armoured rock size is then made, using a maximum bottom velocity of 0.88m/s, resulting in a minimum armoured rock size of 0.16m.
1 Whitehouse, R. J. S. (1998). Scour at marine structures: A manual for practical applications. Thomas Telford, London, p198. 2 Harris J M., Whitehouse R. J. S., Benson T. (2012). The time evolution of scour around offshore structures – the scour time evolution predictor (STEP) model. HR Wallingford Ltd.

Silvertown Tunnel Preliminary Environmental Information Report
Appendix 16 B: Hydrodynamic Modelling
Page 6 of 53
THIS PAGE IS LEFT INTENTIONALLY BLANK

Silvertown Tunnel Preliminary Environmental Information Report
Appendix 16.B: Hydrodynamic Modelling
Page 7 of 53
1. INTRODUCTION
1.1 Background
1.1.1 A new road tunnel has been proposed by Transport for London (TfL) linking the areas of Greenwich Peninsula and Silvertown, on the banks of the River Thames. As a part of this project a temporary jetty structure, has been proposed on the northern bank of the River Thames, to the east of the mouth of the River Lea, Bow Creek. This report investigates the impact of this structure on the local hydrodynamics and determine the extent of any scour around the piles and alongside the jetty.
1.2 Study site
1.2.1 Figure 1Error! Reference source not found. shows the locations of two jetty structure options on the north bank of the River Thames, with Bow Creek to the West. The proposed jetty is a ‘T’ shaped structure, with a jetty head attached to a straight (blue filled polygonError! Reference source not found.) or skewed (grey filled polygonError! Reference source not found.) approach jetty. Error! Reference source not found. Figure 1 also shows the jetty pile alignments for both of the options, each approach jetty has 12 piles, leading to the jetty head containing 19 piles.

Silvertown Tunnel Preliminary Environmental Information Report
Appendix 16 B: Hydrodynamic Modelling
Page 8 of 53
Figure 1 Location of Silvertown Tunnel jetty structure on the north bank of the River Thames, to the east of Bow Creek
1.2.2 Two jetty options are shown in blue and grey, with dredging areas for vessels shown in the solid pink and orange line polygons. The detail of the jetty options can be seen in the bottom panel.
1.3 Scope of work
1.3.1 The assessment of the impact of the jetty structure will investigate the change in local currents due to the movement of water around the jetty piles. The MIKE21FM hydrodynamic modelling software is applied to

Silvertown Tunnel Preliminary Environmental Information Report
Appendix 16.B: Hydrodynamic Modelling
Page 9 of 53
simulate the tidal hydrodynamics, including the flow of the River Thames and the River Lea. The model is developed on a finite element flexible mesh of triangles, which allows for increased grid resolution around complex areas of coastline and regions of interest, while a coarser resolution can be applied to other regions, allowing for increased model efficiency. MIKE21FM simulates the water level variation and flow in response to a variety of forcing functions in coastal areas as well as inshore waterbodies. The model can include the effects of convective and cross momentum plus momentum dispersion, bottom and surface (wind) shear stresses, coriolis and barometric pressure gradient forcing, evaporation and precipitation, hydraulic structures and wave-induced currents. The simulated hydrodynamics around the jetty piles will allow for an estimate of the extent of river bed scour to be made. The scour assessment will be made using the Scour Time Evolution Predictor (STEP) model developed by HR Wallingford3 .
3 Whitehouse, R. J. S. (1998). Scour at marine structures: A manual for practical applications. Thomas Telford, London, p198.

Silvertown Tunnel Preliminary Environmental Information Report
Appendix 16 B: Hydrodynamic Modelling
Page 10 of 53
THIS PAGE IS LEFT INTENTIONALLY BLANK
Silvertown Tunnel Preliminary Environmental Information Report
Appendix 16.B: Hydrodynamic Modelling
Page 11 of 53
2. MODEL DATA
2.1 Bathymetry
2.1.1 Bathymetry data for the study site was supplied by the Port of London Authority (PLA) at 10m resolution and referenced to Chart Datum. Regions of river bed dredging were manually included in the model bathymetry in accordance with the jetty specifications provided by Atkins Plc.
2.2 Hydrodynamics
2.2.1 Hydrodynamic boundary conditions for the Silvertown Tunnel tidal model, simulated using MIKE21FM, were extracted from the HR Wallingford River Thames model. Water level, both components of current velocity (u and v) and river discharge were supplied at three locations: Greenwich (538500, 178200), Silvertown (539500, 180400) and Woolwich (542000, 179600). A period of 48 hours was covered to allow for model spin up and include a complete tidal cycle. Mean spring and neap tidal conditions where included with mean and high river discharge rates to simulate low, average and high flow conditions around the Silvertown Tunnel jetty structure. Discharge values were also supplied for Bow Creek, the river tributary to the immediate west of the jetty structure.

Silvertown Tunnel Preliminary Environmental Information Report
Appendix 16 B: Hydrodynamic Modelling
Page 12 of 53
THIS PAGE IS LEFT INTENTIONALLY BLANK

Silvertown Tunnel Preliminary Environmental Information Report
Appendix 16.B: Hydrodynamic Modelling
Page 13 of 53
Figure 2 Silvertown model mesh with bathymetry in mCD
3. MODEL MESH
3.1 Model mesh background
3.1.1 The model domain was created to cover the region of the River Thames between Greenwich and Woolwich. The mesh resolution varies from 50m at the eastern and western boundaries to 7m around the Silvertown Tunnel jetty structure. The finite element flexible mesh of triangles used within the MIKE21 modelling software, allows for an efficient increase in
resolution around areas of interest while allowing for coarser resolution in other regions of the model domain.
3.1.2 The mesh resolution can be seen to increase around the location of the proposed jetty (Figure 3).
3.2 Silvertown Jetty
3.2.1 Two options of jetty structure configuration (Figure 1Error! Reference source not found.) were included in the Silvertown model mesh, straight (Figure 3) and skewed (Figure 4). The jetty piles were included as pier structures within MIKE21 FM at a sub-grid scale, with a diameter of 600mm. Location, width and shape of the piles is specified so that the

Silvertown Tunnel Preliminary Environmental Information Report
Appendix 16 B: Hydrodynamic Modelling
Page 14 of 53
Figure 3 Location of the straight jetty orientation within the Silvertown model mesh
Figure 4 Location of the skewed jetty orientation within the Silvertown model mesh
effect on the flow is modelled by calculating the current induced drag force on each individual pile.
3.2.2 An area around the jetty head has been designated as a dredge area in the initial design (Figure 1Error! Reference source not found.) and

Silvertown Tunnel Preliminary Environmental Information Report
Appendix 16.B: Hydrodynamic Modelling
Page 15 of 53
Figure 5 Location of dredged area with the straight jetty orientation included for reference
included in the model domain (Figure 5). This area is dredged to a depth of -4.95mCD to allow for vessels with a draft of 4.642m.

Silvertown Tunnel Preliminary Environmental Information Report
Appendix 16 B: Hydrodynamic Modelling
Page 16 of 53
THIS PAGE IS LEFT INTENTIONALLY BLANK

Silvertown Tunnel Preliminary Environmental Information Report
Appendix 16.B: Hydrodynamic Modelling
Page 17 of 53
4. HYDRODYNAMIC SIMULATIONS
4.1 Simulations background
4.1.1 The conditions simulated with the Silvertown Tunnel hydrodynamic model include spring and neap tidal conditions with mean and high river flow rates. Simulations were made with and without the jetty structure so that the differences in current velocities due to the jetty may be examined. For the simulations with the jetty structures the modification to the bathymetry due to dredging for vessels, as shown in Figure 5, is also included. Table 4-1 shows a simulation matrix of the various jetty, tide and river flow conditions.
Table 4-1 Simulation matrix showing possible configurations for jetty structures, tidal conditions and river flow rates
Jetty Option Tide River flow
None Neap Mean
None Neap High
None Spring Mean
None Spring High
Straight Neap Mean
Straight Neap High
Straight Spring Mean
Straight Spring High
Skewed Neap Mean
Skewed Neap High
Skewed Spring Mean
Skewed Spring High
4.2 Model validation
4.2.1 The simulated hydrodynamic conditions listed in Table 4-1 are compared against the HR Wallingford River Thames model results at a point close to the Silvertown Tunnel jetty (539500, 180400). The HR Wallingford River Thames model is validated against an estuary wide survey undertaken in 2004 as a part of the Environment Agency TE2100 study, with further

Silvertown Tunnel Preliminary Environmental Information Report
Appendix 16 B: Hydrodynamic Modelling
Page 18 of 53
validation in 20094 . Figure 6 - Figure 9 shows the comparisons between the Silvertown model and the HR Wallingford model simulated surface elevation and both components of velocity (u and v). The comparisons in Figure 6 - Figure 9 show very good agreement between simulated hydrodynamics, with occasional differences for peak flood and peak ebb velocity components. However, this is seen as an acceptable level of model comparison and within the limits of the calibration.
Figure 6 Mean neap tide with mean river flow
4 HR Wallingford. (2015). LRS Central London Pier Extensions, hydrodynamic and scour assessment. HR Wallingford Ltd.

Silvertown Tunnel Preliminary Environmental Information Report
Appendix 16.B: Hydrodynamic Modelling
Page 19 of 53
Figure 7 Mean neap tide with high river flow conditions
Figure 8 Mean spring tide with mean river flow conditions

Silvertown Tunnel Preliminary Environmental Information Report
Appendix 16 B: Hydrodynamic Modelling
Page 20 of 53
Figure 9 Mean spring tide with high river flow conditions
Silvertown Tunnel Preliminary Environmental Information Report
Appendix 16.B: Hydrodynamic Modelling
Page 21 of 53
5. MODEL RESULTS
5.1 Current speed difference
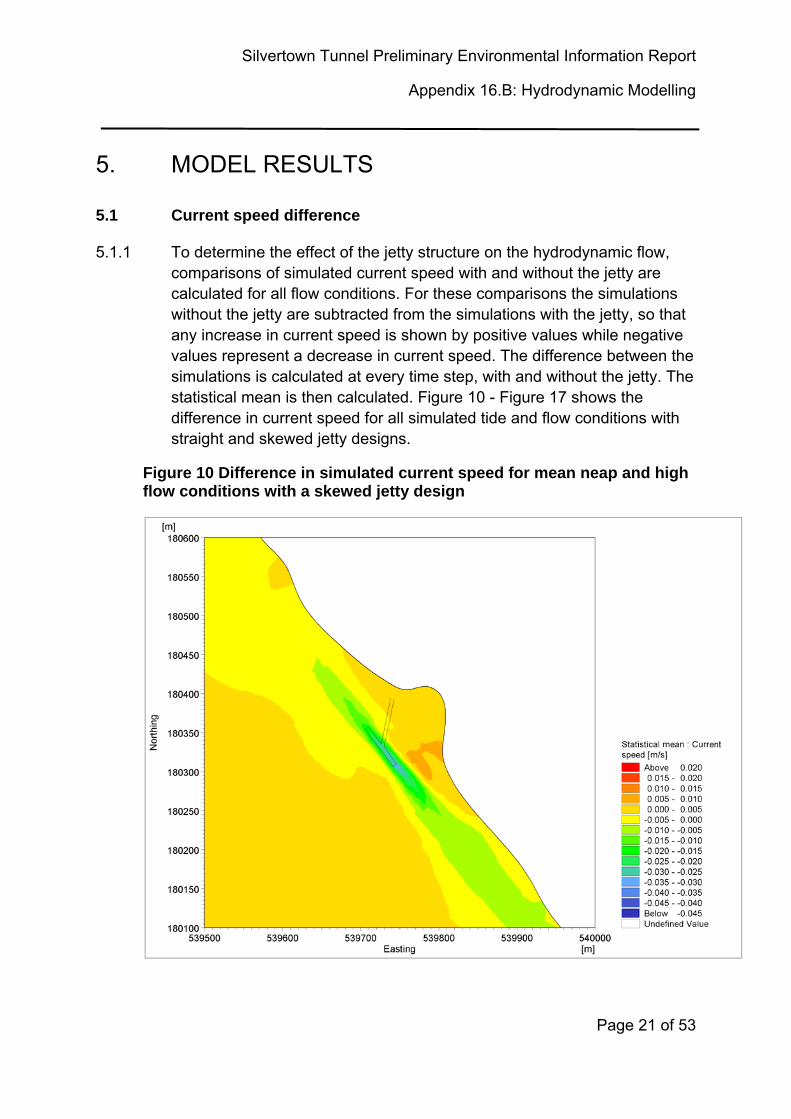
5.1.1 To determine the effect of the jetty structure on the hydrodynamic flow, comparisons of simulated current speed with and without the jetty are calculated for all flow conditions. For these comparisons the simulations without the jetty are subtracted from the simulations with the jetty, so that any increase in current speed is shown by positive values while negative values represent a decrease in current speed. The difference between the simulations is calculated at every time step, with and without the jetty. The statistical mean is then calculated. Figure 10 - Figure 17 shows the difference in current speed for all simulated tide and flow conditions with straight and skewed jetty designs.
Figure 10 Difference in simulated current speed for mean neap and high flow conditions with a skewed jetty design

Silvertown Tunnel Preliminary Environmental Information Report
Appendix 16 B: Hydrodynamic Modelling
Page 22 of 53
Figure 11 Difference in simulated current speed for mean neap and high flow conditions with a straight jetty design

Silvertown Tunnel Preliminary Environmental Information Report
Appendix 16.B: Hydrodynamic Modelling
Page 23 of 53
Figure 12 Difference in simulated current speed for mean neap and mean flow conditions with a skewed jetty design

Silvertown Tunnel Preliminary Environmental Information Report
Appendix 16 B: Hydrodynamic Modelling
Page 24 of 53
Figure 13 Difference in simulated current speed for mean neap and mean flow conditions with a straight jetty design

Silvertown Tunnel Preliminary Environmental Information Report
Appendix 16.B: Hydrodynamic Modelling
Page 25 of 53
Figure 14 Difference in simulated current speed for mean spring and high flow conditions with a skewed jetty design
Silvertown Tunnel Preliminary Environmental Information Report
Appendix 16 B: Hydrodynamic Modelling
Page 26 of 53
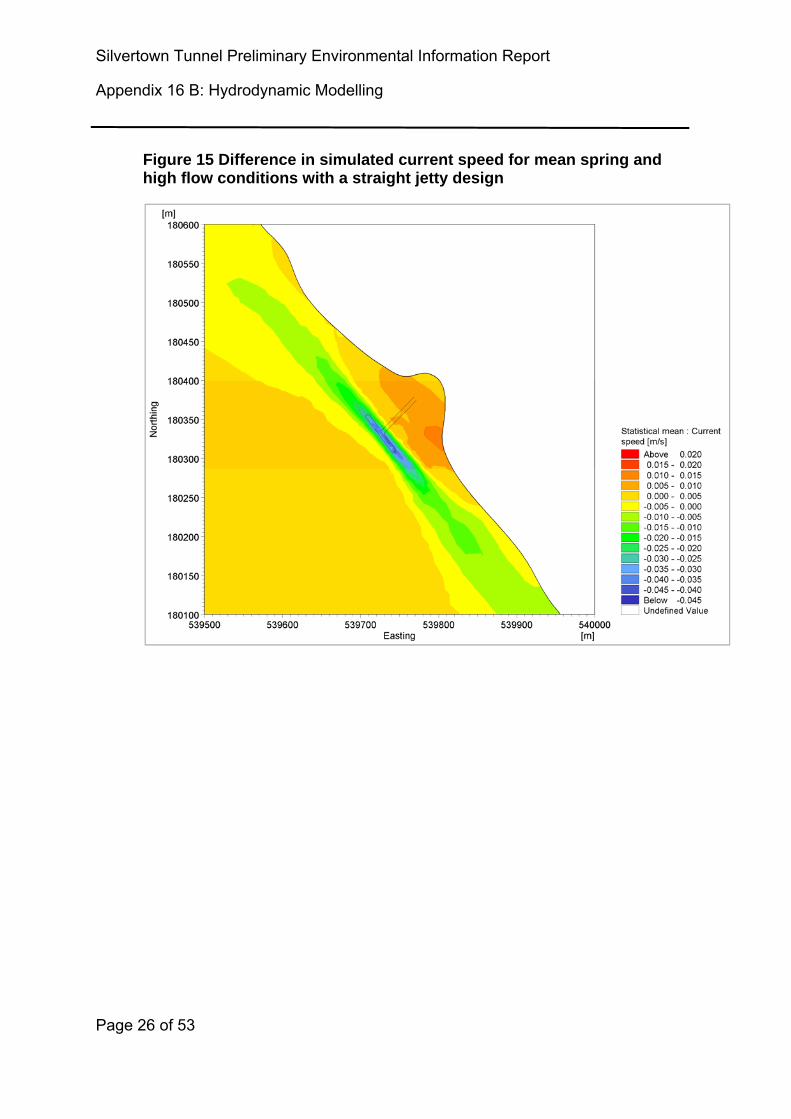
Figure 15 Difference in simulated current speed for mean spring and high flow conditions with a straight jetty design

Silvertown Tunnel Preliminary Environmental Information Report
Appendix 16.B: Hydrodynamic Modelling
Page 27 of 53
Figure 16 Difference in simulated current speed for mean spring and mean flow conditions with a skewed jetty design

Silvertown Tunnel Preliminary Environmental Information Report
Appendix 16 B: Hydrodynamic Modelling
Page 28 of 53
Figure 17 Difference in simulated current speed for mean spring and mean flow conditions with a straight jetty design
5.1.2 Figure 10 - Figure 17 show that there is a reduction in the flow speed around the jetty head for both the straight and skewed jetty designs. The reduction in current speed is greater for spring tide conditions (Figure 14 -Figure 17) than for neap tide conditions (Figure 10 - Figure 13). The reduction in current speed is approximately -0.045m/s for spring tidal conditions and -0.03m/s for neap tidal conditions. A slight increase in current speed is also simulated around the approach jetty for the straight and skewed jetty designs. However, the magnitude of this increase is smaller than the decrease in current speed at the jetty head, with increases in current speed of approximately 0.01m/s.

Silvertown Tunnel Preliminary Environmental Information Report
Appendix 16.B: Hydrodynamic Modelling
Page 29 of 53
5.2 Jetty pile scour
5.2.1 Scour depth evolution around the jetty piles was calculated using the simulated depth averaged velocity. The method of Whitehouse5 was applied, which defines the scour depth S(t) as a function of time using the following equation:
1 (1)
5.2.2 Where Ts is the time scale of the scour process given by equation 2, Se is the equilibrium scour depth given by equation 4 and n is a power normally assumed to be 1.
∗
1(2)
5.2.3 Where d50 is the median grain size (m), g is the gravitational acceleration (ms-2), D is the diameter of the pile (m) and T* is the dimensionless time scale for currents given as:
∗
.
2000
(3)
5.2.4 Where δ is the boundary layer thickness, assumed to be depth of flow for tidal conditions and θ is the Shields parameter. The equation for the equilibrium scour depth Se is given by:
1.5 tanh
(4)
5.2.5 Where K1 is the correction factor for pile nose shape, K2 is the correction factor for the angle of approach of the flow and K3 is the correction factor for bed conditions, varying between 0 and 1 depending on flow conditions, so that:
5 Whitehouse, R. J. S. (1998). Scour at marine structures: A manual for practical applications. Thomas Telford, London, p198.

Silvertown Tunnel Preliminary Environmental Information Report
Appendix 16 B: Hydrodynamic Modelling
Page 30 of 53
0 If 0.5
2 1 If 0.5 1 (5)
1 If 1
5.2.6 The parameter K4 is the correction factor for size of bed material, U is the depth averaged current speed and Ucr is the threshold depth averaged current speed. The scour depth methodology detailed so far has assumed a sandy, non-cohesive sediment type. Previous studies have shown that as the clay content of the sediment increases, up to 40%, the scour depth ratio (St/D) decreases. The sediment clay content can be represented by the use of a reduction factor multiplier on the scour depth. HR Wallingford6 proposed a reduction factor Kcc, which represents the fractional clay content C, with the expression:
11
(6)
5.2.7 This reduction factor reduces scour depth in a mixed sand-clay sediment type by approximately 50%, assuming a 40% clay content. Simulated current speeds were extracted from the Silvertown model at two locations on the straight and skewed jetty structures, at the jetty head and on the approach jetty (Figure 18).
6 Harris J M., Whitehouse R. J. S., Benson T. (2012). The time evolution of scour around offshore structures – the scour time evolution predictor (STEP) model. HR Wallingford Ltd.

Silvertown Tunnel Preliminary Environmental Information Report
Appendix 16.B: Hydrodynamic Modelling
Page 31 of 53
Figure 18 Location of current speed extraction (yellow markers) for jetty pile scour depth calculations
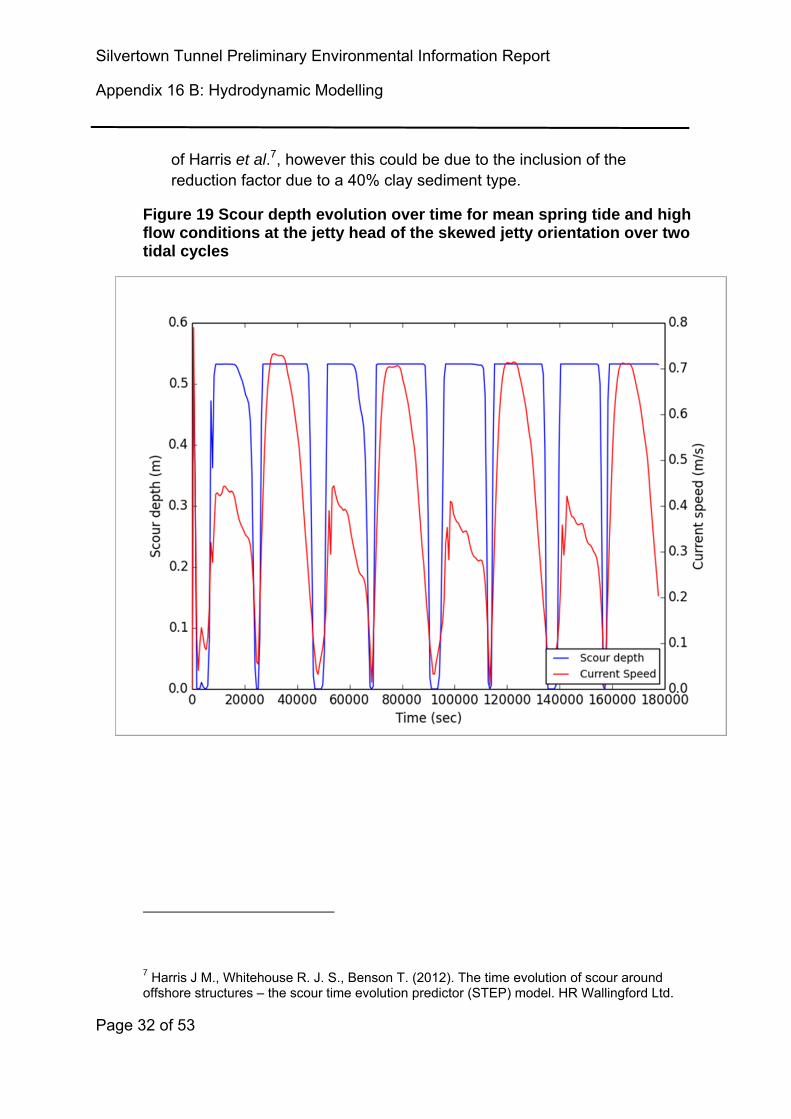
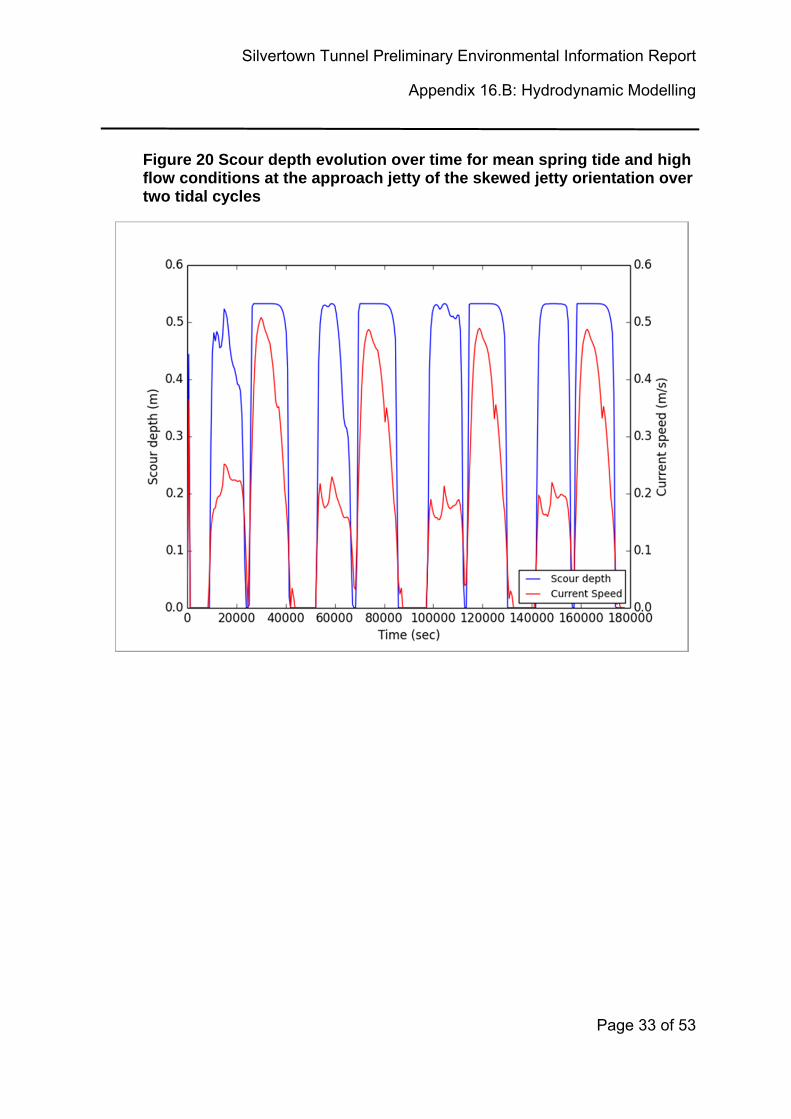
5.2.8 Figure 19 and Figure 20 shows the scour depth evolution over time for mean spring tide and high river flow conditions at the end and connecting pontoons of the skewed jetty orientation. Scour depth evolution for all tidal and river flow conditions on both skewed and straight jetty orientations can be found in Appendix A. This shows a maximum scour depth of 0.53m around the jetty piles, which is approximately 0.89 times the diameter of the pile (0.89D). This is less than the 1.3D scour depth value
Silvertown Tunnel Preliminary Environmental Information Report
Appendix 16 B: Hydrodynamic Modelling
Page 32 of 53
of Harris et al.7, however this could be due to the inclusion of the reduction factor due to a 40% clay sediment type.
Figure 19 Scour depth evolution over time for mean spring tide and high flow conditions at the jetty head of the skewed jetty orientation over two tidal cycles
7 Harris J M., Whitehouse R. J. S., Benson T. (2012). The time evolution of scour around offshore structures – the scour time evolution predictor (STEP) model. HR Wallingford Ltd.
Silvertown Tunnel Preliminary Environmental Information Report
Appendix 16.B: Hydrodynamic Modelling
Page 33 of 53
Figure 20 Scour depth evolution over time for mean spring tide and high flow conditions at the approach jetty of the skewed jetty orientation over two tidal cycles

Silvertown Tunnel Preliminary Environmental Information Report
Appendix 16 B: Hydrodynamic Modelling
Page 34 of 53
THIS PAGE IS LEFT INTENTIONALLY BLANK

Silvertown Tunnel Preliminary Environmental Information Report
Appendix 16.B: Hydrodynamic Modelling
Page 35 of 53
6. PROPELLER SCOUR
6.1.1 Ship propeller wash has the potential to cause erosion or scour of the sea bed and therefore induce instability near to the jetty structure. Previous studies have shown that the Froude F0 number influences the scour depth, given by:
⁄
(7)
6.1.2 Where U0 is the flux velocity of the propeller, g is acceleration due to gravity, d50 is median grain size, δρ is the difference in density of sediment and fluid and ρ is the density of the fluid. For berthing vessels using propellers, maximum jet velocity generally occurs when the vessel is stationary or slow moving (Hawkswood et al., 2014). The maximum jet velocity U0 is given by:
1.48
(8)
6.1.3 Where Pb is the engine power and Dp is the propeller diameter. The maximum equilibrium scour depth is then calculated using the non-dimensional formula of Hong et al. (2012):
, 1.171 .
. .
(9)
6.1.4 Where y0 is the height of the propeller axis from the bed. The largest vessel proposed to be moored at the Silvertown jetty is the Dolphin HAV, with a gross tonnage of 2075t, length of 88.3m and draft of 4.642m. The propeller diameter is assumed to be 2.5m, the minimum height of the propeller axis from the bed is 2.25m and the engine power is taken as 1500kW. These conditions give a maximum equilibrium scour depth caused by propeller wash of 2.6m. An estimate for armour stone sizing can be made using the following equation:
(10)

Silvertown Tunnel Preliminary Environmental Information Report
Appendix 16 B: Hydrodynamic Modelling
Page 36 of 53
6.1.5 Where Vbmax is the maximum bottom velocity, C3 is a coefficient for armour movement recommended as 0.55 in areas of persistent propeller wash8 and A is calculated using:
⁄ (11)
6.1.6 Where as is the unit weight of stone and aw is the unit weight of water. The equation for maximum bottom velocity due to propeller wash is:
⁄ (12)
6.1.7 Following the equations 7-12 with the parameters detailed in the text generates a maximum bottom velocity Vbmax of 0.88m/s and a minimum armoured rock size d50 of 0.16m.
8 Palermo M., Maynord S., Miller J., Reible D. (1998). Guidance for In Situ Subaqueous Capping of Contaminated Sediments. EPA 905-B96-004, Great Lakes National Program Office.
Silvertown Tunnel Preliminary Environmental Information Report
Appendix 16.B: Hydrodynamic Modelling
Page 37 of 53
7. CONCLUSION
7.1.1 The hydrodynamic modelling for the Silvertown Jetty model has shown that the inclusion of the jetty structure, both straight and skewed, will reduce velocities around the jetty head. The reduction in current speeds is due to the increased drag forces generated by the series of jetty piles aligned with the direction of flow. The reduction in current speed is approximately -0.045m/s for spring tidal conditions and -0.03m/s for neap tidal conditions. There is also a slight increase in current speeds simulated in the region inshore of the jetty head, possibly caused by the constriction of flow between the jetty piles, where the approach jetty is aligned perpendicular to the flow. However, the increase in current speeds in this region is approximately 0.01m/s and therefore should not have a significant impact on potential sediment transport.
7.1.2 Scour depths for the jetty piles were calculated using the simulated current speeds under all tidal and river flow conditions. These show that for the 0.6m diameter D piles a maximum scour depth of 0.53m occurs at the approach jetty and jetty head. This is approximately 0.89D, which is less than the 1.3D scour depth value of Harris et al.9 , potentially caused by the inclusion of the clay reduction factor. Further detailed sediment studies would allow for a more accurate representation of the sediment type at the Silvertown jetty site and therefore potentially more accurate scour depth calculations.
7.1.3 Scour depth was also calculated as a result of the propeller wash of vessels moored at the Silvertown jetty. Worst case scenario conditions were applied, with water depths of 1m and the largest potential moored vessel used. Some assumptions were made for vessel specifications, with propeller diameter set to 2.5m and engine power at 1500kW. Equations 7-12 showed that the maximum scour depth due to propller wash with 1m underkeel clearance would be in the region of 2.6m, caused by a maximum near bed velocity of 0.89m/s, and that the appropriate armoured rock size would have a d50 of 0.16m.
THIS PAGE IS LEFT INTENTIONALLY BLANK
9 Harris J M., Whitehouse R. J. S., Benson T. (2012). The time evolution of scour around offshore structures – the scour time evolution predictor (STEP) model. HR Wallingford Ltd.

Silvertown Tunnel Preliminary Environmental Information Report
Appendix 16 B: Hydrodynamic Modelling
Page 38 of 53
Scour depth evolution Appendix A
Figure 21 Scour depth evolution over time for mean neap tide and high flow conditions at the jetty head of the skewed jetty orientation over two tidal cycles
Silvertown Tunnel Preliminary Environmental Information Report
Appendix 16.B: Hydrodynamic Modelling
Page 39 of 53
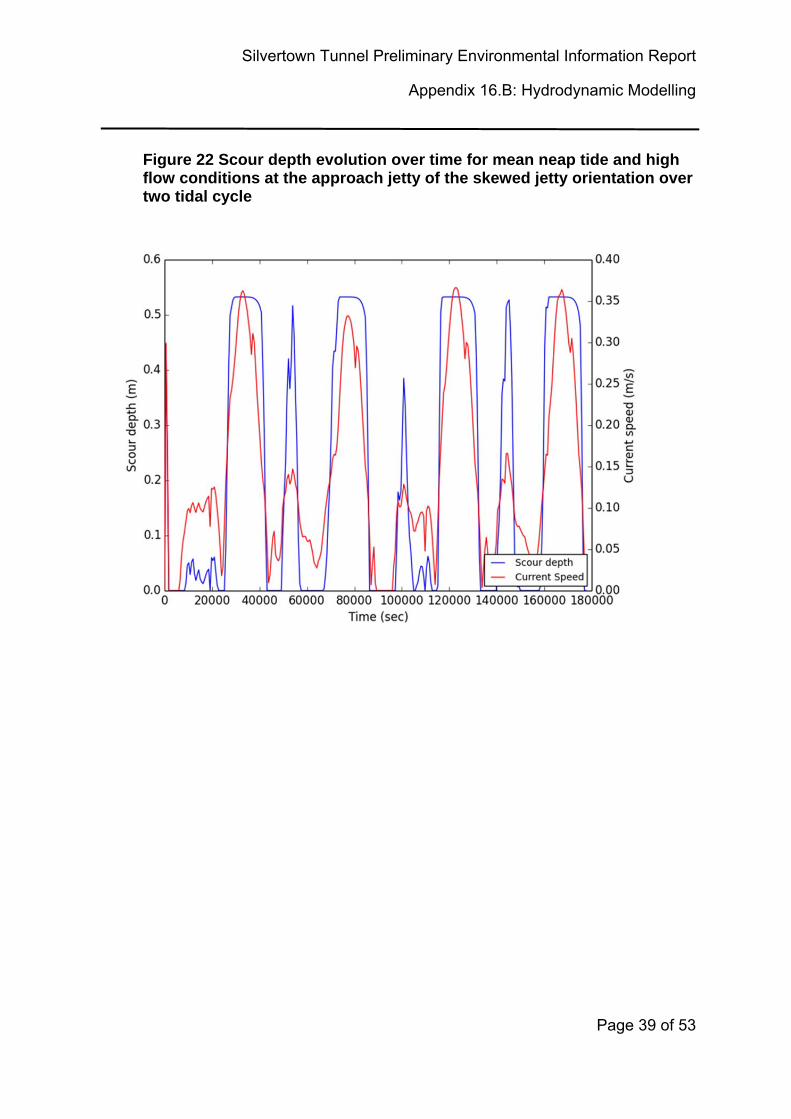
Figure 22 Scour depth evolution over time for mean neap tide and high flow conditions at the approach jetty of the skewed jetty orientation over two tidal cycle

Silvertown Tunnel Preliminary Environmental Information Report
Appendix 16 B: Hydrodynamic Modelling
Page 40 of 53
Figure 23 Scour depth evolution over time for mean neap tide and high flow conditions at the jetty head of the straight jetty orientation over two tidal cycles

Silvertown Tunnel Preliminary Environmental Information Report
Appendix 16.B: Hydrodynamic Modelling
Page 41 of 53
Figure 24 Scour depth evolution over time for mean neap tide and high flow conditions at the approach jetty of the straight jetty orientation over two tidal cycles

Silvertown Tunnel Preliminary Environmental Information Report
Appendix 16 B: Hydrodynamic Modelling
Page 42 of 53
Figure 25 Scour depth evolution over time for mean neap tide and mean flow conditions at the jetty head of the skewed jetty orientation over two tidal cycles

Silvertown Tunnel Preliminary Environmental Information Report
Appendix 16.B: Hydrodynamic Modelling
Page 43 of 53
Figure 26 Scour depth evolution over time for mean neap tide and mean flow conditions at the approach jetty of the skewed jetty orientation over two tidal cycles

Silvertown Tunnel Preliminary Environmental Information Report
Appendix 16 B: Hydrodynamic Modelling
Page 44 of 53
Figure 27 Scour depth evolution over time for mean neap tide and mean flow conditions at the jetty head of the straight jetty orientation over two tidal cycles

Silvertown Tunnel Preliminary Environmental Information Report
Appendix 16.B: Hydrodynamic Modelling
Page 45 of 53
Figure 28 Scour depth evolution over time for mean neap tide and mean flow conditions at the approach jetty of the straight jetty orientation over two tidal cycles

Silvertown Tunnel Preliminary Environmental Information Report
Appendix 16 B: Hydrodynamic Modelling
Page 46 of 53
Figure 29 Scour depth evolution over time for mean spring tide and high flow conditions at the jetty head of the skewed jetty orientation over two tidal cycles

Silvertown Tunnel Preliminary Environmental Information Report
Appendix 16.B: Hydrodynamic Modelling
Page 47 of 53
Figure 30 Scour depth evolution over time for mean spring tide and high flow conditions at the approach jetty of the skewed jetty orientation over two tidal cycles
Silvertown Tunnel Preliminary Environmental Information Report
Appendix 16 B: Hydrodynamic Modelling
Page 48 of 53
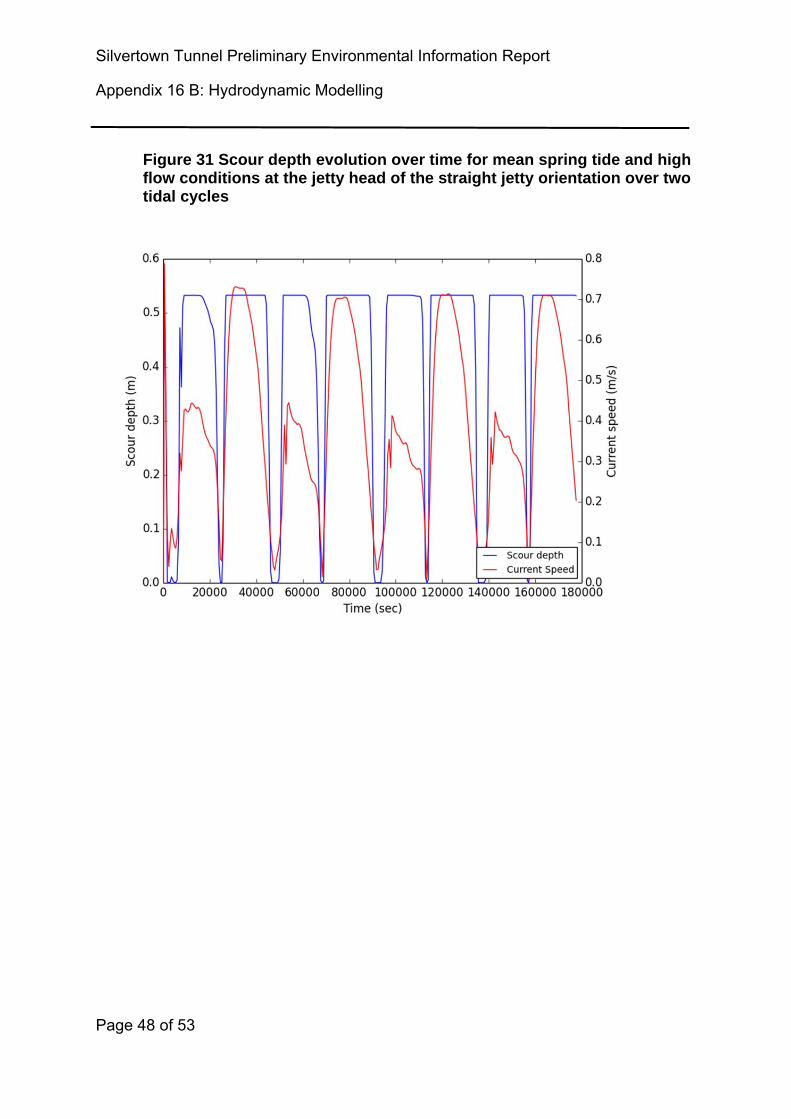
Figure 31 Scour depth evolution over time for mean spring tide and high flow conditions at the jetty head of the straight jetty orientation over two tidal cycles

Silvertown Tunnel Preliminary Environmental Information Report
Appendix 16.B: Hydrodynamic Modelling
Page 49 of 53
Figure 32 Scour depth evolution over time for mean spring tide and high flow conditions at the approach jetty of the straight jetty orientation over two tidal cycles

Silvertown Tunnel Preliminary Environmental Information Report
Appendix 16 B: Hydrodynamic Modelling
Page 50 of 53
Figure 33 Scour depth evolution over time for mean spring tide and mean flow conditions at the jetty head of the skewed jetty orientation over two tidal cycles

Silvertown Tunnel Preliminary Environmental Information Report
Appendix 16.B: Hydrodynamic Modelling
Page 51 of 53
Figure 34 Scour depth evolution over time for mean spring tide and mean flow conditions at the approach jetty of the skewed jetty orientation over two tidal cycles

Silvertown Tunnel Preliminary Environmental Information Report
Appendix 16 B: Hydrodynamic Modelling
Page 52 of 53
Figure 35 Scour depth evolution over time for mean spring tide and mean flow conditions at the jetty head of the straight jetty orientation over two tidal cycles

Silvertown Tunnel Preliminary Environmental Information Report
Appendix 16.B: Hydrodynamic Modelling
Page 53 of 53
Figure 36 Scour depth evolution over time for mean spring tide and mean flow conditions at the approach jetty of the straight jetty orientation over two tidal cycles