Hydrodynamic modelling of Lake Whangape and …...Hydrodynamic modelling of Lake Whangape and Lake...
33
Hydrodynamic modelling of Lake Whangape and Lake Waahi February 2014 ERI Report 31 Prepared for Waikato Regional Council By Hannah F. E. Jones and David P. Hamilton Environmental Research Institute Faculty of Science and Engineering University of Waikato, Private Bag 3105 Hamilton 3240, New Zealand Lake Whangape (Austin Zhang)
Transcript of Hydrodynamic modelling of Lake Whangape and …...Hydrodynamic modelling of Lake Whangape and Lake...

Hydrodynamic modelling of Lake Whangape and Lake Waahi
February 2014
ERI Report 31
Prepared for Waikato Regional Council
By Hannah F. E. Jones and David P. Hamilton
Environmental Research Institute
Faculty of Science and Engineering
University of Waikato, Private Bag 3105
Hamilton 3240, New Zealand
Lake Whangape (Austin Zhang)
rhoad
Typewritten Text
ISSN 2463-6029 (Print) ISSN 2350-3432 (Online)
rhoad
Typewritten Text
rhoad
Typewritten Text
rhoad
Typewritten Text

ii
Cite report as: Jones, H. F. E., Hamilton D. P., 2014. Hydrodynamic modelling of Lake Whangape and Lake Waahi. Prepared for Waikato Regional Council. Environmental Research Institute Report No. 31, University of Waikato, Hamilton. 33 pp. Disclaimer: This report was prepared by scientists from the Environmental Research Institute, University of Waikato. The authors have used the best available information and made use of all data provided in preparing this report, and have interpreted this information exercising all reasonable ability and caution. Furthermore, the accuracy of information and model simulations presented in this document is entirely reliant on the accuracy and completeness of supplied information. The authors do not accept any liability, whether direct, indirect or consequential, arising out of the provision of information in this report.
Reviewed by: Approved for release by:
Chris McBride John Tyrrell Advanced Technical Officer Business Manager Environmental Research Institute Environmental Research Institute University of Waikato University of Waikato

iii
Executive Summary The University of Waikato was contracted by Waikato Regional Council to develop hydrodynamic models for Lake Whangape and Lake Waahi. The models are intended to provide a basis for future water quality modelling to inform the restoration of habitat for native fish and the management of pest fish populations. Lakes Whangape and Waahi are shallow, highly eutrophic lakes in the lower Waikato River basin. They contain significant populations of native fish species, such as īnanga (Galaxias maculatus), longfinned and shortfinned eel (Anguilla dieffenbachi and Anguilla australis). They also contain a number of exotic pest fish, such as mosquito fish (Gambusia affinis), koi carp (Cyprinus carpio) and goldfish (Carassius auratus), that can contribute significantly to water quality problems. For both lakes, bathymetry was combined with LiDAR (Light Detection and Ranging) data to create a topographic-bathymetric Digital Elevation Map (DEM) that provided the basis for the hydrodynamic model grids and may also be used for GIS modelling of potential fish habitat. The DEMs revealed the presence of stopbanks around both lakes that appear to restrict floodplain habitat significantly. Hydrodynamic models for Lakes Whangape and Waahi were developed using available measured or synthesised data. While there was insufficient data available for formal model calibration and validation, year-long model simulations were analysed to ensure that seasonal variability in water levels and temperature were represented. The model used, Delft3D-FLOW, is open-source, developed by Deltares (The Netherlands), and can be coupled to open-source ecological and water quality models (e.g. Delft-WAQ), thus enabling future water quality modelling applications. An important component of this study was the collation of available data and identification of critical knowledge gaps that constrain the present hydrodynamic modelling, and will likely constrain future water quality modelling. There were no data available on lake inflows and outflows (and no water level data available for Lake Whangape), and in-lake measurements for temperature (and for other variables that would be relevant to water quality modelling such as dissolved oxygen, nutrient and chlorophyll a concentrations) were available only at low frequency (c. bimonthly intervals). For future modelling applications it is important that lake inflows and outflows are able to be robustly quantified. For the lake inflows, hydrological catchment modelling may provide a means to obtain inflow volumes at the high temporal frequency (daily) required for model input data. For water quality modelling it is crucial that data are collected for lake inflow water temperature, and dissolved oxygen, nutrient, and sediment concentrations. The installation of lake monitoring buoys (measuring water temperature, dissolved oxygen, turbidity, chlorophyll and phycocyanin fluorescence) on both Lake Whangape and Lake Waahi in early 2014 will provide data suitable for calibration and validation of future hydrodynamic and water quality models, as well as providing high frequency data that have the potential to significantly enhance understanding of lake condition and functioning. It is important that turbidity, chlorophyll and phycocyanin sensors are calibrated with in-lake measurements (of extracted chlorophyll a concentration, phytoplankton cell counts/biovolume, and total suspended sediment concentration). The hydrodynamic models developed in this study may currently be used to identify areas that are inundated under various hydrological scenarios. GIS modelling revealed that stopbanks around both lakes have restricted floodplain habitat by 20 to 25 %. The models may also provide the basis for future modelling and research that could inform management and restoration of the lakes.

iv
Acknowledgments This project was commissioned by Waikato Regional Council (WRC). We thank Kevin Collier and Bruno David (WRC) for constructive comments throughout the project, and Ian Buchanan, Nicola Cowie and Ross Martin (WRC) for provision of data. The hydrodynamic modelling used Delft3D-FLOW (Version 6.00.00.2515) developed by Deltares (The Netherlands), and available as open-source software at http://oss.deltares.nl/web/delft3d.

v
Table of Contents
Executive Summary ................................................................................................................................ iii
Acknowledgments .................................................................................................................................. iv
Table of Contents .................................................................................................................................... v
List of Tables .......................................................................................................................................... vi
List of Figures ......................................................................................................................................... vi
Introduction ............................................................................................................................................ 1
Background ......................................................................................................................................... 1
Lake Whangape and Lake Waahi ........................................................................................................ 2
Study objectives .................................................................................................................................. 3
Methods .................................................................................................................................................. 4
Development of Digital Elevation Models for Lake Whangape, Lake Waahi and surrounding floodplain ............................................................................................................................................ 4
GIS modelling of potential inundation ................................................................................................ 7
Delft3D hydrodynamic model description and setup ......................................................................... 7
Delft3D model grids ........................................................................................................................ 7
Water balance and inflow parameterisation .................................................................................. 9
Meteorological forcing .................................................................................................................. 11
Model simulations ........................................................................................................................ 13
Results and Discussion .......................................................................................................................... 15
GIS modelling of potential inundation .............................................................................................. 15
Delft3D hydrodynamic modelling ..................................................................................................... 18
Limitations and recommendations ................................................................................................... 22
Conclusions ........................................................................................................................................... 24
References ............................................................................................................................................ 26

vi
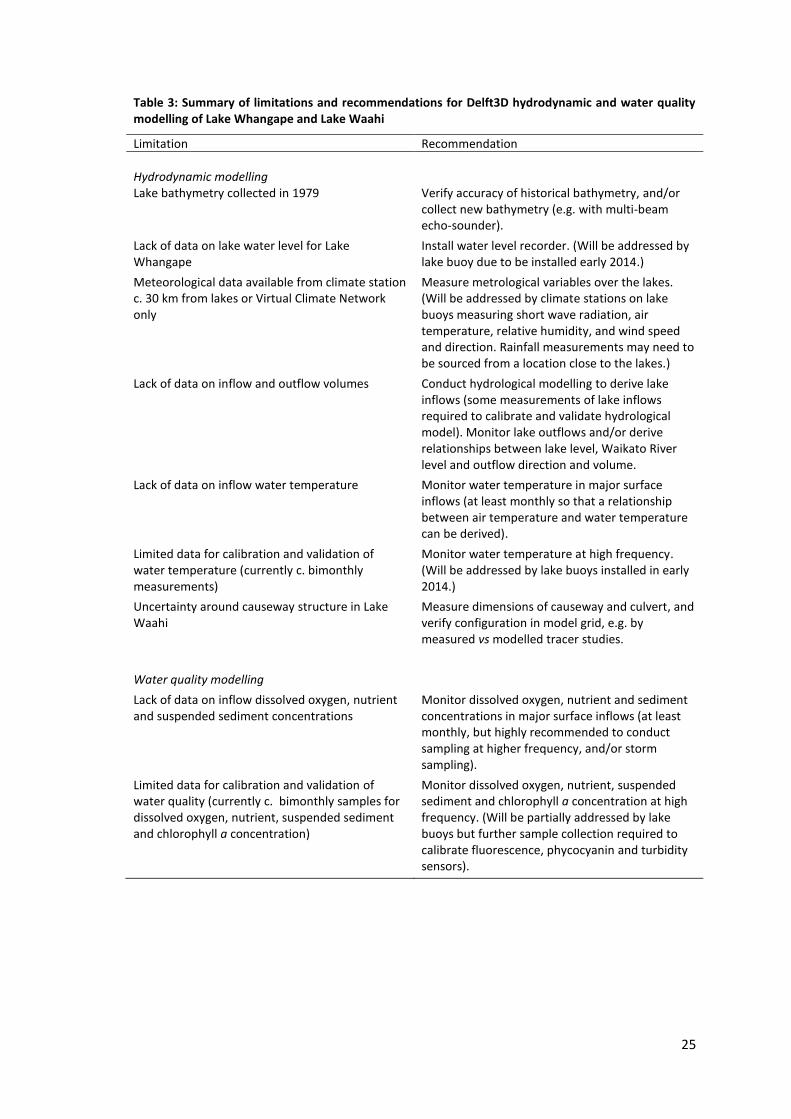
List of Tables Table 1: Delft3D setup and parameters for Lake Whangape and Lake Waahi hydrodynamic models 14 Table 2: Lake surface area at minimum and maximum water levels (m above sea level; m a.s.l.) for Lake Whangape and Lake Waahi. Two scenarios are considered: A) areas currently protected from inundation area excluded, and B) areas currently protected are included. ......................................... 15 Table 3: Summary of limitations and recommendations for Delft3D hydrodynamic and water quality modelling of Lake Whangape and Lake Waahi ..................................................................................... 25
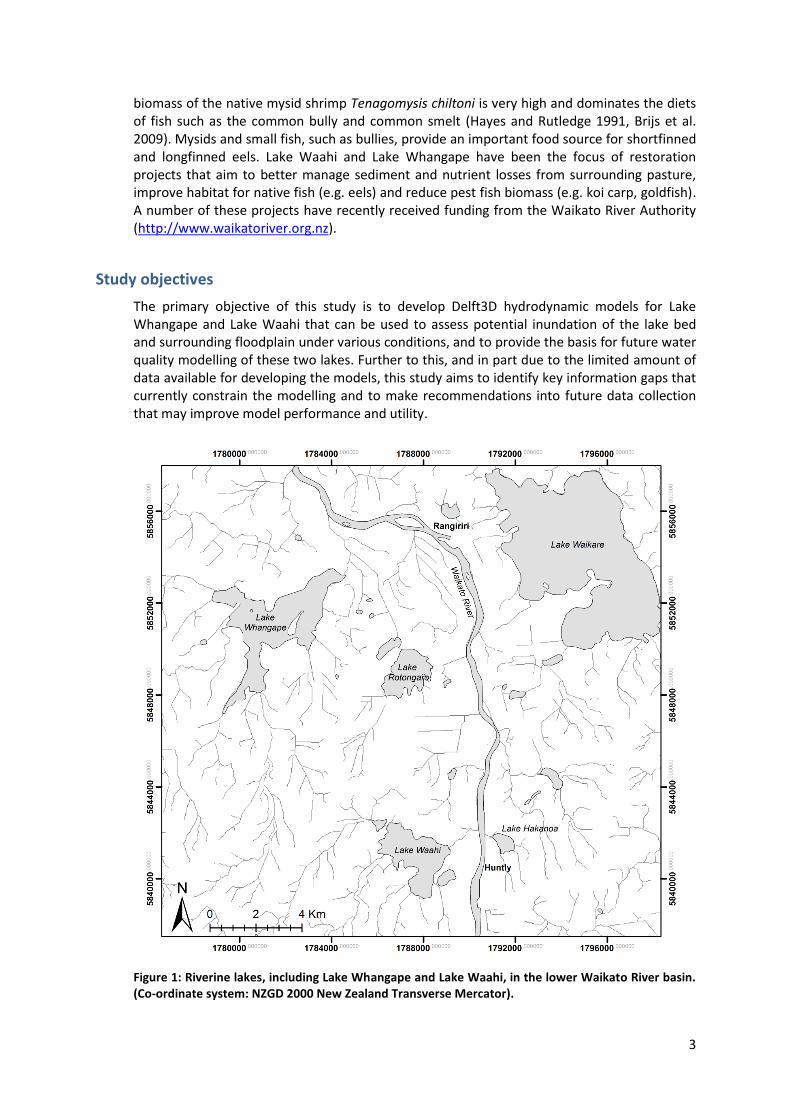
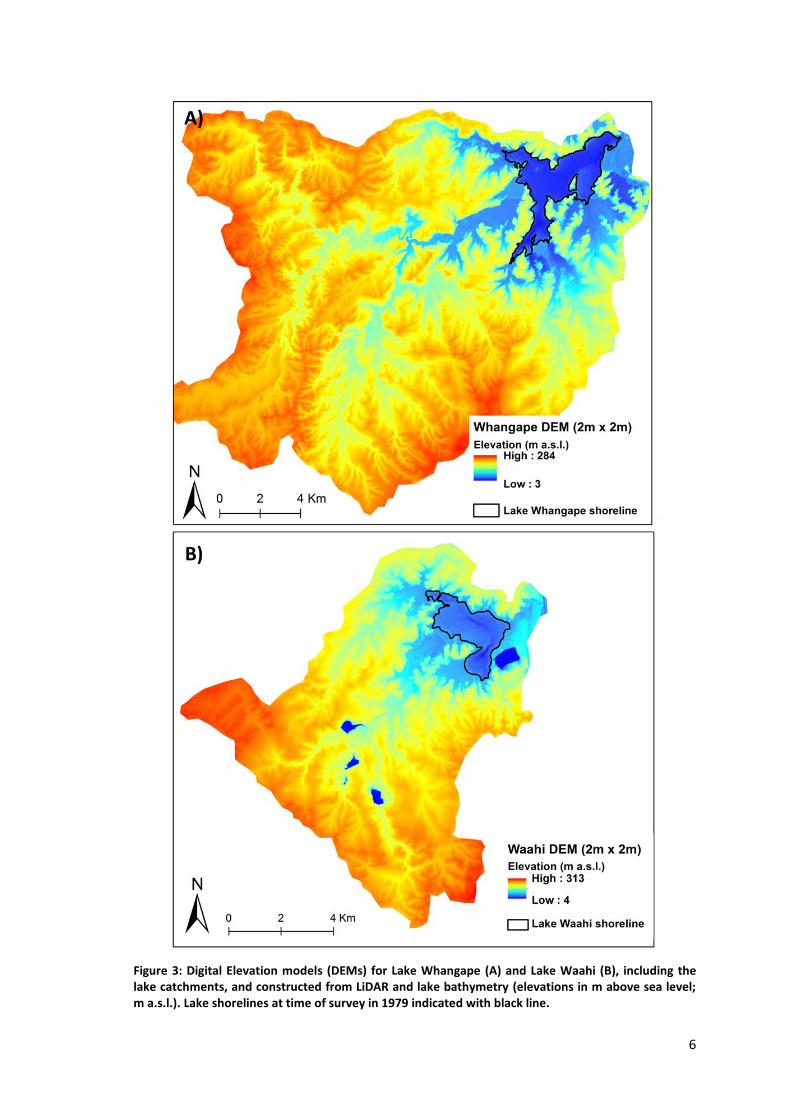
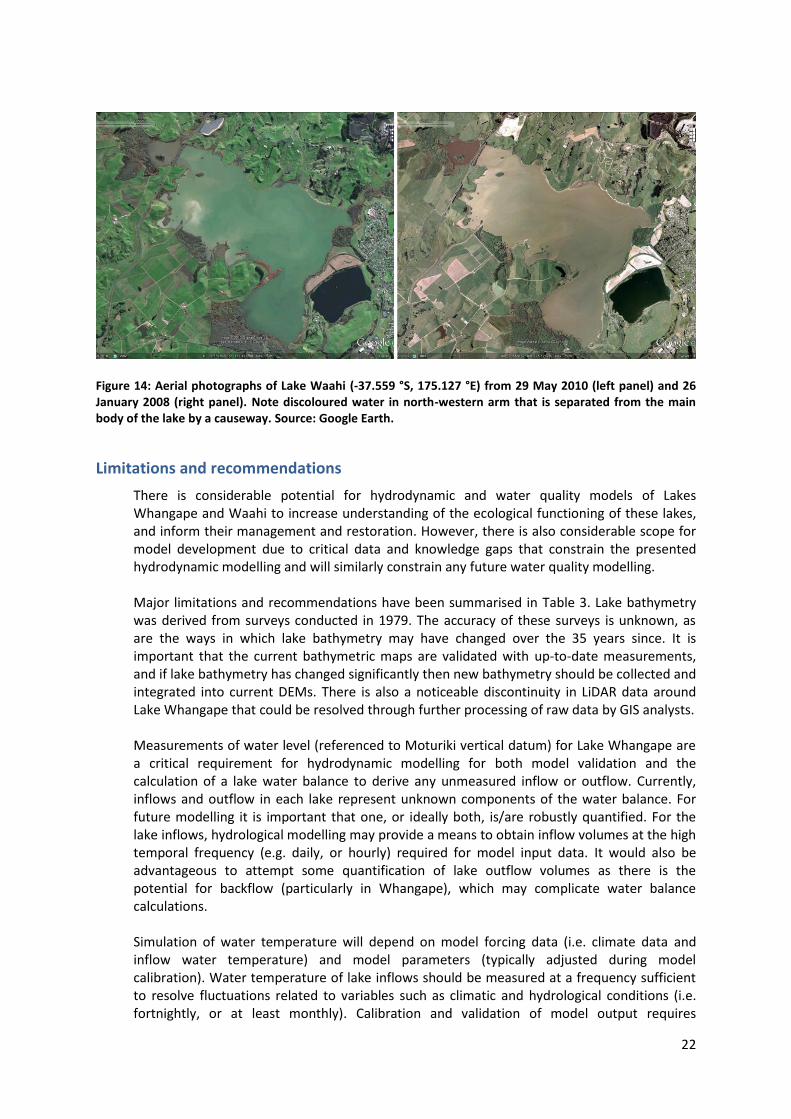
List of Figures Figure 1: Riverine lakes, including Lake Whangape and Lake Waahi, in the lower Waikato River basin. (Co-ordinate system: NZGD 2000 New Zealand Transverse Mercator). ................................................ 3 Figure 2: A) Lake Whangape bathymetry (in m below lake water level at time of survey) and B) Lake Waahi bathymetry. Bathymetry supplied by Waikato Regional Council, digitised from paper maps by Irwin (1981) and Irwin and Main (1981). Water level at time of survey was 6.12 m a.s.l. for Lake Whangape and 9.14 m a.s.l. for Lake Waahi. ......................................................................................... 5 Figure 3: Digital Elevation models (DEMs) for Lake Whangape (A) and Lake Waahi (B), including the lake catchments, and constructed from LiDAR and lake bathymetry (elevations in m above sea level; m a.s.l.). Lake shorelines at time of survey in 1979 indicated with black line. ....................................... 6 Figure 4: Delft3D grid (horizontal resolution 50 x 50 m) and bathymetry for Lake Whangape ............. 8 Figure 5: Delft3D grid (horizontal resolution 50 x 50 m) and bathymetry for Lake Waahi .................... 9 Figure 6: Hypsograph derived from topographic-bathymetric Digital Elevation Models for Lake Whangape (A) and Lake Waahi (B) ....................................................................................................... 12 Figure 7: Meteorological data used as input to the Delft3D models (1 March 2012 – 28 February 2013), obtained from the Virtual Climate Station network and Whatawhata Ews climate station. A) Air temperature (°C), B) short wave radiation (W m-2), C) cloud cover (derived from short-wave radiation), D) rainfall (mm hr-1), E) relative humidity (%), F) wind speed (m s-1) and G) wind direction (°TN). ..................................................................................................................................................... 13 Figure 8: A) Lake Whangape DEM, B) Contour lines for maximum water level (7 m a.s.l.; light blue line) and minimum water level (5 m a.s.l.; dark blue line). Stopbanks indicated with pink line. (Aerial photography sourced from Google Earth) ............................................................................................ 16 Figure 9: A) Lake Waahi DEM, B) Contour lines for maximum water level (10.7 m a.s.l.; light blue line) and minimum water level (7.66 m a.s.l.; dark blue line). Stopbanks indicated with pink line. (Aerial photography sourced from Google Earth) ............................................................................................ 17 Figure 10: Lake Waahi Delft3D modelled and measured water level (A) and water temperature (B) 18 Figure 11: Lake Whangape Delft3D modelled water level (A) and modelled and measured water temperature (B). N.B. No water level measurements were available for Lake Whangape. ................ 19 Figure 12: Lake Waahi Delft3D modelled water depth at A) low water levels (8 March 2012, water level 7.95 m a.s.l.) and B) high water levels (26 July 2012 9.67 m a.s.l.). Note inundation of floodplain/wetlands surrounding the lake in (B). ................................................................................. 20 Figure 13: Lake Whangape Delft3D modelled water depth at A) low water levels (8 March 2012, water level 5 m a.s.l.) and B) high water levels (26 July 2012 6.70 m a.s.l.). Note inundation of floodplain/wetlands surrounding the lake, particularly to the northwest, in (B). ............................... 21 Figure 14: Aerial photographs of Lake Waahi (-37.559 °S, 175.127 °E) from 29 May 2010 (left panel) and 26 January 2008 (right panel). Note discoloured water in north-western arm that is separated from the main body of the lake by a causeway. Source: Google Earth. ............................................... 22

1
Introduction
Background
The University of Waikato (UoW) was contracted by Waikato Regional Council (WRC) to develop hydrodynamic models for Lake Whangape and Lake Waahi, two riverine lakes that provide important habitat for biota in the lower Waikato River floodplain. The development of these hydrodynamic models is intended to provide the basis of future water quality modelling to inform the restoration of habitat for native fish and the management of pest fish populations. Rehabilitation of habitat for native fish (e.g. whitebait and eels), and control of pest fish (e.g. koi carp) have been a recent focus for management and restoration of the lower Waikato River. An important component of this study has also been the collation of available data and identification of critical knowledge gaps that may constrain hydrodynamic modelling. In this study we combined lake bathymetry (digitised from paper maps) with LiDAR data collected for areas above water to produce a high-resolution topographic-bathymetric DEM for the each lake and its catchment. Lakes Whangape and Waahi are both surrounded by wetlands and areas of farmland that are subject to inundation during periods of high rainfall (although farmland may be protected by stopbanks in some places). Assessing the potential for inundation requires accurate high resolution elevation data for the lakes and their surroundings. Digital Elevation Models (DEMs) provide accurate representations of topography over regional scales and have many engineering and mapping applications. For example, the New Zealand Land Cover Database (LCDB) and River Environment Classification (REC) are both based on, or derived from, a DEM (www.mfe.govt.nz). The term Digital Elevation Model can be applied to a number of types of digital representations of terrain, which may include bare earth or surface features (including buildings), and may sometimes also be referred to as Digital Terrain Models or Digital Surface Models. Throughout this document we will refer to DEMs with our definition as follows: Digital Elevation Model (DEM) - gridded elevation data representing the bare topographic surface of the earth, with height referenced to a given level (e.g. m above mean sea level).
Airborne Light Detection and Ranging (LiDAR) is widely used for acquisition of topographic data that can be applied to the construction of DEMs. However, this tends to preclude the inclusion of water bodies in the DEM (bathymetric LiDAR is not yet used routinely in New Zealand), which would be essential for modelling of hydrodynamics and inundation. Therefore, the LiDAR data must be combined with hydrographic survey data to produce a seamless model of the topographic and bathymetric surface (e.g. Medeiros et al. 2011). The combined topographic-bathymetric DEM may be used in GIS modelling of spatial datasets to address issues related to the ecology (e.g. habitat mapping) and resource management (e.g. identification of high-risk or high-pressure areas), and as the basis (i.e. bathymetry) for mechanistic modelling of hydrodynamics and inundation. Hydrodynamic models have been extensively used in New Zealand and overseas, to simulate aspects of lake, estuarine and coastal environments in order to address resource management related issues. In particular, hydrodynamic models may provide more information on ecologically relevant parameters, such as circulation patterns, residence times, water levels, and temperature structure than even high intensity field deployments (e.g. Bell et al. 1998, Tay et al. 2013). Field data are still required, however, to calibrate and validate models. Another advantage of hydrodynamic models is that manipulation of forcing data (e.g. wind,

2
river flow) may offer insight into the effect of specific processes on relevant parameters. For example, manipulation of freshwater discharge in a hydrodynamic model of Tauranga Harbour indicated that storm events could cause significant salinity gradients in the harbour (Tay et al. 2013). Hydrodynamic models of Lake Rotoiti have been applied to assess the efficacy of the Ohau channel diversion wall and as the basis for water quality modelling (Muraoka et al. 2010, von Westernhagen 2010, Jones et al. 2013). In this study, hydrodynamic models for Lakes Whangape and Waahi were developed using available measured or synthesised data. Although there were insufficient data available for formal model calibration and validation, year-long (March 2012 – February 2013) model simulations were analysed to ensure that seasonal variability in water levels and temperature were well represented. The model used, Delft3D-FLOW is open-source, and can be coupled to open-source ecological and water quality models (e.g. Delft-WAQ). The hydrodynamic models developed in this study may therefore provide the basis for future research, e.g. water quality modelling, as well as providing a means to synthesise current knowledge and understanding of these systems.
Lake Whangape and Lake Waahi
Lakes Whangape (-37.470 °S, 175.049 °E) and Lake Waahi (-37.559 °S, 175.127 °E) are both shallow, highly eutrophic lakes in the lower Waikato River basin (Figure 1). Lake Whangape is the larger of the two, with a surface area of c. 14 km2, a mean depth of 1.5 m and a catchment of c. 310 km2. Prior to land-use change in the catchment the lake supported a diverse community of native submerged vegetation but by the 1960s the submerged macrophyte community was dominated by the invasive exotic species, Egeria densa (Champion et al. 2001). In 1987 the macrophyte beds declined, turbidity increased and the remaining macrophyte community was dominated by hornwort (Ceratophylum demersum), also an invasive exotic species. Lake Waahi has a surface area of c. 5 km2, a mean depth of 2 m and catchment area of c. 90 km2. In common with Lake Whangape, historically the lake supported dense populations of native submerged macrophytes, which were then dominated by invasive exotics such as Elodea canadensis by the 1950s. However, following an increase in turbidity during the 1970s and 1980s, likely due to a number of stressors including coal mine discharges, pollution and water level variations, the macrophyte beds collapsed (Ward et al. 1987). In both lakes, elevated inputs of sediment and nutrients from the catchment, as well as wind-induced resuspension, have resulted in high suspended sediment concentrations and phytoplankton biomass. These conditions have largely prevented the re-establishment of submerged macrophytes, due to severe light limitation. Recent (i.e. 2008 to 2013) bimonthly monitoring by Waikato Regional Council has shown Secchi depth of between 0.05 m and 1.1 m (average 0.36 m) in Lake Waahi and between 0.04 m and 0.69 m (average 0.24 m) in Lake Whangape. Chlorophyll a concentration can be extremely high (> 100 mg m-3) in both lakes, more frequently in Lake Whangape. Although both lakes may be described as highly degraded, they contain large populations of native fish species, including īnanga (Galaxias maculatus), longfinned eel (Anguilla dieffenbachii), shortfinned eel (Anguilla australis), common smelt (Retropinna retropinna), common bully (Gobiomorphus cotiadianus) and grey mullet (Mugil cephalus) (e.g. Hayes and Rutledge 1991, West et al. 2000). However, the lakes also contain a number of exotic pest fish, such as mosquito fish (Gambusia affinis), catfish (Ameiurus nebulosus), koi carp (Cyprinus carpio) and goldfish (Carassius auratus), which likely contribute to lake degradation and may hinder restoration efforts. For example, feeding by koi carp resuspends bottom sediments, thus decreasing water clarity. Perhaps in part due to the now turbid nature of these lakes the
3
biomass of the native mysid shrimp Tenagomysis chiltoni is very high and dominates the diets of fish such as the common bully and common smelt (Hayes and Rutledge 1991, Brijs et al. 2009). Mysids and small fish, such as bullies, provide an important food source for shortfinned and longfinned eels. Lake Waahi and Lake Whangape have been the focus of restoration projects that aim to better manage sediment and nutrient losses from surrounding pasture, improve habitat for native fish (e.g. eels) and reduce pest fish biomass (e.g. koi carp, goldfish). A number of these projects have recently received funding from the Waikato River Authority (http://www.waikatoriver.org.nz).
Study objectives
The primary objective of this study is to develop Delft3D hydrodynamic models for Lake Whangape and Lake Waahi that can be used to assess potential inundation of the lake bed and surrounding floodplain under various conditions, and to provide the basis for future water quality modelling of these two lakes. Further to this, and in part due to the limited amount of data available for developing the models, this study aims to identify key information gaps that currently constrain the modelling and to make recommendations into future data collection that may improve model performance and utility.
Figure 1: Riverine lakes, including Lake Whangape and Lake Waahi, in the lower Waikato River basin. (Co-ordinate system: NZGD 2000 New Zealand Transverse Mercator).

4
Methods
Development of Digital Elevation Models for Lake Whangape, Lake Waahi and surrounding floodplain
Hydrodynamic models for Lake Whangape and Lake Waahi, capable of simulating floodplain inundation, first require the development of seamless topographic/bathymetric Digital Elevation Models (DEMs) for each lake and the surrounding floodplain. This was achieved by combining high-resolution (1 m by 1 m) LiDAR (airborne Light Detection And Ranging) for topography above the lake water level with lake bathymetry data (Medeiros et al. 2011). LiDAR was supplied by Waikato Regional Council (WRC) but comprised two different datasets for Waahi and Whangape. LiDAR for the floodplain surrounding Lake Waahi was collected between November 2007 and February 2008, whilst for the floodplain surrounding Lake Whangape it was collected between October 2010 and June 2011. In both cases, supplied data were in New Zealand Geodetic Datum 2000 (NZGD2000), New Zealand Transverse Mercator Projection (NZTM) and Moturiki 1953 Vertical Datum (MVD). The Root-Mean-Square (RMS) accuracies of the grid cells are 0.15 m vertically and 0.5 m horizontally. A DEM was provided by WRC that was in ESRI ASCII grid file format with resolution of 1 m by 1 m, and with data tiled into 2 km by 2 km map tiles. Further detail on metadata is available from WRC. Digitised bathymetry for both lakes was supplied by WRC, which was derived from printed maps of an echo-sounding survey of lake depth (Figure 2). The maps were printed in 1981 and the surveys undertaken in 1979 (Irwin 1981, Irwin and Main 1981). The digitised data set was supplied as a ‘shapefile’ with attributes such as the water depth (as recorded on the printed maps), absolute water level (as recorded on the printed maps), and the absolute elevation (calculated as the absolute water level minus the depth). The data was supplied in New Zealand Geodetic Datum 2000 (NZGD2000), New Zealand Transverse Mercator Projection (NZTM) and Moturiki 1953 Vertical Datum (MVD). Accuracy is unknown due to the limited information on the 1981 maps and possible geo-rectification errors. Further detail on digitising of the paper maps is available from WRC. As both data sets (i.e. LiDAR and bathymetry) were provided with the same horizontal and vertical datum (and horizontal projection) no adjustment of these attributes was required. However, merging of interpolated bathymetry directly with the LiDAR would result in discontinuities and anomalies at the shoreline (e.g. Medeiros et al. 2011). Both datasets therefore required some processing in ArcGIS to create a seamless topographic-bathymetric DEM. For each lake, bathymetry data, provided as contour lines, were converted to raster datasets. Areas of water were removed from the LiDAR raster dataset, and the bathymetry data were combined with a “buffering” LiDAR dataset (i.e. LiDAR extending 100 m inland from the shoreline). The combined bathymetry and shoreline LiDAR were interpolated and then merged with the remaining LiDAR dataset to produce a combined topographic-bathymetric DEM at 2 m x 2 m resolution for each lake and its surrounding catchment (Figure 3).

Figure 2: A) Lake Whangape bathymetry (in m below lake water level at time of survey) and B) Lake Waahi bathymetry. Bathymetry supplied by Waikato Regional Council, digitised from paper maps by Irwin (1981) and Irwin and Main (1981). Water level at time of survey was 6.12 m a.s.l. for Lake Whangape and 9.14 m a.s.l. for Lake Waahi.
6
Figure 3: Digital Elevation models (DEMs) for Lake Whangape (A) and Lake Waahi (B), including the lake catchments, and constructed from LiDAR and lake bathymetry (elevations in m above sea level; m a.s.l.). Lake shorelines at time of survey in 1979 indicated with black line.

7
GIS modelling of potential inundation
The combined topographic-bathymetric DEMs were analysed in ArcGIS™ (v. 10.0) to identify the potential inundation of the area surrounding the lakes under various water levels. Water level at Lake Waahi is monitored continuously by Waikato Regional Council and fluctuated between 7.66 and 10.7 m a.s.l. between 1990 and 2013. Water levels are not currently monitored continuously at Lake Whangape, although a water quality monitoring buoy, which includes a water level recorder, is due to be installed on the lake in early 2014. Water levels have been monitored historically, however. Between 1968 and 1983 the water level in Lake Whangape fluctuated between 4.902 and 7.941 m a.s.l. (WRC), and between 4.5 and 7 m a.s.l. between 1998 and 2000 (Champion et al. 2001). A weir installed at the outlet in 1999 increased the minimum water level to 5 m a.s.l. For the purposes of this GIS modelling the minimum water level for Lake Whangape was taken to be 5 m a.s.l. and the maximum to be 7 m a.s.l. Contour lines were created from the DEMs in ArcGIS™ at elevations equivalent to inundation under the minimum and maximum water levels observed at the lakes. Stopbanks close to the lakes were clearly visible in the DEMs, and although an embankment layer for the Waikato Region was provided by WRC, the DEMs revealed it to be slightly inaccurate and incomplete in places, so a new stopbank layer was digitised.
Delft3D hydrodynamic model description and setup
Delft3D-FLOW, developed by Deltares (The Netherlands), is a hydrodynamic simulation program that calculates non-steady flow from tidal and meteorological forcing on a rectilinear or curvilinear boundary fitted grid. Delft3D-FLOW may be implemented in 2D using a depth-averaged approach (2DH), or in 3D, with the vertical grid defined using either a sigma (σ) co-ordinate or Z-grid (Cartesian co-ordinates) approach (Deltares 2011). The model has been extensively validated (e.g. Elias et al. 2000, Lesser et al. 2004).
Delft3D model grids In this study, separate Delft3D models were developed for Lake Whangape (Figure 4) and Lake Waahi (Figure 5). Each Delft3D model domain included the floodplain surrounding the lakes, but areas currently protected from flooding (by stopbanks) were removed from the model grids. As water levels in Lake Whangape have fluctuated between c. 5 and 7 m a.s.l. the DEM for Lake Whangape was clipped to include only areas < 8 m a.s.l. elevation, the raster resampled to 10 m x 10 m resolution, and then the points exported in xyz format (i.e. latitude longitude, elevation) to be used in Delft3D gridding software. As water levels in Lake Waahi have recently fluctuated between 7.7 and 10.7 m a.s.l., the DEM for Lake Waahi was clipped to include only areas < 11 m a.s.l. elevation, the raster resampled to 10 m x 10 m resolution, and then the points exported in xyz format to be used in Delft3D gridding software. In the present application each Delft3D grid is rectilinear, with a resolution of 50 m x 50 m in the horizontal. Bathymetry was derived from the topographic-bathymetric digital elevation models (DEM) previously described in this report. Spot sampling (at c. bimonthly intervals) by WRC indicates that both lakes are typically isothermal, with water column stratification only recorded in each lake on two or three sampling occasions between 2008 and 2013. For this reason, both lake models were initially setup in 2DH (i.e. depth-averaged), although the grids can be easily be converted to 3D for future modelling applications. Vertically resolved continuous temperature measurements from lake monitoring buoys (due to be installed in the lakes in early 2014) will be crucial for the development of 3D models, and will likely provide further insight into thermal dynamics in the lakes and the significance of vertical variation of variables. A lake monitoring buoy installed on another shallow lowland lake in the Waikato

8
(Lake Ngaroto) has shown that the lake often thermally stratifies at intervals of a few hours, several days or weeks (Collier et al. 2010). It is important to note that future modelling may require 3D to resolve dynamics that are strongly vertically driven (e.g. dissolved oxygen depletion in bottom waters, surface algal blooms). The Lake Whangape model was set up with three surface inflows, representing the major inflow Awaroa Stream to the southwest, a smaller stream, Tikotiko, to the northwest, and a small unnamed stream to the south. The Lake Waahi model was also set up with three inflows, representing the major inflow (also called Awaroa Stream) to the southwest, and two unnamed inflows (one entering the lake west of the causeway, and the other entering the southern basin of the lake). Both lakes have one outflow, which in each lake is located in the northeast corner and flows into the Waikato River. For the purposes of this study, it was assumed that the flow was one-way only through the lake outflows (i.e. no backflow). It is noted that this may not always be the case, in particular for Lake Whangape (water sometimes flows into the lake through the lake outflow when water levels in the Waikato River are high). Furthermore, outflow from Lake Waahi is controlled by gates near the confluence of the Waahi outlet stream and the Waikato River. For the purposes of future hydrodynamic modelling it is recommended that lake outflows are continuously monitored to enable the construction of a more accurate water balance for each lake and the subsequent derivation of model inflows and outflows. Both lake models had temporally-variable meteorological forcing applied uniformly across the model domain.
Figure 4: Delft3D grid (horizontal resolution 50 x 50 m) and bathymetry for Lake Whangape

9
Figure 5: Delft3D grid (horizontal resolution 50 x 50 m) and bathymetry for Lake Waahi
Water balance and inflow parameterisation There were limited data available for the construction of a water balance for both lakes. In particular, there were no data available on inflow or outflow volumes for either lake, and there were no recent water level data for Lake Whangape. Instead, the components of a water balance were approximated for the period 1 March 2012 to 28 February 2013, for the purposes of setting up and running the models, and in order to inform future data collection that might facilitate more rigorous hydrodynamic modelling, and water quality modelling. It should be noted that the water balance described here should be re-calculated when new information becomes available (e.g. hydrological modelling, monitoring of lake inflows and the outflow, continuous water level recorder data for Lake Whangape). A simple lake water balance may be written as:
𝐶ℎ𝑎𝑛𝑔𝑒 𝑖𝑛 𝑠𝑡𝑜𝑟𝑎𝑔𝑒 = 𝑠𝑢𝑟𝑓𝑎𝑐𝑒 𝑖𝑛𝑓𝑙𝑜𝑤𝑠 + 𝑔𝑟𝑜𝑢𝑛𝑑𝑤𝑎𝑡𝑒𝑟 + 𝑟𝑎𝑖𝑛𝑓𝑎𝑙𝑙 − 𝑒𝑣𝑎𝑝𝑜𝑟𝑎𝑡𝑖𝑜𝑛 − 𝑜𝑢𝑡𝑓𝑙𝑜𝑤
In lakes where surface inflows are monitored (or can be estimated using hydrological models) and where groundwater inputs are also known (or assumed to be negligible), then the outflow from the lake can be calculated as the residual of the water balance. Evaporation from the lake may be calculated as a function of wind speed and air vapour pressure from the daily average evaporative heat flux using meteorological input data and lake water temperature (Imerito 2007):
10
𝑄𝑙ℎ = 𝑚𝑖𝑛𝑖𝑚𝑢𝑚 (0,0.622
𝑃𝐶𝐿𝜌𝐴𝐿𝐸𝑈𝑎(𝑒𝐴 − 𝑒𝑆(𝑇𝑆))∆𝑡)
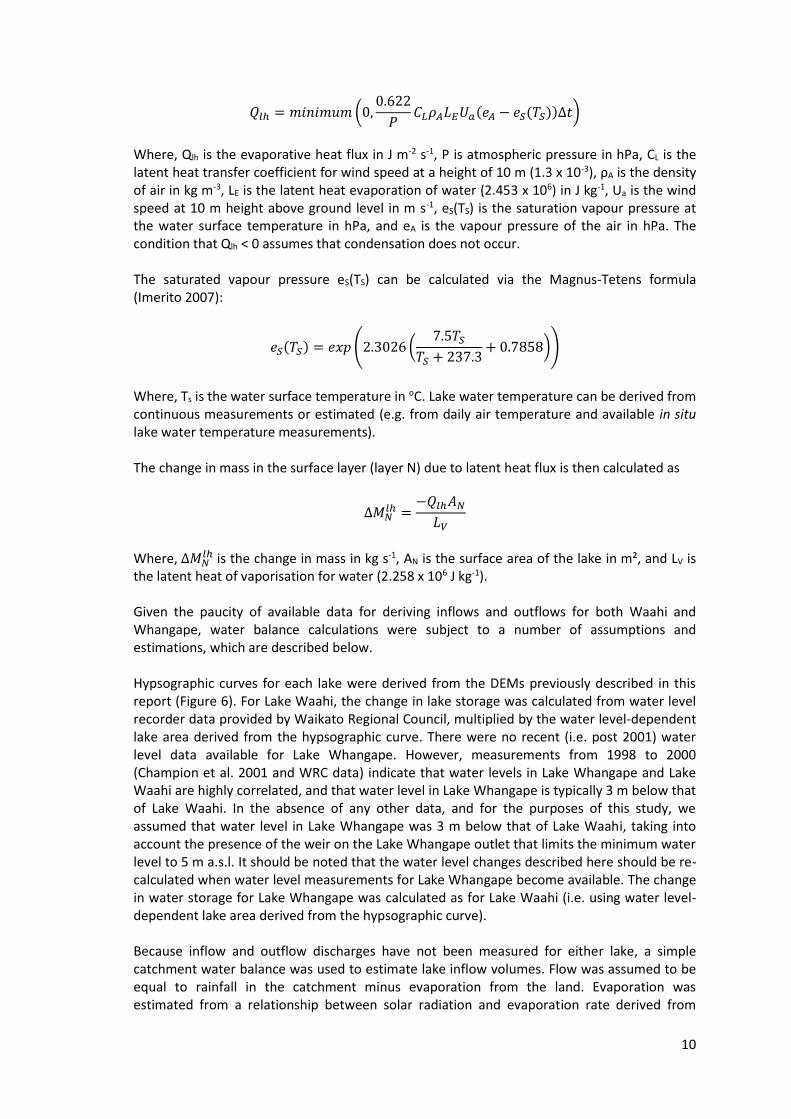
Where, Qlh is the evaporative heat flux in J m-2 s-1, P is atmospheric pressure in hPa, CL is the latent heat transfer coefficient for wind speed at a height of 10 m (1.3 x 10⁻³), ρA is the density of air in kg m-3, LE is the latent heat evaporation of water (2.453 x 10⁶) in J kg-1, Ua is the wind speed at 10 m height above ground level in m s-1, eS(TS) is the saturation vapour pressure at the water surface temperature in hPa, and eA is the vapour pressure of the air in hPa. The condition that Qlh < 0 assumes that condensation does not occur. The saturated vapour pressure eS(TS) can be calculated via the Magnus-Tetens formula (Imerito 2007):
𝑒𝑆(𝑇𝑆) = 𝑒𝑥𝑝 (2.3026 (7.5𝑇𝑆
𝑇𝑆 + 237.3+ 0.7858))
Where, Ts is the water surface temperature in oC. Lake water temperature can be derived from continuous measurements or estimated (e.g. from daily air temperature and available in situ lake water temperature measurements). The change in mass in the surface layer (layer N) due to latent heat flux is then calculated as
∆𝑀𝑁𝑙ℎ =
−𝑄𝑙ℎ𝐴𝑁
𝐿𝑉
Where, ∆𝑀𝑁𝑙ℎ is the change in mass in kg s-1, AN is the surface area of the lake in m², and LV is
the latent heat of vaporisation for water (2.258 x 10⁶ J kg-1). Given the paucity of available data for deriving inflows and outflows for both Waahi and Whangape, water balance calculations were subject to a number of assumptions and estimations, which are described below. Hypsographic curves for each lake were derived from the DEMs previously described in this report (Figure 6). For Lake Waahi, the change in lake storage was calculated from water level recorder data provided by Waikato Regional Council, multiplied by the water level-dependent lake area derived from the hypsographic curve. There were no recent (i.e. post 2001) water level data available for Lake Whangape. However, measurements from 1998 to 2000 (Champion et al. 2001 and WRC data) indicate that water levels in Lake Whangape and Lake Waahi are highly correlated, and that water level in Lake Whangape is typically 3 m below that of Lake Waahi. In the absence of any other data, and for the purposes of this study, we assumed that water level in Lake Whangape was 3 m below that of Lake Waahi, taking into account the presence of the weir on the Lake Whangape outlet that limits the minimum water level to 5 m a.s.l. It should be noted that the water level changes described here should be re-calculated when water level measurements for Lake Whangape become available. The change in water storage for Lake Whangape was calculated as for Lake Waahi (i.e. using water level-dependent lake area derived from the hypsographic curve). Because inflow and outflow discharges have not been measured for either lake, a simple catchment water balance was used to estimate lake inflow volumes. Flow was assumed to be equal to rainfall in the catchment minus evaporation from the land. Evaporation was estimated from a relationship between solar radiation and evaporation rate derived from

11
eddy covariance measurements of evaporation in Waikato pasture (David Campbell, University of Waikato, pers. comm.), using radiation and rainfall estimated at a Virtual Climate Station within 2 km of the lake (see section below on meteorological data). A dynamic hydrological model that takes into account soil type and land use, as well as climate, may provide a more accurate estimate of lake inflows. However, these models also require calibration and validation with field data. Evaporation from each lake was calculated as a function of wind speed and air vapour pressure, using the equations above. Rainfall was calculated from the water level-dependent lake area derived from hypsographic curves multiplied by the daily rainfall total (see section of meteorological forcing below). Daily values for the outflow volume were then calculated as a residual term of a complete water balance for the simulation period (1 March 2012 to 28 February 2013). There were no data available on water temperature in lake inflows, so it was assumed that the temperature was equal to lake water temperature (which was in turn estimated from a relationship between air temperature and available in situ measurements of lake water temperature). It is recommended that prior to further modelling, some data are gathered on inflow water temperature. If inflows are not monitored continuously then a continuous record may be derived from a relationship between regular (e.g. weekly) spot measurements in inflows and air temperature (e.g. Mohseni et al. 1998).
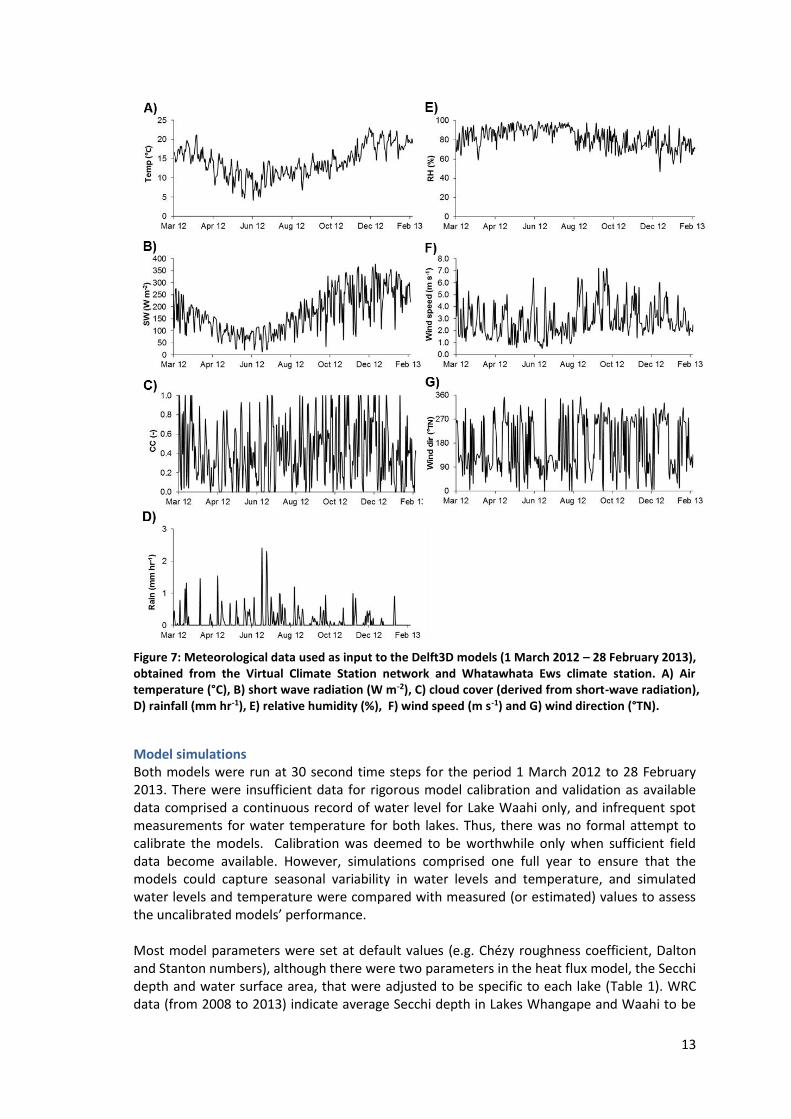
Meteorological forcing Meteorological data required for the simulation period were obtained from the National Climate Data Base (http://cliflow.niwa.co.nz) (Figure 7). There was no suitable climate station located close to the lakes, so meteorological data were obtained from the Virtual Climate Station network (http://www.niwa.co.nz/our-science/climate/our-services/virtual-climate-stations). The Virtual Climate Station (VCS) network provides estimates of daily averaged meteorological conditions on a regular (c. 5 km) grid for all New Zealand. The data included daily average air temperature (°C), global short wave radiation (W m-2), relative humidity (%), and daily total rainfall (m). Daily values for theoretical clear sky and full cloud-cover shortwave radiation (W m-2) were estimated by fitting seasonal sinusoidal curves to the maximum and minimum observed daily shortwave radiation values across the entire simulation period. Subsequently, average daily cloud cover was estimated by calculating the percentage difference between observed total daily shortwave radiation and the estimated theoretical daily maximum and minimum. Occasional values below 0 (clear sky) or above 100 (full cloud cover) were set as 0% and 100%, respectively. Because VCS data do not include estimated wind direction, wind direction (°TN) and wind speed (m s-1) were obtained from the closest climate station, Whatawhata Ews (-37.788 °S, 175.069 °E), which is c. 30 km southwest of the lakes. It is noted that future modelling (both hydrodynamic and water quality) should be able to make use of more accurate and highly resolved (e.g. hourly) meteorological data from climate stations located on lake monitoring buoys, which would be expected to significantly improve the simulation of variables such as water level and water temperature. In Delft3D the heat exchange at the free-surface is modelled based on the effects of both short wave and long wave radiation, evaporation and convection. This study implemented the Delft3D “Ocean heat flux model”, which has previously been applied to many waterbodies, including the North Sea, the Great Lakes, and the Waikato River estuary and allows the user to prescribe time-series for both shortwave radiation and cloud cover (Deltares 2011, Jones and Hamilton 2014). This heat flux model also requires prescription of several parameters that can be used in model calibration: the Secchi depth (which is used to calculate the light extinction

12
coefficient), the Dalton number for evaporative heat flux, and the Stanton number for heat convection (Deltares 2011).
Figure 6: Hypsograph derived from topographic-bathymetric Digital Elevation Models for Lake Whangape (A) and Lake Waahi (B)
13
Figure 7: Meteorological data used as input to the Delft3D models (1 March 2012 – 28 February 2013), obtained from the Virtual Climate Station network and Whatawhata Ews climate station. A) Air temperature (°C), B) short wave radiation (W m-2), C) cloud cover (derived from short-wave radiation), D) rainfall (mm hr-1), E) relative humidity (%), F) wind speed (m s-1) and G) wind direction (°TN).
Model simulations Both models were run at 30 second time steps for the period 1 March 2012 to 28 February 2013. There were insufficient data for rigorous model calibration and validation as available data comprised a continuous record of water level for Lake Waahi only, and infrequent spot measurements for water temperature for both lakes. Thus, there was no formal attempt to calibrate the models. Calibration was deemed to be worthwhile only when sufficient field data become available. However, simulations comprised one full year to ensure that the models could capture seasonal variability in water levels and temperature, and simulated water levels and temperature were compared with measured (or estimated) values to assess the uncalibrated models’ performance. Most model parameters were set at default values (e.g. Chézy roughness coefficient, Dalton and Stanton numbers), although there were two parameters in the heat flux model, the Secchi depth and water surface area, that were adjusted to be specific to each lake (Table 1). WRC data (from 2008 to 2013) indicate average Secchi depth in Lakes Whangape and Waahi to be
14
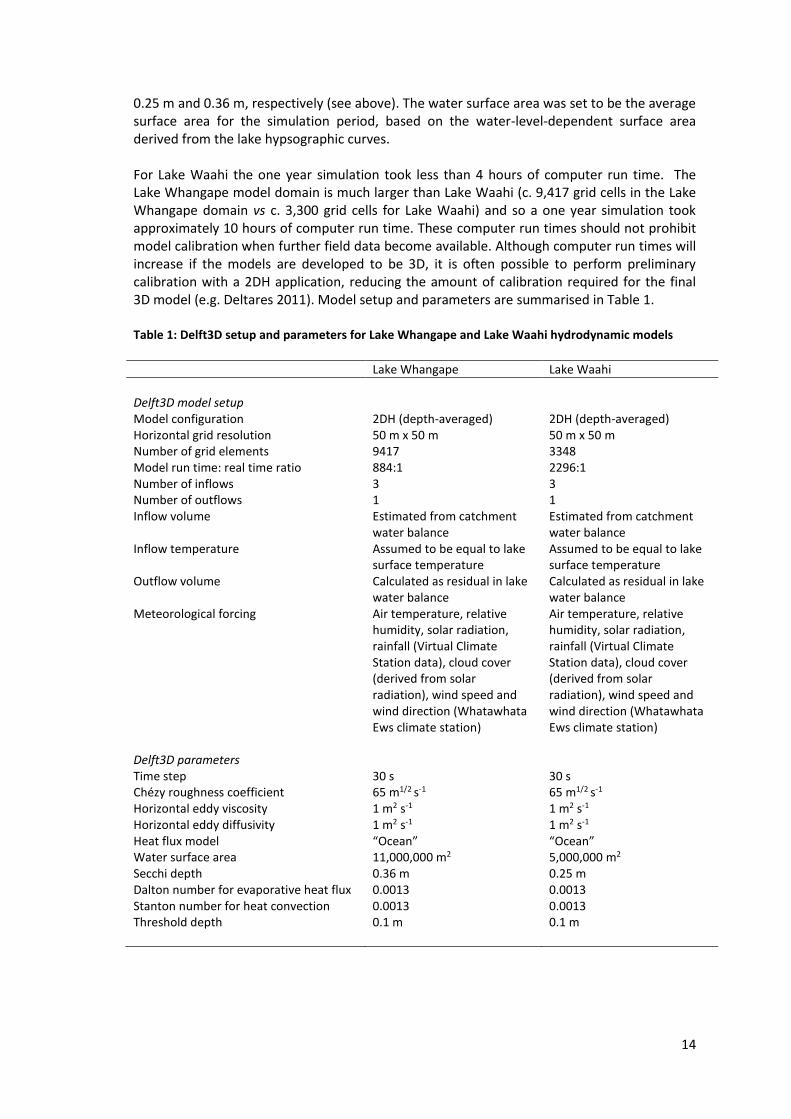
0.25 m and 0.36 m, respectively (see above). The water surface area was set to be the average surface area for the simulation period, based on the water-level-dependent surface area derived from the lake hypsographic curves. For Lake Waahi the one year simulation took less than 4 hours of computer run time. The Lake Whangape model domain is much larger than Lake Waahi (c. 9,417 grid cells in the Lake Whangape domain vs c. 3,300 grid cells for Lake Waahi) and so a one year simulation took approximately 10 hours of computer run time. These computer run times should not prohibit model calibration when further field data become available. Although computer run times will increase if the models are developed to be 3D, it is often possible to perform preliminary calibration with a 2DH application, reducing the amount of calibration required for the final 3D model (e.g. Deltares 2011). Model setup and parameters are summarised in Table 1. Table 1: Delft3D setup and parameters for Lake Whangape and Lake Waahi hydrodynamic models
Lake Whangape Lake Waahi
Delft3D model setup Model configuration 2DH (depth-averaged) 2DH (depth-averaged) Horizontal grid resolution 50 m x 50 m 50 m x 50 m Number of grid elements 9417 3348 Model run time: real time ratio 884:1 2296:1 Number of inflows 3 3 Number of outflows 1 1 Inflow volume Estimated from catchment
water balance Estimated from catchment water balance
Inflow temperature Assumed to be equal to lake surface temperature
Assumed to be equal to lake surface temperature
Outflow volume Calculated as residual in lake water balance
Calculated as residual in lake water balance
Meteorological forcing Air temperature, relative humidity, solar radiation, rainfall (Virtual Climate Station data), cloud cover (derived from solar radiation), wind speed and wind direction (Whatawhata Ews climate station)
Air temperature, relative humidity, solar radiation, rainfall (Virtual Climate Station data), cloud cover (derived from solar radiation), wind speed and wind direction (Whatawhata Ews climate station)
Delft3D parameters Time step 30 s 30 s Chézy roughness coefficient 65 m1/2 s-1 65 m1/2 s-1 Horizontal eddy viscosity 1 m2 s-1 1 m2 s-1 Horizontal eddy diffusivity 1 m2 s-1 1 m2 s-1 Heat flux model “Ocean” “Ocean” Water surface area 11,000,000 m2 5,000,000 m2 Secchi depth 0.36 m 0.25 m Dalton number for evaporative heat flux 0.0013 0.0013 Stanton number for heat convection 0.0013 0.0013 Threshold depth 0.1 m 0.1 m

15
Results and Discussion
GIS modelling of potential inundation
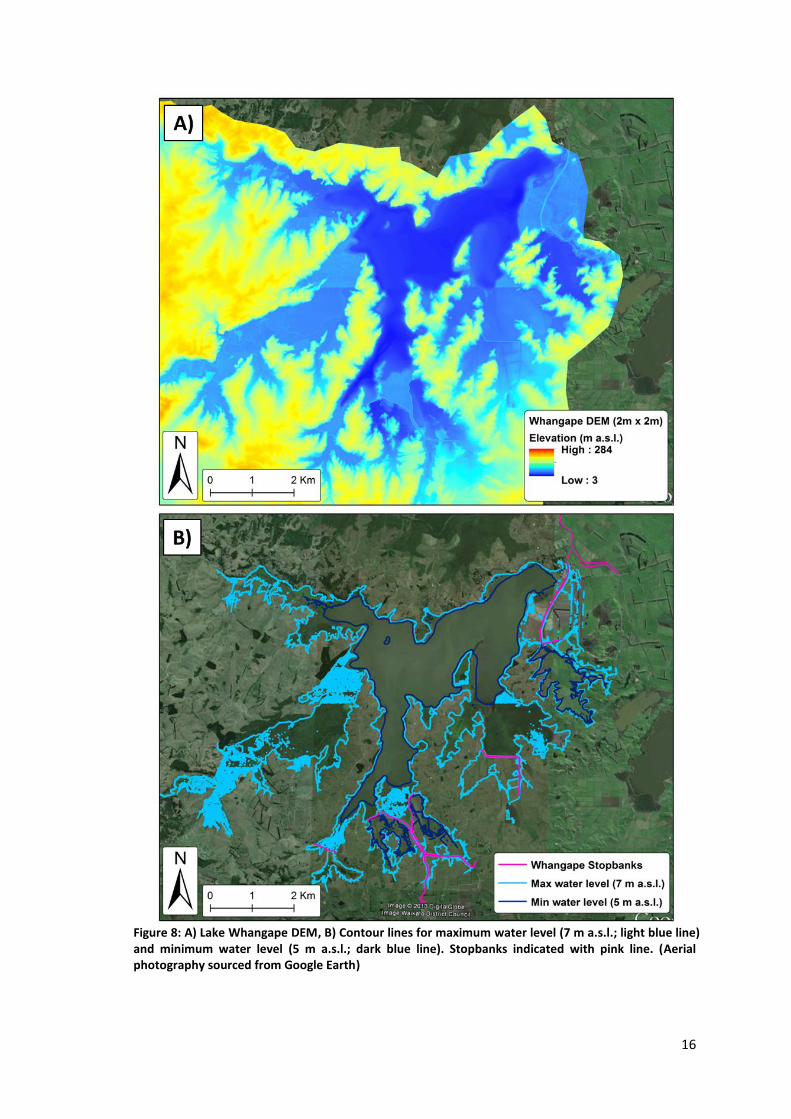
Contour lines for elevations corresponding to minimum and maximum water levels in Lakes Whangape and Waahi were constructed from the topographic-bathymetry DEMs (Figure 8 and Figure 9). These indicate that there is the potential for substantial areas of floodplain to be inundated under high water levels, although stopbanks clearly visible around both lakes will restrict the flooding extent. For Lake Whangape the DEM reveals that there is extremely low-lying land (i.e. < 5 m a.s.l., the minimum water level) surrounding the lake that is currently in farmland and protected by stopbanks, e.g. south of the southern arm, and east of the lake (Figure 8A). A stopbank near Lake Waahi appears to prevent inundation of farmland to the southwest of the lake (Figure 9B). Surface area of each lakes at minimum and maximum water levels was quantified in ArcGIS™ (Table 2). This indicates that, excluding those areas that appear to be protected by stopbanks, the surface area of Lake Whangape is c. 9.5 km2 at the minimum water level but increases to c. 21 km2 at the maximum water level. If areas that are currently protected from flooding are included, then the maximum inundated area increases to c. 28 km2. The surface area of Lake Waahi at the minimum water level is c. 3.7 km2, but increases to c. 8 km2 at the maximum water level with a maximum possible inundated area of c. 10 km2 if areas currently protected from flooding are included. These figures indicate the extent of lake and floodplain habitat loss that has occurred as a result of flood protection. Table 2: Lake surface area at minimum and maximum water levels (m above sea level; m a.s.l.) for Lake Whangape and Lake Waahi. Two scenarios are considered: A) areas currently protected from inundation area excluded, and B) areas currently protected are included.
Lake Whangape Lake Waahi
Minimum water level (m a.s.l.) 5 7.66 Maximum water level (m a.s.l.) 7 10.7 A) Excluding areas protected by stopbanks Area of lake at minimum water level (km2) 9.46 3.69 Area of lake at maximum water level (km2) 21.43 7.94 B) Including areas protected by stopbanks Area of lake at minimum water level (km2) 11.26 3.71 Area of lake at maximum water level (km2) 27.52 10.10
16
Figure 8: A) Lake Whangape DEM, B) Contour lines for maximum water level (7 m a.s.l.; light blue line) and minimum water level (5 m a.s.l.; dark blue line). Stopbanks indicated with pink line. (Aerial photography sourced from Google Earth)

17
Figure 9: A) Lake Waahi DEM, B) Contour lines for maximum water level (10.7 m a.s.l.; light blue line) and minimum water level (7.66 m a.s.l.; dark blue line). Stopbanks indicated with pink line. (Aerial photography sourced from Google Earth)

18
Delft3D hydrodynamic modelling
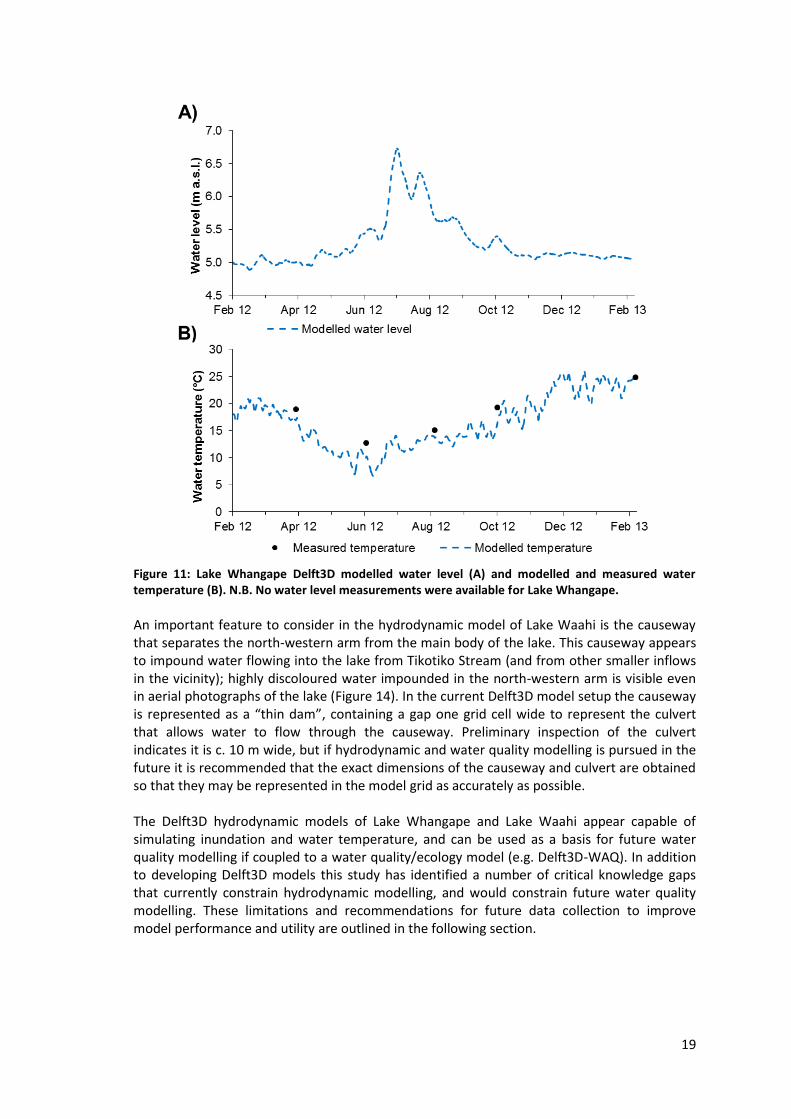
There was insufficient data for formal model calibration and validation, therefore Delft3D model output from year-long simulations was compared with available data to provide an indicative assessment of model performance, and to ensure that seasonal variability in water levels and temperature were represented well by the uncalibrated models. For the Lake Waahi model, measured and modelled water levels were in good agreement (R = 0.99, MAE = 0.03 m, Figure 10A). Measured and modelled water temperatures were also in good agreement (R = 0.99, MAE = 1.53 °C, Figure 10B), although the model appeared to under-predict water temperature in winter. There were no water level measurements available for Lake Whangape for the simulation period but measured and modelled water temperatures were in good agreement, although as for the Lake Waahi model, temperature was under-estimated in winter (R = 0.99, MAE = 1.82, Figure 11). For both models, further data are required to improve the simulation of water temperature, including measurements of lake water temperature (for calibration and validation) and of inflow water temperature (for parameterisation of forcing data). In addition, measurements of water level in Lake Whangape are required to validate model simulations (and for the construction of a lake water balance to derive unmeasured inflows/outflows). For both lakes, model simulations show inundation of floodplains/wetlands surrounding the lakes in winter when water levels are high, and a substantial decrease in lake surface area in summer when water levels are low (Figure 12 and Figure 13), which is consistent with the GIS modelling described above.
Figure 10: Lake Waahi Delft3D modelled and measured water level (A) and water temperature (B)
19
Figure 11: Lake Whangape Delft3D modelled water level (A) and modelled and measured water temperature (B). N.B. No water level measurements were available for Lake Whangape.
An important feature to consider in the hydrodynamic model of Lake Waahi is the causeway that separates the north-western arm from the main body of the lake. This causeway appears to impound water flowing into the lake from Tikotiko Stream (and from other smaller inflows in the vicinity); highly discoloured water impounded in the north-western arm is visible even in aerial photographs of the lake (Figure 14). In the current Delft3D model setup the causeway is represented as a “thin dam”, containing a gap one grid cell wide to represent the culvert that allows water to flow through the causeway. Preliminary inspection of the culvert indicates it is c. 10 m wide, but if hydrodynamic and water quality modelling is pursued in the future it is recommended that the exact dimensions of the causeway and culvert are obtained so that they may be represented in the model grid as accurately as possible. The Delft3D hydrodynamic models of Lake Whangape and Lake Waahi appear capable of simulating inundation and water temperature, and can be used as a basis for future water quality modelling if coupled to a water quality/ecology model (e.g. Delft3D-WAQ). In addition to developing Delft3D models this study has identified a number of critical knowledge gaps that currently constrain hydrodynamic modelling, and would constrain future water quality modelling. These limitations and recommendations for future data collection to improve model performance and utility are outlined in the following section.

Figure 12: Lake Waahi Delft3D modelled water depth at A) low water levels (8 March 2012, water level 7.95 m a.s.l.) and B) high water levels (26 July 2012 9.67 m a.s.l.). Note inundation of floodplain/wetlands surrounding the lake in (B).

Figure 13: Lake Whangape Delft3D modelled water depth at A) low water levels (8 March 2012, water level 5 m a.s.l.) and B) high water levels (26 July 2012 6.70 m a.s.l.). Note inundation of floodplain/wetlands surrounding the lake, particularly to the northwest, in (B).
22
Figure 14: Aerial photographs of Lake Waahi (-37.559 °S, 175.127 °E) from 29 May 2010 (left panel) and 26 January 2008 (right panel). Note discoloured water in north-western arm that is separated from the main body of the lake by a causeway. Source: Google Earth.
Limitations and recommendations
There is considerable potential for hydrodynamic and water quality models of Lakes Whangape and Waahi to increase understanding of the ecological functioning of these lakes, and inform their management and restoration. However, there is also considerable scope for model development due to critical data and knowledge gaps that constrain the presented hydrodynamic modelling and will similarly constrain any future water quality modelling. Major limitations and recommendations have been summarised in Table 3. Lake bathymetry was derived from surveys conducted in 1979. The accuracy of these surveys is unknown, as are the ways in which lake bathymetry may have changed over the 35 years since. It is important that the current bathymetric maps are validated with up-to-date measurements, and if lake bathymetry has changed significantly then new bathymetry should be collected and integrated into current DEMs. There is also a noticeable discontinuity in LiDAR data around Lake Whangape that could be resolved through further processing of raw data by GIS analysts. Measurements of water level (referenced to Moturiki vertical datum) for Lake Whangape are a critical requirement for hydrodynamic modelling for both model validation and the calculation of a lake water balance to derive any unmeasured inflow or outflow. Currently, inflows and outflow in each lake represent unknown components of the water balance. For future modelling it is important that one, or ideally both, is/are robustly quantified. For the lake inflows, hydrological modelling may provide a means to obtain inflow volumes at the high temporal frequency (e.g. daily, or hourly) required for model input data. It would also be advantageous to attempt some quantification of lake outflow volumes as there is the potential for backflow (particularly in Whangape), which may complicate water balance calculations. Simulation of water temperature will depend on model forcing data (i.e. climate data and inflow water temperature) and model parameters (typically adjusted during model calibration). Water temperature of lake inflows should be measured at a frequency sufficient to resolve fluctuations related to variables such as climatic and hydrological conditions (i.e. fortnightly, or at least monthly). Calibration and validation of model output requires

23
measurements of lake water temperature (preferably throughout the water column for any 3D modelling) taken at a higher frequency than the current bimonthly sampling regime. Lake monitoring buoys installed in early 2014 will provide high-frequency (sampling interval of 15 minutes) measurements of water temperature at several depths in the water column, which will be crucial for any future modelling. For future water quality modelling, data would be required for dissolved oxygen, nutrient and sediment concentrations in lake inflows (ideally collected at a similar frequency to the inflow water temperature measurements describe above). Currently, there seem to be no data on water quality in lake inflows. Measuring nutrient and sediment concentrations in lake inflows would also be useful for the validation of nutrient load modelling carried out by Jenkins and Vant (2006). For calibration and validation of a water quality model, data would also be required on dissolved oxygen, nutrient, sediment and chlorophyll a concentrations in the lakes, preferably at a higher frequency than the current bimonthly sampling regime. The lake monitoring buoys will provide high frequency measurements of dissolved oxygen, turbidity, chlorophyll and phycocyanin fluorescence. These data will be highly valuable for model calibration and validation, although it should be noted that calibration of the turbidity, chlorophyll and phycocyanin sensors with in-lake measurements (of extracted chlorophyll a concentration, phytoplankton cell counts and total suspended sediment concentration) will be critical to the applicability of the monitoring buoy measurements for any model calibration. The location of the buoys adjacent to existing water quality monitoring sites should enable this analysis to be undertaken. In this study the hydrodynamic models were developed in 2DH (depth-averaged computation); limited available data for model setup and calibration meant it was not worthwhile undertaking modelling in 3D. Application of 3D modelling would increase model complexity and simulation times considerably. However, future hydrodynamic and water quality modelling may require a 3D application, for example, to capture thermal stratification and/or dissolved oxygen depletion in the hypolimnion. As discussed previously, in Delft3D it is possible to convert a 2DH model to 3D with relatively little effort, and preliminary calibration with a 2DH version of a model will likely inform a 3D application. A consideration of additional run time could be carried out a priori but is not itself expected to preclude the application of 3D simulations. Finally, future research could focus on the potential to use hydrodynamic models in combination with lake buoys and remote sensing data to identify both the location of invasive fish spawning habitat and the timing of major spawning events. It may be possible to use remote sensing to identify vegetation types at the lake margin. A hydrodynamic model could then be used to identify the extent of inundation and water temperature in this habitat under a range of water level scenarios to refine the spatial area that invasive fish (e.g. koi carp) may be targeting for spawning. Real-time data from lake buoys could then be used to indicate that water levels and temperature are such there is a high likelihood of spawning in a particular location, potentially enabling targeted efforts at invasive fish eradication.

24
Conclusions Two hydrodynamic models have been developed using available data for Lake Whangape and Lake Waahi in Delft3D (open-source modelling software available from Deltares, The Netherlands), which simulate inundation and water temperature. This study also developed Digital Elevation Models for the lakes and their catchments, which have been used to quantify the surface area of each lake at minimum and maximum water levels and has revealed that a substantial area of floodplain around each of the lakes is currently protected by stopbanks. We have identified a number of critical knowledge gaps that currently constrain hydrodynamic modelling and any future water quality modelling. In particular, there are very limited data on lake inflows and outflows. Delft3D provides an open-source ecology and water quality module which can be coupled to the hydrodynamic models developed in this study. Necessary forcing data for hydrodynamic modelling include inflow and outflow volumes and inflow water temperature, and for water quality modelling, dissolved oxygen, nutrient and suspended sediment concentrations in inflows, all of which are currently lacking. Currently, in lake measurements are collected at low frequency (bimonthly) and are insufficient for rigorous calibration and validation of a hydrodynamic or water quality model. However, installation of lake monitoring buoys on both Whangape and Waahi in early 2014 will provide data suitable for calibration and validation of future hydrodynamic-water quality models, and will potentially significantly enhance understanding of lake condition and ecosystem dynamics. Furthermore, there may be potential to combine information gained from hydrodynamic modelling (on inundation and water temperatures) with information of vegetation types at the lake margin to identify invasive fish spawning habitat.
25
Table 3: Summary of limitations and recommendations for Delft3D hydrodynamic and water quality modelling of Lake Whangape and Lake Waahi
Limitation Recommendation
Hydrodynamic modelling Lake bathymetry collected in 1979 Verify accuracy of historical bathymetry, and/or
collect new bathymetry (e.g. with multi-beam echo-sounder).
Lack of data on lake water level for Lake Whangape
Install water level recorder. (Will be addressed by lake buoy due to be installed early 2014.)
Meteorological data available from climate station c. 30 km from lakes or Virtual Climate Network only
Measure metrological variables over the lakes. (Will be addressed by climate stations on lake buoys measuring short wave radiation, air temperature, relative humidity, and wind speed and direction. Rainfall measurements may need to be sourced from a location close to the lakes.)
Lack of data on inflow and outflow volumes Conduct hydrological modelling to derive lake inflows (some measurements of lake inflows required to calibrate and validate hydrological model). Monitor lake outflows and/or derive relationships between lake level, Waikato River level and outflow direction and volume.
Lack of data on inflow water temperature Monitor water temperature in major surface inflows (at least monthly so that a relationship between air temperature and water temperature can be derived).
Limited data for calibration and validation of water temperature (currently c. bimonthly measurements)
Monitor water temperature at high frequency. (Will be addressed by lake buoys installed in early 2014.)
Uncertainty around causeway structure in Lake Waahi
Measure dimensions of causeway and culvert, and verify configuration in model grid, e.g. by measured vs modelled tracer studies.
Water quality modelling
Lack of data on inflow dissolved oxygen, nutrient and suspended sediment concentrations
Monitor dissolved oxygen, nutrient and sediment concentrations in major surface inflows (at least monthly, but highly recommended to conduct sampling at higher frequency, and/or storm sampling).
Limited data for calibration and validation of water quality (currently c. bimonthly samples for dissolved oxygen, nutrient, suspended sediment and chlorophyll a concentration)
Monitor dissolved oxygen, nutrient, suspended sediment and chlorophyll a concentration at high frequency. (Will be partially addressed by lake buoys but further sample collection required to calibrate fluorescence, phycocyanin and turbidity sensors).

26
References
Bell, R. G., S. V. Dumnov, B. L. Williams, and M. J. N. Greig. 1998. Hydrodynamics of Manukau Harbour, New Zealand. New Zealand Journal of Marine and Freshwater Research 32:81-100.
Brijs, J., B. J. Hicks, and W. Powrie. 2009. Abundance of mysid shrimp (Tenagomysis chiltoni) in shallow lakes in the Waikato region and implications for fish diet. CBER Report 107. Prepared for Environment Waikato by Centre for Biodiversity and Ecology Research, University of Waikato.
Champion, P. D., S. M. Beadel, and T. M. Dugdale. 2001. Turf communities of Lake Whangape and some potential management techniques. Science for Conservation 186, 54 p.
Collier, K., D. Hamilton, W. Vant, and C. Howard-Williams, editors. 2010. The Waters of the Waikato - Ecology of New Zealands Longest River. Environment Waikato and the Centre for Biodiversity and Ecology Research,The University of Waikato.
Deltares. 2011. Delft3D-FLOW: Simulation of multi-dimensional hydrodynamics flows and transport phenonmena, including sediments. User manual version 3.15. Deltares, The Netherlands.
Elias, E. P. L., D. J. R. Walstra, J. A. Roelvink, M. J. F. Stive, and M. D. Klein. 2000. Hydrodynamic validation of Delft3D with field measurements at Egmond. Pages 2714-2727 in 27th International Conference on Coastal Engineering. American Society of Civil Engineers, Sydney, Australia.
Hayes, J. W. and M. J. Rutledge. 1991. Relationship between turbidity and fish diets in Lakes Waahi and Whangape, New Zealand. New Zealand Journal of Marine and Freshwater Research 25:297-304.
Imerito, A. 2007. Dynamic Reservoir Simulation Model DYRESM v4.0 Science Manual. Centre for Water Research, University of Western Australia.
Irwin, J. 1981. Lake Whangape Bathymetry 1:9000. Lake Series Chart. New Zealand Oceanographic Institute.
Irwin, J. and W. d. L. Main. 1981. Lake Waahi Bathymetry 1:6000. Lake Series Chart. New Zealand Oceanographic Institute.
Jenkins, B. and B. Vant. 2006. PO\ptential for reducting the nutrient loads from the catchments of shallow lakes in the Waikato Region. Environment Waikato Technical Report 2006/54, Waikato Regional Council, Hamilton.
Jones, H., D. Hamilton, and K. Muraoka. 2013. Facilitating rafting on the Kaituna River: The effect of manipulating Lake Rotoiti outflow on the function of the Ohau diversion wall. ERI Report 23. Prepared for Bay of Plenty Regional Council by the Environmental Research Institute, University of Waikato.
Jones, H. F. E. and D. P. Hamilton. 2014. Assessment of the Waikato River estuary and delta for whitebait habitat management: field survey, GIS modelling and hydrodynamic modelling. Prepared for Waikato Regional Council. Environmental Research Institute Report No. 27, University of Waikato, Hamilton. 79 pp.

27
Lesser, G. R., J. A. Roelvink, J. A. T. M. van Kester, and G. S. Stelling. 2004. Development and validation of a three-dimensional morphological model. Coastal Engineering 51:883-915.
Medeiros, S. C., T. Ali, S. C. Hagen, and J. P. Raiford. 2011. Development of a seamless topographic/bathymetric Digital Terrain Model for Tampa Bay, Florida. Photogrammetric Engineering and Remote Sensing 77:1249-1256.
Mohseni, O., H. G. Stefan, and T. R. Erickson. 1998. A nonlinear regression model for weekly stream temperatures. Water Resources Research 34:2685-2692.
Muraoka, K., W. Paul, D. Hamilton, and N. von Westernhagen. 2010. Effect of different operational regimes of Okere gates on the effectiveness of the Ohau channel diversion wall in Lake Rotoiti. CBER Report 107. Prepared for Bay of Plenty Regional Council by the Centre for Biodiversity and Ecology Research, University of Waikato.
Tay, H. W., K. R. Bryan, W. P. de Lange, and C. A. Pilditch. 2013. The hydrodynamics of the southern basin of Tauranga Harbour. New Zealand Journal of Marine and Freshwater Research 47:249-274.
von Westernhagen, N. 2010. Measurements and modelling of eutrophication processes in Lake Rotoiti, New Zealand. PhD. University of Waikato.
Ward, F. J., T. G. Northcote, and M. A. Chapman. 1987. The effects of recent environmental changes in Lake Waahi on two forms of the common smelt Retropinna retropinna and other biota. Water, Air and Soil Pollution 32:427-443.
West, D. W., T. Roxburgh, and B. L. Chisnall. 2000. Fish communities of Lake Whangape, Waikato - April 2000 survey. Conservation Advisory Service Notes No. 322, Department of Conservation, Wellington.