PEFA Assessment Report of Rwanda (2016) with... · Final Report ... BER Budget Execution Report BFP...
125
PEFA Assessment Report of Rwanda (2016) The quality assurance process followed in the production of this report satisfies all the requirements of the PEFA Secretariat and hence receives the ‘PEFA CHECK’. PEFA Secretariat May 9, 2017
Transcript of PEFA Assessment Report of Rwanda (2016) with... · Final Report ... BER Budget Execution Report BFP...

PEFA Assessment Report of Rwanda (2016)
The quality assurance process followed in the production of this report satisfies
all the requirements of the PEFA Secretariat and hence receives the ‘PEFA
CHECK’.
PEFA Secretariat
May 9, 2017

2
Public Expenditure and Financial Accountability (PEFA)
Assessment 2016
Project Number:
27/7.3.1.1/C/PFM-BF/MINECOFIN/2015
Government of Rwanda (Central Government)
Final Report
(February 2016 Framework)
09 MAY 2017
This project is funded by the A project implemented by
Government of Rwanda AECOM International Development Europe

3
The contents of this publication are the sole responsibility of AECOM International Development Europe
and can in no way be taken to reflect the views of the Government

4
Final Report
Project No. 27/7.3.1.1/C/PFM-BF/MINECOFIN/2015
By
Philip Sinnett Charles Komla Hegbor
Francis Mugisha Charles Gasana
Presented by
AECOM INTERNATIONAL DEVELOPMENT, EUROPE

5
Contents
ACRONYMS AND ABBREVIATIONS ................................................................................................ 6
EXECUTIVE SUMMARY .................................................................................................................. 8
1 INTRODUCTION .................................................................................................................... 13 1.1 RATIONALE AND PURPOSE .............................................................................................................. 13 1.2 ASSESSMENT MANAGEMENT AND QUALITY ASSURANCE ....................................................................... 13 1.3 ASSESSMENT METHODOLOGY ......................................................................................................... 14
2 COUNTRY BACKGROUND INFORMATION .............................................................................. 16 2.1 COUNTRY ECONOMIC SITUATION ..................................................................................................... 16 2.2 FISCAL AND BUDGETARY TRENDS ...................................................................................................... 19 2.3 LEGAL AND REGULATORY ARRANGEMENTS FOR PFM .......................................................................... 20 2.4 INSTITUTIONAL ARRANGEMENTS FOR PFM ........................................................................................ 23 2.5 OTHER IMPORTANT FEATURES OF PFM AND ITS OPERATING ENVIRONMENT ........................................... 25
3 ASSESSMENT OF PFM PERFORMANCE ................................................................................... 26 PILLAR I. BUDGET RELIABILITY .................................................................................................................. 26 PILLAR II. TRANSPARENCY OF PUBLIC FINANCES .......................................................................................... 29 PILLAR III. MANAGEMENT OF ASSETS AND LIABILITIES ................................................................................. 37 PILLAR IV. POLICY-BASED FISCAL STRATEGY AND BUDGETING ....................................................................... 46 PILLAR V. PREDICTABILITY AND CONTROL IN BUDGET EXECUTION .................................................................. 54 PILLAR VI. ACCOUNTING, RECORDING AND REPORTING............................................................................... 76 PILLAR VII. EXTERNAL SCRUTINY AND AUDIT ............................................................................................. 81
4 CONCLUSIONS OF THE ANALYSIS OF PFM SYSTEMS ............................................................... 87 4.1 INTEGRATED ASSESSMENT OF PFM PERFORMANCE ............................................................................. 87 4.2 EFFECTIVENESS OF THE INTERNAL CONTROL FRAMEWORK ................................................................... 91 4.3 PFM STRENGTHS AND WEAKNESSES ................................................................................................ 92 4.4 PERFORMANCE CHANGES SINCE A PREVIOUS ASSESSMENT .................................................................... 94
5 GOVERNMENT REFORM PROCESS ......................................................................................... 98 5.1 APPROACH TO PFM REFORMS ........................................................................................................ 98 5.2 RECENT AND ON-GOING REFORM ACTIONS ........................................................................................ 99 5.3 INSTITUTIONAL CONSIDERATIONS ................................................................................................... 101
6 ANNEXES............................................................................................................................. 103
ANNEX 1: PERFORMANCE INDICATOR SUMMARY ...................................................................... 104
ANNEX 2: SUMMARY OF OBSERVATIONS ON THE INTERNAL CONTROL FRAMEWORK ................. 110
ANNEX 3A: RELATED SURVEYS & ANALYTICAL WORK ................................................................. 113
ANNEX 3B: STAKEHOLDERS INTERVIEWED ................................................................................. 114
ANNEX 3C: INFORMATION SOURCES – DOCUMENTS .................................................................. 116
ANNEX 4: DATA USED FOR SCORING PI-1, 2 & 3.2 ....................................................................... 118
ANNEX 5: BUDGET CALENDAR 2015/2016 FISCAL YEAR .............................................................. 122

Rwanda PEFA Assessment, Upgraded Framework 2016
6
Acronyms and Abbreviations
AAP Assessment and Action Plan ACCA Association of Chartered Certified Accountants ACHA Aid Coordination and Harmonization Framework AER Annual Economic Report AfDB African Development Bank AG Accountant General AGA Autonomous Government Agency BCC Budget Call Circular BCDI Bank of Commerce Development and Industry BCR Banque Commerciale du Rwanda BER Budget Execution Report BFP Budget Framework Paper BNR Banque Nationale du Rwanda BSHG Budget Support Harmonization Group CBTI Capacity Building and Technical Input CDF Common Development Fund CEPEX Central Public Investments and External Finance Bureau CFS Consolidated Financial Statements CG Central Government COFOG Classification of the Functions of Government CSR Caisse Sociale du Rwanda DAD Development Assistance Database DAF Director of Administration and Finance DBS Direct Budget Support DC District Council DFID Department for International Development DPCG Development Partners Coordination Group DRI Debt Relief International DSA Debt Sustainability Analysis EAC East African Community EU European Union EDPRS Economic Development and Poverty Reduction Strategy EFU External Finance Unit FARAP Financial Accountability Review and Action Plan FARG Fund to Assist Refugees and Genocides FY Fiscal Year GBE Government Business Enterprise GDP Gross Domestic Product GFSM Government Financial Statistics Manual GoR Government of Rwanda GPIAU Government Principal Internal Audit Unit IASB International Accounting Standards Board ICT Information Communication Technology IFMIS Integrated Financial Management Information Systems IMF International Monetary Fund IPPS Integrated Personnel and Payroll Information System IPSAS International Public Sector Accounting Standards IT Information Technology LABSF Local Authorities Budget Support Fund LGBSF Local Government Budget Support Fund LM Line Ministry MDAs Ministries, Departments, Agencies MDGs Millennium Development Goals MIFOTRA Ministry of Public Service, Skills Development, Vocational
Training & Labour MINALOC Ministry of Local Government, Community Development and
Social Affairs

Rwanda PEFA Assessment, Upgraded Framework 2016
7
MINECOFIN Ministry of Finance and Economic Planning MINISANTE Ministry of Health MIPPS Military Integrated Payroll and Personnel Information System MTEF Medium Term Expenditure Framework N/A Not applicable NBU National Budget Unit NGO Non-Government Organization NPR National Police of Rwanda NTB National Tender Board OAG Office of the Auditor General OBL Organic Budget Law (i.e. as revised, No. 12/2013, unless
otherwise stated) ODA Official Development Assistance OECD Organization for Economic Cooperation and Development OTR Ordinnateur-Trésorier du Rwanda PAYE Pay As You Earn PE Public Enterprise PEFA Public Expenditure and Financial Accountability PEMR Public Expenditure Management Review PFM Public Financial Management PFM-PR Public Financial Management Performance Report PFM SSP Public Financial Management Sector Strategic Plan PIC Public Investment Committee PIP Public Investment Program PPA Public Procurement Authority PRGF Poverty Reduction and Growth Facility PRSP Poverty Reduction Strategy Paper PS/ST Permanent Secretary/ Secretary to the Treasury PSCBP Public Sector Capacity Building Project PSI Policy Support Instrument RDF Rwanda Defence Forces ROSC Report on the Observance of Standards and Codes RPPA Rwanda Public Procurement Regulatory Authority RRA Rwanda Revenue Authority RSSB Rwanda Social Security Board RwF Rwanda Franc SAI Supreme Audit Institution SG Secretary General SIP Strategic Issues Paper SN Sub-National SPIU Single Project Implementation Unit STA Single Treasury Account TIN Taxpayer Identity Number TMU Treasury Management Unit USAID United States Agency for International Development USD United States Dollars VAT Value Added Tax WB World Bank
Fiscal year: 1 July
Currency: RwF (USD 1 = 690 RwF)

Rwanda PEFA Assessment, Upgraded Framework 2016
8
Executive Summary
Purpose and management of the assessment
The overall objective of this PEFA assessment was to produce a comprehensive “PFM
Performance Report” according to the upgraded PEFA Performance Measurement
Framework Methodology of 2016 to provide an analysis of the overall performance of the
PFM systems of the country and to provide a baseline against which future progress can
be measured.
Assessment coverage and timing
This assessment covered the central government of Rwanda, and the fieldwork took
place in June and July 2015: most of the indicators were assessed using data from
2013/2014 and the two previous completed FYs. This data was supplemented by further
fieldwork in November 2016 to comply with the additional requirements of the upgraded
Framework released on 1 February 2016.
Impact of PFM Systems on the three main budgetary outcomes
Aggregate fiscal discipline
Overall, fiscal discipline is reasonably good, and most elements in the overall PFM
system that contribute to achieving this objective appear to be sound. On the revenue
side, performance is good (PI-3, rated ‘B+’), although while there are variances in
expenditure against the original budget (PI-2.1), these are not distorted by payment
arrears, the stock of which is declining (PI-22.1).
In addition, the risks to attaining fiscal discipline have been reduced, due to several
factors: there are few unreported operations (PI-6); monitoring of fiscal risks from other
Public Sector entities is reasonable (PI-10), although there are exceptions with contingent
liabilities and ‘Public Private Partnerships’ (PI-10.3); the recording of government debt
and the inclusion of donor funded project bank accounts into the consolidation of
government cash/bank balances is comprehensive (PI-13); and the multi-year focus in
fiscal planning is also good (PI-16.3 and 4). There are two new indicators that relate to
this budgetary outcome, ‘Macroeconomic and Fiscal Forecasting’ (PI-14) and ‘Fiscal
Strategy’ (PI-15) both of which score very well.
With the exception of the large volume of very old tax arrears (which the law does allow
to be written-off: PI-19.4), the various elements of the system concerned with budget
execution – including internal controls – are sound and contribute to the attainment of
aggregate fiscal discipline.
Strategic allocation of resources
The five indicators concerned with ‘policy-based fiscal strategy and budgeting’, (PIs 14 to
18) all received good overall ratings, and demonstrate that the process to allocate

Rwanda PEFA Assessment, Upgraded Framework 2016
9
budgetary resources in accordance with GoR’s declared strategic objectives is sound and
has in fact, strengthened. There are two exceptions to this: the first is the absence of
medium-term expenditure ceilings in the budget preparation process (PI-16.2); and,
secondly, PI-18.4 regarding Parliamentary oversight of in-year amendments to the
approved budget, (but this is an improvement from the previous assessment). This
conclusion is consistent with a reasonable rating for PI-2, which suggests that the budget
formulation process (which benefits from considerable political engagement at an early
stage) produces the desired results.
Most of the other indicators that contribute to the strategic allocation of resources have
continued to function well, notably the comprehensiveness of the budget documentation,
and its classification in accordance with international norms (PIs 5 (‘B’) and 4 (‘A’)
respectively). The indicators related to revenue collection (PIs 19 and 20) have been
reformulated, and with the exception of tax audits and the monitoring of arrears (PI-19-3
and 4) perform well, which is important as the RRA is expected to increase domestic
revenues in the years to come.
There is another completely new indicator relevant to this budgetary outcome which is
‘Public Investment Management’ (PI-11), and this reflects “generally accepted good
practice”, with ‘A’ ratings for two of the four dimensions.
Efficient use of resources for service delivery
Financial management is not an end in itself, but rather a tool to assist a government to
deliver services to its citizens, and of course, services cannot be delivered in the absence
of funds. In this respect, GoR’s PFM system works well, as can be seen in the good
ratings for the processes that plan services (PIs 16 and 17 mentioned above); the
revenue indicators (PIs 19 and 20 – with the exception of arrears, mentioned above);
predictability in the availability of funds to support expenditure (PI-21, ‘B+’); the fact that
intergovernmental fiscal relations are transparent (PI-7, rated ‘A’) as many services are
actually delivered to communities by the Districts.
While the indicators listed above reveal what may be regarded as a satisfactory level of
performance, the rating for ‘performance information’ which can demonstrate the
efficiency with which services are delivered (PI-8, ‘D”) is disappointing, as is that of the
last of the completely new indicators introduced into the Framework: ‘Public Asset
Management’ (PI-12), which reveals a weak performance – with potentially severe
consequences, in that resources are unlikely to be utilized efficiently or effectively by a
government that does not know what assets it owns.
Importantly, the mechanisms in place to reduce possible leakages in the system, such as
internal controls, and controls over payroll (PIs 25 and 23 respectively) are good, while
Internal Audit continues to improve (PI-26), as do the basic accounting controls (PI 27)
and the procurement indicator (PI-24).
Lastly, while the oversight arrangements (addressed in PIs 30-31) are reasonably
effective: they show a mixed picture. There are improvements, for example in the
Parliamentary scrutiny of the Auditor-General’s reports, while on the other hand, the lack
of financial independence of the OAG – a new dimension introduced to the Framework –
can be seen as a constraint on the scope and nature of the work performed.

Rwanda PEFA Assessment, Upgraded Framework 2016
10
In summary, most aspects of the PFM system are functioning at a satisfactory level – one
that should allow GoR to attain its fiscal and budgetary objectives. This said, there remain
areas for improvement (such as performance information on service delivery; capturing
all assets bought with public funds in registers – and maintaining the registers; managing
revenue arrears; issuing budget execution reports; and improving the (financial)
independence of the OAG), some of which are already incorporated in the PFM SSP.
Performance changes since last assessment
This is the first assessment using the ‘Upgraded’ Framework, and the guidance issued by
the PEFA Secretariat (October 2016) states that only 14 dimensions are directly
comparable with the 2011 version: however, one of these is PI-2 (iii) which was part of
one of the three indicators amended in 2011, i.e. after the previous assessment in
Rwanda (PIs-3 and 19 were the others amended in 2011).
The table below shows changes in the ratings for directly comparable dimensions using
the numbers in this report, against the previous PI and dimension reference. Section 4.4
below provides details of these as well as the ‘non-comparable’ ratings.
Table 0.1: Changes in the ratings for directly comparable dimensions since 2010
No. Indicator Score
2016
Score
2010
‘Old’
#
Performance change
PI-4 Budget classification
4.1 Budget classification A A PI-5 (i) No change.
PI-13 Debt management
13.1 Recording and reporting of debt and guarantees
B B PI-17(i) No change.
PI-17 Budget preparation process
17.1 Budget calendar A A PI-11 (i) No change.
17.2 Guidance on budget preparation B C PI-11 (ii) Improvement: BCC is comprehensive, clear, & issued early Feb, & even without cabinet approved ceilings, is firm basis for preparation of estimates.
PI-18 Legislative scrutiny budgets
18.1 Scope of budget scrutiny A A PI-27 (i) No change.
18.4 Rules for budget adjustment by the executive
B C PI-27 (iv) Improvement: reallocations take place, but limited impact on total.
PI-21 Predictability of in-year resource allocation
21.1 Consolidation of cash balances A B PI-17 (ii) TSA fully functional: CG cash balances are consolidated daily, hence MINECOFIN knows cash position at end each day.
21.2 Cash forecasting and monitoring B B PI-16 (i) No change.
21.3 Information on commitment ceilings
B B PI-16 (ii) No change.
21.4 Significance of in-year budget adjustments
A A PI-16 (iii) No change.
PI-23 Payroll controls
23.3 Internal control of payroll A A PI-18 (iii) No change.
23.4 Payroll audit B B PI-18 (iv) No change.
PI-25 Internal controls on nonsalary expenditure
25.2 Effectiveness of expenditure commitment controls
A A PI-20 (i) No change.

Rwanda PEFA Assessment, Upgraded Framework 2016
11
Overview of on-going and planned PFM reforms and main weaknesses
identified
There are seven key programmes in the current PFM reform strategy, which are:
Economic Planning and Budgeting
Resource Mobilisation
Budget Execution, Accounting and Reporting
External Oversight and Accountability
Electronic Service Delivery and IFMIS
Fiscal Decentralisation
PFM Sector Coordination and Management
In addition, four priorities have emerged for urgent consideration:
Increased resource mobilisation: domestic tax and non-tax revenue mobilisation to
ensure Rwanda becomes self-reliant in the medium to long term
Scaling up of the implementation of IFMIS: extend IFMIS to remaining government
agencies both at central and local government levels as well as initiate the process for
the use of a full-fledged IFMIS that has all the functionalities such as procurement,
fixed asset management, and inventory modules
Strengthen PFM systems at sub-national level: integrate sub-national service
delivery units such as schools and primary healthcare institutions into IFMIS for
effective PFM systems in order to improve decentralised service delivery; joint staff
training for both district councils and local service delivery units will be delivered
Enhance training, professionalization and capacity building across all PFM
disciplines: provide professional training to augment staff to ensure sustainability.
The World Bank is also providing support to the tune of USD 100 million for the Public
Sector Governance ‘Programme-for-Results’, which aims to improve Rwanda's PFM and
statistics systems for the enhancement of transparency and accountability in the use of
public funds, revenue mobilisation and the quality and accessibility of development data
for decision-making.

Rwanda PEFA Assessment, Upgraded Framework 2016
12
Table 0.2: Overall summary of PFM Performance Scores – 2016 Assessment
PFM Performance Indicator (PI) Scoring
Method
Dimension
Ratings Overall
Rating .1 .2 .3 .4
Pillar I: Budget reliability
PI-1 Aggregate expenditure outturn M1 C C
PI-2 Expenditure composition outturn M1 C B C C+
PI-3 Revenue outturn M2 B A B+
Pillar II. Transparency of public finances
PI-4 Budget classification M1 A A
PI-5 Budget documentation M1 B B
PI-6 Central government operations outside fiscal reports M2 A A B A
PI-7 Transfers to subnational governments M2 A A A
PI-8 Performance information for service delivery M2 D C D D D
PI-9 Public access to key fiscal information M1 B B
Pillar III. Management of assets and liabilities
PI-10 Fiscal risk reporting M2 B C C C+
PI-11 Public investment management M2 B A A C B+
PI-12 Public asset management M2 C D C D+
PI-13 Debt management M2 B A A A
IV. Policy-based fiscal strategy and budgeting
PI-14 Macroeconomic and fiscal forecasting M2 B A B B+
PI-15 Fiscal Strategy M2 A A B A
PI-16 Medium-term perspective in expenditure budgeting M2 A D A B B
PI-17 Budget preparation process M2 A B A A
PI-18 Legislative scrutiny of budgets M1 A B A B B+
Pillar V. Predictability and control in budget execution
PI-19 Revenue administration M2 A A D D C+
PI-20 Accounting for revenues M1 A B A B+
PI-21 Predictability of in-year resource allocation M2 A B B A B+
PI-22 Expenditure arrears M1 A C C+
PI-23 Payroll controls M1 A A A B B+
PI-24 Procurement M2 A A C A B+
PI-25 Internal controls on nonsalary expenditure M2 A A B A
PI-26 Internal audit M1 A B C C C+
Pillar VI. Accounting and Reporting
PI-27 Financial data integrity M2 B NA A B B+
PI-28 In-year budget reports M1 A D C D+
PI-29 Annual financial reports M1 C A C C+
VII. External Scrutiny and Audit
PI-30 External audit M1 B C C D D+
PI-31 Legislative scrutiny of audit reports M2 C A B A B+

Rwanda PEFA Assessment, Upgraded Framework 2016
13
1 Introduction
1.1 Rationale and purpose
The overall objective of this PEFA assessment was to produce a comprehensive “PFM
Performance Report” (PFM-PR) prepared according to the ‘Upgraded’ PEFA
Performance Measurement Framework Methodology of February 2016 so as to provide
an analysis of the overall performance of the PFM systems of the country and to provide
a baseline against which future progress can be measured.
More specifically, the results of this assignment will provide the GoR and its Development
Partners with:
a) An assessment of the quality of PFM in the country in 2011/2012, 2012/2013 and
2013/20141, based on the PEFA methodology, including an assessment of the
relative strengths and weaknesses of the main budgetary outcomes: Aggregate
fiscal discipline, Strategic resource allocation and Efficient service delivery;
b) A basis for further analysis and dialogue on PFM reforms so as to inform future
updates to the PFM SSP and subsequent action plans, and also to inform the
monitoring and evaluation work of GoR, Development Partners and other
stakeholders.
1.2 Assessment management and quality assurance
The report was commissioned by GoR, and funded from a MDTF under the control of
GoR.
Box 1-1 Assessment management and quality assurance arrangements PEFA Assessment Management Organization
Oversight Team – Chair & Members: o Patrick Shyaka: Chair, Accountant General - MINECOFIN o Leif Jensen: Co, chair, Senior Public Sector Specialist - World Bank o Daniela Beckmann: Country Director - KFW o Eva Paul: Project Manager - KFW o Scott Caldwell: Senior Governance Advisor - DFID o Sam Waldock: Governance Advisor - DFID o Sion Morton: Attaché for Economy and Governance - EU Delegation o Amin Miramago: PFM Reforms Manager - MINECOFIN o Caleb Rwamuganza: Director General, National Budget Unit -
MINECOFIN o Godfrey Kabera: Director General, National Development Planning &
Research Unit - MINECOFIN o Leonard Rugwabiza: Chief Economist - MINECOFIN o Amina Rwakunda: Senior Economist - MINECOFIN o Octave Semwaga: Acting Coordinator, PITT - MINECOFIN o Richard Tushabe: Commissioner General - RRA o Agnes Kanyangeyo: Deputy Commissioner, Planning - RRA o Alexis Kamuhire: Chief Internal Auditor - MINECOFIN
1 The original ToR required coverage of the FYs 2011/11, 2011/2012 and 2012/13: however, it
was proposed in the Inception Report and agreed by GoR that it would be more useful to cover more recent years.

Rwanda PEFA Assessment, Upgraded Framework 2016
14
o Marcel Mukeshimana: Deputy Accountant General - MINECOFIN o Augustus Seminega: Director General - RPPA o Patrick Habimana: Deputy Auditor General - OAG o Jean de Dieu Rurangirwa: IFMIS Coordinator - MINECOFIN o Jonathan Nzayikorera: Coordinator of Fiscal Decentralisation Unit –
MINECOFIN o John MUNGA: CEO of ICPAR
Assessment Manager: Amin Miramago, PFM Reforms Manager MINECOFIN
Assessment Team Leader: Philip Sinnett. Team Members: Charles Hegbor, Charles Gasana and Francis Mugisha, all contracted to AECOM International Consultants, Spain.
PEFA Review team: Martin Bowen and Urska Zrinski.
Review of Concept Note and/or Terms of Reference
Date of reviewed draft concept note and/or terms of reference: 4-11-2014
Invited reviewers: Oversight Team
Reviewers who provided comments: [name and organization for each one, in particular the PEFA Secretariat and date(s) of its review(s) or as group e.g. the Oversight Team:
o Holy Tiana Rame: PEFA Secretariat (18-11-2014)
o Michel Champomier: PEFA Secretariat (18-11-2014)
o Lewis Hawke: Head, PEFA Secretariat (18-11-2014)
o Oversight Team (20-11-2014)
Date(s) of final concept note and/or terms of reference: 25-2-2015
Review of the Assessment Report
Date(s) of reviewed draft report(s): 11-11-2016
Invited reviewers: o Martin Bowen: PEFA Secretariat (12-2-2016) and (12-01-2017) o Oversight Team (9-3-2016)
1.3 Assessment Methodology
Coverage of the assessment
This assessment covered the central government of Rwanda, as per GFS 2014.
When performance is assessed
The fieldwork for the assessment took place in June and July 2015, and was updated in
November 2016 to meet the requirement of the ‘Upgraded’ PEFA Framework of February
2016: however, because the GoR financial year begins on 1 July, most of the indicators
were assessed using data from 2013/2014 and the two previous completed FYs.
Sources of information
The assessment is based on the review of various documents, listed in ANNEX 2, and
interviews with numerous government officials and other stakeholders, who are listed in
ANNEX 3.
Other methodological issues for the preparation of the report The assessment process required the:
review of legal and regulatory documentation, budget documentation and financial and
audit reports (see ANNEX 2 for documents consulted);

Rwanda PEFA Assessment, Upgraded Framework 2016
15
assessment of PFM practice procedures and systems
quantitative analysis of official financial and budgetary data; and,
the application of professional judgment.
An important consideration in the assessment is an appreciation of the quality,
comprehensiveness and accuracy of data that is used to determine the budget credibility
indicators. The reliability of the PEFA indicators can only be as good as the accuracy of
the financial data upon which they were assessed.
A one-day capacity building workshop was organised by the Assessment Team on 16
June for officials (also listed in ANNEX 3) before the data collection phase. The main
purpose of the workshop was to enable the officials to fully understand the methodology,
indicators and requirements of the PEFA assessment, as well as the method of
determining ratings and performance. It included exercises for participants to help them
understand the application of the PEFA methodology (using training material provided by
the PEFA Secretariat). The workshop also allowed the assessment team to obtain
information and knowledge regarding the functioning of financial management
arrangements, and to clarify the requirements in terms of stakeholders to be interviewed
and information to be obtained.

Rwanda PEFA Assessment, Upgraded Framework 2016
16
2 Country background Information
2.1 Country economic situation
2.1.1 Country context
The Rwandan economy is based on agriculture, which accounted for over a third of GDP
in 2014 and is the principal source of employment for nearly 80% of the labour force. The
country is one of the most densely populated in Africa, at 434 people per square
kilometre, with a total population exceeding 11 million. Virtually all the arable land is
under cultivation, although agricultural productivity is low and the majority of the
population are subsistence farmers. Hence the Government has recognized that the
country must transform from a subsistence agricultural economy to a knowledge-based
society, and its ‘Vision 2020’ lays out an agenda to make this shift. The goals are to
sustain 11.5% growth in GDP; reduce population growth from 2.6% to 2.2% per year in
order to reach an average per capita income of $1240 by 2020; and, reduce the poverty
rate below 30%. The current medium-term policy priorities and allocations are set out in
the second Economic Development and Poverty Reduction Strategy (EDPRS 2),
which covers the years 2013 to 2018.
The EDPRS 2 includes ambitious targets summarized in four thematic areas ranging from
accelerated growth to become a middle-income county; reducing poverty to less than
30% by June 2018; and creating 200,000 non-farm jobs per year, all consistent with the
long-term goals in Vision 2020. Despite the recent global economic downturn and the
reduction of development assistance in 2012, real GDP growth averaged 7.9% from 2005
through to 2014, and the share of GDP derived from the services sector, the most
important engine of Rwanda’s economy in the medium to long term according to Vision
2020, has risen slowly but steadily to 50% in 2014.
Rwanda has also made impressive efforts to reach the Millennium Development Goals
(MDGs): all but one (nutrition) have been achieved, a major accomplishment in the
aftermath of the 1994 genocide. Primary school enrolment rates are now 99%, the
gender equality target has already been met for both primary and secondary education,
together with other milestones; women's participation in parliament is over 50% (64% in
2013), the highest in the world. High-level political leadership has led to a reduction in
HIV prevalence rates from 13% in 2000 to 3% in 2010. Access to improved water
sources is high and MDG 7 (82%) is attainable by end of 2015. Overall, high economic
growth and progress on MDGs, have seen poverty rates reduce by 15.1%, from 60% in
2000 to 44.9 % in 2011.).
In recognition of GoR’s track record of high growth and generally prudent macro-
economic management, including the achievement of low fiscal and current account
deficits and the maintenance of a comfortable level of international reserves, the IMF
approved a Policy Support Instrument (PSI) in June 2010, followed by a second approval
in 2013, designed to address key vulnerabilities, including weaknesses in monetary and
exchange rate policies, which have at times led to high levels of inflation, low levels of
fiscal revenues and exports, and continued high aid dependence (see Table 2.1 below).
The PSI allows for up to $500 million (6.3% of 2014 GDP) in non-concessional external
borrowing for different complementary projects that comprise an investment strategy
aimed at alleviating critical infrastructure constraints to increasing and diversifying exports
of goods and services and developing the country into a knowledge-based service

Rwanda PEFA Assessment, Upgraded Framework 2016
17
economy. The Debt Sustainability Analysis elaborated during the third review of PSI,
suggests Rwanda’s moderate level of debt distress would remain sustainable even if the
non-concessional external borrowing were contracted, but its low export base means
vulnerabilities could increase under adverse shocks.
2.1.2 Key aspects of the government's economic and fiscal reforms
In 2013, the Government implemented Rwanda’s second and current Economic
Development Poverty Reduction Strategy (EDPRS 2), which provides a medium-term
framework for achieving the country’s long-term development aspirations as embodied in
Vision 2020, the seven year GoR program, and the MDGs. The strategy builds on strong
achievements in human capital development and is set out in four thematic areas:
Economic Transformation for accelerated economic growth striving for middle-
income country status (with targets of achieving annual 28.0 per cent exports growth
and 11.5 per cent GDP growth on average between 2013 and 2020).
Rural Development to address the needs of the vast majority of the population and
ensure sustainable poverty reduction (targeted to reduce poverty to less than 30.0
per cent by June 2018).
Productivity and Youth Employment to ensure that growth and rural development
are underpinned by appropriate skills and productive employment, especially the
growing cohort of youth (to increase productivity per worker and targeting the
creation of 200,000 non-farm jobs per year).
Accountable Governance to underpin improved service delivery and citizen
participation in the development process (to increase satisfactory service delivery
and citizen participation).
EDPRS 2 provides a roadmap for government, development partners, the private sector
and civil society, and indicates GoR’s policy priorities, the measures it needs to
implement them, their cost and source of financing. Unlike EDPRS 1, EDPRS 2 clearly
specifies indicators that are well aligned with the Budget cycle and can be monitored. In
addition, EDPRS 2 redefines the country’s priorities guided by the revised targets of the
Vision 2020 adopted in May 2012, which outlines clearly the objectives to be achieved as
a pre-requisite for rapid growth and poverty reduction.
The strategies in Vision 2020 have been converted into actions by a series of medium-
term strategic plans. GoR’s first systematic assessment was the Poverty Reduction
Strategy (PRSP) finalised in 2001, covered the period to 2006. This was followed by the
Economic Development and Poverty Reduction Strategy (EDPRS) for 2008-12, now
replaced by the current EDPRS 2.
The Public Financial Management Reform Strategy (2008-2012) elaborated the reforms
GoR intended to implement in its public financial management systems. This was
scheduled to end in December 2012 but was extended to June 2013 to coincide with the
completion of EDPRS 1, and to allow for the development of a new strategy that would
coincide with the EDPRS 2 timeframe (2013-2018).
The Reform Strategy takes a comprehensive approach, which deals with the key issues in
a structured and sequenced manner, to achieve the overall goal of ensuring efficient,
effective and accountable use of public resources as a basis for economic development
and poverty eradication through improved service delivery. This requires modernizing the
PFM infrastructure; the regulatory framework; policies and systems at both the central and
local government levels. The ultimate objective is to ensure that the GoR develops the
overall capacity to manage and regularly report on its own budget resources as well as

Rwanda PEFA Assessment, Upgraded Framework 2016
18
utilize, account and report on assistance provided by development partners in whatever
form.
The PFM process encompasses the whole range of activities including planning and
budgeting, resource mobilisation, budget execution and expenditure control, reporting
and accountability, audit and legislative oversight arrangements. These activities are
managed or implemented by line ministries, Districts, and are led by the Ministry of
Finance and Economic Planning (MINECOFIN), the OAG and ultimately, Parliament.
The Mid-Term Review and the End of Term Evaluation2 of the first PFM Reform confirmed
that there were significant achievements across various components. However,
challenges remained, as well as some emerging issues, including: inadequate and erratic
resources; effective implementation of IFMIS; weak PFM systems at the Sub-National
level; inadequate human resource capacity across all PFM disciplines; weaknesses in
economic planning and budgeting, in budget execution, accounting and reporting;
inadequate audit and legislative oversight and finally, challenges in the coordination and
management of PFM reforms. To overcome these challenges, a PFM sector strategic plan
for the next five years was developed. In this plan, sector priorities have been organised
into seven major Programmes, with a total of 23 Sub Programmes, representing the
identified priority areas for PFM Reform (see Section 5 of this report). In summary, these
areas are:
Economic Planning and Budgeting;
Resource Mobilisation
Budget Execution, Accounting and Reporting
External Oversight and Accountability
Electronic Service Delivery and IFMIS
Fiscal Decentralisation
PFM Sector Coordination and Management
Besides the above seven key elements, four priorities have emerged for urgent
consideration:
Increased resource mobilisation: domestic tax and non-tax revenue mobilisation to
ensure Rwanda becomes self-reliant in the medium to long term;
Scaling up of the implementation of IFMIS: extend to remaining government
agencies both at central and local government levels as well as initiate the process for
the use of a full-fledged IFMIS that has functionalities such as procurement, fixed
asset management, and inventory modules;
Strengthen PFM systems at sub-national level: integrate sub-national service
delivery units such as schools and primary healthcare institutions into IFMIS for
effective PFM systems in order to improve decentralised service delivery; joint staff
training for both district councils and local service delivery units will be delivered;
Enhance training, professionalization and capacity building across all PFM
disciplines: provide professional training to augment staff to ensure sustainability.
The World Bank is also providing support to the tune of USD100million for the Public
Sector Governance ‘Programme-for-Results’. The main objective of this programme is to
improve Rwanda's PFM and statistics systems for the enhancement of transparency and
accountability in the use of public funds, revenue mobilisation and the quality and
accessibility of development data for decision-making.
2 Independent Evaluation of the Implementation of the PFM Reform Strategy, 2008/12, ECORYS

Rwanda PEFA Assessment, Upgraded Framework 2016
19
2.1.3 Key economic indicators
Table 2.1: Selected economic indicators
2012 2013 2014 2015 2016
(proj)
Population (millions) 10.50 10.70 11.00 11.30 11.6 Annual change in Population (%) 2.6% 2.4% 2.4% 2.7% 2.3% Nominal GDP (RwF B) (FY) 4,128 4,681 5,137 5,580 6,148 Nominal GDP (RwF B)) (CY) 4,435 4,864 5,389 5,837 6,459 Nominal GDP ($m) (CY) 7,220 7,522 7,897 8,109 8,310 GDP per capita ($) 689 701 719 720 719 Real GDP growth (CY) 8.8% 4.7% 7.0% 6.9% 6.0% Gross investment as a % of GDP 26.0% 27.0% 26.0% 27.4% 31.1% National savings as a % of GDP 12.4% 15.6% 12.5% 12.2% 11.4% FDI as % of GDP 3.5 3.4 4.0 3.9 3.9
Trade balance (% of GDP) -17.6 -15.3 -16.0 -15.2 -19.0
Current account balance excl. official transfers (% of GDP)
-16.4 -14.9 -17.0 -18.1 -22.0
Current account deficit including official transfers (% of GDP)
-10.2 -7.4 -12.0 -13.5 -17.2
External debt (end period) % of GDP) 17.6 21.5 14.9 26.9 34.4
Consumer price inflation (annual ave rate %) 6.3 4.2 1.8 2.5 4.6
Consumer price inflation (end of period rate, %) 3.9 3.6 2.1 4.5 4.7
Exchange rate: annual average RwF = $1 614 647 683 720 777
Source: MINECOFIN (Annual Budget Execution Reports; Annual Economic Reports)
2.2 Fiscal and budgetary trends
2.2.1 Fiscal performance
Total revenue (including grants) was more or less constant as a proportion of GDP over
the period, although ‘own revenue’ is – as per agreed GoR policy – on an increasing
trend. Total expenditure is also increasing, most notably on capital account, which shows
a steady rise over the period.
Owing to the global economic downturn, the Government’s fiscal policy has recently
sought to stimulate demand. As a result, the fiscal deficit excluding grants widened to an
estimated 13.5% of GDP in FY 2013/14, though continued donor support reduced the
deficit to 4.3% of GDP: see table below:
Table 2.2: Aggregate Fiscal Data
Central government actuals (as a percent of GDP)
FY 2011/12 FY 2012/13 FY 2013/14
Total revenue 25.4 23.5 26.1
- Own revenue 14.3 15.7 16.8
- Grants 11.1 7.8 9.2
Total expenditure 26.6 28.5 30.0
- Non-interest expenditure 26.2 27.9 29.2
- Interest expenditure 0.4 0.7 0.8
- Capital expenditure 11.7 12.1 13.9
- Net lending 0.0 2.9 1.0
Aggregate deficit (incl. grants) -1.5 -5.2 -4.3
Overall deficit -1.2 -5.0 -4.0
Primary deficit -5.7 -2.3 -3.7
Net financing 1.4 5.2 4.3
- external 2.3 7.2 2.0
- domestic -0.9 -2.0 2.2
Source: MINECOFIN (Annual Budget Execution Reports; Annual Economic Reports for each
year)

Rwanda PEFA Assessment, Upgraded Framework 2016
20
2.2.2 Allocation of resources
Tables 2.3 and 2.4 below indicate government resource allocation over the three-year
period ending June 2014. General public service, economic affairs and education
continue to receive the largest proportion of government resources, with an average of
28.4%, 24.3% and 17.4% respectively. Government resource allocation to current
expenditure averages around 51.3%, whiles capital expenditure averaged around 44.2%.
Transfers and subsidies receive an average allocation of 18.8%, followed by wages and
salaries - 12.67% and then goods and services - 10.67%
Table 2.3: Budget Allocations by Functions (in RwF m)
Actual budgetary allocations by sector (as a percentage of total expenditure)
FY 2011/12 FY 2012/13 FY 2013/14
1. General public services 22.1% 28.6% 34.4%
2. Defence 10.0% 9.3% 4.6%
3. Public order and safety 6.3% 5.7% 5.4%
4. Economic affairs 25.8% 24.7% 22.5%
5. Environmental protection 1.1% 1.5% 0.9%
6. Housing and community amenities 4.4% 2.0% 2.9%
7. Health 6.9% 7.0% 6.6%
8. Recreation, culture, and religion 1.1% 0.9% 1.2%
9. Education 18.2% 16.7% 17.2%
10. Social protection 4.0% 3.5% 4.4%
11. Other
Total 100.0 100.0 100.0
Source: MINECOFIN (Annual Budget Execution Reports; Annual Economic Reports)
Note: total expenditure excludes items financed by capital grants and loans
Table 2.4: Budget allocations by economic classification
Actual budgetary allocations by economic classification (as a % of total exp)
FY 2011/12 FY 2012/13 FY 2013/14
Current expenditure 55.9% 47.5% 50.6%
- wages and salaries 13.2% 12.6% 12.2%
- goods and services 13.6% 9.2% 9.2%
- interest payments 1.7% 2.3% 2.8%
- transfers 20.5% 17.3% 18.6%
- others 6.9% 6.0% 7.7%
Capital expenditure 44.0% 42.3% 46.2%
Source: MINECOFIN (Annual Budget Execution Reports; Annual Economic Reports)
2.3 Legal and regulatory arrangements for PFM
The Constitution (2003)
The Chamber of Deputies (the lower House of Parliament) is required to receive and
debate the annual finance bill before it becomes law, with the concurrence of the Senate
(the upper House). Parliament must also approve external borrowings (subject to the limit
it sets) and grants. The Chamber of Deputies is entitled to receive, direct from the Office
of the Auditor-General, audit reports, audited budget execution reports and financial
statements, to provide oversight of the executive.
The Organic Law on State Finances and Property (OBL), 2013
The revised Organic Law on State Finances and Property (Organic Law No12/2013)
regulates the implementation of budgets of central and local governments and other
public entities that receive funding from the national budget. The law specifies the
principal responsibilities of those involved in preparing and implementing central and
local governments budget, and the management of State Finances.

Rwanda PEFA Assessment, Upgraded Framework 2016
21
In terms of the OBL, the Cabinet plays a role in the preparation of the national budget
before it is formally tabled before the Chamber of Deputies. Cabinet must approve
government’s broad strategic objectives and priorities for budgetary policies for the next
fiscal year and for the next two successive years; approve the Medium Term Expenditure
Framework (MTEF), and annual budget estimates, especially targets for aggregate
revenues, aggregate expenditures, fiscal balance and part of public debt the state is
obliged to pay; approve the annual finance bill prepared by the Minister responsible for
state finance; and determine the amount of money in the budget for SN governments.
The Executive is also responsible for budget execution once the bills have become
finance laws.
The OBL makes the Minister for state finances responsible for all aspects of budget
planning and implementation, and is to keep Parliament informed of macroeconomic and
budgetary developments. To fulfil this role, the Minister has wide ranging powers.
A Chief Budget Manager is the accounting officer of a budget agency, and is responsible
for preparing the annual budget and the medium-term budget framework; to exercise
control over the execution of the budget agency; and prepare for the Permanent
Secretary of the ministry all budget execution reports and related statements.
The Consolidated Funds (one for Central Government and one for each sub-national
government). All revenues and other public monies, earmarked revenues, external loans
and grants received are to be paid into the CF, and withdrawals made on the written
permission of the Minister responsible for state finances (or, in the case of a SNG, the
written permission of the Chairperson of the Executive Committee).
Ministerial Order on the OBL (Financial Regulations). The Ministerial Order (financial
regulations to the Organic Law) includes the accounting standards in the central
Government, local administrative entities, other public enterprises and extra budgetary
funds, and states that “public entities shall follow the “Modified Cash Basis of
Accounting”, except those Public Enterprises which are required to adopt accrual basis of
accounting. The financial statements are also to comply with the International Public
Sector Standards to the extent possible.
The Office of the Auditor-General
OAG is the Supreme Audit Institution and was established in 1998 under Law 04/98. The
Constitution requires the OAG to: a) report to the Chamber of Deputies on the
implementation of the state budget of the previous year. This report must indicate the
manner in which the budget was utilized, unnecessary expenses which were incurred or
expenses which were incurred contrary to the law and whether there was
misappropriation or general squandering of public funds – an audit of budget execution
reports; b) submit a copy of the report to the President of the Republic, Cabinet,
President of the Supreme Court and the Prosecutor General of the Republic; and c) carry
out a financial audit of any institution of the State or with regard to the use of funds
provided by the State as may be required by Chamber of Deputies from time to time.
Law on Public Procurement
The Rwanda Public Procurement Authority (RPPA) was established under law no.
63/2007 of 30/12/2007 and replaced the National Tender Board (NTB – previously set up
under Ministerial Order no. 91/03 of 31/12/2002). The legal framework was amended
under law no. 05/2013 of 13/02/2013 and a new Ministerial Order N° 001/14/10/TC of
19/02/2014. RPPA is responsible for establishing procurement standards, procedures,
and guidelines to ensure transparent, effective and efficient public procurements, as the
function has been decentralized to public entities. This regulatory and oversight mandate

Rwanda PEFA Assessment, Upgraded Framework 2016
22
is exercised though an ‘Independent Review Panel’. RPPA is expected to pilot initiatives
such as an Electronic Procurement System in FY 2016/2017 as part of further reforms to
deepen transparency; competition; economy; efficiency; fairness; and accountability in
public procurement.
The internal control framework
Control environment
The PFM control environment assigns rights and responsibilities for actors in the
PFM system. The ultimate responsibility lies with Chief Budget Managers (CBMs)
who sign off the use of resources. The sign-off for any transaction is secured with an
authorized signature. The roles and responsibilities are prescribed under the OBL,
the Ministerial Instructions (MI) and Ministerial Orders (MO), as well as in PFM
procedure manuals. MO no. 002/09/10/A of 12/02/2009 sets the regulations for
internal control and internal audit for public entities. Under article 3, PEs are required
to establish and implement a system of internal control to secure risks to the entity
and to detect or prevent irregularities. This is to ensure that use of public resources
meets the key principles of economy, efficiency and effectiveness – towards
achieving the PE mission. The control environment has two components (article 4):
ex-ante administrative and financial management control designed to prevent
occurrence of inappropriate decisions; and the ex-post controls that confirm or detect
the inappropriate decisions for corrective action. CBMs are responsible for ensuring
that the control environment is ‘fit-for-purpose’ and effective. All CBMs and their staff
have access to the PFM control tools, namely, the OBL, the MI, the MO, and the
PFM procedure manuals. The accountability cycle is completed by the role played by
the entity’s Audit Committee: ensuring oversight and the timely implementation of
corrective actions in response to audit findings that will strengthen the control
environment.
Risk assessment
Risk assessment is a key aspect of the PFM system as it seeks to secure appropriate
utilization of public resources. It is used to secure the control environment ex-ante
when CBMs identify and mitigate future risks in the PFM environment; or ex-post to
detect and correct inappropriate decisions through routine or risk-based audits. The
Internal Audit Function in PEs is required to follow a ‘risk-based’ approach in line with
‘International Professional Practices Framework – IPPF’, standards issued by the
Institute of Internal Auditors. This, at a minimum, requires multi-year audit plans and
a risk-based approach. Risk-based annual audit plans are approved by the entity’s
Audit Committees (and copied to the CIA), and are designed to progressively secure
key risks in the control environment in a timely manner.
Control activities
Control activities are prescribed in the roles and responsibilities of stakeholders
involved in transacting with public resources in order to meet the objectives of the
entity. They are outlined in the applicable procedure manuals that specify the
recording, accounting and reporting of transactions, and lay down key rules, including
the routine segregation of duties, a multi-layer authorizing environment and corrective
measures when control activities fail.
Information and communication
Any control environment is weakened by a lack of timely information for decision-
making. Control activities are useless if not understood; if key changes are not
communicated in time; if stakeholders are not empowered with sufficient skills that
are updated to respond to a changing control environment. The reporting system
prescribed in various laws and regulations are designed to ensure sufficient

Rwanda PEFA Assessment, Upgraded Framework 2016
23
knowledge and understanding of risks at each PFM System node point for timely
actions. Public Entities are required to report monthly, quarterly and annually to their
Audit Committees (copied to the CIA) on the effectiveness of the control environment.
The CIA consolidates individual Internal Audit reports into a report to the Minister,
which identifies key cross cutting issues and highlights areas requiring action.
Monitoring
CBMs are responsible for monitoring the control environment to ensure it remains
effective against key risks. The Internal Auditor in a public entity is responsible to
detect and recommend corrective actions through internal audit reports to the Audit
Committee, copied to both the CBM and the GCIA. Audit recommendations (whether
ex-ante or ex-post) are only effective if implemented. Both Internal Audit (through the
GCIA) and the OAG routinely report on the degree to which audit recommendations
are being implemented in an entity: if recommendations are not sufficiently
implemented, the GCIA can act through the Minister on key cross cutting issues or
through the entity’s Internal Auditor. Also, the Parliamentary Public Accounts
Committee holds public hearings to ensure that CBMs implement agreed
recommendations.
2.4 Institutional arrangements for PFM
At the central government level, there are 24 Ministries, 19 Government Business
Enterprises (of which 16 are wholly-owned) and more than 80 EBUs. The country is
divided into four geographical Provinces and the City of Kigali, which are deconcentrated
(administrative) arms of the Central Government, and 30 Districts with elected councils.
Beneath the Districts there are ‘sectors’, which are linked to national departments on a
functional basis, but staff are accountable to the District’s Executive Secretary.
Table 2.5: Structure of the public sector: (number of entities & turnover, RwF m)
Year: 2015/16 Public Sector
Government Sub-Sector
Social Security Funds
Public Corporation Sub-Sector
Budgetary Unit
Extra budgetary
Units
Non-Financial Public
Corporations
Financial Public
Corporations
Central 110 80 2 15 5 1st tier SNGs Districts
31
Lower tier(s) of SNGs
4,475
Source: MINECOFIN
Table 2.6: Financial structure of central government – budget estimates (RwF m)
Year: 2014/15 Budgetary and
Extra Units
Social Security Fund
Total Aggregated 2/
Revenue 1,808,812,969,876 427,614,450,190 2,236,427,420,066
Expenditure 1,496,641,676,008 403,552,490,785 1,900,194,166,793
Transfers to (-) and from (+) other units of general gov’t
-312,171,293,868
Source: MINECOFIN

Rwanda PEFA Assessment, Upgraded Framework 2016
24
Table 2.7: Financial structure of central government – actual expenditure (RwF m)
Year: 2014/15 Budgetary and
Extra Units
Social Security Fund
Total Aggregated 2/
Revenue 1,737,240,245,461 42,042,538,541 1,779,282,784,002
Expenditure 1,826,772,990,826 13,342,336,667 1,840,115,327,493
Transfers to (-) and from (+) other units of general gov’t
Liabilities 191,338,699,670 13,197,743,288 204,536,442,958
Financial Assets 191,396,315,247 249,766,686,783 441,163,002,030
Non-financial assets 467,754,050,065 467,754,050,065
Source: MINECOFIN
Parliament
The Constitution (2003) established a bi-cameral parliament to perform legislative,
oversight, and representative functions. There are 53 elected members of the Chamber
of Deputies (the Lower House), who serve for a five-year term (by proportional
representation), 24 of who are female, elected by provincial councils; two representatives
are elected by the National Youth Council; and one by the Federation of the Associations
of the Disabled.
The Senate comprises 26 members who are elected or appointed for an eight-year term:
12 are elected by provincial and sectoral councils; eight are appointed by the President;
four are appointed by the forum of political formations, and two are elected by the staff of
the universities. Senate is vested with the authority to: elect the President, Vice-
President and judges of the Supreme Court, the Prosecutor General and Deputy;
approve appointments of Chairpersons, members of National Commissions, the
Ombudsman, the Auditor General of State Finances, Ambassadors and representatives
to international organizations etc.; and approve other public officers if so required by an
Organic Law.
The Chamber of Deputies is responsible for receiving and debating annual finance bills
before they become law, with the concurrence of the Senate, and also for approving
external borrowings by the central government as well as setting limits or ceilings of such
borrowings (which are contracted by the Minister on behalf of the government): this also
applies to grants. To complete the accountability cycle, the Chamber of Deputies is
entitled to receive, direct from the OAG, audit reports and audited budget execution
reports and financial statements, to review and provide oversight of the executive.
The Judiciary
The Constitution establishes the Supreme Court (the highest court and the guarantor of
judicial independence), the High Court, Provincial, District Municipality and Town courts,
and also specialized Gacaca courts and Military courts). Additionally, the Supreme Court
is responsible for ruling on the constitutionality of organic laws and laws establishing the
internal regulations of each Chamber of Parliament before they are promulgated.
Executive
The President is head of state, and is elected for a seven-year term by universal suffrage.
The President appoints the Prime Minister and the Cabinet (who are precluded from
being members of Parliament), with the approval of the Senate. There is a multi-party
system and the Prime Minister is the head of government.

Rwanda PEFA Assessment, Upgraded Framework 2016
25
The Cabinet is constitutionally accountable to both the President and Parliament, and is
required by Article 12 of the Constitution to approve the Budget Framework Paper before
it is tabled in the Chamber of Deputies. Cabinet must also approve:
the Medium Term Expenditure Framework, fiscal balance and that part of public debt
the state is obliged to pay;
the annual finance bill;
the formula for allocating grants to the sub-national units;
consolidated quarterly budget execution report prepared by the Minister;
the report of the State Finances of the year preceding the consolidated budget;
the budget execution report prepared by the Minister.
2.5 Other important features of PFM and its operating environment
The Rwanda PFM System has a clear legal framework which is implemented across PFM
institutions, led by MINECOFIN. It is fully aligned with the development agenda as a
‘foundational and cross cutting’ issue under the EDPRS 2 four thematic areas. It is
implemented through Chief Budget Managers across public entities. A key difference
between the two PFM Reform Strategies (outlined in 2.1. above) is that, while PFMRS
covered the entire PFM cycle (planning and budgeting, budget execution, accounting and
reporting, audit, and parliamentary oversight); the PFM SSP includes cross cutting issues
such as electronic service delivery and IFMS, fiscal decentralization and PFM sector
coordination. It also highlights new areas of emphasis for the next wave of reform such
as resource mobilization, a responsive IFMIS, linkages between planning and reports, a
strengthened Internal Audit function; fiscal risk management in Public Enterprises as well
as legislative oversight. The degree of reliance on the IFMIS is currently very high and is
expected to increase as well as the sophistication of reporting needs. A successful
implementation of the Subsidiary Entities Accounting and Reporting System to the sub-
entities below the Districts as well as further strengthening of the IPPS will complete a
key architecture for the Rwanda PFM System.
Under EDPRS 2, the PFM SSP is coordinated under the ‘Sector Working Group (SWG)’
co-chaired by the PS/ST and a representative of the Development Partners – clearly a
key function, given the country’s heavy reliance on external support. Details of these
arrangements are set out in Chapter 5. The ‘PFM SSP Action Plan’ is regularly
monitored, as can be seen in the table below:
Table 2.8: Schedule for Monitoring the PFM SSP
Monitoring Report 2014 2015 2016 2017 2018
PEFA Review
Mid Term Review
End Term Assessment
Annual Joint Sector Reviews
Source: PFM SSP (2013 – 2018)

Rwanda PEFA Assessment, Upgraded Framework 2016
26
3 Assessment of PFM Performance
Pillar I. Budget reliability
PI-1 Aggregate expenditure outturn
The total expenditure variation over the period examined was less than 10% in one year
(9.8% in 2011/2012; 12.1% in 2012/2013; and 10.9% in 2013/2014), as reported in Table
3.1 below (the calculations upon which the Table is based are reported in ANNEX 4).
Table 3.1: Comparison of Budget estimates to Actuals (primary expenditure, RwF)
2011/12 2012/13 2013/14
Primary original expenditure 681.6 788.5 1037.2
Primary outturn 748.7 884.2 1149.8
Aggregate expenditure deviation 67.1 95.7 112.6
Aggregate expenditure deviation (%) 9.8% 12.1% 10.9%
Source: MINECOFIN
PI-1 Dimension Score Justification
Aggregate expenditure out-turn C Scoring Method M1
1.1 Aggregate expenditure out-turn C Aggregate expenditure outturn was between 85% and 115% of the approved aggregate expenditure in two of the last three years: (109.8% in 2011/2012; 112.1% in 2012/2013; and 110.9% in 2013/2014)
Ongoing reforms
Improving the planning processes through coordination and intersectoral consultations:
The disconnection between budget agencies’ action plans and budgets has been a key
factor behind the deviations between expenditure outturns and budgets. This is
manifested in the inadequate project consultations; weak feasibility planning and
inadequate follow up mechanisms that weaken the multi-year MTEF process. Key
reforms include:
Improved planning consultations: The process to determine bankable projects that
merit funding has been enhanced with strong multi-sectoral consultations on plans,
priorities and key linkages. The key outcome is that only agreed priorities inform the
resource allocations during the budgeting process – ensuring that resources are
allocated to activities and projects that are ready for implementation. They also help
to have a clear linkage between agencies ‘plans and budgets.
The role of the Public Investment Committee (PIC) in scrutinizing the public projects:
The PIC ensures that investment decisions are underpinned by appropriate feasibility
studies. This strengthens cost estimation and execution – improving the linkages
between action plans, funding decisions and budget execution. This will also
contribute towards lesser deviation between expenditures outturns and the budgets
in the medium term.

Rwanda PEFA Assessment, Upgraded Framework 2016
27
PI-2 Expenditure composition outturn
Where the composition of actual expenditure varies considerably from the original
budget, the budget is unlikely to be a useful statement of policy intent. PI-2 is a tighter
measure of budget discipline, as it measures how well a government can forecast
expenditure at the MDA (vote) level. The indicator considers the variation between the
budgeted and actual distribution of expenditure, and measures whether the budget is a
credible statement of policy intent.
2.1 Expenditure composition outturn by function
This dimension measures whether policy priorities are implemented as approved,
capturing the extent to which budget reallocations between budget heads contribute to
variance in expenditure composition (excluding contingency and interest expenditure).
Variance in expenditure composition by program, administrative or functional
classification was less than 15% in two of the last 3 Years (Yr1 11.5%; Yr2 26.1%; and
Yr3 10.1%)
Dimension rating = C
2.2 Expenditure composition outturn by economic type
The dimension measures the extent to which reallocations between budget items by
economic classification, contributes to the variance in expenditure composition (including
interest expenditure). Variance in expenditure composition by economic classification
was less than 10% in at least two of the last three Years (4.6% in 2011/12; 10.6% in
2012/13; and 6% in 2013/14).
Dimension rating = B
2.3 Expenditure from contingency reserves
The dimension recognizes the need for a contingency toward unforeseen events but it
should not be so large to undermine the credibility of the budget. Actual expenditure
charged to the contingency vote was on average more than 6% but less than 10% of the
original budget (FY2011/12; 9.3%; FY2012/13; 8.5%; FY2013/14; 10.4% or an average of
9.3%).
Dimension rating = C
Table 3.2: Consolidated Fund expenditure composition variance of (%)
2011/12 2012/13 2013/14
Total expenditure variation i.e. PI-1 9.8% 12.1% 10.9%
Composition variance by function i.e. PI-2(i) 11.5% 26.1% 10.1%
Composition variance by economic type i.e. PI-2(ii) 4.6% 10.6% 6.0%
Contingency share of budget i.e. PI-2(iii) 9.3% 8.5% 10.4%
Average contingency share 9.4%
Source: MINECOFIN
PI-2 Dimension Score Justification
Expenditure composition
outturn
C+ Scoring Method M1
2.1 Expenditure composition outturn by function
C Variance in expenditure composition by program, administrative or functional classification was less than 15% in two of last 3 Years (Yr1 11.5%; Yr2 26.1%; and Yr3 10.1%)
2.2 Expenditure composition outturn by economic type
B Variance in expenditure composition by economic classification was less than 10% in two of the last three years (4.6% in 2011/12; 10.6% in 2012/13; and 6% in 2013/14)

Rwanda PEFA Assessment, Upgraded Framework 2016
28
PI-2 Dimension Score Justification 2.3 Expenditure from
contingency reserves C Actual expenditure charged to the contingency
vote was on average 9.4% over the 3 FYs.
Ongoing reforms: are highlighted above under PI-1.
PI-3 Revenue outturn
3.1 Aggregate revenue outturn
Revenue is recognized at the point of collection. The main sources of domestic revenue
collected include income tax, value added tax, excise duty, and import duty. A
comparison of actual receipts against the original budgeted figures indicates that, in
aggregate, revenue collection has exceeded budgeted figures in two of the last three
years (107.7% in 2011/2012; and 101.7% in 2013/2014). The variance remained within
the threshold range of 94% and 112% in these two years but dipped to 90.2% in
2012/2013 as a result of a sharp reduction in grants. The calculations come from the
figures in Table 3.3, which are detailed in Annex 4.
Table 3.3: Comparison of Budgeted & Actual Revenue (domestic revenue, RwF B)
2011/12 2012/13 2013/14
Revenue Type Bud Outt’n % Bud Outt’n % Bud Outt’n %
Total Domestic
Revenue
529.3 591.7 111.1 724.4 736.4 101.7 843.4 862.0 102.2
Tax Revenue 501.4 557.0 111.1 641.2 651.9 101.7 775.4 761.0 98.1
Non-Tax Revenue 27.9 34.7 124.4 83.2 84.5 101.6 68.0 101.0 148.5
Total Grants 444.6 457.3 102.9 496.0 364.9 73.6 470.7 474.3 100.8
Capital Grants 184.3 191.6 104.0 243.9 174.9 71.7 300.0 303.3 101.1
Budg’ary Grants 250.3 265.7 102.1 252.1 190.0 75.4 170.7 171.0 100.2
Total Revenue &
Grants
973.9 1,049.0 107.4 1,220.4 1,101.3 90.2 1,314.1 1,336.3 101.7
Source: MINECOFIN
Dimension rating = B
3.2 Revenue composition outturn
Revenue composition was significantly affected in FY 2012/2013 as a result of reductions
and delays in development partners’ disbursements, despite a modest increase in
domestic revenues. There was a decline in tax revenue of 1.9% during FY 2013/2014,
due to the lagged tax reform impact on a host of revenue administration measures that
included introducing electronic billing machines (EBM). The variance in revenue
composition was 4.0% in 2011/12; 15.0% in 2012/13; and 4.8% in 2013/14 (cf: Annex 4)
Dimension rating = A
PI-3 Dimension Score Justification
Revenue outturn B+ Scoring Method M2
3.1 Aggregate revenue outturn B Actual Revenue was between 94% and 112% in two of the last three years (107.4% in 2011/2012; 90.2% in 2012/2013; and 101.7% in 2013/2014)
3.2 Revenue composition outturn
A Variance in revenue composition was less than 5% in two of the last three years (4.0% in 2011/12; 15.0% in 2012/13; and 4.8% in 2013/14)
Ongoing reforms: None.

Rwanda PEFA Assessment, Upgraded Framework 2016
29
Pillar II. Transparency of public finances
PI-4 Budget classification
4.1 Budget and accounts classification is consistent with international standards
An updated Chart of Accounts was brought into operation in May 2011, which provides
for programmatic, economic and functional classifications for the budget, and also
identifies sources of funding. This satisfies the requirements of the Organic Budget Law
12/2103, and is in line with the IMF GFSM 1986. The annual Budget Law used these
classifications from FY 2013/2014, and the final budget execution report for FY
2013/2014 presented the information on actual expenditures in this format.
PI-4 Dimension Score Justification
Budget classification A Scoring Method M1 4.1 Budget classification A The classification system is consistent with
GFS/COFOG standards.
Ongoing reforms
Budget documentation for 2015/2016 has been produced using GFS 2014.
PI-5 Budget documentation
5.1 The comprehensiveness of the information provided in the annual budget documentation
is measured against a list of ‘basic’ and ‘additional items
The table below summarises the main elements of the budget and their availability in the
budget documentation as quoted in the documents reviewed in Annex 3C.
Table 3.4: Budget documentation benchmarks
No. Budget documentation benchmarks Availability
Basic elements 1. Forecast of the fiscal deficit or surplus or accrual operating result. Yes
2. Previous year’s budget outturn, presented in same format as budget proposal. Yes
3. Current fiscal year’s budget presented in the same format as the budget proposal. This can be either the revised budget or the estimated outturn.
Yes
4. Aggregated budget data for both revenue and expenditure according to the main heads of the classifications used, including data for the current and previous year with a detailed breakdown of revenue and expenditure estimates (Budget classification is covered in PI-4.)
Yes
Additional elements
5. Deficit financing, describing its anticipated composition. Yes
6. Macro-economic assumptions, including at least estimates of GDP growth, inflation, interest rates, and the exchange rate.
Yes
7. Debt stock, including details at least for the beginning of the current year presented in accordance with GFS or other comparable standard.
No
8. Financial assets, including details at least for the beginning of the current fiscal year presented in accordance with GFS or other comparable standard.
Yes
9. Summary information of fiscal risks, including contingent liabilities such as guarantees, and contingent obligations embedded in structure financing instruments such as public-private partnership (PPP) contracts, and so on.
No
10. Explanation of budget implications of new policy initiatives and major new public investments, with estimates of the budgetary impact of all major revenue policy changes and/or major changes to expenditure programs.
Yes
11. Documentation on the medium-term fiscal forecasts. Yes
12. Quantification of tax expenditures. No

Rwanda PEFA Assessment, Upgraded Framework 2016
30
PI-5 Dimension Score Justification (M2)
Budget documentation B Scoring Method M1
5.1 Budget documentation B Budget documentation fulfils nine elements, including all four basic elements.
Ongoing reforms: None.
PI-6 Central government operations outside financial reports
Article 7 of Act 12 of 2103 requires that “all revenues, including grants and loans and all
expenditures shall be included in the budget of the concerned public entity”, and Article
65 specifies that “All public entities shall prepare and submit their quarterly budget
execution reports to the Minister. Public institutions shall submit their quarterly budget
execution reports after approval by the relevant competent authority. On a quarterly
basis, the Minister shall prepare and submit a consolidated budget execution report to
Cabinet”.
Table 3.5: Breakdown of Identified EBOs Nature of EBO Estimated
amount/range of EBO (as share of BCG total
spending)
How covered in fiscal reports
EBOs: The 80 EBOs are included in the Consolidated Annual Financial Statement.
All included in the Consolidated Annual Financial Statements
Autonomous special funds: The Rwanda Social Security Board (RSSB) is a financial institution, supervised by the National Bank of Rwanda.
Bulk of income is from GoR in respect of its employees: deducting this amount leaves equivalent of less than 1% of GoR budget as ‘off budget’.
Not covered in fiscal reports.
Externally Financed Projects: The Development Assistance Database lists 936 such projects.
Total value is RwF 9,057m, of which RwF 8,449 has been disbursed.
Some projects are direct to Districts, and hence are not in CG fiscal reports.
6.1 Expenditure outside financial reports
All entities which are controlled and mainly financed by GoR appear on the national
budget and are included in the relevant fiscal reports as part of the standard reporting
processes by the MDA concerned. (The former Rwanda Social Security Fund was
merged with the Rwanda Health Insurance Fund (RAMA) by law 45/2010 to form the
Rwanda Social Security Board (RSSB) which, as a financial institution is supervised by
the National Bank of Rwanda. GoR contributions to the fund – set at 5% of salaries –
appear as expenditure in MDA budgets: subtracting this amount from the Fund’s income
would leave less than 1% of budgeted government expenditure that is unreported.)
Dimension rating = A

Rwanda PEFA Assessment, Upgraded Framework 2016
31
6.2 Revenue outside financial reports
As noted in the table above, the Development Assistance Database lists 936 Externally
Financed Projects, many of which are direct to Districts: however, the Annual Financial
Report produced by MINECOFIN lists amounts received for current projects.
Fees and charges paid by citizens when receiving GoR services are reported by line
ministries. Also, as noted above (in 6.1), income to the Rwanda Social Security Board
from GoR contributions is reported.
Dimension rating = A
6.3 Financial reports of extrabudgetary units
The Consolidated Annual Financial Statement for FY 2013/2014 produced by
MINECOFIN within six months of the end of the year includes the finances of all MDAs
and more than 80 extrabudgetary units (although not all EBOs have the same year-end
as GoR). Thus the requirement of Article 67 of the Organic Law No12/2013 on State
Finances and Property that extrabudgetary units submit annual accounts to the line
ministry with which they are associated is satisfied – thus allowing detailed information to
be reported.
Dimension rating = B
PI-6 Dimension Score Justification
Central government operations
outside financial reports
A Scoring Method M2
6.1 Expenditure outside financial reports
A All entities which are controlled and mainly financed by GoR are on budget and included in fiscal reports, and the RSSB accounts for less than 1% of GoR budgeted exp.
6.2 Revenue outside financial reports
A The Annual Financial Report produced by MINECOFIN is comprehensive and includes amounts received from donors for current projects.
6.3 Financial reports of extra-budgetary units
B The Consolidated Annual Financial Statement for FY 2013/2014 produced by MINECOFIN in September includes the finances of most extrabudgetary units.
Ongoing reforms: None.
PI-7 Transfers to subnational governments
7.1 System for allocating transfers
Beneath the central government in Rwanda there are 30 District Councils, plus the City of
Kigali. Each Council has an elected mayor, and is responsible for delivering services
(such as Family Promotion and Child Protection; Infrastructure, Land, Housing and Town
Planning; Economic Development and Employment Promotion) to its citizens. The total
resources available to Districts over the MTEF is shown in the table below:
Table 3.6: Resources available to District Councils
2015/16 2016/17 2017/18
Block Grant 47,423 43,801 46,460
Earmarked grants 259,402 262,793 272,269
Own revenues 38,103 63,185 68,686
Transfers from other GoR agencies 18,856 18,264 17,173
Donor Funds 13,783 43,710 43,704
Total 377,569 431,753 448,292
Rwanda PEFA Assessment, Upgraded Framework 2016
32
Source: MINECOFIN
As can be seen, the majority of resources come from the Central Government, which
uses three mechanisms to shared resources with and between the Districts:
a block grant, designed to meet wage and some operational costs;
earmarked grants to support the delivery of specific public services; and
development funds from the Local Administrative Entities Development Authority
(LODA).
Each is considered in turn in the sections below.
Block grant
The quantum of the Block Grant is fixed by law as a minimum of 5% of the previous
year’s (central Government) domestic revenue, and this is respected. A simple
formula is used to distribute this amount to the 27 Districts (the City of Kigali does
not receive a share) which is: 50% based on the number of ‘Sectors’ (as a proxy for
the wage bill, area population and service delivery costs); 30% based on poverty
(using data from National Institute of Statistics); and, 20% on population.
Earmarked grants
These are determined by and operate through the budget process of the line
ministry responsible for the function. The Fiscal and Financial Decentralization
Policy and the Fiscal Decentralization Strategy state that earmarked funds are to be
distributed among Districts using objective formulae approved by ministerial decree.
In the last completed FY 2014/2015, all allocations were all made in accordance with
published formulae.
Local investment projects financing
The Local Administrative Entities Development Agency (LODA) was established by
Law 62/2013 and is supervised by the Ministry of Local Government (MINALOC).
LODA assumed all the responsibilities formerly assigned to the Rwanda Local
Development Support Fund, as well as those of the Common Development Fund
(established in 2002 under Law 20/2002, to support development in Districts), and is
funded primarily from the Government budget via an amount equivalent to 10% of
the previous year’s domestic revenue collection: this is supplemented by funds
provided by the donor community.
LODA focuses on Local Economic & Community Development, Social Protection,
and capacity building of local administrative entities, and monitors and evaluate
the implementation of development programs in Districts.
Funds are allocated to Districts via transparent formulae. For example, for funds for
decentralized development projects use:- Population size, 40% (based on National
Census and Habitat data 2012); Area: 20%; and, Poverty level: 40% (based on
EICV2010/2011 data).
In summary, the horizontal allocation of all transfers from central government to Districts
(over 90% by value) is determined by transparent and rules based systems.
Dimension rating = A
7.2 Timeliness of information on transfers
Following the first Budget Call Circular, consultative meetings between central and local
government take place during October, coordinated by MINALOC/LODA in three clusters
(Economic, Social and Governance), and Districts are continuously updating their
Development Plans.

Rwanda PEFA Assessment, Upgraded Framework 2016
33
By November, first draft District plans (PPDs and PIP forms) are submitted to the joint
planning team of MINALOC and MINECOFIN for quality assurance through LODA, which
then provides feedback.
The second annual Budget Call Circular issued in January (as noted in Annex 5)
provides Districts with their allocations for the following FY, allowing adequate time to
develop well-considered budgets. Although changes will occur as the available resource
envelope is refined (for example in February following budget consultation
recommendations, then in March when the final draft of Imihigo is produced), they are not
major and will only require slight adjustments to District budgets.
Dimension rating = A
PI-7 Dimension Score Justification
Transfers to subnational
governments A Scoring Method M2
7.1 System for allocating transfers
A Over 90% transfers from central government to Districts are determined by transparent and rules based systems.
7.2 Timeliness of information on transfers
A Districts receive their allocations in the second BCC, and while these may be amended, firm figures are available by the end of March, thus allowing adequate time for well-considered budgets to be developed.
Ongoing reforms: None.
PI-8 Performance information for service delivery
This indicator assesses the quality of the annual performance information at different
stages of the budget cycle (especially in the executive’s budget proposal or its supporting
documentation, in the year-end report, and in audit reports or performance evaluation
reports). It also looks at annual information on public service delivery, and the extent to
which the nature and coverage of such information is likely to promote greater
operational efficiency in service delivery. It also helps to know whether resources reach
service delivery units as planned to enable the achievement of annual and medium-term
performance targets as well as strategic sector objectives.
8.1 Performance plans for service delivery
The assessment team considered the 2013/14 annual budget in scoring this dimension,
and noted that budget outputs to be achieved by ministries are specified: for example, i)
pre-primary schools, primary or 9-year basic education (9YBE), ii) primary health services
and iii) social protection, among others. In addition, it is reported that the total primary
expenditures by functional classification in the education sector amounted to RWF 212.2
billion against a budget of RWF 219.5 billion and registered an overall sector execution
rate of 96.6%. This included pre-primary education with a target for 2013/14 to increase
the number of classrooms from 1,870 in FY 2012/13 to 2,148 classrooms in the FY
201/14 and actually reached 97% of this target. For primary and secondary education,
targets were to reduce the textbook to pupil ratio from 1:2 to 1:1 in primary schools, 1:3 to
1:2 in lower secondary and 1:10 to 1:5 in upper secondary schools.
Dimension rating = D

Rwanda PEFA Assessment, Upgraded Framework 2016
34
8.2 Performance achieved for service delivery
Rwanda is substantially focused on the issue of service delivery to the extent that in its
EDPRS 2 medium-term plan and the budget framework paper, there are several costed
activities to be accomplished or reached in improving service delivery by FY 2017/18.
Also, service delivery is top of the list of issues included in the performance contracts
(Imihigo) signed between the top leadership and district Mayors (who are responsible for
implementation of the planned activities).
In addition, the year-end annual budget execution report captures information on
performance results achieved by all ministries, and this has been the case for some
years. While the information provides a basis to understand what has been delivered, the
current reporting format is not clear enough in terms of the methods of calculation and
data sources for all ministries. That said, the coverage of ministries is clear, although an
additional focus may be required to define explicit targets to be reached each financial
year.
Dimension rating = C
8.3 Resources received by service delivery units
This dimension measures the extent to which a system is in place to monitor if the service
delivery units received the funds allocated to the sector/services as planned. However,
such a system does not currently exist in Rwanda, although the subsidiary entities
accounting system (SEAS) being developed by MINECOFIN is aimed at reaching this
objective. The IFMIS has not been able to track revenue and expenditure up to the level
of end users (i.e., individual schools and health facilities across the country). Expenditure
reports by districts do not capture resources received in kind by non-budget agencies
(NBA). Also, the data is not used to prepare aggregated expenditure reports by type of
service unit and geographical distribution for tracking analysis (as repeatedly reported by
the OAG).
Dimension rating = D
8.4 Performance evaluation for service delivery
This dimension assesses the extent to which the design of service delivery programs and
the efficiency and effectiveness of those programs is assessed in a systematic manner
through independent performance evaluations. The OAG does include some
performance audits in the report on the annual financial audit of government. The extent
to which the OAG report meets the specifics of a design program of service delivery is
one thing, but the report does touch some aspects of the efficiency and effectiveness of
service delivery without necessarily being specifically targeted in the true sense of
program definition. What this means is that, the performance audit must evaluate the
extent of service delivery in order to make specific observations and recommendations to
enhance service delivery, and define mechanisms to follow up on these
recommendations.
However, in 2012 and 2014, the World Bank sponsored PETS survey on primary
education and social protection sectors respectively. These surveys were conducted by
civil society (Transparency International-Rwanda TI-R), and the results were beneficial for
policy feedback and improvement.
Dimension rating = D

Rwanda PEFA Assessment, Upgraded Framework 2016
35
PI-8 Dimension Score Justification
Performance information for
service delivery D+ Scoring Method M2
8.1 Performance plans for service delivery
D A framework of performance indicators is not in place for the majority of MDAs.
8.2 Performance achieved for service delivery
C The Annual Budget Execution report captures performance results for the majority of service delivery functions.
8.3 Resources received by service delivery units
D No system currently exists to monitor resources received by service delivery units as planned.
8.4 Performance evaluation for service delivery
D Surveys by TI-Rwanda are independent performance evaluations of service delivery, but while recommendations for enhancing delivery are included, they do not cover 25% of expenditure.
Ongoing reforms: None.
PI-9 Public access to fiscal information
9.1 The comprehensiveness of fiscal information available to the public
As shown in Table 3.7 below, GoR meets four of the five ‘basic’ information benchmarks
and two of the additional benchmarks.
Table 3.7: Public access to key fiscal information
No. Fiscal information benchmarks
Availability (Yes/No)
Notes (Means of Availability)
Basic elements 1. Annual Executive Budget
Proposal documentation. A complete set of executive budget proposal documents (as assessed in PI-5) is available to the public within one week of the executive’s submission of them to the legislature.
Yes Government website.
2. Enacted Budget. The annual
budget law approved by the legislature is publicized within two weeks of passage of the law.
Yes Government website.
3. In-year budget execution reports.
The reports are routinely made available to the public within one month of their issuance, as assessed in PI-27.
No Neither monthly nor quarterly reports are produced for the public. A mid-year report is produced and included in the BFP, which eventually will be a public document.
4. Annual budget execution report.
The report is made available to the public within six months of the fiscal year’s end.
Yes Produced within 3 months of year-end.
5. Audited annual financial report, incorporating or accompanied by the external auditor’s report. The reports are made available to the public within twelve months of the fiscal year’s end
Yes Government website.
Additional elements 6. Pre-Budget Statement. The broad
parameters for the executive budget proposal regarding expenditure, planned revenue and debt is made available to the public at least four
No Although the Executive’s proposals are submitted to Parliament more than 2 months before the start of the year, the budget timetable (Annex 5)

Rwanda PEFA Assessment, Upgraded Framework 2016
36
No. Fiscal information benchmarks
Availability (Yes/No)
Notes (Means of Availability)
months before the start of the fiscal year.
suggests that the public do not have access to a ‘Pre-budget statement’ four months before the FY commences.
7. Other external audit reports. All
non-confidential reports on central government consolidated operations are made available to the public within six months of submission.
Yes
8. Summary of the Budget Proposal. A clear, simple summary of the executive’s budget proposal or the enacted budget accessible to the non-budget experts, often referred to as a “citizens’ budget”, and where appropriate translated into the most commonly spoken local language, is publicly available within two weeks of the executive budget proposal’s submission to the legislature and within one month of the budget’s approval.
Yes
9. Macroeconomic forecasts. The forecasts, as assessed in PI-14.1, are available within one week of their endorsement.
No These forecasts are not made public.
PI-9 Dimension Score Justification
Public access to fiscal
information
B Scoring Method M1
9.1 Public access to fiscal information
B Four ‘basic’ elements and two additional elements are made available to the public within the specified timescales.
Ongoing reforms: None.

Rwanda PEFA Assessment, Upgraded Framework 2016
37
Pillar III. Management of assets and liabilities
PI-10 Fiscal risk reporting
10.1 Monitoring of public corporations
The definitions in the OBL specify that a Public Entity is: “a public entity with legal
personality managed in accordance with laws governing public entities and which is
entitled to a budget for fulfilling its mission” and that an extra budgetary entity is: “a public
entity whose budget is partially financed through the annual State Finance Law”, while
Article 7 (‘Incurring extra budgetary expenditures’) prescribes that “All revenues, including
grants and loans and all expenditures shall be included in the budget of the concerned
public entity. It is prohibited to incur extrabudgetary expenditures whatever their source”.
The Annual Financial Statement for FY 2013/2014 produced by MINECOFIN includes the
finances of more than 80 Autonomous Government Agencies that have been
consolidated before submission to the Auditor-General for audit. Cross-checking this list
of AGAs against the almost 100 abbreviations for entities that have been included in the
OAG’s report for the same year demonstrates that the major AGAs do submit annual
accounts to the line ministry with which they are associated, as required by Article 67 of
the OBL. All Public Corporations produce audited AFS within six months of their year-
end, and the data is published in a consolidated report.
Since the GPMU was created in 2009, information on the 20 Public Entities where GoR
owns the majority of shares3 has been consolidated into a ‘Fiscal Risk of Government
Investment Portfolio’. The latest version of this (internal and unpublished) document is
dated June 2014, and specifies for each Public Entity:
the income statement
the external audit opinion;
corporate governance issues,
financial management and reporting structures,
internal control weaknesses that could negatively impact profitability and long-term
financial sustainability,
priority action areas, actual or potential financial losses,
debt accumulation, and the risk of declining profitability or default; and
the strength of the legal, regulatory and oversight framework for the whole sector.
Table 3.8: Public Enterprises (RwF)
Public Enterprises Total Net Book Value
Latest AFS
Rwanda Civil Aviation Authority (RCAA) 100% 19,198,880,200 30-Jun-13
EWSA 100% 52,329,856,620 30-Jun-13
National Bank of Rwanda (BNR) 100% 68,840,141,000 30-Jun-13
National Post Office 100% 2,582,578,373 31-Dec-13
Rwanda Social Security Boards(RSSB) 100% 496,238,035,954 30-Jun-13
Rwanda Utilities Regulatory Agency (RURA) 100% 5,981,766,742 30-Jun-13
Special Guarantee Fund 100% 512,857,666 30-Jun-13
Office National des Transports en Commune 100% 5,050,723,420 30-Jun-13
Military Medical Insurance Scheme (MMI) 100% 6,376,286,000 31-Dec-13
RwandAir Ltd. 100% 3,415,234,271 30-Jun-13
King Faisal Hospital Rwanda 100% 6,997,875,702 30-Jun-13
Prime Holdings Sarl 100% 62,450,551,358 31-Dec-13
3 In fact, GoR owns 100% of the shares of 16 of the 19 listed PEs; and 99%, 90% and 57.3% of
the other three. The Government investment portfolio lists (minority) shareholdings in a further 27 entities, ranging from 42% to less than 1%.

Rwanda PEFA Assessment, Upgraded Framework 2016
38
Rutongo Mines 90% (5,550,743,717) 31-Jun-13
Rwanda Grains and cereal Corporation Ltd 57.3% 1,240,096,914 31-Dec-13
Ngali Holdings, 100% (176,621,031) 30-Dec-13
Horizon Group Ltd 100% 21,351,943,000 31-Dec-13
Agaciro Development Fund Ltd 100% 18,588,325,625 30-Jun-13
Rwanda National Investment Trust Ltd 100% 10,000,000 30-Jun-13
Rwanda Printer Company 100% 650,000,000 30-Jun-13
Source: Government Portfolio Unit – MINECOFIN
Thus a consolidated risk report on Public Entities is produced. However, this information
is effectively a year out of date as much of it is drawn from the Annual Report and
Accounts of each entity (not all of which have the same FY as government). In addition,
although the OAG is only responsible for auditing some of these entities – many of the
audits are outsourced to commercial firms – although OAG does receive the audit
reports, as does MINECOFIN.
Dimension rating = B
10.2 Monitoring of subnational governments
Article 36 of the OBL requires Districts to produce expenditure estimates based on
existing and proposed expenditure policies of decentralized entities and in conformity
with medium term strategies established by the Central government. Article 23 requires
the Executive Committee of sub-national governments to submit quarterly budget
execution reports to MINALOC within one month of the end of the quarter. These are also
copied to MINECOFIN, so that a consolidated budget execution report can be submitted
to Cabinet (quarterly) and a mid-year consolidated budget execution report to the
Chamber of Deputies.
The District reports cover all expenditure and revenue (central transfers, donors and own
revenue) and use a format consistent with central government reporting: this incorporates
sectoral categories. An annual financial statement is submitted to the Accountant
General, where the information is captured in the consolidated financial statements within
one month of the end of the FY. All District accounts are audited by the OAG annually,
and the results presented to Parliament.
Dimension rating = C
10.3 Contingent liabilities and other fiscal risks
In addition to the monitoring of Public Corporations and the work of the GPMU described
in 10.1 above, Table 7.3.3 of the GoR Consolidated Financial Statement for the FY
ended 30 June 2014 lists contingent liabilities totalling almost RwF 58 Billion, the majority
of which are in respect of the government-owned airline, RwandAir Express. However, in
the last few years, GoR has entered into a number of ‘Public Private Partnership’
arrangements in, for example, the Telecommunication, Energy and Water sectors, and
these are not recognised as contingent liabilities.
Dimension rating = C
PI-10 Dimension Score Justification
Fiscal risk reporting C+ Scoring Method M2
10.1 Monitoring of public corporations
B Most Public Corporations produce audited AFS within six months of their year-end
10.2 Monitoring of subnational governments
C All SNGs submit annual financial statements to the Accountant General: these are consolidated within one month of end of FY, sent for audit then published.
10.3 Contingent liabilities and other fiscal risks
C With the exception of GoR’s PPP arrangements, contingent liabilities are recognised in financial reports.
Rwanda PEFA Assessment, Upgraded Framework 2016
39
Ongoing reforms
In April this year, the Rwanda Development Board tabled a bill on PPPs in Parliament.
PI-11 Public investment management
This indicator assesses the institutional framework governing critical decision-making
referencing public investments and the management of these investments, taking into
consideration the national policy and strategic objective for achieving and sustaining
economic growth, as well as the fiscal space (both capital investment and recurrent
costs) for financing these investments.
11.1 Economic analysis of investment proposals
Since 2013, GoR has centralised public investment management aimed at ensuring the
attainment of value-for-money in all public sector investment initiated by Ministries,
Departments and Agencies (MDAs). This responsibility has been added to the functions
of the National Development Planning and Research (NDPR) department under
MINECOFIN. The public investment technical team, a unit under the NDPR, has
developed a guideline for the management of public investments. The guideline provides
institutional content among others, including project approval process, the use of the
Public Investment Programme (PIP – this is the master document for approved public
projects), private sector involvement and project impact evaluation.
The public investment committee undertakes critical project appraisal of all capital
investment projects in accordance with NDPR economic analysis guidelines to ascertain
the financial viability and the overall economic benefit to both the public and private
sectors. However, while not all appraisals results are published (as required for an ‘A’
rating), NDPR reports show that the majority are.
Dimension rating = B
11.2 Investment project selection
The institutional framework supporting investment project selection begins with the
submission of proposed projects appraisal documents from MDAs and Local Government
Authorities to MINECOFIN for initial clearance. There are two separate public investment
committees – one for central government chaired by the Permanent Secretary of
MINECOFIN with membership of Permanent Secretaries from other stakeholder
ministries; the second committee (local government project advisory committee) is for
local government authorities chaired by the Permanent Secretary of MINECOFIN, the
membership of which includes provincial Executive Secretaries and district council
permanent secretaries. MDAs and Districts formulate the projects after receiving initial
clearance from MINECOFIN; the formulated projects are resubmitted to MINECOFIN for
appraisal, forwarded to the public investment committee (PIC) for approval before the
necessary budgetary provisions are made. It is important to state that approved projects
do not necessarily translate to automatic budgetary allocation or funding. The following
criteria are used in project prioritisation and selection:
Desirability – this means project(s) must be in line with the Economic Development
and Poverty Reduction Strategy (EDPRS), Sector Strategic Plans (SSPs) as well as
District Development Plans (DDPs); must be of institutional relevance as well as
provide support to both public and private sectors
Achievability – this looks at the project deliverability, funding mechanisms and other
environmental constraints and challenges

Rwanda PEFA Assessment, Upgraded Framework 2016
40
Viability – cost implications and mainstream revenue-generating potentials,
management implications, financial sustainability and project economic impact.
Dimension rating = A
11.3 Investment project costing
The Public Investment Programme (PIP) annual timetable synchronises perfectly with the
annual budget preparation calendar. PIP consultations begin in mid-January with MDAs.
By February a draft PIP is prepared for circulation to the External Finance Unit, Macro-
economic Department and the Budget Department for review, input and approval by the
Public Investment Committee (PIC). Between March and May, the PIP is further
discussed during budget consultations for inclusion into the Budget Framework Paper
(BFP) for Cabinet approval.
Comprehensive project costings should consider both investment cost and forward linked
recurrent expenditure, the cost-benefit with critical sensitivity and scenario analysis,
taking into account the public and private interest. It should also ascertain the affordability
and cash flow implications with regards to the available fiscal space and the current and
ongoing projects funded by the national budget. Interactions with officials of MDAs and
the National Development Planning and Research (NDPR) confirm that complete costing
(both investment cost and forward linked recurrent expenditure) over the project life cycle
is undertaken to ensure sustainability and evidence to demonstrate this was provided to
the Assessment Team. The Public Investment Guidelines outline the project costing
framework for both development (capital) cost and operation (recurrent) cost portfolios;
MDAs and DCs adhere to the costing framework. A review of at least five (5) major
government (MDA and DC) projects with cost broken down into development cost and
recurrent cost, is summarised in the table below: this information is included in the budget
documentation.
Table 3.9: Summary of Five Largest Approved Government Projects (RwF B)
Name of Project Supervising MDA
Dev’t Cost Forward Linked Recurrent Cost Total
Jun-14 Jun-15 Jun-16 Jun-17 Jun-18
Crop Intensification Project
Agriculture
32.810
11.364
11.364
11.364
11.364 78.267
Base Butaro Kidaho Road Infrastructure
51.120
- -
- 1.043 52.164
Rural Sector Support Project
Agriculture
54.394
- 7.922 - 6,932 69.248 Rwanda Integrated Trade Logistics Facilities Project
Trade & Industry
50.475
-
-
-
16.825 67.300
Rukomo Base Road Infrastructure 50.114 - - - 1.022 51.137
Grand Total
318.117
Source: NDPR
Dimension rating = A
11.4 Investment project monitoring
The Project Management and Monitoring Unit (PMMU) within MINECOFIN is responsible
for managing and reporting on government projects. The PMMU was created in 2013,
principally to assist MDAs and District Councils (DCs) in project budget preparations and
management through in-house technical assistance. The unit develops and disseminates
reporting templates to MDAs and DCs. It is also the main collaborator during Country
Performance Assessment Reviews conducted by the World Bank. In addition to field
visits to project sites to ascertain the level of implementation, quarterly and annual project
progress reports are prepared and submitted to Cabinet for review. At present, the IFMIS
platform produces reports on government own resource projects; it is however intended

Rwanda PEFA Assessment, Upgraded Framework 2016
41
to include donor projects in the monitoring mechanism through IFMIS during the
FY2015/2016. Evidence from the 3rd quarter FY2014/2015 report indicates that RwF
383.7billion out of a total project budget of RwF 787billion representing 49% was
executed. In addition to the quarterly project progress report, the PMMU also prepares an
annual report for Cabinet review. The 2013/2014 annual project progress and financial
report (dated September 2014) indicates an 88% development budget execution rate;
government own resource execution was 90% whiles donor funded execution rate was
84%. Total actual development budget execution amounted to RwF 666billion for
FY2013/2014.
Dimension rating = C
PI-11 Dimension Score Justification
Public investment management B+ Scoring Method M2
11.1 Economic analysis of investment proposals
B MDAs and District Councils submit all proposed capital investment projects to the Public Investment Committee for economic appraisal before approval in accordance with the public investment guidelines issued by the National Development Planning & Research: some results are published
11.2 Investment project selection A All major investment projects are prioritized on the basis of the Public Investment Guidelines before they are included in the budget
11.3 Investment project costing A Public Investment Guidelines outline a comprehensive costing framework for both investment cost and forward linked recurrent costs: the information is included in the budget documentation
11.4 Investment project monitoring
C The Project Management and Monitoring Unit (PMMU) of MINECOFIN undertakes at least quarterly physical inspection of all approved government projects. It also prepares quarterly and annual project progress and financial reports, but these are not published
Ongoing reforms
The PFM SSP recognises the need to build capacity in this area and has therefore made
provision in that respect. The National Development Planning and Research Department
under MINECOFIN is the lead agency. During FY2015/2016, the PMMU as part of the
reforms proposes to undertake a needs-assessment of all Single Projects Implementation
Units (SPIUs) across all MDAs to ascertain the level of efficacy and capacity constraints.
PI-12 Public asset management
The assessment of this indicator focuses of the quality and comprehensiveness of a
register covering central government financial and non-financial assets, and the legal and
administrative framework governing the disposal of these assets
12.1 Financial asset monitoring
The Government Portfolio Unit under MINECOFIN is responsible for maintaining records
of all government domestic and foreign investments. At the end of each financial year, a
statement is prepared and annexed to the annual consolidated financial statements.
However, only a summary of the annual CFS is published, and this does not include the
statement of government’s investment portfolio.
The statement of government investment portfolio is nonetheless complete and
comprehensive, detailing name of the entity in which government has invested (both
Rwanda PEFA Assessment, Upgraded Framework 2016
42
domestic and international investments), the shareholding structure, the number of
shares, the net book value at year-end, the opening net book value, and the latest
available financial statement of the entity in question. Further, the statement also details
proceeds from any privatisation or divestiture in government interest in each company,
the name of the current investor, value of shares divested, amount received by
government, and outstanding receivables thereon. In addition, the statement outlines the
dividends received by government from entities that have declared dividends. For
instance, in FY2013/2014, GoR earned a total of RwF 3.024billion dividends from its
investments as compared to RwF 2.3billion in FY2012/2013. The statement further
discloses any government on-lending portfolio. In June 2013, GoR lent USD 78.89m to
Rwandair, out of which a repayment of USD 49.68m was received by June 30th, 2013.
The Government Portfolio Unit maintains a separate folder containing the share
certificates of all companies (both domestic and foreign) in which Government has
financial interest. The following table provides a sample list of some entities with GoR
financial interest:
Table 3.9: Sample List of Entities with GoR Financial Interest
Name of Company GoR Number
of Shares Share Value
(RwF m) Share Value
(USD ) Rwandair 2,662,655 13,313 -
Horizon Group 7,384,019 7,384 -
King Faisal Hospital 6,932,328 6,932 -
Ngali Holdings Ltd 2,000 10 -
Rwanda Grains & Cereals Corporation 28,500 2,850 -
Golden Lion Hotels (Rwanda) SARL 35,190 - 3,519,000
Rutongo Mines Ltd 9,000 - 450,000
Rwanda National Investment Trust Ltd 1,000 10 -
Source: Government Portfolio Unit – MINECOFIN
Dimension rating = C
12.2 Nonfinancial asset monitoring GoR has an asset management policy and framework that provides comprehensive
guidelines on acquisition, registration (fixed assets register), safeguarding, recording and
accounting, valuation, loss of asset, transfer and disposal, insurance, among others. The
Rwanda Housing Authority, a semi-autonomous agency under the Ministry of
Infrastructure is responsible for compiling and maintaining a consolidated central
government register for all central government's movable and immovable fixed assets.
The Ministry of Infrastructure is responsible for developing policies for four sectors,
namely electricity, water, transport and housing. Besides these sectors, the Ministries of
Health and Education are responsible for constructing hospitals and schools.
Each MDA keeps a fixed asset register. A review of the National Institute of Statistics of
Rwanda (NISR) fixed assets register as at June 2015 showed that the register is
comprehensive and complete. It provided details such as supplier, description of asset,
asset code, date of acquisition, current condition (good or bad), serial number, expected
life span, historical cost, current year depreciation, accumulated depreciation, and the net
book value. The total historical cost of fixed assets for NISR as at 30th June 2015 was
RwF 1,947,528,702 with a net book value of RwF 320,127,554.

Rwanda PEFA Assessment, Upgraded Framework 2016
43
Interactions with officials from the Rwanda Housing Authority suggest that the
consolidated fixed asset register is a work-in-progress. The Authority has received
information of fixed assets from all central government MDAs for compilation into a
consolidated fixed asset register. It is also in the process of valuing all these assets, while
MINECOFIN is putting together a comprehensive framework aimed at accounting for
these assets. Dimension rating = D
12.3 Transparency of asset disposal Law No. 50/2008 of 9th September 2008 provides the legal framework for government
assets disposal, and is operationalised by MO No. 007/2009 dated 1st December 2009
(official gazette no. 23 of 7th June 2010), regulating the disposal of government assets.
Articles 2, 3 and 4 of this MO regulate the preparation of the list of assets to be disposed,
establishment of assets disposal and valuation committee, and the composition of the
disposal team respectively. The valuation committee, according to Article 4 of the MO is
composed of five (5) members, namely the head of finance department of the entity in
question, the logistics officer, and three other members nominated by the chief budget
office of the entity. Article 5 prohibits the head of the public institution, the Executive
Secretaries of District Councils, the CBM, the Internal Auditor and the legal advisor to be
members of the asset valuation committee.
Available evidence suggests that an established procedure exists for the transparent
disposal of assets: it is however insufficient to conclude on just one evidence of a public
auction advertisement placed in the national television network that the majority of central
government assets follow the same procedure. Dimension rating = D
PI-12 Dimension Score Justification
Public asset management D+ Scoring Method M2
12.1 Financial asset monitoring C The Government Portfolio Unit maintains a record of an up-to-date and to a large extent complete register of government financial assets, indicating shareholding structure, net book value and dividend declared, paid and payable to government. The report is annexed to the GoR Consolidated Financial Statement: however, it is not published.
12.2 Nonfinancial asset monitoring
D Even though MDAs compile fixed asset registers, these have not yet been consolidated for GoR: however, the Rwanda Housing Authority is in the process of doing this.
12.3 Transparency of asset disposal
D Although there is legislation and an MO on the sale and disposal of central government assets; there is insufficient evidence to comment on the implementation and transparency of the procedures.
Ongoing reforms
The Rwanda Housing Authority and MINECOFIN are working together to compile a
comprehensive central government fixed assets register. A framework on valuation and
accounting is also being developed.

Rwanda PEFA Assessment, Upgraded Framework 2016
44
PI-13 Debt management
This indicator assesses the overall management of both domestic and foreign public
debt. It also examines the reporting framework for debt stock as well as system for
monitoring and reporting of stock of expenditure arrears.
13.1 Recording and reporting of debt and guarantees
The Debt Management Unit in MINECOFIN was established in September 2014 to
perform the front, middle and back office functions, which had previously been
undertaken by the External Resource Unit (external resource mobilisation, bilateral and
multilateral), the Macroeconomic Unit (analyses of public borrowing) and the Treasury
(recording and reporting) respectively. The Debt Management and Financial Analysis
System (DMFAS) is used to record the movement of public debt; the information provided
by DMFAS is comprehensive, complete – except for not recording PPPs – updated and
reconciled quarterly. An excel spreadsheet is used to record PPPs and explicit
government guarantees; the explicit guarantees currently amount to USD 75million,
representing less than 1% of GDP. Officials of the Debt Management Unit did indicate
that there is currently no clear policy on implicit or contingent liabilities; however, the
National Bank of Rwanda maintains some records of implicit liabilities. The DMFAS
software provides information on debt contracted (categorised into bilateral or
multilateral) i.e. principal loan, rate of interest, interest amount, due date, amount paid
(principal and interest) and amount outstanding including any accrued interest. Total
public debt as at June 2014 stands at USD 2,295million4, translating to RwF
1,452.2billion5, representing 30.5% of GDP. It is projected to hit USD 2,719million
6
representing 33% of GDP by June 2015.
Dimension rating = B
13.2 Approval of debt and guarantees
The Minister of Finance and Economic Planning is sole authorised officer specified in
Chapter V Article 50 of the OBL to borrow or issue guarantees on behalf of central
government, including public entities. District Councils have power to borrow to finance
development projects, but these can only be exercised with the approval of the Minister,
who is also authorised to set borrowing limits. Just as is the case for normal government
borrowing which requires a critical statistical review to determine the borrowing and/or
fiscal space, all government guarantees are subjected to the same thorough framework
to ensure there is sufficient economic space to issue guarantees. Public borrowing is
made against targets set and approved by Parliament in the three-year Medium Term
Debt Strategy.
Dimension rating = A
13.3 Debt management strategy
As part of the annual budget submissions to Parliament for approval, MINECOFIN
prepares a three-year Medium Term Debt Strategy (MTDS), guided by GoR's Public Debt
Policy. This is updated annually on a rolling basis, and provides the overall borrowing
framework for government. It outlines comprehensive roadmap on modalities for
achieving a desirable mix of financial instruments, at the lowest risk and cost, aimed at
mobilising domestic and foreign funding for the implementation of public investment
programmes, including exchange rate and financing cost implications. A number of
government policies are taken into consideration during the preparation of the MTDS:
4 Source: Medium Term Debt Strategy June 2015
5 Source: Government of Rwanda Consolidated Financial Statement FY2013/2014
6 Source: Medium Term Debt Strategy June 2015

Rwanda PEFA Assessment, Upgraded Framework 2016
45
these include the Government Program (Public Investment Programme, Public Private
Partnerships, and National Export Promotion Strategy) and other economic development
programmes such as the EDPRS 2 and Vision 2020).
The June 2015 MTDS sustainability analysis revealed that Rwanda's public debt portfolio
is sustainable at WB and IMF debt sustainability thresholds, with a present value (PV) of
debt to GDP ratio of 26.7% as at March 2015. Officials from MINECOFIN and the
National Bank of Rwanda undertake a joint Debt Sustainability Analysis (DSA) every
year, and the latest review (March 2015) raised concerns with a PV of debt to export at
134.1% by December 2014 as against 101.7% in 2013; this was attributed to an increase
in the non-concessionary loan by GoR on behalf of Rwandair for fleet expansion, and
also dwindling export revenues.
The Public Debt Committee (made up of officials from MINECOFIN and National Bank of
Rwanda) meets quarterly to review the debt strategy, its management, and also to
reconcile GoR’s debt portfolio.
Dimension rating = A
PI-13 Dimension Score Justification
Debt management A Scoring Method M2
13.1 Recording and reporting of debt and guarantees
B DMFAS is used to record public debt. The debt record is comprehensive, complete and reconciled quarterly.
13.2 Approval of debt and guarantees
A Chapter V Article 50 of the OBL provides the framework for public borrowing: the Minister of Finance is the sole authority, and also approves borrowing limits for District. Loans are made against targets set in MTDS.
13.3 Debt management strategy A MINECOFIN prepares a three-year medium term debt strategy, updated annually on a rolling basis: this provides clear targets with associated risk, exchange rate and interest rate factors. A DSA is prepared annually.
Ongoing reforms: None.

Rwanda PEFA Assessment, Upgraded Framework 2016
46
Pillar IV. Policy-based fiscal strategy and budgeting
PI-14 Macroeconomic and fiscal forecasting
14.1 Macroeconomic forecasts
The Macroeconomic Policy Unit (MU) uses projections incorporating government policies
set out in the EDPRS 2 as well as ad hoc inputs from line Ministries, the National Bank of
Rwanda (the Central Bank) – which produces inflation estimates, and forecasts of loan
disbursements, repayments and other financing items – and the National Institute of
Statistics of Rwanda. The Framework uses the latest information available and
developments in Government policies that may have significant impact on revenues and
expenditures, as well as macroeconomic data such as GDP, inflation and exchange
rates. Previous trends are observed and forecasting techniques are used to derive
projections of different scenarios, although these are not shared with Parliament or
published, nor are they reviewed by another (independent) entity): however, the ‘chosen’
scenario is included in the BFP, which is made public (cf. PI-5, element 6).
Dimension rating = B
14.2 Fiscal forecasts Revenue forecasting is formalized, integrated in the budget process, and sufficiently top
down to influence the allocation of expenditure across GoR priorities. The MU in
MINECOFIN is responsible for revenue forecasting, with input from RRA (which actually
collects revenue). The MU formulates and monitors Rwanda’s economic policies and
programs that impact key aspects of economic management, and produces
macroeconomic forecasts on growth that inform economic policy, the fiscal framework,
tax forecasts and debt management strategy (and also facilitates IMF economic
surveillance). The Unit makes projections to support a macroeconomic framework
consistent with the EDPRS2 and Vision 2020. Revenue forecasts are comprehensive to
include all revenue sources including domestic revenue (tax and non-tax revenue) and
grants (capital and budget support), and form part of the budget documentation sent to
Parliament.
The MU also analyses the implications of public expenditure as they affect both
aggregate supply and demand and provides GoR with a ‘Government Operations Table’,
describing the fiscal program and policy over the short-run, with annual fiscal revisions
during the budget process. The Medium Term Expenditure Framework (MTEF) submitted
to Parliament includes the forecast fiscal years and the next two years on both revenue
and expenditure with explanatory notes with notes explaining variances form the previous
year’s forecasts. The Minister of Finance’s budget speech7 to Parliament follows the BFP
(as prescribed under article 79 of the Constitution and Articles 36 and 42 of the OBL) and
highlights key assumptions, including the impact of the global economic conditions; donor
aid flows; migrant remittances; and foreign direct investment (FDI).
Dimension rating = A
14.3 Macrofiscal sensitivity analysis The work of the MU described in 14.1 above includes modelling various scenarios, such
as the impact of changes in commodity prices, which caused a severe shock in FY
2014/15. These reports, reviewed by the Assessment Team include sensitivity analyses,
and are presented to the Cabinet, but not to Parliament. Dimension rating = B
7 Minister of Finance Budget Speech (Fiscal Year 2013/2014).

Rwanda PEFA Assessment, Upgraded Framework 2016
47
PI-14 Dimension Score Justification
Macroeconomic and Fiscal Forecasting
B+ Scoring Method M2
14.1 Macroeconomic forecasts B Projections incorporating government policies (ex EDPRS 2); GDP; inflation; exchange rates; and ad hoc inputs from MDAs and Central Bank
are incorporated in a framework produced by the Macroeconomic Policy Unit and included in the BFP, but are not independently reviewed.
14.2 Fiscal forecasts A Macroeconomic forecasts consistent with the EDPRS and Vision 2020 inform economic policy, the fiscal framework, tax forecasts and debt management strategy. The MTEF submitted to Parliament includes the forecast FY and the next two years on both revenue and expenditure, with notes explaining variances form the previous year’s forecasts.
14.3 Macrofiscal sensitivity analysis
B The work of the MU includes modelling various scenarios, and these are presented to the Cabinet, but not to Parliament.
Ongoing reforms:
Recent tax reforms have focused on reducing the cost of administration and fostering
compliance. Under these reforms, the following were introduced: electronic filing
payment; the electronic single window (bonded warehouses and agencies in import and
export); electronic cargo tracking to protect cargo from source to destination; mobile filing
and payment; the gold scheme to facilitate compliant taxpayers; a revision in the
investment code; a royalty tax on minerals; a revision of double taxation agreement with
Mauritius; and the electronic billing machines (EBM). Other reforms included changes in
the common external tariffs (CET) within the East African Community (EAC) framework.
PI-15 Fiscal Strategy
A clearly articulated fiscal strategy will include well documented qualitative and
quantitative targets, identify the constraints to be overcome and report on the extent to
which pervious targets have been achieved.
15.1 Fiscal impact of policy proposals Any failure to anticipate the impact of policy changes can lead to unanticipated deficits
and can undermine service delivery, hence the need for these to be understood and
documented. The dimension focuses on both revenue and expenditure proposals.
On the revenue side, the MU within MINECOFIN advises the Minister through the TPC on
possible tax changes that will meet economic policy objectives, and highlights the impact
on both taxpayers and the economy. The MU also identifies new avenues for widening
the tax base to raise domestic revenues to finance the budget; prepares annual and
medium-term revenue forecasts; produces quarterly and annual revenue performance
reports; and drafts appropriate legislation for revenue collection.
The MU also analyses the implications of all expenditure proposals as they affect both
aggregate supply (production) and aggregate demand (spending) in order to provide GoR
with an appropriate public spending orientation or effective budget allocation to spending
as compiled in the consolidated tables (Government Operations Table, using the
standard GFS format). In addition, the public investment technical team in the NDPR (see
also PI-11) provides important inputs to this process in relation to the planning and
management of public investments.

Rwanda PEFA Assessment, Upgraded Framework 2016
48
As noted in PI-5, the budget documentation presented to Parliament includes the impact
of proposed policy changes.
Dimension rating = A
15.2 Fiscal strategy adoption
For several years, the various Annexes to the BFP set out the fiscal framework within
which the budget of GoR is formulated. As well as defining and preparing a series of
standard assumptions to ensure that the basis upon which fiscal forecasts are produced
is both robust and transparent, the framework includes forecasts of debt issuance and
repayments, together with the stock of debt, and has contributed to the development of a
debt management strategy (see also PI-13.3).
Fiscal data is collected by the MU in MINECOFIN and formulated into a MTFF
Framework to project aggregate ceilings for the budget as well as forecasts of the fiscal
balance. Different scenarios are modelled for internal use, although the final
documentation presented to Parliament includes the ‘preferred’ or most likely forecast.
The IMF has agreed a ‘Policy Support Instrument’ with GoR, and the latest report records
that the framework for the FY2015/16 budget is in line with PSI objectives, and includes
quantified targets for fiscal consolidation through domestic resource mobilization
(increases in tax revenue in the medium-term) as well as expenditure prioritization to
reduce the fiscal gap, which will in turn reduce reliance on external donor support.
Dimension rating = A
15.3 Reporting on fiscal outcomes
This dimension assesses the extent to which the government makes available – as part
of the annual budget documentation submitted to the legislature – an assessment of its
achievements against the stated fiscal objectives and targets.
The BFP and the Annual Economic Reports (both of which are presented to Parliament)
contain data on the actual and planned fiscal balance, together with explanations of the
reasons for variances: the relevant extract is shown in the table below:
Table 3.10: Difference between actual and originally forecasted CG fiscal balance
2011/2012 2012/2013 2013/2014
RwF ‘B % RwF ‘B % RwF ‘B %
Planned 97 2.4 137 3.0 271 5.3
Actual 62 1.5 243 5.3 222 4.3
Difference 0.9 2.3 1.0
Source: Annual Economic Report
The difference was 0.9% in 2011/12, 2.3% in 2012/13, and 1.0% in 2013/14.
Dimension rating = B
PI-15 Dimension Score Justification
Fiscal Strategy A Scoring Method M2
15.1 Fiscal impact of policy proposals
A Estimates of the fiscal impact of proposed policy changes – both revenue and expenditure – are included in the budget documentation submitted to Parliament.
15.2 Fiscal strategy adoption A GoR has set three-year medium-term fiscal objectives with quantitative targets at the start of budget preparation in each of the last 3 FYs.
15.3 Reporting on fiscal outcomes
B The BFP and the Annual Economic Reports
(both of which are presented to Parliament) contain data on the actual and planned fiscal

Rwanda PEFA Assessment, Upgraded Framework 2016
49
PI-15 Dimension Score Justification balance, together with explanations of the reasons for variances.
Ongoing reforms: None.
PI-16 Medium-term perspective in expenditure budgeting
16.1 Medium-term expenditure estimates
Considerable efforts have gone in linking the budget with sector priorities, institutional
plans and national priorities reflected in EDPRS 2. In line with this, Ministerial budget
consultations for FY2015/16 were held during March 2015 and were fully informed by
preceding planning consultations where broad priorities were agreed. The exercise was
led and coordinated by MINECOFIN supported by MINALOC, MINICAAF and MIFOTRA.
The result is the production of estimates covering three financial years using
administrative, economic and functional classifications.
Dimension rating = A
16.2 Medium-term expenditure ceilings
The Budget calendar (included as Annex 5) sets out the various steps in the process,
and as can be seen, two Budget Call Circulars (BCCs) are issued, in October and
January. However, neither of the BCCs contain ceilings: these are only developed for
inclusion in the BFP which goes to Cabinet in March.
Dimension rating = D
16.3 Alignment of strategic plans and budgets
The country’s national investment program is set out in the EDPRS 2, which covers the
period 2013/2018. There are 14 individual strategy documents combined into EDPRS 2,
prepared by sector (or sub-sector), and these cover more than 80% of government
expenditure. The forward estimates included in the budget documents are mostly
consistent with the individual strategies, which identify financial requirements against
potential budget allocations – and hence the funding gaps – although not all distinguish
capital (investment) from recurrent expenditures.
Dimension rating = A
16.4 Consistency of budgets with previous year estimates The Budget Framework Paper sets a medium-term resource envelope and clarifies the
costs of strategic policy options. The BFP states that “the budget for fiscal year 2015/16
is consistent with the medium-term fiscal framework, which broadly continues the policy
started in 2014/15”. As can be seen in the table below, total planned expenditure for FY
2015/2016 has changed, in the light of the fall in commodity prices, and there is a shift
away from capital to recurrent expenditure, as a result of the expenditure prioritization
policy: these differences are fully explained in BFP Annexes.
Table 3.11: MTEF/BFP Outer Year Links in (Billion RwF)
BFP April 2014 BFP April 2015
2014/15 1,753 -
2015/16 1,955 1,768
2016/17 2,095 1,882
2017/18 - 2,037 Source: MINECOFIN, Budget Framework Papers 2014/2015 and 2015/2016 (April 2015)
Dimension rating = B

Rwanda PEFA Assessment, Upgraded Framework 2016
50
PI-16 Dimension Score Justification
Medium-term perspective in
expenditure budgeting B Scoring Method M2
16.1 Medium-term expenditure estimates
A Budget requests by MDAs are scrutinized for compliance with agreed priorities as reflected in EDPRS 2, and are produced using administrative, economic and functional classifications.
16.2 Medium-term expenditure ceilings
D Medium-term expenditure ceilings are only included in the BFP, which is issued after the
two BCCs: hence MDAs and Districts commence budget preparation without these parameters.
16.3 Alignment of strategic plans and medium-term budgets
A The forward estimates included in the budget documents are mostly consistent with the individual strategies.
16.4 Consistency of budgets with previous year estimates
B Links between the MTEF second year estimates and setting of the annual budget for the following FY are clear, for MDAs representing 75% and differences are explained in Annexes to the BFP.
Ongoing reforms: None.
PI-17 Budget preparation process
This indicator assesses the budget formulation process that allows for an effective top-
down and bottom-up participation of the MDAs, including their political leadership
represented by Cabinet. It also assesses the extent to which the annual budget
preparation process supports the linking of the draft budget to public policy objectives.
Dimensions (i) and (ii) are assessed using the last budget submission, for FY2015/2016.
Dimension (iii) is assessed on the basis of the last three approved budgets: i.e. the FY
2013/2014, 2014/2015, 2015/2016.
17.1 Budget calendar
Article 26 (1-6) of the OBL outlines the legal and regulatory framework for annual national
budget preparation and approval, with particular reference to the issuance of budget call
circulars, which should be in accordance with the budget calendar accompanying the
budget instructions. As shown in Annex 5 a clear and fixed budget calendar exist that
allows MDAs and District Councils at least three months from the date of receipt of the
second and final budget call circular, issued on 6th February 2015 for 2015/2016 budget
preparations. Timelines indicated in the budget calendar are always respected. As part of
measures to improve budget preparation and submissions, a first budget call circular is
issued around September of the previous year to serve as a guide to budget
preparations, the second and final BCC issued in February provides the final estimates of
fiscal envelop to all budget entities. The 2015-2016 planning and budgeting guideline is a
simplified 4-page document that provides clear guidelines and timing of each activity to
budget preparations. A strategic issues paper (SIP) is also annexed to the BCC; this
requires each MDA to outline their strategic objectives for the fiscal year in no more than
five pages.
Dimension rating = A
17.2 Guidance on budget preparation
The budget formulation and preparation process has evolved over the years, witnessing
significant improvement since the last assessment. High-level political involvement
begins in September, with a ministerial and governors meeting including district council
mayors and executive secretaries. At this stage, the first budget call circular (BCC) is

Rwanda PEFA Assessment, Upgraded Framework 2016
51
issued to all budget entities – central government and sub-nationals. Officials from
MINECOFIN provide technical support to budget entities in the preparation of draft
annual action plans and budgets, together with annual procurement plans. The budget
guidelines are clear, comprehensive and simplified. The second BCC, issued on 6
February, assisted MDAs and District Councils (DCs) in the preparation of the budget
estimates, but does not include cabinet-approved ceilings. The bottom-up approach to
budgeting has been institutionalised in the fixed budget calendar and is actually followed
through; this takes place in October for the first consultations with the private sector and
community members. The Guide to Citizen's Budget provides considerable guidance for
ordinary citizens to make meaningful input into the budget. A national dialogue is
organised in December and the feedback is used to revise the draft budget. While MDAs
participate in the legislative review of the BFP submitted to parliament in April,
MINECOFIN organises a development partner consultative group meeting in order to
firm-up donor commitments to be mainstreamed into the final budget estimates. As part
of measures to ensure improved service delivery and accountable governance, the
government organises another consultative forum between April and May involving
government officials and community members in order to draft and finalise a performance
contract known as "IMIHIGO".
Dimension rating = B
17.3 Budget submission to the legislature
The Constitution 2003 (Article 79) as amended accordingly mandates Cabinet to submit
to Parliament a national budget (state finance bill) before the beginning of the new
financial year. The OBL further stipulates that the Minister of Finance, after Cabinet's
approval shall submit the annual state budget to Parliament not later than 15th June, to
allow the lower house of parliament (Chamber of Deputies) to approve the bill before 30th
June. Over the last three completed fiscal years 2012/2013, 2013/2014, 2014/2015 as
well as the current fiscal year 2015/2016, MoF confirm that the final budget estimates
were submitted to the Prime Minister by the end of April, then immediately presented to
the legislature. Budget submissions to parliament begin in April each year with the
presentation of the Budget Framework Paper (BFP), which contains annexes of all MDAs
estimates. Parliament begins the reviews when the BFP is referred to the budget
committee and the various sector sub-committees. Recommendations are forwarded to
the executive for the necessary revisions, which do not significantly affect the original
estimates annexed to the BFP.
Dimension rating = A
PI-17 Dimension Score Justification
Budget preparation process A Scoring Method M2
17.1 Budget calendar A MINECOFIN issues a clear and comprehensive fixed budget calendar to MDAs and district councils. MDAs and sub-national governments respect the timeframe contained in the budget calendar. The BCC allows at least three months for MDAs and DCs to prepare budget estimates
17.2 Guidance on budget preparation
B The final BCC is comprehensive and clear; it was issued early February but without cabinet approved ceilings.
17.3 Budget submission to the legislature
A The OBL requires the Minister of Finance to submit budget proposals to the legislature on or before 15th June each year. For all the three years under consideration as well as the current fiscal year 2015/2016, national budget submissions have been presented to the legislature before the end of April.
Ongoing reforms: None.

Rwanda PEFA Assessment, Upgraded Framework 2016
52
PI-18 Legislative scrutiny of budgets
This indicator assesses the legislative scrutiny and debate of the annual budget law as
described by the scope of the scrutiny, the internal procedures for scrutiny and debate
and the time allocated to that process, in terms of the ability to approve the budget before
the commencement of new FY.
18.1 Scope of budget scrutiny The power of Parliament to scrutinize the national budget is derived from Amendment
n°03 of 13/08/2008 to Article 79 of the Constitution. This requires the Chamber of
Deputies, in each financial year, to adopt the Finance Bill before the commencement of
the session devoted to the examination of the budget and the Cabinet is required to
submit to both Chambers the Finance Bill for the next financial year. Accordingly, the
Parliament expects to receive the Budget implementation report for the first semester of
the current financial year from Cabinet before examining the budget of the next financial
year.
Article 32 of the OBL requires the Minister of Finance and Economic Planning to prepare
and submit to both Chambers of the Parliament, by not later than 30th April of each year,
the Budget Framework Paper after approval by Cabinet before submission to both
Chambers of the Parliament. The Budget Framework Paper includes the following
annexes:
the basic macroeconomic indicators;
the fiscal projections for the relevant period;
the mid-year budget execution report of the current year;
the borrowing and loan servicing projections;
the projections of grants by source;
the guidelines on earmarked transfers to decentralised entities;
the projected internally generated revenues and related expenditures of Central
Government entities;
the consolidated summaries of revenues and expenditures of decentralized entities;
the revenues and expenditure projections of public institutions;
the amount of dividends paid by companies in which the State holds shares and the
part of the amount which will go to the budget;
the securities issued by the Government;
the gender budget statement.
By article 32 of the OBL, for FY 2013/14 and previous FYs the Parliament received the
Budget Framework Paper on time and consistently submitted comments to the Cabinet
on or before the 30th May of the current fiscal year.
Dimension rating = A
18.2 Legislative procedures for budget scrutiny The Legislature’s procedures for budget review are firmly established and respected as
prescribed in article 11 of OBL: the Chamber of Deputies and the Councils of the
decentralized entities, in their respective capacity are the only organs with powers to
adopt the annual budget and its revision. Prior to the adoption of the annual budget,
members of the Chamber of Deputies and members of the Decentralized Entities Council
consider and provide comments on the Budget Framework Paper (as stated earlier).
Although Parliament is not allowed to increase the final budget estimates presented by
the Minister of Finance, the Special Budget Committee can recommend or negotiate an

Rwanda PEFA Assessment, Upgraded Framework 2016
53
upward adjustment of the budget estimates of Constitutional bodies where necessary.
The Budget Committee has 9 members and is backed by a technical office which
supports MPs in their review of the budget estimates. The presence of such an office is
good practice to impart enough time for actual discussions, a meaningful debate on the
budget proposal, and for negotiations with the entities.
Dimension rating = B
18.3 Timing of budget approval Article 32 of the OBL ensures that the Parliament has sufficient time to consider the draft
budget, the Budget Framework Paper (BFP). The legislation has a provision for over 30
days to review the budget proposal: on April 5, the Cabinet receives the BFP and the
draft budget. During April and May, Parliament calls the ministers to discuss and review
the BFP and draft budget. By the end of May, Parliament finishes the consultations and
submits recommendations on the budget to the Executive. Those recommendations are
important to finalize the Finance Law. By the 5th of June, Parliament receives the draft
Finance Law for review and approval. This has been well documented; thus the process
has been followed. The law requires that the budget should be approved before the 15th
June and the years under review have adhered to this deadline. For FY 2011/2012, the
budget was approved on the 8th June 2011 while FY 2012/2013 the budget was approved
on 14th June 2012 and for the FY 2013/2014, the budget was approved on 13
th June
2013.
Dimension rating = A
18.4 Rules for budget adjustments by the executive
Any significant adjustment to expenditure is requested through a ‘Supplementary
Budget,’ which follows the same process as the Finance Law, and this is subject to clear
Parliamentary rules. The law does not set a limit for any supplementary budget, however,
there was no significant expansion of total expenditure in the last financial year.
Dimension rating = B
PI-18 Dimension Score Justification
Legislative scrutiny budgets B+ Scoring Method M1 18.1 Scope of budget scrutiny A The legislature first reviews and approves the
BFP before the budget is formally presented: the timeframe allows detailed debate & scrutiny.
18.2 Legislative procedures for budget scrutiny
B The legislature’s procedures to review budget are firmly established in law and are respected.
18.3 Timeliness of budget proposal approval
A The legislature approved the annual budget before the start of the FY in the last three years.
18.4 Rules for budget adjustment by the executive
B Parliamentary rules govern supplementary estimates, and there was no significant expansion of the total budget in the last FY.
Ongoing reforms
The Minister of Finance is expected to issue guidelines on modalities of budget
reallocation to give effect to conditions and limits with which the budget is managed at the
entity level.

Rwanda PEFA Assessment, Upgraded Framework 2016
54
Pillar V. Predictability and control in budget execution
PI-19 Revenue administration
This indicator assesses the compliance of revenue agencies to prescribed rules and
regulations.
The Rwanda Revenue Authority (RRA) is an autonomous agency under MINECOFIN,
established by an Act of Parliament (Law No 15/97 of November 1997). Law No. 08/2009
dated 27th April 2009 as amended accordingly regulates the organisation, functions and
responsibilities of RRA. In addition, managing risks to revenue, conducting audit and
fraud investigations, and arrangements for dealing with revenue arrears are considered.
The RRA is also responsible for collecting social security contributions on behalf of the
Rwanda Social Security Board, as well as the District Councils.
19.1 Rights and obligations for revenue measures
As part of its drive to ensure that there is timely, easy access and accurate information on
tax obligations and payments, RRA has compiled a book of all 23 tax laws, ministerial
orders and commissioner general rules. The laws, regulations, ministerial orders and
commissioner general rules are clear and comprehensive; of importance to note is the
fact that these laws, regulations and orders are in three languages, i.e. Kinyarwanda,
English and French. The granting of tax exemption is strictly regulated by law, as enacted
by Parliament, thereby limiting the discretionary powers of officials. RRA continues to roll
out reforms which since 2010, include the following:
Tax policy reforms
Replacement of ad valorem excise duty on petroleum products to specific tax in line
with East African Community (EAC) standards; the removal of VAT on petroleum
products was also effected;
Introduction of gaming tax, including 13% special tax on gaming activities and a 15%
withholding tax on game winnings;
Increase of excise duty on all mobile phone airtime from 5% to 8%;
Implementation of SME tax regime, which categorises SMEs into Micro Taxpayers
and Small Taxpayers for tax efficiency and increase tax compliance with the sole aim
of reducing cost of compliance;
Revision of VAT law to include all public tenders, making it mandatory for all public
entities to report VAT on public tenders;
Revision of the VAT law for mandatory use of the Electronic Billing Machine (EBM) by
all registered VAT tax collectors;
Introduction of mineral royalty tax;
Revision of existing rules on Double Taxation Avoidance Agreement (DTAA) between
Rwanda and Mauritius, to be more favourable to Rwandan business enterprises.
Tax administration reforms
Collection of social security contributions on behalf of the Rwanda Social Security
Board (RSSB), for the purposes of reducing cost of compliance to taxpayers and
social security contributors, by way of becoming a "one-stop shop" for tax and social
security contribution. This arrangement is under an MoU between RRA and RSSB;
Introduction and deployment of mobile cargo scanners at all entry ports for efficient
and faster taxpayer service;
The deployment of SIGTAS (tax software) at all taxpayer offices for ease of
declaration of all domestic taxes;

Rwanda PEFA Assessment, Upgraded Framework 2016
55
Introduction of e-tax filing and payment system for efficiency; this includes an M-
declaration and payment system that allows tax declaration and payment via the
mobile phone;
The establishment of the Rwanda Electronic Single Window (RESW) at Customs for
ease of payment of import duties;
The creation of a 24-hour toll-free call centre for efficient taxpayer service delivery;
The establishment of a Data Warehouse, Risk Management and Business Intelligence
System; this is meant to ensure optimum tax compliance by adopting a risk-based
audit platform for taxpayer audit;
An MoU between RRA and the District Councils to decentralized taxes (fixed asset
tax, rental income tax and trading license tax) as well as local fees on behalf of the
Districts in order to maximise local government’s own revenue;
Amendment to VAT code allowing small and medium enterprises with annual turnover
up to RwF 200million to file VAT returns quarterly;
Deployment of mobile cargo scanners at Gatuna and Rusumo border posts, in
addition to existing mobile scanner at Gikondo border post in order to expedite
customs inspection and clearing procedures, thereby accelerating business
transactions;
Streamlining of taxpayer registration documentation requirements from six to three
aimed at easing the act of doing business in Rwanda; mandatory importer
documentation currently include commercial invoice, bill of lading and packing list;
RRA launched the Rwanda Electronic Single Window (RESW) system at Customs;
this provides a single interface for businesses to lodge standardised information for
use by all relevant governmental agencies at the same time to facilitate the issuance
of business and clearing permits and reduce time and cost of doing business; Payment of PAYE on quarterly basis instead of monthly basis for SMEs whose annual
turnover is less or equal to RwF 200million; this was in line with the amendment of the
VAT code to allow for quarterly filing of VAT returns for the same category of SMEs.
The Taxpayer Service Department provides client service to the taxpayer. It is dedicated
to the provision of both basic and sophisticated taxpayer service for existing and potential
taxpayers to know their tax obligations. This is fundamental to ensuring that a simplified
framework that facilitates taxpayer access to critical information on tax laws, regulations,
tax incidence and most importantly, administrative procedures are in place for achieving
optimum and efficient tax collection and compliance. Once enacted by Parliament, all tax
laws, ministerial orders and commissioner general rules are gazetted and made
available, at very affordable price nationwide, in bookshops. In addition, various
government websites including RRA, MINECOFIN, Office of the Prime Minister, have
electronic copies of all the gazetted laws and regulations for ease of access. Tax leaflets
are conspicuously displayed at the main reception of RRA head office and other regional
and district offices nationwide for public use, free of charge. Tax education is carried out
on print and electronic media in English and Kinyarwanda, in addition to town hall
meetings. There are regular and vibrant taxpayer education campaigns carried out
throughout the fiscal year in accordance with annual tax education work-plans.
Innovatively since 2012, the establishment of a 24-hour client service call centre where
existing and potential taxpayers can call toll-free with the short code "3004" for tax
enquiries has significantly improved taxpayer education and client service in general. A
number of taxpayer education campaigns were undertaken in FY2013/2014, a summary
of which include, but is not limited to the following table:

Rwanda PEFA Assessment, Upgraded Framework 2016
56
Table 3.12: Taxpayer education campaigns
Activity type and place Tax topic/subject Participants
Launching of Taxpayer’s day 2013 at Nyagatare District
Promoting tax compliance: a Collective Responsibility
Official Guests from Eastern Province & Kigali City
Consultative meeting of Mining Sector on New law concern mining Sector at RRA HQ
New Law of Mining Sector Representatives of Mining Associations
Tax Education with Small Taxpayers from ENABLIS Association at ENABIS Office
Profit tax, VAT &PAYE Entrepreneurs supported by ENABLIS
Ikiganiro kuri ba Rwiyemezamirimo bakorera Huye, Inama yateguwe na RPPA
Imisoro yishyrwa na ba Rwiyemezamirimo bakora amasoko ya Leta
Rwiyemezamirimo bo mu Ntara y’amajyepfo
Consultative meeting of Taxpayers who have no EBM with CDTD at HQ
Gukangurira abacuruzi gukoresha EBM ku bacuruzi banditse muri TVA
Ku bacuruzi bose bo mu mujyi wa Kigali banditse muri TVA badafite EBM
Launching of Rwanda Authorized Economic Operation (AEO) at SERENA Hotel
Abacuruzi batumiza ibintu mu mahanga
Recruitment of new taxpayers operating in Nyarugenge District
Registration on VAT & Income Tax
Small and medium Taxpayers of Nyarugenge District
Tax education with Small Taxpayers from Bugarama Trading center in Rusizi District
M-Declaration, EBM & Flat Tax
Small Taxpayers from Bugarama Trading Center
Tax education with taxpayers from Kabeza, Giporoso, Kimironko & Kicukiro at Hill Top Hotel
Registration, M-Declaration, EBM & Flat Tax
Small Taxpayers from Kabeza, Giporoso, Kimironko Trading Centre.
Sensitization of EBM on Taxpayers registered in VAT operating in Rubavu District at La Corniche Motel.
Implementation and the requirement by the VAT law no 37/2012 of 09/11/2012 in article 24 of law and article 9 of ministerial order No 02/13/10/TC of 31/07/2013.
Taxpayers registered in VAT operating in Western Province
EBM Campaign (visit door to door) Implementation of the use of EBM
Traders in Kigali
Kwigira Programme in Huye District The role of taxes in the development of our country
Local leaders and opinion leaders from Southern Province
Source: RRA
The legal framework governing tax procedures is contained in Law No. 25/2005 dated 4th
December 2005. The law prescribes procedures for addressing tax issues relating to
appeals, fines and interest, modes of communication to/from taxpayer, forms of appeal,
taxpayer registration requirements among others, for the various categories of tax
applicable to personal income tax, corporate tax, withholding tax, value added tax (VAT),
property tax on vehicles and boats, and gaming tax. Chapter VII of Law No.25/2005
regulates the tax appeals mechanisms with amendments of selected Articles or
Provisions of the law. The following Articles under Chapter VII have been amended:
Article 32: Decision on appeal (As modified and completed by article 9 of the law
n°1/2012 of 03/02/2012 modifying and complementing law nº 25/2005 of 04/12/2005
on tax procedures, Official Gazette nº 13 of 26/03/2012):
Article 32 b: Conduct of a new audit because of evidence discovered when
considering an appeal (As provided by article 10 of the law n°1/2012 of 03/02/2012
modifying and complementing law nº 25/2005 of 04/12/2005 on tax procedures,
Official Gazette nº 13 of 26/03/2012):

Rwanda PEFA Assessment, Upgraded Framework 2016
57
Subsection 2: Appeal to the Appeals Commission Article 33 – 37: These articles
were repealed by the Law no 74/2008 of 31/12/2008 of 04/12/2005 on tax procedures.
Official Gazette No. 19 of 11/05/2009;
Section 2: Judicial appeal Article 38: Appeal with the tribunal (As modified and
completed by article 7 of the law n°74/2008 of 31/12/2008 modifying and
complementing law nº 25/2005 of 04/12/2005 on tax procedures, Official Gazette nº
19 of 11/05/2009).
Administrative and judicial tax appeals mechanisms are provided for in Part 20 Articles
229 to 231 of the East African Community Customs Management Act 2004. There exists
a functional administrative tax appeals framework. The law regulates the functions and
activities of the administrative appeals system. The Commissioner General has 30 days
to respond to a taxpayer's appeal, with an extension of an additional 30 days after
expiration of the first 30-day period. The law also provides for an amicable settlement;
according to the law, the Commissioner General shall determine the modalities of the
amicable settlement. This raises an element of discretionary powers, as there are no
clear guidelines for such modalities. The repeal of Articles 33 to 37, which hitherto
required a second layer of administrative appeals mechanism has quickened the appeals
process, paving the way for judicial review in case a taxpayer is dissatisfied, 30 days
after the Commissioner General's decision on administrative appeal. Available statistics
on tax appeals indicate that 198 out of 265 cases (67 cases carried forward to
FY2014/2015) were reviewed within the fiscal year ended June 2014 as against 169 and
160 for fiscal years 2012/2013 and 2011/2012 respectively, reflecting an increase of
17.2% over the 2012/2013 appeal cases. In FY2013/2014, 142 out of the 198 cases were
subjected to judicial appeal, resulting in 80 favourable cases for RRA and 42 cases
against RRA. 19 out of the 142 cases were partially favourable to each party (i.e. RRA
and plaintiff), with one case resolved amicably.
Dimension rating = A
19.2 Revenue risk management
RRA collects at least 98% of government revenue. Self-assessment is the main tax
declaration method used by RRA for taxpayers. RRA has also introduced M-Declaration,
a mobile phone tax declaration and payment module for ease of tax declaration and
payment. The introduction of a risk-based computerised taxpayer-profiling framework by
the Department for Risk Management since 2014 in the identification and selection of
taxpayers for audit and fraud investigations has significantly improved the revenue
collection, audit and fraud investigations and the update of the taxpayer database. These
IT systems (the risk-based computerised taxpayer-profiling module, and M-Declaration)
run on the SIGTAS platform; therefore, updates are automatic. Registration of taxpayers-
businesses is linked to the registrar of companies’ database, from which tax identification
numbers are generated automatically and uploaded unto RRA SIGTAS platform.
Dimension rating = A
19.3 Revenue audit and investigation
Chapter V Articles 20 to 25 of the Law No.25/2005 and its amended provisions outlines
the legal and regulatory framework for tax audit and fraud investigations. According to the
law, RRA must provide a 7-day written notice to the auditee taxpayer, requesting for
specific documentation such as the entity's audited financial statements, bank
statements, cashbook(s), and other relevant expenditure invoices. The law makes
provision for a 15-day extension at the request of the taxpayer but can do so only once.
The Department for Risk Management, a new creation in 2014, has strengthened the
existing tax audit and fraud investigations mechanism. A computer-based risk-profiling
module is used to identify potential taxpayers for audit. The computer model tracks all

Rwanda PEFA Assessment, Upgraded Framework 2016
58
importers to ensure taxpayers are adequately captured and updated in order to raise the
requisite tax assessment.
Personnel from the audit and fraud investigations department use a risk-based audit work
plan to conduct their audits. At end of the audit, a draft report is issued to the taxpayer for
comments before sign-off. Available statistics from the annual activity reports of RRA
reflect a surge in tax audit, fraud investigation and post-clearance audit, although this
cannot be related to planned activities. However, the Customs Services Department
(CSD) recovered an amount of RwF 1.4billion in FY2012/2013, whilst the Large Taxpayer
Office (LTO) and the Small & Medium Taxpayer Office (SMTO) recovered RwF
21.3billion and RwF 5.4billion respectively in the same year. In FY2013/2014, a total of
RwF 9.1billion was recovered from 374 physical audits conducted by the SMTO,
representing 293.5% of tax declared by taxpayers. During the same period, the LTO and
the CSD recovered RwF 11.1billion representing 21.4% of tax declared and RwF
1.6billion respectively.
While these statistics, may be impressive, there is no data available to relate the number
of planned audits to those actually undertaken.
Dimension rating = D
19.4 Revenue arrears monitoring
The management of tax arrears by the Revenue Authority remains crucial to ensuring
adequate cash flows for budget execution and management. Officials from RRA have
indicated that even though tax arrears remain a challenge, there appears to be a
downward trend in absolute terms. Tax default is considered a bad debt provided it
remains unpaid 10 years from the due date; this is defined in Article 46 of Law
No.25/2005 on Tax Procedures with its amended provisions dated 4th December 2005.
Article 69 of the same law provides for a tax waiver, including interest and penalties
provided there are sufficient grounds to grant such waivers to the defaulting taxpayer, but
with the approval of Cabinet. Gross tax arrears collection rate stood at 29.6% and 24.7%
in FY2012/2013 and FY2013/2014 respectively; effectively the collection rate is below
60% for the last completed fiscal year (Table 3.13 below). The age analysis of stock of
tax arrears reveals that 81.6% of total tax arrears for FY2013/2014 are more than twelve
(12) months old. On the other hand, the ratio of total tax arrears to total tax revenue for
the same period was 13.3% (refer to Table 3.14 below).
Table 3.13: Collection Ratio of tax arrears
RwF M 2011/2012 2012/2013 2013/2014
Stock of arrears
- Large taxpayer’s office (LTO) 32,244 42,706 46,068
- Small & Medium taxpayer’s office (MTO) 37,434 41,018 56,586
Total stock of arrears 69,678 83,725 102,655
Total arrears collected during the year 16,443 24,780 25,355
Collection ratio 23.6% 29.6% 24.7%
Source: RRA

Rwanda PEFA Assessment, Upgraded Framework 2016
59
Table 3.14: Age Analysis of Stock of Tax Arrears FY2013/2014
RwF M LTO Tax
Arrears
MTO Tax
Arrears
STO Tax
Arrears
Total Tax
Arrears
Per
cent
Less than 3 months o’due 1,254 2,758 4,532 8,544 8.3%
Between 3 and 6 months 3,906 452 511 4,870 4.8%
Between 6 and 12 months 453 3,985 991 5,430 5.3%
More than 12 months 40,453 17,997 25,358 83,809 81.6%
Total arrears June 2014 46,068 25,192 31,394 102,655 100.0%
Total revenue June 2014 773,900
% arrears to total revenue 13.3%
Source: RRA
Dimension rating = D
PI-19 Dimension Score Justification
Revenue administration C+ Scoring Method M2
19.1 Rights and obligations for revenue measures
A The RRA, which collects 98% of GoR revenue provides easy access to detailed and user-friendly tax information to both existing and potential taxpayers. RRA also has a functional administrative tax appeals system for the redress of taxpayer complaints.
19.2 Revenue risk management
A RRA, which collects at least 98% of government domestic revenue (mostly via ‘self-assessment’), uses a computerised risk-based taxpayer-profiling module to identify and select taxpayers for audit and fraud investigations.
19.3 Revenue audit and investigation
D RRA undertakes periodic tax audit and fraud investigations, using a risk-based work plan: however, it is not possible to relate planned activities to those achieved.
19.4 Revenue arrears monitoring
D The stock of revenue arrears as a percentage of total tax revenue is 13.3% (i.e. below 20%), arrears older than 12 months represent 81.6% of total stock of tax arrears for FY2013/2014
Ongoing reforms
As part of the reforms to streamline the stock of revenue arrears, enforcement actions
were taken in 2014/2015 resulting in the re-categorization of all debtors into recoverable
and irrecoverable debts. A payment plan has been agreed with some debtors on the
recoverable list; some legal actions have also been taken resulting in freeze of assets.
RRA management intends to present to its Board and subsequently to the Minister of
Finance, all irrecoverable debts for consideration and necessary write-off actions. Going
forward, RRA proposal referencing recovery and write-offs will eventually streamline its
debt stock in the medium-term. Further, management proposes to take timely revenue
recovery actions including proper taxpayer profiling, increased exhaustive enforcement
actions and write-off strategies.
PI-20 Accounting for revenue
This indicator assesses of the mechanism by which RRA reports and reconciles all taxes
collected and remitted to the MINECOFIN in a complete and timely manner.
20.1 Information revenue collections
Revenue administration remains crucial to cash management and efficient budget
execution. As the main collector of domestic revenue for government, the RRA provides
timely and up-to-date revenue collections information to the MINECOFIN on a daily basis.
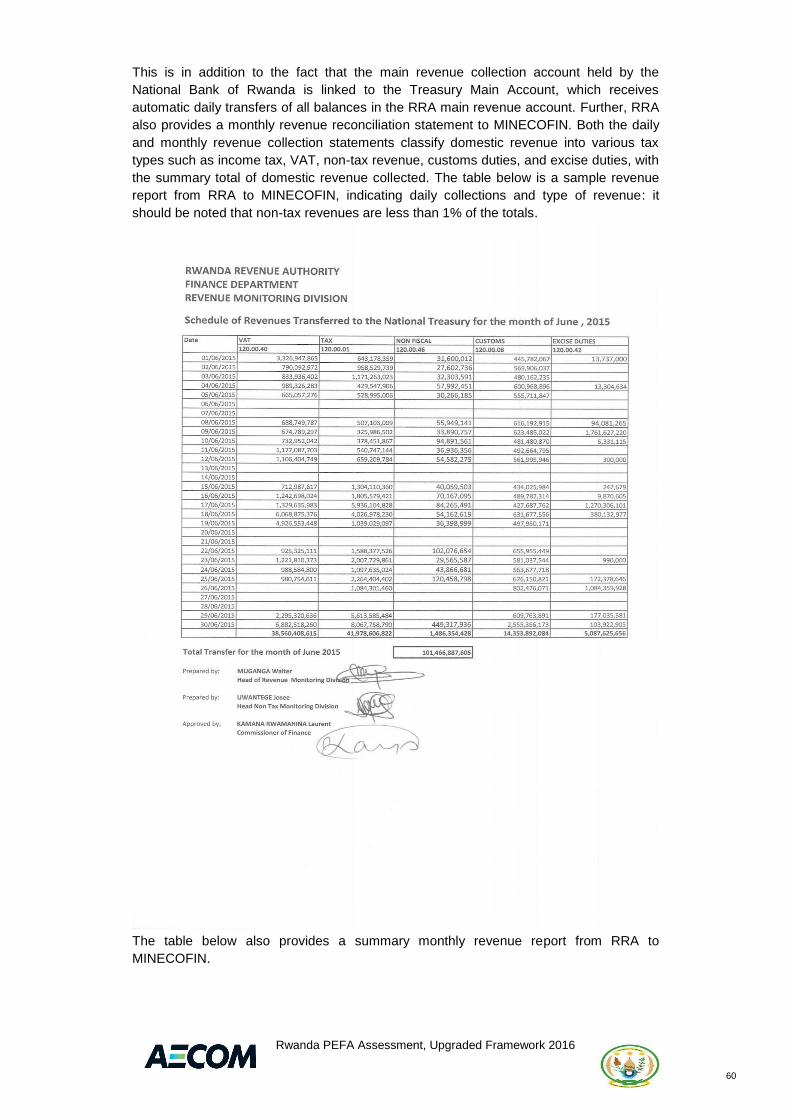
Rwanda PEFA Assessment, Upgraded Framework 2016
60
This is in addition to the fact that the main revenue collection account held by the
National Bank of Rwanda is linked to the Treasury Main Account, which receives
automatic daily transfers of all balances in the RRA main revenue account. Further, RRA
also provides a monthly revenue reconciliation statement to MINECOFIN. Both the daily
and monthly revenue collection statements classify domestic revenue into various tax
types such as income tax, VAT, non-tax revenue, customs duties, and excise duties, with
the summary total of domestic revenue collected. The table below is a sample revenue
report from RRA to MINECOFIN, indicating daily collections and type of revenue: it
should be noted that non-tax revenues are less than 1% of the totals.
The table below also provides a summary monthly revenue report from RRA to
MINECOFIN.

Rwanda PEFA Assessment, Upgraded Framework 2016
61
Table 3.15: RRA Monthly Revenue Report to MINECOFIN
Month
Apr-15 May-15 Jun-15 Total
VAT 24,244,454,552
22,190,511,567 38,560,408,615 84,995,374,734
Income tax 42,573,971,423
30,960,318,373 41,978,606,822
115,512,896,618
Non-tax 1,183,486,110
1,228,943,645 1,486,354,428 3,898,784,183
Customs duties 11,574,863,404
13,356,834,558 14,353,892,084 39,285,590,046
Excise duties 3,730,961,069
4,846,063,876 5,087,625,656 13,664,650,601
Total Transfer to MINECOFIN 83,307,736,558
72,582,672,019 101,466,887,605
257,357,296,182
Dimension rating = A
20.2 Transfer of revenue collections
RRA maintains two main types of bank account; one known as the main revenue account
held at the National Bank of Rwanda, which is linked to the Treasury Single Account (the
Consolidated Fund) maintained and operated by the National Treasury, and the second
bank account known as the tax collection bank account held with commercial banks.
Transfers from the main RRA revenue account are made daily into the Treasury Main
Account (Consolidated Fund), leaving a zero-balance. Commercial banks that collect
taxes from taxpayers transfer all tax collections within 48 hours into the main RRA
revenue account held by the Central Bank. The main revenue account is a zero-balance
bank account; at the close of business each day, balances are transferred automatically
into the Consolidated Fund. The bank account held by commercial banks receives taxes
from all manner of taxpayers. It is noteworthy that less than 1% of total tax revenue
remains on transit at small border/entry posts that have no immediate access to a
banking facility; nonetheless, these are fully reconciled and deposited within 2 days at the
nearest commercial bank with RRA bank account.
Dimension rating = B
20.3 Revenue accounts reconciliation
SIGTAS is the software used by the RRA for tax administration, and this is accessible
online and provides the taxpayer platform for self-assessment. The system is also linked
to the M-declaration (mobile phone declaration and payment). Complete accounts
reconciliation entails the process of comparing total tax assessed in a given period to
actual tax collected out of the amount assessed, then arrears which arise as a result of
the difference between tax assessed and tax collected, and finally comparing actual tax
collections to total tax collections transferred to MINECOFIN. Three types of complete
reconciliations are done; daily, monthly and six-monthly reconciliations. The daily
reconciliation generates a report that shows total tax assessed, tax collected, tax
transferred to the Treasury and the stock of arrears. The second reconciliation occurs
every month within two weeks after the end of the preceding month, whiles the third
occurs every six months within a month following the half-year. The monthly and bi-
annual reconciliations involve officials from MINECOFIN.
Dimension rating = A

Rwanda PEFA Assessment, Upgraded Framework 2016
62
PI-20 Dimension Score Justification
Accounting for revenue B+ Scoring Method M1
20.1 Information on revenue collections
A MINECOFIN receives monthly revenue reports from RRA. The report categorises revenue into type of revenue such as VAT, income tax, non-tax revenue, customs duties and excise duties.
20.2 Transfer of revenue collections
B Transfers from the main RRA revenue bank account to the Treasury Main Account are effected within a day. Transfers from tax accounts held by commercial banks take 48 hours to reach the main RRA revenue account
20.3 Revenue accounts reconciliation
A Officials of RRA and MINECOFIN undertake reconciliations between tax collected and transfers to the Treasury each month within two weeks of the end of the month, and every six months within a month after the period. RRA also undertakes a complete reconciliation between assessment, collections, transfers and arrears daily with SIGTAS.
Ongoing reforms: None.
PI-21 Predictability of in-year resource allocation
This indicator assesses the extent to which MINECOFIN provides reliable information on
the availability of funds to the MDAs that manage administrative budget heads in the
central government budget, and the consolidation and control of government cash
balances. For effective budget execution, it is crucial that MDAs receive reliable
information on the availability of funds. For all three dimensions, assessment is based on
the last completed FY, 2013/2014.
21.1 Consolidation of cash balances
According to the OBL, the opening of any government bank account requires the
approval of the Minister of Finance. This function in practice has been delegated to the
Accountant General. The MINECOFIN operates a Treasury Single Account, which allows
GoR to ascertain in real time the total cash position by close of business each day. It is
responsible for consolidating all central government cash and bank balances, in
collaboration with the Debt Management Unit. The Consolidated Fund Account or the
Treasury Main Account is the main central government bank account. It is linked to the
RRA Main Revenue Bank Account (a zero-balance account) that collects domestic tax
from other revenue collecting commercial bank accounts. At the close of business each
day, balances in the RRA Main Revenue account are transferred automatically into the
Treasury Main Account held at the National Bank of Rwanda. Also linked to the Treasury
Main Account are sub-treasury bank accounts for MDAs and District Councils. MDA sub-
treasury bank accounts are operations accounts; outstanding balances are transferred
into the Treasury Main Accounts at close of business each day in order to ascertain total
government balances, and are reversed the next day for normal MDA transactions and
operations. MDA own revenue accounts are also linked to the Treasury Main Account;
these bank accounts are not operations accounts. A major improvement since the 2010
assessment is the inclusion of donor funded project bank accounts into the TSA
mechanism, thereby making it possible for government to ascertain its entire bank
balances each day. The inclusion of donor funded project accounts was made possible
by the mandatory requirements for all donors to maintain and operate bank accounts
from the National Bank of Rwanda, as contained in the Rwanda Aid Policy of July 2006.
Dimension rating = A

Rwanda PEFA Assessment, Upgraded Framework 2016
63
21.2 Cash forecasting and monitoring
At present, cash forecasts are prepared and submitted to MINECOFIN using the IFMIS
platform, since all MDAs, including District Councils are connected unto IFMIS. As
required by Article 42 of OBL No.12/2013/OL, each MDA prepares annual procurement
plan together with an annual cash plan and submits it to MINECOFIN for consolidation
into a master central government cash forecast. The annual cash plan is updated
quarterly on a rolling basis through IFMIS, based on actual cash flows. After the passing
of the appropriations bill by parliament, MDAs receive a quarterly expenditure
commitment warrant from the Minister of Finance that allows MDAs to commit for
expenditure. The Treasury Management Committee (TMC) meets twice each quarter to
review, consider and approve the updated quarterly cash plans. It should be noted that
the cash flow forecast includes commitment for both recurrent and capital expenditures.
The membership of the Treasury Management Committee is as follows:
Permanent Secretary of MINECOFIN (Chairperson)
Chief Economist of National Bank of Rwanda (Deputy Chairperson)
Deputy Accountant General, National Treasury (Member)
Director General of National Budget (Member)
Director General Macro-fiscal Department (Member)
Director General National Development Planning (Member)
Director General External Finance Department (Member)
Director General Debt Management Unit (Member)
Commissioner General Rwanda Revenue Authority
MINECOFIN is able to ascertain the daily cash position of the central government
through the operation of the Treasury Single Account (TSA) system for efficient cash flow
management and budget execution.
Dimension rating = B
21.3 Information on commitment ceilings
Once the appropriations bill is passed by parliament, the Minister of Finance issues
quarterly expenditure commitment ceilings to all MDAs in line with Article 42 of the OBL,
following the submission of annual cash forecast by each MDA to MINECOFIN for
consolidation. Cash release for the payment of expenditure committed is monthly; any
changes to agreed cash plans are communicated in a timely manner to MDAs for the
necessary readjustments. District Councils however receive quarterly cash allocations in
line with their quarterly approved cash flow plans. Expenditure commitment ceilings are
approved through IFMIS for all MDAs and District Councils. Each budget entity commits
for goods and services through IFMIS; payments for such expenditures are made
centrally by the National Treasury by authorising the National Bank of Rwanda to transfer
funds to suppliers from the appropriate MDA cash allocation.
Dimension rating = B
21.4 Significance of in-year budget adjustments
Article 46 of the OBL regulates budget reallocations, and virements from staff
compensation to other expenditure categories are prohibited without legislative approval:
this does not occur in practice. During budget execution, the chief budget manager is
allowed to vire budgeted recurrent expenditure within the same budget entity, up to a
cumulative maximum of 20% of the original approved budget. Should the chief budget
manager require reallocation in excess of 20%, he/she must seek the approval of the
Minister of Finance. Budget reallocations between recurrent and development
expenditure can only be done with the approval of the Minister of Finance. Budget
reallocations, where necessary, are done once after the first six months of the budget
execution and reported to Parliament.
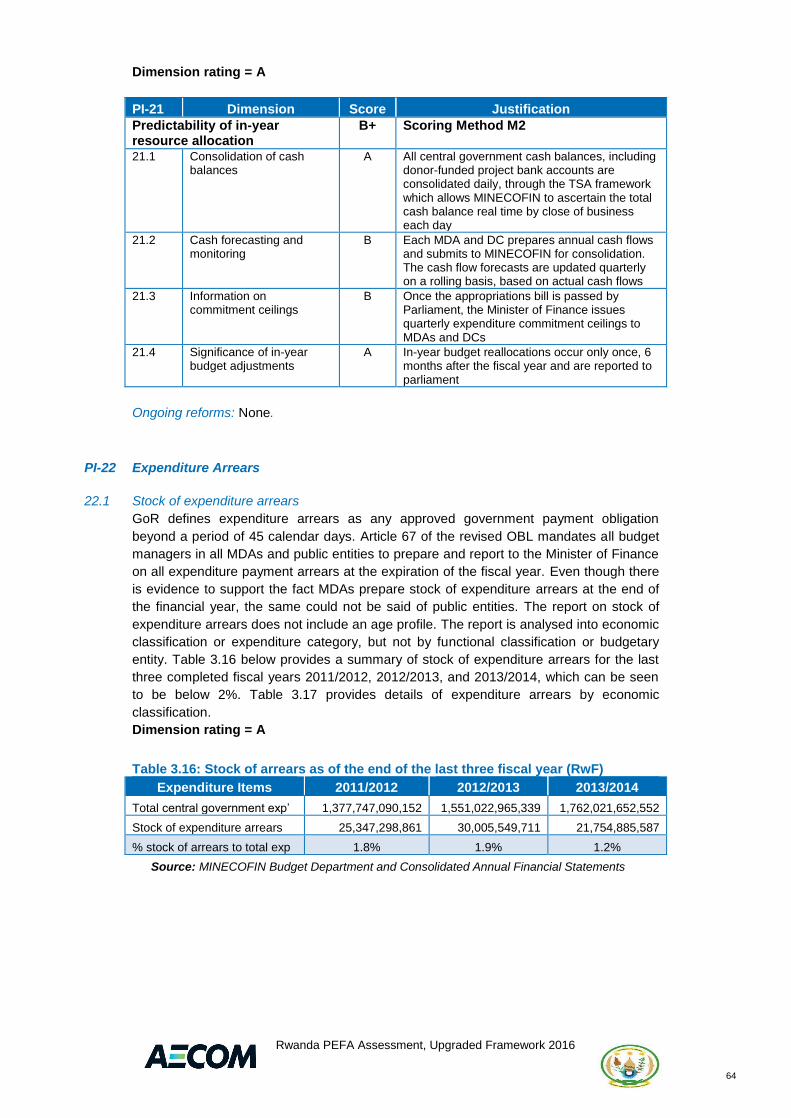
Rwanda PEFA Assessment, Upgraded Framework 2016
64
Dimension rating = A
PI-21 Dimension Score Justification
Predictability of in-year resource allocation
B+ Scoring Method M2
21.1 Consolidation of cash balances
A All central government cash balances, including donor-funded project bank accounts are consolidated daily, through the TSA framework which allows MINECOFIN to ascertain the total cash balance real time by close of business each day
21.2 Cash forecasting and monitoring
B Each MDA and DC prepares annual cash flows and submits to MINECOFIN for consolidation. The cash flow forecasts are updated quarterly on a rolling basis, based on actual cash flows
21.3 Information on commitment ceilings
B Once the appropriations bill is passed by Parliament, the Minister of Finance issues quarterly expenditure commitment ceilings to MDAs and DCs
21.4 Significance of in-year budget adjustments
A In-year budget reallocations occur only once, 6 months after the fiscal year and are reported to parliament
Ongoing reforms: None.
PI-22 Expenditure Arrears
22.1 Stock of expenditure arrears
GoR defines expenditure arrears as any approved government payment obligation
beyond a period of 45 calendar days. Article 67 of the revised OBL mandates all budget
managers in all MDAs and public entities to prepare and report to the Minister of Finance
on all expenditure payment arrears at the expiration of the fiscal year. Even though there
is evidence to support the fact MDAs prepare stock of expenditure arrears at the end of
the financial year, the same could not be said of public entities. The report on stock of
expenditure arrears does not include an age profile. The report is analysed into economic
classification or expenditure category, but not by functional classification or budgetary
entity. Table 3.16 below provides a summary of stock of expenditure arrears for the last
three completed fiscal years 2011/2012, 2012/2013, and 2013/2014, which can be seen
to be below 2%. Table 3.17 provides details of expenditure arrears by economic
classification.
Dimension rating = A
Table 3.16: Stock of arrears as of the end of the last three fiscal year (RwF)
Expenditure Items 2011/2012 2012/2013 2013/2014
Total central government exp’ 1,377,747,090,152 1,551,022,965,339 1,762,021,652,552
Stock of expenditure arrears 25,347,298,861 30,005,549,711 21,754,885,587
% stock of arrears to total exp 1.8% 1.9% 1.2%
Source: MINECOFIN Budget Department and Consolidated Annual Financial Statements
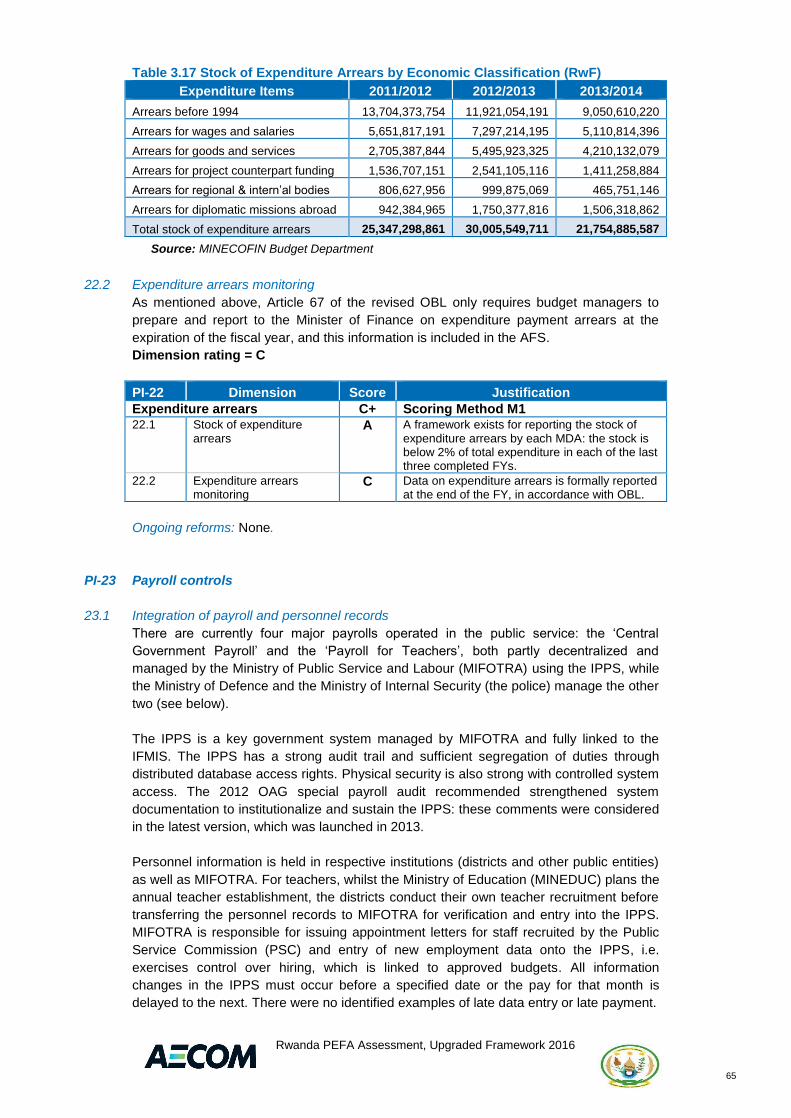
Rwanda PEFA Assessment, Upgraded Framework 2016
65
Table 3.17 Stock of Expenditure Arrears by Economic Classification (RwF)
Expenditure Items 2011/2012 2012/2013 2013/2014
Arrears before 1994 13,704,373,754 11,921,054,191 9,050,610,220
Arrears for wages and salaries 5,651,817,191 7,297,214,195 5,110,814,396
Arrears for goods and services 2,705,387,844 5,495,923,325 4,210,132,079
Arrears for project counterpart funding 1,536,707,151 2,541,105,116 1,411,258,884
Arrears for regional & intern’al bodies 806,627,956 999,875,069 465,751,146
Arrears for diplomatic missions abroad 942,384,965 1,750,377,816 1,506,318,862
Total stock of expenditure arrears 25,347,298,861 30,005,549,711 21,754,885,587
Source: MINECOFIN Budget Department
22.2 Expenditure arrears monitoring
As mentioned above, Article 67 of the revised OBL only requires budget managers to
prepare and report to the Minister of Finance on expenditure payment arrears at the
expiration of the fiscal year, and this information is included in the AFS.
Dimension rating = C
PI-22 Dimension Score Justification
Expenditure arrears C+ Scoring Method M1
22.1 Stock of expenditure arrears
A A framework exists for reporting the stock of expenditure arrears by each MDA: the stock is below 2% of total expenditure in each of the last three completed FYs.
22.2 Expenditure arrears monitoring
C Data on expenditure arrears is formally reported at the end of the FY, in accordance with OBL.
Ongoing reforms: None.
PI-23 Payroll controls
23.1 Integration of payroll and personnel records
There are currently four major payrolls operated in the public service: the ‘Central
Government Payroll’ and the ‘Payroll for Teachers’, both partly decentralized and
managed by the Ministry of Public Service and Labour (MIFOTRA) using the IPPS, while
the Ministry of Defence and the Ministry of Internal Security (the police) manage the other
two (see below).
The IPPS is a key government system managed by MIFOTRA and fully linked to the
IFMIS. The IPPS has a strong audit trail and sufficient segregation of duties through
distributed database access rights. Physical security is also strong with controlled system
access. The 2012 OAG special payroll audit recommended strengthened system
documentation to institutionalize and sustain the IPPS: these comments were considered
in the latest version, which was launched in 2013.
Personnel information is held in respective institutions (districts and other public entities)
as well as MIFOTRA. For teachers, whilst the Ministry of Education (MINEDUC) plans the
annual teacher establishment, the districts conduct their own teacher recruitment before
transferring the personnel records to MIFOTRA for verification and entry into the IPPS.
MIFOTRA is responsible for issuing appointment letters for staff recruited by the Public
Service Commission (PSC) and entry of new employment data onto the IPPS, i.e.
exercises control over hiring, which is linked to approved budgets. All information
changes in the IPPS must occur before a specified date or the pay for that month is
delayed to the next. There were no identified examples of late data entry or late payment.

Rwanda PEFA Assessment, Upgraded Framework 2016
66
Individual payroll records capture key employment data (name; date of employment;
gender; date of birth; identity card number; bank details; salary and allowances
information). The gross pay and allowances for individuals depend on personal
circumstances (years of service, qualifications, etc.). A census was carried out at the end
of 2010 to establish and update records and ensure completeness of civil servant
employment information.
The degree of integration and reconciliation previously identified in the other two payroll
systems (Defence and Police) has been maintained. The records section in the Ministry
of Defence (MOD) maintains the personnel records while the personnel and salaries
section manages the payroll. The army payroll system (MIPPS: Military Integrated Payroll
and Personnel Information System) is fully computerized (personnel records and payroll
database are integrated) and was developed in-house. Systems access is password-
controlled and restricted to authorized officers. The Records Section has an organization
chart indicating authorized positions, their ranks and associated salaries while
maintaining detailed records (service number, full names, current rank, parent’s names,
date and place of birth, date of entry into the army, bank account details, photograph,
etc.) for each employee on MIPPS. The Personnel and Salary Section prepares the
monthly payrolls and pay salaries directly into employee accounts at the Savings and
Credit Society (ZIGAMA). The records section is responsible for checking and effecting
changes in personnel records on receipt of written authorization from the respective units.
All changes and variations are justified.
In the National Police Service, (RNP), the ‘Records Section’ of the Directorate of
Administration & Personnel maintains personnel records while the ‘Payment Section’
manages the payroll the payroll. Reports are received and processed monthly from units
by the records section before the processing the payroll by the salary section. Personnel
information and the respective payrolls are directly linked and checked against prior
payrolls.
Dimension rating = A
23.2 Management of payroll changes
Personnel records are decentralized to central government entities as well as to Districts
for teachers. It is the responsibility of those entities to update personnel records when
required. MIFOTRA staff noted that changes in both the teachers’ and central
government payrolls are generally made in time for the following month. Retroactive
payments do not appear to be common.
Within the RDF and the RNP, the Records Section makes the necessary changes to the
personnel records as information is received. Retroactive adjustments are also rare.
Dimension rating = A
23.3 Internal control of payroll
As noted above, information from MIFOTRA confirms that authority to change the payroll
is both restricted and clear and the audit trail is strong. The IPPS has the establishment,
a database of positions and payroll data – all integrated, and anybody who is not on the
IPPS cannot be paid. The system is linked to the national ID system – able to reflect any
changes such as deaths, retirements, etc., in real-time. Salary payments are made
electronically through the IPPS using an interface with the Central Bank (BNR).
The IPPS changes to RDF personnel records are made by the Records Section and are
supported by written authorization from a senior officer. Changes to payroll are supported
by changes to the personnel data. A complete audit trail is maintained. The Records

Rwanda PEFA Assessment, Upgraded Framework 2016
67
Section of the RNP maintains an organizational chart detailing the posts assigned to
each section and department. There is also a list of established ranks showing the
associated salary scales. The Director of Administration & Personnel must authorize all
changes to personnel records on the basis of written reports from all units on incidents
necessitating changes to personnel records. The payroll audits of the OAG include
physical verifications of individuals within the overall risk parameters assigned by the
OAG. Controls in place are sufficiently extensive to make it extremely difficult to meet all
of the requirements unless the entry is genuine.
Dimension rating = A
23.4 Payroll audit
The annual audit coverage of the OAG for MDAs is at 100% of the total value of all
expenditures and that includes all payrolls. The OAG also conducted a special payroll
audit on the integrity, accuracy and completeness of the data processed through the
IPPS as at 31st July 2012, and highlighted management issues of access controls,
physical access and conditions in the payroll server room, data backup, gaps in key
personnel employment data as well as other weaknesses, which have mostly been acted
upon.
While there is extensive auditing of the payroll systems by the OAG these are probably
risk-based and not conducted annually: however, the information reviewed gives no
indication of ghost workers in the last three years in either the OAG or Internal Audit
reports.
Dimension rating = B
PI-23 Dimension Score Justification
Payroll controls B+ Scoring Method M1
23.1 Integration of payroll and personnel records
A All personnel records and payroll data is reconciled on a monthly basis, and there are strict controls over IPPS, including links to budget approvals.
23.2 Management of payroll changes
A Authorized record changes are made in time for the next payroll and retroactive payments are very limited.
23.3 Internal control of payroll A Authority to change records and payroll is restricted, results in an audit trail and is adequate to ensure high integrity of data.
23.4 Payroll audit B A payroll audit covering all central government entities was conducted by OAG ‘Special Payroll Audit on the integrity, accuracy and completeness of data processed through the IPPS’ in July 2012.
Ongoing reforms
The new IPPS version was only launched in 2013. As with both the IFMIS and MIPPS,
these are in-house developed systems that initially focus on basic utilization needs. As
the PFM systems deepen, user needs will become more sophisticated. The anticipation
of more complex reporting requirements is recognized in the new PFM Sector Strategic
Plan (PFM SSP: 2013 – 2018) as a key priority to design the ‘PFM system of the future’
and deepen the scope and integration of existing enabling ICT platforms (including the
payroll systems). Current reforms also seek to address the issues identified in the OAG
special payroll audit as well as emerging reporting requirements.

Rwanda PEFA Assessment, Upgraded Framework 2016
68
PI-24 Procurement
This indicator assesses the effectiveness of the procurement system. The first dimension
focuses on the extent to which prudent monitoring and reporting are in place to ensure
value for money, fiduciary integrity, while the other dimensions focus on the operation of
the procurement system, including the effectiveness of an independent administrative
complaint resolution mechanism. The assessment covers all procurement for central
government using national procedures, including MDAs and Districts. The assessment is
based on the last completed FY, 2013/14.
24.1 Procurement monitoring
This dimension looks at whether systems are in place to maintain data on what has been
procured and to whom contracts have been awarded. While the procurement function
has been decentralized to MDAs and Districts, each is required to produce an annual
procurement plan and submit this to the Rwanda Public Procurement Authority (RPPA)
once the new FY commences in July.
Once the plan is approved, individual procurement requests must also pass through the
RPPA, where they are recorded in a comprehensive database, which shows what is to be
procured, then subsequently, the value and to whom the award is made: monthly reports
of all procurements undertaken are produced and sent to MINECOFIN.
Dimension rating = A
24.2 Procurement methods
Article 17 of N° 05/2013 of 13/02/2013 Law on Public Procurement sets the conditions of
use of restricted tendering. When prevailing circumstances make it impossible to meet
the conditions for use of a given method and a procuring entity finds it necessary to use a
less competitive method under this Law in order to effect procurement, it shall seek
authorisation from the RPPA. RPPA does grant authorisation after receiving a reasonable
justification from the procuring entity accompanied by a confirmation from the supervising
Minister that such procurement is in public interest.
Article 33 covers the conditions for restricted tendering and states that a procuring entity
may use restricted tendering for procurement, if either:
the goods or construction, are of highly complex or specialized nature, or
are available only from a limited number of suppliers or contractors.
Article 35 further sets conditions for single-source procurement in which the procuring
entity may engage in single-source procurement when:
the goods, works or services are available only from a particular supplier or contractor,
or a particular supplier or contractor has exclusive rights in respect of the goods,
works or services, and no reasonable alternative or substitute exists;
there is an urgent need for the goods, works or services, and engaging in tendering
proceedings or any other method of procurement would be impractical, provided that
the circumstances giving rise to the urgency were neither foreseeable by the procuring
entity nor the result of carelessness on its part;
owing to a disaster, force majeure, there is an urgent need for the goods, works or
services, making it impractical to use other methods of procurement because of the
time required in using those methods;
there are additional activities that cannot be technically separated from initial tender.
The value of such additional activities shall not exceed twenty per cent (20%) of the
initial tender and shall be subject to an amendment to the contract;

Rwanda PEFA Assessment, Upgraded Framework 2016
69
the procuring entity seeks to enter into a contract with the service provider that is
working or teaching in a higher learning institutions or research institutions in the
country for the purpose of research, experiment or study.
Indeed, from the RPPA annual report, the law is strictly followed as can be seen in Table
3.18 below:
Table 3.18: Procurement methods used
Procurement methods Number of procurement Total procurement value
No. Percentage Amount (RwF) Percentage
Open bidding 1,318 81.9 114,299,470,166 95.1
Restricted bidding 57 3.5 2,310,248,974 1.9
Request for quotations 151 9.4 487,180,948 0.4
Direct procurement 47 2.9 1,662,451,454 1.4
Community participation 20 1.2 895,080,343 0.7
Unidentified method 17 1.1 485,900,864 0.5
Total 1,610 100 120,140,332,749 100
Source: RPPA Annual Activity report 2013/2014
The Assessment Team reviewed the 2012/2013 RPPA Annual Report and interviewed
RPPA staff members in respect of the justification for the single-source contracts let in
2011/2012 and 2012/2013, as well as the RPPA records in respect of each of the 20
single-source contracts, all of which were approved by the RPPA Board, as required by
the law.
Dimension rating = A
24.3 Public access to procurement information Article 2 of law N° 05/2013 of 13/02/2013 requires a Ministerial Order to be issued on this
matter, hence chapter one of MO N° 001/14/10/TC of 19/02/2014 provides details in
response to public access to complete procurement information. Article 2 of this MO
states that a ‘Procuring Entity’ (PE) shall prepare a provisional public procurement plan
while preparing the budget for the next financial year. Namely, not later than the 31st July
of every year, every procuring entity shall submit to the RPPA an annual procurement
plan with the following intentions:
identification of needs;
identification of priorities;
indication if it is necessary to carry out a prior study for tenders of works;
identification of the procurement method to be used for any planned tender;
estimation of the value of the planned tender;
specification of the source of funds for that tender;
determination of the necessity to grant local preference to international tenders;
specification of the need for request for approval prior to the award of contract;
planning the schedules in which different processes of tendering shall be carried out;
planning for the execution schedules of the contract.
The order instructs that the annual public procurement plan be approved by the Chief
Budget Manager of every procuring entity after consultation with heads of departments of
the entity. The plan can be reviewed only twice during the financial year, once in the
second quarter and once in the third quarter. The RPPA is then required to prepare
standard documents for public procurement planning and publish them on its official
website.

Rwanda PEFA Assessment, Upgraded Framework 2016
70
Article 3 of the Ministerial Order demands that some of the elements of the procurement
plan, namely, title and quantity of the tender, method of tendering, source of funds,
expected publication and execution dates be published. This information is then posted
on the official website of the procuring entity, posted on the RPPA official website,
advertised in at least one newspaper of wide circulation, which may be national or
international and displayed on the procuring entity’s notice board. The revised
procurement plan is also required to be published, by this order.
Article 42 of the Ministerial Order is about the publication of the competition results and
requires the procuring entity to publish the results of the contract award as soon as the
contract is signed by both parties. The results so published include at least the following:
winner of the tender, amount of the tender awarded and duration of the contract. The
results are also posted on the official website of the procuring entity, posted on the RPPA
official website, and displayed on the procuring entity’s notice board.
Table 3.19: PEFA requirements to rate this dimension
The following key procurement information is available to the public through
appropriate means:
1 Legal and regulatory framework for procurement Yes
2 Government procurement plans Yes
3 Bidding opportunities Yes
4 Contract awards (purpose, contractor and value) 15%
5 Data on resolution of procurement complaints No
6 Annual procurement statistics No
From the RPPA’s Annual reports for 2012/2013 and 2013/2014, there seem to be major
problems in PEs meeting the demands of this dimension (iii). The RPPA law N° 05/2013
of 13/02/2013 and the corresponding Ministerial Order N° 001/14/10/TC of 19/02/2014
are only being introduced and oblige the PEs in the direction of good practice but from
the annual reports, the PEs are far from meeting the targets. For example, in 2012/2013
RPPA procurement audit report, only 7.5% of the PEs posted awarded contract to their
website, whilst for 2013/2014, just 15.5% were available to their website. Besides, the
RPPA procurement audit report is not explicit on PEs posting of data on resolution of
procurement complaints that are supposed to be made public. Dimension rating = C
24.4 Procurement complaints management Article 14 of the law N° 05/2013 of 13/02/2013 and the Chapter V of the Ministerial Order
N° 001/14/10/TC of 19/02/2014 establishes the legal framework for an independent
administrative procurement complaints system. According to this law, an Independent
Review Panels is composed of seven (7) members for a term of office of four (4) years.
They are chosen from the Public Sector, Private sector and civil society. Members from
the Public Sector are not to exceed three. Members of the Independent Review panel at
the National level are appointed by a Ministerial Order while those of the different
Independent Review Panels at the District level are appointed by the District Council. The
appointees are to comprise at least of experts in public procurement, law, construction,
economics and information technology.
Article 49 of the Ministerial Order, establishes that members of the tender committees as
well as those people not authorized to be members of those committees, the staff and
members of “RPPA” Board of Directors and members of the District Council shall not be
allowed to be members of the Independent Review Panels. Article 50 goes on to state
that any bidder wishing to lodge a complaint to the Independent Review Panel shall be

Rwanda PEFA Assessment, Upgraded Framework 2016
71
required to pay a non-refundable fee equivalent to RwF 50,000 for tenders whose
amount does not exceed twenty million RwFs while for tenders whose value is over this
amount the fee for review shall be RwF 100,000. This fee is not prohibitive whatsoever.
By Article 52, if the complainant is not satisfied with the decision of the independent
review panel at District level and decides to continue with his/her appeal to the National
Independent Review Panel, s/he shall be also required to pay the appeal fee required for
the service at this level. However, if the independent review panel at District level fails to
take a decision within the required time, the complainant shall not be required to pay the
appeal fee if s/he decides to continue with his/her appeal to the National Independent
Review Panel.
Article 60 of the Order provides that the decisions of the Independent Review Panel shall
be published and communicated to both parties. They shall be posted on the official
website of the procuring entity, posted on the RPPA official website and displayed on the
procuring entity’s notice board. In fact, at the RPPA website there are annual reports of
the Independent Review Panels that contains data on all reviews and as these reports
are published on the website, they are publicly available.
As defined by legislation and reported in the annual RPPA report listed in Annex 3C
which was reviewed by the Assessment Team, the independent administrative
procurement complaint system exists and meets all six criteria, as can be seen in Table
3.20, below:
Table 3.20: Mechanisms for reviewing procurement complaints
Complaints are reviewed by a body which:
1 is not involved in any capacity in procurement transactions or in the process leading to contract award decisions
√
2 does not charge fees that prohibit access by concerned parties √
3 follows processes for submission and resolution of complaints that are clearly defined and publicly available
√
4 exercises the authority to suspend the procurement process; √
5 issues decisions within the timeframe specified in the rules/regulations √
6 issues decisions that are binding on all parties (without precluding subsequent access to an external higher authority)
√
Dimension rating = A
PI-24 Dimension Score Justification
Procurement B+ Scoring Method M2
24.1 Procurement monitoring A Procurement data maintained by RPPA is comprehensive, and is published annually.
24.2 Procurement methods A Procurement methods are followed according to the law
24.3 Public access to procurement information
C The PEs do not comply fully: only 3 of the 6 criteria are met.
24.4 Procurement complaints management
A RPPA practices meets all legal requirements, including the six criteria listed in Table 3.21.
Ongoing reforms
The RPPA have just concluded major reforms some of which resulted in the new OBL
and the Ministerial Order N° 001/14/10/TC of 19/02/2014 currently being implemented:
this introduces initiatives such as an Electronic Procurement System that RPPA is piloting
in 8 sites in FY 2016/2017, and is due to be implemented across GoR from 1 April 2017.

Rwanda PEFA Assessment, Upgraded Framework 2016
72
PI-25 Internal controls on nonsalary expenditure
This indicator covers a wide range of processes and type of payment across central
government including existence of segregation of duties, effectiveness of expenditure
commitment controls and effectiveness of the payment controls systems.
25.1 Segregation of duties
The Chief Budget Managers (CBM) in budget agencies are ultimately responsible for
ensuring internal controls remain effective. The roles and segregation of duties in terms
of authorization, recording, custody of assets, reconciliation and audit is a key internal
control to ensure no single person is responsible for a transaction ‘end-to-end’. In the
Rwanda PFM system, segregation of duties is prescribed in the OBL, the financial
management and accounting regulations, and in the accounting and procedure manuals
as amended from time to time. The Budget Officer ensures budget commitments are
respected, the accountant records transactions, while the Director of Finance and
Administration (DAF), and ultimately, the CBM authorizes payments. Also, the
accountants prepare periodic (monthly) reconciliations (cashbook, bank accounts, etc.);
the DAF verifies or approves (to their limits); and the CBM signs-off with authorization.
Audit is conducted by an independent internal audit function that reports to the entity
Audit Committee and the GCIA as well as the OAG external audit. There are no reported
incidences of ‘system overrides’ identified in the literature reviewed (OAG reports, GCIA
reports, etc.).
Dimension rating = A
25.2 Effectiveness of expenditure commitment controls
The Chief Budget Managers (CBMs) are accountable for the implementation of
expenditure commitment controls under the Public Entities (PE) they manage. As noted
in dim (i) above, there is clear segregation of duties at the PEs – where the budget officer
deals with commitments and the accountant maintains accounting records – all reporting
through the DAF. Each PFM role at a PE, is prescribed within a policy legal framework
(the OBL, Ministerial Instructions and Procedure Manuals).
Very little expenditure is made outside the IFMIS. Budgets and cash limits are managed
and reported on a quarterly basis, with agreed ceilings that are rarely breached. The PE
has full access to the IFMIS and is restricted to spending within the limits established.
Whilst the budget officer maintains commitment and payment records on the IFMIS; the
accountant prepares payments and maintain accounting records – where payments are
largely made directly into bank accounts. Expenditure is authorized by the DAF and the
relevant CBM. Expenditure is legitimately made in line with existing finance and
accounting procedure manuals, ensuring that ex-ante controls are adhered to.
The requirement for both ex-ante and ex-post controls and audit are strong. IA staff are
based in all PEs, with a reporting line to both the PE’s Audit Committee as well as to the
GCIA. IA staff conduct risk-based audits in line with approved annual audit plans –
reviewing expenditure and adherence to budget commitments. Also, the OAG also
reviews budgetary compliance in those PEs the office audits. As a result, there are strong
commitment controls in place that limit expenditure to actual cash availability and within
approved budget allocations.
Dimension rating = A
25.3 Compliance with payment rules and procedures
The degree of compliance with rules for processing and recording transactions has
strengthened, according to the audit reports – both internal and external – that the
Assessment Team reviewed: this may reflect improved PFM capacity at budget agencies.

Rwanda PEFA Assessment, Upgraded Framework 2016
73
Non-compliance is increasingly met with stronger consequences for CBM and other PFM
staff, that may end with public hearings at the PAC of Parliament. Public sector
expenditure is largely conducted through public tenders to ensure economy, efficiency,
effectiveness and value for money. Budget agencies are required to have and adhere to
annual approved procurement plans; this feeds into quarterly budget execution reports
and approved quarterly cash flow plans. Public servants are required to adhere to the
prescribed control environment, and any variations are followed up and acted upon.
Although compliance has clearly improved since the last PEFA, both the OAG and the
GCIA continue to report some weaknesses. Simplified or emergency procedures are
used occasionally, but are justified.
Dimension rating = B
PI-25 Dimension Score Justification
Internal controls on nonsalary
expenditure
A Scoring Method M2
25.1 Segregation of duties A Appropriate segregation of duties exists throughout the process, in accordance with the OBL, which specifies clear responsibilities.
25.2 Effectiveness of expenditure commitment controls
A Expenditure commitment controls remain in place that effectively limit commitments to actual cash availability and approved budget allocations.
25.3 Compliance with payment rules and procedures
B The degree of compliance is good and is improving but some variations do occur and are reported.
Ongoing reforms
Following the new OBL, Ministerial Instructions are being drafted to determine the
specific responsibilities of the Government Chief Internal Auditor.
PI-26 Internal audit
This indicator examines the operation of internal audit standards and procedures. GoR
has decentralized Internal Audit (IA) to MDAs and Districts, each of which has an Audit
Committee (AC). There is a central IA Unit at MINECOFIN responsible for monitoring,
reporting on, and training staff of the decentralized IA units.
26.1 Coverage of internal audit
The “Government Principal Internal Audit Unit (GPIAU)”, is responsible for monitoring,
reporting, and training staff of the decentralized IA units. It is composed of 17 staff (nine
at the time of 2010 PEFA) of which three, including its head, the Government Chief
Internal Auditor, are qualified accountants either with or working towards a ‘Certified
Internal Auditor’ designation. Within the staff establishment, five are focused on central
government entities; five on the Districts; four comprise the inspection team; one is in
charge of governance, quality assurance and the effectiveness of Audit Committees
(ACs); the team is led by the Chief Internal Auditor with an administrative assistant.
IA personnel at placed at each government entity: over 160 at central government
entities, and going forward, the number will increase from 2 to 3 at each District (90 IA
Staff). The function has been greatly strengthened by the new OBL, including the
mandated establishment and role of Audit Committees across all entities. The law
empowers the CIA to: coordinate all internal auditors nationally; move into any entity to
conduct an audit; use existing staff to focus on areas of audit interest; and influence the
audit program of any government entity.
Dimension rating = A

Rwanda PEFA Assessment, Upgraded Framework 2016
74
26.2 Nature of audits and standards applied
The function uses the ‘International Professional Practices Framework (IPPF)’ for internal
audit issued by the Institute of Internal Auditors. It has an Internal Audit Procedure
Manual; a Handbook for Audit Committees (with both an Audit Charter and an Internal
Audit Charter); a set of audit templates in line with the IPPF in soft form; has launched a
‘General Audit Program’ that entities can customize in consultation with their respective
Audit Committees; and is implementing a “Five Year Strategic Plan for 2013 – 2018.”
New staff are routinely trained on the basics (induction training) and progress to
undertake aligned professional courses – 42 internal audit staff are at various stages of
training on accounting qualifications as well as the CIA designation.
The function has a presence at each entity and employs the ‘risk-based’ approach
elaborated in the Manual and the templates used by audit staff. Audit Committees
approve the respective audit plans and reports – all copied to the GCIA, who reserves the
decision to act to influence the mitigation of identified risks and rectify weakness. The
‘Teammate’ software introduced in 2013 has not been successfully utilized – it is limited
to 50 licenses at central government level until its value is visible to the sub-national
governments and an appropriate change management process is put in place. Although
there are no clear cases reported, independence is likely to be impaired by the nature of
recruitment, staff appraisal and right to dismiss at the individual entity level. The function
intends to strengthen this through draft regulations to be issued through a MO and
expected to be functional by June 2016. The current setup and mission of the Internal
Audit Function is edging closer to a modern and effective Internal Audit – with the
increasing possibility that the OAG will rely more on its reports: Its effectiveness will do
much to inculcate a more sustainable culture of accountability and professionalism.
Dimension rating = B
26.3 Implementation of internal audits and reporting
Each IA unit submits its annual plan to the AC, copied to the GCIA. The GCIA provides
advice and comment on these plans where necessary, and monthly and quarterly reports
to individual ACs are copied to the GCIA, who in turn, consolidates them into a quarterly
report to the Minister to highlight any crosscutting internal control issues. Through this,
the GCIA is able to track the IA function across GoR.
While there is no formal mechanism to monitor and report on implementation of individual
audit plans, each MDA or District AC does receive routine reports and these are copied
to the GCIA, who monitors and reports (to the Minister) on progress and has confirmed
that most programmed audits are completed.
Dimension rating = C
26.4 Response to internal audits
In the period since the last PEFA, PFM reforms to strengthen internal audit appear to
have borne results. As a result of a strengthened GCIA and the establishment of Audit
Committees across budget agencies, audit recommendations are increasingly
implemented and reported on. The GCIA as well as the OAG track and report on how the
percentage of recommendations implemented across budget agencies. At the time of this
assessment, this averaged 70% of recommendations implemented – with a stronger
compliance at central government.
The OAG has reported a steady improvement in the implementation of audit
recommendations from a low base of 60% (2006) to 73% (2011); 75% (2012); and 79%
(2013). The latest CIA quarterly report (31st March 2015) puts compliance at 70%. Some
entities have routinely achieved 100% implementation (such as MIFOTRA, MINEDUC,

Rwanda PEFA Assessment, Upgraded Framework 2016
75
MINISANTE and MINADEF), while some are lagging mainly as a result of short-term
staffing issues. Samples of Internal Audit Matrices confirm management commitment
towards corrective actions, timeframes and sign-offs. The CIA, acting through
MINECOFIN, issues reminders to entities lagging behind in the implementation of major
and crosscutting recommendations to implement all recommendations in their totality –
this, together with a culture of Audit Committees (established via MO No 004/09/MIN),
has reinforced compliance in the last three years.
Dimension rating = C
PI-26 Dimension Score Justification
Internal audit C+ Scoring Method M1 26.1 Coverage of internal audit A Internal Audit is operational at all government
entities.
26.2 Nature of audits and standards applied
B Internal audit in MDAs follow audit plans (approved by Audit Committees and copied to the GCIA) and are focused on evaluations of the adequacy and effectiveness of internal controls.
26.3 Implementation of internal audits and reporting
C While IA is decentralized to MDAs and Districts, the GCIA monitors the implementation of individual plans of IA units.
26.4 Response to internal audits
C Implementation of audit recommendations at budget agencies averaged 70% in the 31
st
March 2015 GCIA quarterly report, but there is a growing number of MDAs implementing 100%.
Ongoing reforms
The ongoing reforms are designed to strengthen the culture and practice of Internal
Audit. There is emphasis on strengthening the risk-based approach at PE level through
deeper training and professional certifications. There are plans to increase internal audit
staff at district level from 2 to 3 as well as re-launching the use of internal audit software
at the subnational level (was suspended because of inadequate change management
preparation). There are plans to strengthen the skillsets for PE Audit Committees in order
to enhance the effectiveness of their role. The GCIA is expected to issue through the
Minister of Finance new internal audit regulations to strengthen the function at entity
level, including the independence of internal auditors.

Rwanda PEFA Assessment, Upgraded Framework 2016
76
Pillar VI. Accounting, Recording and Reporting
PI-27 Financial data integrity
Reliable reporting of financial information requires a system of consistent checking and
verification of accounting records and practices as a critical part of internal controls to
ensure quality decision-making information. Under the Rwanda PFM system, there is a
strong requirement to comply with the requirements of the OBL, the regulations and the
accounting and financial management manual that underpin the integrity of financial data.
27.1 Bank account reconciliation
GoR operates a zero balance accounting system with a Single Treasury Account (STA)
and records indicate there were 1,136 bank accounts (184 for MDAs and 734 for
Projects) in operation at the time of assessment. The treasury cash book records all
receipts and expenses onto the STA. Information on expenditure (at least 80% of the
expenditure) and receipts (such as Treasury Bills, bonds, letter of credit, etc.) processed
centrally is recorded into the cashbook and processed through the National Bank of
Rwanda (BNR).
Bank reconciliation for all active bank accounts in budget agencies is conducted monthly
and signed off for reporting to MINECOFIN by the 15th of the following month (within two
weeks of month-end). The assessment team was able to observe the public accounts
office track bank reconciliations completed through the IFMIS. The budget execution
reports submitted to MINECOFIN include among other things, a bank and cashbook
reconciliation report as an annex. The sign-off by the senior management (both the DAF
and CBM) of the budget agency ensures that issues identified are resolved. At the time of
the assessment, most budget agencies were conducting bank reconciliations twice a
month as tracked on the IFMIS. The responsibility for bank reconciliations of individual
bank accounts lies with budget agencies and is widely complied with. Bank reconciliation
for all central government bank accounts takes place monthly, at aggregate level and
detailed levels, usually within 2 weeks from the end of the month.
Dimension rating = B
27.2 Suspense accounts
There are no suspense accounts operated under the Rwanda PFM system. Travel
expenses are promptly expensed and the responsibility to reconcile unutilized travel
allowances lies with the budget agency and its internal practices. There no reported
variations in either GCIA or OAG reports.
Dimension rating = NA
27.3 Advance accounts
Travel allowances are provided for authorized mission days and expensed. Where
budget agencies operate an imprest (petty cash), this is reconciled and signed off
monthly and reported as an annex to the monthly budget execution report.
Advance payments under public procurement are usually secured with guarantees and
are administered within the procurement rules.
Dimension rating = A
27.4 Financial data integrity processes
The Rwanda PFM system is heavily dependent on the IFMIS, which was developed in-
house system and has evolved over time. Access to the IFMIS is restricted and driven by
user requirements. Levels of access are documented, ranging from a ‘read-only’ basis, to
user with rights to interact with IFMIS at a deeper level (create, modify or report), but

Rwanda PEFA Assessment, Upgraded Framework 2016
77
these result in an ‘audit trail’ on the system. Although there is no identifiable (formal)
IFMIS oversight body, there is strong political support as well as collaboration at lead-
user level where requirements are articulated.
Dimension rating = B
PI-27 Dimension Score Justification
Financial data integrity B+ Scoring Method M2
27.1 Bank account reconciliation
B Bank reconciliations for all CG bank accounts takes place monthly, at aggregate and detailed levels, usually within 2 weeks from the end of the month.
27.2 Suspense accounts NA No suspense accounts are operated.
27.3 Advance accounts A Imprest accounts operated at budget agencies are reconciled and reported to on in the monthly budget execution report within two weeks following month-end.
27.4 Financial data integrity processes
B Access and changes to records are restricted and recorded.
Ongoing reforms
There are efforts to strengthen the IFMIS and improve reporting in the PFM System. An
IFMIS review is underway to determine the course for the next version. The current PFM
Sector Strategic Plan identifies IFMIS and other mission-critical systems as foundational
issues to be at the heart of the next reform efforts. Even the current version of IFMIS, has
challenges in extracting ad hoc data. MINECOFIN and the Central Bank have embarked
on an initiative to create an automatic link between the IFMIS and the Central Banking
System that will ensure that data is shared between the two systems so that bank
reconciliations can be carried out on a more regular basis.
PI-28 In-year budget reports
28.1 Coverage and comparability of reports The classifications of data in the reports allow a comparison between estimates and
actual in these areas: overall revenue performance; realization of external inflows;
performance of major (recurrent) economic items of expenditure; public debt; and arrears.
The reports are monitored on IFMIS, and the Assessment Team was able to review a
sample on-line and confirm that budget execution by ministry and program provides a
detailed analysis for the Government to monitor budget implementation and utilization of
funds released for both current and future planning. In addition, reports provide a
narrative on spending taking place during the quarter, to highlight what has taken place
during that period.
Dimension rating = A
28.2 Timing of in-year reports
Article 65 of the OB makes it clear that all public entities are to prepare and submit
quarterly budget execution reports to the Minister of Finance, and likewise public
institutions are to submit quarterly budget execution reports after approval by the relevant
competent authority. Also, on a quarterly basis, the Minister of Finance is required to
prepare and submit a consolidated budget execution report to Cabinet, and a mid-year
report to Parliament, the format and content of which are to be prescribed in the Financial
Regulations: at the time of assessment, these remain ‘work in process’, and the law is
silent on the timing of the submission of this report. The quarterly reports have not been
provided and the team concluded that they are not issued.
Dimension rating = D

Rwanda PEFA Assessment, Upgraded Framework 2016
78
28.3 Accuracy of in-year budget reports
As in previous years, budget agencies had various mis-postings in their financial
statements but MINECOFIN allowed them to adjust and correct these before signing
audit reports. According to the OAG, adjustments during audit were made for a majority
of budget agencies, which suggests that monthly budget execution reports are unreliable,
and hence that budget tracking by MINECOFIN does not provide an accurate reflection of
the real position.
Some entities budgeted for activities under incorrect budget lines while other entities view
mis-postings as a consequence of delayed funds release by Treasury, which forces them
to utilise available funds – from alternative budget lines – to implement activities.
Management in budget agencies did not perform adequate review of monthly financial
reports and budget utilization reports to identify and facilitate timely correction of mis-
postings during the year. Nevertheless, these concerns do not fundamentally undermine
the basic usefulness of the reports.
Dimension rating = C
PI-28 Dimension Score Justification
In-year budget reports D+ Scoring Method M1
28.1 Coverage and comparability of reports
A Classification of data allows comparison to original budget for all items of expenditure.
28.2 Timing of in-year reports D No evidence of issuance of quarterly reports.
28.3 Accuracy of in-year budget reports
C There are concerns over the accuracy of information in the reports, but this does not fundamentally undermine the basic usefulness.
Ongoing reforms
The Financial Regulations under the 2013 OBL are in development and will detail timing
and other good practices for budget execution and reporting.
PI-29 Annual financial reports
This indicator assesses the ability to prepare year-end financial statements in a timely
fashion. Article 67 of the OBL provides the legal framework for the preparation of the
annual financial statements – which are supposed to provide full disclosure of all
government revenue, expenditure, assets and liabilities as well as a statement of
cashflow – by the Minister, for external audit by the OAG.
29.1 Completeness of annual financial reports The annual financial statements prepared and submitted by the AccGen to the OAG only
reflect transactions emanating from the Consolidated Fund, and present an
amalgamation of the financial position of MDAs. As shown in Table 3.23 below, not all
financial information is reported on by the AccGen, but the reports are comparable with
the approved budget.
The annual Consolidated Financial Statements (CFSs) cover all MDAs and other budget
entities. OAG issued a ‘disclaimed’ opinion on the CFS for the previous three years, but
noted an improvement for FY 2013/14, with an increase in the number of public entities
receiving unqualified reports from 34% in FY 2012/13 to 36%. The OAG also notes that
although this number is still small compared to all entities audited, it does suggest that
the culture of providing proper and adequate accountability for public funds is taking root
in some public entities.

Rwanda PEFA Assessment, Upgraded Framework 2016
79
The OAG also reports significant accounting errors in the CFSs, where balances
approved by Cabinet in September 2014 were adjusted to correct errors identified during
the audits of individual budget agencies before audit reports were signed. The extent of
these errors was a decrease in expenditure of RwF 15,376,536,520 in the adjusted
CFSs, compared to balances in the version approved by Cabinet.
Table 3.21: Information Contained in the Accountant General Financial Statements
Financial heading Sub-financial heading Presence in Financial
Statements
Revenue Direct tax Yes
Indirect tax Yes
Non-tax revenue (incl. IGF) Yes
Grants Yes
Expenditure & transfers Personnel Emolument Yes
Administration Yes
Service Yes
Investments Yes
Statutory payments Yes
Subsidies Yes
Retained IGF No
DP funded projects Yes
Assets Cash & Bank balances Yes
Advances Yes
Public loans (receivable) Yes
Equity & other investments Yes
Revenue arrears No
Liabilities Public debts (domestic) Yes
Public debts (foreign) Yes
Statutory obligations Yes
Expenditure arrears Yes
Dimension rating = C
29.2 Submission of reports for external audit
Article 66 of the OBL requires each budget agency/MDA to submit its accounts to
MINECOFIN within three months of the end of fiscal year. In turn, Article 67 requires the
Minister of Finance to submit the public accounts, including those of individual budget
agencies/MDAs (as well as SN governments and GBEs) i.e. the CFS to the OAG by the
same date. In each of the FYs under review (2013/14, 2012/13 and 2011/12, the CFS
and the public accounts of Central Government budget agencies, were submitted to the
OAG within 3 months after the end of the FY, as required by law.
Table 3.22: Timeliness of Submission of AFS by AG to OAG
Financial Year Financial Statements for: Date of Submission to OAG
FY2011/2012 Consolidated Fund 28 September, 2012
FY2012/2013 Consolidated Fund 27 September, 2013
FY2013/2014 Consolidated Fund 29 September, 2014
Source: MINECOFIN/Accountant General’s Office Dimension rating = A

Rwanda PEFA Assessment, Upgraded Framework 2016
80
29.3 Accounting standards
The CFSs are prepared according to the modified cash basis of accounting as defined by
the International Accounting Standards Board (IASB). Although the intention is to adhere
and comply, with the extent possible, to International Public Sector Accounting Standards
(IPSAS), this has not been fully attained and omissions are very common, as stated by
the OAG. For example, not all the 2013/14 financial statements contain a consolidated
cashflow statement supported by detailed segmental reporting: i.e. financial information
on government business enterprises (GBEs) and sub-district entities is disclosed in the
notes to the CFS but their flows and cash balances are not reflected in the consolidated
cashflow statement. Also, other government entities, notably: (i) Central Treasury and the
RRA; (ii) other MDAs; (iii) development projects; and (iv) Districts, are said to have their
cashflow supported by detailed reporting; however, their financial statements cannot yet
be described as compliant with cash-basis IPSAS.
According to the OAG reports, there are omissions in the disclosure of these items in
each of the three years, which also implies that the statement of expenditure and income
in the accounts is incorrect. This leads the assessment team to conclude that the
requirements of the modified cash basis of accounting as per national standards, as well
as IPSAS, are not met in other important respects.
Dimension rating = C
PI-29 Dimension Score Justification
Annual financial reports C+ Scoring Method M1
29.1 Completeness of annual financial reports
C There are persistent weaknesses in CFS and entities still have errors in their books of accounts. The entities with adverse or qualified audit reports are however dropping.
29.2 Submission of reports for external audit
A Submission of CFS have been timely and strictly within three months of the end of the FY.
29.3 Accounting standards C While the CFS are presented in consistent format, the requirements of IPSAS and national accounting standards are still not met.
Ongoing reforms
There is an on-going exercise to update the financial regulations, including the possibility
of applying IPSAS standards to general government. Also, MINECOFIN has completed a
road map towards progressive compliance to IPSAS standards by FY 2016/2017, while
full accrual based financial accounts could be reached by 2020.

Rwanda PEFA Assessment, Upgraded Framework 2016
81
Pillar VII. External Scrutiny and Audit
PI-30 External audit
This indicator assesses the quality of the external audit in terms of the scope and
coverage of the audit, adherence to appropriate audit standards (including independence
of the external audit institutions), the focus on significant and systemic PFM issues in its
reports, and the performance of a full range of financial audits, such as the reliability of
financial statements, the regularity of transactions and the functioning of internal control
and procurement systems. The assessment covers the central government institutions
including all MDAs and extra-budgetary funds (where they exist). The timeliness of
submission of audit reports to the legislature is also important in ensuring timely
accountability of the executive to the legislature and the public, much as it is for a timely
follow up of the external audit recommendations. The assessment covers the central
government institutions including all MDAs, and extra-budgetary funds (where they exist)
and focuses on the last audited financial year, FY2013/14.
30.1 Audit coverage and standards
The OAG coverage of financial audits has continued to grow vertically and horizontally
over time. In FY 2013/14, the coverage passed the target and reached 81% of total
Government expenditure. Over and above annual coverage of all MDAs, including
Districts, the OAG now audits the State CFS and an increased number of GBEs and non-
budget agencies, covering annual revenue, expenditure and assets/liabilities. Financial
audits scrutinize accounting and Corporate Governance issues, financial and contract
management as well as value for money issues, using INTOSAI standards to highlight
significant issues.
The OAG has been a member of INTOSAI (and AFROSAI) for the past twelve years, and
the financial audit methodologies applied conform to international standards: they are
based on systematic risk assessments, an annual audit plan and sound sampling
techniques with the assistance of audit-specific computerized techniques such as IDEA.
The audit is focused on systemic issues. The OAG, as the Supreme Audit Institution is in
constant touch with AFROSAI-E and has participated in recent training events covering:
management development; audit supervision and review; and, performance audit. Also,
in order to monitor progress in compliance with international standards, AFROSAI-E
carried out an ‘Institutional Capacity Building Functions’ assessment in October 2014 and
a report was submitted to OAG for action.
The OAG issues audit reports annually according to the law, in five volumes:
Volume I: provides an Executive Summary of the Annual Report;
Volume II: the State Consolidated Financial Statements that are audited;
Volume III: key findings from audits of Districts and City of Kigali;
Volume IV, PART 1: key findings from audit of MDAs, other Central Administration
entities and projects;
Volume IV, PART 2: key findings from audit of Boards and GBEs; and
Volume V: summary of key findings from Performance audits and Special
assignments.
Dimension rating = B
30.2 Submission of audit reports to legislature
Article 67 of the OBL instructs the Minister of Finance to submit consolidated financial
statements to the Auditor-General not later than 30 September of the following fiscal
year, and this has been adhered to. The OAG is then required to submit the Audit Report

Rwanda PEFA Assessment, Upgraded Framework 2016
82
to Parliament not later than 30 April. For the past three completed audits, the OAG
submitted the Report on the CFSs to Parliament as shown in Table3.23 below:
Table 3.23: Schedule of date of receipts of Audited Reports by Parliament
Name of Audit Report Date of receipt by Parliament
2011/2012 2012/2013 2013/2014 State Consolidated Financial Statements 11 May 2013 30 April 2014 30 April 2015
Local Governments (City of Kigali and Districts) 11 May 2013 30 April 2014 30 April 2015
Ministries and other Central Administration Entities and Projects 11 May 2013 30 April 2014 30 April 2015
Performance Audit 11 May 2013 30 April 2014 30 April 2015
Government Boards and Business Enterprises
Rwanda Social Security Board (RSSB) - - 30 April 2015
Rwanda Revenue Authority (RRA) - - 30 April 2015
Electricity Water Supply and Sanitation Authority (EWAS) - 30 April 2014 30 April 2015
Rwanda Education Board (REB) - - 30 April 2015
National Agriculture Export Board (NAEB) - 30 April 2014 30 April 2015
Rwanda Broadcasting Agency (RBA) 11 May 2013 - 30 April 2015
Rwanda Utilities Regulatory Authority (RURA) 11 May 2013 - 30 April 2015
However, the rating of this dimension is based on the timing of the last report submitted
to the legislature, which is within 8 months of the OAG receiving the CFSs.
Dimension rating = C
30.3 External audit follow-up
The OAG reports include an assessment of the audited agencies that implemented audit
recommendations from the previous year. Article 69 of the OBL requires each CBM and
Director of public bodies to implement recommendations of the Auditor-General aimed at
improving the effective management of finances under their control. As such, many
budget entities track implementation of audit recommendations through an action plan,
whose status is reported to MINECOFIN as an attachment to the monthly financial
statements. This is a notable improvement, since the tracking reports are signed by the
CBM as evidence of their responsibility: this is acknowledged in the OAG report, and
should ensure that issues are addressed in a timely manner. Mechanisms are being put
in place to identify the causes for any entity failing to reach its targets, and for specific
follow-ups to be taken to facilitate the necessary improvements.
Although the OAG reports that only a proportion of previous year’s recommendations are
fully implemented, the majority of the shortfall lies with a few budget entities, namely,
Universities, GBEs and Boards.
Dimension rating = C
30.4 SAI Independence
The independence of the SAI is demonstrated by the arrangements for the appointment
(and removal) the head of the SAI, non-interference in the planning and implementation
of the SAI’s audit work, and in the approval and disbursement procedures for the SAI’s
budget. Table 3.24 below assesses each of these elements as per the law and practice in
Rwanda, which are designed in accordance to the core elements of INTOSAI standards.

Rwanda PEFA Assessment, Upgraded Framework 2016
83
Table 3.24: adherence to core elements of INTOSAI standards
INTOSAI Standards Adherence of external audit practices to INTOSAI standards AG Independence i.e. appointment, termination, salary
Yes, partly. By Article 183 as Amendment n° 04 of 17/06/2010 of 2003 Constitution, the Office of the Auditor-General of State Finances is an independent public institution responsible for the auditing of state finances and property. By article 13 of law N° 79/2013 of 11/09/2013 of OAG, the Auditor-General is appointed by the Presidential but approved by the Senate as stated by Article 88 of the 2003 Constitution. After the appointment, the Auditor-General takes the oath of office before the President of the Republic in the presence of both Chambers of Parliament meeting in joint session. By article 13 above, the Auditor-General is appointed for a five (5)-year term renewable only once. Article 17 of the OAG law indicate that the removal from office shall be made through a Presidential Order and notified to both Chambers of the Parliament (Senate and Chamber of Deputies). However, the salary and other benefits of the A-G are determined by Presidential Order, and are not a direct charge on the consolidated fund determined by Parliament.
Financial Independence of OAG and Staffing Arrangements
No. Although by article 3 of law N° 79/2013 of 11/09/2013, OAG does its own staff recruitment to fill in vacant positions once its annual budget has been passed, the financial independence of the OAG is undermined by the fact that he has to apply for funds like the other MDAs and its budget proposal has to be scrutinized by MINECOFIN before the Parliament approves it. Also, OAG receives budget ceilings from MINECOFIN for budget preparation and needs to defend its budget during the budget hearing process. There may be delays in cash releases from MINECOFIN (as for any other GoR entity) that may adversely affect OAG performance. That said, in discharging its responsibilities, the OAG does exercise independence without receiving any injunctions from other organs of state.
Access to Public Records
Yes. By the OAG law N° 79/2013 of 11/09/2013, article 7, the Auditor-General has the extensive right to question people, to have all the relevant and needed documents, electronic documents and information and any other information related to finance management deemed necessary for the performance of his/her duties. The law makes it clear that a person shall not invoke professional secrecy to withhold information required by the Auditor-General for audit purpose and the Chief Budget Manager within the audited entity must do his/her best to facilitate the Auditor-General to have full access to accounting documents and property records within the time limits. The same article says that the Auditor-General has a right to ask any person other than a staff member of the entity being audited to provide information necessary for the performance of his/her duties.
Independence in Preparation of Annual Audit Work Plan
Yes. Article 4 of OAG of law N° 79/2013 0f 11/09/2013 requires the OAG to submit to the Speaker, Chamber of Deputies an audit plan within a period not exceeding thirty (30) days following the receipt of the financial statements for the previous fiscal year. The PEFA team met with OAG and established that the workplan submitted to the chamber is independent from the executive.
Dimension rating = D
PI-30 Dimension Score Justification
External audit D+ Scoring Method M1
30.1 Audit coverage and standards
B OAG uses INTOSAI standards when auditing CFS, and covers most government revenue and expenditure, assets and liabilities: this has been the practice for the last three FYs.
30.2 Submission of audit reports to the legislature
C OAG has submitted the audit reports to the legislature within 8 months.
30.3 External audit follow-up C OAG reports that only a proportion of previous year’s recommendations are fully implemented.
30.4 SAI Independence D While many of the requirements are met, financial independence is not: the OAG’s budget is controlled by MINECOFIN
Ongoing reforms
In general, the Government supports the independence of the OAG as can be seen by
the enactment of a bill into law on 11/11/2013 (No 79/2013) for this purpose. This law
enhances the independence and autonomy of the Office and has enabled OAG to comply
further with the requirements of ISSAI 10,20,3000 and 3100, which are necessary to
attain Level 3: the established level classification of SAIs under AFROSAI-E. The OAG
plans to review the institutional set-up to align its current structure with the new Audit Act.
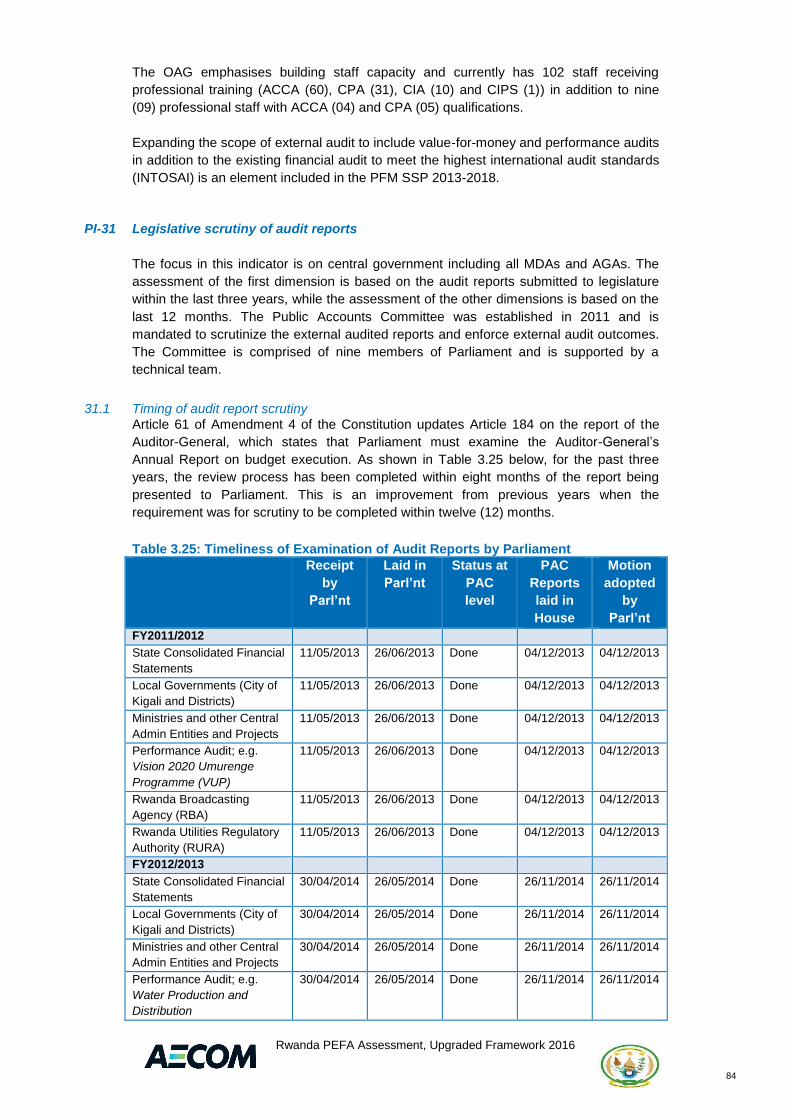
Rwanda PEFA Assessment, Upgraded Framework 2016
84
The OAG emphasises building staff capacity and currently has 102 staff receiving
professional training (ACCA (60), CPA (31), CIA (10) and CIPS (1)) in addition to nine
(09) professional staff with ACCA (04) and CPA (05) qualifications.
Expanding the scope of external audit to include value-for-money and performance audits
in addition to the existing financial audit to meet the highest international audit standards
(INTOSAI) is an element included in the PFM SSP 2013-2018.
PI-31 Legislative scrutiny of audit reports
The focus in this indicator is on central government including all MDAs and AGAs. The
assessment of the first dimension is based on the audit reports submitted to legislature
within the last three years, while the assessment of the other dimensions is based on the
last 12 months. The Public Accounts Committee was established in 2011 and is
mandated to scrutinize the external audited reports and enforce external audit outcomes.
The Committee is comprised of nine members of Parliament and is supported by a
technical team.
31.1 Timing of audit report scrutiny
Article 61 of Amendment 4 of the Constitution updates Article 184 on the report of the
Auditor-General, which states that Parliament must examine the Auditor-General’s
Annual Report on budget execution. As shown in Table 3.25 below, for the past three
years, the review process has been completed within eight months of the report being
presented to Parliament. This is an improvement from previous years when the
requirement was for scrutiny to be completed within twelve (12) months.
Table 3.25: Timeliness of Examination of Audit Reports by Parliament Receipt
by
Parl’nt
Laid in
Parl’nt
Status at
PAC
level
PAC
Reports
laid in
House
Motion
adopted
by
Parl’nt
FY2011/2012
State Consolidated Financial
Statements
11/05/2013 26/06/2013 Done 04/12/2013 04/12/2013
Local Governments (City of
Kigali and Districts)
11/05/2013 26/06/2013 Done 04/12/2013 04/12/2013
Ministries and other Central
Admin Entities and Projects
11/05/2013 26/06/2013 Done 04/12/2013 04/12/2013
Performance Audit; e.g.
Vision 2020 Umurenge
Programme (VUP)
11/05/2013 26/06/2013 Done 04/12/2013 04/12/2013
Rwanda Broadcasting
Agency (RBA)
11/05/2013 26/06/2013 Done 04/12/2013 04/12/2013
Rwanda Utilities Regulatory
Authority (RURA)
11/05/2013 26/06/2013 Done 04/12/2013 04/12/2013
FY2012/2013
State Consolidated Financial
Statements
30/04/2014 26/05/2014 Done 26/11/2014 26/11/2014
Local Governments (City of
Kigali and Districts)
30/04/2014 26/05/2014 Done 26/11/2014 26/11/2014
Ministries and other Central
Admin Entities and Projects
30/04/2014 26/05/2014 Done 26/11/2014 26/11/2014
Performance Audit; e.g.
Water Production and
Distribution
30/04/2014 26/05/2014 Done 26/11/2014 26/11/2014

Rwanda PEFA Assessment, Upgraded Framework 2016
85
National Agriculture Export
Board (NAEB)
30/04/2014 26/05/2014 Done 26/11/2014 26/11/2014
Electricity Water Supply and
Sanitation Authority (EWAS)
30/04/2014 26/05/2014 Done 26/11/2014 26/11/2014
Rwanda Broadcasting
Agency (RBA) 30/04/2013 26/05/2014 Done
26/11/2014 26/11/2014
FY2013/2014
State Consolidated Financial
Statements
30/04/2015 11/05/2015 In progress Not yet Not yet
Local Governments (City of
Kigali and Districts)
30/04/2015 11/05/2015 In progress Not yet Not yet
Ministries & other Central
Admin Entities & Projects
30/04/2015 11/05/2015 In progress Not yet Not yet
Performance Audit; e.g.
Electricity Access Rollout
Programme
30/04/2015 11/05/2015 In progress Not yet Not yet
National Agriculture Export
Board (NAEB)
30/04/2015 11/05/2015 In progress Not yet Not yet
Electricity Water Supply and
Sanitation Authority (EWAS)
30/04/2015 11/05/2015 In progress Not yet Not yet
Rwanda Revenue Authority 30/04/2015 11/05/2015 In progress Not yet Not yet
Rwanda Social Security
Board (RSSB)
30/04/2015 11/05/2015 In progress Not yet Not yet
Rwanda Education Board
(REB)
30/04/2015 11/05/2015 In progress Not yet Not yet
Rwanda Broadcasting
Agency (RBA)
30/04/2015 11/05/2015 In progress Not yet Not yet
Source: Parliament: Accounts Committee Official Records
Dimension rating = C
31.2 Hearings on audit findings
Since the establishment of a PAC 2011, Parliament examines the Auditor-General’s
report on public accounts. The practice is that public entities with significant issues
highlighted in the Auditor-General’s report are selected for scrutiny and hearings. For
example, MoF provided letters from Parliament to the prime minister to call Government
agencies to budget hearings with specific queries to be addressed
PAC hearings and scrutiny of the OAG’s reports on public accounts are covered live on
Parliamentary radio and sometimes on national television. PAC invites cabinet ministers,
Directors-General of boards, Commissioners-General, and any other officer(s) linked to
audit findings for questioning. The timeliness and conclusiveness of PAC's hearings on
audited public accounts is satisfactory and done within the provisions of the law as
evidence shown in Table 3.25 above.
Dimension rating = A
31.3 Recommendations on audit by the legislature
Recommendations issued adhere to Article 184 of the 2003 Constitution, which states:
the institutions and public officials to which a copy of the annual report of the Auditor
General is addressed are obliged to implement its recommendations by taking
appropriate measures in respect of the irregularities and other shortcomings which were
disclosed. Accordingly, the PAC prepares a report of its scrutiny of the Auditor-General’s
annual report and makes recommendations which are presented to the plenary session
of the Chamber. During the year, the Chamber of Deputies provides oversight to ensure
that recommendations are being implemented, including conducting field visits: the
assessment Team reviewed a field report from September/October 2014 which provided

Rwanda PEFA Assessment, Upgraded Framework 2016
86
an update on the status of open audit recommendations. In addition, the Team, through
interviews and reviews of Audited Financial statements for FY 2011/12, FY 2012/13, and
FY 2013/14, discovered that some recommendations were implemented. This is indeed
in conformity with OAG report 2013/14 that about 60% of the audit recommendations
were implemented.
Dimension rating = B
31.4 Transparency of legislative scrutiny of audit reports
The PAC is very active with regard to transparency and openness in its scrutiny and in-
depth hearings and proceedings in the committee room. This has been possible because
there is now a full-time radio station for the parliament and occasionally the national TV
covers the hearings: hence the general public has the opportunity to be informed about
the work of the PAC in completing the accountability loop. The PAC presents its report to
Parliament for debate and resolutions are signed off by the speaker, and submitted to the
Executive (Prime Minister).
Dimension rating = A
Ongoing reforms
The PAC is considering proposals that would see more harmonisation with rules of the
East African Community (EAC) States that include having powers of the high court in the
activities the PAC.
Providing technical support to parliamentary committees on budget and public accounts
for effective scrutiny is an element included in the PFM SSP 2013-2018.
PI-31 Dimension Score Justification
Legislative scrutiny of audit
reports
B+ Scoring Method M2
31.1 Timing of audit report scrutiny
C All the audited public accounts for the period under review have been fully examined and adopted by the Legislature, within 8 months from receipt of the reports.
31.2 Hearings on audit findings A Parliament has been consistent in the scrutiny of audited public accounts submitted by the Auditor-General. It has conducted in-depth hearings covered by radio and national television coverage and by senior officials /ministers and alike linked to audit findings.
31.3 Recommendations on audit by the legislature
B The PAC recommends actions to be taken, and those endorsed by Parliament are formally issued to the executive for action. The PAC keeps track of follow-up actions and conducts field visits. Nonetheless, not all recommendations are implemented.
31.4 Transparency of legislative scrutiny of audit reports
A All hearings are conducted in public (except security organs). Committee reports are debated in the full chamber of legislature and published on official website.

Rwanda PEFA Assessment, Upgraded Framework 2016
87
4 Conclusions of the analysis of PFM systems
4.1 Integrated assessment of PFM performance
Budget reliability
Over the three years covered by this assessment, (2011/2012 – 2013/2014) the Rwanda
PFM system has produced a credible budget. While total expenditure outturn variation
did exceed 10% in two years, the composition variance by economic classification is
good (rated ‘B’), and the comparison of revenue estimates to actual outturns is also good
(PI-3, rated ‘B+’), as collections regularly meet and even exceed targets, especially tax
revenues, which may be due to increased effectiveness of the Revenue Authority.
Reliable information provided by donors on both forecast disbursements and actual cash
flows has contributed to a credible national budget, although there are concerns around
the frequency of monitoring expenditure arrears (PI-22).
For several years, the BFP has set out the fiscal framework within which the GoR budget
is formulated. This framework defines standard assumptions to ensure that the basis
upon which fiscal forecasts are produced incorporate the policies set out in the EDPRS 2
and are both robust and transparent: these include aggregate ceilings for the budget, and
forecasts of the fiscal balance. A measure of the credibility of the framework produced for
the FY2015/16 budget is that the IMF note that it is in line with the ‘Policy Support
Instrument’ agreed with GoR.
Transparency of public finances
Budget documentation is comprehensive and the recently updated (and not yet formally
released) GFS 2014 classification was used for the 2015/2016 budget presented to
Parliament (PIs 4 and 5). Coverage of government operations is good (PI-6) and the
public have good access to fiscal information (PI-9), in accordance with generally
accepted good practices.
The complex structure of service delivery in Rwanda (via the several thousand non-
budget agencies beneath the Districts) means that fiscal data reported by districts (which
in any event do not capture resources received in kind) – let alone performance data – is
not available to report by type of service unit and geographical distribution for tracking
purposes: there may be performance targets for the majority of GoR services, but there
are deficiencies in the format and methods of measurement (PI-8, which is very weak).
Management of assets and liabilities
Overall, the mechanisms for monitoring fiscal risks (PI-10) are reasonable, but while
contingent liabilities arising from the guarantees provided to the national airline
(Rwandair) are recorded, those inherent in various Public Private Partnership
arrangements are not.
GoR has developed robust public investment guidelines for ensuring the selection and
approval of viable public projects for execution. The National Development Planning and
Research (NDPR) is responsible for undertaking objective economic project analysis for
approval by the Public Investment Committee (PIC). Not only do MDAs prepare project
costing during submissions of project proposals, but the NDPR also prepares complete
project costing that considers both investment cost and forward linked recurrent
expenditures. The Project Management and Monitoring Unit (PMMU) under MINECOFIN

Rwanda PEFA Assessment, Upgraded Framework 2016
88
monitors and prepares quarterly and annual project progress and financial reports for
Cabinets review (PI-11).
Even though a fixed assets management policy and framework exists, with a mandate
given to the Rwanda Housing Authority to compile and consolidate both movable and
immovable fixed assets register, it is yet to complete the process: it remains a work-in-
progress. Each MDA however, prepares a fixed asset register each year. The
Government Portfolio Unit is responsible for all government financial assets, which are
recorded but not disclosed to the public. There exists a legal framework for the disposal
of fixed assets; the practice is improving (PI-12).
The ‘Debt Management and Financial Analysis System’ (DMFAS) is used for recording
government debts, and this provides complete and accurate information on both
domestic and foreign debt. However, it does not record PPPs and implicit liabilities;
officials indicated that the National Bank of Rwanda maintains some records of
contingent liabilities. Guarantees are recorded separately in an excel datable; they
currently stand at USD 75 million. Chapter V Article 50 of the OBL No.12/2013/OL
mandates the Minister of Finance as the sole government official responsible for
borrowing on behalf of government; in practice this is adhered to. The stock of
expenditure arrears is less than 2% of total central government annual expenditure over
the last three completed fiscal years FY2011/2012 to FY2013/2014. A three-year medium
term debt strategy, updated annually, guides public borrowing (PI-13).
Policy-based fiscal strategy and budgeting
In recent years, the budget preparation process has increased in rigour, including greater
scrutiny of MDA budget requests for compliance with priorities agreed in EDPRS 2 and
there has also been a strengthening of links between strategic plans (which cover most
GoR expenditure) and forward estimates (PI-16).
There is a clear budget calendar issued by MINECOFIN to all ministries, departments
and agencies as well as district councils with timelines for each activity; these timelines
are adhered to. MINECOFIN issues clear and comprehensive cabinet approved budget
call circulars to all MDAs and District Councils, allowing at least three months for the
preparation of a meaningful budget. In last three completed fiscal years including
FY2014/2015, the legislature approved the budget before the beginning of the financial
year.
Revenue forecasting is formalized, integrated in the budget process, and sufficiently top
down to influence the allocation of expenditure across GoR priorities. The
Macroeconomic Unit makes projections to support a framework consistent with the
EDPRS and Vision 2020. Revenue forecasts are comprehensive to include all revenue
sources including domestic revenue (tax and non-tax revenue) and grants (capital and
budget support), and form part of the budget documentation sent to Parliament, with the
Medium-Term Expenditure Framework (MTEF). This includes the forecast fiscal years
and the next two years on both revenue and expenditure with explanatory notes with
notes explaining variances form the previous year’s forecasts (PI-14). Proposed policy
changes are derived through stakeholder consultations, and are based on clear
macroeconomic assumptions that are benchmarked to determine the fiscal impact.
Parliament considers and provides comments on the Budget Framework Paper (PI-18).
Sector committees scrutinize budget submissions and make recommendations to the
plenary for consideration and approval, although Parliament has no power to amend
budget estimates, recommendations are considered by the Executive and in most cases,
result in amendments to initial budget submissions. The Imihigo process ensures public

Rwanda PEFA Assessment, Upgraded Framework 2016
89
participation before Parliament has at least two months to scrutinize budget estimates,
and the bill has been approved on time each year. This process has been well
documented, and followed in each FY reviewed.
Predictability and control in budget execution
The Rwanda Revenue Authority has a functional client service department dedicated to
providing basic and sophisticated taxpayer service for easy access to tax laws,
regulations, ministerial orders and commissioner general rules. Tax laws are published
on the website. A compilation of tax laws is available for sale to the public at a very low
price. Electronic, print media and town hall tax education campaigns are carried out
regularly. Self-assessment is widely used for tax declaration; the introduction of M-
Declaration (a mobile phone declaration) has significantly improved taxpayer declaration
and payment. The department for risk management uses a computerised risk-based
taxpayer-profiling module to identify and select taxpayers for audit and fraud
investigations. This system has contributed to the recovery of huge taxes. Article 46 of
Law No.25/2005 on Tax Procedures states that tax arrears over 10 years shall be written
off, although this remains to be done, and is the biggest remaining challenge. Officials
from RRA have indicated that administrative measures are underway to ensure concrete
resolution (PI-19).
MINECOFIN received daily and monthly reports on domestic revenue collected and
transferred to the Treasury Main Account. The reports detail categories of revenue
collected and transferred; i.e. VAT, income tax, non-tax revenue, customs duties and
excise duties. Transfers from the main RRA revenue account are done daily to the
Treasury Main Account, leaving a zero balance. Transfers from RRA revenue accounts
held by commercial banks take 48 hours. Monthly revenue reconciliation is done within
two weeks following the month; the semi-annual reconciliations are effected within a
month following the period. These reconciliations involve officials from RRA and
MINECOFIN (PI-20).
The full implementation of the Treasury Single Account system has significantly improved
the consolidation of central government cash balances on a daily basis; the consolidation
of cash balances now includes balances from donor project bank accounts. MDAs and
DCs prepare annual cash flow forecast, updated quarterly on rolling basis based on
actual cash flows, and consolidated by MINECOFIN. Following the issuance of quarterly
expenditure commitment ceilings by the Minister of Finance, the Treasury Management
Committee meets twice each quarter and approves quarterly cash ceilings; these are
uploaded unto IFMIS for expenditure commitments and payments. Budget reallocations
do not take place until after six (6) months of the approval of the original budget by the
legislature. Up to 20% cumulative virements of the original approved budget of a vote
within the same budget entity is allowed; these are reported to parliament (PI-21)
All personnel records and payroll data is reconciled monthly, and there are strict controls
over IPPS, including links to budget approvals. Authorized record. Authority to change
records and payroll is restricted, and when changes are made, they are usually in time for
the next payroll, as retroactive payments are very limited. The OAG audits all four
payrolls, and conducted a ‘Special Payroll Audit on the integrity, accuracy and
completeness of data processed through the IPPS’ in July 2012, which highlighted
management issues and other weaknesses, which have mostly been acted upon.
The Rwanda Public Procurement Authority (RPPA) fulfils a monitoring and capacity
building role in a decentralized procurement system. RPPA has been strengthened by
the full implementation of laws 12/2007 and 05/2013, and maintains records for contracts
representing almost all expenditure incurred through GoR procurement (PI-24). Requests

Rwanda PEFA Assessment, Upgraded Framework 2016
90
to use restricted tendering methods require the supervising Minister to confirm that this
would be in the public interest, and this is adhered to: justification for the 20 single-source
contracts let in 2011/2012 and 2012/2013 were all approved by the RPPA. MDA
procurement plans (showing title and quantity of the tender, method of tendering, source
of funds, expected publication and execution dates) are published on the official websites
of the procuring entity and the RPPA, and are advertised in newspapers, as are the
results of a competitive tendering process and the contract award as soon as the contract
is signed by both parties.
Less positive is comments in the RPPA’s Annual reports for 2012/2013 and 2013/2014,
stating that there are major problems with Procuring Entities meeting all the legal
requirements (e.g. only 15% of actually post procurement outcomes to their websites.
Finally, an independent review panel is functional and decisions reached by the panel are
published.
There is a robust commitment control policy in place in the accounting system, and the
majority of payments are made through direct bank transfers. As a result, expenditure
commitment controls are in place and effectively limit commitments to actual cash
availability and approved budget allocations. The OBL, accounting regulations, and
various manuals of procedure specify the requirements for duties to be divided between
staff involved in different aspects of the payment process, and these are generally
followed, although both the GCIA and the OAG do report minor instances of non-
compliance with internal financial controls (PI-25).
The Internal Audit function is decentralized, but guidance and monitoring is provided by
the central IA Unit at MINECOFIN (officially referred to as the ‘Government Principal
Internal Audit Unit’): this is now fully staffed, and there are internal audit personnel at
each government entity, including Districts: in total, there are over 160 IA personnel,
although independence may be impaired as staff are recruited (and can be dismissed) at
the entity level.
A ‘risk-based’ approach – following the Institute of Internal Auditors’ ‘Professional
Practices Framework’ – is used, and the function has been greatly strengthened by the
new OBL, and Entity Audit Committees approve the respective audit plans, and review
the reports produced, which coupled with a strong political will has improved the
implementation of audit recommendations, as noted by the OAG. The central unit
consolidates and issues a quarterly Internal Audit report to the Minister of Finance
highlighting key and crosscutting findings and recommendations for attention and action.
Accounting and reporting
Bank reconciliations for all Central Government accounts takes place at least monthly at
aggregate and detailed levels within two weeks of the end of the period. GoR does not
use suspense accounts, and travel allowances are promptly expensed and any
reconciliation conducted at the MDA level.
In-year budget execution reporting (PI-28) covers general government and is on a
quarterly basis. Reports are broken down by the three classifications: programmatic;
economic; and functional, and include external disbursements, all at the payment (and
not at the commitment) stage. The fact that the OAG reported that the majority of budget
agencies required adjustment to their AFS during audit suggests that monthly budget
execution reports are less than completely reliable
The annual Consolidated Financial Statements (CFSs) cover all MDAs and other budget
entities, and are prepared according to the modified cash basis of accounting, in

Rwanda PEFA Assessment, Upgraded Framework 2016
91
accordance with the legal framework, although this does not comply with International
Public Sector Accounting Standards (IPSAS). The CFSs for the three years up to
2012/13 had received a ‘disclaimed’ opinion from the OAG: however, an improvement
was noted for FY 2013/14, with a slight increase in the number of public entities receiving
unqualified reports (up from 34% in FY 2012/13 to 36%.) which the OAG sees as an
indication that the culture of providing proper and adequate accountability for public funds
is taking root in some public entities. Unfortunately, this was not the case with some
GBEs, where the AFSs were marred by gross financial mismanagement, such as not
maintaining proper books of account or failing to implement proper internal controls,
resulting in losses or misappropriations of public resources. Reports have been produced
on time, within three months of the year-end (PI-29).
External scrutiny and audit
The OAG coverage of financial audits has continued to grow, and in FY2013/14 had
reached 81% of Government expenditure. Over and above annual coverage of all MDAs,
including Districts, the OAG now audits the State Consolidated Financial Statements and
an increased number of GBEs and non-budget agencies, and has submitted the Audit
Report to Parliament within the statutory period of seven months in each of the last three
FYs (PI-30). The OAG’s report includes an assessment of the audited agencies that
implemented audit recommendations from the previous year, and hence many budget
entities track implementation of audit recommendations through an action plan, whose
status is reported to MINECOFIN as an attachment to the monthly financial statements.
Mechanisms are being put in place to identify the causes for any entity failing to reach its
targets, and for specific follow-ups to be taken to facilitate the necessary improvements.
Although the OAG reports that only a proportion of previous years’ recommendations had
been fully implemented, the majority of the shortfall lies with a few budget entities,
namely, Universities, GBEs and Boards.
The Public Accounts Committee was established in 2011, and examines all the accounts
submitted to it by the Auditor-General, and has completed its review within eight months
of the report being presented to Parliament in each of the past three years: hearings are
covered live on Parliamentary radio and sometimes on national television. The PAC
prepares a report that includes recommendations, which is presented to the plenary
session of the Chamber, then passed to the executive for action. Moreover, during the
year, the Chamber of Deputies provides oversight to ensure that recommendations are
being implemented (PI-31).
4.2 Effectiveness of the Internal Control Framework
The control environment is strong, with clear roles and responsibilities prescribed under
the OBL, Ministerial Instructions and Ministerial Orders. Job descriptions specify the
responsibilities of public servants when dealing with resources provided by government
funds. Control activities such as the segregation of duties, and multi-layer authorization
requirements are prescribed in procedure manuals, which specify all aspects of
recording, accounting and reporting transactions.
Each Public Entity is required to establish and implement a system of internal control to
secure risks to the entity and to detect or prevent irregularities. The formalization of risk
assessments is fundamental to determine the scope of these controls, which must be
appropriate to mitigate future risks, or detect inappropriate decisions or actions. Internal
Auditors in PEs follow a ‘risk-based’ approach, which require multi-year audit plans that
are approved by the entity’s Audit Committees (and copied to the GCIA).

Rwanda PEFA Assessment, Upgraded Framework 2016
92
The accountability cycle is completed by the role played by the entity’s Audit Committee:
ensuring oversight and the timely implementation of corrective actions in response to
audit findings that will strengthen the control environment. Public Entities report monthly,
quarterly and annually to their Audit Committees (copied to the GCIA) on the
effectiveness of the control environment. The GCIA consolidates individual Internal Audit
reports into a report to the Minister, which identifies key cross cutting issues and
highlights areas requiring action.
Of course, Audit recommendations are only effective if implemented, and both Internal
Audit (through the GCIA) and the OAG routinely report on the degree to which their
recommendations implemented (including to the PAC in the case of the OAG).
In summary, the internal control framework appears to be generally effective in the
national government – although there are exceptions, but at least these are reported.
However, the situation at the sub-national level is less positive, possibly due to the
difficulty of segregating duties, or the fact that staff may be less well trained.
4.3 PFM Strengths and Weaknesses
Aggregate fiscal discipline
Overall, fiscal discipline is reasonably good, and most elements in the overall PFM
system that contribute to achieving this objective appear to be sound. On the revenue
side, performance is good (PI-3, rated ‘B+’), although while there are variances in
expenditure against the original budget (PI-2.1), these are not distorted by payment
arrears, the stock of which is declining (PI-22.1).
In addition, the risks to attaining fiscal discipline have been reduced, due to several
factors: there are few unreported operations (PI-6); monitoring of fiscal risks from other
Public Sector entities is reasonable (PI-10), although there are exceptions with contingent
liabilities and ‘Public Private Partnerships’ (PI-10.3); the recording of government debt
and the inclusion of donor funded project bank accounts into the consolidation of
government cash/bank balances is comprehensive (PI-13); and the multi-year focus in
fiscal planning is also good (PI-16.3 and 4). There are two new indicators that relate to
this budgetary outcome, ‘Macroeconomic and Fiscal Forecasting’ (PI-14) and ‘Fiscal
Strategy’ (PI-15) both of which score very well.
With the exception of the large volume of very old tax arrears (which the law does allow
to be written-off: PI-19.4), the various elements of the system concerned with budget
execution – including internal controls – are sound and contribute to the attainment of
aggregate fiscal discipline.
Strategic allocation of resources
The five indicators concerned with ‘policy-based fiscal strategy and budgeting’, (PIs 14 to
18) all received good overall ratings, and demonstrate that the process to allocate
budgetary resources in accordance with GoR’s declared strategic objectives is sound and
has in fact, strengthened. There are two exceptions to this: the first is the absence of
medium-term expenditure ceilings in the budget preparation process (PI-16.2); and,
secondly, PI-18.4 regarding Parliamentary oversight of in-year amendments to the
approved budget, (but this is an improvement from the previous assessment). This
conclusion is consistent with a reasonable rating for PI-2, which suggests that the budget
Rwanda PEFA Assessment, Upgraded Framework 2016
93
formulation process (which benefits from considerable political engagement at an early
stage) produces the desired results.
Most of the other indicators that contribute to the strategic allocation of resources have
continued to function well, notably the comprehensiveness of the budget documentation,
and its classification in accordance with international norms (PIs 5 (‘B’) and 4 (‘A’)
respectively). The indicators related to revenue collection (PIs 19 and 20) have been
reformulated, and with the exception of tax audits and the monitoring of arrears (PI-19-3
and 4) perform well, which is important as the RRA is expected to increase domestic
revenues in the years to come.
There is another completely new indicator relevant to this budgetary outcome which is
‘Public Investment Management’ (PI-11), and this reflects “generally accepted good
practice”, with ‘A’ ratings for two of the four dimensions.
Efficient use of resources for service delivery
Financial management is not an end in itself, but rather a tool to assist a government to
deliver services to its citizens, and of course, services cannot be delivered in the absence
of funds. In this respect, GoR’s PFM system works well, as can be seen in the good
ratings for the processes that plan services (PIs 16 and 17 mentioned above); the
revenue indicators (PIs 19 and 20 – with the exception of arrears, mentioned above);
predictability in the availability of funds to support expenditure (PI-21, ‘B+’); the fact that
intergovernmental fiscal relations are transparent (PI-7, rated ‘A’) as many services are
actually delivered to communities by the Districts.
While the indicators listed above reveal what may be regarded as a satisfactory level of
performance, the rating for ‘performance information’ which can demonstrate the
efficiency with which services are delivered (PI-8, ‘D”) is disappointing, as is that of the
last of the completely new indicators introduced into the Framework: ‘Public Asset
Management’ (PI-12), which reveals a weak performance – with potentially severe
consequences, in that resources are unlikely to be utilized efficiently or effectively by a
government that does not know what assets it owns.
Importantly, the mechanisms in place to reduce possible leakages in the system, such as
internal controls, and controls over payroll (PIs 25 and 23 respectively) are good, while
Internal Audit continues to improve (PI-26), as do the basic accounting controls (PI 27)
and the procurement indicator (PI-24).
Lastly, while the oversight arrangements (addressed in PIs 30-31) are reasonably
effective: they show a mixed picture. There are improvements, for example in the
Parliamentary scrutiny of the Auditor-General’s reports, while on the other hand, the lack
of financial independence of the OAG – a new dimension introduced to the Framework –
can be seen as a constraint on the scope and nature of the work performed.
In summary, most aspects of the PFM system are functioning at a satisfactory level – one
that should allow GoR to attain its fiscal and budgetary objectives. This said, there remain
areas for improvement (such as performance information on service delivery; capturing
all assets bought with public funds in registers – and maintaining the registers; managing
revenue arrears; issuing budget execution reports; and improving the (financial)
independence of the OAG), some of which are already incorporated in the PFM SSP.

Rwanda PEFA Assessment, Upgraded Framework 2016
94
4.4 Performance changes since a previous assessment
This is the first assessment using the upgraded Framework, and the guidance issued by
the PEFA Secretariat (October 2016) states that only 14 dimensions are directly
comparable with the 2011 version (it should also be noted that PIs-2, 3 and 19 were
amended in 2011, after the previous assessment). The directly comparable dimensions
are (using the numbers in this report) PI-4.1; PI-5.1; PI-13.1; PI-17.1 & 2; PI-18.1 & 4; PI-
21.1, 2, 3 & 4; PI-23.3 & 4; and PI-25.2: these are shown in Table 0.1 in the Introduction.
For completeness, Table 4.1 below shows all applicable ratings from the 2010
assessment.
Table 4.1: Comparison with previous assessment, by indicator and dimension
No. Indicator Score
2016
Score
2010
‘Old’
#
Performance
change
PI-1 Aggregate expenditure outturn C
1.1 Aggregate expenditure outturn C A 1 Indirectly comparable.
PI-2 Expenditure composition outturn
C+ D* 2 * indicator changed in 2011
2.1 Expenditure composition outturn by function
C Not comparable.
2.2 Expenditure composition outturn by economic type
B Not comparable.
2.3 Expenditure from contingency reserves
C Not comparable.
PI-3 Revenue outturn B+ A 3 * indicator changed in 2011
3.1 Aggregate revenue outturn B Not comparable.
3.2 Revenue composition outturn A Not comparable.
PI-4 Budget classification A
4.1 Budget classification A A 5 (i) Directly comparable.
PI-5 Budget documentation B
5.1 Budget documentation B A 6 (i) Indirectly comparable.
PI-6 Central government operations outside financial reports
A
6.1 Expenditure outside financial reports
A A 7 (i) Not comparable.
6.2 Revenue outside financial reports
A New.
6.3 Financial reports of extra-budgetary units
B New.
PI-7 Transfers to subnational governments
A Indirectly comparable.
7.1 System for allocating transfers A A 8 (i) Indirectly comparable.
7.2 Timeliness of information on transfers
A A 8 (ii) Indirectly comparable.
PI-8 Performance information for service delivery
D
8.1 Performance plans for service delivery
D New.
8.2 Performance achieved for service delivery
C New.
8.3 Resources received by service delivery units
D D 23 (i) Not comparable.
8.4 Performance evaluation for service delivery
D New.
PI-9 Public access to key fiscal information
B
9.1 Public access to fiscal information
B A 10 (i) Not comparable.
PI-10 Fiscal risk reporting C+
10.1 Monitoring of public corporations B C 9 (i) Not comparable.
10.2 Monitoring of subnational C C 9 (ii) Not comparable.

Rwanda PEFA Assessment, Upgraded Framework 2016
95
No. Indicator Score
2016
Score
2010
‘Old’
#
Performance
change
governments
10.3 Contingent liabilities and other fiscal risks
C New.
PI-11 Public investment management
B+
11.1 Economic analysis of investment proposals
B New.
11.2 Investment project selection A New.
11.3 Investment project costing A New.
11.4 Investment project monitoring C New.
PI-12 Public asset management D+
(i) Quality of central government financial asset monitoring
C New.
(ii) Quality of central government non-financial asset monitoring
D New.
(iii) Transparency in the sale of non-financial assets
C New.
PI-13 Debt management A
13.1 Recording and reporting of debt and guarantees
B C 17 (i) Directly comparable.
13.2 Approval of debt and guarantees A A 17 (iii) Not comparable.
13.3 Debt management strategy A New.
PI-14 Macroeconomic and fiscal forecasting
B+
14.1 Macroeconomic forecasts B New.
14.2 Fiscal forecasts A New.
14.3 Macrofiscal sensitivity analysis B New.
PI-15 Fiscal strategy A
15.1 Fiscal impact of policy proposals A New.
15.2 Fiscal strategy adoption A New.
15.3 Reporting on fiscal outcomes B New.
PI-16 Medium-term perspective in expenditure budgeting
B
16.1 Medium-term expenditure estimates
A C 12 (i) Not comparable.
16.2 Medium-term expenditure ceilings
D New.
16.3 Alignment of strategic plans and medium-term budgets
A C 12 (iii) Not comparable.
16.4 Consistency of budgets with previous year estimates
B New.
PI-17 Budget preparation process A
17.1 Budget calendar A A 11 (i) Directly comparable.
17.2 Guidance on budget preparation B C 11 (ii) Directly comparable.
17.3 Budget submission to the legislature
A A 27 (iii) Not comparable.
PI-18 Legislative scrutiny budgets B+
18.1 Scope of budget scrutiny A B 27 (i) Directly comparable.
18.2 Legislative procedures for budget scrutiny
B A 27 (ii) Not comparable.
18.3 Timeliness of budget proposal approval
A A 11 (iii) Indirectly comparable.
18.4 Rules for budget adjustment by the executive
B C 27 (iv) Directly comparable.
PI-19 Revenue administration C+ Indirectly comparable.
19.1 Rights and obligations for revenue measures
A A 13 (ii) Not comparable.
19.2 Revenue risk management A New.
19.3 Revenue audit and investigation D A,A,B 14 (i-iii) Not comparable.
19.4 Revenue arrears monitoring D D 15 (i) Not comparable.
PI-20 Accounting for revenue B+
20.1 Information on revenue collections
A New.

Rwanda PEFA Assessment, Upgraded Framework 2016
96
No. Indicator Score
2016
Score
2010
‘Old’
#
Performance
change
20.2 Transfer of revenue collections B B 15 (ii) Not comparable.
20.3 Revenue accounts reconciliation A A 15 (iii) Not comparable.
PI-21 Predictability of in-year resource allocation
B+
21.1 Consolidation of cash balances A B 17 (ii) Directly comparable.
21.2 Cash forecasting and monitoring B B 16 (i) Directly comparable.
21.3 Information on commitment ceilings
B B 16 (ii) Directly comparable.
21.4 Significance of in-year budget adjustments
A A 16 (iii) Directly comparable.
PI-22 Expenditure arrears C+
22.1 Stock of expenditure arrears A B 4 (i) Directly comparable.
22.2 Expenditure arrears monitoring C B 4 (ii) Directly comparable.
PI-23 Payroll controls B+
23.1 Integration of payroll and personnel records
A A 18 (i) Indirectly comparable.
23.2 Management of payroll changes A A 18 (ii) Indirectly comparable.
23.3 Internal control of payroll A A 18 (iii) Directly comparable.
23.4 Payroll audit B B 18 (iv) Directly comparable.
PI-24 Procurement B+ * indicator changed in 2011
24.1 Procurement monitoring A New.
24.2 Procurement methods A A 19 (ii) Not comparable.
24.3 Public access to procurement information
C A 19 (iii) Indirectly comparable.
24.4 Procurement complaints management
A A 19 (iv) Indirectly comparable.
PI-25 Internal controls on nonsalary expenditure
A
25.1 Segregation of duties A New.
25.2 Effectiveness of expenditure commitment controls
A A 20 (i) Directly comparable.
25.3 Compliance with payment rules and procedures
B B 20 (iii) Not comparable.
PI-26 Internal audit C+
26.1 Coverage of internal audit A C 21 (i) Indirectly comparable.
26.2 Nature of audits and standards applied
B New.
26.3 Implementation of internal audits and reporting
C C 21 (ii) Not comparable.
26.4 Response to internal audits C C 21 (iii) Not comparable.
PI-27 Financial data integrity B+
27.1 Bank account reconciliation B B 22 (i) Indirectly comparable.
27.2 Suspense accounts NA A 22 (ii) Indirectly comparable.
27.3 Advance accounts A A 22 (ii) Indirectly comparable.
27.4 Financial data integrity processes
B New.
PI-28 In-year budget reports D+
28.1 Coverage and comparability of reports
A C 24 (i) Indirectly comparable.
28.2 Timing of in-year reports D D 24 (ii) Indirectly comparable.
28.3 Accuracy of in-year budget reports
C C 24 (iii) Not comparable.
PI-29 Annual financial reports C+
29.1 Completeness of annual financial reports
C D 25 (i) Indirectly comparable.
29.2 Submission of reports for external audit
A A 25 (ii) Indirectly comparable.
29.3 Accounting standards C C 25 (iii) Indirectly comparable.
PI-30 External audit D+
30.1 Audit coverage and standards B A 26 (i) Not comparable.
30.2 Submission of audit reports to the legislature
C B 26 (ii) Not comparable.

Rwanda PEFA Assessment, Upgraded Framework 2016
97
No. Indicator Score
2016
Score
2010
‘Old’
#
Performance
change
30.3 External audit follow-up C B 26 (iii) Not comparable.
30.4 SAI Independence D New.
PI-31 Legislative scrutiny of audit reports
B+
31.1 Timing of audit report scrutiny C B 28 (i) Indirectly comparable.
31.2 Hearings on audit findings A B 28 (ii) Indirectly comparable.
31.3 Recommendations on audit by the legislature
B B 28 (iii) Not comparable.
31.4 Transparency of legislative scrutiny of audit reports
A New.

Rwanda PEFA Assessment, Upgraded Framework 2016
98
5 Government Reform Process
5.1 Approach to PFM reforms
Since 2008, the Government of Rwanda's approach to Public Financial Management
Reform (PFMR) has been a well-coordinated, sequenced but ambitious strategic
framework aimed at achieving set targets within the stipulated timeframe envisaged in the
PFMR Strategy 2008-2012. The Independent Evaluation Report of the Implementation of
the PFMR Strategy 2008-2012 allocated an overall score of 80% achievement relating to
the four key pillars, namely Economic and Budget Management, Financial Management
and Reporting, Public Procurement, and finally Oversight of Budget Execution. A second
PFM reform strategy, known as the Public Financial Management Sector Strategic Plan
(PFM SSP) was launched in 2013 following from recommendations obtained from the
evaluation of the first strategy, the PFM Joint Sector Review 2012/2013, as well as
government's own priority areas for improvement. The PFM SSP 2013-2018 is a
foundational pillar under the Governance and Accountability thematic area contained in
the Economic Development and Poverty Reduction Strategy 2 (EDPRS II); it is
recognised as a key crosscutting issue for economic development.
The PFM SSP 2013-2018 is not an isolated strategic framework but a rather linked
approach, taking its main roots from the Vision 2020 and the distilled national medium
term strategy EDPRS II spanning 2013-2018. The PFM SSP reform strategy is linked to
EDPRS II in the following thematic areas:
Economic Transformation for Rapid Growth: - ensuring optimum domestic revenue
mobilisation and expenditure prioritisation aimed at achieving maximum economic
growth and poverty reduction
Rural Development: – prioritisation and improvement of sub-national PFM system for
the attainment of economy, efficiency and effectiveness of service delivery for primary
healthcare and schools at the community level in line with the Government's policy on
fiscal decentralisation, in order to deliver good and accountable local governance.
Productivity and Youth Employment: - significant emphasis on youth employment
in the PFM sector for improved productivity, in collaboration with professional training
institutions for capacity building to feed both the public and private sectors of the
economy.
Accountable Governance: – improvement in PFM both at central and local
government levels provides a platform for transparency, accountability and good
governance with a well-coordinated effort and input of external oversight government
bodies such as Parliament and the Office of the Auditor General
It is also crucially important to underscore the involvement of development partners in the
quest to improve PFM at both central and local government levels. To this end, there is a
considerable donor buy-in in the PFM SSP, which has a budget of USD91.7million over a
5-year period. The donor buy-in is as a result of government's resolve to be as
transparent as possible, in addition to owning and leading the reform process. In lieu of
this, a memorandum of understanding (MoU) for a basket fund has also been signed
between GoR and supporting donors in June 2014 to provide funding for the PFM SSP
2013-2018.

Rwanda PEFA Assessment, Upgraded Framework 2016
99
5.2 Recent and on-going reform actions
The PFM SSP 2013-2018 essentially outlines PFM reforms to be implemented over the
next five years and the forward-looking perspective for improvement in key priority areas
going forward. There are seven key programmes identified in the current strategy,
subdivided into sub-programmes with achievable output targets and timelines, the
summary of which are as follows:
Economic Planning and Budgeting
There are four sub-programmes under this pillar, namely national development planning,
economic policy formulation, public investment programming and policy based budgeting.
As part of the reform agenda, it is envisaged to improve performance based budgeting for
supporting fiscal budgeting, ensure considerable improvement in the preparation of
MTEF as a mechanism for effective planning, mainstreaming official development
assistance into the national budget document, developing a comprehensive budget
framework with budget agencies linked to or reflecting sector strategies. Further,
strengthening risk management in planning and budgeting, as well as ensuring that total
government debts are sustainable remain key focal points.
Resource Mobilisation
Tax policy formulation, tax administration and external financing are the three elements
under this programme. The targets include significant increase in domestic resource
mobilisation, simplification of tax policy measures aimed at ensuring transparency and
comprehensiveness, provide adequate and comprehensive structures for external
resource mobilisation, develop strategies for raising and improving non-tax revenue, and
providing a platform for the use of country systems in the management of ODA
Budget Execution, Accounting and Reporting
As an essential part of PFM reform, budget execution, treasury management, internal
audit, accounting and reporting, public procurement and management of public
enterprises fiscal risks are the main elements to be reformed. It is targeted to ensure that
budget execution reflects budget agency priorities and approved plans, improve the
quality and timeliness of in-year budget execution reports, increase and improve the
usefulness of financial reports for public consumption. Further, it is aimed at improving
treasury management functions and procedures with regards to cash management,
ensure the full compliance of public procurement laws and regulations, strengthen
internal controls and provide a computer assisted auditing technique in internal audit
External Oversight and Accountability
Two elements are envisaged for improvement, namely external audit functions performed
by the Auditor General and parliamentary scrutiny referencing review of national budget
estimates and audit reports submitted by the Auditor General. The reforms will entail
expanding the scope of external audit to include value-for-money and performance audits
in addition to the existing financial audit to meet the highest international audit standards
(INTOSAI), and the provision of technical support to parliament committees on budget
and public accounts for effective scrutiny.
Electronic Service Delivery and IFMIS
Automation is seen as a functional element for efficient service delivery. In this regard,
the Integrated Financial Management & Information System (IFMIS) and the Integrated
Personnel & Payroll System (IPPS) will continue to receive support for improvement. It is
intended to roll out IFMIS to remaining government entities in line with Vision 2020
strategic plans, achieve full integration for all government IT systems (IFMIS, IPPS,

Rwanda PEFA Assessment, Upgraded Framework 2016
100
SIGTAS, etc.), complete and operationalize the HR modules of IPPS, and finally train
staff on the use of all IT systems.
Fiscal Decentralisation
Government is committed to ensuring full decentralisation in order to provide efficient
service delivery to local communities at a cheaper cost. Under this programme of reform,
increased resource mobilisation by district councils, reduce the time lag for fiscal
transfers to local authorities and strengthening of PFM systems including capacity
building of local council staff remain paramount. The reform will seek to strengthen
existing PFM systems to improve local service delivery, improve local revenue
mobilisation frameworks, ensure fairness and equity in fiscal transfers to district councils,
provide training to sub-national staff on effective planning and budgeting, and finally
entrust full responsibility to local council senior managers regarding devolved government
agencies
PFM Sector Coordination and Management
In order to ensure targets are met as stipulated in the reform agenda, it is important to
have a well- coordinated PFM Secretariat with well-trained staff to spearhead the reform
agenda. Therefore, PFM coordination and management, staff training and capacity
building, as well as monitoring and evaluation interventions and tools continue to be very
relevant. For this reason, the reform will focus on strengthening the existing PFM
secretariat (which is now known as the Single Project Implementation Unit - SPIU) and
coordination mechanisms, improve M&E, and streamline communication processes for
effective stakeholder coordination and participation. Of significance is ensuring an
increase of staff with professional qualification such as Institute of Certified Public
Accountants of Rwanda (ICPAR), and continued professional development (CPD)
programmes; this will be augmented by staff motivation and incentive schemes.
Besides the above seven key elements, four priorities have emerged for urgent
consideration:
Increased resource mobilisation: domestic tax and non-tax revenue mobilisation to
ensure Rwanda becomes self-reliant in the medium to long term
Scaling up of the implementation of IFMIS: extend IFMIS to remaining government
agencies both at central and local government levels as well as initiate the process for
the use of a full-fledged IFMIS that has all the functionalities such as procurement,
fixed asset management, and inventory modules
Strengthen PFM systems at sub-national level: integrate sub-national service
delivery units such as schools and primary healthcare institutions into IFMIS for
effective PFM systems in order to improve decentralised service delivery; joint staff
training for both district councils and local service delivery units will be delivered
Enhance training, professionalization and capacity building across all PFM
disciplines: provide professional training to augment staff to ensure sustainability.
The World Bank is also providing support to the tune of USD100million for the Public
Sector Governance Programme-for-Result. The main objective of this programme is to
improve Rwanda's PFM and statistics systems for the enhancement of transparency and
accountability in the use of public funds, revenue mobilisation and the quality and
accessibility of development data for decision-making

Rwanda PEFA Assessment, Upgraded Framework 2016
101
5.3 Institutional considerations
Government leadership and ownership A major success story of the implementation of PFM reforms in Rwanda is commitment
and government ownership at the highest political level. This is coupled with strong buy-
ins from lower level government officials due to their involvement right from the initial
development stages of PFM reform strategies. Development Partners continue to support
PFM reforms in Rwanda partly due to the low levels of corruption and the willingness of
government to tackle corruption head-on; active participation of civil society organisations
contributes significantly to reform successes. Key government agencies such as
Parliament, Office of the Auditor-General, Rwanda Revenue Authority, MDAs, among
others have been consulted in developing PFM reform strategies. Active participation of
government officials has been encouraging.
Coordination across government As part of the government rationalisation policy, the PFM Secretariat has been integrated
into the Single Project Implementation Unit (SPIU). The SPIU's role is to provide strategic
coordination and oversight for the effective implementation of the reform agenda. It is
responsible for procurement, financial management and logistical support for the PFM
SSP. It is also in charge of providing secretarial services for both the SWG and TWG,
and reports to the Permanent Secretary of MINECOFIN. It is the responsibility of IAs to
develop and implement approved action plans and budget. Each implementing agency is
in charge of a sub-programme(s) but with the inclusion of other stakeholders where
necessary. Development Partners and CSOs are co-opted as members of the IAs to
provide technical support and guidance. Further, each implementing agency submits
progress reports to each of the seven (7) programme managers for consolidation.
A sustainable reform process Progress made thus far with respect to the first PFM reform programme 2008-2012 has
contributed to stakeholder interest and continuous participation in the second reform PFM
SSP 2013-2018. In view of this, a memorandum of understanding (MoU) has been
signed between contributing development partners and government in June 2014. The
financial cost of the PFM SSP is USD91.7million. Out of this, contributing development
partners have committed to providing funding amounting to USD15.3million, leaving a
funding gap of USD76.4million. The World Bank is also proving funding for the Public
Sector Governance Programme-for-Results to the tune of USD100million. It is the belief
of government that the level of transparency and credibility of the reform programme will
translate into additional funding from donors for the full implementation of the second
PFM reform programme.
Transparency of the PFM program A credible and transparent PFM reform strategy provides confidence for stakeholder
collaboration, support and participation. Public Financial Management reforms success
hinges on a strong institutional framework. The first PFM reform 2008-2012 gained
significant success mainly due to effective institutional factors and stakeholder
involvement. The second reform – PFM SSP – builds on the success story of the first; the
current institutional support framework strengthens the existing structures and includes
the following:
PFM Sector Working Group (SWG)
The SWG is the highest policy body for the PFM sector made up of key stakeholders
from government, development partners, and civil society organisations. It is chaired by
the Permanent Secretary of MINECOFIN and Secretary to the Treasury, and co-chaired
by a representative of development partners. It meets once every quarter to review and

Rwanda PEFA Assessment, Upgraded Framework 2016
102
approve plans and progress thereon, seeking to better coordinate and improve
stakeholder involvement and effectiveness. The SWG is responsible for the coordination
of a bi-annual Joint Sector Review (JSR) in line with EDPRS 2 with both historical and
future perspectives. It also provides support to the PFM Technical Working Groups,
programmes and sub-programme managers.
PFM Sector Technical Working Group (TWG)
The TWG is the second highest organ responsible for providing guidance on
technical PFM activities, reviewing work plans and budgets in addition to monitoring
the implementation of annual reform programmes and activities. It is made up of
seven (7) programme managers and 23 sub-programme managers, with
representative from development partners, chaired by the Accountant General and
the Coordinator of the Single Project Implementation Unit serving as the secretary. It
meets at least once every two months but may meet more frequently when
necessary. For better coordination, the TWG meets two weeks in advance of any
proposed meeting schedule of the SWG.
Development Partners Coordination Group (DPCG)
The Development Partners Coordination Group (DPCG) is composed of GoR
Permanent Secretaries, Heads of bilateral and multilateral donor agencies, as well as
representatives of civil society and the private sector. The meetings of the Group are
co-chaired by the Permanent Secretary and Secretary to the Treasury (MINECOFIN)
and a representative of development partners. The main functions of the DPCG are
to:
Serve as a forum for dialogue in the coordination of development aid to Rwanda;
Monitor the implementation of the EDPRS II progress – with help of the EDPRS 2
M&E matrix/CPAF;
Harmonize the Development Partners’ programmes, projects, and budget support
with the GoR;
Review progress made in the fulfilment of commitments undertaken by
Development Partners in the 2003 Rome Declaration on Harmonization, the 2005
Paris Declaration on Aid Effectiveness, the 2008 Accra Agenda for Action, and the
2011 Busan Outcome Document;
Convene quarterly – 2 DPCG meetings organized in synchronization with IMF
missions to facilitate macro-economic dialogue.

Rwanda PEFA Assessment, Upgraded Framework 2016
103
6 Annexes

Rwanda PEFA Assessment, Upgraded Framework 2016
104
Annex 1: Performance Indicator summary
No. Indicator Score Justification
Pillar I: Budget reliability
PI-1 Aggregate expenditure outturn
C
PI-1 Aggregate expenditure outturn
C Aggregate expenditure outturn was between 85% and 115% of the approved aggregate expenditure in two of the last three years: (109.8% in 2011/2012; 112.1% in 2012/2013; and 110.9% in 2013/2014)
PI-2 Expenditure composition outturn
C+
2.1 Expenditure composition outturn by function
C Variance in expenditure composition by program, administrative or functional classification was less than 15% in two of last 3 Years (Yr1 11.5%; Yr2 26.1%; and Yr3 10.1%)
2.2 Expenditure composition outturn by economic type
B Variance in expenditure composition by economic classification was less than 10% in two of the last three years (4.6% in 2011/12; 10.6% in 2012/13; and 6% in 2013/14)
2.3 Expenditure from contingency reserves
C Actual expenditure charged to the contingency vote was on average 9.4% over the 3 FYs.
PI-3 Revenue outturn B+
3.1 Aggregate revenue outturn
B Actual Revenue was between 94% and 112% in two of the last three years (107.4% in 2011/2012; 90.2% in 2012/2013; and 101.7% in 2013/2014)
3.2 Revenue composition outturn
A Variance in revenue composition was less than 5% in two of the last three years (4.0% in 2011/12; 15.0% in 2012/13; and 4.8% in 2013/14)
Pillar II. Transparency of public finances
PI-4 Budget classification A
4.1 Budget classification A The classification system is consistent with GFS/COFOG standards.
PI-5 Budget documentation B
5.1 Budget documentation B Budget documentation fulfils nine elements, including all four basic elements.
PI-6 Central government operations outside financial reports
A
6.1 Expenditure outside financial reports
A All entities which are controlled and mainly financed by GoR are on budget and included in fiscal reports, and the RSSB accounts for less than 1% of GoR budgeted exp.
6.2 Revenue outside financial reports
A The Annual Financial Report produced by MINECOFIN is comprehensive and includes amounts received from donors for current projects.
6.3 Financial reports of extra-budgetary units
B The Consolidated Annual Financial Statement for FY 2013/2014 produced by MINECOFIN in September includes the finances of most extrabudgetary units.
PI-7 Transfers to subnational governments
A
7.1 System for allocating transfers
A Over 90% transfers from central government to Districts are determined by transparent and rules based systems.
7.2 Timeliness of information on transfers
A Districts receive their allocations in the second BCC, and while these may be amended, firm figures are available by the end of March, thus allowing adequate time for well-considered budgets to be developed.
PI-8 Performance information for service delivery
D
8.1 Performance plans for service delivery
D A framework of performance indicators is not in place for the majority of MDAs.

Rwanda PEFA Assessment, Upgraded Framework 2016
105
No. Indicator Score Justification
8.2 Performance achieved for service delivery
C The Annual Budget Execution report captures performance results for the majority of service delivery functions.
8.3 Resources received by service delivery units
D No system currently exists to monitor resources received by service delivery units as planned.
8.4 Performance evaluation for service delivery
D Surveys by TI-Rwanda are independent performance evaluations of service delivery, but while recommendations for enhancing delivery are included, they do not cover 25% of expenditure.
PI-9 Public access to key fiscal information
B
9.1 Public access to fiscal information
B Four ‘basic’ elements and two additional elements are made available to the public within the specified timescales.
Pillar III. Management of assets and liabilities
PI-10 Fiscal risk reporting C+
10.1 Monitoring of public corporations
B Most Public Corporations produce audited AFS within six months of their year-end
10.2 Monitoring of subnational governments
C All SNGs submit annual financial statements to the Accountant General: these are consolidated within one month of end of FY, sent for audit then published.
10.3 Contingent liabilities and other fiscal risks
C With the exception of GoR’s PPP arrangements, contingent liabilities are recognised in financial reports.
PI-11 Public investment management
B+
11.1 Economic analysis of investment proposals
B MDAs and District Councils submit all proposed capital investment projects to the Public Investment Committee for economic appraisal before approval in accordance with the public investment guidelines issued by the NDP& R: however, the results of these appraisals are not published
11.2 Investment project selection
A All major investment projects are prioritized on the basis of the Public Investment Guidelines before they are included in the budget
11.3 Investment project costing
A The Public Investment Guidelines outline a comprehensive costing framework for both investment cost and forward linked recurrent costs: MDAs and DCs adhere to the guidelines
11.4 Investment project monitoring
C PMMU at MINECOFIN undertakes at least quarterly physical inspection of all approved government projects. It also prepares quarterly and annual project progress and financial reports, but these are not published.
PI-12 Public asset management
D+
12.1 Quality of central government financial asset monitoring
C The Government Portfolio Unit maintains a record of an up-to-date and to a large extent a complete register of government financial assets, indicating shareholding structure, net book value and dividend declared, paid and payable to government. The report is annexed to the GoR Consolidated Financial Statement, however it is not published.
12.2 Quality of central government non-financial asset monitoring
D Even though MDAs compile a comprehensive and complete fixed asset register, the government is yet to put together a consolidated fixed asset register. The Rwanda Housing Authority is in the process of compiling a consolidated central government fixed assets register.
12.3 Transparency in the sale of non-financial assets
D Although there is legislation and an MO on the sale and disposal of central government assets; there is insufficient evidence to comment on the implementation and transparency of the procedures.
PI-13 Debt management A
13.1 Recording and reporting B DMFAS is used to record public debt. The debt

Rwanda PEFA Assessment, Upgraded Framework 2016
106
No. Indicator Score Justification
of debt and guarantees record is comprehensive, complete and reconciled quarterly.
13.2 Approval of debt and guarantees
A Chapter V Article 50 of the OBL provides the framework for public borrowing: the Minister of Finance is the sole authority, and also approves borrowing limits for District. Loans are made against targets set in MTDS.
13.3 Debt management strategy
A MINECOFIN prepares a three-year medium term debt strategy, updated annually on a rolling basis: this provides clear targets with associated risk, exchange rate and interest rate factors. A DSA is prepared annually.
Pillar IV. Policy-based fiscal strategy and budgeting
PI-14 Macroeconomic and fiscal forecasting
B+
14.1 Macroeconomic forecasts B Projections incorporating government policies (ex EDPRS 2); GDP; inflation; exchange rates; and ad hoc inputs from MDAs and Central Bank are incorporated in a framework produced by the Macroeconomic Policy Unit and included in the BFP, but are not independently reviewed.
14.2 Fiscal forecasts A Macroeconomic forecasts consistent with the EDPRS and Vision 2020 inform economic policy, the
fiscal framework, tax forecasts and debt management strategy. The MTEF submitted to Parliament includes forecast FY & next 2 years on both revenue and expenditure, with notes explaining variances form the previous year’s forecasts.
14.3 Macrofiscal sensitivity analysis
B The work of the MU includes modelling various scenarios, which are presented to Cabinet, but not to Parliament.
PI-15 Fiscal strategy A
15.1 Fiscal impact of policy proposals
A Estimates of the fiscal impact of proposed policy changes – both revenue and expenditure – are included in the budget documentation submitted to Parliament.
15.2 Fiscal strategy adoption A GoR has set three-year medium-term fiscal objectives with quantitative targets at the start of budget preparation in each of the last 3 FYs.
15.3 Reporting on fiscal outcomes
B The BFP and the Annual Economic Reports (both of which are presented to Parliament) contain data on the actual and planned fiscal balance, together with explanations of the reasons for variances.
PI-16 Medium-term perspective in expenditure budgeting
B
16.1 Medium-term expenditure estimates
A Budget requests by MDAs are scrutinized for compliance with agreed priorities as reflected in EDPRS 2, and are produced using administrative, economic and functional classifications.
16.2 Medium-term expenditure ceilings
D Medium-term expenditure ceilings are only included in the BFP, which is issued after the two BCCs:
hence MDAs and Districts commence budget preparation without these parameters.
16.3 Alignment of strategic plans and medium-term budgets
A Individual sector strategy documents combined into EDPRS 2 cover over 80% of government expenditure.
16.4 Consistency of budgets with previous year estimates
B Links between the MTEF second year estimates and setting of the annual budget for the following FY are clear, for MDAs representing 75% and differences are explained in Annexes to the BFP.
PI-17 Budget preparation process
A
17.1 Budget calendar A MINECOFIN issues a clear and comprehensive fixed budget calendar to MDAs and district councils. MDAs and sub-national governments respect the

Rwanda PEFA Assessment, Upgraded Framework 2016
107
No. Indicator Score Justification
timeframe contained in the budget calendar. The BCC allows at least three months for MDAs and DCs to prepare budget estimates
17.2 Guidance on budget preparation
B The final BCC is comprehensive and clear; it is issued early February but without cabinet approved ceilings.
17.3 Budget submission to the legislature
A The OBL requires the Minister of Finance to submit budget proposals to the legislature on or before 15th June each year. For all the three years under consideration as well as the current fiscal year 2015/2016, national budget submissions have been presented to the legislature before the end of April.
PI-18 Legislative scrutiny budgets
B+
18.1 Scope of budget scrutiny A The legislature first reviews and approves the BFP before the budget is formally presented: the timeframe allows detailed debate and scrutiny.
18.2 Legislative procedures for budget scrutiny
B The legislature’s procedures to review budget are firmly established in law and are respected.
18.3 Timeliness of budget proposal approval
A The legislature approved the annual budget before the start of the FY in the last three years.
18.4 Rules for budget adjustment by the executive
B Parliamentary rules govern supplementary estimates, and there was no significant expansion of the total budget in the last FY.
Pillar V. Predictability and control in budget execution
PI-19 Revenue administration C+
19.1 Rights and obligations for revenue measures
A The RRA, which collects 98% of GoR revenue provides easy access to detailed and user-friendly tax information to both existing and potential taxpayers. RRA also has a functional administrative tax appeals system for the redress of taxpayer complaints.
19.2 Revenue risk management
A RRA, which collects at least 98% of government domestic revenue (mostly via ‘self-assessment’), uses a computerised risk-based taxpayer-profiling module to identify and select taxpayers for audit and fraud investigations.
19.3 Revenue audit and investigation
D RRA undertakes periodic tax audit and fraud investigations, using a risk-based work plan: however, it is not possible to relate planned activities to those achieved.
19.4 Revenue arrears monitoring
D The stock of revenue arrears as a percentage of total tax revenue is 13.3% (i.e. below 20%), arrears older than 12 months represent 81.6% of total stock of tax arrears for FY2013/2014
PI-20 Accounting for revenue B+
20.1 Information on revenue collections
A MINECOFIN receives monthly revenue reports from RRA. The report categorises revenue into type of revenue such as VAT, income tax, non-tax revenue, customs duties and excise duties.
20.2 Transfer of revenue collections
B Transfers from the main RRA revenue bank account to the Treasury Main Account are effected within a day. Transfers from tax accounts held by commercial banks take 48 hours to reach the main RRA revenue account
20.3 Revenue accounts reconciliation
A Officials of RRA and MINECOFIN undertake reconciliations between tax collected and transfers to the Treasury each month within two weeks of the end of the month, and every six months within a month after the period. RRA also undertakes a complete reconciliation between assessment, collections, transfers and arrears daily with SIGTAS.
PI-21 Predictability of in-year resource allocation
B+
21.1 Consolidation of cash balances
A All central government cash balances, including donor-funded project bank accounts are

Rwanda PEFA Assessment, Upgraded Framework 2016
108
No. Indicator Score Justification
consolidated daily, through the TSA framework which allows MINECOFIN to ascertain the total cash balance real time by close of business each day
21.2 Cash forecasting and monitoring
B Each MDA and DC prepares annual cash flows and submits to MINECOFIN for consolidation. The cash flow forecasts are updated quarterly on a rolling basis, based on actual cash flows
21.3 Information on commitment ceilings
B Once the appropriations bill is passed by Parliament, the Minister of Finance issues quarterly expenditure commitment ceilings to MDAs and DCs
21.4 Significance of in-year budget adjustments
A In-year budget reallocations occur only once, 6 months after the fiscal year and are reported to parliament
PI-22 Expenditure arrears C+
22.1 Stock of expenditure arrears
A A framework exists for reporting the stock of expenditure arrears by each MDA: the stock is below 2% of total expenditure in each of the last three completed FYs.
22.2 Expenditure arrears monitoring
C Data on expenditure arrears is formally reported at the end of the FY, in accordance with OBL.
PI-23 Payroll controls B+
23.1 Integration of payroll and personnel records
A All personnel records and payroll data is reconciled on a monthly basis, and there are strict controls over IPPS, including links to budget approvals.
23.2 Management of payroll changes
A Authorized record changes are made in time for the next payroll and retroactive payments are very limited.
23.3 Internal control of payroll A Authority to change records and payroll is restricted, results in an audit trail and is adequate to ensure high integrity of data.
23.4 Payroll audit B A payroll audit covering all central government entities was conducted by OAG ‘Special Payroll Audit on the integrity, accuracy and completeness of data processed through the IPPS’ in July 2012.
PI-24 Procurement B+
24.1 Procurement monitoring A Procurement data maintained by RPPA is comprehensive, and is published annually.
24.2 Procurement methods A Procurement methods are followed according to the law
24.3 Public access to procurement information
C The PEs do not comply fully: only 3 of the 6 criteria are met.
24.4 Procurement complaints management
A RPPA practices meets all legal requirements, including the six criteria listed in Table 3.21.
PI-25 Internal controls on nonsalary expenditure
A
25.1 Segregation of duties A Appropriate segregation of duties exists throughout the process, in accordance with the OBL, which specifies clear responsibilities.
25.2 Effectiveness of expenditure commitment controls
A Expenditure commitment controls remain in place that effectively limit commitments to actual cash availability and approved budget allocations.
25.3 Compliance with payment rules and procedures
B The degree of compliance is good and is improving but some variations do occur and are reported.
PI-26 Internal audit C+
26.1 Coverage of internal audit A Internal Audit is operational at all government entities.
26.2 Nature of audits and standards applied
B Internal audit in MDAs follow audit plans (approved by Audit Committees and copied to the GCIA) and are focused on evaluations of the adequacy and effectiveness of internal controls.
26.3 Implementation of internal audits and reporting
C While IA is decentralized to MDAs and Districts, the GCIA monitors the implementation of individual plans of IA units.
26.4 Response to internal audits
C Implementation of audit recommendations at budget agencies averaged 70% in the GCIA quarter report at 31
st March 2015, although there is a growing
Rwanda PEFA Assessment, Upgraded Framework 2016
109
No. Indicator Score Justification
number of MDAs implementing 100%.
Pillar VI. Accounting, Recording and Reporting
PI-27 Financial data integrity B+
27.1 Bank account reconciliation
B Bank reconciliations for all CG bank accounts takes place monthly, at aggregate and detailed levels, usually within 2 weeks from the end of the month.
27.2 Suspense accounts NA No suspense accounts are operated.
27.3 Advance accounts A Imprest accounts operated at budget agencies are reconciled and reported to on in the monthly budget execution report within two weeks following month-end.
27.4 Financial data integrity processes
B Access and changes to records are restricted and recorded.
PI-28 In-year budget reports D+
28.1 Coverage and comparability of reports
A Classification of data allows comparison to original budget for all items of expenditure.
28.2 Timing of in-year reports D No evidence of issuance of quarterly reports.
28.3 Accuracy of in-year budget reports
C There are concerns over the accuracy of information in the reports, but this does not fundamentally undermine the basic usefulness.
PI-29 Annual financial reports C+
29.1 Completeness of annual financial reports
C There are persistent weaknesses in CFS and entities still have errors in their books of accounts. The entities with adverse or qualified audit reports are however dropping.
29.2 Submission of reports for external audit
A Submission of CFS have been timely and strictly within three months of the end of the FY.
29.3 Accounting standards C While the CFS are presented in consistent format, the requirements of IPSAS and national accounting standards are still not met.
Pillar VII. External Scrutiny and Audit
PI-30 External audit D+
30.1 Audit coverage and standards
B OAG uses INTOSAI standards when auditing CFS, and covers total government revenue and expenditure, assets and liabilities: this has been the practice for the last three FYs.
30.2 Submission of audit reports to the legislature
C OAG has submitted the audit reports to the legislature within 8 months.
30.3 External audit follow-up C OAG reports that only a proportion of previous year’s recommendations are fully implemented.
30.4 SAI Independence D While many of the requirements are met, financial independence is not: the OAG’s budget is controlled by MINECOFIN
PI-31 Legislative scrutiny of audit reports
B+
31.1 Timing of audit report scrutiny
C All the audited public accounts for the period under review have been fully examined and adopted by the Legislature, within 8 months from receipt of the reports.
31.2 Hearings on audit findings A Parliament has been consistent in the scrutiny of audited public accounts submitted by the Auditor-General. It has conducted in-depth hearings in the camera of Parliamentary radio and national television coverage and by senior officials /ministers and alike linked to audit findings.
31.3 Recommendations on audit by the legislature
B The PAC recommends actions to be taken, and those endorsed by Parliament are formally issued to the executive for action. The PAC keeps track of follow-up actions and conducts field visits. Nonetheless, not all recommendations are implemented.
31.4 Transparency of legislative scrutiny of audit reports
A All hearings are conducted in public (except security organs). Committee reports are debated in the full chamber and published on official website.

Rwanda PEFA Assessment, Upgraded Framework 2016
110
Annex 2: Summary of observations on the internal control framework
“Information for this annex should be drawn from the PEFA assessment only. No new information
should be collected. Where there is no information to provide a summary of findings, the table
should include the words ‘No information available from the PEFA assessment’”.
(PEFA SECRETARIAT GUIDANCE)
Internal control components and elements
Summary of observations
1. Control environment
1.1 The personal and professional integrity and ethical values of management and staff, including a supportive attitude toward internal control constantly throughout the organisation.
The rights and responsibilities for the various actors in the PFM system are prescribed in the OBL, Ministerial Instructions and Orders, as well as in PFM procedure manuals: these appear to be well adopted and internalised.
1.2. Commitment to competence
No information available from the PEFA assessment.
1.3. The “tone at the top” (i.e. management’s philosophy and operating style)
CBMs are responsible for ensuring that the control environment is ‘fit-for-purpose’ and effective: the ultimate responsibility lies with them, as they sign-off the use of resources.
1.4. Organisational structure
No information available from the PEFA assessment.
1.5. Human resource policies and practices
No information available from the PEFA assessment.
2. Risk assessment
2.1 Risk identification Several PIs are related to the extent to which risks are identified, notably:
11.1 Economic analysis of investment proposals, which is rated ‘B’ as all proposed capital investment projects are
submitted to the Public Investment Committee for economic appraisal before approval;
13.3 Debt management strategy which is rated ‘A’, as a
three-year medium term debt strategy is updated annually with associated risk, exchange rate and interest rate factors;
21.2 Cash forecasting and monitoring which is rated ‘B’, as
cash flow forecasts are updated quarterly on a rolling basis, based on actual cash flows
19.2 Revenue risk management which is rated ‘A’, as RRA,
uses a computerised risk-based taxpayer-profiling module to identify and select taxpayers for audit and fraud investigations.
2.2 Risk assessment (significance and likelihood)
One example of a risk assessment would be the work MINECOFIN in preparing a medium term debt strategy, updated annually and providing clear targets with associated risk, exchange rate and interest rate factors: cf: 13.3 of this PI, which is rated ‘A’.
2.3 Risk evaluation Risk-based annual audit plans are approved by the entity’s Audit Committees (and copied to the CIA), and are designed to progressively secure key risks in the control environment in a timely manner (26.3, which is rated ‘B’).
2.4 Risk appetite assessment
No information available from the PEFA assessment.
2.5 Responses to risk (transfer, tolerance, treatment or
No information available from the PEFA assessment.

Rwanda PEFA Assessment, Upgraded Framework 2016
111
termination)
3. Control activities
3.1 Authorization and approval procedures
Control activities are prescribed in the roles and responsibilities of stakeholders involved in transacting with public resources in order to meet the objectives of the entity. This can be seen by reference to the following PIs:
27.4 Financial data integrity processes which is rated B
Access and changes to records are restricted and recorded.
13.1 Recording and reporting of debt and guarantees which is rated B DMFAS is used to record public debt. The debt record
is comprehensive, complete and reconciled quarterly.
13.2 Approval of debt and guarantees which is rated A
Chapter V Article 50 of the OBL provides the framework for public borrowing: the Minister of Finance is the sole authority, and also approves borrowing limits for District. Loans are made against targets set in MTDS.
25.2 Effectiveness of expenditure commitment controls which is rated ‘A’ Expenditure commitment controls remain in
place that effectively limit commitments to actual cash availability and approved budget allocations.’
PI-23 Payroll controls, rated ‘B+’ overall:
23.1 Integration of payroll and personnel records which is rated ‘A’: 23.2 Management of payroll changes which is rated ‘A’: 23.3 Internal control of payroll which is rated ‘A’
3.2 Segregation of duties (authorizing, processing, recording, reviewing)
Segregation of duties is rated A in 25.1 Appropriate segregation of
duties exists, in accordance with the OBL, which specifies clear responsibilities.
3.3 Controls over access to resources and records
25.3 Compliance with payment rules and procedures which is rated B The degree of compliance is good and is improving but some
variations do occur and are reported. 27.4 Financial data integrity processes which is rated B Access
and changes to records are restricted and recorded.
3.4 Verifications 28.3 Accuracy of in-year budget reports which is rated C There
are concerns over the accuracy of information in the reports, but this does not fundamentally undermine the basic usefulness.
3.5 Reconciliations 27.1 Bank account reconciliation which is rated B for all CG bank
accounts are monthly, at aggregate and detailed levels, usually within 2 weeks from the end of the month.
3.6 Reviews of operating performance
Although RRA undertakes periodic tax audit and fraud investigations, using a risk-based work plan: however, it is not possible to relate planned activities to those achieved, hence 19.3 Revenue audit and investigation is rated D
3.7 Reviews of operations, processes and activities
Examples would be:
13.3 Debt management strategy which is rated ‘A’ A
MINECOFIN prepares a three-year medium term debt strategy, updated annually on a rolling basis
24.1 Procurement monitoring which is rated ‘A’ is
comprehensive, and is published annually by RPPA.
3.8 Supervision (assigning, reviewing and approving, guidance and training)
No information available from the PEFA assessment.
4. Information and communication
All organs of State are required to report monthly, quarterly and annually to their Audit Committees (copied to the CIA) on the effectiveness of the control environment. The CIA consolidates these into a report to the Minister, which identifies key cross cutting issues and highlights areas requiring action.
5. Monitoring
5.1 Ongoing monitoring CBMs are responsible for monitoring the control environment to ensure it remains effective against key risks. This is illustrated in the following PIs:
6 Central government operations outside financial reports, rated B+ overall.

Rwanda PEFA Assessment, Upgraded Framework 2016
112
8.3 Resources received by service delivery units which is rated D as there is no system to monitor resources received by
service delivery units as planned.
PI-10 Fiscal risk reporting which is rated B: specifically, 10.1 Monitoring of public corporations is rated B, as All Public
Corporations produce audited AFS within six months of their year-end:
10.2 Monitoring of subnational governments is rated A as all
SNGs submit annual financial statements to the Accountant General, within one month of end of FY; and 10.3 Contingent liabilities and other fiscal risks are rated C as (except for
GoR’s PPPs) contingent liabilities are recognised in financial reports.
11.4 Investment project monitoring which is rated C as the
PMMU undertakes at least quarterly physical inspection of all approved projects and prepares quarterly and annual project progress and financial reports.
12.1 Quality of central government financial asset monitoring which is rated C as GPU maintains a record of an
up-to-date and largely complete register of government financial assets but it is not published
12.2 Quality of central government non-financial asset monitoring which is rated D Even though MDAs compile a
comprehensive and complete fixed asset register, the government is yet to put together a consolidated fixed asset register.
28.1 Coverage and comparability of reports is rated A as the
classification of data allows comparison to original budget for all items of expenditure.
24.1 Procurement monitoring which is rated A Procurement
data maintained by RPPA is comprehensive, and is published annually.
19.4 Revenue arrears monitoring which is rated D The stock
of revenue arrears as a percentage of total tax revenue is 13.3%
22.2 Expenditure arrears monitoring which is rated C Data
on expenditure arrears is formally reported at the end of the FY.
5.2 Evaluations Example of the evaluations that take place are found in the following PIs:
8.4 Performance evaluation for service delivery is rated ‘C’
11.2 Investment project selection which is rated ‘A’ All major
investment projects are prioritized on the basis of the Public Investment Guidelines before they are included in the budget
5.3 Management responses
One example of a management response can be seen in 26.4: Response to internal audits which is rated C Implementation of
audit recommendations at budget agencies averaged 70% in the GCIA quarter report at 31
st March 2015, although there is a growing
number of MDAs implementing 100%.

Rwanda PEFA Assessment, Upgraded Framework 2016
113
Annex 3A: Related surveys & analytical work
(none cited)

Rwanda PEFA Assessment, Upgraded Framework 2016
114
Annex 3B: Stakeholders Interviewed
Name Organisation Position Telephone Email
Ministry of Finance and Economic Planning (MINECOFIN)
Patrick Marara Shyaka MINECOFIN Accountant General +250-788431964 [email protected]
Marcel Mukeshimana MINECOFIN Deputy AG - Public Accounts +250-788465517 [email protected]
Reuben K. Karemera MINECOFIN Deputy AG - Treasury [email protected]
Clement Ncuti MINECOFIN Economist +250-788485089 [email protected]
Hakizimana Obold MINECOFIN Economist, Real Sector +250-788554488 [email protected]
Amina V. Rwakunda MINECOFIN Senior Economist +250-788500525 [email protected]
Bizimana M. Javan MINECOFIN Economist, Public Debt +250-788844494 [email protected]
Rugwabiza Minega MINECOFIN Chief Economist
Amin Miramago MINECOFIN PFM Reforms Manager +250-733460646 [email protected]
Jeanette Ruigamba MINECOFIN Ag Director, Budget Mgt &
Reporting
+250-788501367 [email protected]
Jean Damascene Murekumbanze MINECOFIN Fiscal Decentralisation Officer +250-783116577 [email protected]
Cris Ayebaze MINECOFIN M&E Specialist - SPIU +250-788772890 [email protected]
Jimm Rangira MINECOFIN Fiscal Decentralisation Officer +250-788437503 [email protected]
William Furaha MINECOFIN Budget Expert +250-788506529 [email protected]
Eric Hakizimana MINECOFIN Budget Mgt and Reporting +250-788985383 [email protected]
Fred Bazatsinda MINECOFIN SPIU Procurement Officer +250-788462307 [email protected]
Jean de Dieu Rurangizwa MINECOFIN IFMIS Coordinator +250-788505673 [email protected]
Robert Otala MINECOFIN IFMIS Advisor +250-782516882 [email protected]
Marie Flora Uwamahoro MINECOFIN Accountant +250-788843212 [email protected]
Laban Bayingana MINECOFIN Cash Plan Manager +250-788780644 [email protected]
Caleb Rwamuganza MINECOFIN Director General, National
Budget
+250-788407240 [email protected]
Dr Octave Semwaga MINECOFIN PITT Acting Coordinator +250-788810123 [email protected]
Godfrey Kabera MINECOFIN Director General, Planning +250-788478597 [email protected]
Veneranda Mukakimenyi MINECOFIN Internal Auditor, Govt. +250-788650158 [email protected]
.rw
Alexis Kamuhire MINECOFIN Chief Internal Auditor, Govt. +250-788674737 [email protected]
William Furaha MINECOFIN Sector Specialist +250-788506529 [email protected]
Jimm Rangira MINECOFIN Fiscal Decentralisation Expert +250-788437503 [email protected]
Leonard Rugwabiza Minega MINECOFIN Chief Economist +250-788760010 [email protected]
Stella Nteziryayo MINECOFIN Ag Director, Debt Mgt Office +250-785823321 [email protected]
Javan M. Bizimana MINECOFIN Public Debt Expert +250-788844494 [email protected]
Susan Tuguta MINECOFIN Director, Govt Portfolio Unit +250-786384849 [email protected]
Ministry of Labour (MIFOTRA)
Samuel Mulindwa MIFOTRA Permanent Secretary +250-788387575 [email protected]
Manzi Aimable MIFOTRA IPPS Team Member +250-788309378 [email protected]
Migabo Roger MIFOTRA Lead IPPS Program Manager +250-788301767 [email protected]
Gaspard Musonera MIFOTRA SPIU Coordinator +250-738351501 [email protected]
Rwanda Public Procurement Authority
Augustus Seminega RPPA Director General +250-788305862 [email protected]
Christophe Nzakamwita RPPA Head of Audit & Monitoring +250-788627280 [email protected]
Christian Numviye Jean RPPA Planning, M&E Evaluation +250-788863770 [email protected]

Rwanda PEFA Assessment, Upgraded Framework 2016
115
Name Organisation Position Telephone Email
Officer
Ministry of Health (MINSANTE)
Dr Solange Hakiba MoH Permanent Secretary +250-788308079 [email protected]
Parfait Uwaliraye MoH Director General, Planning +250-788624354 [email protected]
Agatha Umutoni MoH SPIU Manager +250-788519267 [email protected]
Innocent Auka MoH Director of Finance +250-788679734 [email protected]
Jesus Uwamahoro MoH HR Manager +250-788472656 [email protected]
Rwanda Housing Authority
Noel Nsanzineza RHA Corporate Services Manager +250-788523852 [email protected]
Ministry of Infrastructure
Christian Rwakunda MoI Permanent Secretary +250-788306635 [email protected]
Rwanda Revenue Authority
Richard Tusabe RRA Commissioner General +250-788312304 [email protected]
Agnes Kanyangeyo RRA Deputy Comm’r, Planning +250-788585846 [email protected]
Augustine Mwebaze RRA +250-788594411 [email protected]
Office of the Auditor General
Patrick Habimana OAG Deputy Auditor General +250-788308371 [email protected]
Parliament
Constance M. Rwaka Parliament Chairperson, Budget
Committee
+250-788531107 [email protected]
Theonest Karenzi Parliament Deputy Chairperson, PAC +250-788303588 [email protected]
Adolphe Bazatoha Parliament Deputy Chairperson, Budget
Committee
+250-788508333 [email protected]
Speciose Ayinkamiye Parliament Clerk of Budget Committee +250-788842502 [email protected]

Rwanda PEFA Assessment, Upgraded Framework 2016
116
Annex 3C: Information Sources – Documents
Legal and regulatory framework
The 2003 Constitution of Rwanda
Rwanda Audit Law 79/2013
East African Community Customs Management Act 2004
Flat Tax Law 2012
Law No. 1/2012 modifying Law No. 25/2005 on tax procedures
Law No. 55/2013 on mineral tax
Ministerial Instructions No. 004/09/10/MIN on the establishment of audit committees
Ministerial Order No. 002/13/10/TC on the use of electronic billing machines
New VAT Law No. 02/2015
Rwanda Public Procurement Law No. 12/2007
Rwanda Revenue Authority: Compilation of Tax Laws in Rwanda
Ministerial Order No. 007/2009 on Asset Disposal
Law No. 06/2015 on Investment Promotion and Facilitation
Budget documents
Budget estimates - Original Finance Law 2011/2012
Budget estimates - Original Finance Law 2012/2013
Budget estimates - Original Finance Law 2013/2014
2015/2016 Final Budget Speech
2015/2016 First Budget Call Circular
2015/2016 Second and Final Budget Call Circular
2015/2016 Budget Framework Paper
2015/2016 Planning and Budgeting Calendar
2014/2015 Budget Execution Report
Macro framework Public Dataset
Auditor-General annual reports
Auditor-General's report on central government 2011/2012
Auditor-General's report on central government 2012/2013
Performance Audit Report - Retrenched Civil Servants
Value-for-Money Audit Report - Agriculture
Accountant General Reports
Consolidated Annual Financial Statements for 2011/2012
Consolidated Annual Financial Statements for 2012/2013
Consolidated Annual Financial Statements for 2013/2014
Rwanda Revenue Authority
Annual Activity Report 2011/2012; 2012/2013; 2013/2014
Taxpayer Education Work Plan 2013/2014
Taxpayer Education Campaign 2013/2014
Commissioner General Directives on Amicable Settlement of Tax Issues
Data on stock of tax arrears 2011/2012, 2012/2013, 2013/2014
Copy of Revenue Reconciliation Report between RRA and MINECOFIN Treasury 2013/2014
Copy of revenue transfer report from RRA to MINECOFIN Treasury April, May, June 2015
Executive Summary of Annual Report on Tax Appeals 2013/2014
Rwanda Revenue Authority Service Charter

Rwanda PEFA Assessment, Upgraded Framework 2016
117
Parliament
Standing Orders of the Senates
Rwanda Public Procurement Authority
Annual Activity Report 2012/2013; 2013/2014; 2014/2015
RPPA National Independent Review Panel Annual Activity Report 2012/2013 dated 10/10/2013
National Independent Review Panel Decision No. 018/2014/NIRP: Case between Rwanda
Police and Rosenbauer International AG
Citizen's charter on payment modalities in public procurement
Rwanda Public Procurement User Guide - November 2010
Standard Bidding Documents for Small Consultancies
Standard Bidding Documents for Large Works
Standard Bidding Documents for Supply of Goods
Other official documents
Vision 2020 document
IMF Article IV Report on Rwanda - Report No. 14/343 - December 2014
Public Investment Guidelines
Donor Performance Assessment Framework (DPAF) 2011/2012; 2012/2013; 2013/2014
Official Development Assistance Report 2011/2012; 2012/2013; 2013/2014
Debt Sustainability Analysis - August 2014
Economic Development and Poverty Reduction Strategy (EDPRS) II: 2013-2018
7-Year Government Programme 2010-2017
Transparency International Corruption Perception Index Report 2014
Internal procurement control and audit manual
Medium Term Debt Strategy - June 2015
Rwanda Development Assistance and Aid Policy July 2006
Independent Evaluation of the Implementation of the PFM Reform Strategy 2008-2012:
November 2012
First and Second Budget Call Circular 2011/2012
PFM Published PAD - World Bank Report: October 2014
MoU on Basket Fund between GoR and Contributing Donors - June 2014
Public Financial Management Sector Strategic Plan 2013-2018
Statement of Government Portfolio on Investments (Financial Assets) 2013/2014
PFM Joint Sector Review Summary Report 2012/2013
Annual Economic Reports 2011/2012; 2012/2013; 2013/2014
Protocol on the Establishment of the East African Monetary Union - November 2013
SmartFMS (IFMIS) Qualify Assurance Group Review Report August 2011
Asset Management Policy - Government of Rwanda

Rwanda PEFA Assessment, Upgraded Framework 2016
118
Annex 4: Data used for scoring PI-1, 2 & 3.2
Table 1 - Fiscal years for assessment
Year 1 = 2011/2012 Year 2 = 2012/2013 Year 3 = 2013/2014
Table 2
Data for year = 2011/2012 administrative or functional
head budget actual
adjusted budget
deviation absolute deviation
%
12 MINECOFIN 88,895,302,951 107,547,739,159 94,859,519,451 12,688,219,708 12,688,219,708 13.4% 18 MININFRA
101,008,190,572 119,712,755,866
107,785,092,128 11,927,663,738 11,927,663,738 11.1% 14 MINEDUC 88,570,444,563 88,254,159,582 94,512,865,471 -6,258,705,889 6,258,705,889 6.6% 01 PRESIREP 60,016,406,332 52,569,584,256 64,043,062,736 -11,473,478,481 11,473,478,481 17.9% 06 MINADEF 50,158,066,055 50,465,196,810 53,523,300,834 -3,058,104,025 3,058,104,025 5.7% 16 MINISANTE 47,971,374,487 44,209,621,889 51,189,898,456 -6,980,276,566 6,980,276,566 13.6% 09 MINAGRI 35,055,032,754 44,557,387,687 37,406,965,846 7,150,421,840 7,150,421,840 19.1% 23 MINALOC 33,819,213,298 40,155,814,337 36,088,232,057 4,067,582,280 4,067,582,280 11.3% 07 MININTER 28,545,129,857 30,344,031,919 30,460,296,675 -116,264,756 116,264,756 0.4% 08 MINAFFET 15,806,482,193 15,500,149,143 16,866,980,091 -1,366,830,947 1,366,830,947 8.1% 10 MINICOM 12,283,030,763 10,260,827,813 13,107,131,163 -2,846,303,351 2,846,303,351 21.7% 22 MINIRENA 9,348,804,962 7,365,213,616 9,976,040,541 -2,610,826,925 2,610,826,925 26.2% 04 PRIMATURE 9,063,121,446 9,472,543,896 9,671,189,777 -198,645,881 198,645,881 2.1% 15 MIJESPOC 8,634,860,419 11,055,824,506 9,214,195,606 1,841,628,900 1,841,628,900 20.0% 05 SUPREME COURT 7,359,989,684 7,032,169,132 7,853,790,486 -821,621,354 821,621,354 10.5% 03 CHAMBER OF DEPUTIES 6,923,771,634 6,528,064,140 7,388,305,436 -860,241,296 860,241,296 11.6% 13 MINIJUST 6,919,213,953 7,948,185,929 7,383,441,968 564,743,961 564,743,961 7.6% 20 MIFOTRA 3,952,408,212 3,226,806,323 4,217,585,533 -990,779,210 990,779,210 23.5% 17 NATIONAL PUBLIC PROSECUTION AUTHORITY (NPPA) 3,537,097,948 3,761,255,493 3,774,411,026 -13,155,533 13,155,533 0.3% 02 SENATE 2,462,446,552 2,646,366,386 2,627,658,480 18,707,906 18,707,906 0.7%
21 (= sum of rest) 3,790,705,652 3,381,299,809 4,045,033,929 -663,734,120 663,734,120 16.4% allocated
expenditure
624,121,094,287 665,994,997,690
665,994,997,690 -0 76,517,936,665
contingency: MinecofinData-
41,416,043,604 63,693,952,888
Interest Payments
16,026,391,639 18,964,965,508
total expenditure 681,563,529,530 748,653,916,086
overall (PI-1) variance
9.8%
composition (PI-2) variance
11.5%
contingency share of budget 9.3%
19 MINIYOUTH - 789,403,466 21 MINEAC 1,803,948,098 1,196,382,263
25 MIDIMAR 1,076,954,020 899,307,379

Rwanda PEFA Assessment, Upgraded Framework 2016
119
11 MINICT 909,803,534 496,206,702
Sub-Total (21 (= sum of rest)
3,790,705,652
3,381,299,809
Table 3
Data for year = 2012/2013 administrative or functional
head budget actual
adjusted budget
deviation absolute deviation
%
12 MINECOFIN 101,657,982,470 216,274,095,306 113,904,984,246 102,369,111,060 102,369,111,060 89.9%
18 MININFRA 119,645,215,533 121,788,038,190 134,059,186,099 -12,271,147,909 12,271,147,909 9.2%
14 MINEDUC 110,114,439,385 92,379,044,206 123,380,212,539 -31,001,168,333 31,001,168,333 25.1%
01 PRESIREP 59,340,506,509 44,011,241,574 66,489,411,799 -22,478,170,224 22,478,170,224 33.8%
06 MINADEF 53,511,884,359 53,533,908,891 59,958,600,366 -6,424,691,475 6,424,691,475 10.7%
16 MINISANTE 48,279,549,713 50,762,149,289 54,095,912,744 -3,333,763,455 3,333,763,455 6.2%
09 MINAGRI 45,656,049,924 49,765,272,109 51,156,353,106 -1,391,080,997 1,391,080,997 2.7%
23 MINALOC 38,302,988,467 40,731,141,352 42,917,449,195 -2,186,307,843 2,186,307,843 5.1%
07 MININTER 34,310,074,346 32,053,076,992 38,443,498,316 -6,390,421,324 6,390,421,324 16.6%
10 MINICOM 16,835,682,685 11,863,785,267 18,863,921,203 -7,000,135,936 7,000,135,936 37.1%
08 MINAFFET 15,893,626,778 16,122,289,902 17,808,373,369 -1,686,083,467 1,686,083,467 9.5%
22 MINIRENA 9,433,066,157 8,709,744,203 10,569,492,192 -1,859,747,989 1,859,747,989 17.6%
05 SUPREME COURT
8,064,508,391 7,574,987,892
9,036,060,710 -1,461,072,818 1,461,072,818 16.2% 15 MINISPOC 8,023,019,953 8,841,060,986
8,989,574,052 -148,513,066 148,513,066 1.7% 03 CHAMBER OF DEPUTIES
6,925,008,944 7,209,883,705
7,759,282,798 -549,399,093 549,399,093 7.1% 13 MINIJUST 6,075,775,633 7,094,035,245
6,807,740,139 286,295,106 286,295,106 4.2% 04 PRIMATURE 5,565,369,019 4,341,586,952
6,235,843,512 -1,894,256,560 1,894,256,560 30.4% 17 NATIONAL PUBLIC PROSECUTION AUTHORITY (NPPA)
3,909,100,010 3,806,808,563
4,380,039,464 -573,230,901 573,230,901 13.1% 19 MYICT 2,940,746,180 2,293,655,525
3,295,025,527 -1,001,370,002 1,001,370,002 30.4% 20 MIFOTRA 2,838,192,276 2,869,964,841
3,180,116,688 -310,151,847 310,151,847 9.8%
21 (= sum of rest) 4,932,101,309 4,831,591,467 5,526,284,393 -694,692,926 694,692,926 12.6%
allocated expenditure 702,254,888,041 786,857,362,457 786,857,362,456 0.0 205,310,812,330 contingency: MinecofinData-
68,001,618,968 67,367,010,392
Interest Payments
18,200,656,820 29,982,754,794
total expenditure 788,457,163,829 884,207,127,643
overall (PI-1) variance
12.1%
composition (PI-2) variance
26.1%
contingency share of budget 8.5%
02 SENATE 2,715,408,523 3,067,271,825
21 MINEAC 1,239,589,740 870,231,990
25 MIDIMAR 977,103,046 894,087,652
Sub-Total (21 (= sum of rest)
4,932,101,309
4,831,591,467
Table 4
Data for year = 2013/2014
administrative budget actual adjusted deviation absolute %

Rwanda PEFA Assessment, Upgraded Framework 2016
120
or functional head
budget deviation
12 MINECOFIN 301,458,689,887 313,091,576,084 323,065,188,930 -9,973,612,846 9,973,612,846 3.1%
18 MININFRA 143,195,473,303 191,507,767,604 153,458,746,384 38,049,021,220 38,049,021,220 24.8%
14 MINEDUC 118,235,459,574 110,178,862,526 126,709,769,421 -16,530,906,895 16,530,906,895 13.0%
01 PRESIREP 57,648,168,442 57,487,398,356 61,779,995,250 -4,292,596,894 4,292,596,894 6.9%
06 MINADEF 55,135,431,359 56,627,235,665 59,087,162,342 -2,459,926,677 2,459,926,677 4.2%
16 MINISANTE 51,623,014,750 49,685,437,748 55,322,999,711 -5,637,561,963 5,637,561,963 10.2%
23 MINALOC 38,437,381,457 40,063,373,840 41,192,310,320 -1,128,936,480 1,128,936,480 2.7%
07 MININTER 37,242,978,122 35,561,834,745 39,912,300,315 -4,350,465,570 4,350,465,570 10.9%
09 MINAGRI 35,522,455,029 40,834,299,889 38,068,461,883 2,765,838,006 2,765,838,006 7.3%
10 MINICOM 19,392,961,685 17,596,710,001 20,782,916,668 -3,186,206,667 3,186,206,667 15.3%
08 MINAFFET 16,702,883,325 21,647,555,931 17,900,031,872 3,747,524,059 3,747,524,059 20.9%
22 MINIRENA 9,808,450,272 9,727,062,665 10,511,452,967 -784,390,302 784,390,302 7.5%
03 CHAMBER OF DEPUTIES
8,402,633,621 9,090,440,720
9,004,876,984 85,563,736 85,563,736 1.0%
05 SUPREME COURT
8,155,629,738 8,265,868,323
8,740,169,551 -474,301,228 474,301,228 5.4%
15 MINISPOC 7,376,606,236 12,801,483,881 7,905,310,967 4,896,172,914 4,896,172,914 61.9%
13 MINIJUST 4,885,756,623 5,780,008,888 5,235,934,274 544,074,614 544,074,614 10.4%
17 NATIONAL PUBLIC PROSECUTION AUTHORITY (NPPA)
3,983,860,799 3,964,235,901
4,269,396,720 -305,160,819 305,160,819 7.1%
04 PRIMATURE 3,323,745,501 3,152,841,120 3,561,968,868 -409,127,748 409,127,748 11.5%
02 SENATE 2,908,490,646 3,430,368,651 3,116,951,382 313,417,269 313,417,269 10.1%
19 MYICT 2,737,714,819 2,875,600,727 2,933,935,511 -58,334,784 58,334,784 2.0%
21 (= sum of rest) 6,549,074,427 6,208,384,384 7,018,467,333 -810,082,949 810,082,949 11.5%
allocated expenditure 932,726,859,615 999,578,347,649 999,578,347,649 0 100,803,223,637
contingency: MinecofinData-
64,044,667,588 107,932,342,785
Interest Payments
40,447,682,416 42,308,841,156
total expenditure 1,037,219,209,619 1,149,819,531,590
overall (PI-1) variance
10.9%
composition (PI-2) variance
10.1%
contingency share of budget 10.4%
20 MIFOTRA 2,557,522,553 2,289,184,986
26 MIGEPROF 2,201,706,196 1,988,056,625
21 MINEAC 989,494,132 899,794,226
25 MIDIMAR 800,351,546 1,031,348,547
Sub-Total (21 (= sum of rest)
6,549,074,427 6,208,384,384
Table 5 - Results Matrix 2011/12 2012/13 2013/14 Rating
Total expenditure variation i.e. PI-1 9.8% 12.1% 10.9% C
Composition variance by function i.e. PI-2(i) 11.5% 26.1% 10.1% C
Composition variance by economic type i.e. PI-2(ii) 4.6% 10.6% 6.0% B
Contingency share of budget i.e. PI-2(iii) 9.3% 8.5% 10.4% -
Average contingency share 9.4% C

Rwanda PEFA Assessment, Upgraded Framework 2016
121
Annex 4 – calculation spreadsheet for PI-3.2
Calculation Sheet for Revenue composition outturn (February 1, 2016)
Data for year = 2011/12
Economic head budget actual adjusted budget
deviation absolute deviation
percent
Taxes 501 557 538.0 19.0 19.0 3.5%
Non-tax revenues 30 34 32.2 1.8 1.8 5.5%
Grants from foreign governments
445 457 477.8 -20.8 20.8 4.4%
Total revenue 976 1048 1,048.0 0.0 41.7
overall variance 107.4%
composition variance 4.0%
Data for year = 2012/13
Economic head budget actual adjusted budget
deviation absolute deviation
percent
Taxes 641.2 651.9 578.6 73.3 73.3 12.7%
Non-Tax revenues 83.2 84.5 75.1 9.4 9.4 12.5%
Grants from foreign governments
496 364.9 447.6 -82.7 82.7 18.5%
Total revenue 1220.4 1101.3 1,101.3 0.0 165.4
overall variance 90.2%
composition variance 15.0%
Data for year = 2013/14
Economic head budget actual adjusted budget
deviation absolute deviation
percent
Taxes 775.4 761 788.5 -27.5 27.5 3.5%
Non-Tax revenues 68 101 69.1 31.9 31.9 46.1%
Grants from foreign governments
470.7 474.3 478.7 -4.4 4.4 0.9%
Total revenue 1314.1 1336.3 1,336.3 0.0 63.7
overall variance 101.7%
composition variance 4.8%
year total revenue deviation composition variance
2011/12 107.4% 4.0%
2012/13 90.2% 15.0%
2013/14 101.7% 4.8%

Rwanda PEFA Assessment, Upgraded Framework 2016
122
Annex 5: Budget Calendar 2015/2016 Fiscal Year
MONTH MINECOFIN MINISTRY DISTRICTS
SEPTEMBER
Issue the 2013/14 Backward looking JSRs TORs Conduct trainings for planners and budget Officers (Two weeks)
Participate in the trainings of planners and budget officers
Participate in the trainings of planners and budget officers
Technical support in preparation of backward looking JSRs provided to sectors
JSR preparatory meetings organized
Elaborate an approach to update and harmonize DDPs with national strategies
Issuance of 1st Planning &
BCC
Dissemination of P&BCC to Agencies Developing internal planning roadmaps, review, identification of gaps and Emerging Priorities
Dissemination of P&BCC to Districts Developing internal planning roadmaps, review, identification of gaps and Emerging Priorities Continuous updating of DDPs
Ministerial and Governors high level meeting conducted to kick start the planning process( Central & local Government, TBC)
Ministerial and Governors high level meeting conducted to kick start the planning process( Central & local Government, TBC)
Provide technical support in drafting of plans Provide technical support & quality assurance of JSR Reports
Drafting 2015/16 Plans and investments Conduct 2013/14 Backward Joint sector reviews Draft JSR Reports produced and JSR Meetings conducted Incorporate feedback and produce the Final JRS report for submission to MINECOFIN
OCTOBER Joint training of district councillors on key components of PFM(Planning, Budgeting and Financial regulations)
District Councillors Training
Provide technical support & quality assurance of plans and investments
Submission of JSR signed reports
Preparation of PPDs, PIP forms and Projects Selection
Ministries’ and Agency consultations on plans and investments
Consultations with the Private Sector on plans and investments conducted
Central and Local government Consultative meetings coordinated by MINALOC/ LODA in 3 Clusters (Economic, Social and Governance)
Central and Local government Consultative meetings coordinated by MINALOC/ LODA in 3 Clusters (Economic, Social and Governance) Continuous updating of DDPs
NOVEMBER
Quality assurance of plans and investments
First Draft Ministries' plans submitted to MINECOFIN for Quality assurance
First Draft Districts' plans , PPDs and PIP forms submitted to the joint planning team of MINALOC & MINECOFIN for quality assurance through LODA

Rwanda PEFA Assessment, Upgraded Framework 2016
123
MONTH MINECOFIN MINISTRY DISTRICTS
Revise Ministries and Agencies plans and investments based on the feedback provided by MINECOFIN
Revise Districts’ plans and investments based on feedback provided from joint planning team led by LODA
Analyse possible gaps in DDPs and update them accordingly
Joint Planning session between central and local Government Including Infrastructure needs Forum
Joint Planning session between central and local Government Including Infrastructure needs Forum
Joint Planning session between central and local Government Including Infrastructure needs Forum
Coordinate the submission of the Second Draft Plans
Adjust Plans and Investments with reference to outcomes from joint planning session between CG & LG including Infrastructure needs
Adjust Plans and Investments with reference to outcomes from joint planning session between CG & LG including Infrastructure needs
Second Draft Ministries' plans submitted to MINECOFIN
Phase 1 Planning Consultations
Phase 1 Planning Consultations
DECEMBER
Phase2 Planning Consultations
Phase2 Planning Consultations
Submit the updated plans to the joint team through LODA
Preparation for National Dialogue
Preparation for National Dialogue
Finalize draft version of updated DDPs and submit to JADF(including private sector representatives and other stakeholders)
Preparation for National Dialogue
National Dialogue (TBC) National Dialogue (TBC) National Dialogue (TBC)
Support ministries and Agencies, and districts in Budget Revision
Budget Revision Budget Revision
Prepare Phase 3 Planning consultations briefs a head of planning consultations
Prepare for Phase 3 planning consultations
JANUARY
Analyze sector Reports on performance against big priority outputs in the 2014/15 budgets
Submit sector Reports on performance against big priority outputs in the 2014/15 budgets
Submit Imihigo progress reports
Phase 3 Planning consultations
Phase 3 Planning consultations
Support Ministries to adjust Plans
Incorporate planning consultations recommendations in the plans
Preparation for Public Investment Committee(PIC)
Preparation for Public Investment Committee(PIC)
Joint consultative forum on LG Projects
Fine-tune PPDs, PIP forms for submission to MINECOFIN
Public Investment Committee( PIC) to agree on projects to be funded in 2015/16
Public Investment Committee( PIC) to agree on projects to be funded in 2015/16 at MINECOFIN

Rwanda PEFA Assessment, Upgraded Framework 2016
124
MONTH MINECOFIN MINISTRY DISTRICTS
Preparation of summary plans for submission to Cabinet
Adjust Plans and Investments with reference to PIC Recommendations
Adjust Plans and Investments with reference to feedback from consultative forum
Submission of summary plans and Budget outlook paper to Cabinet
Issuance of the 2nd
BCC Dissemination of 2nd
BCC to Agencies
Dissemination of 2nd
BCC to Districts
Training of MDA's Staff on budget Data Entry Requirements
Preparation of Budget proposals including earmarked transfers to districts
Preparation of Budget proposals Finalising the MTEF, LPP and approval
Analyzing draft submissions of Budget and MTEF and quality assurance
Submission of Budget proposals, earmarked transfers and MTEF Data entry in IFMIS
Submission of Budget proposals and MTEF Data entry in IFMIS
FEBRUARY
Support Ministries, Agencies and Districts in Data Entry in Smart IFMIS
Data Entry Into Smart IFMIS Data Entry Into Smart IFMIS
Budget Consultation Meetings with Agencies on Budget Priorities and Resource Allocations
Budget consultations
Adjustments from budget consultations
Adjustment from budget consultations and submission of IMIHIGO outputs
Adjustment from budget consultations and submission of IMIHIGO outputs
Leadership retreat (TBC) preparations
Leadership retreat (TBC) preparations
Adjust budget as per budget consultation recommendations Leadership retreat (TBC) preparation
Leadership retreat (TBC) Leadership retreat (TBC) Leadership retreat (TBC)
MARCH
Preparation of the Budget Framework Paper (BFP)
Conduct 2015/16 forward looking Joint sector reviews
Prepare 1st
Imihigo Draft (TBC) in consultation with stakeholders
Finalization of Budget Framework Paper and submission to cabinet
Technical support in preparation of forward looking JSRs provided to sectors
Quality assurance of submitted 2015/16 forward looking draft JSR Reports
Incorporate feedback and produce the JSR Final report for submission to MINECOFIN
Preparations for commemoration of 21
st
Anniversary of Genocide against the Tutsi
Preparations for commemoration of 21
st
Anniversary of Genocide against the Tutsi
Preparations for commemoration of 21
st
Anniversary of Genocide against the Tutsi
Preparation of Public Investment Programme(PIP) 2015/16-2017/18
Submission of Signed Forward Looking JSR reports
APRIL 21st Genocide
commemoration 21
st Genocide
commemoration 21
st Genocide
commemoration
Submission of Draft BFP to Parliament
Approval of the Budget Framework Paper
Joint Quality assurance on Draft Imihigo for ministries & Districts (In collaboration with PMO, PRESREP &MINALOC)
Incorporate feedback and produce the Final draft of Imihigo
Incorporate feedback and produce the Final draft of Imihigo

Rwanda PEFA Assessment, Upgraded Framework 2016
125
MONTH MINECOFIN MINISTRY DISTRICTS
MAY Submission of draft Finance Law to parliament
Participation in DPCG
Hold DPCG meetings Communication of Firm Commitments by Development Partners
JUNE Budget hearings in Parliament
Budget hearings in Parliament
Budget hearings in Parliament
Submission of Final Draft Imihigo
Produce final Imihigo draft Produce final Imihigo draft
Finalization of Public Investment Programme(PIP) 2015/16- 2017/18
Preparation of the Budget speech and finalization of the finance law
Approval of Finance Law by Parliament
District Council Scrutiny and Approval of Annual Budget and IMIHIGO
Presentation of Finance Law to the Parliament