Public Expenditure and Financial Accountability … downloads/Lesotho PEFA 2016...Public Expenditure...
189
i Contract number: FED/2015/357-008 Contracting Authority: National Authorising Office (NAO), Lesotho Ministry of Finance Public Expenditure and Financial Accountability (PEFA) Assessment 2016 Final Report April 2017 This service contract is financed by The European Union A service contract implemented by LINPICO Sarl in consortium with GRM International and NTU Support to Public Finance Management Reform, Kingdom of Lesotho
Transcript of Public Expenditure and Financial Accountability … downloads/Lesotho PEFA 2016...Public Expenditure...

i
Contract number: FED/2015/357-008 Contracting Authority: National Authorising Office (NAO), Lesotho Ministry of Finance
Public Expenditure and Financial Accountability (PEFA) Assessment 2016
Final Report
April 2017
This service contract is financed by
The European Union
A service contract implemented by LINPICO Sarl
in consortium with GRM International and NTU
Support to Public Finance Management Reform, Kingdom of Lesotho

ii
ACRONYMS AND ABBREVIATIONS ............................................................................................... VI
EXECUTIVE SUMMARY .................................................................................................................. 1
Purpose and Management of the Assessment ................................................................................. 1
Assessment Coverage and Timing .................................................................................................... 1
Impact of PFM Systems on the three main budgetary outcomes ..................................................... 2
Strategic Allocation of Resources ...................................................................................................... 2
Efficient Use of Resources for Service Delivery ................................................................................. 3
Performance Changes since Last Assessment ................................................................................... 4
Overview of ongoing and planned PFM Reforms and Main Weaknesses Identified ........................ 7
1 INTRODUCTION ...................................................................................................................... 9
1.1 RATIONALE AND PURPOSE ............................................................................................................... 9
1.2 ASSESSMENT MANAGEMENT AND QUALITY ASSURANCE .................................................................... 10
1.3 ASSESSMENT METHODOLOGY ........................................................................................................ 11
Coverage of the Assessment ........................................................................................................... 11
When Performance was Assessed .................................................................................................. 12
Sources of Information .................................................................................................................... 12
Other methodological issues for the preparation of the report...................................................... 13
2 COUNTRY BACKGROUND INFORMATION .............................................................................. 14
2.1 ECONOMIC SITUATION .................................................................................................................. 14
2.1.1 Country Context ................................................................................................................ 14
2.1.2 Key aspects of the Government's Economic and Fiscal Reforms ...................................... 15
2.1.3 Key Economic Indicators ................................................................................................... 16
2.2 FISCAL AND BUDGETARY TRENDS .................................................................................................... 17
2.2.1 Fiscal Performance ............................................................................................................ 17
2.2.2 Allocation of Resources ..................................................................................................... 17
2.3 LEGAL AND REGULATORY ARRANGEMENTS FOR PFM ........................................................................ 18
2.4 INSTITUTIONAL ARRANGEMENTS FOR PFM ...................................................................................... 19
2.5 OTHER IMPORTANT FEATURES OF PFM AND ITS OPERATING ENVIRONMENT ......................................... 21
3 ASSESSMENT OF PFM PERFORMANCE ................................................................................... 24
PILLAR I. BUDGET RELIABILITY .................................................................................................................. 24
PI-1 Aggregate Expenditure Outturn ........................................................................................ 24
PI-2 Expenditure Composition Outturn ..................................................................................... 25
PI-3 Revenue Outturn ................................................................................................................ 27
PILLAR II. TRANSPARENCY OF PUBLIC FINANCES .......................................................................................... 29
PI-4 Budget Classification .......................................................................................................... 29
PI-5 Budget Documentation ...................................................................................................... 29
PI-6 Central Government Operations outside Financial Reports .............................................. 31
PI-7 Transfers to Sub-National Governments............................................................................ 32
PI-8 Performance Information for Service Delivery ................................................................... 34
PI-9 Public Access to Fiscal Information .................................................................................... 37
PILLAR III. MANAGEMENT OF ASSETS AND LIABILITIES ................................................................................. 39
PI-10 Fiscal Risk Reporting .......................................................................................................... 39
PI-11 Public Investment Management ........................................................................................ 41
iii
PI-12 Public Asset Management ................................................................................................. 44
PI-13 Debt Management ............................................................................................................. 45
PILLAR IV. POLICY-BASED FISCAL STRATEGY AND BUDGETING ....................................................................... 49
PI-14 Macroeconomic and Fiscal Forecasting ............................................................................. 49
PI-15 Fiscal Strategy .................................................................................................................... 50
PI-16 Medium-Term Perspective in Expenditure Budgeting ....................................................... 52
PI-17 Budget Preparation Process ............................................................................................... 54
PI-18 Legislative Scrutiny of Budgets .......................................................................................... 56
PILLAR V. PREDICTABILITY AND CONTROL IN BUDGET EXECUTION ................................................................. 60
PI-19 Revenue Administration ..................................................................................................... 60
PI-20 Accounting for Revenue ..................................................................................................... 64
PI-21 Predictability of in-year Resource Allocation ..................................................................... 65
PI-22 Expenditure Arrears ........................................................................................................... 68
PI-23 Payroll Controls .................................................................................................................. 69
PI-24 Procurement ...................................................................................................................... 73
PI-25 Internal Controls on Non-Salary Expenditure .................................................................... 77
PI-26 Internal Audit ..................................................................................................................... 79
PILLAR VI. ACCOUNTING AND REPORTING ................................................................................................. 85
PI-27 Financial Data Integrity ..................................................................................................... 85
PI-28 In-year Budget Reports ...................................................................................................... 87
PI-29 Annual Financial Reports ................................................................................................... 89
PILLAR VII. EXTERNAL SCRUTINY AND AUDIT .............................................................................................. 93
PI-30 External Audit .................................................................................................................... 93
PI-31 Legislative Scrutiny of Audit Reports ................................................................................. 96
4 CONCLUSIONS OF THE ANALYSIS OF PFM SYSTEMS ............................................................... 99
4.1 INTEGRATED ASSESSMENT OF PFM PERFORMANCE .......................................................................... 99
Budget Reliability ............................................................................................................................ 99
Transparency of Public Finances ..................................................................................................... 99
Management of Assets and Liabilities .......................................................................................... 100
Policy-Based Fiscal Strategy and Budgeting ................................................................................. 100
Predictability and Control in Budget Execution ............................................................................ 101
Accounting and Reporting ............................................................................................................ 102
External Scrutiny and Audit ........................................................................................................... 102
4.2 EFFECTIVENESS OF THE INTERNAL CONTROL FRAMEWORK ................................................................ 103
4.3 PFM STRENGTHS AND WEAKNESSES ............................................................................................. 107
Aggregate Fiscal Discipline ........................................................................................................... 107
Strategic Allocation of Resources .................................................................................................. 108
Efficient Use of Resources for Service Delivery ............................................................................. 109
4.4 PERFORMANCE CHANGES SINCE A PREVIOUS ASSESSMENT ............................................................... 109
5 GOVERNMENT REFORM PROCESS ....................................................................................... 112
5.1 APPROACH TO PFM REFORMS ..................................................................................................... 112
5.2 RECENT AND ONGOING REFORM ACTIONS ..................................................................................... 113
5.3 INSTITUTIONAL CONSIDERATIONS ................................................................................................. 115
Government Leadership and Ownership....................................................................................... 115

iv
Coordination across Government ................................................................................................. 115
A Sustainable Reform Process ....................................................................................................... 116
Transparency of the PFM Programme .......................................................................................... 116
6 ANNEXES............................................................................................................................ 117
ANNEX 1: PERFORMANCE INDICATOR SUMMARY ..................................................................... 118
ANNEX 2: INTERNAL CONTROL COMPONENTS AND ELEMENTS .................................................. 127
ANNEX 3: SOURCES OF INFORMATION ...................................................................................... 131
ANNEX 4: EXIT WORKSHOP (INVITATION, PROGRAMME, AND ATTENDANCE) ............................ 152
ANNEX 5: SUMMARY ASSESSMENT BASED ON OLD (2011) METHODOLOGY ............................... 156
ANNEX 6: PEFA CHECK ACCREDITATION .................................................................................... 183

v
DISCLAIMER
The opinions contained in this report are of the exclusive responsibility of the authors
and do not represent, in any way, the official position of the Government of Lesotho,
nor the European Union, nor those of its Member States.
vi
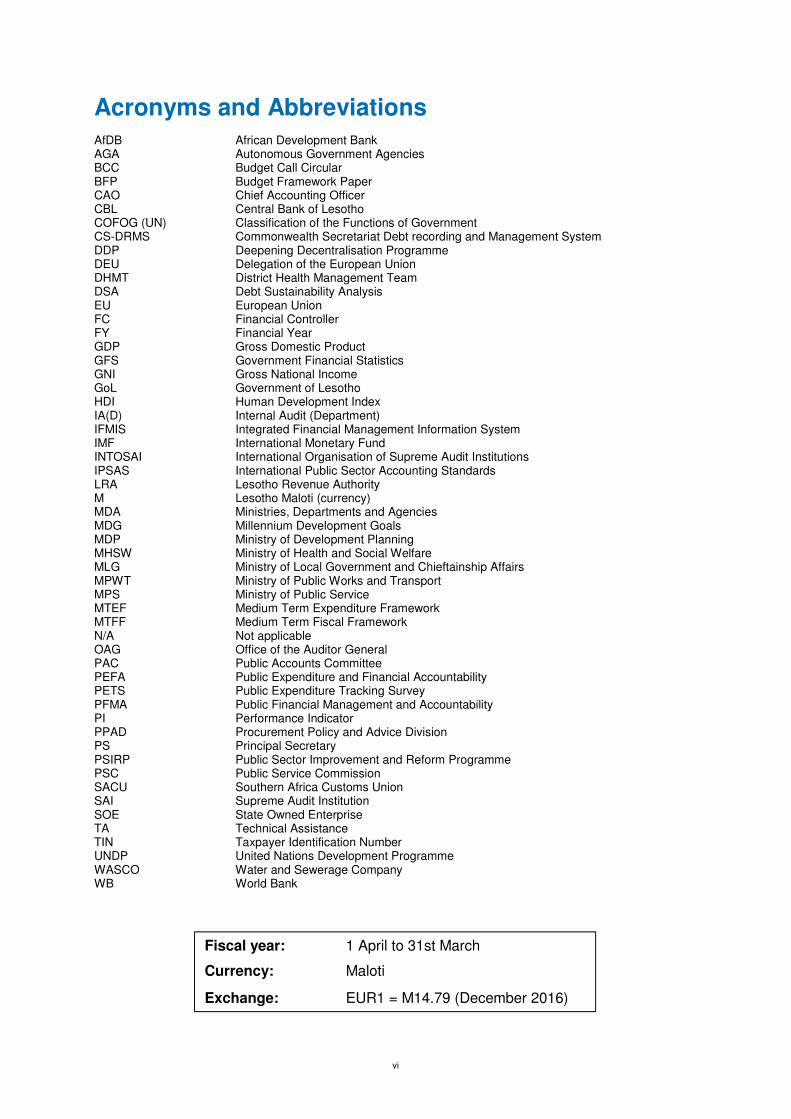
Acronyms and Abbreviations AfDB African Development Bank AGA Autonomous Government Agencies BCC Budget Call Circular BFP Budget Framework Paper CAO Chief Accounting Officer CBL Central Bank of Lesotho COFOG (UN) Classification of the Functions of Government CS-DRMS Commonwealth Secretariat Debt recording and Management System DDP Deepening Decentralisation Programme DEU Delegation of the European Union DHMT District Health Management Team DSA Debt Sustainability Analysis EU European Union FC Financial Controller FY Financial Year GDP Gross Domestic Product GFS Government Financial Statistics GNI Gross National Income GoL Government of Lesotho HDI Human Development Index IA(D) Internal Audit (Department) IFMIS Integrated Financial Management Information System IMF International Monetary Fund INTOSAI International Organisation of Supreme Audit Institutions IPSAS International Public Sector Accounting Standards LRA Lesotho Revenue Authority M Lesotho Maloti (currency) MDA Ministries, Departments and Agencies MDG Millennium Development Goals MDP Ministry of Development Planning MHSW Ministry of Health and Social Welfare MLG Ministry of Local Government and Chieftainship Affairs MPWT Ministry of Public Works and Transport MPS Ministry of Public Service MTEF Medium Term Expenditure Framework MTFF Medium Term Fiscal Framework N/A Not applicable OAG Office of the Auditor General PAC Public Accounts Committee PEFA Public Expenditure and Financial Accountability PETS Public Expenditure Tracking Survey PFMA Public Financial Management and Accountability PI Performance Indicator PPAD Procurement Policy and Advice Division PS Principal Secretary PSIRP Public Sector Improvement and Reform Programme PSC Public Service Commission SACU Southern Africa Customs Union SAI Supreme Audit Institution SOE State Owned Enterprise TA Technical Assistance TIN Taxpayer Identification Number UNDP United Nations Development Programme WASCO Water and Sewerage Company WB World Bank
Fiscal year: 1 April to 31st March
Currency: Maloti
Exchange: EUR1 = M14.79 (December 2016)

1
Executive Summary
Purpose and Management of the Assessment
This Public Expenditure and Financial Accountability (PEFA) Performance Assessment
Report evaluates the seven core pillars of the Public Financial Management (PFM) system of
the Government of Lesotho (GoL) as set out in the summary assessment below. It evaluates
how effectively the PFM system achieves the desirable budget outcomes of aggregate fiscal
discipline, strategic allocation of resources, and efficient service delivery. The assessment
was conducted in consultation with officials of the GoL and a team of international
consultants. An oversight team with representatives of GoL managed the project.
Prior to this current assessment, two previous PEFA assessments have been conducted in
Lesotho at central government level; the first in 2009 covering FY2005/2006 to FY2007/2008
and the second in 2012 covering FY2009/2010 to FY2011/2012
This assessment uses the revised 2016 PEFA framework.
The main report has the following structure:
• Chapter 1 is an introduction explaining the context, purpose and process of preparing
the report, specifying the institutional coverage;
• Chapter 2 provides an overview of relevant country-related information that provides
the context underpinning the indicator results and the overall PFM performance;
• Chapter 3 provides the detailed assessment of performance in terms of the seven
pillars of the PFM system. It provides analysis and measurement of results in terms of
the 31 performance indicators (PIs) of PFM performance;
• Chapter 4 includes an integrated crosscutting analysis on performance of the PFM
systems and how it impacts on the Government’s ability to deliver on the intended
fiscal and budgetary outcomes, and to identify the most important systems
weaknesses in that respect;
• Chapter 5 provides an overview of government´s PFM reform programmes including
the institutional factors that are likely to impact the planning and implementation of
reforms;
• Annexes 1-6 provide supporting data and information to the assessment.
Assessment Coverage and Timing
The assessment covers budgetary Central Government (including deconcentrated
government; education and health operations), the Auditor General and Parliament.
Subnational Government has been included insofar as the government’s oversight of fiscal
risks arising from Local Government Units are concerned. Local Government Units per se,
were covered in this assessment, as they are not separate budget heads. However, they are
included in the expenditure of Ministry of Local Government. Public Corporations/
Enterprises (primarily concerned with water and electricity) form an important part of the
economy, and the government has shareholdings in a number of commercial or semi-
commercial enterprises and more recently has engagements in Public Private Partnerships

2
(PPP). The coverage also includes the governments monitoring of government-owned or -
controlled corporations, concerning fiscal risks and possibly contingent liabilities related to
their operations.
Data gathering for the assessment, took place primarily between October and November
2016.
Completed Fiscal Years are 2013/14, 2014/15, and 2015/16; the latest three years for which
completed budget data is available. The last completed Fiscal Year is 2016, and the latest
budget submitted to legislature and enacted is for the Fiscal Year 2016/17. As of the time of
drafting this report, external audit of central government consolidated financial statements for
FY2014/2015 and FY2015/2016 have not been completed. The analysis of the performance
indicators in Chapter 3 is based on the latest data available in each case, following the
guidelines for each indicator.
At the level of Government institutional entities, the focus is on PFM practices as evidence of
Government performance rather than a review of specific entities.
Impact of PFM Systems on the three main budgetary outcomes
Fiscal Discipline
Aggregate fiscal discipline requires that the budget be delivered as planned, with effective
systems for ensuring financial compliance by all staff engaged in PFM activities. The PFM
compliance functions must work well, as measured by relevant PFM Performance Indicators.
The most relevant of these indicators and their assessment indicate that fiscal discipline
(aggregate and at the component level) is undermined by weak budget credibility,
compliance, accounting and reporting:
• Controls of spending are deficient and reporting on budget outturns is late.
• Timely accounting and reporting is not working well and both in-year reporting as well
as annual financial statements are late and with unsure quality. The Auditor General
has for several years given qualified opinions on annual financial statements.
• Central control over cash is not working well, making the planning of government
spending difficult.
• Inadequate internal controls for both payroll and procurement.
• External controls are hampered by late submission of financial statements and the
fact that MoF unnecessarily delays the Auditor General´s reports.
Strategic Allocation of Resources
Strategic allocation of resources requires planning and executing the budget to be in line with
government priorities aimed at achieving policy objectives. Some of the relevant indicators
and their ratings show that the upstream processes of budget formulation and budget
process perform fairly well. However, there are weaknesses in terms of downstream
implementation of policies because of deficient upstream budget decisions and allocations.
Whereas a strong framework exists for objectively analysing and selecting public
investments, the medium to long-term ramifications of forward linked recurrent expenditures
are not fully considered during appraisal stages; this has implication on subsequent annual
budget estimates in terms of available fiscal space. Processes have also been hampered
severely by delays and deficient transparency and control:

3
• The Macro department is developing useful analysis but they are not yet implemented
in the budget process and the budget documentation, as the forward estimates in the
budgets so far seem to be derived from incremental calculation processes.
• The budget preparation process, including legislative scrutiny of budgets, shows that
these processes are in place and working fairly well.
• Expenditure composition outturn is showing that the final year-end result did not
deliver the resource allocation intended at the beginning of the year.
• Predictability and control of the budget is showing disappointing results
demonstrating the difficulty for budget managers to monitor and manage their
budgets.
• Fiscal risks, assets and liabilities are areas of great concern. There are obvious and
systematic weaknesses in the systems for monitoring different risks leading to
potentially considerable government losses.
Efficient Use of Resources for Service Delivery
Non-compliance with the budget may lead to a shift across expenditure categories; this
potentially has a negative effect on efficient service delivery.
The current PFM system in Lesotho hampers efficient service delivery. The budget process
does not have a strong policy or strategic focus and controls are deficient. Currently, there is
no applied medium-term fiscal strategy to guide the budget process.
The most relevant indicators and their ratings show an appropriate budget development
process but inadequate performance in budget execution:
• Budget (expenditure composition outturn) is a major concern for service delivery. This
means that the original intentions of the budget as approved by parliament to meet
service delivery is derailed by in-year decisions to reallocate these estimates across
sectors
• Budget information is not transparent and comprehensive; this defeats citizens' ability
to follow through and track resource allocations for service delivery. .
• Policy-based budgeting with a multi-year perspective is lacking. The budget process
is able to deliver such a perspective but does not currently have the tools to do so.
• The procurement and tendering processes need an urgent total rehabilitation of the
government procurement system as both performance and controls are deficient.
In summary, there is significant fiscal indiscipline resulting in wasteful government
expenditure because of very weak linkages to policy priorities and initiatives as originally
intended, thereby contributing to misallocation of scarce government resources, resulting in
poor service delivery. The fiscal risk exposure to government is huge but still unknown in
nominal terms; the existence of PPPs that are currently running and government's intention
to fund other investment projects through PPP arrangements significantly poses a threat to
government finances especially so when there are neither guidelines nor legislation on PPP.
Again, government capacity on PPP arrangement is very limited.

4
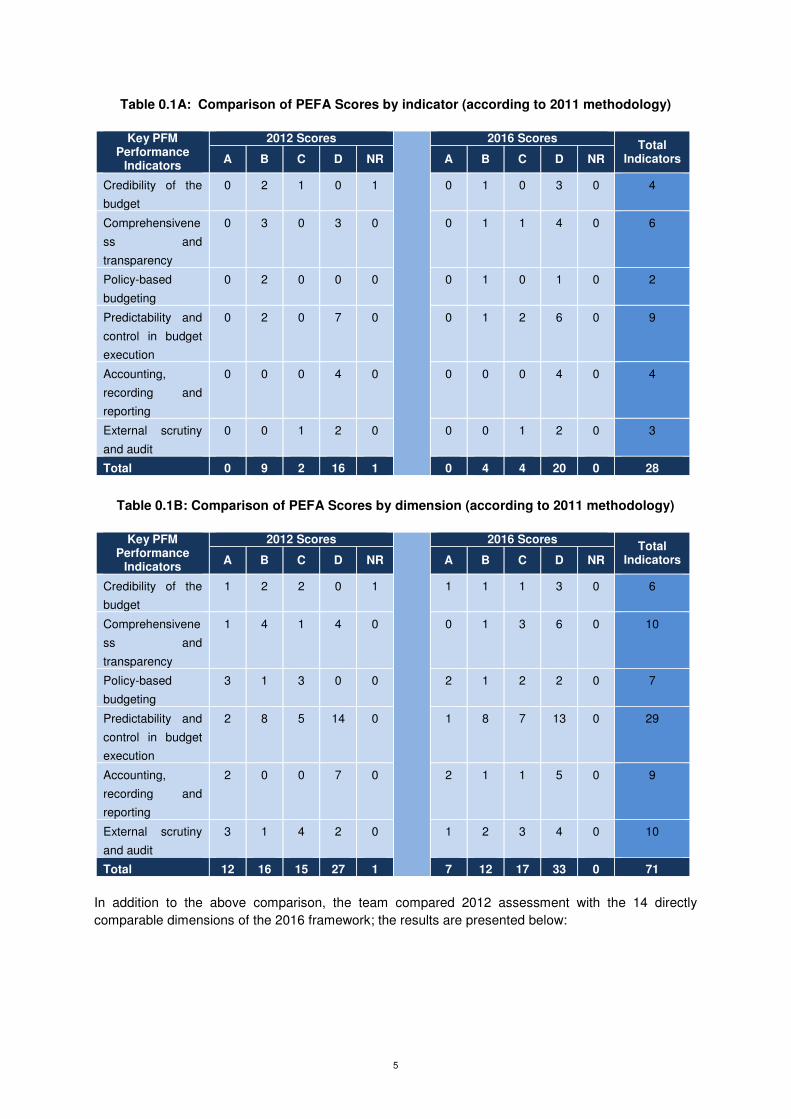
Performance Changes since Last Assessment
In line with tracking performance changes in accordance with the PEFA methodology, the
tables below provide performance changes both at the level of indicators and dimensions. As
indicated in the two tables below, scores have deteriorated significantly at both indicator and
dimension levels since 2012. For instance, whereas there were 9 'Bs' and 16 'Ds' in 2012 at
performance indicator level, 2016 recorded only 4 'Bs' but with an increase number of 'Ds' to
20. At dimension level, 2012 recorded 12 'As' and 27 'Ds'; but this deteriorated to 7 'As' and
33 'Ds'. Annex 7.2 provides detailed ratings and performance changes per dimension
according to the old (2011) PEFA methodology. Overall, scores and performance have
deteriorated.
The analysis of the results points to deterioration of aggregate fiscal discipline when
compared with 2012 assessment, principally due to significant budget overruns even though
revenue outturns were close to targets. Unbudgeted increases in civil servants emoluments
during the years 2014/2015 and 2015/2016 were the main contributing factor, coupled with
expenditures relating to staff capacity building initiatives. Again, huge backlogs and delays in
accounts reconciliations as a basis for monitoring budget execution contribute to fiscal
indiscipline
Whiles expenditures out of contingency vote has been consistently maintained within set
limits, which is impressive, composition variances have been extremely high, the impact of
which is poor and ineffective resource allocation according to original short and medium
term strategic plans; this therefore defeats policy-based budgeting intents.
Comprehensiveness and transparency of fiscal information required for proper social
accountability appear to be fallen short of expectations. The existence of IFMIS has had
very limited positive impact on good financial management practices. Procurement
management has remained stagnant since 2012; nonetheless, the establishment of
independent procurement tribunal is seen as a positive step towards transparency
Service delivery across the entire government machinery has been disappointing; there are
no signs of improvement. This has been compounded by poor resource allocation described
above. Internal controls for both salary and non-salary expenditures has not improved,
especially so with payroll controls. The general external oversight functions of both the
supreme audit institution and parliament have seen very little or no improvements.
5
Table 0.1A: Comparison of PEFA Scores by indicator (according to 2011 methodology)
Key PFM
Performance Indicators
2012 Scores
2016 Scores Total
Indicators A B C D NR A B C D NR
Credibility of the
budget
0 2 1 0 1 0 1 0 3 0 4
Comprehensivene
ss and
transparency
0 3 0 3 0 0 1 1 4 0 6
Policy-based
budgeting
0 2 0 0 0 0 1 0 1 0 2
Predictability and
control in budget
execution
0 2 0 7 0 0 1 2 6 0 9
Accounting,
recording and
reporting
0 0 0 4 0 0 0 0 4 0 4
External scrutiny
and audit
0 0 1 2 0 0 0 1 2 0 3
Total 0 9 2 16 1 0 4 4 20 0 28
Table 0.1B: Comparison of PEFA Scores by dimension (according to 2011 methodology)
Key PFM
Performance Indicators
2012 Scores
2016 Scores Total
Indicators A B C D NR A B C D NR
Credibility of the
budget
1 2 2 0 1 1 1 1 3 0 6
Comprehensivene
ss and
transparency
1 4 1 4 0 0 1 3 6 0 10
Policy-based
budgeting
3 1 3 0 0 2 1 2 2 0 7
Predictability and
control in budget
execution
2 8 5 14 0 1 8 7 13 0 29
Accounting,
recording and
reporting
2 0 0 7 0 2 1 1 5 0 9
External scrutiny
and audit
3 1 4 2 0 1 2 3 4 0 10
Total 12 16 15 27 1 7 12 17 33 0 71
In addition to the above comparison, the team compared 2012 assessment with the 14 directly
comparable dimensions of the 2016 framework; the results are presented below:

6
Table 0.1C: Changes in the ratings for directly comparable dimensions since 2012
Old Indicator/ Dimension (2012)
New Indicator/ Dimension (2016)
2012 Score
2016 Score
Performance change since 2012
2.2
The average amount of expenditure actually charged to the contingency vote over the last three years
2.3 Expenditure from Contingency Reserves
A A
PI-5 Classification of the Budget
PI-4 Budget Classification B C
17.1 Quality of debt data recording and reporting
13.1 Reporting of Debt and Guarantees
A B
11.1 Existence of and adherence to a fixed budget calendar
17.1 Budget calendar C C
11.2
Clarity/ Comprehensiveness of and political involvement in the guidance on the preparation of budget submissions (budget circular or equivalent)
17.2 Guidance on budget preparation
A A
27.1 Scope of the legislature’s scrutiny
18.1 Scope of budget scrutiny
B B
27.4
Rules for in-year amendments to the budget without ex-ante approval by the legislature
18.4 Rules for budget adjustments by the executive
C C
17.2 Extent of consolidation of the government’s cash balances
21.1 Consolidation of cash balances
D D
16.1 Extent to which cash flows are forecast and monitored
21.2 Cash forecasting and monitoring
D D
16.2
Reliability and horizon of periodic in-year information to MDAs on ceilings for expenditure commitment
21.3 Information on commitment ceilings
A B
16.3
Frequency and transparency of adjustments to budget allocations, which are decided above the level of management of MDAs.
21.4 Significance of in-year budget adjustments
B B
18.3 Internal controls of changes to personnel records and the payroll
23.3 Internal control of payroll
D D
18.4
Existence of payroll audits to identify control weaknesses and/or ghost workers.
23.4 Payroll audit D D
20.1 Effectiveness of expenditure commitment controls.
25.2 Effectiveness of expenditure commitment controls
B C
Legend
Improved Slipped No Change
Of importance to note is that only 14 dimensions are directly comparable between the old
(2011) and the new (2016) frameworks. Above, table 0.1C provides a summary analysis of
7
performance change since 2012 compared to 2016. Whereas the overall 2016 PFM
performance is incomparable with the 2012 assessment, the general observation is that of no
improvement and in some cases, there is a decline in performance.
In all four cases below, the assessment, team opines that the 2012 assessment ratings were
too high, based on the following:
• Budget Classification: This has remained unchanged since 2012; Budget
Classification is based on administrative and economic categories compliant with
GFS 2001; COFOG has not been applied since 2012. The Government is working
towards GFS 2014, which will include COFOG;
• Quality of Debt Data Recording: In 2012, the team did not consider PPP in assessing
this dimension, probably because there were no ongoing PPP arrangements. In
2016, however, PPP was considered, firstly because of a number of ongoing PPP
arrangements, and secondly the non-existence of PPP Policy Guidelines and/or
Legislation;
• Information on Commitment Ceilings: In 2012, expenditure commitments ceilings are
issued quarterly to budget entities; this has not changed;
• Effectiveness of Expenditure Commitment Controls: The 2012 Assessment ignored
commitments outside IFMIS; this practice is not new. The 2016 Assessment took
account of commitment controls both within IFMIS and outside IFMIS.
It is therefore fair to conclude that performance has remained unchanged since 2012 with
reference to the four dimensions outlined above.
Overview of ongoing and planned PFM Reforms and Main
Weaknesses Identified
The overall PFM Reform Action Plan is a wide-ranging but interrelated approach to PFM
reforms. Development Partners have endorsed this approach, through individually and
jointly, providing financial commitments in support of the government’s initiatives.
However, the Action Plan is Government of Lesotho (GoL) owned and led at high-level
through the Improvement Reform Steering Committee (IRSC), and at an operational level
through Component Leaders who are senior government officials, just below the level of
Heads of Departments.
The principal stakeholders of EU-Lesotho co-operation are:
i. The European Union Delegation;
ii. The Ministry of Finance key departments and implementing units: National
Authorising Office; PFM Secretariat, Budget Department, Macroeconomic Policy
Management Department, Legal Department, Private Sector Development and
Financial Affairs Department;
iii. The Ministry of Development Planning relevant departments, including: Department
of Aid Coordination, and the Project Cycle Management Department;
iv. The World Bank; the African Development Bank, and the IMF.
The PFM Reform Action Plan covers the period of financial years 2012/13 to 2017/18
inclusive and has eight technical and institutional development components, at an estimated
cost of USD 27.07million.
8
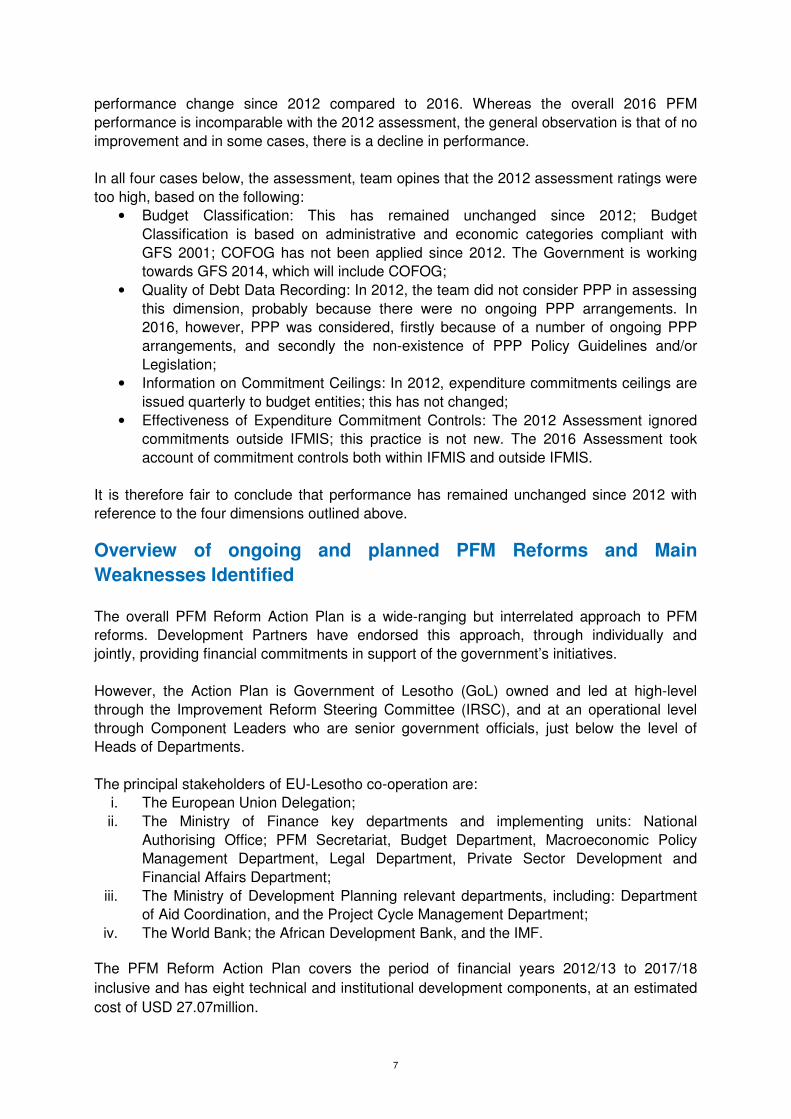
Table 0.2: Overall summary of PFM Performance Scores
PFM Performance Indicator (PI) Scoring
Method
Dimension Ratings Overall
Rating i. ii. iii. iv.
Pillar I: Budget reliability
PI-1 Aggregate expenditure outturn M1 D D
PI-2 Expenditure composition outturn M1 D D A D+
PI-3 Revenue outturn M2 B C C+
Pillar II. Transparency of public finances
PI-4 Budget classification M1 C C
PI-5 Budget documentation M1 C C
PI-6 Central government operations outside fiscal reports M2 D D D D
PI-7 Transfers to sub-national governments M2 C D D+
PI-8 Performance information for service delivery M2 D D D D D
PI-9 Public access to key fiscal information M1 D D
Pillar III. Management of assets and liabilities
PI-10 Fiscal risk reporting M2 D D D* D
PI-11 Public investment management M2 C B B B B
PI-12 Public asset management M2 D D C D+
PI-13 Debt management M2 C C D D+
Pillar IV. Policy-based fiscal strategy and budgeting
PI-14 Macroeconomic and fiscal forecasting M2 C C D D+
PI-15 Fiscal Strategy M2 D C C D+
PI-16 Medium-term perspective in expenditure budgeting M2 B A D C C+
PI-17 Budget preparation process M2 C A C B
PI-18 Legislative scrutiny of budgets M1 B A C C C+
Pillar V. Predictability and control in budget execution
PI-19 Revenue administration M2 A C C B B
PI-20 Accounting for revenues M1 D B D D+
PI-21 Predictability of in-year resource allocation M2 D D B B C
PI-22 Expenditure arrears M1 D C D+
PI-23 Payroll controls M1 D D D D D
PI-24 Procurement M2 D D* D D D
PI-25 Internal controls on non salary expenditure M2 A C D C+
PI-26 Internal audit M1 C D D D D+
Pillar VI. Accounting and Reporting
PI-27 Financial data integrity M2 D D D A D+
PI-28 In-year budget reports M1 C D C D+
PI-29 Annual financial reports M1 B B D D+
Pillar VII. External Scrutiny and Audit
PI-30 External audit M1 C D C D D+
PI-31 Legislative scrutiny of audit reports M2 D D D D D

9
1 Introduction
1.1 Rationale and Purpose
The Public Expenditure and Financial Accountability (PEFA) program provides a framework
for assessing and reporting on the strengths and weaknesses of Public Financial
Management (PFM) using quantitative indicators to measure performance. PEFA is a tool
that helps governments achieve sustainable improvements in PFM practices by providing a
means to measure and monitor performance against a set of indicators across the range of
important public financial management institutions, systems, and processes.
The previous PEFA Assessment for the Government of Lesotho (GoL) which was based on
the 2011 revised PEFA Framework, was undertaken during 2012 (based on data covering
the period 2009/10 – 2011/12 and the PFM status as of mid-2012), and published in
November 2012. This means that the results from the new assessment based on the new
2016 framework will create a new baseline for successive assessments. The results from the
2016 assessment are only partly comparable with the previous assessment, as new
indicators have been added while most of the remaining indicators have changed
composition and scoring calibration. There are two scoring method; the first is M1 which uses
the weakest link for averaging the overall score - in this case, the dimension with the lowest
rating is taking as the overall score and a '+' is added where the other dimension has a
higher rating. The second method is M2 - where a mathematical average is used; for ease of
reference, this is accounted for in the PEFA framework on page 10
The 2012 assessment identified a number of areas where significant PFM improvements
have occurred since 2009, among them the passing of the Public Financial Management
and Accountability Act 2011 and the installation of the new Integrated Financial
Management Information System (IFMIS). However, overall progress since 2009 was
deemed rather disappointing by the 2012 assessment.
The purpose of this Report is to provide information to stakeholders about the actual
performance of the GoL’s current PFM system against the new common and standardized
Assessment Framework, and thereby facilitate the identification of areas of reform priorities.
In addition, the PEFA Report brings out the status quo as a guide for future reform priorities
of the GoL and provides information to international Development Partners to be taken into
account in their future cooperation with and support for the PFM Reform Plans of GoL.
The first step in the preparation of this assessment was planned to be a PEFA training
intervention in August 2016 for related GoL departments and agencies, at which the purpose
and methodology of the PEFA Assessment was presented and included a number of training
activities and workshops for a selected number of GoL key staff. This training was foreseen
in the Logical framework of the support to PFM reform, component #8. However, despite its
permanent goodwill and constant impressive efforts, the M&E unit of the Planning Directorate
did only get a limited number of 10 participants, most of them focal points of the EU PFM
support project, which changed the original training plan. Nevertheless, the training
10
intervention carried out daily sessions and collected useful information in advance for the
oncoming PEFA team.
The overall objective of this PEFA assessment was to draft a comprehensive “PFM
Performance Report” (PFM-PR) prepared according to the PEFA Performance Measurement
Framework Methodology of 2016 so as to provide an analysis of the overall performance of
the PFM systems of the GoL and to provide a baseline against which future progress can be
measured.
More specifically, the results of this assignment will provide the GoL and its Development
Partners with:
a) An assessment of the quality of PFM in the GoL in 2016, based on the PEFA
methodology, including an assessment of the relative strengths and weaknesses of the
three main budgetary outcomes: Aggregate fiscal discipline, Strategic resource
allocation and Efficient service delivery, and;
b) A basis for further analysis and dialogue on PFM Reforms, to inform future updates to
the PFM SSP and subsequent action plans. Additionally, inform the monitoring and
evaluation work of government, development partners and other stakeholders.
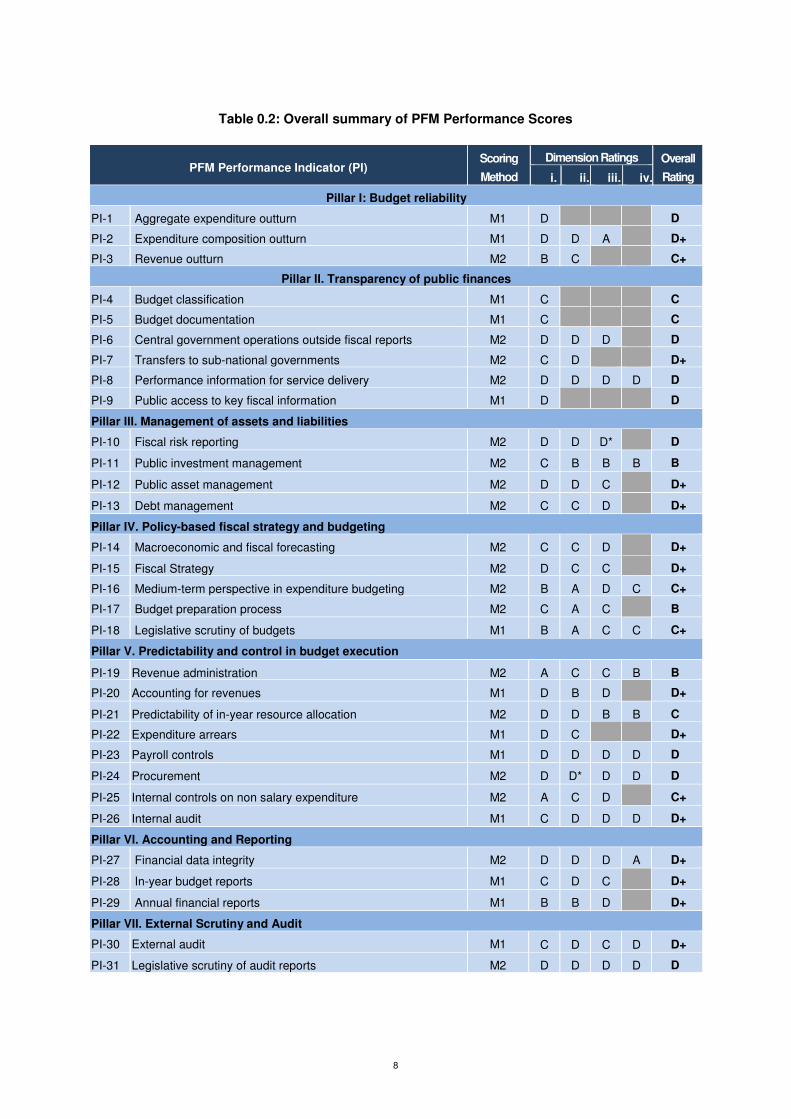
1.2 Assessment Management and Quality Assurance
Box 1-1 Assessment Management and Quality Assurance Arrangements
PEFA Assessment Management Organization Oversight Team – Chair & Members:
• Chair, Mr. Habofanoe Makopela – Director Planning, MoF
• Ms. Maleshoane Lekomola – Chief Budget Officer, MoF • Mr. Tom Mpeta – Principal Secretary of Finance, MoF
• Mr. Sam Mphaka – Accountant General, MoF • Mrs. Motena Ts’olo – Chief Executive Macroeconomic Policy Management Department,
MoF
• Mr. Ts'olo Maoeng, PFM Monitoring and Evaluation, and Quality Control Officer, MoF
• Assessment Manager: Mr. Ts'olo Maoeng, PFM Monitoring and Evaluation, and Quality Control Officer, MoF
Assessment Team:
• Göran Steen, PEFA Team Leader • Charles Hegbor, PEFA Expert 1 • James Botha, PEFA Expert 2
Review of Concept Note and/or Terms of Reference Date of reviewed draft concept note and/or Terms of Reference: August 2016 Invited Reviewers:
• PEFA Secretariat • Government of Lesotho • Michel Sigaud, PFM/ PEFA Consultant • Linpico Sarl, Project Manager
• World Bank : Mr. Gert Van der Linde - Lead Financial Management Specialist. The World
Bank is also instrumental in funding part of the ongoing PFM reform project, specifically
11
focusing on the upgrade of IFMIS
• European Union : Mr. Jyrki Torni - First Secretary. The EU is the lead sponsor of the
ongoing PFM reform with funding from the 10th EDF. The PEFA assessment is also funded
solely by the EU
• AFDB: Mr. Kalayu Gebre-Selassie - Chief Governance Officer. The AfDB is also providing
funding to support the PFM reform project with specific focus on strengthening external
audit functions
• IMF: Mrs. Sebongile Nkholise - IMF Country Office. The IMF is providing technical
assistance on cash and treasury management aimed at developing a Treasury Single
Account framework for efficient cash management
• Lead agency of the PEFA assessment: European Union
Date(s) of final concept note and/or Terms of Reference: August 2016
Review of the Assessment Report
• Date(s) of reviewed draft report(s): Draft report:January 16, 2017; Draft final report: March 3, 2017 (Both these reports were sent out for review to all reviewers); Final report March 22, 2017
• PEFA Secretariat: Reviewed Draft report, Draft final report and Final report • Government of Lesotho: Reviewed Draft report and Draft final report • Michel Sigaud, PFM/ PEFA Consultant: Reviewed Draft report and Draft final report • Linpico Sarl, Project Manager: Reviewed Draft report and Draft final report Reviewed Draft
report and Draft final report
• World Bank : Mr. Gert Van der Linde - Lead Financial Management Specialist. The World
Bank is also instrumental in funding part of the ongoing PFM reform project, specifically
focusing on the upgrade of IFMIS Reviewed Draft report and Draft final report
• European Union : Mr. Jyrki Torni - First Secretary. The EU is the lead sponsor of the
ongoing PFM reform with funding from the 10th EDF. The PEFA assessment is also funded
solely by the EU. Reviewed Draft report and Draft final report
• AFDB: Mr. Kalayu Gebre-Selassie - Chief Governance Officer. The AfDB is also providing
funding to support the PFM reform project with specific focus on strengthening external
audit functions. Reviewed Draft report and Draft final report
• IMF: Mrs. Sebongile Nkholise - IMF Country Office. The IMF is providing technical
assistance on cash and treasury management aimed at developing a Treasury Single
Account framework for efficient cash management: Reviewed Draft report and Draft final
report
1.3 Assessment Methodology
Coverage of the Assessment
The assessment covers budgetary Central Government (inclusive deconcentrated
government; education and health operations), the Auditor General and Parliament.
Subnational Government have been included insofar as the government’s oversight of fiscal
risks arising from Local Government Units are concerned. Currently there are 25 Ministries,
10 Offices (including the Offices of His Majesty the King, the Prime Minister and the Auditor-
General). At Sub-National level, there are 10 District Councils and Maseru City Council, and

12
128 Community Councils. Local Government Units per se are not covered in this assessment
as they are not separate budget heads but included in the expenditure of Ministry of Local
Government.
Public corporations/ enterprises (primarily concerned with water and electricity) form an
important part of the economy, and the government has shareholdings in a number of
commercial or semi-commercial enterprises and more recently has made financial
engagements in Public Private Partnerships (PPP). The coverage includes the
governments monitoring of government -owned or -controlled corporations concerning
fiscal risks and possibly contingent liabilities related to their operations.
At the level of Government institutional entities, the focus is on PFM practices as evidence of
Government performance rather than a review of specific entities.
When Performance was Assessed
Data gathering for the assessment, primarily took place between October and November
2016. Completed Fiscal Years are 2013/14, 2014/15, and 2015/16, the latest three years for
which competed budget data is available. The last completed Fiscal Year is 2016, and the
latest budget submitted to legislature and enacted is for the Fiscal Year 2016/17. The
analyses of the performance indicators in Chapter 3 are based on the latest data available in
each case, following the guidelines for each indicator.
The assessment was conducted via the following stages:
a) Concept Note Review – see Box 1.1, above;
b) Launch of PEFA Training for counterpart team, (August 2016). In this period some
basic data was gathered for the following PEFA assessment;
c) Assessment Team recruited, (September 2016);
d) Assessment Team successively in place in Maseru, (October 19 – November 2,
2016);
e) Assessment Field Phase, (October 19 – December 14, 2016);
f) Preliminary results presented at stakeholders’ validation workshop, (December 8,
2016);
g) Draft Report finalised and circulated to government and stakeholders, (December
2016);
h) Comments received from Government and stakeholders, (January 2017);
i) Final Draft Report finalised and re-circulated, (February 2017);
j) Final Report finalised after input from stakeholders, (March 2017);
k) Final Report presented and discussed in Maseru together with Government and other
stakeholders, (March 2017);
Sources of Information
The Assessment Team carried out extensive data collection and consulted with a range of
stakeholders, including Government Officials and Development Partner representatives.
The list of persons consulted is visible in Annex 3. Annex 2 provides the main information
sources cited.
22

13
Dates Sources are provided for all data tables, figures, and boxes.
Other methodological issues for the preparation of the report
The PEFA Training that took place before the assessment was envisaged as being an
extensive 4 weeks procedure, which would create a counterpart team capable of providing
support to the assessment throughout the field phase. However, it appeared that the
attendance at the training had been poor for a number of unknown reasons. Therefore, it was
not possible for the Assessment Team to mobilise a counterpart team to play the originally
envisaged role.
There was a delay starting the assessment, for various reasons, and subsequently started
about 1½ months after the training. Furthermore, oftentimes the Assessment Team
experienced considerable delays in organising meetings and getting access to requested
data. However, overall, the Assessment Team considers the gathered information and data
to form a solid base for the analysis and the following conclusions resulting in the scorings of
the Report´s 31 indicators.

14
2 Country Background Information
2.1 Economic Situation
The following paragraphs outline the Lesotho’s economic context with key fiscal Performance Indicators.
2.1.1 Country Context
The last population and housing census conducted in 2006, states that Lesotho had a total population of a little over 1.86million. According to the World Bank, Lesotho's estimated population in 2015 stood at 2.135million. GDP in nominal terms was M24billion in 2015 and the real GDP growth rate was 3.4% at constant prices. Having gained independence in October 1966 from Great Britain, the Kingdom of Lesotho has seen some socioeconomic developments with improvements in the road network, telecommunication, health, and education over the last 50 years. Nonetheless, the level of poverty remains high at 57.1% of the total population and is especially prevalent in rural areas. Revenues from the Southern Africa Customs Union (SACU) remain the largest share of domestic revenues, at about 44% in 2015/2016 mainly from textiles and other commodity imports into the Southern African sub-region. Royalties from water transfers to South Africa and other non-tax revenues were around 9.4% according to 2015/2016 financial reports from the Ministry of Finance. In spite of the slowdown in global trade, the resultant effect of which is a decline in SACU revenue, GDP is expected to grow from 3.4%1 in 2015/16 to 5.5%2 in 2017/18. This is primarily due to the commencement of production in a new large diamond mine, in 2017. Current inflation (2015/16) is 4.4% but anticipated to rise to 5% in 2017 mainly due to macroeconomic factors in Lesotho and partly from the economic fundamentals of the Republic of South Africa (RSA) since Lesotho's economy is to a large degree driven by the dictates of RSA. The local currency (Maloti) is pegged to the Rand; therefore any depreciation (or otherwise) impacts on the Maloti. HIV/AIDS continues to plague the Kingdom, especially the youth at an alarming infection rate of 1003 new cases per week. That notwithstanding, the Government is committed to eliminating the menace through the 90:90:90 Campaign by the year 2030 - this means, "90% of Basotho know their status, 90% of those who are positive are put on treatment and 90% maintain viral suppression". As a landlocked country, most of the Kingdom's imports are through its only neighbour, the Republic of South Africa. For this reason, the Lesotho Revenue Authority has automated customs and allied services to facilitate import declarations for improved international trade. The Government acknowledges corruption as a challenge that needs concerted effort in
1 Budget speech 2016/2017
2 Budget speech 2016/2017
3 Refer to 2016/2017 budget speech; page 33
15
addressing; this according to the GoL will improve investor confidence, stimulate economic growth and create more jobs for the large number of unemployed graduates. Unemployment remains high, especially among the youth.
2.1.2 Key aspects of the Government's Economic and Fiscal Reforms
The National Strategic Development Plan (NSDP) 2012/2013 - 2016/2017 outlines the broad spectrum of government reform agenda. It has eight thematic areas, namely:
i. Stability and Democracy; ii. Human Rights; iii. Law Enforcement and Administration of Justice; iv. Policy, Planning and Public Financial Management; v. Public Administration and Service Delivery; vi. Decentralisation; vii. Regional Integration, International Relations and Cooperation, and; viii. Media. Currently, the GoL is undergoing PFM reform with sponsorship from the EU under the 10th EDF, World Bank, African Development Bank, and the IMF, which spans 2012-2018. The PFM Reform Action Plan identifies eight strategic objectives to address; aimed at improving the PFM legal framework, macroeconomic performance, transparency and accountability, and external oversight. They include:
• Modernisation and implementation of PFM legal framework; • Assurance and effectiveness of policy and fiscal transparency; • Cash flow management for improved central government debt management strategy; • Improve efficiency and effectiveness of internal control environment; • Improve and assure compliance with accounting and reporting of budget execution in
line with legal framework and international standards; • Align public procurement with international best practices in relation to efficiency and
transparency; • Improve the external audit and legislative oversight functions to ensure full
compliance with INTOSAI and parliamentary best practices respectively; • Develop a robust monitoring and evaluation framework to track progress of PFM
reforms overtime with full government ownership. Currently, there have not been substantial achievements in terms of actual implementation of the key objectives outlined above, as pointed out in the PFM Annual Report dated May 2016. The exceptions are the initial preparatory work, regarding recruitment and staffing of the PFM Reform Secretariat, and the development of ToRs for short and long-term consultants. Moreover, it has been identified that a lot more effort from the GoL is required by means of ownership and assertiveness of technical departments and component heads, in order to drive the reform agenda. The World Bank is also funding a number of development programmes for overall government reforms in the following areas:
• Lesotho Scaling Renewable Energy Programme (signed 9th October 2016); • Social Assistance Project (signed 3rd June 2016); • Lesotho Education Quality for Equality Project (signed 26th May 2016); • Public Sector Modernisation Project (signed 24th March 2016); • Lesotho Continuous Survey Methodology (signed 4th December 2014).
The Government's budget deficit continues to widen, year-on-year, necessitating the legislature to cut government spending in 2015/2016. Unfortunately, however, it appears this has not helped in any way due to provisions in the PFM Act (Section 16(c)) authorising
16
additional expenditure with ex-post legislative approval. The increase in government spending has mostly been on recurrent expenditure to the detriment of development expenditure posing a significant threat to the fulfilment of the NSDP. The Government, through the 2016/2017 Budget Speech calculated the increase in budget deficit to be 9%, above the desired 3% of GDP. This is mainly due to the reduction in SACU revenue, which is now 17% of GDP (in FY2016/2017) as opposed to 23% in the previous FY. To consolidate fiscal reforms, the government proposed a number of cost cutting measures including cuts in international travels, office rentals, and entertainment. Further, improvement in non-tax revenue collection and accountability has also been identified to bridge the revenue gap.
2.1.3 Key Economic Indicators
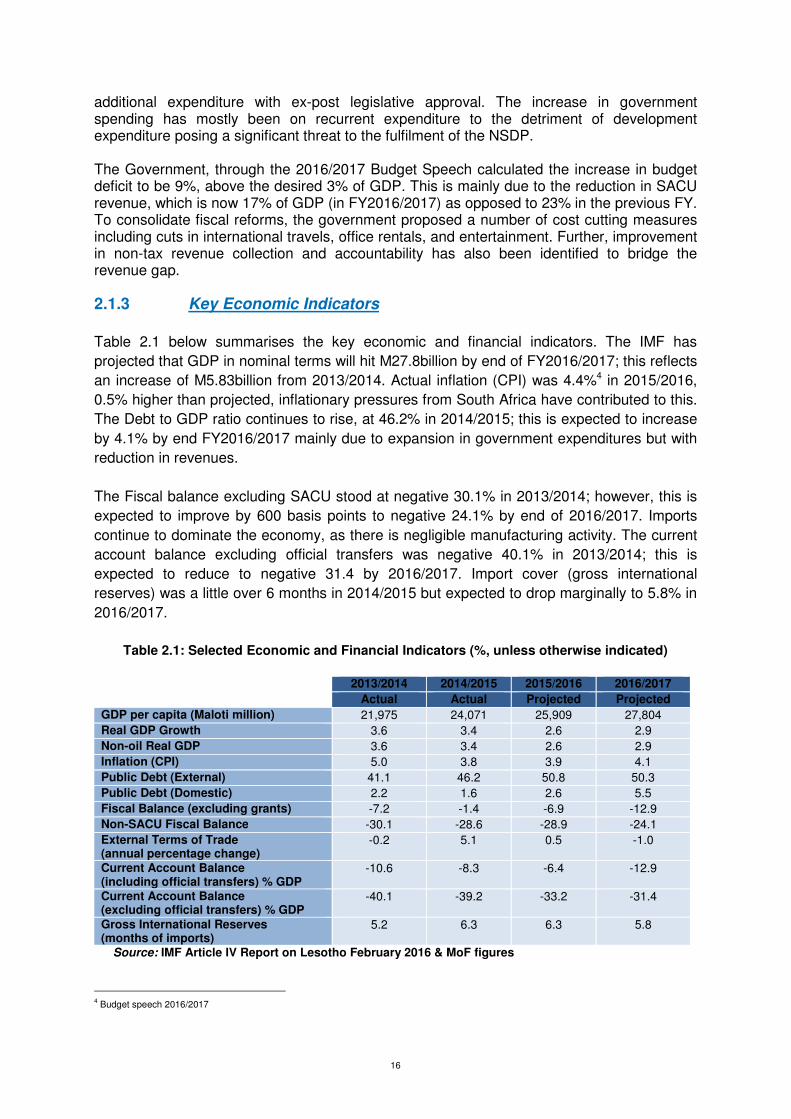
Table 2.1 below summarises the key economic and financial indicators. The IMF has
projected that GDP in nominal terms will hit M27.8billion by end of FY2016/2017; this reflects
an increase of M5.83billion from 2013/2014. Actual inflation (CPI) was 4.4%4 in 2015/2016,
0.5% higher than projected, inflationary pressures from South Africa have contributed to this.
The Debt to GDP ratio continues to rise, at 46.2% in 2014/2015; this is expected to increase
by 4.1% by end FY2016/2017 mainly due to expansion in government expenditures but with
reduction in revenues.
The Fiscal balance excluding SACU stood at negative 30.1% in 2013/2014; however, this is
expected to improve by 600 basis points to negative 24.1% by end of 2016/2017. Imports
continue to dominate the economy, as there is negligible manufacturing activity. The current
account balance excluding official transfers was negative 40.1% in 2013/2014; this is
expected to reduce to negative 31.4 by 2016/2017. Import cover (gross international
reserves) was a little over 6 months in 2014/2015 but expected to drop marginally to 5.8% in
2016/2017.
Table 2.1: Selected Economic and Financial Indicators (%, unless otherwise indicated)
Year 2013/2014 2014/2015 2015/2016 2016/2017
Actual Actual Projected Projected
GDP per capita (Maloti million) 21,975 24,071 25,909 27,804
Real GDP Growth 3.6 3.4 2.6 2.9
Non-oil Real GDP 3.6 3.4 2.6 2.9
Inflation (CPI) 5.0 3.8 3.9 4.1
Public Debt (External) 41.1 46.2 50.8 50.3
Public Debt (Domestic) 2.2 1.6 2.6 5.5
Fiscal Balance (excluding grants) -7.2 -1.4 -6.9 -12.9
Non-SACU Fiscal Balance -30.1 -28.6 -28.9 -24.1
External Terms of Trade (annual percentage change)
-0.2 5.1 0.5 -1.0
Current Account Balance (including official transfers) % GDP
-10.6 -8.3 -6.4 -12.9
Current Account Balance (excluding official transfers) % GDP
-40.1 -39.2 -33.2 -31.4
Gross International Reserves (months of imports)
5.2 6.3 6.3 5.8
Source: IMF Article IV Report on Lesotho February 2016 & MoF figures
4 Budget speech 2016/2017
17
2.2 Fiscal and Budgetary Trends
2.2.1 Fiscal Performance
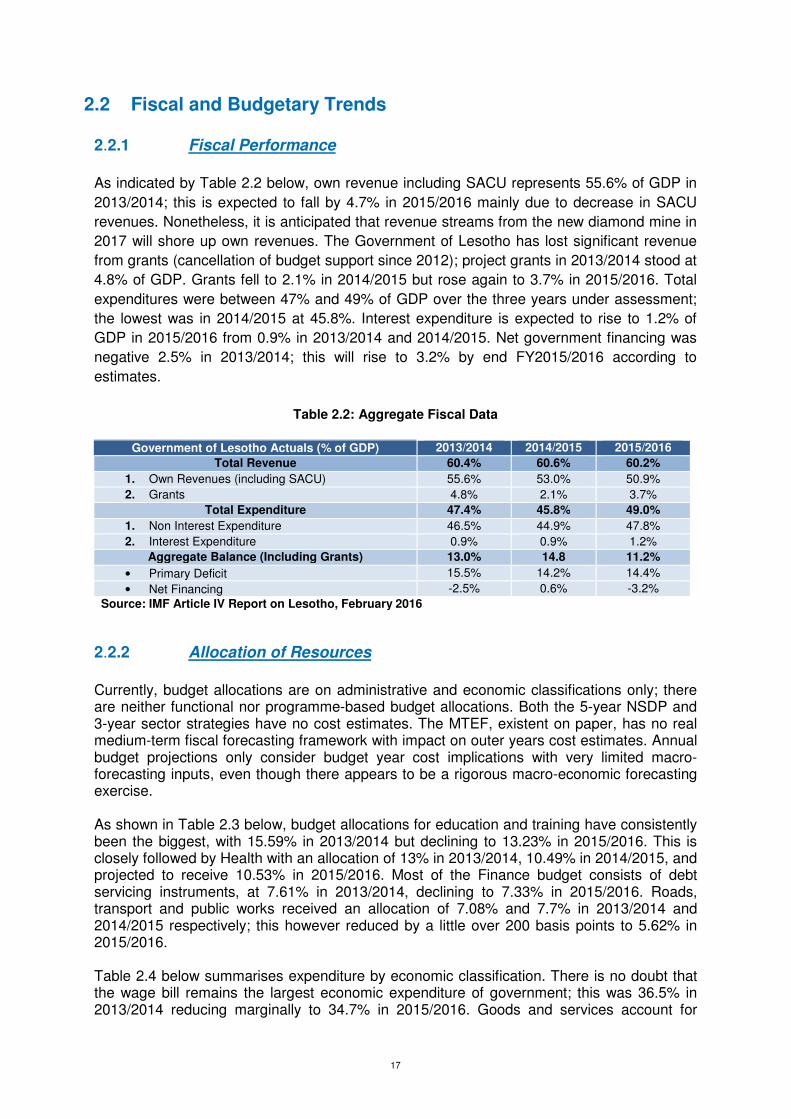
As indicated by Table 2.2 below, own revenue including SACU represents 55.6% of GDP in
2013/2014; this is expected to fall by 4.7% in 2015/2016 mainly due to decrease in SACU
revenues. Nonetheless, it is anticipated that revenue streams from the new diamond mine in
2017 will shore up own revenues. The Government of Lesotho has lost significant revenue
from grants (cancellation of budget support since 2012); project grants in 2013/2014 stood at
4.8% of GDP. Grants fell to 2.1% in 2014/2015 but rose again to 3.7% in 2015/2016. Total
expenditures were between 47% and 49% of GDP over the three years under assessment;
the lowest was in 2014/2015 at 45.8%. Interest expenditure is expected to rise to 1.2% of
GDP in 2015/2016 from 0.9% in 2013/2014 and 2014/2015. Net government financing was
negative 2.5% in 2013/2014; this will rise to 3.2% by end FY2015/2016 according to
estimates.
Table 2.2: Aggregate Fiscal Data
Government of Lesotho Actuals (% of GDP) 2013/2014 2014/2015 2015/2016
Total Revenue 60.4% 60.6% 60.2%
1. Own Revenues (including SACU) 55.6% 53.0% 50.9%
2. Grants 4.8% 2.1% 3.7%
Total Expenditure 47.4% 45.8% 49.0%
1. Non Interest Expenditure 46.5% 44.9% 47.8%
2. Interest Expenditure 0.9% 0.9% 1.2%
Aggregate Balance (Including Grants) 13.0% 14.8 11.2%
• Primary Deficit 15.5% 14.2% 14.4%
• Net Financing -2.5% 0.6% -3.2%
Source: IMF Article IV Report on Lesotho, February 2016
2.2.2 Allocation of Resources
Currently, budget allocations are on administrative and economic classifications only; there are neither functional nor programme-based budget allocations. Both the 5-year NSDP and 3-year sector strategies have no cost estimates. The MTEF, existent on paper, has no real medium-term fiscal forecasting framework with impact on outer years cost estimates. Annual budget projections only consider budget year cost implications with very limited macro-forecasting inputs, even though there appears to be a rigorous macro-economic forecasting exercise. As shown in Table 2.3 below, budget allocations for education and training have consistently been the biggest, with 15.59% in 2013/2014 but declining to 13.23% in 2015/2016. This is closely followed by Health with an allocation of 13% in 2013/2014, 10.49% in 2014/2015, and projected to receive 10.53% in 2015/2016. Most of the Finance budget consists of debt servicing instruments, at 7.61% in 2013/2014, declining to 7.33% in 2015/2016. Roads, transport and public works received an allocation of 7.08% and 7.7% in 2013/2014 and 2014/2015 respectively; this however reduced by a little over 200 basis points to 5.62% in 2015/2016. Table 2.4 below summarises expenditure by economic classification. There is no doubt that the wage bill remains the largest economic expenditure of government; this was 36.5% in 2013/2014 reducing marginally to 34.7% in 2015/2016. Goods and services account for

18
22.8%, 19.6% and 21.4% respectively in 2013/2014, 2014/2015, and 2015/2016. Capital expenditure on the other hand received 15.7%, on average, over the last three completed fiscal years.
Table 2.3: Budget Allocations by Administrative Heads
Actual budgetary allocations by administrative heads (as a percentage of total expenditure)
Administrative Heads 2013/2014 2014/2015 2015/2016*
Agriculture and Food Security 2.41% 1.95% 1.72%
Health 13.01% 10.49% 10.53%
Education and Training 15.59% 13.00% 13.23%
Finance 7.61% 6.23% 7.33%
Trade and Industry 0.79% 0.90% 0.51%
Development Planning 5.94% 5.27% 5.29%
Justice, Human Rights and Correctional Services
1.34% 1.23% 1.61%
Home Affairs 1.22% 1.31% 1.76%
Prime Minister 0.86% 0.72% 1.60%
Communication, Science and Technology 1.28% 1.88% 2.66%
Law and Constitutional Affairs 0.42% 0.41% 0.48%
Foreign Affairs and International Relations 2.19% 2.02% 2.01%
Public Works and Transport 7.08% 7.70% 5.62%
Forestry and Land Reclamation 1.49% 1.39% 1.25%
Energy, Meteorology and Water Affairs 3.50% 3.31% 1.05%
Labour and Employment 0.42% 0.36% 0.30%
Tourism, Environment and Culture 0.59% 0.79% 0.84%
Auditor General Office 0.21% 0.17% 0.17%
His Majesty's Office 0.18% 0.05% 0.05%
Public Services Commission 0.05% 0.05% 0.04%
Total of remaining administrative heads 33.83% 40.76% 41.94%
Total expenditure 100.00% 100.00% 100.00%
Source: Consolidated Annual Financial Statements * Unaudited
Table 2.4 Budget allocations by economic classification
Actual budgetary allocations by economic classification (as a % of total exp)
2013/2014 2014/2015 2015/2016
Current Expenditure 84.0% 86.0% 83.0%
Wages and Salaries 36.5% 34.0% 34.7% Goods and Services 22.8% 19.6% 21.4% Interest Payments 0.8% 1.2% 2.0% Transfers 13.9% 12.0% 12.8% Others 10.0% 19.2% 12.1%
Capital expenditure 16.0% 14.0% 17.0% Total expenditure 100.0% 100.0% 100.0%
Source: Audited Financial Statements; Budget Documents
2.3 Legal and Regulatory Arrangements for PFM
The regulatory framework prescribing public financial management in the Government of
Lesotho consists of a comprehensive set of laws and regulations emanating from Chapter 10
on Finance (sections 110 – 117) and from Chapter 13 on Public Service (sections 136 – 151)
of the Constitution 1993.
19
Practical application of the Constitution is facilitated through specific laws and regulations
with the aim of promoting compliance and accountability for public financial management.
The Public Financial Management and Accountability Act, Act 12 of 2011, is the predominant
legislative tool that introduces processes and standards to guide the use, management and
control of public funds. It consists of the following pertinent chapters:
• Roles and Responsibilities (functions of the ministers and chief accounting officers);
• Budget (process, format, time frames, reporting and monitoring);
• Financial Management;
• Reporting and Audit;
• Procurement and Government Property;
• Losses of Public Money or Government Property.
The implementation of the Treasury Regulations occurred in March 2014, to provide
guidance to leadership and management when dealing with certain specific prescripts
contained in the PFMAA.
In addition, aligned to the PFM framework are a number of enabling and operational laws
and regulations that are of significance when conceptualizing the comprehensiveness of
public financial management and include:
• Legislation dealing with taxes (Income Tax Act 1993, VAT Act 2003; Customs and
Excise Duties Act, 1982)
• The Public Services Act, Act 2005 and the 2008 Public Service Regulations
• The Local Government Act, Act No 6 of 1997, as amended
• The Companies Act, Act No 18 of 2011
• The Standing Orders of the National Assembly, 28 May 2008, read with the
Parliamentary Powers and Privileges Act, Act No 8 of 1994
• The Central Bank of Lesotho Act, Act 2000
• New Audit Act 2016 (yet to be operationalized; the implementation date of the act
was postponed to 01 April 2017)
The Accountant General issues financial management guidelines to assist Chief Accounting
Officers and Financial Controllers when executing their responsibilities in terms of the
PFMAA and to date consist of:
• Independent reporting is provided for in the Constitution, sections 117 and 142,
regulating the appointment, responsibilities and rights of the Auditor General and
section 81(1) read with the Standing Orders providing for the oversight function of the
Public Accounts Committee. The Audit Act, Act No12 of 1973, provides for the
powers and detailed responsibilities of the Auditor General. The year(s) under PEFA
review were audited under the old 1973 act.
2.4 Institutional Arrangements for PFM
Legislative
Lesotho is a Parliamentary constitutional monarchy. The Parliament consists of a 120 seat
National Assembly, with 80 members elected in single member constituencies and 40 by
proportional representation. The King has no executive or legislative powers. There are two

20
Parliamentary Committees dealing with financial matters, a Portfolio Committee (Economics
and Development Cluster) which examines Budget Proposals and a Public Accounts
Committee, which can look into any aspect of government financial management, drawing on
reports by the Auditor-General. Government supporters, members of the ruling party
constitute the majority of members of the PAC, but the Chairman by convention is from the
Opposition.
Executive
The Cabinet of Ministers consists of the Prime Minister and other Ministers, and is
collectively responsible to Parliament. The Constitution requires there to be at least eight
Ministers: at present, there are 25. Following the General Election in 2012, Lesotho has for
the first time a coalition government. In accordance with the Westminster model, the initiative
rests with the Executive, and the National Assembly is not in a position to initiate significant
financial proposals against the wishes of Ministers.
Judiciary
The Judicial branch consists of the High Court (Chief Justice appointed by the Monarch on
the advice of the Prime Minister), Court of Appeal, Magistrate Courts and Traditional
(Customary) Courts.
Organisation of the Government
In addition to the current 25 Ministries, there are 10 Offices (including the office of the Auditor
General and the Directorate of Corruption and Economic Offences) carrying out government
functions and wholly financed through the Budget. There are also a number of public bodies
(examples are the Road Fund and the Petroleum Fund, which receive some part of tax
revenue, but are outside the Budget). At sub-national level, there are 10 districts, Maseru
City and 128 community councils.
The Ministry of Finance has recently been responsible for all aspects of fiscal policy,
including medium-term fiscal planning and the planning of investment. The Budget
Department in the Ministry of Finance remains responsible for budget planning, including the
preparation of Budget Framework Papers that extend fiscal planning (including the planning
of investment) into the medium term. The Treasury is responsible for the execution of
payments, for the management of the government’s cash and for financial reporting; debt
management department is responsible for managing all central government debt portfolio.
The Private Sector Development and Financial Affairs Department also covers procurement
and a monitoring function in relation to public enterprises.
The Macro-Economic Unit of the Department of Economic Policy advises on the stance of
fiscal policy. At Line Ministry level, responsibility and accountability for public funds rests with
the Principal Secretary who is the Chief Accounting Officer (CAO); in each Ministry there is a
Financial Controller who has dual responsibilities, first to the Principal Secretary of the line
ministry and second to the MoF, reporting to the Accountant-General. Tables 2.5 & 2.6 below
provide a snapshot of government structure; table 2.7 provides the fiscal structure of
government.
21
Section 4.2 of the report describes in detail the internal control environment within the
government. The control environment has been strengthened by the enactment of Treasury
Regulations in March 2014; segregation of duties has been clearly outlined even compliance
to PFM laws and regulations remain a challenge. The absence of audit committees reduces
the efficacy of measures put in place to improve public finance management.
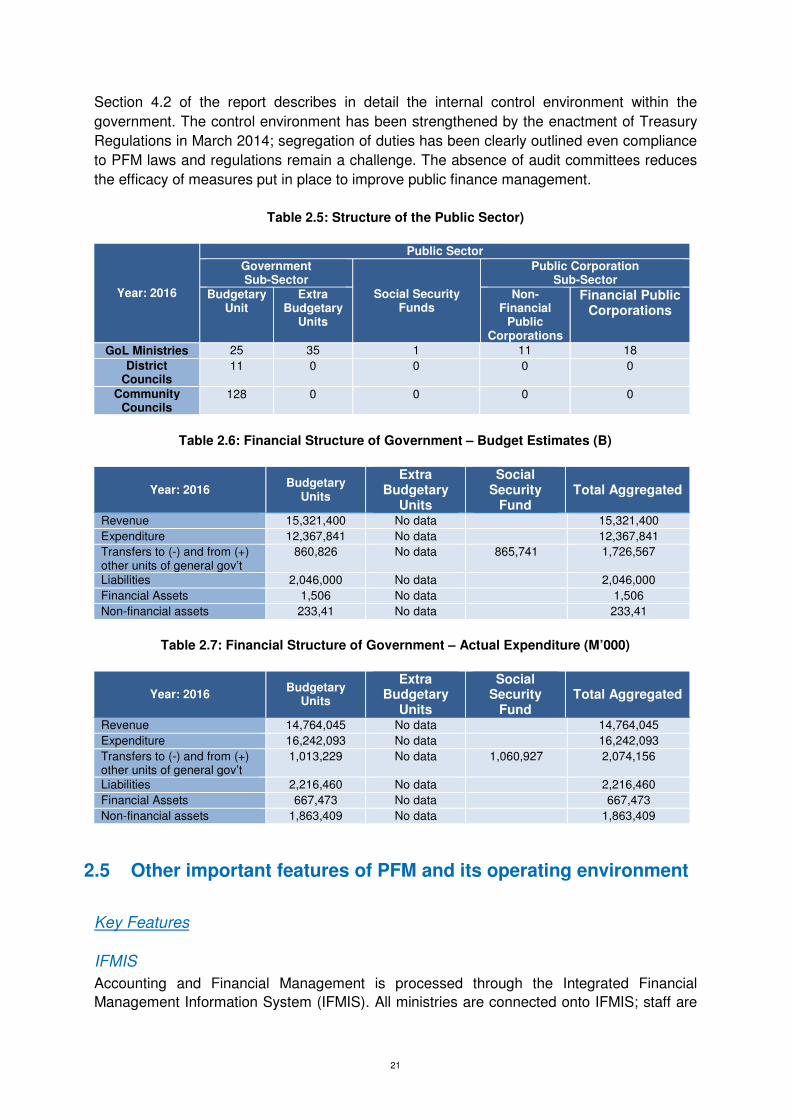
Table 2.5: Structure of the Public Sector)
Year: 2016
Public Sector
Government Sub-Sector
Social Security Funds
Public Corporation Sub-Sector
Budgetary Unit
Extra Budgetary
Units
Non-Financial
Public Corporations
Financial Public Corporations
GoL Ministries 25 35 1 11 18
District Councils
11 0 0 0 0
Community Councils
128 0 0 0 0
Table 2.6: Financial Structure of Government – Budget Estimates (B)
Year: 2016 Budgetary
Units
Extra Budgetary
Units
Social Security
Fund
Total Aggregated
Revenue 15,321,400 No data 15,321,400
Expenditure 12,367,841 No data 12,367,841
Transfers to (-) and from (+) other units of general gov’t
860,826 No data 865,741 1,726,567
Liabilities 2,046,000 No data 2,046,000
Financial Assets 1,506 No data 1,506
Non-financial assets 233,41 No data 233,41
Table 2.7: Financial Structure of Government – Actual Expenditure (M’000)
Year: 2016 Budgetary
Units
Extra Budgetary
Units
Social Security
Fund
Total Aggregated
Revenue 14,764,045 No data 14,764,045
Expenditure 16,242,093 No data 16,242,093
Transfers to (-) and from (+) other units of general gov’t
1,013,229 No data 1,060,927 2,074,156
Liabilities 2,216,460 No data 2,216,460
Financial Assets 667,473 No data 667,473
Non-financial assets 1,863,409 No data 1,863,409
2.5 Other important features of PFM and its operating environment
Key Features
IFMIS
Accounting and Financial Management is processed through the Integrated Financial
Management Information System (IFMIS). All ministries are connected onto IFMIS; staff are

22
adequately trained. The system provides for a decentralised capturing of revenue,
procurement and expenditure transactions, capturing the budget and reporting by ministries.
Processing of payments are however centralised in the office of the Accountant General. The
monthly electronic payroll interface directly into IFMIS and processing changes to the payroll
approved by ministries (Casualty Returns) is centralised within the office of the Accountant
General. Receipting of cash relating to own revenues and bank reconciliations for
commercial bank accounts held by line ministries is done manually on a decentralised basis.
The National Treasury reconciles the main treasury bank accounts held by the Central Bank
of Lesotho
The system provides real-time validation of orders against available budget (funds) for most
categories of procurement creating a commitment of acceptance and issue of an order.
However, excluded from this control mechanism are expenditure against contracts
(infrastructure projects running over multiple financial years) and services provided by other
spheres of government. A significant weakness identified is that the system not closed off for
access after year-end by ministries and incidents of backdating of transactions to prior
financial years are therefore possible.
Payroll
The previous Unique Payroll System was replaced by the Resource Link system in 2015 and
is still in the process of being rolled out. Personnel records are maintained in hardcopy
format in ministries whilst monthly payments are done through the electronic centralised
payroll under the custody of the Accountant General. There are 5 separate payrolls of which
only the public servants have an approved establishment informing the payroll, for example: • Public Servants
• Police
• Defence
• Educators
• Pensions
The average payroll growth 2013/16 was 14.31% per annum, mainly as result of a 23%
salary adjustment in the 2013/14 financial year that is well above the average CPI. A key
weakness in employee and payroll management is that the citizens of Lesotho are not issued
with identity numbers. The Department of Home Affairs is in the process of registering all
citizens and information provided is that at the time of the PEFA Assessment 2016,
approximately 50% of public servants have been issued with the personalized identity
numbers. This limits the effectiveness of internal controls and significantly increase the risk of
duplicating people on the payroll or making payment for non-authentic employees (ghosts).
Transparency (Budget; Procurement; Oversight)
Public participation, as a key stakeholder of government, is limited as not all of the
appropriate processes are transparent. The budget process does not allow for input by
members of the public and periodic reporting to the public is non-existent.
Most ministries’ websites are dysfunctional. Information relating to procurement opportunities
is mainly publicised through the printed media. The Public Account Committee hearings are
not held in public. However, the PAC Reports are made available by the Secretariat on
request.

23
The absence of the Adjustment Appropriation Act for the adjustments made each year is a
significant weakness to the current budget process.
Oversight
The PAC comprises 25 Members of Parliament and its rights are established in the
Constitution, Parliamentary Powers and Privileges Act and the Standing Orders. In the
absence of a formally adopted Charter, the committee include a list of activities in its reports
to Parliament. The most recent available report is that of recommendations made on the
Auditor General’s report for the financial year 2008/09.
The Auditor General is in the process of tabling its report for the year ending 31 March 2015
in Parliament. For all of the preceding 4 years ending 31 March 2014 the Auditor General
issued adverse audit opinions and it is expected that for 2015 the opinion will remain the
same.
Financial Reporting
Financial statements are compiled annually but not fully compliant with IPSAS Cash Basis of
Accounting; full compliance to IPSAS cash is still work-in-progress. The Minister of Finance
tables only the consolidated Annual Financial Statements in Parliament in accordance with
the PFMA Act. For the first time (the 2015/16 Financial Year) Ministries have submitted
individually signed annual financial statements for consolidation and audit purposes.
However, the Auditor General in terms of the PFMAA, issues a report on the consolidated
annual financial statements only.
Financial Management
Key to the accounting framework is the maintenance of accurate records to safeguard
government assets. Information supplied revealed that the government has in excess of 330
bank accounts under control of the Accountant General and Financial Controllers. At date of
assessment, 12% of accounts (1.2% of balances) were reconciled as at 31 March 2016
whilst reconciliations of the remaining balances date back to prior periods. No Fixed Asset
Registers are in place that accurately reflect the extent, value or location of the portfolio of
moveable property of government, and as such, the value of losses cannot be accurately
determined. Whiles all line ministries and most departments and agencies have internal audit
units, their effectiveness is very weak largely due to lack of application of international
auditing standards, insufficient technical capacities, and insufficient budget allocations for
internal audit functions.

24
3 Assessment of PFM Performance
Pillar I. Budget Reliability
PI-1 Aggregate Expenditure Outturn
This indicator measures the extent to which aggregate actual expenditure deviates from the originally approved aggregate expenditure budget over the last three (3) completed fiscal years: 2013/2014, 2014/2015 and 2015/2016. One key concern that requires urgent attention relates to data reliability. During the 2012 PEFA Assessment, the same problem, that of the unreliability of Expenditure data, was voiced. Presently, the budget functionality in IFMIS is not active; Government officials use Microsoft Excel in budget preparation. Approved budget figures are manually loaded into IFMIS without a mapping table, which is time consuming. Moreover, the inaccuracy of the figures creates a number of additional shortcomings in an analysis. The budget analysis as shown in Table 1.1 (Result Matrix) below depicts serious budget credibility challenges. When compared to 2012 Assessment results, it is fair to conclude that there has been a decline in performance even though scores and performance are not directly comparable. However, the results would not change significantly even if the old PEFA methodology had been guiding the evaluation. One contributing factor to the overall decline in performance is that Government Expenditure has increased exponentially compared to marginal revenue appreciation. Another factor could be the discontinuation of direct budget support by donors since 2011/2012 due to serious macroeconomic challenges. As indicated in the table below, aggregate expenditure deviations to originally approved budget were above 15% in two of the last three completed fiscal years; actual deviations were 1.1%, 25.9% and 31.3% in FY2013/2014, FY2014/2015, and FY2015/2016 respectively; with detailed analyses presented in Annexes 4 (tables 1A, 1B, & 1C). This compares poorly to 2012 where deviations ranged between 0.5% and 8.3% from 2009/2010 to 2011/2012.
Dimension rating = D
Table 1.1: Result Matrix for PI-1, PI-2(i) & PI-2(iii)
for PI-1 for PI-2 (i) for PI-2 (iii)
Year Total expenditure
deviation Composition variance by
function Contingency share
2013/14 1.1% 27.3%
0.7% 2014/15 25.9% 37.9% 2015/16 31.3% 31.1%
PI-1
(M1)
Dimension Score
2016
Justification for 2016 score
1 Aggregate Expenditure Outturn D Actual budget outturn compared to originally
approved budget deviated more than 15% in two of
the last three completed fiscal years. Actual
deviations were 1.1% in FY2013/2014, 25.9% in
FY2014/2015, and 31.3% in FY2015/2016
25
Ongoing reforms
The government is migrating from GFS 2001 to GFS 2014 with technical support from the
IMF.
PI-2 Expenditure Composition Outturn
This indicator has three dimensions. Dimension 2.1 assesses the expenditure composition outturn by each line ministry (functional classification) excluding contingency and interest on debt. Dimension 2.2 measures the expenditure composition variance by type of expenditure (economic classification) including interest on debt but excluding contingency. Dimension 2.3 assesses the average amount of expenditure actually charged to the contingency budget. Each of the three dimensions underwent assessment for the last three completed fiscal years.
Context
It is important to draw attention to the difficulty encountered in analysing the budgeted and actual figures. Again, the reliability of these figures has created a number of problems. One major reason for discrepancies in budget and actual figures is the continuous use of manual entry of budget figures into IFMIS; also, there is no mapping table. The originally approved aggregate figures in functional classification are inconsistent with aggregate economic classification. Except for 2013/2014, the Assessment Team had to adjust the 2014/15 and 2015/2016 figures for consistency. In 2014/2015, the economic category budget and actual outturn were adjusted by M2.71bn and M1.85bn (please, refer to Annex 4) respectively. An adjustment of M4.16bn (please, refer to Annex 4) was passed concerning the 2015/2016 approved budget in economic category.
2.1 Expenditure composition outturn by function
The results of the analysis as shown in Table 2.2 below reveal, not only the weakness in the legal framework (Section 15(1) of the PFMA Act 2011 which allows budget reallocations of up to 20% and 10% in recurrent and capital budget respectively), but also in practice the excessive and frequent expenditure reallocations across administrative heads. It is therefore not surprising that actual expenditure composition outturns by administrative heads were 27.3%, 37.9% and 31.1% in FY2013/2014, FY2014/2015, and FY2015/2016 respectively; these variances are not far off the total virements (30% - recurrent plus capital) allowed by the PFMA Act. The outcome of PI-1 coupled with the results of PI-2.1 suggest weaknesses in budget formulation and preparation by line ministries; this also confirms the views expressed by the Macroeconomic Department of the MoF suggesting that budget forecasts have no solid basis but are only 'wish lists' by line ministries. In addition, one could attribute this to the withdrawal of donor budget support since 2011/2012. In the same period, government expenditure continues to increase, leading to ex-ante Parliamentary approval of supplementary estimates for new staff salaries, payment of software licences, and centralised staff training expenses, amongst others. Dimension rating = D
2.2 Expenditure composition outturn by economic type
Section 15 of the PFMA Act 2011 allows for budget reallocation within economic classification but only with the approval of the Minister of Finance. The expenditure budget and actual outturns analysed indicate significant reallocations across economic heads. As shown in Table 2.1 below, expenditure composition variance were between 49% and 68%;

26
actual variances were 49%, 51% and 68.4% in FY2013/2014, FY2014/2015, and FY2015/2016 respectively which are extremely high. The results of the analysis point to serious budget formulation and preparation challenges thereby affecting budget credibility. The effect of which could include misalignment of policy priorities and not achieving set targets according to sector strategies. Dimension rating = D
Table 2.1: Result Matrix PI-2.2 Composition variance by economic classification
Year Total Expenditure Deviation
(Less Contingency) Composition Variance by Economic Classification
2013/214 99.0% 49.0%
2014/2015 124.1% 51.0%
2015/2016 129.5% 68.4%
2.3 Expenditure from contingency reserves
Article 114 of the 1993 Constitution and Section 17 of the PFMA Act 2011 provide for the establishment of a Contingency Fund to cater for unforeseen eventualities. The Minister of Finance, according to the law, must seek parliamentary approval for the establishment of the fund. During the three years under review, parliament appropriated M100million in each of the three years for contingencies. The government has consistently respected the use of contingency reserve and has remained unchanged since 2012 assessment. The appropriated figure represents 0.8% of total appropriations. Actual expenditures charged to the contingency fund is averaged at 0.7% as shown in Table 2.2 below; this is less than 3% of the originally approved budget. Dimension rating = A
Table 2.2 Result Matrix PI-2.1 & PI-2.3 Composition variance by administrative classification and contingency
for PI-1 for PI-2 (i) for PI-2 (iii)
Year Total expenditure
deviation Composition
variance by function Contingency share
2013/14 1.1% 27.3%
0.7% 2014/15 25.9% 37.9%
2015/16 31.3% 31.1%
PI-2
(M1)
Dimension Score
2016
Justification for 2016 score
2 Expenditure Composition Outturn D+
2.1 Expenditure Composition Outturn
by Function
D Expenditure composition outturn by
administrative heads, in FY2013/2014,
FY2014/2015, and FY2015/2016 was above
15% in each of the three years; actual outturns
were 27.3%, 37.9% and 31.1% respectively.
2.2 Expenditure Composition Outturn
by Economic Type
D In all three completed fiscal years under review,
expenditure composition outturn by economic
classification was more than 15%. Actual
composition variances were 49%, 51% and
68.4% in FY2013/2014, FY2014/2015, and
FY2015/2016 respectively.
2.3 Expenditure from Contingency
Reserves
A Actual expenditure charged to contingency vote
is 0.7% on average; this is less than 3% of
originally approved budget
27
Ongoing reforms
No known reforms
PI-3 Revenue Outturn
This indicator has two dimensions. Dimension 3.1 measures the aggregate revenue outturn compared to originally approved revenue budget by Parliament. Dimension 3.2 measures the revenue composition (revenue type) variance.
3.1 Aggregate revenue outturn
Revenue from SACU remains the main revenue source for the Government; it constitutes about 44% of total government revenues, followed by income taxes on personal emoluments at 12% and grants at 8% according to 2015/2016 revenue data from the Ministry of Finance. It is important to note that revenues from SACU are highly dependent on global economic fundamentals in terms of prices of export commodities. A significant shift from the 2012 PEFA assessment is the exclusion of SACU in the analysis in order to be consistent with the requirements of the 2011 PEFA Framework. The 2016 Framework however considers domestic tax and non-tax revenue, revenues from external taxes (in this case SACU), social security contributions and grants from foreign governments, but excludes loans. The Macro-Fiscal Unit is responsible for revenue forecasting; the unit works with officials of Lesotho Revenue Authority to project revenues on a three-year medium-term basis with the aid of a revenue-forecasting module. A Medium-Term Fiscal Framework exists but it is very weak as it has very little or no link with current year budget forecasting figures. Forecasting has its foundations based on historical trends of actual collections adjusted in line with current inflation and rate of growth. However, revenue forecasting is weak given that most assumptions underlying revenue projections are estimates from the MoF since actual statistical figures from the National Statistical Service are usually a year late. Revenue projections from the IMF also serve as a basis for government revenue forecasting, as part of the reliability check. As shown in Table 3.1 (Result Matrix) below, aggregate revenue deviation was between 94% and 112% in at least two of the last three completed fiscal years. Actual aggregate deviations were 91.2% in FY2013/2014, 100% in FY2014/2015 and 96.4% in FY2015/2016. The main drivers of these predictable revenues are those from SACU, which are close to 100% of budgeted figures. Dimension rating = B
3.2 Revenue Composition Outturn
Central Government revenues fall under three categories: 1. Tax revenues made up of taxes on incomes, profits and gains, taxes on goods and
services, export trade and property taxes; 2. Grants from foreign governments; 3. Other revenues consisting of property income, investment income, and unclassified
income. The results of the analysis as depicted in Table 3.1 below indicate a composition variance of less than 15% in FY2013/2014 and FY2015/2016. Actual composition variances were 12.2% in FY2013/2014, 20.2% in FY2014/2015, and 10.3% in FY2015/2016. According to the analysis the large composition variance of 20.2% in FY2014/2015 is attributable to an over realisation of revenue from unclassified sources at a rate of 2,933% when compared to the original budgeted figure.
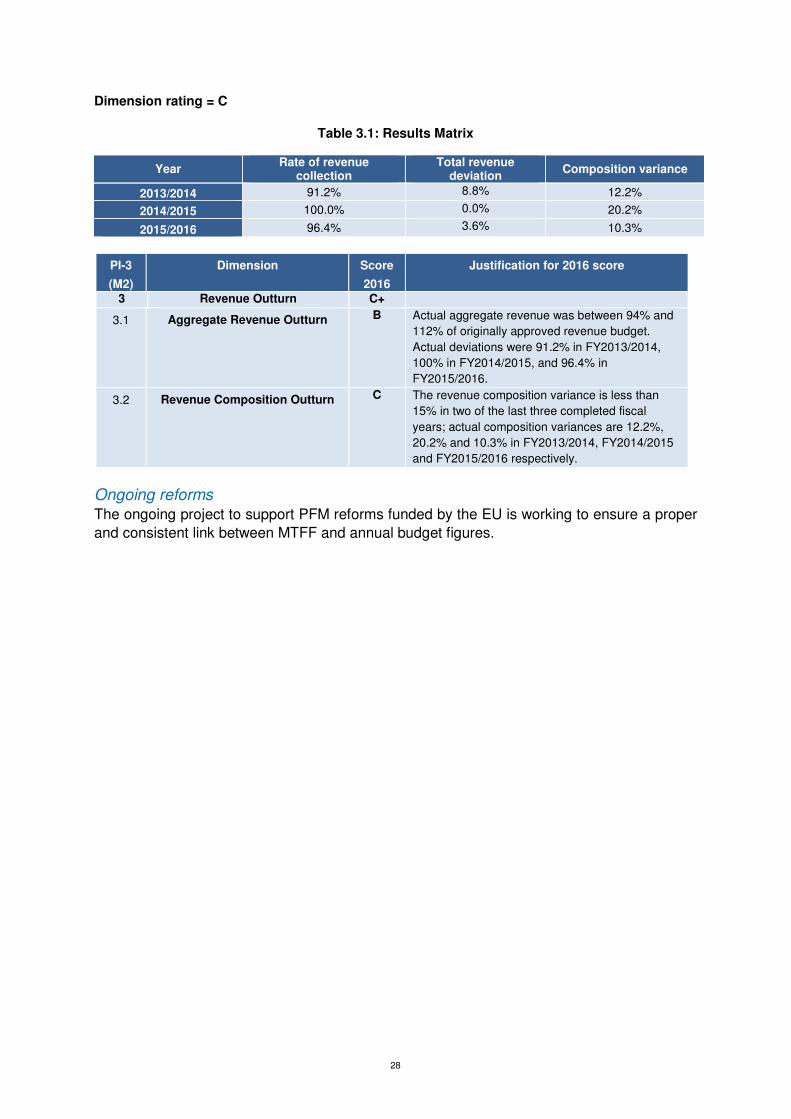
28
Dimension rating = C
Table 3.1: Results Matrix
Year Rate of revenue
collection Total revenue
deviation Composition variance
2013/2014 91.2% 8.8% 12.2%
2014/2015 100.0% 0.0% 20.2%
2015/2016 96.4% 3.6% 10.3%
PI-3
(M2)
Dimension Score
2016
Justification for 2016 score
3 Revenue Outturn C+
3.1 Aggregate Revenue Outturn B Actual aggregate revenue was between 94% and
112% of originally approved revenue budget.
Actual deviations were 91.2% in FY2013/2014,
100% in FY2014/2015, and 96.4% in
FY2015/2016.
3.2 Revenue Composition Outturn C The revenue composition variance is less than
15% in two of the last three completed fiscal
years; actual composition variances are 12.2%,
20.2% and 10.3% in FY2013/2014, FY2014/2015
and FY2015/2016 respectively.
Ongoing reforms
The ongoing project to support PFM reforms funded by the EU is working to ensure a proper
and consistent link between MTFF and annual budget figures.
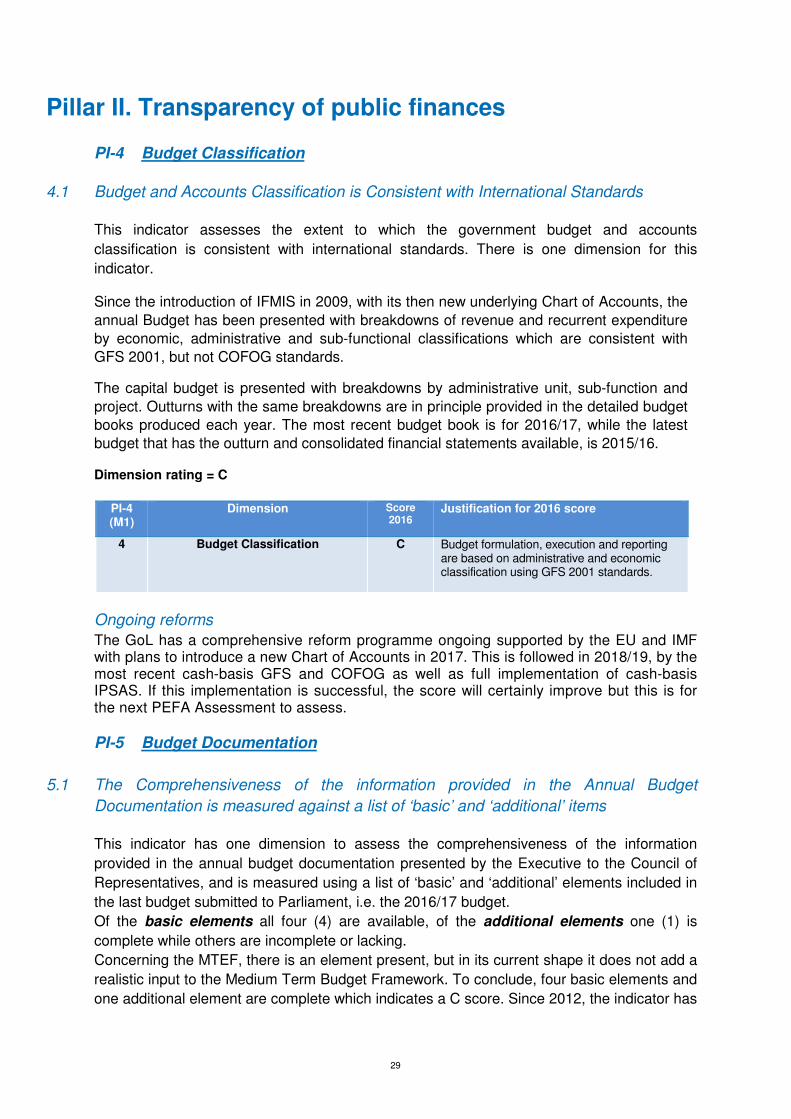
29
Pillar II. Transparency of public finances
PI-4 Budget Classification
4.1 Budget and Accounts Classification is Consistent with International Standards
This indicator assesses the extent to which the government budget and accounts
classification is consistent with international standards. There is one dimension for this
indicator.
Since the introduction of IFMIS in 2009, with its then new underlying Chart of Accounts, the
annual Budget has been presented with breakdowns of revenue and recurrent expenditure
by economic, administrative and sub-functional classifications which are consistent with
GFS 2001, but not COFOG standards.
The capital budget is presented with breakdowns by administrative unit, sub-function and
project. Outturns with the same breakdowns are in principle provided in the detailed budget
books produced each year. The most recent budget book is for 2016/17, while the latest
budget that has the outturn and consolidated financial statements available, is 2015/16.
Dimension rating = C
PI-4 (M1)
Dimension Score 2016
Justification for 2016 score
4 Budget Classification
C Budget formulation, execution and reporting are based on administrative and economic classification using GFS 2001 standards.
Ongoing reforms
The GoL has a comprehensive reform programme ongoing supported by the EU and IMF with plans to introduce a new Chart of Accounts in 2017. This is followed in 2018/19, by the most recent cash-basis GFS and COFOG as well as full implementation of cash-basis IPSAS. If this implementation is successful, the score will certainly improve but this is for the next PEFA Assessment to assess.
PI-5 Budget Documentation
5.1 The Comprehensiveness of the information provided in the Annual Budget
Documentation is measured against a list of ‘basic’ and ‘additional’ items
This indicator has one dimension to assess the comprehensiveness of the information
provided in the annual budget documentation presented by the Executive to the Council of
Representatives, and is measured using a list of ‘basic’ and ‘additional’ elements included in
the last budget submitted to Parliament, i.e. the 2016/17 budget.
Of the basic elements all four (4) are available, of the additional elements one (1) is
complete while others are incomplete or lacking.
Concerning the MTEF, there is an element present, but in its current shape it does not add a
realistic input to the Medium Term Budget Framework. To conclude, four basic elements and
one additional element are complete which indicates a C score. Since 2012, the indicator has

30
changed and is not directly comparable with the previous scoring system. However, at the
elementary level one finds that the equivalent of the current basic elements 2 and 4 were not
available, or were incomplete, in 2012, which suggests an overall improvement, as they are
now complete.
Dimension rating = C
Table 5.1: Budget Documentation Benchmarks
No. Budget documentation benchmarks Availability Basic elements
1. Forecast of the fiscal deficit or surplus (or accrual operating result). Yes, in the budget speech 2016
2. Previous year’s budget outturn, presented in the same format as the budget proposal
Yes, in the documentation for the 2016/17 budget
3. Current year’s budget (either the revised budget or the estimated outturn), presented in the same format as the budget proposal
Yes, in the documentation for the 2016/17 budget
4. Aggregated budget data for both revenue and expenditure according to the main heads of the classifications used (ref. PI-4), including data for the current and previous year, in addition to the detailed breakdown of revenue and expenditure estimates
Yes, in the documentation for the 2016/17 budget
Additional elements 5. Deficit financing, describing anticipated composition No, but debt bulletin has some
information on deficit financing but not describing the anticipated composition
6. Macro-economic assumptions, including at least estimates of GDP growth, inflation, interest rates, and the exchange rate
No, only to some extent, GDP and inflation, available in the budget speech, not interest rates and exchange rates
7. Debt stock, including details at least for the beginning of the current year presented in accordance with GFS or other comparable standard
Yes, In the debt bulletin, issued every quarter meaning that one bulletin comes in January, ahead of budget submission
8. Financial Assets, including details at least for the beginning of the current year presented in accordance with GFS or other comparable standard
Not available
9. Summary information of fiscal risks including contingent liabilities such as guarantees, and contingent obligations embedded in structure financing instruments such as PPP contracts, etc.
Not available
10. Explanation of budget implications of new policy initiatives and major new public investments, with estimates of the budgetary impact of all major revenue policy changes and/or major changes to expenditure programs
No, only budget allocations on policy initiatives
11. Documentation on the medium-term framework No, available, but because of underlying weakness it is not a reliable forecast for year 2 and 3
12. Quantification of tax expenditures Not available

31
PI-5 (M1)
Dimension Score 2016
Justification for 2016 score
5 Budget Documentation C 4 basic elements and 1 additional element are
complete, which gives a C score
Ongoing reforms • The introduction of the Citizen’s Budget, with the first issue already published.
• For the 2017/18 budget preparations, a new Budget Strategy Paper is being prepared that will address some information that is currently lacking.
• With the ongoing PFM Reform Project, one expects that more elements will become available, e.g. macro-economic assumptions.
PI-6 Central Government Operations outside Financial Reports
This indicator has three dimensions; Dimension 6.1 measures the extent to which Central Government expenditures are outside its consolidated financial statements; Dimension 6.2 assesses the level of Central Government revenue outside its budget/ financial statements; and Dimension 6.3 examines the extent to which extra-budgetary units' financial reports are submitted to Government.
6.1 Expenditure outside Financial Reports The Government of Lesotho and its development partners adopted a partnership policy in November 2013 to enhance the effectiveness of development cooperation through greater government ownership and partnership, increase transparency and accountability, and above all to accelerate socio-economic development. The policy instituted clear structures and guidelines for aid mobilisation and management in order to maximise the benefits of future development cooperation. The current policy is under review. The adoption of the policy implied the use of national systems (procurement, banking, accounting & reporting, auditing) as encouraged through the Paris Declaration on Aid Effectiveness (2005), the Accra Agenda for Action (2008) and the Busan Partnership Agreement (2012). There are seven major development partners in Lesotho, namely: EU, WB, AfDB, IMF, UN, South Africa, and USA. Whilst the Assessment Team was unable to fully quantity development support outside the national budget, interactions with Government Officials suggest that more than 50% of donor-financed projects and programmes remain outside government budget, the bulk of which originate from USAID and China. In addition, at least 50% of expenditures from extra-budgetary units are excluded from central government financial statements. That said, the World Bank's client connect platform uniquely provides direct access to the Government in terms of commitments and actual disbursements. As stated in PI-19.1, the Assessment Team has deduced that less than half (50%) of non-tax revenue is reported to Central Government even though there are no figures to substantiate this claim. It is therefore fair to conclude that at least half of expenditure from non-tax revenue and donor support is outside Central Government financial statements . Dimension rating = D
6.2 Revenue outside Financial Reports With reference to PI-19.1, non-tax revenue represents 9.4% of Central Government domestic revenue, excluding grants. Furthermore, officials believe that only half of non-tax revenue is reported; this implies that about 9.4% of domestic revenue is not reported. Again, at least half of donor-financed projects/ programmes are believed to be outside Central Government financial reports. Therefore, more than 10% of both budgeted Central Government revenue and revenue from donors are outside its financial statements. The draft
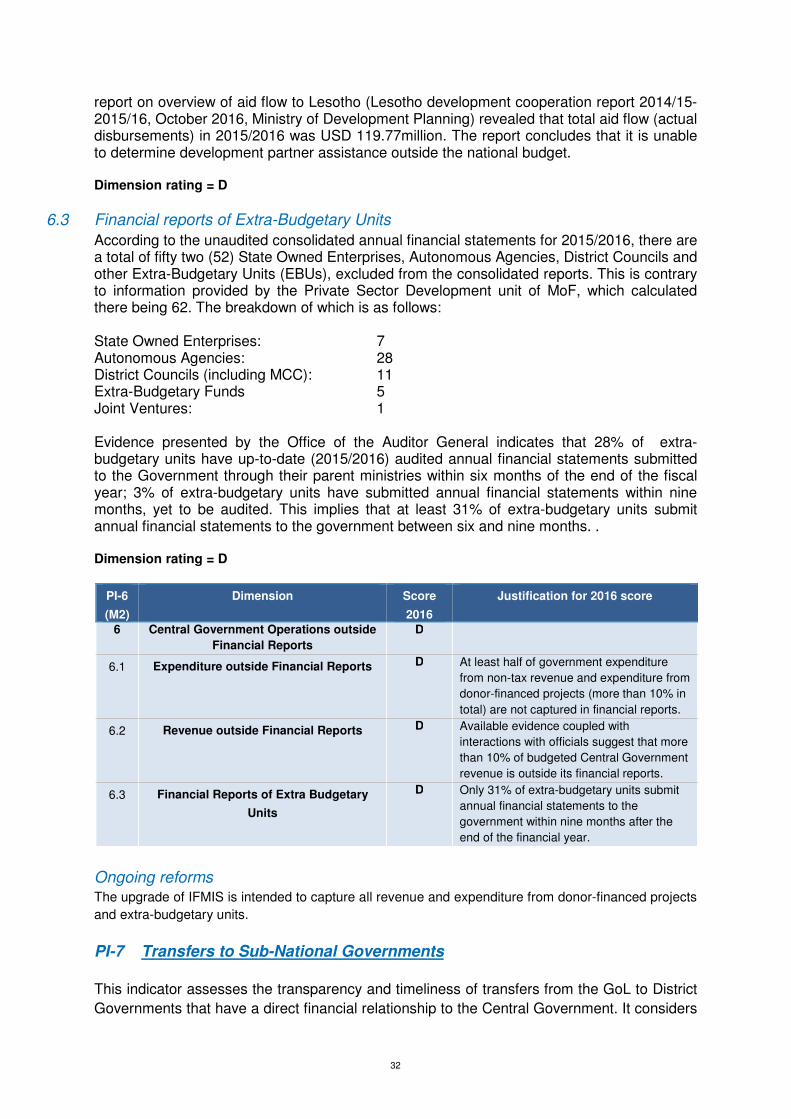
32
report on overview of aid flow to Lesotho (Lesotho development cooperation report 2014/15-2015/16, October 2016, Ministry of Development Planning) revealed that total aid flow (actual disbursements) in 2015/2016 was USD 119.77million. The report concludes that it is unable to determine development partner assistance outside the national budget. Dimension rating = D
6.3 Financial reports of Extra-Budgetary Units
According to the unaudited consolidated annual financial statements for 2015/2016, there are a total of fifty two (52) State Owned Enterprises, Autonomous Agencies, District Councils and other Extra-Budgetary Units (EBUs), excluded from the consolidated reports. This is contrary to information provided by the Private Sector Development unit of MoF, which calculated there being 62. The breakdown of which is as follows: State Owned Enterprises: 7 Autonomous Agencies: 28 District Councils (including MCC): 11 Extra-Budgetary Funds 5 Joint Ventures: 1
Evidence presented by the Office of the Auditor General indicates that 28% of extra-budgetary units have up-to-date (2015/2016) audited annual financial statements submitted to the Government through their parent ministries within six months of the end of the fiscal year; 3% of extra-budgetary units have submitted annual financial statements within nine months, yet to be audited. This implies that at least 31% of extra-budgetary units submit annual financial statements to the government between six and nine months. . Dimension rating = D
PI-6
(M2)
Dimension Score
2016
Justification for 2016 score
6 Central Government Operations outside
Financial Reports
D
6.1 Expenditure outside Financial Reports D At least half of government expenditure
from non-tax revenue and expenditure from
donor-financed projects (more than 10% in
total) are not captured in financial reports.
6.2 Revenue outside Financial Reports D Available evidence coupled with
interactions with officials suggest that more
than 10% of budgeted Central Government
revenue is outside its financial reports.
6.3 Financial Reports of Extra Budgetary
Units
D Only 31% of extra-budgetary units submit
annual financial statements to the
government within nine months after the
end of the financial year.
Ongoing reforms The upgrade of IFMIS is intended to capture all revenue and expenditure from donor-financed projects
and extra-budgetary units.
PI-7 Transfers to Sub-National Governments
This indicator assesses the transparency and timeliness of transfers from the GoL to District
Governments that have a direct financial relationship to the Central Government. It considers

33
the basis for transfers from Central Government and whether District Governments receive
information on their allocations on time, to facilitate proper budget planning.
Sub-National Government (SNG) in Lesotho is small. Local Government is predominantly
two-tier, with District Councils as the upper tier and Community and Urban Councils as the
lower tier. There are in total 10 District Councils, 64 Community Councils, 11 Urban Councils
and one Municipal (City) Council. According to the Local Government Legislation, urban
areas have single-tier Municipal or Urban Councils.
The capital Maseru has its own unique single-tier authority; the Maseru Municipal Council
(MCC). In rural areas, directly elected Community Councils are the lower tier and the
indirectly elected District Councils representing community councils are second tier. All are
separate legal entities with their own administrative, planning, accounting and procurement
staff. The main governing legislation for the local government system is the Local
Government Act 1997, as amended and Local Government Elections Act 1998. They are
subject to the provisions of the 2011 PFMA Act.
However, SNGs have limited financial autonomy, with the exception of MCC, which is part
of a pilot project for increased self-governance. All other councils pay their revenues into
the consolidated fund and their expenditures, both capital and recurrent, are financed
entirely by Central Government through transfers from the Ministry of Local Government
(MLG) budget. The costs of local health and education services are borne by the relevant
Ministries.
7.1 System for Allocating Transfers
Except for MCC, local council budgets are funded entirely using transfers from Central
Government. Grants are appropriated under the MLG for recurrent and capital expenses of
the Local Authorities. In the current arrangements, budget allocation and Central
Government transfers for financing local authorities, are channelled through the MLG, as the
councils are not direct budget heads in the Ministry of Finance (MoF). When councils utilise
public funds, their reports go through the MLG, authenticated by the Directorate of Planning
(for capital budgets and projects), and the Office of the Financial Controller (in the case of
operational and running budgets and expenditures) to the Ministry of Finance. According to
the MLG the grants for expenditure are calculated as follows:
• Construction of Rural Roads, Equal share of approved appropriation to 10 districts.
• Development fund for councils, Equal share of approved appropriation to 75 councils
• Solid waste management for urban councils, Equal share of approved appropriation
to 10 urban councils.
Of importance to note is that the above system of allocations is not approved by the
legislature; they were developed by the MLG in 2012 following complaints from District
Councils to the existing rules, which were applicable between 2005 and 2011.
The transfers of these appropriations as block grants encompasses all government
contributions and, are given first to the Council level and to then to District and Community
level.
Dimension rating = C
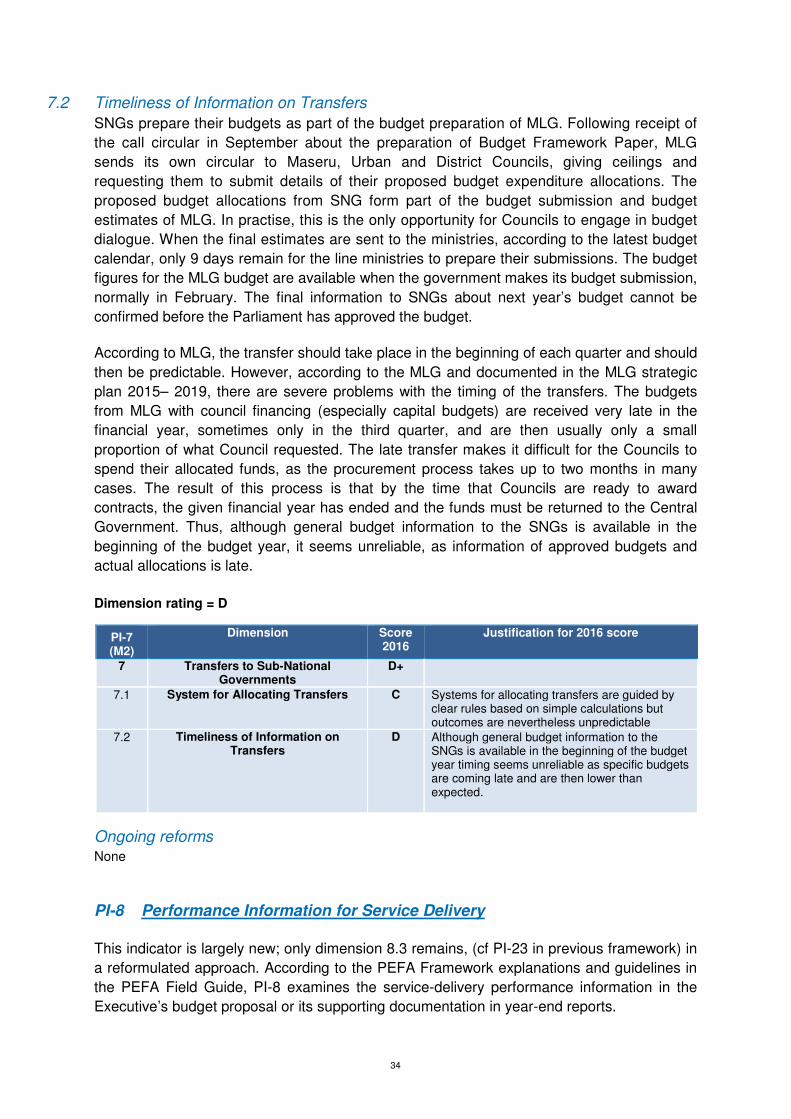
34
7.2 Timeliness of Information on Transfers
SNGs prepare their budgets as part of the budget preparation of MLG. Following receipt of
the call circular in September about the preparation of Budget Framework Paper, MLG
sends its own circular to Maseru, Urban and District Councils, giving ceilings and
requesting them to submit details of their proposed budget expenditure allocations. The
proposed budget allocations from SNG form part of the budget submission and budget
estimates of MLG. In practise, this is the only opportunity for Councils to engage in budget
dialogue. When the final estimates are sent to the ministries, according to the latest budget
calendar, only 9 days remain for the line ministries to prepare their submissions. The budget
figures for the MLG budget are available when the government makes its budget submission,
normally in February. The final information to SNGs about next year’s budget cannot be
confirmed before the Parliament has approved the budget.
According to MLG, the transfer should take place in the beginning of each quarter and should
then be predictable. However, according to the MLG and documented in the MLG strategic
plan 2015– 2019, there are severe problems with the timing of the transfers. The budgets
from MLG with council financing (especially capital budgets) are received very late in the
financial year, sometimes only in the third quarter, and are then usually only a small
proportion of what Council requested. The late transfer makes it difficult for the Councils to
spend their allocated funds, as the procurement process takes up to two months in many
cases. The result of this process is that by the time that Councils are ready to award
contracts, the given financial year has ended and the funds must be returned to the Central
Government. Thus, although general budget information to the SNGs is available in the
beginning of the budget year, it seems unreliable, as information of approved budgets and
actual allocations is late.
Dimension rating = D
PI-7 (M2)
Dimension Score 2016
Justification for 2016 score
7 Transfers to Sub-National Governments
D+
7.1 System for Allocating Transfers C Systems for allocating transfers are guided by clear rules based on simple calculations but outcomes are nevertheless unpredictable
7.2 Timeliness of Information on Transfers
D Although general budget information to the SNGs is available in the beginning of the budget year timing seems unreliable as specific budgets are coming late and are then lower than expected.
Ongoing reforms None
PI-8 Performance Information for Service Delivery
This indicator is largely new; only dimension 8.3 remains, (cf PI-23 in previous framework) in
a reformulated approach. According to the PEFA Framework explanations and guidelines in
the PEFA Field Guide, PI-8 examines the service-delivery performance information in the
Executive’s budget proposal or its supporting documentation in year-end reports.

35
It should explain if plans result from strategic priorities and if they can be compared with
budget allocations for service delivery. The indicator determines whether there has been an
implementation of performance audits or evaluations. In addition, this indicator assesses to
what extent information on resources received by service delivery units is collected and
recorded.
8.1 Performance Plans for Service Delivery
In the budget book for 2015/16 (as well as for the current year 2016/17), there is a section for
Budget and Performance Data outcome and plans for next year for all ministries presented in
a table per programme with some objectives/ performance/ output indicators. However, the
budget call circular does not contain information about programmes and there is no guidance
in the circular on how to present these indicators and data, neither are they costed. There
might be more solid plans behind these tables but the Assessment Team has not seen any
such documents. Strategic plans exist for some line ministries but they are not detailed into
the service delivery levels and they are not costed. One can conclude that in these tables,
all ministries are presenting concentrated output/performance plans with indicators but it is
unclear if they are derived from stated policies or strategies and with unclear links with the
budget as no budget data is attached. The conclusion is that these plans are not meeting the
requirements outlined in the PEFA framework and in the PEFA assessment field guide, they
are also including administrative performance which is clearly excluded for such reporting in
the PEFA framework.
The assessment team has had a closer look at two ministries, Ministry of Education and
Ministry of Health, which are concerned with the frontline service delivery units. At the
Ministry of Education, there is no overall or detailed documented service delivery plan except
the finance contribution. However, the Ministry of Health conducts annual operation plans
down to the district level; they also have a quality monitoring/output follow up system based
on 25 indicators. The budget follow up and reporting goes down to the district level. These
plans are not consolidated in the budget submission.
Dimension rating = D
8.2 Performance Achieved for Service Delivery
As described in 8.1, there is performance output reporting in the Annual Budget with some
Performance Indicators, but their accuracy is unclear, and they are not strategically linked to
budget outcomes. The conclusion about this performance reporting is the same as for
performance plans in 8.1.
For the Ministry of Education, there is no specific information available about performance
delivery results. With reference to the Ministry of Health, there are some reports and reviews
available from recent years but not as part of an annual performance evaluation system.
Dimension rating = D
8.3 Resources Received by Service Delivery Units
There are no surveys, evaluations or follow up reports, for the last 3 years that provide
information on the level or amount of resources received by service delivery units. This
applied to both the Ministry of Education and the Ministry of Health. It is noteworthy to
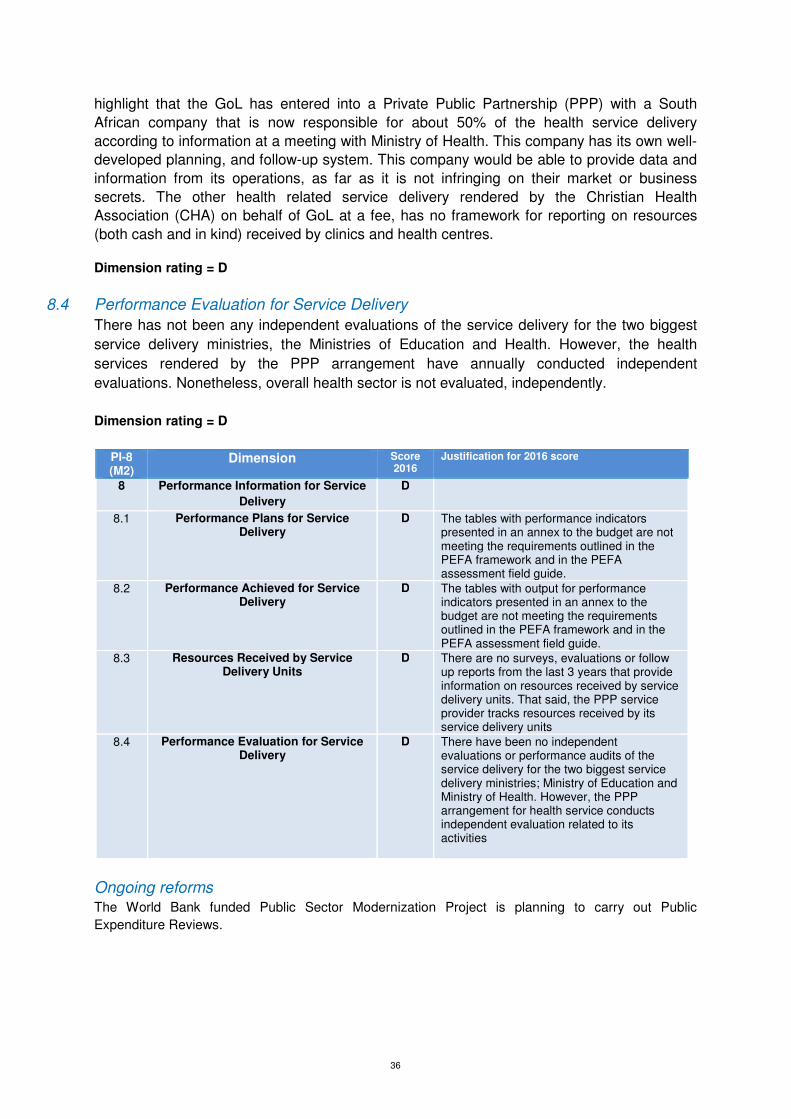
36
highlight that the GoL has entered into a Private Public Partnership (PPP) with a South
African company that is now responsible for about 50% of the health service delivery
according to information at a meeting with Ministry of Health. This company has its own well-
developed planning, and follow-up system. This company would be able to provide data and
information from its operations, as far as it is not infringing on their market or business
secrets. The other health related service delivery rendered by the Christian Health
Association (CHA) on behalf of GoL at a fee, has no framework for reporting on resources
(both cash and in kind) received by clinics and health centres.
Dimension rating = D
8.4 Performance Evaluation for Service Delivery
There has not been any independent evaluations of the service delivery for the two biggest
service delivery ministries, the Ministries of Education and Health. However, the health
services rendered by the PPP arrangement have annually conducted independent
evaluations. Nonetheless, overall health sector is not evaluated, independently.
Dimension rating = D
PI-8 (M2)
Dimension Score 2016
Justification for 2016 score
8 Performance Information for Service
Delivery
D
8.1 Performance Plans for Service Delivery
D The tables with performance indicators presented in an annex to the budget are not meeting the requirements outlined in the PEFA framework and in the PEFA assessment field guide.
8.2 Performance Achieved for Service Delivery
D The tables with output for performance indicators presented in an annex to the budget are not meeting the requirements outlined in the PEFA framework and in the PEFA assessment field guide.
8.3 Resources Received by Service Delivery Units
D There are no surveys, evaluations or follow up reports from the last 3 years that provide information on resources received by service delivery units. That said, the PPP service provider tracks resources received by its service delivery units
8.4 Performance Evaluation for Service Delivery
D There have been no independent evaluations or performance audits of the service delivery for the two biggest service delivery ministries; Ministry of Education and Ministry of Health. However, the PPP arrangement for health service conducts independent evaluation related to its activities
Ongoing reforms The World Bank funded Public Sector Modernization Project is planning to carry out Public
Expenditure Reviews.
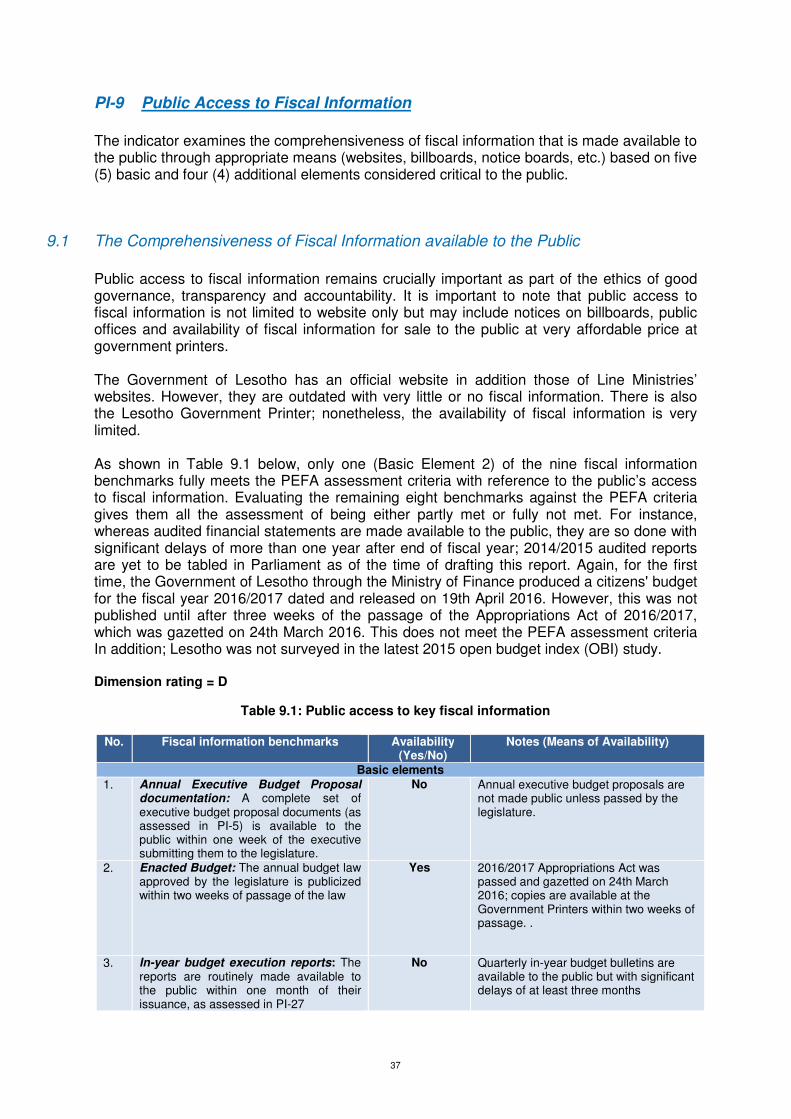
37
PI-9 Public Access to Fiscal Information
The indicator examines the comprehensiveness of fiscal information that is made available to the public through appropriate means (websites, billboards, notice boards, etc.) based on five (5) basic and four (4) additional elements considered critical to the public.
9.1 The Comprehensiveness of Fiscal Information available to the Public
Public access to fiscal information remains crucially important as part of the ethics of good governance, transparency and accountability. It is important to note that public access to fiscal information is not limited to website only but may include notices on billboards, public offices and availability of fiscal information for sale to the public at very affordable price at government printers. The Government of Lesotho has an official website in addition those of Line Ministries’ websites. However, they are outdated with very little or no fiscal information. There is also the Lesotho Government Printer; nonetheless, the availability of fiscal information is very limited. As shown in Table 9.1 below, only one (Basic Element 2) of the nine fiscal information benchmarks fully meets the PEFA assessment criteria with reference to the public’s access to fiscal information. Evaluating the remaining eight benchmarks against the PEFA criteria gives them all the assessment of being either partly met or fully not met. For instance, whereas audited financial statements are made available to the public, they are so done with significant delays of more than one year after end of fiscal year; 2014/2015 audited reports are yet to be tabled in Parliament as of the time of drafting this report. Again, for the first time, the Government of Lesotho through the Ministry of Finance produced a citizens' budget for the fiscal year 2016/2017 dated and released on 19th April 2016. However, this was not published until after three weeks of the passage of the Appropriations Act of 2016/2017, which was gazetted on 24th March 2016. This does not meet the PEFA assessment criteria In addition; Lesotho was not surveyed in the latest 2015 open budget index (OBI) study. Dimension rating = D
Table 9.1: Public access to key fiscal information
No. Fiscal information benchmarks Availability (Yes/No)
Notes (Means of Availability)
Basic elements 1. Annual Executive Budget Proposal
documentation: A complete set of executive budget proposal documents (as assessed in PI-5) is available to the public within one week of the executive submitting them to the legislature.
No Annual executive budget proposals are not made public unless passed by the legislature.
2. Enacted Budget: The annual budget law approved by the legislature is publicized within two weeks of passage of the law
Yes 2016/2017 Appropriations Act was passed and gazetted on 24th March 2016; copies are available at the Government Printers within two weeks of passage. .
3. In-year budget execution reports: The reports are routinely made available to the public within one month of their issuance, as assessed in PI-27
No Quarterly in-year budget bulletins are available to the public but with significant delays of at least three months
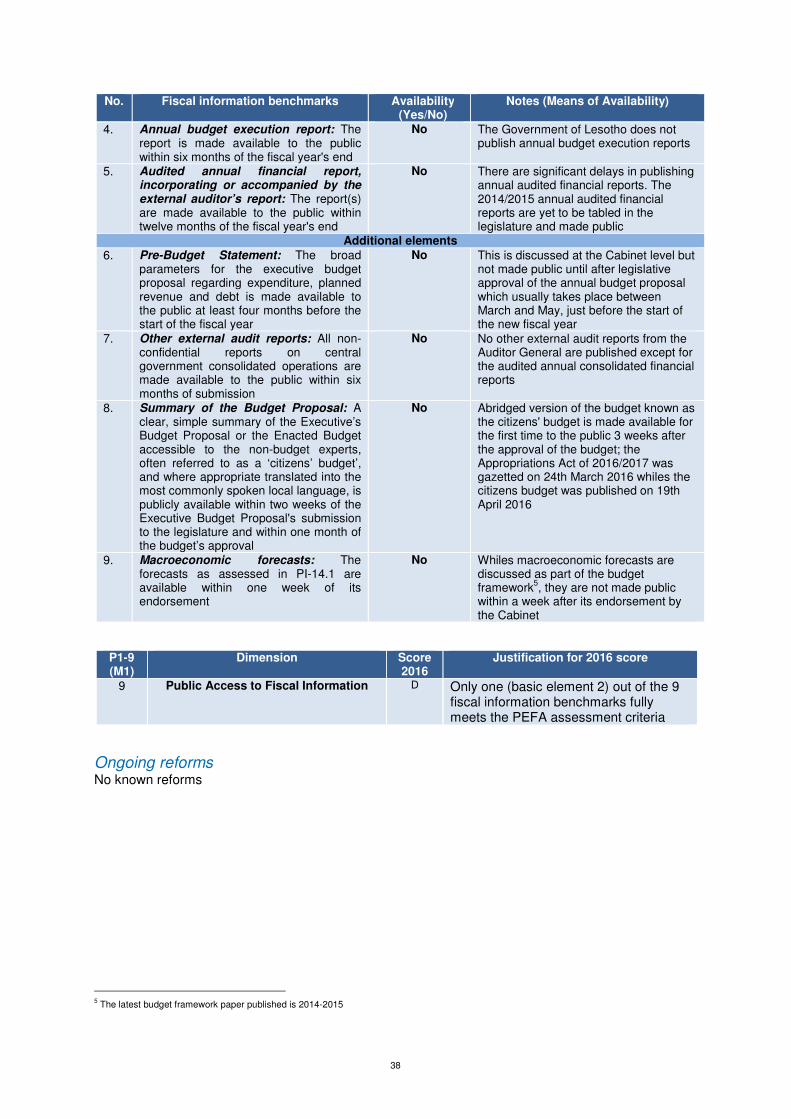
38
No. Fiscal information benchmarks Availability (Yes/No)
Notes (Means of Availability)
4. Annual budget execution report: The report is made available to the public within six months of the fiscal year's end
No The Government of Lesotho does not publish annual budget execution reports
5. Audited annual financial report, incorporating or accompanied by the external auditor’s report: The report(s) are made available to the public within twelve months of the fiscal year's end
No There are significant delays in publishing annual audited financial reports. The 2014/2015 annual audited financial reports are yet to be tabled in the legislature and made public
Additional elements 6. Pre-Budget Statement: The broad
parameters for the executive budget proposal regarding expenditure, planned revenue and debt is made available to the public at least four months before the start of the fiscal year
No This is discussed at the Cabinet level but not made public until after legislative approval of the annual budget proposal which usually takes place between March and May, just before the start of the new fiscal year
7. Other external audit reports: All non-confidential reports on central government consolidated operations are made available to the public within six months of submission
No No other external audit reports from the Auditor General are published except for the audited annual consolidated financial reports
8. Summary of the Budget Proposal: A clear, simple summary of the Executive’s Budget Proposal or the Enacted Budget accessible to the non-budget experts, often referred to as a ‘citizens’ budget’, and where appropriate translated into the most commonly spoken local language, is publicly available within two weeks of the Executive Budget Proposal's submission to the legislature and within one month of the budget’s approval
No Abridged version of the budget known as the citizens' budget is made available for the first time to the public 3 weeks after the approval of the budget; the Appropriations Act of 2016/2017 was gazetted on 24th March 2016 whiles the citizens budget was published on 19th April 2016
9. Macroeconomic forecasts: The forecasts as assessed in PI-14.1 are available within one week of its endorsement
No Whiles macroeconomic forecasts are discussed as part of the budget framework
5, they are not made public
within a week after its endorsement by the Cabinet
P1-9 (M1)
Dimension Score 2016
Justification for 2016 score
9 Public Access to Fiscal Information D Only one (basic element 2) out of the 9 fiscal information benchmarks fully meets the PEFA assessment criteria
Ongoing reforms No known reforms
5 The latest budget framework paper published is 2014-2015

39
Pillar III. Management of Assets and Liabilities
PI-10 Fiscal Risk Reporting
This indicator measures the extent to which fiscal risks to the government are reported.
Fiscal risks can arise from adverse macroeconomic situations, financial positions of district
governments or public corporations, and contingent liabilities from the GoL’s own programs
and activities, including extra budgetary units. They can also arise from other implicit and
external risks such as market failure and natural disasters. Central government will usually
have a formal oversight role in relation to other public sector entities and should be aware of,
monitor, and manage fiscal risks at a consolidated level.
Fiscal risk management consists of a set of procedures designed to quantify and report risks.
Those risks can arise from many sources: This indicator is concerned with Public
corporations, financial position of sub-national (SN) levels of government and contingent
liabilities.

40
10.1 Monitoring of Public Corporations
The PEFA 2016 framework refers to GFS 2014 definitions to determine which entities are
public corporations but, GFS 2014 has not been implemented in Lesotho. However, A
country need not have adopted a budget classification based on GFS 2014 for public
corporations to be assessed as meeting the definition of public corporations GFSN as
explained in the PEFA Assessment Fieldguide. The assessment has used available
information from the government to determine what to assess. What we have got listed from
government sources is a document, “Financial and Governance Oversight of State owned
Enterprises”, obtained from MOF PDS Department; there are 32 Parastatals, 19 Companies
and 11 Agencies; all in all 62. It is a mix of entities that are wholly or partly owned by the
government; public enterprises, companies in which the Government has a minority
shareholding and a range of autonomous institutions, commissions and boards of varying
financial significance. The last PEFA Assessment (2012) states that there are 58 such
organizations. The assessment team also obtained a document “Policy on Corporate
Governance for Lesotho Public Enterprises, Government Agencies and Entities”. The
document is undated but it was sent out in August 2009 with a Savingram as an Official
working document of the GoL, but it is not approved by the Cabinet and has not been
implemented.
The MoF should exercise oversight of relevant entities on behalf of the Central Government,
but that is not taking place and the PSD Department does not receive any financial
statements or other reports, meaning that there is no central risk monitoring within the MoF.
The portfolio ministries, with entities under them are receiving, in some cases, financial
statements but are not exercising any oversight either. The Auditor General is only mandated
to audit those ones where the government owns 50% or more, and according to
documentation from the Auditor General there were 34 such entities of which one is now
closed down. Not all financial statements are submitted to Auditor General on time, up to 8
years delay occurs and in 9 cases the Auditor General is giving a qualified opinion in the last
audit report meaning that the information in the financial statements is incomplete and/or not
following accepted accounting standards. The Auditor General has no information about the
financial statements or the audit of the rest of the public corporations outside the mandatory
audit.
Dimension rating = D
10.2 Monitoring of Sub-National Governments
There is no systematic monitoring by the MLG of the SNG´s fiscal positions and the MLG
does not follow up on financial statements. In information obtained from the Auditor General,
the assessment team has found that historically, financial statements from the councils have
been submitted late. Currently audit reports concerning 2014/15 are available for 8 of 11
councils while for one council the latest audit report is from 2007/08, for another 2010/11 and
for one - not available, but the last 2 completed years of that council is now under audit. In
the available audit reports, only one gets an unqualified opinion while the rest have qualified
opinions, adverse opinions or disclaimers. The most common opinion is a disclaimer,
indicating a very low quality of the financial statement.
Dimension rating = D

41
10.3 Contingent Liabilities and other Fiscal Risk
The revised Consolidated Statements for 2015-16 contain a note about Contingent Liabilities
that shows a total balance by 31 of March 2016 of M88,046,347 . However, it is not possible
to confirm if this data is complete as far as central government is concerned. Public Private
Partnerships are not included. According to the PSD Department, there is no available
knowledge regarding the levels at risk in different ventures, nor is there yet any coordinated
oversight exercised over the existing PPPs even though there are two major PPP
arrangements currently ongoing in the health sector. The incomplete information about
contingent liabilities creates considerable uncertainty about the status and volume of these
risks.
Dimension rating = D*
PI-10 (M1)
Dimension Score 2016
Justification for 2016 score
10 Fiscal Risk Reporting D 10.1 Monitoring of Public Corporations D MoF PSD does not currently receive any
financial reports from Public Corporations. However majority of SoEs submit reports to their line ministries but fiscal risks are not monitored
10.2 Monitoring of Sub-National Governments
D There is no systematic monitoring of SNG´s fiscal positions and audits have been late due to late submissions of financial statements
10.3 Contingent Liabilities and other Fiscal Risks
D* Contingent liabilities are disclosed in a limited way that leaves uncertainty about the volume of these risks, particularly contingent liabilities arising out of PPPs
Ongoing reforms
Officials from PSD department say the ongoing PFM reform is now working on creating a
functional monitoring framework for Public Corporations but it has, to date, not been
established. Such a monitoring function should have the potential to identify and document
fiscal risks as well as map out contingent liabilities stemming from Public corporations and
PPPs.
PI-11 Public Investment Management
This indicator has four dimensions. It assesses the institutional framework for decision-making on public investments, the economic appraisal, selection and costing as well as the monitoring and management of these investments, taking into consideration the national and policy and strategic objective for achieving and sustaining economic growth, as well as the fiscal space (both capital investment and recurrent costs) for financing these investments.
11.1 Economic Analysis of Investment Proposals
The Ministry of Development Planning is responsible for providing guidelines as well as coordinating all central government capital investment. It works with all heads of planning departments across line ministries through a committee known as the Public Sector Investment Committee (PSIC); a Cabinet decision in September 2013 changed its name from Project Appraisal Committee (PAC) to PSIC. The committee also includes key heads of departments in MoF such as Budget Department, Macro-fiscal Department, Ministry of

42
Environment, and the Ministry of Gender. The committee's role is guided by established guidelines as contained in the PSIC manual dated November 2013; the guidelines are not currently published on the website due to technical challenges but copies are made available to all line ministries. The strategic role of the PSIC includes but not limited to critically and objectively evaluating all new capital projects in accordance with established rules, recommending projects for funding, approving the final PSIP report, and monitoring project implementation. The economic analysis of all capital investment projects begins with ministerial level appraisal, forwarded to the PSIC for further scrutiny to ensure projects align to the National Strategic Development Plan (NSDP). Once proposed projects pass the appraisal criteria set out in the guidelines, they are included in the Public Sector Investment Programme (PSIP) report (feasibility study report) and submitted to Cabinet for final approval. The outcome of the PSIP report is not published except for internal (inter-ministerial) use only. Of importance to note is the weak technical capacity to critically assess public investment management; also, there is a disconnect between appraisal guidelines in the PIM manual and the actual implementation of those guidelines that will consider project viability, fiscal space, and socio-economic benefit Dimension rating = C
11.2 Investment Project Selection
Prior to Cabinet approval of capital investment projects for inclusion into the annual budget, the following basic selection criteria must be satisfied in line with established guidelines, namely:
• Alignment of project with the NSDP. • Achievability– this looks at the project deliverables, funding mechanisms and other
environmental constraints and challenges. If funding is not available, project remains in the PSIP until funds are raised either domestically or externally.
• Viability– cost implications and mainstream revenue-generating potentials, management implications, financial sustainability and project economic impact. The overall socio-economic impact is evaluated.
• Project priority - how important is the project; sequencing is not considered at the project selection stage which is a weakness but plays a pivotal role during project implementation.
• Feasibility study report. • Environmental impact assessment report. • Evidence of acquisition and ownership of proposed project site.
In addition to the above basic requirements for project selection, capital projects from Line Ministries are required to submit a project concept note (or Proposal). This is a formal presentation by the implementing Ministry or Agency, with the full participation of the Principal Secretary (the Accounting Officer). A desk Appraisal Report from the Department of Project Cycle Management (DPCM) within Ministry of Development Planning, appraisal report from external funding agency where necessary, and evidence of experience in the sector as well as further clarifications of proposals. Dimension rating = B
11.3 Investment Project Costing
A comprehensive project costing ought to take into account both investment cost and forward linked recurrent expenditure, the cost-benefit analysis through critical sensitivity analysis, consider the public and private interest, among others. It should also ascertain the affordability and cash flow implications referencing fiscal space for both ongoing projects and new investments to be funded by the national budget. A number of capital projects, including the expansion of the Moshoeshoe International Airport, the Rural Electrification Project, the

43
Rehabilitation of the Sehlabathebe National Park were examined to ascertain whether both capital cost and forward linked recurrent expenditures are budgeted for and included in the 3-year medium-term budget. Project proposals must outline investment costs and forward linked recurrent expenditures; the inclusion of recurrent expenditure into project costing began in late 2013. The annual national budget (MTEF) also includes at least initial capital costs and three-year projections of recurrent expenditure in relation to the project(s); where the capital cost is multi-year, it is spread according to funding/disbursement schedules. However, these estimates appear to have very little impact during the next budget cycle. Dimension rating = B
11.4 Investment Project Monitoring
The Department of Project Cycle Management (DPCM) within the Ministry of Development Planning (MDP) is the central body responsible for project monitoring and evaluation. The department monitors all capital projects with officials from the planning units of implementing line ministry. A draft PCM manual dated July 2016 prescribes the monitoring and evaluation functions and responsibilities of each stakeholder regarding project implementation. For uniformity, DPCM has developed a reporting template for use by implementing agencies and development partners where necessary. Quarterly site visits are carried out; internal monitoring and evaluation reports are also produced quarterly. Following project completion, M&E report is prepared; however, no reports are published except for internal use only. That said, all capital projects funded by development partners (which constitute more than 50% of total capital investments) entail independent monitoring and evaluation experts; M&E and completion reports are published. A review of one of the periodic M&E reports for rural electrification project funded by AfDB indicates total loan commitment, actual disbursements, undisbursed loan, and percentage of completion, expected completion date and reasons for deviations against targets. Dimension rating = B
PI-11 (M2)
Dimension Score 2016
Justification for 2016 score
11 Public Investment Management B
11.1 Economic Analysis of Investment Proposals
C Economic analyses of all central government capital investment projects are conducted in line with established guidelines; however the outcome of the investment proposals are not published except for inter-ministerial use only
11.2 Investment Project Selection B Project selection is based on established (but not published) selection criteria. Prior to inclusion in the budget, Cabinet approves all project proposals that have passed the PSIC appraisal process
11.3 Investment Project Costing B Both investment cost and forward linked recurrent expenditures are provided for in both project proposals and MTEF budget documents for at least the first three years
11.4 Investment Project Monitoring B Monitoring and evaluation of all capital projects entail both physical progress of work and financial progress; nonetheless internal M&E reports are not published but those (which constitute more than 50% of total capital investments) by external evaluators are published

44
Ongoing reforms No known reforms
PI-12 Public Asset Management
This indicator has three dimensions. Dimension 12.1 assesses the level at which financial assets (government equity investments in public or private companies) are monitored and reported; Dimension 12.2 examines the extent to which non-financial assets (fixed assets) are monitored and reported; Dimension 12.3 measures the level of transparency of fixed asset disposal.
12.1 Financial Asset Monitoring
The Private Sector Development (PSD) Unit within MoF is responsible for monitoring all government equity investments in both public and private companies; however, this unit lacks the dexterity in monitoring and evaluating the performance of government investments in these companies. The institutional framework for managing these investments is incorporated in the Corporate Governance Policy on SOEs. The policy sets out the ministerial responsibilities, management structure, government representation and voting rights, statutory accountability and control, the role of the Auditor General, legislative role, among others. Interactions with officials of the PSD unit suggest serious capacity and professional capability constraints; further, the unit does not keep records of shares certificates even though it is part of their core mandate. Again, rarely does the unit receive copies of annual audited financial statements of these SOEs. Evidence adduced by the PSD shows government equity investment in 18 companies with shares between 5% to 100%. The equity investment schedule does not provide information on the number of shares, value of each share, the total investment cost, date of investment and any movement in equity, including whether dividends are declared or not. In 2015/2016, government received dividends totalling M400.47million as compared to M180million in 2014/2015; this was reported in the 2015/2016 draft consolidated annual financial statements. Dimension rating = D
12.2 Nonfinancial Asset Monitoring Section 5(i) of the PFMA Act 2011 mandates all chief accounting officers to prepare a register of all fixed assets including asset management plans; that said, budget entities do not fully comply with this legal provision. There is no centralised government institution responsible for recording and reporting all (consolidated) central government fixed assets; nonetheless, some line ministries do maintain a register of fixed assets funded by development partners since it is a mandatory requirement in the financing agreements. The consolidated annual financial statements only report on fixed assets acquisition, compliant with Section 13(a) of the PFMA Act 2011 but fail to provide a comprehensive list of fixed assets. Given the importance of the efficient management of national assets in ensuring good public financial management, a comprehensive database on both moveable (vehicles, furniture & fittings, machinery & equipment, computers, etc.) and immoveable (buildings & structures, land, mineral and energy resources, etc.) assets will play a significant role towards the attainment of budget credibility through the minimisation of wastage of scarce government resources. Dimension rating = D
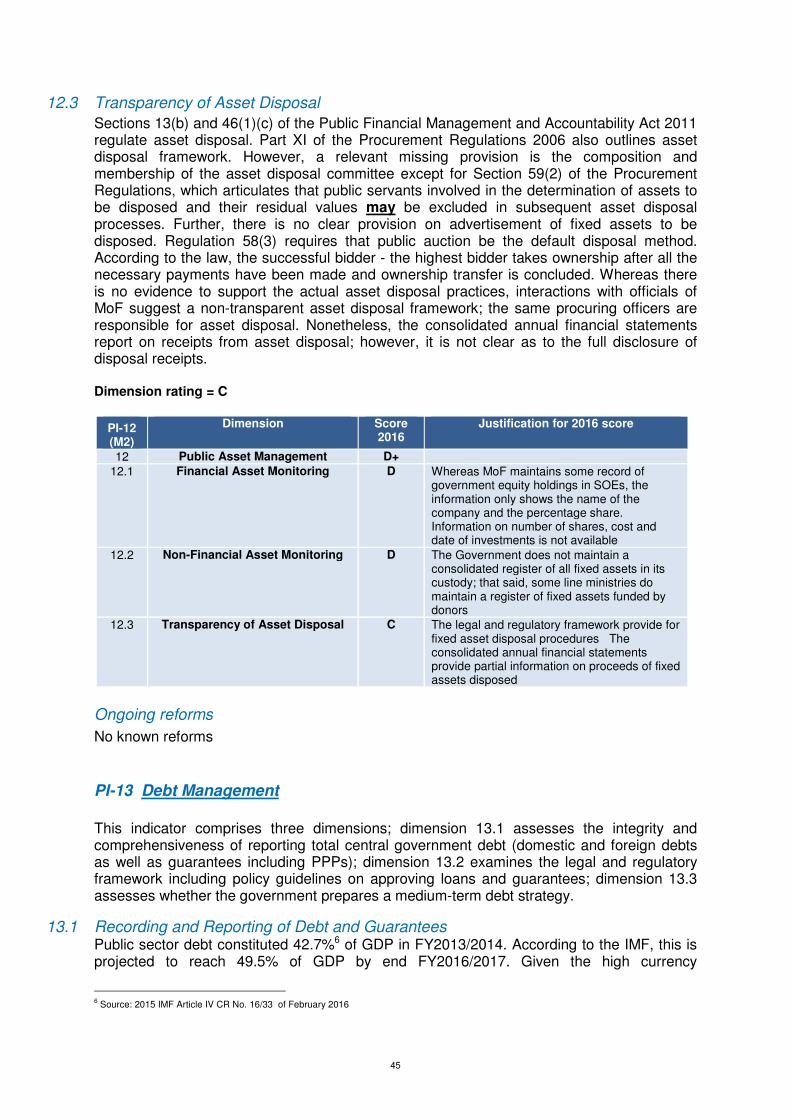
45
12.3 Transparency of Asset Disposal
Sections 13(b) and 46(1)(c) of the Public Financial Management and Accountability Act 2011 regulate asset disposal. Part XI of the Procurement Regulations 2006 also outlines asset disposal framework. However, a relevant missing provision is the composition and membership of the asset disposal committee except for Section 59(2) of the Procurement Regulations, which articulates that public servants involved in the determination of assets to be disposed and their residual values may be excluded in subsequent asset disposal processes. Further, there is no clear provision on advertisement of fixed assets to be disposed. Regulation 58(3) requires that public auction be the default disposal method. According to the law, the successful bidder - the highest bidder takes ownership after all the necessary payments have been made and ownership transfer is concluded. Whereas there is no evidence to support the actual asset disposal practices, interactions with officials of MoF suggest a non-transparent asset disposal framework; the same procuring officers are responsible for asset disposal. Nonetheless, the consolidated annual financial statements report on receipts from asset disposal; however, it is not clear as to the full disclosure of disposal receipts. Dimension rating = C
PI-12 (M2)
Dimension Score 2016
Justification for 2016 score
12 Public Asset Management D+ 12.1 Financial Asset Monitoring D Whereas MoF maintains some record of
government equity holdings in SOEs, the information only shows the name of the company and the percentage share. Information on number of shares, cost and date of investments is not available
12.2 Non-Financial Asset Monitoring D The Government does not maintain a consolidated register of all fixed assets in its custody; that said, some line ministries do maintain a register of fixed assets funded by donors
12.3 Transparency of Asset Disposal C The legal and regulatory framework provide for fixed asset disposal procedures The consolidated annual financial statements provide partial information on proceeds of fixed assets disposed
Ongoing reforms
No known reforms
PI-13 Debt Management
This indicator comprises three dimensions; dimension 13.1 assesses the integrity and comprehensiveness of reporting total central government debt (domestic and foreign debts as well as guarantees including PPPs); dimension 13.2 examines the legal and regulatory framework including policy guidelines on approving loans and guarantees; dimension 13.3 assesses whether the government prepares a medium-term debt strategy.
13.1 Recording and Reporting of Debt and Guarantees Public sector debt constituted 42.7%6 of GDP in FY2013/2014. According to the IMF, this is projected to reach 49.5% of GDP by end FY2016/2017. Given the high currency
6 Source: 2015 IMF Article IV CR No. 16/33 of February 2016
46
depreciation, coupled with decline in export revenues posing major threats to debt sustainability, Lesotho is still considered a moderate debt distress country. Total public debt stood at M13.978billion7 (equivalent to US$1.04billion), composed of M1.274billion and M12.704billion domestic and foreign debt respectively. Further, the 2015/2016 draft consolidated annual financial statements report total government guarantees of M88.05million, up from M47.69million in 2014/2015; this represents 185% rise from the 2014/2015 figure. Presently, the Government does not report on contingent liabilities arising out of Public Private Partnerships (PPPs), even though a couple of such arrangements are ongoing, namely the Mamohato Memorial Hospital and the Health Headquarters. There is also no information on implicit contingencies. The institutional arrangement supporting the ongoing PPPs is very weak; the Health Ministry has a PPP coordinating department that works with the contract management department within the Ministry of Finance: both departments have very low human capacity and technical capability. Given the challenges in relation to the current PPP arrangements, the Government has developed a draft PPP policy, eventually leading to the development and promulgation of PPP legal regulations, going forward. It has also resolved to report on PPPs, henceforth. The Public Debt Department uses the Commonwealth Secretariat Debt Recording and Management System (CS-DRMS) for recording and managing debt stock. The software is comprehensive and generates monthly analytical and statistical reports within 15 days after the end of the preceding month. Complete reconciliation of debt stock is at least quarterly with information obtained from creditor statements. The CS-DRMS provides information on domestic and foreign debt, bilateral and multilateral loans with respect to transaction date, outstanding opening balance, principal payments, interest payment, principal and interest due date, additional loan commitments, and closing balance. Internal reconciliation concerns between the Public Debt Department and the Accountant General Department, identified during the 2012 PEFA assessment have continued to linger till date; there is no direct interface between IFMIS and CS-DRMS - this results in manual debt data entry into IFMIS thereby leading to inaccurate data recording and reporting. Dimension rating = C
13.2 Approval of Debt and Guarantees There are four legal and regulatory frameworks governing central government borrowing in Lesotho, namely: (i) Loans and Guarantees Act 1967, (ii) Local Loans Act 2001, and (iii) Public Finance Management and Accountability Act 2011. There is no legislation or policy guidelines on Public Private Partnerships. Whereas the Loans and Guarantees Act 1967 empowers the Minister of Finance to raise external loans and issue guarantees on behalf of government, the Local Loans Act 2001 authorises the Minister to raise domestic loans through the issuance of treasury bills and bonds. Sections 28 and 29 of the PFMA Act 2011 oblige the Minister of Finance to approve all central government loans with prior consent from Cabinet, including loans and guarantees for state-owned enterprises, sub-national governments and parastatals. Section 28(5) of the PFMA Act 2011 requires the Minister of Finance to critically assess whether the borrowing entity or individual has the capacity to repay the loan prior to approval; in practice, however, this is not the case as political pressure overrides professional and legal considerations. Annual borrowing limits are however within agreed thresholds set by the IMF and approved by the legislature. A significant flaw identified in the Loans and Guarantees Act 1967 relates to government guaranteeing loans for individuals and private and/or public corporate entities as outlined in Section 6 (1) of the Act. Even though Section 6(2) requires the Minister of Finance to satisfy himself/herself that the borrower is capable of repaying the loan, political pressure has overridden this provision. This has necessitated the drafting of a new loans bill, currently at
7 Source: Unaudited consolidated annual financial reports FY2015/2016

47
the draft stage; the new bill is known as "Public Debt and Aid Management Bill 2016". One critical clause included in the new debt bill is the establishment of a sinking fund to cater for implicit contingent liabilities. It is expected to be finalised and promulgate by end of calendar year 2017. In addition to the flaw identified in the Loans and Guarantees Act 1967, lawmakers have passed a new law, which allows each parliamentarian to borrow at commercial rate with government guarantee; the government pays the loan interest. Officials from the debt department have also raised concerns regarding similar facilities being extended to Permanent Secretaries of line ministries. Another key development is the drafting of a PPP policy; though at the draft stage, it is expected to be finalised in 2017; this will eventually lead to the promulgation of PPP legislation going forward. Dimension rating = C
13.3 Debt Management Strategy
The first official debt management strategy was developed in 2013 but was never adopted due to major disagreements between the Ministry of Finance and the Ministry of Development Planning regarding the underlying assumptions thereto. To date, there has not been any official medium-term debt management strategy (MTDMS) to guide central government borrowing even though an informal debt strategy comes to play in times of borrowing decision either domestically or internationally. In this regard, the Government of Lesotho has sought the assistance of the World Bank and the IMF to build local capacity referencing the development of MTDMS. The IMF during its Article IV consultations works in tandem with staff of MoF (Public Debt Department) to prepare a debt sustainability analysis (DSA); the most current DSA was annexed to the 2015 IMF Article IV report on the Kingdom of Lesotho dated February 2016. Going forward, the new "Public Debt and Aid Management Bill 2016" when promulgated will make the development of MTDMS mandatory. Dimension rating = D
PI-13 (M2)
Dimension Score 2016
Justification for 2016 score
13 Debt Management D+ 13.1 Recording and Reporting of Debt
and Guarantees C Both domestic and foreign debt including
guarantees are recorded and reconciled at least quarterly with information obtained from creditor statements. CS-DRMS generates monthly reports with statistical analyses. However PPPs are neither recorded nor reported. Again, internal reconciliation challenges arising as a result of manual debt data entry onto IFMIS have not been resolved
13.2 Approval of Debt and Guarantees C The legal and regulatory framework grant authorisation to borrow both from domestic and external sources; the Minister of Finance is the sole person authorised to contract loans and issue guarantees on behalf of government and SOEs subject to Cabinet approval. Annual borrowing limits are approved by parliament and are within IMF thresholds. Nonetheless, political pressure overriding the Minister of Finance power to approve all loans remains a significant issue
13.3 Debt Management Strategy D The Ministry of Finance does not prepare a medium-term debt sustainability strategy to guide central government borrowing decisions; however there appears to be an informal debt management strategy in making borrowing decisions.

48
Ongoing reforms
A new bill on debt has been drafted; it is expected to be promulgated by end of calendar year
2017. The new bill is known as the "Public Debt and Aid Management Bill 2016".

49
Pillar IV. Policy-based fiscal strategy and budgeting
PI-14 Macroeconomic and Fiscal Forecasting
This indicator measures the ability of a government to develop robust macroeconomic and
fiscal forecasts, which are crucial to developing a sustainable fiscal strategy and ensuring
greater predictability of budget allocations.
The Macroeconomic Policy and Management Department (MPMD) was established in 2007
with the aim of building technical capacity and developing forecasting tools. The unit is now
well established with a sufficient number of skilled staff. The MPMD mainly uses an IMF-type
Financial Programming (FP) model to produce its three-year medium-term macro-fiscal
forecasts. These forecasts feed into the formulation of the BSP. The Central Bank of Lesotho
(CBL) also produces macroeconomic forecasts using a similar FP model. CBL, like MoF,
has received technical assistance from IMF. CBL´s forecasts, which are made biannually,
are made for 3 years and published on its website. Differences do exist between CBL's
forecasts and those of MoF, but mainly due to different reporting cycles; MoF are linked to
the fiscal years and CBL to calendar years. There is some exchange of information between
CBL and MoF but of little use to MoF.
However, the macro-fiscal forecasts made by the MoF are hampered by a lack of timely and
accurate macroeconomic data (according to IMF report on Strengthening Medium-Term
Budget Planning, Cash Management, and Fiscal Reporting, September 2016) and weak
coordination across departments and agencies. In addition, CBL points to the problem of
data quality. Another challenge is the significant delays in releasing actual statistical figures
by the Bureau of Statistics; most data used are forecast figures. The existence of a Macro-
fiscal Working Group (MWG) appears to have little impact on data quality and integrity.
According to the IMF, there is a need to improve the reliability of macro-fiscal forecasts and
the medium-term fiscal framework (MTFF) through:
• Improving coordination and information exchange;
• Strengthening the macro-fiscal forecasting model by correcting historical
inconsistencies within the existing database;
• Preparing macro-fiscal forecasts at the beginning of the fiscal year and updating
these before the BSP is approved, and;
• Developing analytical capacity to assess the impact of fiscal risks on public finances
and incorporate this assessment into the forecasting and fiscal policymaking process.
14.1 Macroeconomic Forecasts
The MPMD prepares forecasts for key macroeconomic indicators for the budget year and the
following two fiscal years, but are not disclosing the underlying assumptions publicly. The
forecast feeds into the budget strategy paper and into budget process via the budget call
circular but in the government’s budget submission it appears only as a mentioning of a few
indicators in the budget speech. However, there is some sporadic communication with the
Parliament during the fiscal year where the Parliament committee for the economic cluster
requests for such information.
Dimension rating = C

50
14.2 Fiscal Forecasts The MPMD prepares fiscal forecasts for the budget year and the two following years, which
are documented in the MTEFF framework. The forecasts include aggregate revenues,
expenditures and anticipated deficit. These forecasts are also reflected in the Budget
Strategy Paper and in the budget call circular. However, the fiscal forecasts submitted to
parliament do not include the underlying assumptions as part of the budget submission to the
National Assembly.
Dimension rating = C
14.3 Macro-Fiscal Sensitivity Analysis This kind of analyses are being developed with IMF model, but are not yet documented and
published and not regularly used as an input in the budget submissions although the
department is sometimes requested to assess different outcomes. According to the PEFA
framework, sensitivity analysis should involve an analysis of debt sustainability as well as
impact of fiscal policy decisions; this is not the case in the example of analysis disclosed to
the assessment team. In addition, there is no qualitative assessment regarding the impact of
the current sensitivity analysis produced by the macro department.
Dimension rating = D
PI-14 (M2)
Dimension Score 2016
Justification for 2016 score
14 Macroeconomic and Fiscal Forecasting
D+
14.1 Macroeconomic Forecasts C The government prepares forecasts for key macroeconomic indicators for the budget year and the following two fiscal years; however, these are not submitted to the Parliament systematically except when requested by parliament economic cluster
14.2 Fiscal Forecasts C The government prepares fiscal forecasts for the budget year and the following two fiscal years with aggregate revenue and expenditure estimates as well as anticipated deficit; however the underlying assumptions are not part of the budget submissions to Parliament
14.3 Macro-Fiscal Sensitivity Analysis D This kind of analysis is under development but is not yet documented and published. There is also no qualitative assessment of the impact of sensitivity analysis currently produced by the macro department
PI-15 Fiscal Strategy
This indicator provides an analysis of the capacity to develop and implement a clear fiscal
strategy. It also measures the ability to develop and assess the fiscal impact of revenue and
expenditure policy proposals that support the achievement of the government’s fiscal goals.
The government’s fiscal strategy, although not exhaustive, is reflected in the Budget Strategy
Paper and in the Call circular. According to these documents, over the next three years the
aim is to maintain long-term fiscal sustainability and to provide a sufficient fiscal and/or
51
foreign reserve buffer against domestic and external shocks and imbalances. Prudent fiscal
management will also help to sustain confidence of investors and development cooperating
partners and help to secure financing for investment by the private sector and for
infrastructure projects. However, according to IMF (Kingdom of Lesotho, Strengthening
Medium-Term Budget Planning, Cash Management, and Fiscal Reporting, 2016), the
government does not yet have a set of clear fiscal policy objectives to guide budget
preparation.
15.1 Fiscal Impact of Policy Proposals The call circular has a section on National Policy goals and key policy charges. The goals
are grouped in three clusters with reference to National Strategic Development Plan (NSDP):
(i) facilitating job creation, inclusive growth and economic diversification; (ii) reducing
economic and social vulnerabilities; and (iii) improving public sector efficiency and service
delivery. These are setting overall priorities for the budget but are not clearly linked to
priorities in the estimates for revenue and expenditure in the call circular. In the BSP is some
information about “Translating Policies into Budget Allocations”. The information in BSP says
that the government have taken strategic measures to streamline more resource allocations
towards NSDP priority sector ministries and it is also accompanied with a table showing the
allocations to some ministries from the last three budget years including the current year.
Concerning the capital estimates, the criteria for priorities are more precise and the
requirement is that all project submissions and estimates should indicate how the projects
reflect national development priorities. To summarize, the government indicates aggregated
estimates of the fiscal impact for some proposed changes in revenue and expenditure policy
for the budget year.
Dimension rating = D
15.2 Fiscal Strategy Adoption
The Fiscal Strategy is reflected in the Budget Strategy Paper and also in the call Circular
where each of them contains 1 – 2 pages of brief descriptions. The fiscal strategy over the
next three years will thus aim at maintaining long-term fiscal sustainability and providing a
sufficient fiscal and/or foreign reserve buffer against domestic and external shocks and
imbalances. Prudent fiscal management will also help to sustain confidence of investors and
development cooperating partners and help to secure financing for investment by the private
sector and for infrastructure projects. As included in the Call Circular, it is approved by the
Cabinet but it is not part of the budget submission to the Parliament. Therefore, it is prepared
for internal use only, and might be useful for the budget preparation, but it is not published as
a comprehensive Fiscal Strategy Document.
Dimension rating = C
15.3 Reporting on Fiscal Outcomes
There is a brief quarterly Budget and fiscal bulletin published from the last year and onwards
by the MoF that contains some performance on Macroeconomic Developments, Budget and
Fiscal Developments and ongoing PFM reforms. The bulletin gives an overview of the
quarterly budget operations; revenue collection; recurrent budget performance and capital
budget performance.

52
Dimension rating = C
PI-15 (M2)
Dimension Score 2016
Justification for 2016 score
15 Fiscal Strategy D+
15.1 Fiscal Impact of Policy Proposals
D The government prepares estimates of the fiscal impact for some, but not all, proposed changes in revenue and expenditure policy for the budget year.
15.2 Fiscal Strategy Adoption C The Fiscal Strategy is reflected in the Budget Strategy Paper and also in the call Circular and seems to be for internal use
15.3 Reporting on Fiscal Outcomes C There is a quarterly Budget and Fiscal Bulletin published for the last year by the MoF that contains some performance on Macroeconomic Developments, Budget and Fiscal Developments and ongoing PFM reforms. The bulletin gives an overview of the quarterly budget operations; revenue collection; recurrent budget performance and capital budget performance.
Ongoing reforms
Several improvements have been made to the 2017/18 FY economic and fiscal strategy
document (Budget Strategy Paper) to ensure it has a policy effect and is more coherent and
consistent. Among other notable changes, is the inclusion and introduction of clear fiscal
objectives and targets; a comprehensive corresponding fiscal strategy; a detailed
commentary on the current debt status and sustainability analysis as well as its
corresponding medium-term strategy and a fiscal risk statement.
PI-16 Medium-Term Perspective in Expenditure Budgeting
This indicator examines the extent to which expenditure budgets are developed for the
medium term within explicit medium-term budget expenditure ceilings. It also examines the
extent to which annual budgets are derived from medium-term estimates and the degree of
alignment between medium-term budget estimates and strategic plans.
The information for dimensions 16.1, 16.2 and 16.4 is sourced from the budget book
2016/17, from the budget call circular December 2015 (in preparation of the budget 2016/17)
and the budget strategy paper September 2015.
16.1 Medium-Term Expenditure Estimates
The Annual Budget contained in the Budget book presents estimates of expenditure for the
budget year and the two following fiscal years allocated by administrative and economic
classification. The economic classification is according to GFS 2001 but COFOG is not
applied. Nevertheless, interactions with officials of line ministries, the budget office of MoF,
as well as the macro-fiscal unit of MoF coupled with evidence from previous year's budget
compared to current year's figures clearly point to a very weak MTEF. The process merely
exists but is not functional. At the beginning of each fiscal year, budget formulation and
preparation starts afresh without any recourse to previous year's forecast.
53
Dimension rating = B
16.2 Medium-Term Expenditure Ceilings
Aggregate and ministry-level expenditure ceilings for the budget year and the two following
fiscal years are part of the budget call circular and approved by the Cabinet before the
budget circular is issued. The Medium term Framework is prepared annually beginning with
the MOF calling the MDAs (for 2015/16 budget in September 29, 2015) to prepare a Budget
Framework Paper (BFP) for medium term (three years). The BFP is intended to be an
instrument that facilitates the alignment of identified national priorities to resource allocation.
MDAs have been developing Budget Framework Papers (BFPs) with projections for both
capital and recurrent expenditure for the upcoming year and two subsequent years.
However, these documents are merely incremental projections as the MDAs do not use
macro-economic information for the projections. As can be read in the call circular, the MoF
regards the BFPs as valuable information for the budget process but the information in the
BFPs do not determine the ceilings. The MoF and MoDP determine the ceilings and the
Cabinet budget committee based on overall government priorities.
Dimension rating = A
16.3 Alignment of Strategic Plans and Budgets
The team has assessed the following documents, the National Vision 2020, the National
Strategic Development Plan (NSDP) 21012/13 – 2016/17, MoF strategic plan for 2015 - 2020
and the MoDP strategic plan for 2013 – 2017. These plans are comprehensive and valuable
in their own rights but alignment between the NSDP and the annual budget is weak. In
addition, there is no complete costing of strategic plans referencing investment cost and
recurrent forward linked expenditure. That notwithstanding, the Ministry of Development
Planning as part of its annual formulation and selection of investment projects into the Public
Sector Investment Project (PSIP) has begun since November 2013, to include forward linked
recurrent cost in all project costing albeit with some reservations. It is therefore fair to
conclude that some recurrent cost implications are considered but not comprehensive in all
aspects. . The NSDP mentions as an implementation priority to facilitate the integration of the
plan into the Medium Term Expenditure Framework (MTEF) and annual budget process, but
there is no evidence that this has happened or is ongoing for any of the ministries.
Dimension rating = D
16.4 Consistency of budgets with previous year estimates
In general, budget documents do not provide systematic explanations neither of the changes
to expenditure estimates between the second year of the last medium-term budget and the
first year of the current medium-term budget at the aggregate level. In the budget speech for
the last three years, the Minister of Finance had made some brief comments on the budget
performance deviations of the last budgets in the context of presenting the new budget.
However, these comments do not fulfill the PEFA framework requirements for consistency
analysis in the medium term framework.
Dimension rating = C

54
PI-16 (M2)
Dimension Score 2016
Justification for 2016 score
16 Medium-Term Perspective In Expenditure Budgeting
C+
16.1 Medium-Term Expenditure Estimates
B The Annual Budget contained in the Budget book presents estimates of expenditure for the budget year and the two following fiscal years allocated by administrative and economic classification. The economic classification is according to GFS 2001, but COFOG is not applied
16.2 Medium-Term Expenditure Ceilings A Aggregate and ministry-level expenditure ceilings for the budget year and the two following fiscal years are part of the budget call circular and approved by the Cabinet before the budget circular is issued
16.3 Alignment of Strategic Plans and Medium-Term Budgets
D Medium term strategic plans exist but are not costed or aligned to the budget process
16.4 Consistency of Budgets with Previous Year Estimates
D In general, the budget documents do not provide
systematic explanations. In the budget speech
for the last three years, the Minister of Finance
has made some brief comments on the budget
performance deviations of the last budgets in the
context of presenting the new budget. However,
these comments do not fulfil the PEFA
framework requirements for consistency analysis
in the medium term framework.
Ongoing reforms:
None.
PI-17 Budget Preparation Process
This indicator assesses the budget formulation process that allows for an effective top-down
and bottom-up participation of the MDAs, including their political leadership represented by
Cabinet. It also assesses the extent to which the annual budget preparation process
supports the linking of the draft budget to public policy objectives. Dimensions (i) and (ii) are
assessed using the last budget submission, for FY2016/17. Dimension (iii) is assessed
based on the last three approved budgets: i.e. the FY 2014/15, 2015/16, 2016/17.
17.1 Budget Calendar
The budget calendar/ process is presented as a one page graphic overview for the 2016/17
that contains 12 steps linked to specific months. The Calendar starts April/May 2015 and
continues up to February/March 2016 when the budget is submitted to the Parliament and
the Appropriation Act is passed. Two successive call circulars complement this overview
calendar where the later contains the specific timetable for the budget preparation as follows:

55
Proposed 2016/17 Budget Timetable
Budget Estimates Call Circular 2ND
December, 2015 Submission of Budget Estimates (Revenue & Expenditure) 11
TH December, 2015
Budget Discussion with Line Ministries 21ST
December, 2015 Presentation of Budget Estimates to Cabinet Budget Committee 12
TH January, 2016
Presentation of Budget Estimates to Cabinet 26TH
January, 2016 Presentation of Budget Estimates to Parliament 19
TH February, 2016
In the above Table, the first short Call circular is missing. It was issued on September 29,
2016, calling on the ministries to prepare a Budget framework paper for 2016/17 – 2018/19
as a requirement for the MTEF budgeting approach. The actual budget circular with detailed
estimates and expenditure ceilings, was issued on December 2, 2015. As the submission of
the budget estimates to the MoF was due on December 11, 2015, only 9 days for the budget
entities to complete their detailed budget submissions, which is clearly insufficient (see also
table below). While most MDAs keep to the calendar, many also frequently delay their
submissions to MoF, although not many days.
Table 17.1: 2016/2017 Budget Calendar
Budget for fiscal year
Budget Circular(s) provided by MoF to Ministries and
Budgetary Units
Date for Final Submission of Estimates to MoF by Ministries and
budgetary units
Cabinet approval of budget before submission to
Parliament 2016/17 December 2, 2015 December 11, 2015 January 16, 2016
Dimension rating = C
17.2 Guidance on Budget Preparation
The second Budget call circular includes proposed expenditure ceilings for each ministry’s
recurrent and capital expenditures as well as indicative ceilings for the two outer years. The
guidelines for budget submissions are clear and comprehensive. They include national
growth and development policy goals and macroeconomic framework. Cabinet approved the
ceilings in the second circular, prior to the distribution of the circular to the budgeting
entities, as required by the PFMA Act. However, the ceilings are often not respected as the
MDAs are submitting proposals in their submissions to the MoF significantly above their
allocated ceilings. Neither are the overall policy goals and macroeconomic framework
affecting much on the MDAs budget proposals as the MDAs are mostly making an
incremental budgeting exercise based on past budget and expenditure. In the final budget
preparation, the government makes the budget in line with the published ceilings regardless
of the MDAs overruns. As the indicator primarily is measuring the guidelines, the scoring will
be high anyway.
Dimension rating = A
17.3 Budget Submission to the Legislature
The Budget Speech by the Minister of Finance is presented to Parliament on the day the
budget is submitted to Parliament. For the last submitted budget, the date of the speech
was 19 February 2016 when the budget was also submitted. For the two previous years,
the dates are as in the table below. 2015/ 16 stands out, as the budget was not submitted
until May. The reason for this was that the Parliament was dissolved before the election
and was not in the position to receive the budget earlier. The Parliament has to approve the
budget before the end of the FY: it thus have had about one and a half months to review

56
the budget in two normal years 2014/15 and 2016/17.
Dimension rating = C
Table 17.2: Annual budget estimates submissions to Parliament
Budget for Fiscal Year Date of Submission to Parliament
2014/ 15 February 20, 2014 2015/ 16 May 22, 2015 2016/ 17 February`19, 2016
PI-17 (M2)
Dimension Score 2016
Justification for 2016 score
17 Budget Preparation Process B 17.1 Budget Calendar C A detailed budget calendar exists and is adhered
to but the budgeting entities only get 9 days to prepare their detailed submissions
17.2 Guidance On Budget Preparation A The call circular includes expenditure ceilings for each ministry’s recurrent and capital expenditures as well as indicative figures for the two outer years. The guidelines for budget submissions are clear and comprehensive
17.3 Budget Submission to the Legislature
C In two of the last three years, the budget has been submitted at least one month before the start of the fiscal years
Ongoing reforms
• Fiscal and budget bulletin has been introduced and is published on quarterly
basis.
• Citizen’s budget has also been introduced and first issue has already been
published.
• Programme performance based budgeting (PPBB) framework has also been
rolled out to all MDAs. A comprehensive performance framework is expected to
be defined and introduced to complete and consolidate the reform.
• Development of draft national planning and budget regulations completed. The
Department is targeting to have the new regulations issued in the 2017/18 fiscal
year.
• Development of budget guidebook (i.e guidelines and procedures) is almost
completed.
PI-18 Legislative Scrutiny of Budgets
This indicator assesses the legislative scrutiny and debate of the Annual Budget Law as
described by: scope of the scrutiny; internal procedures for scrutiny and debate, and the time
allocated to that process; the ability to approve the budget before the commencement of new
financial year, and the existence of rules for in-year amendments to the budget without ex-
ante approval by the legislature.
57
18.1 Scope of Budget Scrutiny
The Standing Orders of the Parliament guide the budget process in the Parliament. The
Portfolio Committee for economic affairs (the Economic and Development Cluster) of the
National Assembly is responsible for the scrutiny and preparation of the budget before
Parliament’s approval. The process starts when the budget is submitted, on which day the
Minister of Finance is also delivering the budget speech before the Parliament. The minister
is summarising the policy context of the budget, some policy priorities and implications as
well as some information about the macro-economic preconditions.
The submitted budget that the committee has to work with contains detailed estimates of
expenditure and revenue and aggregates for the coming year as well as forward estimates
for the two subsequent years, as required by the PFMA Act. The Budget Speech with its
information is also part of the budget documentation; the quarterly Debt bulletin that is
submitted in January also forms part of the budget information. After receiving the budget
documentation, it is copied to all the members of Parliament. The chair of the portfolio
committee convenes the committee and sets the agenda for the committee´s work with the
annual budget. All portfolio committees are also involved in the preparation, by working on
their specific parts of the budget. During the weeks when the budget examination goes on,
all ministries are called in to explain and defend their budget submissions before the
committee. Normally, different stakeholders are invited for consultations with the committee
to give comments on the budget proposal. The whole process of budget examination in the
Parliament takes about 4 weeks, but it has also been as short as 2 weeks in the past.
During the process, the different committees and also the budget committee are proposing
amendments to the budget resulting in reallocations but not in expansion of the budget.
After the process of examining the budget, the Portfolio Committee, presents its report to
the full house. The Committee of Supply then debates the Budget proposals, which is the
whole House of Assembly. The Standing Orders also specify that the debate on the budget
should cover the “general principles of financial and economic policy set forth by the
Minister, the financial proposals contained in the estimates and the matters raised in the
(Portfolio) Committee’s report”.
During the review of the 2016/2017 budget, Parliament´s review covered revenue and
expenditure estimates for the coming year, but did not cover the figures for the subsequent
years. The Appropriation Bill as approved by the Parliament also only covers the coming
year; figures for the two subsequent years are given for information only.
Dimension rating = B

58
18.2 Legislative Procedures for Budget Scrutiny
Following the initial presentation of the Minister of Finance in the Budget speech the Portfolio
Committee on the Economic and Development Cluster reviews the proposals, and makes a
report to the National Assembly as a whole. When examining the budget and the Portfolio
Committee’s report, the National Assembly goes into Committee mode and becomes the
Committee of Supply. It is at this stage that changes to the draft budget recommended by the
Portfolio Committee are discussed. After the National Assembly, the budget goes to the
Senate for approval within one day. The Constitution specifies that in general, in the case of
disagreements between the two houses of Parliament, the National Assembly’s decision will
prevail.
The Standing Orders describe the procedures for the review and approval of the budget in
detail under Chapter X, Financial Procedures. The functions of the Portfolio Committee are
also described in the Chapter X, as well as negotiation and debate procedures for any
proposed amendment to the draft budget. Section 71 of Chapter X also outlines the relations
between the National Assembly, the Minister of Finance and the Cabinet if amendments are
to be approved. The Orders also include provisions for the Parliament for public hearings on
the budget and other matters.
Dimension rating = A
18.3 Timing of Budget Approval
The budget for, 2016/17 was submitted in February 19, 2016, early enough in the process
(almost one and a half months before FY-end 2015/16 ) to allow time for the Parliaments
budget process and ensure passage before the end of the fiscal year.
The dates of the budget submissions to the Parliament and the dates of the approval are
as shown in the table 3.18 below. In 2015/16 there was a significant delay of 3 months as
the Parliament was dissolved and new elections held.
Table 18.1: Budget Submission to Parliament and Approval (2013/14-2015/16)
Budget Year Draft Budget Submitted to Parliament Budget Adopted by Parliament
2013/14 February 22, 2013 March 26th, 2013 2014/15 February 15, 2014 March 24tht, 2014 2015/16 May 22, 2015 June 26th, 2015
Dimension rating = C
18.4 Rules for Budget Adjustments by the Executive
There are clear rules for in-year changes described in the Constitution, chapter X and in
the PFMA Act. 15 – 16. They provide that the Executive cannot make budget amendments
during the year that entail an increase of total expenditure without ex-ante approval
(through a supplementary appropriation bill) by Parliament. This is not respected by the
government, which only submits one supplementary bill Ex Post each year, summarising
several amendments. This has also been accepted by the Parliament although it
contravenes the Finance Act.
In-year amendments that involve reallocations between administrative headings and
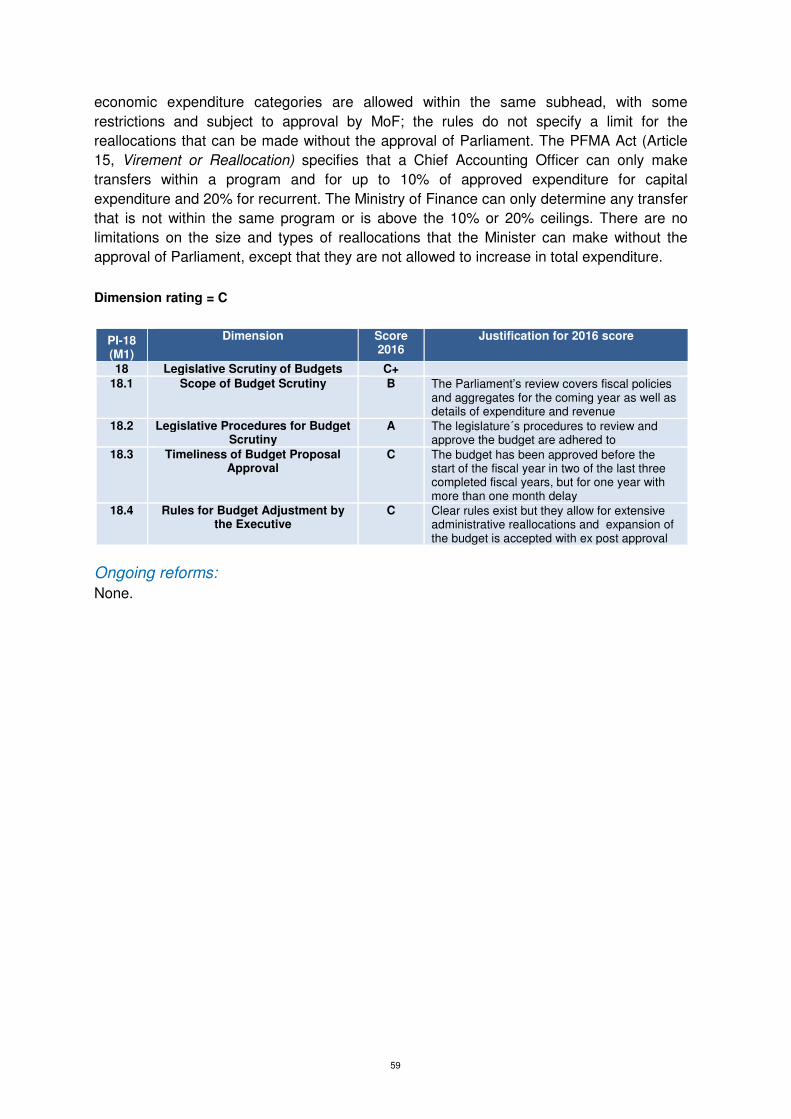
59
economic expenditure categories are allowed within the same subhead, with some
restrictions and subject to approval by MoF; the rules do not specify a limit for the
reallocations that can be made without the approval of Parliament. The PFMA Act (Article
15, Virement or Reallocation) specifies that a Chief Accounting Officer can only make
transfers within a program and for up to 10% of approved expenditure for capital
expenditure and 20% for recurrent. The Ministry of Finance can only determine any transfer
that is not within the same program or is above the 10% or 20% ceilings. There are no
limitations on the size and types of reallocations that the Minister can make without the
approval of Parliament, except that they are not allowed to increase in total expenditure.
Dimension rating = C
PI-18 (M1)
Dimension Score 2016
Justification for 2016 score
18 Legislative Scrutiny of Budgets C+ 18.1 Scope of Budget Scrutiny B The Parliament’s review covers fiscal policies
and aggregates for the coming year as well as details of expenditure and revenue
18.2 Legislative Procedures for Budget Scrutiny
A The legislature´s procedures to review and approve the budget are adhered to
18.3 Timeliness of Budget Proposal Approval
C The budget has been approved before the start of the fiscal year in two of the last three completed fiscal years, but for one year with more than one month delay
18.4 Rules for Budget Adjustment by the Executive
C Clear rules exist but they allow for extensive administrative reallocations and expansion of the budget is accepted with ex post approval
Ongoing reforms:
None.
60
Pillar V. Predictability and Control in Budget Execution
PI-19 Revenue Administration
There are four dimensions. Dimension 19.1 measures the rights and obligations of taxpayers including redress; dimension 19.2 examines the risk associated with revenue management; dimension 19.3 assesses the audit and fraud investigation measures; and dimension 19.4 assesses the mechanisms for monitoring and collecting revenue arrears. The assessment of this indicator cuts across the entire revenue administration of central government including tax and non-tax revenue.
Background
Act 14 of 2001 established the Lesotho Revenue Authority (LRA) as an autonomous government entity under the Ministry of Finance; the new Act repealed Acts 14 of 1967, 6 of 1999 and Order No.6 of 1988. It was established to administer the else while functions of Income Tax, Customs and Sales Tax; the Sales Tax has also been replaced with the VAT Act 9 of 2001 and following amendments. LRA became operational in January 2003 with the core mandate to improve efficiency and effectiveness in revenue administration and collection at minimal operating cost to both taxpayers and the Government. While it is important to state that the Public Service Act 1995 does not cover LRA, the Authority is mandated by law to report to the National Assembly and administratively to MoF.
19.1 Rights and Obligations for Revenue Measures
LRA has a functional website. Information on taxpayer obligations and rights to redress is clear and simple to understand. Also available on the website are public rulings and court judgements on tax cases; for instance a court of appeal judgement between LRA and Zainab Moosa dated November 2015, and LRA public ruling relating to VAT on Hire Purchase dated December 2013. A one-page LRA charter summarises the obligations and rights of taxpayer and LRA service standards. Across LRA offices (Large Taxpayer Office - LTO; Small & Medium Taxpayer Offices), there are tax leaflets providing information on taxpayer obligations; for instance, there is a leaflet on taxation of employment income, guide to filing income tax returns, guide to Customs duties and VAT, income tax return forms, and individual self-assessment income tax forms. One can also download tax registration (business and individual) forms, income tax forms, customs forms, and ASYCUDA forms on the website. At the entrance is situated a client service desk for enquiries and directions. Even though tax information on printed materials is in English, the client service desk assists taxpayers in the local dialect. There is also a toll-free client service number for enquiries. Furthermore, LRA conducts public forum and media discussions on taxation especially where new and/or revise legislations and administrative processes have been promulgated and adopted. Income Tax The Income Tax Act 1993, Act No. 9 of 1993, provides comprehensive and easy provisions on taxpayer obligations. Chapter I defines tax terminologies; this helps to forestall any ambiguity. Sections 4 to 8 describe individual, partnership or corporate resident or non-resident legal entities liable to tax. Part III Sections 9 to 12 define the income tax rates for both individuals, partnerships and corporate bodies, as prescribed in Schedules 2 to 5. Chapter III Sections 115 to 127 state the allowable and disallowable fringe benefits for taxpayers and applicable taxes thereon; these include loan, debt, superannuation, domestic assistance, meals, utilities, medical and fuel/car fringe benefits, among others. The procedure for filing income tax returns is clearly spelt out in Section 128; a taxpayer must file returns on the stipulated form with full disclosure of income and source of income. Self-assessment is well captured under Section 133.

61
Just as taxpayers have an obligation to pay tax, so do they have a right to redress; Sections 137 to 140 prescribe rights of objections to tax assessed. The provisions allow for administrative tax appeal within 4 years of assessment of initial assessment or 60 days following from the revised assessment. Where the taxpayer and the Commissioner General of LRA are unable to resolve assessment differences, Sections 138 and 139 (replaced with Act 2 of 2005 - Revenue Appeals Tribunal), and 140 prescribe resolution in a tax tribunal (high court) and further appeal in the Court of Appeals. The taxpayer reserves the right to file an appeal within 60 days after the decision of the high court. Customs The Customs and Excise Act (1982) in addition to accompanying amendments (Customs Amendment Act 3, 1984; Order 2, 1986; and Act 25, 1986) are the laws governing customs and excise duties administration. Officials of LRA have indicated that the Customs and Excise Act 1982 is being revised but still at the early stages. Chapter III spells out import and export of goods. Section 46 outlines applicable customs and excise rates as prescribed in the accompanying schedules. The provisions in the law criminalise tax evasion and avoidance, as well as smuggling, all punishable by law. Referencing tax appeals, the Revenue Appeals Tribunal Act 2 of 2005 is also applicable; taxpayers have rights to redress. Sections 13 to 15 stipulate the framework for hearing procedures and adjudication of tax cases. VAT The Revenue Appeals Tribunal Act 2 of 2005 also applies to VAT taxpayer rights to redress. Besides the administrative appeals mechanism, taxpayers after exhaustive internal processes may opt for tax tribunal and even appeal to the Court of Appeals. The main legal framework on VAT is the Value Added Tax Act (2001); there are some amendments and regulations to the original law, namely: VAT Amendment Act 6 of 2003, VAT & Income Tax Regulations 2014. All taxable supplies and imports are liable to VAT in accordance with Section 5; Section 6 details exempt supplies and imports - these include educational materials and institutions of education, public transport, medical services, and financial services, among others. Whereas Section 7 deals with persons liable to VAT, Sections 12 to 14 prescribes taxable supplies, services and imports. Non-Tax Revenue Actual non-tax revenue, according to the 2015/2016 unaudited consolidated financial statements, was M1.3bn; this represents about 8.8% of total government revenue including grants and 9.4% excluding grants. At present, there is no unit or department within MoF responsible for coordinating non-tax revenue budgeting as well as monitoring actual collections against approved budget, except for the Treasury Department reporting on actual outturns from line ministries. It is believed, with official confirmation from MoF, that less than half of non-tax revenue collected by line ministries is actually reported. Further, it appears there is neither legal nor regulatory policy framework on the management of non-tax revenue besides Sections 21, 26 and 27 of the PFMA Act 2011 mandating line ministries to report and account for all state funds. Dimension rating = A
19.2 Revenue Risk Management
Revenue risk management is vital to revenue maximisation through mitigation measures against tax evasion; for this reason, the 2014-2019 LRA strategic plan considers the establishment of a Revenue Risk Management Unit (RRMU) and the implementation of an Enterprise Risk Management (ERM) policy is a crucial stage in attaining the overall strategic objective. Whereas the RRMU was established in 2015, the full rollout of the ERM is yet to commence which will, among others automate selection and management of cases. A draft
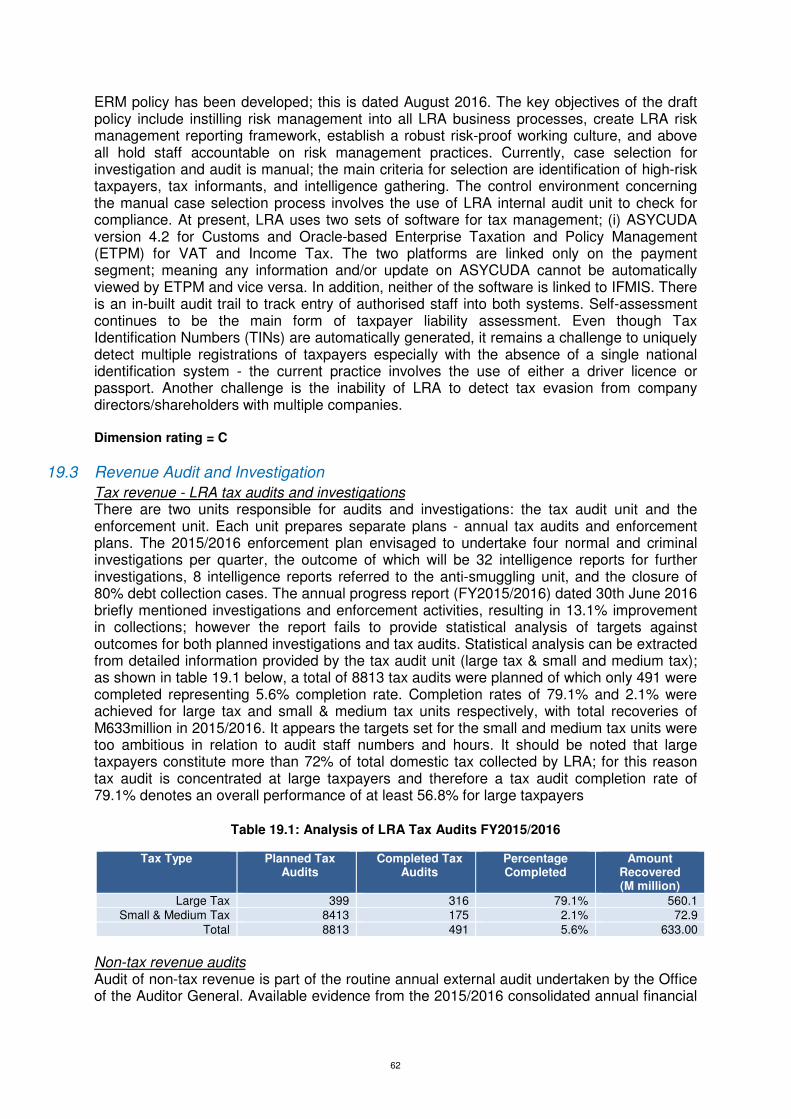
62
ERM policy has been developed; this is dated August 2016. The key objectives of the draft policy include instilling risk management into all LRA business processes, create LRA risk management reporting framework, establish a robust risk-proof working culture, and above all hold staff accountable on risk management practices. Currently, case selection for investigation and audit is manual; the main criteria for selection are identification of high-risk taxpayers, tax informants, and intelligence gathering. The control environment concerning the manual case selection process involves the use of LRA internal audit unit to check for compliance. At present, LRA uses two sets of software for tax management; (i) ASYCUDA version 4.2 for Customs and Oracle-based Enterprise Taxation and Policy Management (ETPM) for VAT and Income Tax. The two platforms are linked only on the payment segment; meaning any information and/or update on ASYCUDA cannot be automatically viewed by ETPM and vice versa. In addition, neither of the software is linked to IFMIS. There is an in-built audit trail to track entry of authorised staff into both systems. Self-assessment continues to be the main form of taxpayer liability assessment. Even though Tax Identification Numbers (TINs) are automatically generated, it remains a challenge to uniquely detect multiple registrations of taxpayers especially with the absence of a single national identification system - the current practice involves the use of either a driver licence or passport. Another challenge is the inability of LRA to detect tax evasion from company directors/shareholders with multiple companies. Dimension rating = C
19.3 Revenue Audit and Investigation
Tax revenue - LRA tax audits and investigations There are two units responsible for audits and investigations: the tax audit unit and the enforcement unit. Each unit prepares separate plans - annual tax audits and enforcement plans. The 2015/2016 enforcement plan envisaged to undertake four normal and criminal investigations per quarter, the outcome of which will be 32 intelligence reports for further investigations, 8 intelligence reports referred to the anti-smuggling unit, and the closure of 80% debt collection cases. The annual progress report (FY2015/2016) dated 30th June 2016 briefly mentioned investigations and enforcement activities, resulting in 13.1% improvement in collections; however the report fails to provide statistical analysis of targets against outcomes for both planned investigations and tax audits. Statistical analysis can be extracted from detailed information provided by the tax audit unit (large tax & small and medium tax); as shown in table 19.1 below, a total of 8813 tax audits were planned of which only 491 were completed representing 5.6% completion rate. Completion rates of 79.1% and 2.1% were achieved for large tax and small & medium tax units respectively, with total recoveries of M633million in 2015/2016. It appears the targets set for the small and medium tax units were too ambitious in relation to audit staff numbers and hours. It should be noted that large taxpayers constitute more than 72% of total domestic tax collected by LRA; for this reason tax audit is concentrated at large taxpayers and therefore a tax audit completion rate of 79.1% denotes an overall performance of at least 56.8% for large taxpayers
Table 19.1: Analysis of LRA Tax Audits FY2015/2016
Tax Type Planned Tax Audits
Completed Tax Audits
Percentage Completed
Amount Recovered (M million)
Large Tax 399 316 79.1% 560.1 Small & Medium Tax 8413 175 2.1% 72.9
Total 8813 491 5.6% 633.00
Non-tax revenue audits Audit of non-tax revenue is part of the routine annual external audit undertaken by the Office of the Auditor General. Available evidence from the 2015/2016 consolidated annual financial
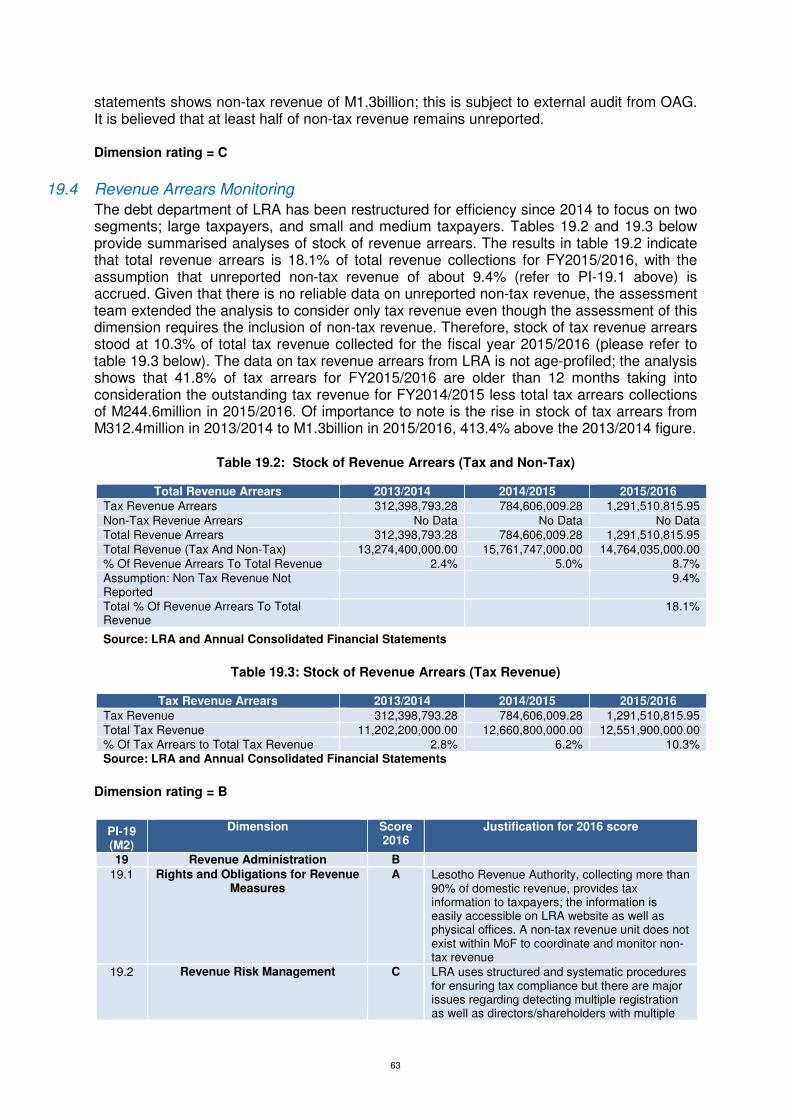
63
statements shows non-tax revenue of M1.3billion; this is subject to external audit from OAG. It is believed that at least half of non-tax revenue remains unreported.
Dimension rating = C
19.4 Revenue Arrears Monitoring
The debt department of LRA has been restructured for efficiency since 2014 to focus on two segments; large taxpayers, and small and medium taxpayers. Tables 19.2 and 19.3 below provide summarised analyses of stock of revenue arrears. The results in table 19.2 indicate that total revenue arrears is 18.1% of total revenue collections for FY2015/2016, with the assumption that unreported non-tax revenue of about 9.4% (refer to PI-19.1 above) is accrued. Given that there is no reliable data on unreported non-tax revenue, the assessment team extended the analysis to consider only tax revenue even though the assessment of this dimension requires the inclusion of non-tax revenue. Therefore, stock of tax revenue arrears stood at 10.3% of total tax revenue collected for the fiscal year 2015/2016 (please refer to table 19.3 below). The data on tax revenue arrears from LRA is not age-profiled; the analysis shows that 41.8% of tax arrears for FY2015/2016 are older than 12 months taking into consideration the outstanding tax revenue for FY2014/2015 less total tax arrears collections of M244.6million in 2015/2016. Of importance to note is the rise in stock of tax arrears from M312.4million in 2013/2014 to M1.3billion in 2015/2016, 413.4% above the 2013/2014 figure.
Table 19.2: Stock of Revenue Arrears (Tax and Non-Tax)
Total Revenue Arrears 2013/2014 2014/2015 2015/2016
Tax Revenue Arrears 312,398,793.28 784,606,009.28 1,291,510,815.95 Non-Tax Revenue Arrears No Data No Data No Data Total Revenue Arrears 312,398,793.28 784,606,009.28 1,291,510,815.95 Total Revenue (Tax And Non-Tax) 13,274,400,000.00 15,761,747,000.00 14,764,035,000.00 % Of Revenue Arrears To Total Revenue 2.4% 5.0% 8.7% Assumption: Non Tax Revenue Not Reported
9.4%
Total % Of Revenue Arrears To Total Revenue
18.1%
Source: LRA and Annual Consolidated Financial Statements
Table 19.3: Stock of Revenue Arrears (Tax Revenue)
Tax Revenue Arrears 2013/2014 2014/2015 2015/2016
Tax Revenue 312,398,793.28 784,606,009.28 1,291,510,815.95 Total Tax Revenue 11,202,200,000.00 12,660,800,000.00 12,551,900,000.00 % Of Tax Arrears to Total Tax Revenue 2.8% 6.2% 10.3% Source: LRA and Annual Consolidated Financial Statements
Dimension rating = B
PI-19 (M2)
Dimension Score 2016
Justification for 2016 score
19 Revenue Administration B 19.1 Rights and Obligations for Revenue
Measures A Lesotho Revenue Authority, collecting more than
90% of domestic revenue, provides tax information to taxpayers; the information is easily accessible on LRA website as well as physical offices. A non-tax revenue unit does not exist within MoF to coordinate and monitor non-tax revenue
19.2 Revenue Risk Management C LRA uses structured and systematic procedures for ensuring tax compliance but there are major issues regarding detecting multiple registration as well as directors/shareholders with multiple
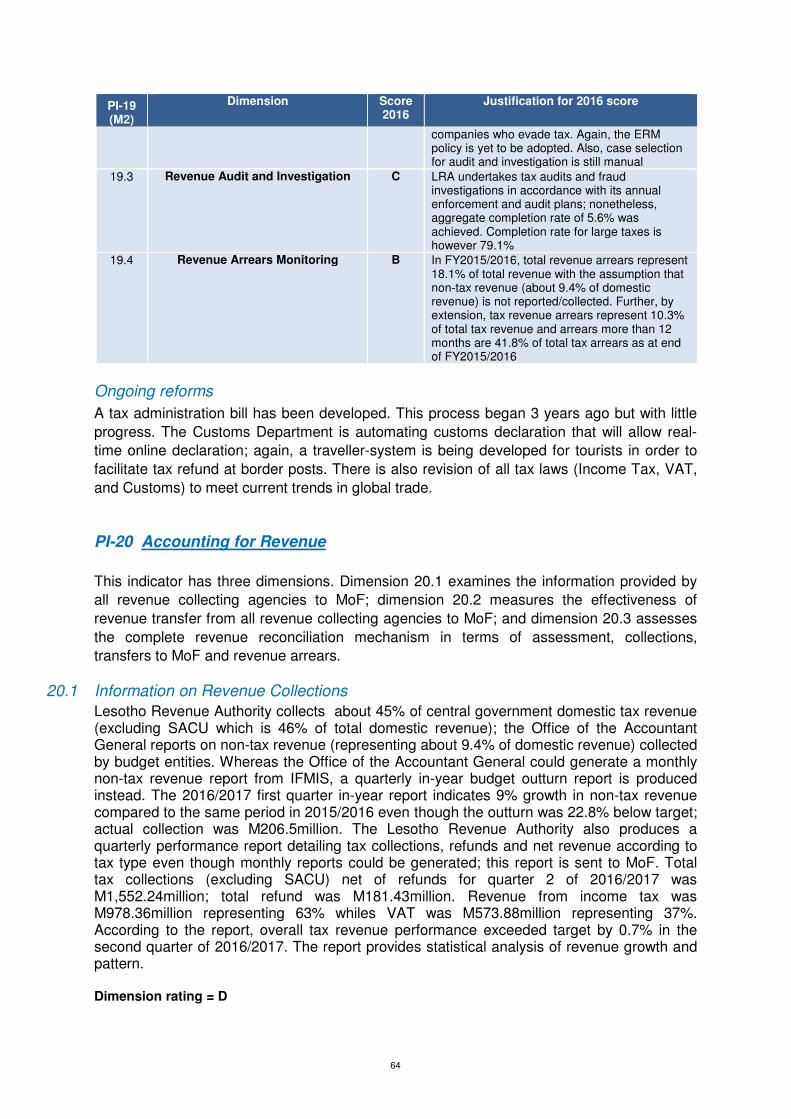
64
PI-19 (M2)
Dimension Score 2016
Justification for 2016 score
companies who evade tax. Again, the ERM policy is yet to be adopted. Also, case selection for audit and investigation is still manual
19.3 Revenue Audit and Investigation C LRA undertakes tax audits and fraud investigations in accordance with its annual enforcement and audit plans; nonetheless, aggregate completion rate of 5.6% was achieved. Completion rate for large taxes is however 79.1%
19.4 Revenue Arrears Monitoring B In FY2015/2016, total revenue arrears represent 18.1% of total revenue with the assumption that non-tax revenue (about 9.4% of domestic revenue) is not reported/collected. Further, by extension, tax revenue arrears represent 10.3% of total tax revenue and arrears more than 12 months are 41.8% of total tax arrears as at end of FY2015/2016
Ongoing reforms
A tax administration bill has been developed. This process began 3 years ago but with little
progress. The Customs Department is automating customs declaration that will allow real-
time online declaration; again, a traveller-system is being developed for tourists in order to
facilitate tax refund at border posts. There is also revision of all tax laws (Income Tax, VAT,
and Customs) to meet current trends in global trade.
PI-20 Accounting for Revenue
This indicator has three dimensions. Dimension 20.1 examines the information provided by
all revenue collecting agencies to MoF; dimension 20.2 measures the effectiveness of
revenue transfer from all revenue collecting agencies to MoF; and dimension 20.3 assesses
the complete revenue reconciliation mechanism in terms of assessment, collections,
transfers to MoF and revenue arrears.
20.1 Information on Revenue Collections
Lesotho Revenue Authority collects about 45% of central government domestic tax revenue (excluding SACU which is 46% of total domestic revenue); the Office of the Accountant General reports on non-tax revenue (representing about 9.4% of domestic revenue) collected by budget entities. Whereas the Office of the Accountant General could generate a monthly non-tax revenue report from IFMIS, a quarterly in-year budget outturn report is produced instead. The 2016/2017 first quarter in-year report indicates 9% growth in non-tax revenue compared to the same period in 2015/2016 even though the outturn was 22.8% below target; actual collection was M206.5million. The Lesotho Revenue Authority also produces a quarterly performance report detailing tax collections, refunds and net revenue according to tax type even though monthly reports could be generated; this report is sent to MoF. Total tax collections (excluding SACU) net of refunds for quarter 2 of 2016/2017 was M1,552.24million; total refund was M181.43million. Revenue from income tax was M978.36million representing 63% whiles VAT was M573.88million representing 37%. According to the report, overall tax revenue performance exceeded target by 0.7% in the second quarter of 2016/2017. The report provides statistical analysis of revenue growth and pattern. Dimension rating = D
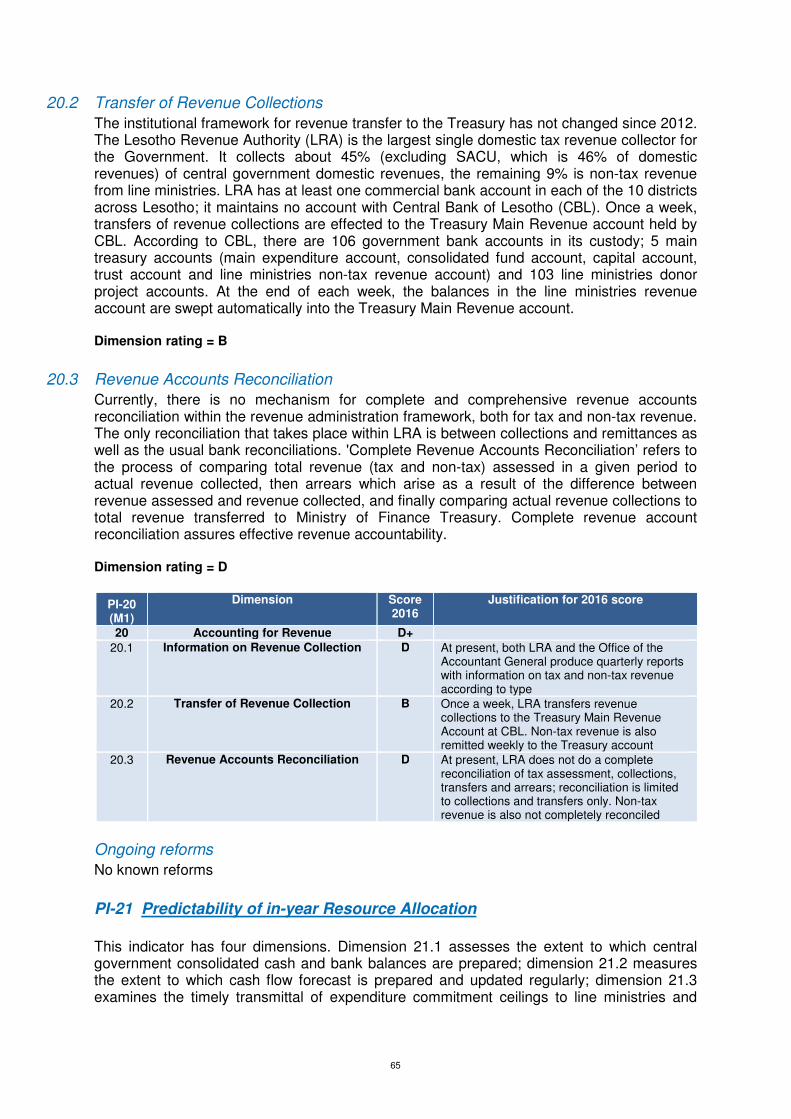
65
20.2 Transfer of Revenue Collections
The institutional framework for revenue transfer to the Treasury has not changed since 2012. The Lesotho Revenue Authority (LRA) is the largest single domestic tax revenue collector for the Government. It collects about 45% (excluding SACU, which is 46% of domestic revenues) of central government domestic revenues, the remaining 9% is non-tax revenue from line ministries. LRA has at least one commercial bank account in each of the 10 districts across Lesotho; it maintains no account with Central Bank of Lesotho (CBL). Once a week, transfers of revenue collections are effected to the Treasury Main Revenue account held by CBL. According to CBL, there are 106 government bank accounts in its custody; 5 main treasury accounts (main expenditure account, consolidated fund account, capital account, trust account and line ministries non-tax revenue account) and 103 line ministries donor project accounts. At the end of each week, the balances in the line ministries revenue account are swept automatically into the Treasury Main Revenue account. Dimension rating = B
20.3 Revenue Accounts Reconciliation
Currently, there is no mechanism for complete and comprehensive revenue accounts reconciliation within the revenue administration framework, both for tax and non-tax revenue. The only reconciliation that takes place within LRA is between collections and remittances as well as the usual bank reconciliations. 'Complete Revenue Accounts Reconciliation’ refers to the process of comparing total revenue (tax and non-tax) assessed in a given period to actual revenue collected, then arrears which arise as a result of the difference between revenue assessed and revenue collected, and finally comparing actual revenue collections to total revenue transferred to Ministry of Finance Treasury. Complete revenue account reconciliation assures effective revenue accountability. Dimension rating = D
PI-20 (M1)
Dimension Score 2016
Justification for 2016 score
20 Accounting for Revenue D+ 20.1 Information on Revenue Collection D At present, both LRA and the Office of the
Accountant General produce quarterly reports with information on tax and non-tax revenue according to type
20.2 Transfer of Revenue Collection B Once a week, LRA transfers revenue collections to the Treasury Main Revenue Account at CBL. Non-tax revenue is also remitted weekly to the Treasury account
20.3 Revenue Accounts Reconciliation D At present, LRA does not do a complete reconciliation of tax assessment, collections, transfers and arrears; reconciliation is limited to collections and transfers only. Non-tax revenue is also not completely reconciled
Ongoing reforms
No known reforms
PI-21 Predictability of in-year Resource Allocation
This indicator has four dimensions. Dimension 21.1 assesses the extent to which central government consolidated cash and bank balances are prepared; dimension 21.2 measures the extent to which cash flow forecast is prepared and updated regularly; dimension 21.3 examines the timely transmittal of expenditure commitment ceilings to line ministries and
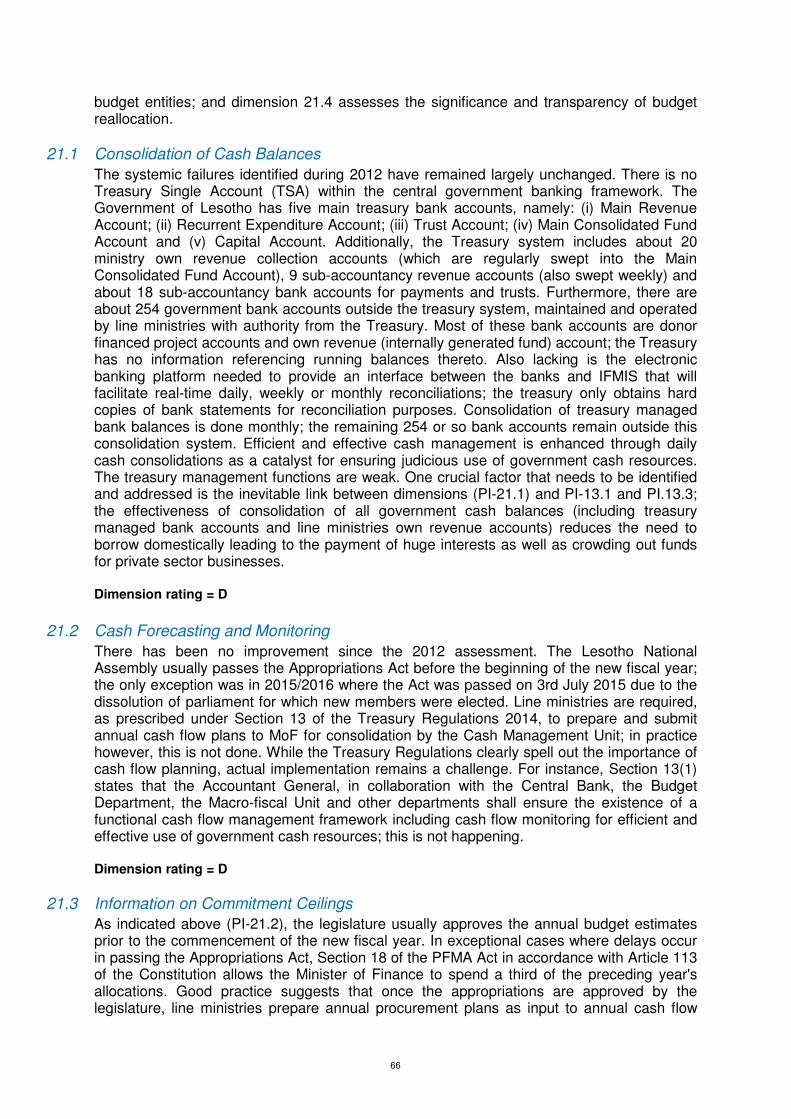
66
budget entities; and dimension 21.4 assesses the significance and transparency of budget reallocation.
21.1 Consolidation of Cash Balances
The systemic failures identified during 2012 have remained largely unchanged. There is no Treasury Single Account (TSA) within the central government banking framework. The Government of Lesotho has five main treasury bank accounts, namely: (i) Main Revenue Account; (ii) Recurrent Expenditure Account; (iii) Trust Account; (iv) Main Consolidated Fund Account and (v) Capital Account. Additionally, the Treasury system includes about 20 ministry own revenue collection accounts (which are regularly swept into the Main Consolidated Fund Account), 9 sub-accountancy revenue accounts (also swept weekly) and about 18 sub-accountancy bank accounts for payments and trusts. Furthermore, there are about 254 government bank accounts outside the treasury system, maintained and operated by line ministries with authority from the Treasury. Most of these bank accounts are donor financed project accounts and own revenue (internally generated fund) account; the Treasury has no information referencing running balances thereto. Also lacking is the electronic banking platform needed to provide an interface between the banks and IFMIS that will facilitate real-time daily, weekly or monthly reconciliations; the treasury only obtains hard copies of bank statements for reconciliation purposes. Consolidation of treasury managed bank balances is done monthly; the remaining 254 or so bank accounts remain outside this consolidation system. Efficient and effective cash management is enhanced through daily cash consolidations as a catalyst for ensuring judicious use of government cash resources. The treasury management functions are weak. One crucial factor that needs to be identified and addressed is the inevitable link between dimensions (PI-21.1) and PI-13.1 and PI.13.3; the effectiveness of consolidation of all government cash balances (including treasury managed bank accounts and line ministries own revenue accounts) reduces the need to borrow domestically leading to the payment of huge interests as well as crowding out funds for private sector businesses. Dimension rating = D
21.2 Cash Forecasting and Monitoring
There has been no improvement since the 2012 assessment. The Lesotho National Assembly usually passes the Appropriations Act before the beginning of the new fiscal year; the only exception was in 2015/2016 where the Act was passed on 3rd July 2015 due to the dissolution of parliament for which new members were elected. Line ministries are required, as prescribed under Section 13 of the Treasury Regulations 2014, to prepare and submit annual cash flow plans to MoF for consolidation by the Cash Management Unit; in practice however, this is not done. While the Treasury Regulations clearly spell out the importance of cash flow planning, actual implementation remains a challenge. For instance, Section 13(1) states that the Accountant General, in collaboration with the Central Bank, the Budget Department, the Macro-fiscal Unit and other departments shall ensure the existence of a functional cash flow management framework including cash flow monitoring for efficient and effective use of government cash resources; this is not happening. Dimension rating = D
21.3 Information on Commitment Ceilings
As indicated above (PI-21.2), the legislature usually approves the annual budget estimates prior to the commencement of the new fiscal year. In exceptional cases where delays occur in passing the Appropriations Act, Section 18 of the PFMA Act in accordance with Article 113 of the Constitution allows the Minister of Finance to spend a third of the preceding year's allocations. Good practice suggests that once the appropriations are approved by the legislature, line ministries prepare annual procurement plans as input to annual cash flow
67
plans, in order to facilitate the issuance of expenditure commitment ceilings; the current practice however is not effectively coordinated as a result of non-existence of annual cash flow plans. The Ministry of Finance issues quarterly expenditure commitment ceilings to line ministries; actual cash is released monthly for payment of expenditure. It appears this dimension was overrated in 2012 since the practice of quarterly expenditure commitment ceilings (warrants) has remained unchanged. It may have been misunderstood by the previous assessment team, that the continuous expenditure commitment outside IFMIS meant six months or more warranty to spend of which the resultant effect is unknown stock of expenditure arrears (please, refer to PI-22 below). Dimension rating = B
21.4 Significance of in-year Budget Adjustments
There has been no change since the last assessment in 2012. In-year budget virements are frequent, especially in March, but transparent. Section 15(1) of the PFMA Act 2011 allows for 20% and 10% of budget reallocations within the same programme for recurrent and capital expenditure respectively, at the level of the Chief Accounting Officer; any extra virements above the set threshold must be approved by the Minister of Finance. Given that budget reallocations could potentially distort policy priorities, Section 15(2) guards against any virements with significant changes to policy intent. Nonetheless, the analysis in PI-2 clearly points out huge expenditure composition variances with potential distortion of policy intent. Once, in each of the last three completed fiscal years, the National Assembly passed ex-ante supplementary appropriations in accordance with Article 112(3) and Section 16 of the Constitution and PFMA Act respectively. These occurred six months after the beginning of the fiscal year. Virements are reported to parliament twice - first during supplementary appropriations, and second during submission of annual budget estimates. In 2015/2016, budget reallocations for recurrent and capital expenditure were 124 and 32 times respectively, with a total value of M950.7million, representing about 8% of originally approve budget. Dimension rating = B
PI-21 (M2)
Dimension Score 2016
Justification for 2016 score
21 Predictability of in-year Resource Allocation
C
21.1 Consolidation of Cash Balances D There is no TSA. Even though treasury managed bank balances are consolidated monthly, there are over 254 other government bank accounts (donor-financed projects and own revenue bank accounts) maintained and operated by line ministries that are not part of the monthly consolidation system
21.2 Cash Forecasting and Monitoring D Section 13 of the Treasury Regulations 2014 mandates all budget entities to prepare and submit annual cash flow plans to MoF for consolidation and monitoring; in practice however, this is not done
21.3 Information on Commitment Ceilings
B MoF issues quarterly expenditure commitment warrants to budget entities; actual cash releases are monthly
21.4 Significance of in-year Budget Adjustments
B In-year budget reallocations are significant but done in a transparent manner. Once in each of the last three completed fiscal years, parliament passed ex-ante supplementary appropriations six months after the beginning of the fiscal year
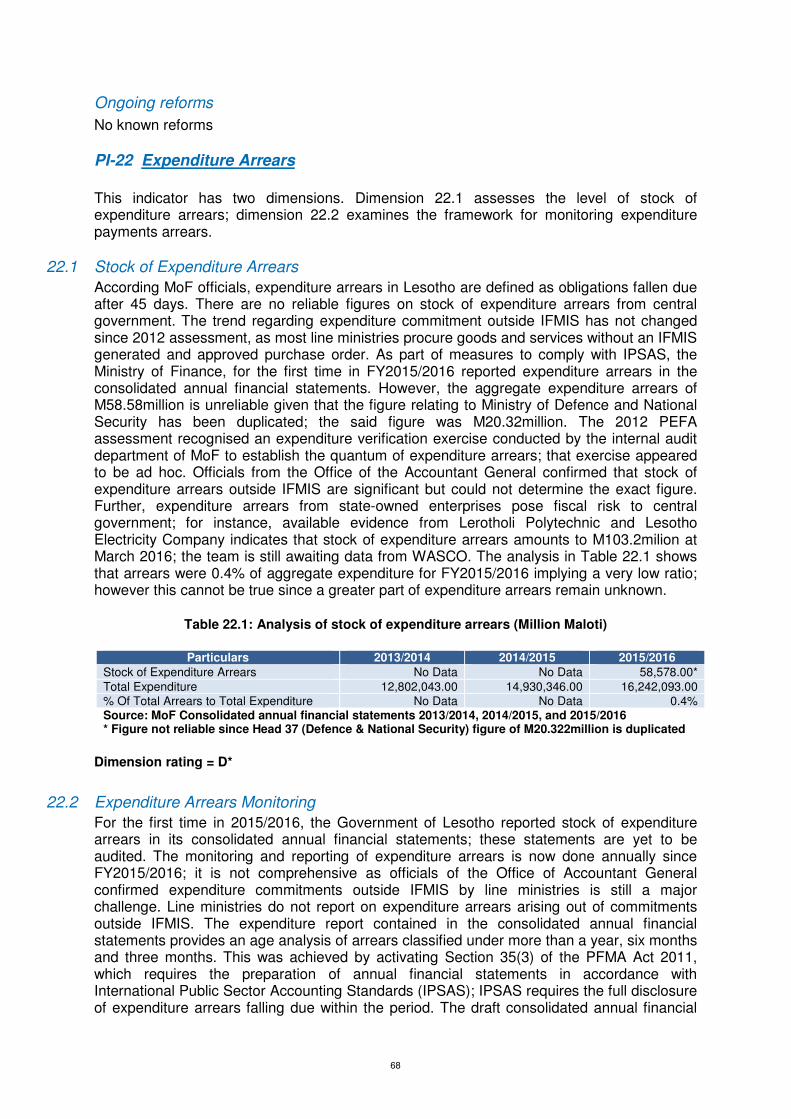
68
Ongoing reforms
No known reforms
PI-22 Expenditure Arrears
This indicator has two dimensions. Dimension 22.1 assesses the level of stock of expenditure arrears; dimension 22.2 examines the framework for monitoring expenditure payments arrears.
22.1 Stock of Expenditure Arrears
According MoF officials, expenditure arrears in Lesotho are defined as obligations fallen due after 45 days. There are no reliable figures on stock of expenditure arrears from central government. The trend regarding expenditure commitment outside IFMIS has not changed since 2012 assessment, as most line ministries procure goods and services without an IFMIS generated and approved purchase order. As part of measures to comply with IPSAS, the Ministry of Finance, for the first time in FY2015/2016 reported expenditure arrears in the consolidated annual financial statements. However, the aggregate expenditure arrears of M58.58million is unreliable given that the figure relating to Ministry of Defence and National Security has been duplicated; the said figure was M20.32million. The 2012 PEFA assessment recognised an expenditure verification exercise conducted by the internal audit department of MoF to establish the quantum of expenditure arrears; that exercise appeared to be ad hoc. Officials from the Office of the Accountant General confirmed that stock of expenditure arrears outside IFMIS are significant but could not determine the exact figure. Further, expenditure arrears from state-owned enterprises pose fiscal risk to central government; for instance, available evidence from Lerotholi Polytechnic and Lesotho Electricity Company indicates that stock of expenditure arrears amounts to M103.2milion at March 2016; the team is still awaiting data from WASCO. The analysis in Table 22.1 shows that arrears were 0.4% of aggregate expenditure for FY2015/2016 implying a very low ratio; however this cannot be true since a greater part of expenditure arrears remain unknown.
Table 22.1: Analysis of stock of expenditure arrears (Million Maloti)
Particulars 2013/2014 2014/2015 2015/2016
Stock of Expenditure Arrears No Data No Data 58,578.00* Total Expenditure 12,802,043.00 14,930,346.00 16,242,093.00 % Of Total Arrears to Total Expenditure No Data No Data 0.4% Source: MoF Consolidated annual financial statements 2013/2014, 2014/2015, and 2015/2016 * Figure not reliable since Head 37 (Defence & National Security) figure of M20.322million is duplicated
Dimension rating = D*
22.2 Expenditure Arrears Monitoring
For the first time in 2015/2016, the Government of Lesotho reported stock of expenditure arrears in its consolidated annual financial statements; these statements are yet to be audited. The monitoring and reporting of expenditure arrears is now done annually since FY2015/2016; it is not comprehensive as officials of the Office of Accountant General confirmed expenditure commitments outside IFMIS by line ministries is still a major challenge. Line ministries do not report on expenditure arrears arising out of commitments outside IFMIS. The expenditure report contained in the consolidated annual financial statements provides an age analysis of arrears classified under more than a year, six months and three months. This was achieved by activating Section 35(3) of the PFMA Act 2011, which requires the preparation of annual financial statements in accordance with International Public Sector Accounting Standards (IPSAS); IPSAS requires the full disclosure of expenditure arrears falling due within the period. The draft consolidated annual financial
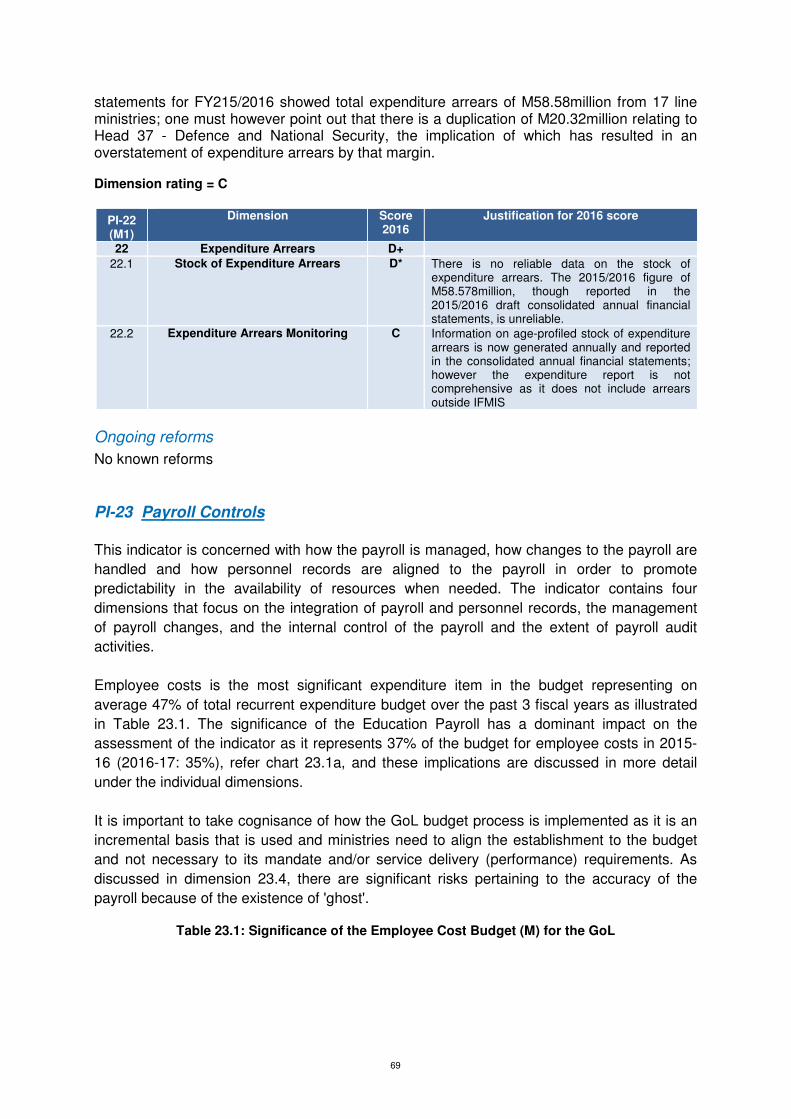
69
statements for FY215/2016 showed total expenditure arrears of M58.58million from 17 line ministries; one must however point out that there is a duplication of M20.32million relating to Head 37 - Defence and National Security, the implication of which has resulted in an overstatement of expenditure arrears by that margin. Dimension rating = C
PI-22 (M1)
Dimension Score 2016
Justification for 2016 score
22 Expenditure Arrears D+
22.1 Stock of Expenditure Arrears D* There is no reliable data on the stock of expenditure arrears. The 2015/2016 figure of M58.578million, though reported in the 2015/2016 draft consolidated annual financial statements, is unreliable.
22.2 Expenditure Arrears Monitoring C Information on age-profiled stock of expenditure arrears is now generated annually and reported in the consolidated annual financial statements; however the expenditure report is not comprehensive as it does not include arrears outside IFMIS
Ongoing reforms
No known reforms
PI-23 Payroll Controls
This indicator is concerned with how the payroll is managed, how changes to the payroll are
handled and how personnel records are aligned to the payroll in order to promote
predictability in the availability of resources when needed. The indicator contains four
dimensions that focus on the integration of payroll and personnel records, the management
of payroll changes, and the internal control of the payroll and the extent of payroll audit
activities.
Employee costs is the most significant expenditure item in the budget representing on
average 47% of total recurrent expenditure budget over the past 3 fiscal years as illustrated
in Table 23.1. The significance of the Education Payroll has a dominant impact on the
assessment of the indicator as it represents 37% of the budget for employee costs in 2015-
16 (2016-17: 35%), refer chart 23.1a, and these implications are discussed in more detail
under the individual dimensions.
It is important to take cognisance of how the GoL budget process is implemented as it is an
incremental basis that is used and ministries need to align the establishment to the budget
and not necessary to its mandate and/or service delivery (performance) requirements. As
discussed in dimension 23.4, there are significant risks pertaining to the accuracy of the
payroll because of the existence of 'ghost'.
Table 23.1: Significance of the Employee Cost Budget (M) for the GoL

70
2013/2014 2014/2015 2015/2016 Cost of Employees 3 429 742 086 3 346 225 344 5 645 355 267 Total operating budget 6 613 998 600 7 018 622 439 13 254 438 304 % 51.9% 47.7% 42.6% Source: Budget Books 2013/2014 – 2016/2017
The most recent available audited consolidated financial statements (31 March 2014), note
7, reflect an overspending on payroll in excess of M822m.
Chart 23.1a: Significant Payroll Components
Source: Budget Book 2016/17
During the period under assessment, the GoL replaced the former Unisys Payroll system and
implemented a new system, Resource Link, effective April 2016. Not all modules are active
yet, however the payroll module for all ministries is active.
23.1 Integration of Payroll and Personnel Records
Personnel records are manually maintained in hardcopies (personnel files) whilst an
electronic payroll system is used and by implication requires capturing changes into the
payroll system manually. In the absence of an automated integration, pre-numbered
Casualty Return documents serve as the basis for ensuring that the payroll is aligned to
individual personnel records.
Ministries maintain the personnel records whilst management of the payroll is centralised
within the Ministry of Finance. There is no evidence to suggest frequent validation of the
payroll and personnel data takes place. Interactions with officials of Ministry of Public
Service, Ministry of Education and Office of the Accountant General, indicate that the
accuracy of the payroll especially for Education is a major concern. The existence of 'ghost
teachers' is a significant risk.
Two additional factors that prohibit accurate and timely integration is that of the country not
having allocated identity numbers to citizens and secondly, at the start of each financial year
each ministry approves and adopts a new establishment once approved by the Public
Service Ministry. There is however no approved established that informs the payrolls for the
majority of the workforce.
37%
9%8%7%
7%
32%
Cost of Employees 2015/16
Education
Police
Defence
LG & C
Health
OTHER

71
Dimension rating = D
23.2 Management of Payroll Changes
There are three specific types of changes i.e. changing the establishment, centralised
adjustments for annual salary increases processed by the MoF and those changes pertaining
to personnel records with impact on actual payroll expenditure. Details of the changes
pertaining to personnel costs mainly as result of salary increases are illustrated in Chart 23.2.
Chart 23.2: Annual increase (%) in Employee Costs (Monetary Impact of Changes made)
Source: Consolidated Annual Financial Statements 2010/13 to 2015/16; Budget Book 2016/17
A manual pre-numbered document, the Casualty Returns (“CRs”), is used by the individual
ministries for effecting changes to individual employee payroll information such as new
appointments and terminations. Changes occur daily and the prescribed process provides for
daily submission of CRs for centralised processing by the MoF. However, there is no audit
trail generated to track changes and the timely and accurate processing of CRs. Significant
delays in processing terminations resulted in salary payments to officials who have left their
post. The internal control system over CRs and the payroll are weak. The individual payrolls
for the education, police and defence are not based on an approved establishment and as
such, over- and short supply of officials to workstations are experienced.
Payroll is not reviewed and/ or certified for accuracy and there is no evidence that ministries
review the monthly Payroll Analysis sent out by the MoF. Delay in submission of CRs is as a
major concern. Distances between cost centres and head office, budget constraints to
conduct a physical verification and in general a lack of compliance for speedy removal of
officials from the payroll on termination of services were among the main reasons for
existence of 'ghost workers'. It was not possible to quantify the impact of the delays in
processing CRs as there is no audit trail to track processing and salary overpayments are not
processed through suspense accounts indicating debt to be recovered from employees.
Dimension rating = D
0.00% 5.00% 10.00% 15.00% 20.00% 25.00%
2010/11
2011/12
2012/13
2013/14
2014/15
2015/16
Annual Increases in Personnel Cost

72
23.3 Internal Control of Payroll
Since the 2012 PEFA assessment 2 distinct HR-Manuals (Human Resources Management &
Development Policy Manual; Human Resources Management (HRM) Standard Operations
Guide) have been formulated and implemented in 2012 and the Treasury Regulations (PART
VIII, sections 44 -50) was issued 28 March 2014. These documents, together with the
prevailing legal framework, serve as guidelines for HR practitioners. The CR system provides
adequate controls for safeguarding the payroll integrity, if compliance is complete. In terms of
the CR system, authority for making changes are set at two levels i.e. the Principal Secretary
within the ministry approves the CR, which is then sent for final approval by the Ministry of
Public Service. However, there is a lack of adherence to the payroll controls.
The OAG reported (2013/2014 audit report - PART 11 (2); 2010/13 – PART 9 (9.1)) that
systems of internal controls were inadequate to support achievement of programme
objectives, e.g. control measure with regard to updating the payroll and dispatching lists were
found to be weak and led to fraudulent activities. In addition, non-compliance to laws and
regulations was noted and in specific spending units, incidents of overpayments, wrongful
payments were reported. Delays in effecting changes in salaries resulted in over and under
payments of public officers mainly as result of the delay in issuing CRs.
Dimension rating = D
23.4 Payroll Audit
Interaction with officials suggests that the “audit” of the payroll was limited to a headcount
conducted in 2015 by the Ministry of Public Service on the payroll of the ministries of Health
and of Local Government. The project was suspended due to capacity constraints and
effectiveness of the project. As mentioned earlier, Lesotho citizens have not been issued with
national identity cards, which limits the effectiveness of verification of individuals. Numerous
anomalies were already identified during the 2014 project, representing possible ghosts and
employees being paid after termination of services.
The OAG and IA units have both confirmed that no information technology audit was
conducted on either general or application controls over the past 5 years. In addition, there is
no evidence that the risks surrounding the payroll and salaries were adequately prioritised in
the audit plans of both the OAG and IA unit.
Dimension rating = D
PI-23 (M1)
Dimension Score 2016
Justification for 2016 score
23 Payroll Controls D 23.1 Integration of Payroll and Personnel
Records D There is no automatic integration or
reconciliations between personnel records and the payroll system
23.2 Management of Payroll Changes D Personnel records and the payroll are not updated at least quarterly and incidents of retrospective adjustments happen so frequently that it has been highlighted as a challenge to ministries and the office of the Accountant General
23.3 Internal Control of Payroll D There are no controls to validate and ensure the

73
PI-23 (M1)
Dimension Score 2016
Justification for 2016 score
integrity of the payroll data 23.4 Payroll Audit D There were no payroll audits, inspections or
surveys conducted during the past three years
Ongoing reforms
The GoL is currently implementing a number of reforms that may have an impact on payroll
management processes:
• The Department of Home Affairs is issuing each citizen with an identity number to be
captured onto payroll and updating personnel files;
• The roll out of the Government Human Resource Information Management System
(HRIMS);
• The execution of the Public Service Biometric and Payroll Census;
• The Public Financial Management Reform Project;
• The Public Service Modernization Project (PSMP).
PI-24 Procurement
This indicator is concerned with the management of procurement expenditure, in order to
promote predictability of resource availability. The indicator contains four dimensions that
focus on key aspects of procurement management; procurement monitoring; transparency,
openness and competitiveness of procurement methods applied; public access to
procurement information; and the management of procurement complaints and redress
arrangements.
The GoL has established a procurement system and a comprehensive regularity framework
to ensure that the use of public money in acquiring inputs for, and achieving value for money
in, the delivery of Government programmes and services, is effective.
The regularity framework consists of:
• The Public Financial Management and Accountability Act, Act 12 of 2011, PART VII
providing for procurement and management of government property. The Chief
Accounting Officer of a given Ministry is responsible for ensuring that the principles of
value for money, open and effective competition, transparent and ethical behaviour
and management of risk, are observed in the procurement processes of that
particular Ministry
• Treasury Regulations, 28 March 2014, PARTS IV – VI, deals with procurement and
spending of public monies
• The Public Procurement Regulations, 2007, provides for a detailed procedural
framework
• The GoL Code of Good Practice in Procurement
• Procurement Plans by each ministry
Non-employee expenditure represents 68% of the total 2015/16 budget as illustrated in chart
24.1, of which capital expenditure represents 26%. Please, note that these categories of
expenses are analysed in relation to total national budget which include debt servicing cost,
subscriptions, and transfers.

74
Chart 24.1: Share of GoL Budget by Economic Classification
Source: Budget Book 2016/17
Key: CoE = Cost of Employees; OPEX = Operating Expenses; CAPEX = Capital Expenditure
The main spending ministries are set out in chart 24.2 and the relative size of non-employee
budgeted expenditure within each ministry is set out in chart 24.3.
Chart 24.2: Revised Budget 2015/16 - Top 5 Ministries
Source: Budget Book 2016/17
Chart 24.3: Significance of procurement
32%
42%
26%
2015/16 Budget
CoE
Other OPEX
CAPEX
15%
13%
12%
8%7%
45%
2015/16: Capital & Recurrent (excluding payroll)
Finance
Health
Development
Water
DPW & T
OTHER
0.0%20.0%40.0%60.0%80.0%
100.0%120.0%
Wa
ter
De
ve
lop
me
nt
Ma
jest
y
DP
W &
T
Fin
an
ce
Tra
de
En
erg
y
Ge
nd
er,
Yo
uth IEC
He
alt
h
So
cDe
v
Co
mm
un
ica
t…
Ho
me
To
uri
sm PM
LG &
C
Sm
all
Bu
sin
ess
Ag
ric
Min
ing
Sta
tuto
ry
Fo
ren
sics
Law
PS
C
Lab
ou
r
Jud
icia
ry
Pe
nsi
on
s
Om
bu
dsm
an
Pu
bli
c S
erv
Fo
reig
n A
ff
De
fen
ce
Fo
rest
ry
Po
lice
Just
ice
Ed
uca
tio
n
OA
G
Capital and Recurrent (excluding payroll) as % of Total Revised Budget FY2015/2016
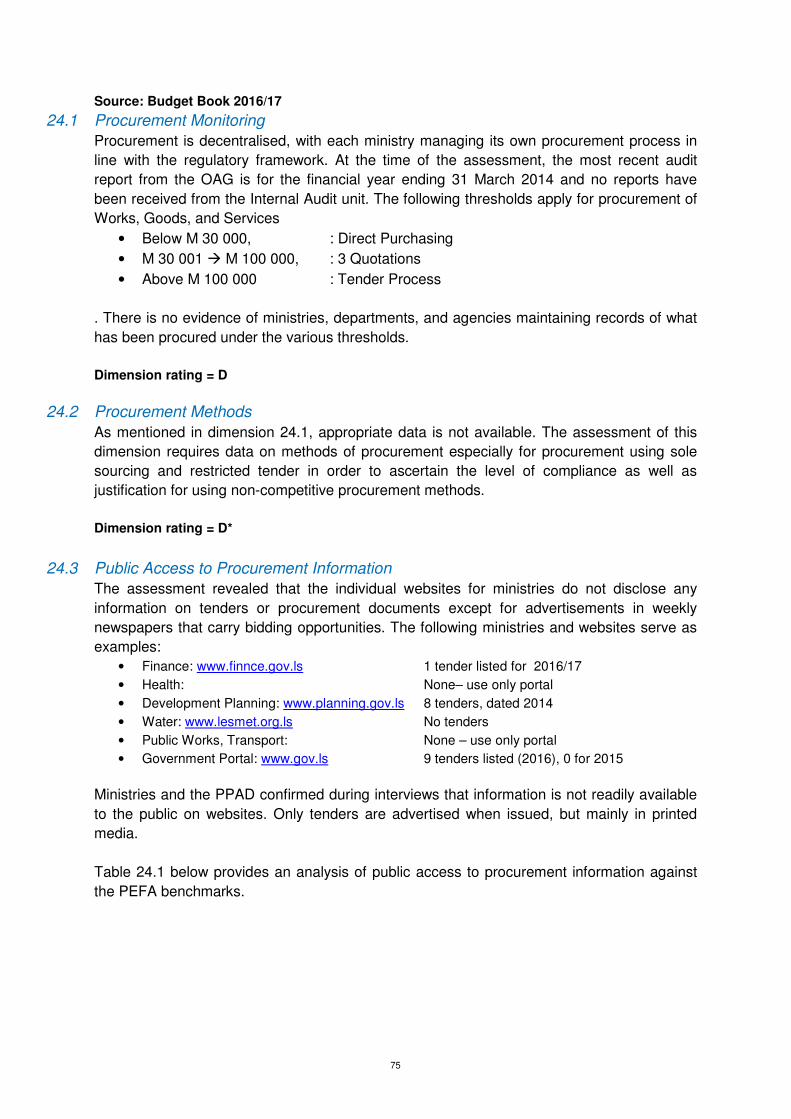
75
Source: Budget Book 2016/17
24.1 Procurement Monitoring
Procurement is decentralised, with each ministry managing its own procurement process in
line with the regulatory framework. At the time of the assessment, the most recent audit
report from the OAG is for the financial year ending 31 March 2014 and no reports have
been received from the Internal Audit unit. The following thresholds apply for procurement of
Works, Goods, and Services
• Below M 30 000, : Direct Purchasing
• M 30 001 � M 100 000, : 3 Quotations
• Above M 100 000 : Tender Process
. There is no evidence of ministries, departments, and agencies maintaining records of what
has been procured under the various thresholds.
Dimension rating = D
24.2 Procurement Methods
As mentioned in dimension 24.1, appropriate data is not available. The assessment of this
dimension requires data on methods of procurement especially for procurement using sole
sourcing and restricted tender in order to ascertain the level of compliance as well as
justification for using non-competitive procurement methods.
Dimension rating = D*
24.3 Public Access to Procurement Information The assessment revealed that the individual websites for ministries do not disclose any
information on tenders or procurement documents except for advertisements in weekly
newspapers that carry bidding opportunities. The following ministries and websites serve as
examples:
• Finance: www.finnce.gov.ls 1 tender listed for 2016/17
• Health: None– use only portal
• Development Planning: www.planning.gov.ls 8 tenders, dated 2014
• Water: www.lesmet.org.ls No tenders
• Public Works, Transport: None – use only portal
• Government Portal: www.gov.ls 9 tenders listed (2016), 0 for 2015
Ministries and the PPAD confirmed during interviews that information is not readily available
to the public on websites. Only tenders are advertised when issued, but mainly in printed
media.
Table 24.1 below provides an analysis of public access to procurement information against
the PEFA benchmarks.

76
Table 24.1: PEFA requirements to rate this dimension
The following key procurement information is available to the public through appropriate means:
No. Key procurement information Yes/No 1 Legal and regulatory framework for procurement:
These documents are not freely available to the public as they are not traceable on websites, not all ministerial websites are active. It can be purchased from the Government Printers but not readily available at the time of the assessment.
No
2 Procurement plans:
Procurement plans are prepared but not reliable; they not made available to the public
No
3 Bidding opportunities:
In the 2014 regulations – decree no 2, advertising in 3 newspapers are required. At least, the weekly national newspaper advertises bidding opportunities
Yes
4 Contract awards (purpose, contractor and value)
These are not disclosed to the public in terms of contract value and other details
No
5 Data on resolution of procurement complaints
Complaints Register for 2012 – 2015 received from the PPAD with 11 incidents reported. They are not publicized
No
6 Annual procurement statistics
Statistics are not published
No
Dimension rating = D
24.4 Procurement Complaints Management
There are three levels within the government before a service provider can approach a court
of law. Whilst within the ministry there is no segregation of responsibilities as it falls within the
mandate of the Procurement Officer, the second tier is the PPAD in the MoF and thereafter
the Procurement Tribunal .The Tribunal is not yet fully functional. The legal framework allows
for judicial review of decisions of Procurement Tribunal.
Interactions with the private sector (Lesotho Chamber of Commerce and Industry) suggest
that for fear of victimisation and blacklisting, very few bidders take advantage of the court
system; also because of the very slow justice delivery system.
Table 24.2: Mechanisms for reviewing procurement complaints Complaints are reviewed by a body which: Yes/No
1 Is not involved in any capacity in procurement transactions or in the process leading to contract award decisions
No; procurement tribunal not functional
2 Does not charge fees that prohibit access by concerned parties
No; procurement tribunal not functional
3 Follows processes for submission and resolution of complaints that are clearly defined and publicly available
No; procurement tribunal not functional
4 Exercises the authority to suspend the procurement process
No; procurement tribunal not functional
5 Issues decisions within the timeframe specified in the rules/regulations
No; procurement tribunal not functional
6 Is not involved in any capacity in procurement transactions or in the process leading to contract award decisions
No; procurement tribunal not functional
Dimension rating = D
77
PI-24 (M2)
Dimension Score 2016
Justification for 2016 score
24 Procurement D 24.1 Procurement Monitoring D There is no reliable record/database for
monitoring procurement management
24.2 Procurement Methods D* There is no record/database of what has been procured using which method. Details on the extent of deviations are not available centrally at PPAD
24.3 Public Access to Procurement Information
D Only one of the procurement elements is publicly available (that is, bidding opportunities in newspapers)
24.4 Procurement Complaints Management
D Procurement tribunal not yet fully functional
Ongoing reforms
Public Finance Management Reform Action Plan 2012-2018, Component 6
PI-25 Internal Controls on Non-Salary Expenditure
This indicator covers a wide range of processes and types of payment across central
government including existence of segregation of duties, effectiveness of expenditure
commitment controls and compliance with payment rules and procedures ensuring that
resources are obtained, and used as intended and only where appropriate authority is
exercised.
A comprehensive regularity framework consisting of international and national standards,
laws and regulations guide ministries in designing, implementing and applying control
processes and procedures. In Lesotho both the PFMA Act of 2012 and the Treasury
Regulations, 2014 directly address internal controls and allocate specific duties and
responsibilities to accounting officers in ministries. There are also International frameworks
such as the COSO (Committee of Sponsoring Organisations of the Treadway Commission)
Internal Control – Integrated Framework and the INTOSAI standard on Governance, ISSAI
9100 – Guidelines for Internal Control in the Public Sector that serve as guidelines when
considering the internal control environment; these are not applicable in Lesotho.
25.1 Segregation of Duties
The GoL expenditure process provides for specific roles and responsibilities and at a high
level consists of the following separate activities i.e.:
• Annual budget allocations by the MOF
• Procurement plans compiled by Ministries
• Procurement process managed by Ministries
• Accounting records integrated and managed by the MOF
• Payments initiated by line ministries, processed and paid by the MOF
Within ministries, a generic organogram exists for each finance section that includes
functions such as procurement, administration, and payments. This structure provides for
implementing the prescribed procurement and payment process within ministries and all
positions have formal job descriptions. The financial management process provides for an
officer responsible for raising purchase requisitions within each department; the purchase
requisitions are then authorised by the head of department, sent to head of budget for
clearance and then to the Chief Accounting Officer for approval before the local purchase

78
order is raised. The head of accounts authorises for payment once goods and/or services are
delivered with the appropriate Goods Received Note with confirmation from the head of
stores where necessary. Each ministry has an officer responsible for stores and assets
management who is supposed to ensure strict compliance. There are also clear segregation
of responsibilities when it comes to recording of financial data, reconciliations and internal
audit. However, compliance remains a major concern due to high vacancy levels, lack of
skills and capacity.
Dimension rating = A
25.2 Effectiveness of Expenditure Commitment Controls
The procurement process provides for a commitment to be raised and offset against
available funds (budgets) on the IFMS system once an order is generated. Based on
interviews conducted any procurement outside of the process is regarded as irregular and
service providers will not be paid. There are instances where commitments are raised
outside IFMIS, for example, payments for infrastructure projects where the projects span
over multiple financial years. The impact of incurring “expenditure without placing orders” has
a material impact on the effectiveness of commitment controls.
The Auditor General has reported (on the consolidated financial statements) that 14
ministries that overspent M277m in 2013/14 (2012/13 information incomplete in audit report
(par 3.6)) pertaining to recurrent expenditure (par 5.31). It is however not clear to what extent
overspending in personnel costs, if any, contributed to the overspending due to a lack of
reporting or disclosure by economic classification in the report.
Dimension rating = C
25.3 Compliance with Payment Rules and Procedures
Available evidence points to serious disregard for payment rules and procedures. Purchase
orders not processed through IFMIS are rejected for payment; however, there are numerous
instances where commitments are made outside IFMIS, thereby creating huge expenditure
arrears. Nonetheless, IFMIS functionality disallows all commitments that are in excess of
approved limits within IFMIS. There are identified instances and risks that indicate a high
level of non-compliance i.e. the Auditor General has reported on overspending by ministries,
bank reconciliations that are not up to date (not all expenses therefore necessary captured)
and the fact that expenditure on capital projects is not committed prior to payment.
Dimension rating = D
PI-25 (M2)
Dimension Score 2016
Justification for 2016 score
25 Internal controls on Non-Salary Expenditure
C+
25.1 Segregation of Duties A Appropriate segregation of duties is prescribed throughout the expenditure process and responsibilities are clearly laid down
25.2 Effectiveness of Expenditure Commitment Controls
C IFMIS functionality is capable of controlling commitments; however not all expenditures are processed through IFMIS

79
PI-25 (M2)
Dimension Score 2016
Justification for 2016 score
25.3 Compliance with Payment Rules and Procedures
D Clear internal controls exist but they are rarely adhered to
Ongoing reforms
None
PI-26 Internal Audit
This indicator assesses the standards and procedures applied in internal audit and contains
four dimensions dealing with the coverage of internal audit, the nature of audits and
standards applied, implementation of internal audit plans and the response to internal audit
reports.
In the public sector, the function is primarily focused on assuring the adequacy and
effectiveness of internal controls: the reliability and integrity of financial and operational
information; the effectiveness and efficiency of operations and programs; the safeguarding of
assets; and compliance with laws, regulations, and contracts. Effectiveness of risk
management, control, and governance processes should be evaluated by following
professional standards such as the International Standards for the Professional Practice of
Internal Auditing, issued by the Institute of Internal Auditors. These include: (a) appropriate
structure particularly with regard to organizational independence; (b) sufficient breadth of
mandate, access to information; and power to report; and (c) use of professional audit
methods, including risk assessment techniques.
The Internal Audit Unit functions on a “shared-service” basis reporting to the Accountant
General, both functionally and administratively, as the intended Audit Committee has not
been yet been established. The regulatory framework within what the IA conducts its
business consists mainly of:
• the Public Financial Management and Accountability Act, Act 12 of 2011, section 38
• the Treasury Regulations 2014, section 11
• the International Standards for the Professional Practice of Internal Auditing, 2012
(this is partly adopted by Lesotho)
26.1 Coverage of Internal Audit
There is insufficient evidence that internal audit activities are prioritising risks as prescribed in
the PFMAA and in accordance with IA standards. As stated above, internal audit services are
rendered on a “shared service” basis with the IA Director (Chief Audit Executive) reporting to
the Accountant General (MoF).
Though individual auditors are deployed in ministries, this is mainly an operational
arrangement and does not necessary result in adequate audit coverage in terms of the risk
areas including payroll, fixed assets, non-tax revenue, procurement, cash management, ICT,
among others even though majority of line ministries, departments and agencies have
functional internal audit units. IAD (MoF) confirmed that no audit has been carried out on
information technology system(s) used in government for the past 3 to 5 years to test the
general and application control strengths. The Lesotho Revenue Authority, on the other
80
hand, has a dedicated team of internal auditors to cover the majority of revenue (tax
revenues) collected for central government.
Dimension rating = C
26.2 Nature of Audits and Standards Applied
There is no evidence that there is an adequate Quality Assurance in process and the Internal
Audit Unit has not conducted any self-assessment or arranged for an external assessment
as prescribed in IIA standard 1300. Based on discussions there is no Risk Management
Framework in government and there is no evidence that audit assignments prioritized risks
using alternative means.
In the absence of copies of IA reports, it is not possible to determine the main audit areas,
that is, risks, effectiveness of internal control or compliance matters. The OAG has
concluded in its audit strategy that it places no reliance on IA due to lack of coverage, limited
compliance to standards, incomplete working paper files and lack of comprehensive internal
audit reports. Internal audit standards manual was unavailable for the team's review.
Dimension rating = C
26.3 Implementation of Internal Audits and Reporting
Treasury Regulation 11(14) requires that the IA unit prepare (in consultation with the Audit
Committee) the following documents:
a) A three-year rolling strategic plan;
b) An annual work plan for the first year of the rolling strategic plan; and
c) An annual report (for the Audit Committee) detailing its performance against the
annual work plan to allow for effective monitoring and possible intervention.
As stated above, the Audit Committee has not yet been established and based on
discussions, the three year rolling strategic plan has not been prepared. The last internal
work plan available was for FY2015/2016 as presented in table 26.1 below for majority of line
ministries; not much is achieved in terms of implementation of audit plans. A number of
internal audit reports for FY2015/2016 were reviewed; the main issues arising out of these
reports include non-compliance with procurement rules, non-reconciliation of bank accounts,
incomplete documentation to support expenditure payments, missing payment vouchers,
poor non-tax revenue accounting, among others.
Table 26.1: Internal Audit Unit Work plans - 2015/2016
Ministry Planned Engagement in 2015/16 Conducted Engagements 2015/16
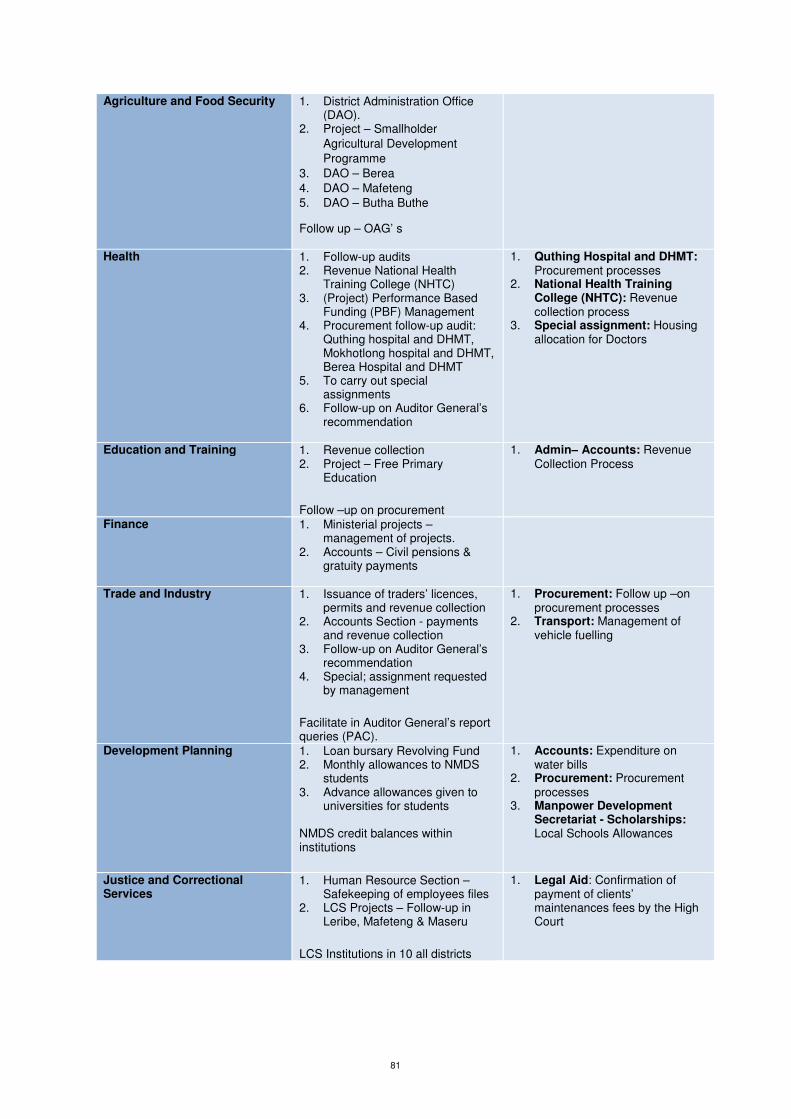
81
Agriculture and Food Security 1. District Administration Office (DAO).
2. Project – Smallholder
Agricultural Development
Programme
3. DAO – Berea
4. DAO – Mafeteng 5. DAO – Butha Buthe
Follow up – OAG’ s
Health 1. Follow-up audits 2. Revenue National Health
Training College (NHTC) 3. (Project) Performance Based
Funding (PBF) Management 4. Procurement follow-up audit:
Quthing hospital and DHMT, Mokhotlong hospital and DHMT, Berea Hospital and DHMT
5. To carry out special assignments
6. Follow-up on Auditor General’s recommendation
1. Quthing Hospital and DHMT: Procurement processes
2. National Health Training College (NHTC): Revenue collection process
3. Special assignment: Housing allocation for Doctors
Education and Training 1. Revenue collection 2. Project – Free Primary
Education
Follow –up on procurement
1. Admin– Accounts: Revenue Collection Process
Finance 1. Ministerial projects – management of projects.
2. Accounts – Civil pensions & gratuity payments
Trade and Industry 1. Issuance of traders’ licences, permits and revenue collection
2. Accounts Section - payments and revenue collection
3. Follow-up on Auditor General’s recommendation
4. Special; assignment requested by management
Facilitate in Auditor General’s report queries (PAC).
1. Procurement: Follow up –on procurement processes
2. Transport: Management of vehicle fuelling
Development Planning 1. Loan bursary Revolving Fund 2. Monthly allowances to NMDS
students 3. Advance allowances given to
universities for students NMDS credit balances within institutions
1. Accounts: Expenditure on water bills
2. Procurement: Procurement processes
3. Manpower Development Secretariat - Scholarships: Local Schools Allowances
Justice and Correctional Services
1. Human Resource Section – Safekeeping of employees files
2. LCS Projects – Follow-up in Leribe, Mafeteng & Maseru
LCS Institutions in 10 all districts
1. Legal Aid: Confirmation of payment of clients’ maintenances fees by the High Court
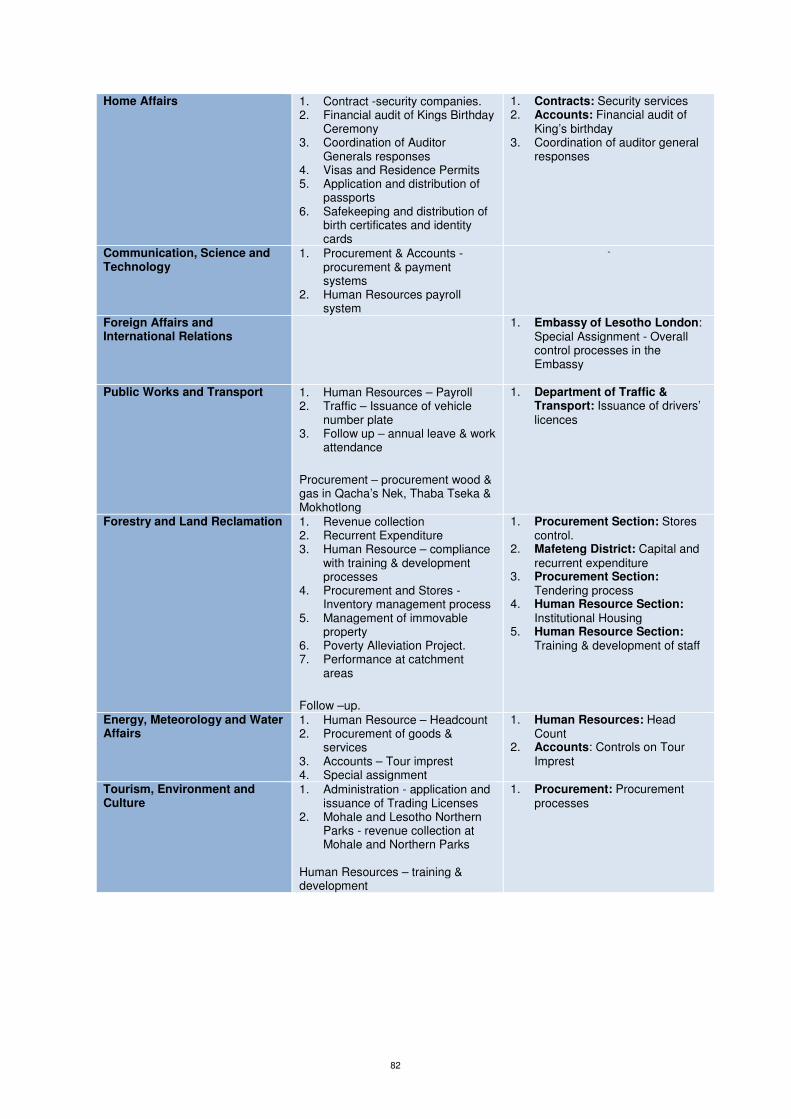
82
Home Affairs 1. Contract -security companies. 2. Financial audit of Kings Birthday
Ceremony 3. Coordination of Auditor
Generals responses 4. Visas and Residence Permits 5. Application and distribution of
passports 6. Safekeeping and distribution of
birth certificates and identity cards
1. Contracts: Security services 2. Accounts: Financial audit of
King’s birthday 3. Coordination of auditor general
responses
Communication, Science and Technology
1. Procurement & Accounts - procurement & payment systems
2. Human Resources payroll system
-
Foreign Affairs and International Relations
1. Embassy of Lesotho London: Special Assignment - Overall control processes in the Embassy
Public Works and Transport 1. Human Resources – Payroll
2. Traffic – Issuance of vehicle number plate
3. Follow up – annual leave & work attendance
Procurement – procurement wood & gas in Qacha’s Nek, Thaba Tseka & Mokhotlong
1. Department of Traffic & Transport: Issuance of drivers’ licences
Forestry and Land Reclamation 1. Revenue collection 2. Recurrent Expenditure 3. Human Resource – compliance
with training & development processes
4. Procurement and Stores - Inventory management process
5. Management of immovable property
6. Poverty Alleviation Project. 7. Performance at catchment
areas
Follow –up.
1. Procurement Section: Stores control.
2. Mafeteng District: Capital and recurrent expenditure
3. Procurement Section: Tendering process
4. Human Resource Section: Institutional Housing
5. Human Resource Section: Training & development of staff
Energy, Meteorology and Water Affairs
1. Human Resource – Headcount 2. Procurement of goods &
services 3. Accounts – Tour imprest 4. Special assignment
1. Human Resources: Head Count
2. Accounts: Controls on Tour Imprest
Tourism, Environment and Culture
1. Administration - application and issuance of Trading Licenses
2. Mohale and Lesotho Northern Parks - revenue collection at Mohale and Northern Parks
Human Resources – training & development
1. Procurement: Procurement processes

83
Defence and National Security 1. Administration Department - compliance with policies, procedure & financial regulations
2. Administration – compliance with public procurement regulations
3. Makoanyane Military hospital Revenue collection
LDF Department – compliance with financial regulations
1. Administration: Follow Up- Procurement & Accounts
Local Government and Chieftainship
1. Open tender procurement. 2. Local Government Development
Grant (LDG) in all 10 districts 3. Human Resource 4. Special Assignments by the
Management 5. Facilitate of delivery of
affordable quality houses to Basotho within property planned settlements (Housing)
1. Districts Council audits on donor fund
2. Local Development Grant projects (LDG) and Capacity Building Grant (CBG) for 10 district councils and Maseru City Council (MCC)
Gender, Youth, Sports and Recreation
1. Accounts - Pending Payments 2. Subventions and Subscriptions 3. Ministry’s Projects
Follow Up - Procurement and Revenue processes
1. Setsoto Stadium: Revenue collection
2. Re-opening of Matheko Youth Centre: Procurement of equipment
3. Administration: Controls related to clearance of equipment to be used by the vocational training centres
Social Development 1. Administration & Accounts - Fleet Management
2. Accounts – budget & expenditure on communication
3. Procurement, Stores and Accounts
4. Accounts, Procurement, Stores – compliance with procurement & financial Regulations in 10 districts
5. Special Assignments
1. Procurement & Stores: Procurement processes
Dimension rating = C
26.4 Response to Internal Audits
The majority of internal audit units within line ministries prepares and issue periodic internal
audit reports to management (chief accounting officers); however, available evidence
(sample of internal audit reports from forestry, works, defence, finance, trade, and foreign
affairs) indicates no executive action or response to audit findings. Officials from IAD MoF
have expressed serious concerns regarding non-executive action to audit (internal and
external) findings.
Dimension rating = D
PI-26 (M1)
Dimension Score 2016
Justification for 2016 score
26 Internal Audit D+
26.1 Coverage of Internal Audit C Majority of line ministries and budget entities have functional internal audit units
26.2 Nature of Audits and Standards D There is no evidence of the nature of audits

84
PI-26 (M1)
Dimension Score 2016
Justification for 2016 score
Applied conducted or that appropriate standards were applied
26.3 Implementation of Internal Audits and Reporting
C Annual internal plans are prepared; majority of these plans are implemented. Some internal audit reports are issued to chief accounting officers
26.4 Response to Internal Audits D Even though periodic internal audit reports are prepared and issued to management, there is neither execution action nor responses to audit queries
Ongoing reforms
The ongoing PFM reform project is providing the support needed to implement change to
GoL’s Internal Audit.
85
Pillar VI. Accounting and Reporting
PI-27 Financial Data Integrity
This indicator assesses the extent to which treasury bank accounts, suspense accounts, and
advance accounts are regularly reconciled and how the processes in place support the
integrity of financial data. Timely, relevant, and reliable financial information is required to
support fiscal and budget management and decision-making.
Reliable reporting of financial information requires a system of consistent checking and
verification of accounting records and practices as a critical part of internal controls to ensure
quality decision-making information. This is an important part of internal control and a
foundation for good information for management and for external reports that underpin
aggregate fiscal discipline, strategic allocation of resources, and the efficiency of service
delivery. Care should be taken to properly account for losses to be recovered and
expenditure to be appropriately classified.
In order to enhance data integrity the regulatory framework and circular(s) issued by the
office of the Accountant General provide guidance to ministries:
• Public Financial Management and Accountability Act, Act 12 of 2011
• The Treasury Regulations, 28 March 2014 –
o PART VII (sections 32 - 43: Advances);
o PART XII (section 81: Bank Reconciliations);
o PART XVII (sections 93 – 99: Financial Reports)
• Accountant General Circular: Bank Reconciliations, February 2016
27.1 Bank Account Reconciliation
There are in total 364 bank accounts (outside treasury control) spread between the ministries who are responsible for doing the reconciliations on a monthly basis (Note 9, AFS 2015/16). Reconciliations are manual, as the IFMIS reconciliation module, where an automatic bank statement upload is done unto IFMIS for direct reconciliation, is not active. Inaccurate reporting on revenue and cash and bank balances (material differences) are included as qualification matters for the OAG to issue adverse audit opinions for the four years ending 31 March 2014. The office of the Accountant General shared the concern that there is a high risk of significant delays (backlog) in compiling the required reconciliations by the ministries. Statistics provided for October 2016 indicates that of all the bank accounts managed by government treasury, 98% (by value) has a backlog of more than 12 months whilst 1.2% are 8 months in arrears. There is only one Treasury managed bank account reconciled as at 30 September 2016 (Lipam-CDSM). Most donor-funded project accounts are however reconciled regularly and within 4 weeks after month-end; these reconciliations are more regular due to donor insistence and periodic monitoring which is lacking within the government framework Dimension rating = D
27.2 Suspense Accounts
As reported during the 2012 PEFA assessment, “below the line” suspense accounts have not
been reconciled since 2007/08. These balances remained un-reconciled and cleared up to
the 2015/16 financial year. The Accountant General stated that these suspense accounts
would be cleared during the 2016-17 financial year. The OAG has raised serious concerns

86
regarding the non-acquittal of these suspense accounts. Accounting for salary over-
payments as result of the delay in processing terminations on time through the payroll are
not processed to record the monies owed to the state. These debts are therefore
unaccounted for and not disclosed appropriately.
Suspense Account - Receivables
An analysis of the suspense accounts as per the annual financial statements indicates a
growing or static balance, which could be indicative of non-reconciliation of other suspense
accounts and/or non-collection of monies owed to the GoL as illustrated in table 27.1:
Table 27.1: Disclosure as per the audited annual financial statements
SUSPENSE ACCOUNTS (RECEIVEABLES) AND ADVANCES (M’000)
2009/10 2010/11 2011/12 2012/13 2013/14 2014/15 2015/16 Domestic 0 0 0 0 0 In terms of
IPSAS Cash Basis
of Accounting no detailed information disclosed
In terms of IPSAS Cash
Basis of Accounting no detailed information disclosed
Annual Advances 0 0 0 0 0
Other Accounts Receivable 72 65,001 87,709 87,436 87,436
Other Temporary Advances 218 218 638 1,506 1,736
Staff Debtors 0 0 0 -24 -24
Tour Impress 2,366 8,314 2,624 39,414 52,886
2,656 73,533 90,971 128,332 142,034
Source: Audited Annual Financial Statements 2010/13 and 2013/14; AFS 2014/15 and 2015/16
The following “Miscellaneous Other Expenditure” was reported on in the annual financial
statements without adequate disclosure of the nature of these payments, which could
represent possible transactions that should have been allocated to suspense accounts and
not expensed. Refer Table 27.2. In addition, the OAG reported on the fact that losses to the
value of M138m were expensed in the 2013/14 financial year and not earmarked to be
recovered by raising a debt (suspense account).
Table 27.2: Disclosure as per the audited annual financial statements
“MISCELLANEOUS OTHER EXPENDITURE” (M’000)
2009/10 2010/11 2011/12 2012/13 2013/14 2014/15 2015/16 Miscellaneous 651 165 693 298 920 822 740 051 767 583 729 392 878 833
% of Total Expenditure
(excluding CoE) 10.6% 12.8% 14.1% 11.8% 9.4% 8.2% 9.0% Source: Audited Annual Financial Statements 2010/13 and 2013/14; AFS 2014/15 and 2015/16 (Total excluding Personnel Costs)
Suspense Account- Payables
The annual financial statements reflected no credit balances pertaining to suspense
accounts as at 31 March 2014.
Ministries informed the PEFA team that suspense accounts are reconciled by the office of
the Accountant General. In addition, not all salary over payments are processed timely as
payroll controls are inadequate to identify 'ghost' employees.
Dimension rating = D
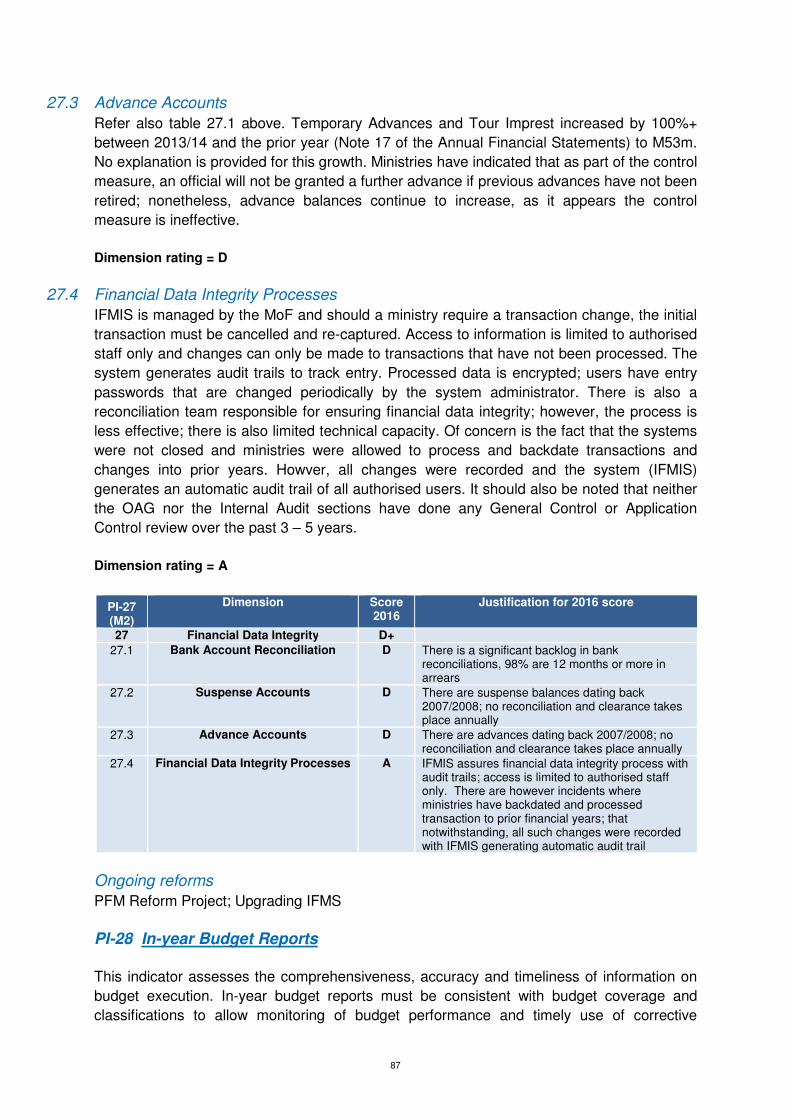
87
27.3 Advance Accounts
Refer also table 27.1 above. Temporary Advances and Tour Imprest increased by 100%+
between 2013/14 and the prior year (Note 17 of the Annual Financial Statements) to M53m.
No explanation is provided for this growth. Ministries have indicated that as part of the control
measure, an official will not be granted a further advance if previous advances have not been
retired; nonetheless, advance balances continue to increase, as it appears the control
measure is ineffective.
Dimension rating = D
27.4 Financial Data Integrity Processes
IFMIS is managed by the MoF and should a ministry require a transaction change, the initial
transaction must be cancelled and re-captured. Access to information is limited to authorised
staff only and changes can only be made to transactions that have not been processed. The
system generates audit trails to track entry. Processed data is encrypted; users have entry
passwords that are changed periodically by the system administrator. There is also a
reconciliation team responsible for ensuring financial data integrity; however, the process is
less effective; there is also limited technical capacity. Of concern is the fact that the systems
were not closed and ministries were allowed to process and backdate transactions and
changes into prior years. Howver, all changes were recorded and the system (IFMIS)
generates an automatic audit trail of all authorised users. It should also be noted that neither
the OAG nor the Internal Audit sections have done any General Control or Application
Control review over the past 3 – 5 years.
Dimension rating = A
PI-27 (M2)
Dimension Score 2016
Justification for 2016 score
27 Financial Data Integrity D+
27.1 Bank Account Reconciliation D There is a significant backlog in bank reconciliations, 98% are 12 months or more in arrears
27.2 Suspense Accounts D There are suspense balances dating back 2007/2008; no reconciliation and clearance takes place annually
27.3 Advance Accounts D There are advances dating back 2007/2008; no reconciliation and clearance takes place annually
27.4 Financial Data Integrity Processes A IFMIS assures financial data integrity process with audit trails; access is limited to authorised staff only. There are however incidents where ministries have backdated and processed transaction to prior financial years; that notwithstanding, all such changes were recorded with IFMIS generating automatic audit trail
Ongoing reforms
PFM Reform Project; Upgrading IFMS
PI-28 In-year Budget Reports
This indicator assesses the comprehensiveness, accuracy and timeliness of information on
budget execution. In-year budget reports must be consistent with budget coverage and
classifications to allow monitoring of budget performance and timely use of corrective
88
measures. There is a comprehensive regulatory framework dealing with budget (and weekly
cash flow) monitoring and reporting and specifically the following:
• the Public Financial Management and Accountability Act, Act 12 of 2011 (refer
sections 4(c),(e); 27; 34(1)(a)
• the Treasury Regulations, 2014 (refer sections 12(2); 13; 14; 93(1); 98
When assessing the indicator it is important to take note of the process implemented
whereby the office of the Accountant General takes overall responsibility for cash flow
management, which includes strict monitoring of both revenue and expenditure. Quarterly
warrants are issued to spending units to facilitate procurement and expenditure payments in
line with the prescribed procurement plans, taking into account the extent of commitments.
All (procurement and payment) transactions are processed on the IFMIS, which is managed
by the office of the Accountant General and reports are available on a daily basis allowing
aggregate monitoring.
28.1 Coverage and Comparability of Reports
Reporting is done directly from the IFMIS, which is used by all ministries. There is a
standardised Chart of Accounts (“SCOA”) in place and the entire budget is manually
captured onto the IFMIS, updated when the budget is adjusted. At the stage of issuing a
Government Order, the IFMIS is updated by registering the commitment and the eventual
payment is processed against the commitment. This ensures alignment of expenditure by
ministries, departments and agencies, and according to administrative and economic sub-
votes and sub-sub-votes.
Transfers to de-concentrated and extra-budgetary units within central government are
considered as expenditure and captured onto the IFMIS as these units are regarded as
autonomous and not integrated into reporting processes. As discussed in dimension 28.2
there are three levels of reporting done as part of the in-year monitoring process i.e. weekly,
monthly and quarterly and are fully compatible with the budget.
Dimension rating = C
28.2 Timing of in-year Budget Reports
The availability of information in IFMIS on a real-time basis promotes budget monitoring.
However, budget monitoring is weak. This is of significance, as procurement cannot proceed
without available commitment. The PFMAA (section 98) provides for reports to be submitted
within 14 days of the end of each month, inclusive of the bank reconciliations, to the
Accountant General. In line with section 98, the Accountant General shall report to the
Cabinet throughout the year (no timeframes nor frequency is prescribed), and to National
Assembly on a quarterly basis. Whiles IFMIS is capable of generating in-year budget reports
real-time, there are significant delays of more than 4 months in producing quarterly in-year
reports. As of the time of drafting this report, only the first quarter in-year budget report for
FY2016/2017 has been published on MoF website.
Dimension rating = D
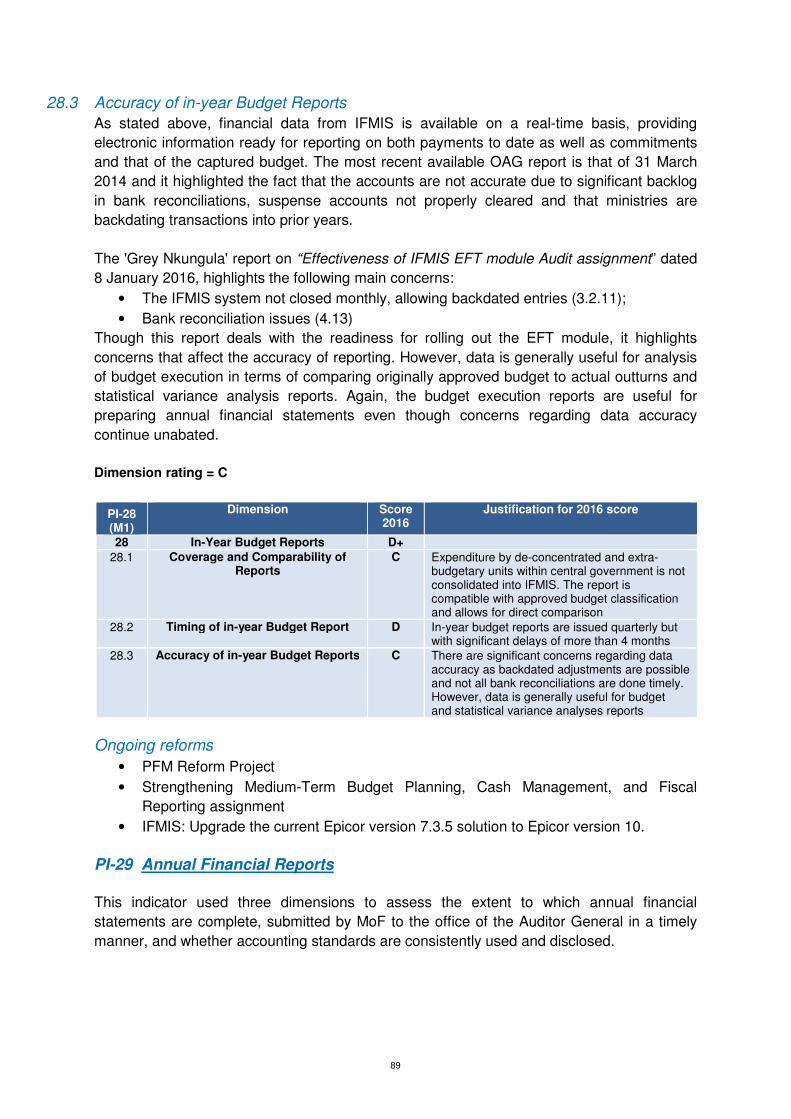
89
28.3 Accuracy of in-year Budget Reports
As stated above, financial data from IFMIS is available on a real-time basis, providing
electronic information ready for reporting on both payments to date as well as commitments
and that of the captured budget. The most recent available OAG report is that of 31 March
2014 and it highlighted the fact that the accounts are not accurate due to significant backlog
in bank reconciliations, suspense accounts not properly cleared and that ministries are
backdating transactions into prior years.
The 'Grey Nkungula' report on “Effectiveness of IFMIS EFT module Audit assignment” dated
8 January 2016, highlights the following main concerns:
• The IFMIS system not closed monthly, allowing backdated entries (3.2.11);
• Bank reconciliation issues (4.13)
Though this report deals with the readiness for rolling out the EFT module, it highlights
concerns that affect the accuracy of reporting. However, data is generally useful for analysis
of budget execution in terms of comparing originally approved budget to actual outturns and
statistical variance analysis reports. Again, the budget execution reports are useful for
preparing annual financial statements even though concerns regarding data accuracy
continue unabated.
Dimension rating = C
PI-28 (M1)
Dimension Score 2016
Justification for 2016 score
28 In-Year Budget Reports D+ 28.1 Coverage and Comparability of
Reports C Expenditure by de-concentrated and extra-
budgetary units within central government is not consolidated into IFMIS. The report is compatible with approved budget classification and allows for direct comparison
28.2 Timing of in-year Budget Report D In-year budget reports are issued quarterly but with significant delays of more than 4 months
28.3 Accuracy of in-year Budget Reports C There are significant concerns regarding data accuracy as backdated adjustments are possible and not all bank reconciliations are done timely. However, data is generally useful for budget and statistical variance analyses reports
Ongoing reforms
• PFM Reform Project
• Strengthening Medium-Term Budget Planning, Cash Management, and Fiscal
Reporting assignment
• IFMIS: Upgrade the current Epicor version 7.3.5 solution to Epicor version 10.
PI-29 Annual Financial Reports
This indicator used three dimensions to assess the extent to which annual financial
statements are complete, submitted by MoF to the office of the Auditor General in a timely
manner, and whether accounting standards are consistently used and disclosed.
90
The regulatory framework is explicit in prescribing timeframes, target dates, responsibilities
and set the basis for preparing financial reports on the IPSAS Cash Basis of accounting,
namely:
• the Public Financial Management and Accountability Act, Act 12 of 2011 (sections 34;
35; 36; 37); Public Entities (PART VI)
• the Treasury Regulations, 28 March 2014 (PART XVI)
• International Standard on Cash Basis issued by the Public Sector Accounting
Standards Board (IPSAS)
It is important when assessing the indicator to take note of the significant delays in finalising
accounts, presenting them for audit purposes and the eventual tabling in parliament. In
addition, the regularity framework provides for the OAG to issue an audit report (and opinion)
on consolidated financial statements and that ministries compiled individual annual financial
statements for the first time for the year ending 31 March 2016.
29.1 Completeness of Annual Financial reports
The Government's annual financial statements are comparable with originally approved budgets. The GoL 31 March 2016 consolidated annual financial statements are prepared on the IPSAS cash basis consisting of the following:
I. Report by the Minister of Finance II. Report by Accountant General
a. Commentary on Consolidated Financial Statements III. Consolidated Financial Statements For the year ended 31st March, 2016
a. Consolidated Statement of Cash Receipts and Payments b. Consolidated Statement of Comparison of Budget and Actual Amounts c. Statement of Accounting Policies d. Statement of Consolidated Entities
IV. IV. Notes to the Consolidated Financial Statements • Appendix 1: Analysis of Receipts and Payments by Spending Unit • Appendix 2: Budget Comparison – Analysis by Spending Unit • Appendix 3: FY2015/16 Original to Revised Budget
A generic template is in use for ministries for compiling the 31 March 2016 individual financial statements providing for disclosure of the following i.e.
• Report by the Accounting Officer • Certificate by the Chief Accounting Officer • Statement 1: Statement of Cash Receipts and Payments • Statement 2: Statement of comparison of Budget and Actual amounts • Statement 3: Special Funds • Statement 4: Accounting Policies • Notes to the financial statements • Schedule of Cash Balances • Schedules of Revenue Arrears and other debtors • Schedule of Payment Arrears • Schedule of Contingent Liabilities • Schedule of Losses and Write-off • Schedule of Spending Units • State owned entities • External Assistance and borrowings • Below the line accounts

91
Local Authorities, Public Entities (state owned enterprises and autonomous bodies) and Extra Budgetary Funds are excluded from the consolidated financial statements for the year ending 31 March 2016 and as such the consolidation represents an amalgamation of ministries, offices and special purpose accounts e.g. “Interest Charges”; “Refund Erroneous Receipt”, etc. The successful consolidation is dependent on the extent of applying a similar accounting framework. Table 29.1 outlines information contained in 2015/2016 annual financial statements:
Table 29.1: Information Contained in the GoL Consolidated Annual Financial Statements 31 March 2016
Financial heading Sub-financial heading Presence in
Financial Statements
Revenue
Direct Tax Yes Indirect Tax Yes Investment Income Yes Non-Tax Revenue Yes Grants Yes
Expenditure & transfers
Personnel Emolument Yes Goods and Services Yes Interests Yes Investments Yes Losses Yes Statutory Payments Yes Subsidies and Transfers Yes
Assets
Cash and Bank Balances Note 9 M 8,914,270,000 Advances
Public Loans (Receivable) Note 15 M 926,024,738 Equity and Other Investments Note 10 Revenue Arrears Note 11 M 9,213,000
Liabilities
Public Debts (Domestic) Note 14 M 1,274,768 Public Debts (Foreign) Note 14 M 13,978,406 Long Term Borrowings Yes Suspense Accounts Note 12 M 170,464,121 Contingent Liabilities- Pension Fund Note 13 M 2,046,000,000 Contingent Liabilities - Guarantees Note 16 M 88,046,347 Expenditure Arrears Note 17 M 58,578,000
Source: Consolidated Financial Statements 31 March 2016
Dimension rating = B
29.2 Submission of Reports for External Audit
The OAG is required to issue an opinion on only the consolidated annual financial statements as prescribed by the PFMAA. As shown in Table 29.2 below the Accountant General submitted consolidated annual financial statements within 5 months after the end of the fiscal year for external audit.

92
Table 29.2: Timeliness of Submission of AFS by Accountant General to OAG
Financial Year Financial Statements for Date of Submission to OAG
FY2014 Consolidated Fund 01 September 2014 FY2015 Consolidated Fund 31 August, 2015 FY2016 Consolidated Fund 31 August 2016
Source: OAG
Dimension rating = B
29.3 Accounting Standards
The PFMAA specifies that the IPSAS Cash Basis of Accounting framework should be
adopted and applied for compiling financial statements. Compliance to IPSAS was evaluated
as indicated in Table 29.3 below using the consolidated annual statements and four line
ministries annual financial statements (Education, Finance, Public Works, and Agriculture).
The Accountant General has indicated that 2015/2016 was the first year of compiling the
financial statements on the IPSAS Cash Basis and the process will be fully phased in over a
period of two financial years. As shown in the table below, compliance to IPSAS cash
averaged 94%; however, this is not consistent overtime since 2015/2016 was the first year of
adopting IPSAS cash
Table 29.3: IPSAS Compliance
Financial Year Consolidated AFS Ministries (4)
AFS
Observations Consolidated AFS Ministries AFS
(4)
FY2015/2016 Yes Yes – Sample Tested
91% Average: 94%
FY2014/2015 Yes No – Not Compiled
86% N/A
FY2013/2014 Yes No – Not Compiled
75% N/A
Dimension rating = D
PI-29 (M1)
Dimension Score 2016
Justification for 2016 score
29 Annual Financial Reports D+
29.1 Completeness of Annual Financial Reports
B Most of the minimum requirements of IPSAS have been complied with. AFS contains information on revenue, expenditure, financial assets and financial liabilities, although not complete
29.2 Submission pf reports for External Audit
B The consolidated annual financial statements (2015/2016) were submitted to OAG within 5 months of the financial year (31 August 2016)
29.3 Accounting Standards D It is only in 2015/2016 that both ministries and consolidated financial statements were more IPSAS compliant. Accounting standards have not been consistently applied for the last three years
Ongoing reforms
PFM Reform Project – Implementing IPSAS Cash Basis

93
Pillar VII. External scrutiny and audit
PI-30 External Audit
This indicator assesses the quality of the external audit in terms of the scope and coverage
of the audit, adherence to appropriate audit standards (including independence of the
external audit institutions). The timeliness of submission of audit reports to the legislature is
also important in ensuring timely accountability of the executive to the legislature and the
public, much as it is for a timely follow up of the external audit recommendations. The
assessment covers the central government institutions including all agencies and extra-
budgetary funds (where they exist) and focuses on the last 3 financial years, FY2013/2014;
2014/2015; 2015/2016. It is important to note that the 2014/2015 audit report has been
finalised by the OAG and submitted to the Minister of Finance in accordance with the PFMA
Act; this is yet to be made public since the Minister of Finance as provided for by the law has
not tabled it in parliament
The regulatory framework that determines the mandate and requirements for the OAG is as
follows:
• Public Financial Management and Accountability Act, Act 12 of 2011;
o Sections 35 and 37 to audit the consolidated annual financial statements of
the GoL;
o Section 39 to audit the annual financial statements of local authorities;
o Section 45 to audit the annual financial statements of public enterprises;
• Audit Act, Act 12 of 1973. The year(s) under PEFA review were all audited under the
old 1973 Act;
• New Audit Act 2016 (yet to be operationalised), the implementation date of the act
was postponed to 01 April 2017 );
• International Standards for Supreme Audit Institutions (INTOSAI).
The OAG (SAI) is responding to the Accountant General as it submits the annual GoL
financial statements which resulted in the combined 3-year period 2010-2013 audited and
reported on 26 February 2014 (adverse audit opinion) and the 2013/14 reported 20 February
2015 (adverse opinion). The audit reports for both 2014/15 and 2015/16 have not yet been
tabled or released.
Of significance, for the assessment of this indicator is the fact that the OAG only needs to
issue a report (opinion) on the consolidated annual financial statements and secondly, that
there is a significant delay in tabling Audit Reports in Parliament. The OAG (SAI) is affiliated
to AFROSAI-E that promotes annual self-assessments through the Capacity Building
Framework (CBF). The results of these assessments as published and are illustrated in
graph 30.1. In terms of the assessments, the Lesotho SAI remains in the bottom quartiles in
most of the indicators amongst the 26 countries assessed.
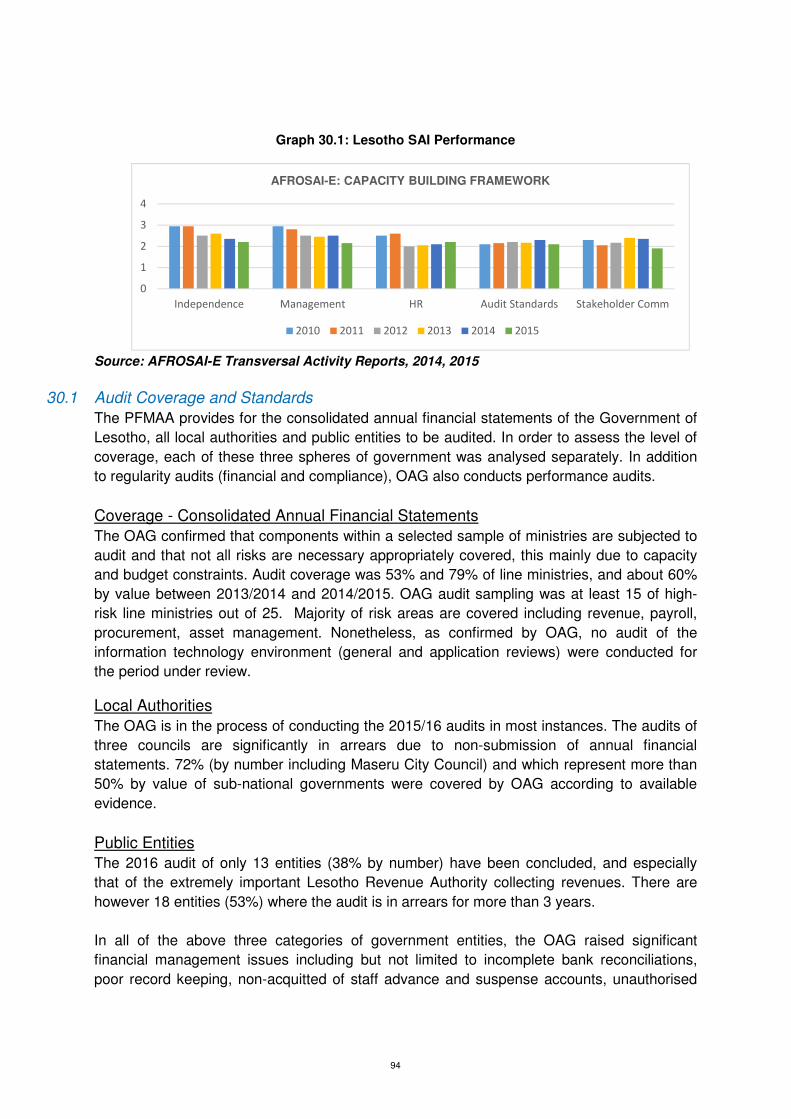
94
0
1
2
3
4
Independence Management HR Audit Standards Stakeholder Comm
AFROSAI-E: CAPACITY BUILDING FRAMEWORK
2010 2011 2012 2013 2014 2015
Graph 30.1: Lesotho SAI Performance
Source: AFROSAI-E Transversal Activity Reports, 2014, 2015
30.1 Audit Coverage and Standards
The PFMAA provides for the consolidated annual financial statements of the Government of
Lesotho, all local authorities and public entities to be audited. In order to assess the level of
coverage, each of these three spheres of government was analysed separately. In addition
to regularity audits (financial and compliance), OAG also conducts performance audits.
Coverage - Consolidated Annual Financial Statements
The OAG confirmed that components within a selected sample of ministries are subjected to
audit and that not all risks are necessary appropriately covered, this mainly due to capacity
and budget constraints. Audit coverage was 53% and 79% of line ministries, and about 60%
by value between 2013/2014 and 2014/2015. OAG audit sampling was at least 15 of high-
risk line ministries out of 25. Majority of risk areas are covered including revenue, payroll,
procurement, asset management. Nonetheless, as confirmed by OAG, no audit of the
information technology environment (general and application reviews) were conducted for
the period under review.
Local Authorities
The OAG is in the process of conducting the 2015/16 audits in most instances. The audits of
three councils are significantly in arrears due to non-submission of annual financial
statements. 72% (by number including Maseru City Council) and which represent more than
50% by value of sub-national governments were covered by OAG according to available
evidence.
Public Entities
The 2016 audit of only 13 entities (38% by number) have been concluded, and especially
that of the extremely important Lesotho Revenue Authority collecting revenues. There are
however 18 entities (53%) where the audit is in arrears for more than 3 years.
In all of the above three categories of government entities, the OAG raised significant
financial management issues including but not limited to incomplete bank reconciliations,
poor record keeping, non-acquitted of staff advance and suspense accounts, unauthorised

95
expenditures, poor asset management including non-existence of fixed assets register,
among others
Dimension rating = C
30.2 Submission of Audit Reports to Legislature
The most significant component when conducting the assessment is that of the Central
Government of Lesotho and it should be noted that GoL reports of Local Authorities and
Public Entities are not tabled in Parliament. As discussed in dimension 30.4, the Auditor
General submits its reports to the Minister of Finance in terms of the PFMAA (section 37)
and it is the Minister's responsibility to table the report in Parliament. Table 30.1 below
outlines date of submission of audit reports to parliament
Table 30.1: Schedule of date of receipts of Audited Reports by Parliament
Financial Period AFS approval date Audit Report Date Date Tabled
2010/2013 (3 years) 01 October 2013 26 February 2014 April 2015 FY2013/2014 December 2014 (Revised) 20 February 2015 May 2016 FY2014/2015 31 August 2015 Not Issued by MoF Not Tabled FY2015/2016 31 August 2016 Not Issued Not Tabled
Dimension rating = D
30.3 External Audit Follow-Up
The executive provides formal responses to OAG audit queries. Scrutiny of the management
letters indicates that auditees respond in some instances (not all) to findings giving
undertakings on how to address findings. The delays in submitting consolidated financial
statements and eventually issuing the audit reports as is evident for the period under review,
limits the opportunity to address the audit findings effectively and timely so that better audit
outcomes can be achieved. It was also confirmed that there is no formal written plan
formulated (for example “Audit Intervention Plans”) by ministries to ensure that timeframes
and responsibilities are allocated to activities in order to address weaknesses and incidents
of non-compliance.
Dimension rating = C
30.4 SAI Independence
The prevailing regularity framework provides for the Auditor General to submit its audit
reports to the Minister of Finance but not directly to Parliament. In addition, the OAG staff is
recruited through the Public Services Act and not independently. A new Audit Act of 2016,
was gazetted but is not yet implemented, as it appears it is not aligned to the Constitution
and PFMAA. Further delays in implementing the new Audit Act affect OAG's independence.
Table 30.2 illustrates the current status of OAG's independence according to INTOSAI
standards.

96
Table 30.2: Independence of SAI in relation to INTOSAI standards
INTOSAI Standards Adherence of External Audit Practices to INTOSAI Standards
AG Independence i.e. Appointment, Termination, Salary
The Auditor General is appointed by the King with advice from the Prime Minister in terms of the Constitution Article 142. The Constitution guarantees AG's tenure in office until retirement age. The Constitution does not prescribe the terms of remuneration of the AG
Financial Independence of OAG and Staffing Arrangements
The OAG is funded through the national budget process and recruit its staff through the legal framework provided for public services. This has two implications i.e. budget constraints to increase capacity and prescribed salary scales that prevent the OAG to attract skills and experience.
Access to Public Records In terms of the PFMAA the OAG has access to all records. During discussion held with the AG, it was confirmed that there were no incidents where any restrictions was placed on the OAG.
Independence in Preparation of Annual Audit Work Plan
The OAG is responsible for preparing its Annual Work Plan independently from ministries, parliament or parliamentary committees for example the PAC.
Dimension rating = D
PI-30 (M1)
Dimension Score 2016
Justification for 2016 score
30 External Audit D+ 30.1 Audit Coverage and Standards C OAG audits cover the consolidated financial
statements and majority of line ministries, highlighting significant financial issues. International standards have been applied to a limited extent
30.2 Submission Of Audit Reports To The Legislature
D Significant delays of more than 10 months occur in submitting audit reports to parliament
30.3 External Audit Follow-Up C The executive provides formal responses to OAG audit queries requiring remedial action
30.4 SAI Independence D The independence of the OAG is compromised through the prevailing regulatory framework prescribing reporting through the MoF. Also, MoF approves OAG budget. OAG staffing is through the Public Service Scheme
Ongoing reforms
New Audit Act, 2016 passed awaiting regulations
PI-31 Legislative Scrutiny of Audit Reports
This indicator focuses on legislative scrutiny of the audited financial reports of Central
Government, including institutional units; with reference to the extent that either (a) they are
required by law to submit audit reports to the legislature, or (b) their parent or controlling unit
must answer questions and take action on their behalf. It has four dimensions that focus on
the timing of audit report scrutiny, hearings conducted on audit findings, the legislature’s
recommendations on the audit, and the transparency of the legislative scrutiny of audit
reports. The assessment of the first dimension is based on the audit reports submitted to
legislature within the last three years, while the assessment of the other dimensions is based
on the last 12 months.
Of significance when assessing this indicator is to note that the Westminster System of
Government is used and that the following regularity framework applies specifically to the
Public Accounts Committee i.e.
• The Constitution of Lesotho, 1993, section 81(1);

97
• The Parliamentary Powers and Privileges Act 1994, Act No 8 of 1994, sections 9 and
10;
• The Standing Orders No 77(1); 95, 97(5) and 105(1);
• International Best Practices Guidelines issued by APAC, AFROPAC and
SADCOPAC;
• The Public Financial Management and Accountability Act, Act 12 of 2011; and
• The Treasury Regulations 2014.
The Public Accounts Committee (PAC) is responsible for parliamentary scrutiny of OAG
Reports. The PAC is a sessional Committee of the National Assembly (the committee is
reconstituted for each parliamentary session. This is unlike the Portfolio Committees, which
continue until the next General Election). The Committee has power, according to the
Parliamentary Powers and Privileges Act 1994, to summon persons and to require the
production of any documents and records. The duties and responsibilities are derived from
the Standing Orders.
The overall effectiveness of the oversight function and impact on budgetary outcomes are
severely compromised by the lapse of time between the end of the Financial Year under
review and the date of the actual hearing. For the period under review for the 2016 PEFA
Assessment, only one report was issued for the hearings held February 2014, focusing on
the 2008/09 Financial Year. The PAC made 379 recommendations.
Audit reports for Local Authorities and Public Entities are not tabled in Parliament but the
PAC has the authority to consider the audit findings when conducting hearings on the
relevant ministries.
31.1 Timing of Audit Report Scrutiny
The OAG issued a “combined” Audit Report for the three years 2010/11; 2011/12 and
2012/13 on 26 February 2014, with hearings conducted in May 2016. Cognizance should be
taken of the delays in tabling audit reports in Parliament as assessed under PI 30.2. These
delays have a significant impact on the effectiveness of any oversight function aimed at
monitoring and improving public financial management and budget oversight.
Dimension rating = D
31.2 Hearings on Audit Findings
There is no Charter in place that sets out the process for the PAC when conducting their
business. In the PAC Report following the hearings on the 2008/09 audit findings, section 4
sets out the approach that was actually adopted. This approach does not refer to, or include
a process or opportunity for consultation with the OAG. However, OAG is in most cases
consulted prior to PAC review of audit reports. Based on the PAC Report it is evident that in-
depth hearings were held. In many instances, the hearings refer to sources other than the
audit reports. A comprehensive set of 379 recommendations was compiled following the
hearings based on the 2008/09 OAG and other findings. Nonetheless, the significant time
delay impacts negatively on the good work done.
Dimension rating = D

98
31.3 Recommendations on Audit by the Legislature
The most recent recommendations are those made on the 2008/09 Financial Year, hearings
held February 2014. However, there is no evidence that the PAC Report was tabled in
Parliament. Based on discussion at Ministries, no formal recommendations were received.
Dimension rating = D
31.4 Transparency of Legislative Scrutiny of Audit Reports
Hearings are not held in public and reports are not published for public scrutiny at least for
the last three completed fiscal years 2013/2014, 2014/2015, and 2015/2016. Members of the
public can however obtain copies of PAC reports (prior years - the latest relates to
2008/2009) at the PAC Secretariat at reasonably low cost.
Dimension rating = D
PI-31 (M2)
Dimension Score 2016
Justification for 2016 score
31 Legislative Scrutiny of Audit Reports
D
31.1 Timing of Audit Report Scrutiny D The legislature (Public Accounts Committee) has not conducted reviews of OAG audit reports for the last three completed fiscal years. PAC is still reviewing 2013/2014 audit reports
31.2 Hearings on Audit Findings D Even though PAC hearings include summoning chief accounting officers and senior staff, the last review is for FY2013/2014 which is still ongoing
31.3 Recommendations on Audit by the Legislature
D PAC is still conducting hearing related to 2013/2014 OAG audit reports; it is more than 24 months behind schedule
31.4 Transparency of Legislative Scrutiny of Audit Reports
D PAC hearings exclude public attendance. The PAC report, for the last three completed fiscal years 2013/2014, 2014/2015, and 2015/2016 is not published on a website neither are they available for purchase at reasonably low cost.
Ongoing reforms External consultant intervention and advisory services
99
4 Conclusions of the analysis of PFM systems
4.1 Integrated Assessment of PFM Performance
Budget Reliability
The budget is not credible as far as expenditure budgeting is concerned. Actual budget
outturn compared to originally approved budget deviated more than 15% in two of the last
three completed Fiscal Years. Actual deviations were 1.1% in FY2013/2014, 25.9% in
FY2014/2015, and 31.3% in FY2015/2016. Even though not directly comparable with 2012
Assessment, it is clear that there has been budget overruns during the assessment period.
Officials of MoF have indicated ex-post supplementary budget approvals by the legislature
but no Supplementary Appropriations Acts were created in support of these increases. The
situation is worse when it comes to administrative and economic budget reallocations;
variations were as high as 37.9% and 68.4% for administrative and economic classifications
respectively. That said, the government has respected the use of contingency reserves since
2012, which was below 3% of total actual expenditure; actual contingency use averaged
0.7%
Revenue budgets on the other hand have been credible at the aggregate levels with
variances between original budget and actual outturn ranging between 94% and 112%.
Composition variance, which examines deviations in the type of revenues, has been
satisfactory, at 15% of original budget. Even though not directly comparable, it is fair to
conclude that performance of revenue budgeting has remained unchanged since 2012.
Transparency of Public Finances
Budget formulation, execution and reporting are based on administrative and economic
classification using GFS 2001 standards; at present, COFOG is not yet applied and this has
been the case since 2012. Information included in budget documents has improved
marginally. The introduction of citizens' budget, as part of transparency framework, in 2016 is
commendable. The budget contains forecast of fiscal deficit, previous year's budget outturns,
consistent budget estimates, and aggregation and detailed presentation of budget estimates
for both revenues and expenditures. However, both budget estimates and financial reports
since 2012 have not comprehensively captured all Central Government revenues for both
donor-financed projects and non-tax revenues; it is estimated that non-tax revenues outside
the budget (and financial reports) amounts to at least 9.4% of total government domestic
revenues (excluding grants).
Whilst there are simple and clear rules for sub-national transfers, they exist without
Parliamentary approval. The most challenging issue with sub-national transfers is the
significant delays and unreliability of transfers, especially with capital grants, thereby
negatively affecting investment project implementation. Service delivery benchmarks are not
clearly identified, and are likewise not published. Monitoring and reporting on resources
received by frontline service delivery units is poor and non-existent apart from monitoring and
100
evaluation of the PPP arrangement in the health sector which covers about 50% of total
health delivery; the educational sector is seriously lagging behind.
Public access to fiscal information is very limited; apart from bidding opportunities advertised
in weekly newspapers. Information on contracts awards and resolution of procurement
complaints are not publicised. In-year budget reports are posted on the website, but
significantly late. Annual budget documents are available to the public at moderate cost.
Annual financial statements (both audited and unaudited) experience significant delays in
publishing.
Management of Assets and Liabilities
At the centralised level, the Private Sector Development (PSD) Department within MoF is ill-
capacitated to effectively monitor fiscal risk from public entities and parastatals; it receives no
financial statements (audited and unaudited) from State Owned Enterprises (SOEs) and
parastatals.
At the decentralised level (Line Ministries), the situation is almost the same; monitoring of
public entities is non-existent. The Office of the Accountant General is responsible for
recording and reporting contingent liabilities; it does this in a very limited way. Whilst some
explicit guarantees are recorded and reported, there is no information on implicit contingent
liabilities. In addition, the Government has no idea on the contingent liabilities that could arise
out of the ongoing PPP arrangements.
Monitoring of sub-national governments is poor. However, there has been some
improvements in recent months thanks to an EU funded project known as the "Deepening
Decentralisation Programme (DDP)", which has compelled District Councils to prepare
Annual Financial Statements. The management and monitoring public (capital) investment
projects is robust and well-coordinated by the Ministry of Development Planning, except that
economic analysis of investment projects and evaluation (completion) reports are not
published but for donor-financed projects which are mandatory.
Public Assets Management is non-existent; Line Ministries have no Fixed Assets Register let
alone a centralised Fixed Assets Register. There are rules on fixed asset disposal but these
are rarely respected. Information on equity investments is scanty; it fails to provide very
important details such as number of equity shares as well as cost per equity.
Whiles the debt management (recording and reporting) is comprehensive, at present, it is
incomplete due to failure to record and report on PPPs. Again, there is no formalised (and
internal) debt management strategy apart from IMF-led debt strategies during Article IV
consultations.
Policy-Based Fiscal Strategy and Budgeting
Macro-fiscal forecasting is satisfactory but it has very little impact on MTEF; sensitivity
analyses are undertaken but are not properly documented or utilized in order to guide policy
decisions going forward. The GoL prepares estimates of the fiscal impact for some, but not
all, proposed changes in revenue and expenditure policy for the budget year. Both the
101
Budget Strategy Paper and Call Circular reflect changes in fiscal strategy but neither of these
pieces of documentation are circulated to Parliament.
Reporting on fiscal performance is scanty; this is usually contained in the quarterly budget
bulletin. MTEFs exist on paper but are meaningless as far as medium-term budgeting is
concerned; as each year the budget formulation and preparation processes begin afresh with
no link to previous year's estimates in the MTEF. Guidance to budget preparation is
satisfactory; the budget calendar is clear and simple but provides very little time for Line
Ministries to complete their annual estimates once MoF releases the approved budget
ceilings. Budget ceilings are not respected, resulting in huge budget cuts.
Clear rules exist for Legislative Scrutiny and approval of budget estimates and are respected.
The procedures include public consultations. Legislative approval of the budget was delayed
in 2015/2016 due to political elections; otherwise, approvals occur before the beginning of
the new Fiscal Year in time for budget execution. Rules for in-year budget amendments
(supplementary appropriations) are clear but these rules allow for extensive administrative
reallocations; legislative approvals for these reallocations and amendments are ex-post.
Predictability and Control in Budget Execution
Tax revenue administration is good in terms of providing taxpayer information on tax liability;
the Client Service Department of LRA assists taxpayers on their tax obligations; a recent
introduction is the toll free client service telephone facility. Tax Identification Numbers (TINs)
are automatically generated for taxpayers but at present there is no unique national ID
system in Lesotho, TINs are generated using driver licenses and passports.
Information on non-tax revenue is very limited; there is currently no dedicated Non-Tax
Revenue Unit within the MoF to coordinate and monitor non-tax revenue budgeting and
collection. The Office of Accountant General performs the back-end function of recording and
reporting non-tax revenues. Revenue risk management is still undeveloped; it needs to be
upgraded to effectively track tax evasion. Tax audits are compiled but case selection
management is still manual and could be compromised. The understanding is that efforts are
underway to automate case selection for efficiency. Even though tax arrears are below 20%
of total tax collections, they are increasing year-on-year and as such must be monitored and
collected on time to reduce the incidence of bad debt.
The estimated that non-tax revenue loss is approximately 9.4% or more when compared to
total domestic revenue since not all is collected and properly accounted for. Transfers of tax
revenue to the treasury is weekly, through commercial bank accounts operated by LRA;
there is no doubt that government is losing revenue to commercial banks who are trading
with Government Cash. Daily transfers will be ideal or operating a centralised revenue
account with CBL will reduce revenue losses to government
Consolidation of government cash balances does not take place. Cash flow projections are
not prepared; where they exist, they are neither monitored nor updated. Expenditure
commitment ceilings are satisfactory; they are issued quarterly to budget entities for
expenditure commitment. By law, budget virements are allowed up to 20% and 10% for
recurrent and capital expenditure for programmes within votes at the level of Chief
102
Accounting Officers; any excess requires the approval of the Minister of Finance. The biggest
drawback is the fact that the law fails to limit the level of additional virements at the level of
the Minister of Finance.
Monitoring and reporting of expenditure arrears have begun since 2015/2016 but it is not
comprehensive as it fails to report on expenditures outside IFMIS. Payroll controls are
extremely weak; establishment controls are poor; the most alarming is the use of casualty
returns for change of Personnel and Payroll Records which remains unprocessed between
three to nine months, thereby resulting in payment of 'ghost employees'. Procurement
management is still a challenge; the entire process is opaque. Apart from advertisement of
bidding opportunities in the newspapers, Contract Awards are not published. The
procurement legal framework allows for redress but the Private Sector is of the view that it
provides very little confidence for remedy.
The general internal control framework is weak. Processes for non-salary expenditure are
clearly defined for purposes of segregation of duties; however, compliance remains a
challenge. The use of simplified processes to circumvent the rules is prominent leading to
expenditure arrears outside IFMIS. Internal audit functions are widespread across line
ministries, but their efficacy leaves much to be desired; periodic reports are not produced;
very little international standards are observed.
Accounting and Reporting
Reconciliation of bank statements, those managed by the Treasury and Line Ministries'
commercial bank accounts have huge backlogs of more than 12 months; Available evidence
with statistical computation suggests that only 1.9% (in value) of Central Government bank
accounts are fully reconciled until March 2016. Therefore, this significantly affects data
quality. Huge suspense and advance accounts have not been reconciled as far back as
2009/2010.
The use of IFMIS leaves an audit trail, with sufficient passwords for authorised users
necessary to guarantee financial data integrity process. However, prior years' are not closed
within IFMIS, which then allows retrospective data entry. In-year budget execution reports
are compatible with original budget classifications and allow for easy statistical analysis.
Whiles IFMIS is capable of generating real-time financial information, quarterly reports are
produced between 3 to 4 months after end of preceding quarter.
For the first time in 2015/2016, Line Ministries prepared Annual Financial Statements
partially compliant with IPSAS cash, likewise consolidated Annual Financial Statements.
Annual Financial Reports were prepared and submitted within 5 months to the Office of the
Auditor General.
External Scrutiny and Audit
The independence of the Office of the Auditor General is severely compromised due to its
inability to recruit its own staff, but rather through the Public Services Commission/ Ministry
of Public Service, the consequence of which is poor remuneration and fringe benefits to
attract very competent skilled labour. Again, the MoF determines the Office's Budget. A new
103
Audit Bill has been passed awaiting the necessary regulatory framework; this is expected to
provide some leverage to the OAG to improve independence.
Whilst OAG undertakes its annual financial audits largely compliant with INTOSAI standards,
the current legal framework does not permit submission of Audited Financial Reports directly
to the legislature. The consolidated Audit Reports are submitted to the Minister of Finance
who in turn submits these reports to the National Assembly even though OAG completes its
audits within three months. For this reason, the Audit Reports for 2014/2015 have been
completed and submitted to the Minister of Finance but they are yet to be tabled in the
legislature. At present, performance audits are carried out but not ICT audits due to lack of
capacity. The executive provides formal responses to audit queries; however very little is
done with recommended remedial actions.
The legislature, over the last three completed fiscal years, has not reviewed Audit Reports
related to these periods. It is still reviewing reports up to 2013/2014. PAC hearings do not
provide for public participation; that said, government officials are summoned for hearing.
4.2 Effectiveness of the Internal Control Framework
Control Environment
The Internal Control Framework was strengthened by introducing the Treasury Regulations
2014 (28 March 2014) in support of the PFMAA by including sections 10 and 11 on Internal
Control activities. The PFMAA (Sections 1(a) and 2(g)) makes it the responsibility of both the
Minister and Chief Accounting Officer to implement and maintain sound systems of internal
control. The Auditor General however continuously reports on such a high degree of non-
compliance to the framework that it cannot rely on the effectiveness of internal controls when
conducting audit assignments.
International standards and best practices have been designed serving as a benchmark for
governments, the most relevant and appropriate being: • the COSO (Committee of Sponsoring Organisations of the Treadway Commission)
Internal Control – Integrated Framework
• the INTOSAI GOVERNANCE - 9100 – Guidelines for Internal Control Standards for
the Public Sector
One significant issue of non-compliance that could have addressed weaknesses is the
absence of an Audit Committee steering Internal Audit activities as provided for in TR11. The
impact and effectiveness of the Internal Audit Unit is severely compromised contributing to
the poor state of affairs pertaining to financial management and more specifically the
weaknesses in internal controls.
The time lag (periods) between the end of a financial year and eventual tabling of resolutions
and recommendations by the Public Accounts Committee to Parliament is of concern. The
Assessment Team was unable to establish to what extent recommendations are
implemented by relevant Ministries. Further, there is no evidence following up on these
recommendations by oversight structures and processes such as audit and portfolio
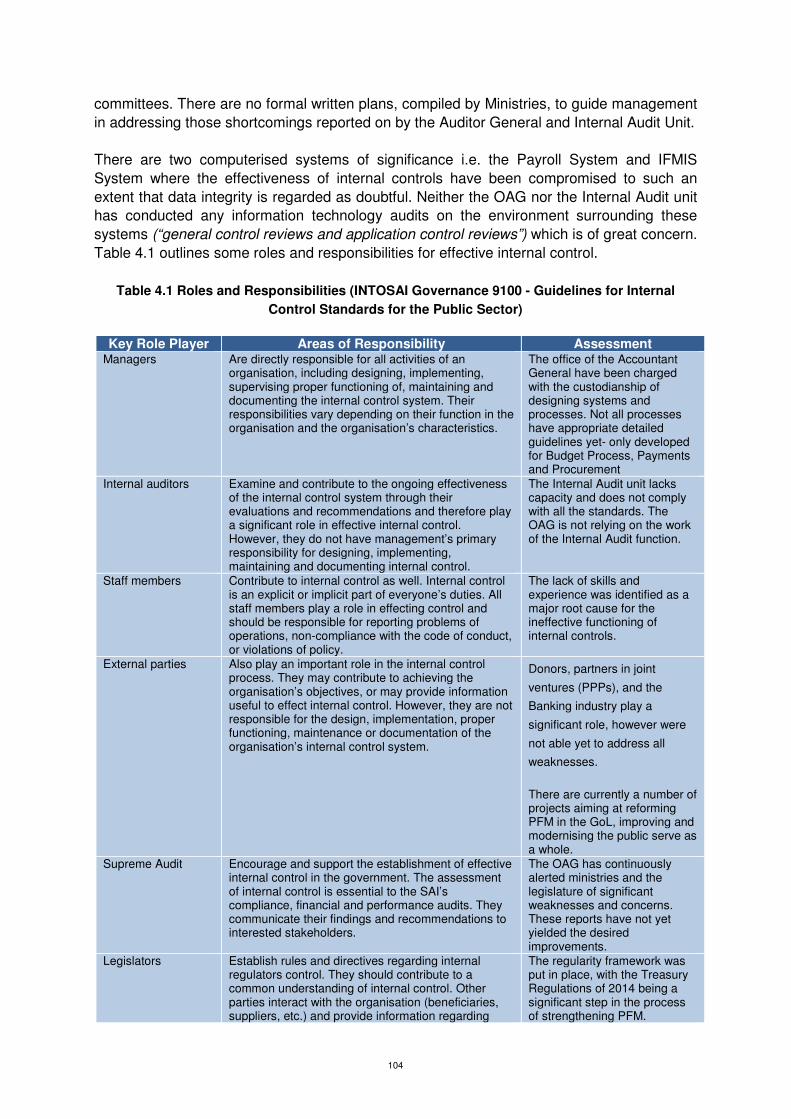
104
committees. There are no formal written plans, compiled by Ministries, to guide management
in addressing those shortcomings reported on by the Auditor General and Internal Audit Unit.
There are two computerised systems of significance i.e. the Payroll System and IFMIS
System where the effectiveness of internal controls have been compromised to such an
extent that data integrity is regarded as doubtful. Neither the OAG nor the Internal Audit unit
has conducted any information technology audits on the environment surrounding these
systems (“general control reviews and application control reviews”) which is of great concern.
Table 4.1 outlines some roles and responsibilities for effective internal control.
Table 4.1 Roles and Responsibilities (INTOSAI Governance 9100 - Guidelines for Internal
Control Standards for the Public Sector)
Key Role Player Areas of Responsibility Assessment
Managers Are directly responsible for all activities of an organisation, including designing, implementing, supervising proper functioning of, maintaining and documenting the internal control system. Their responsibilities vary depending on their function in the organisation and the organisation’s characteristics.
The office of the Accountant General have been charged with the custodianship of designing systems and processes. Not all processes have appropriate detailed guidelines yet- only developed for Budget Process, Payments and Procurement
Internal auditors Examine and contribute to the ongoing effectiveness of the internal control system through their evaluations and recommendations and therefore play a significant role in effective internal control. However, they do not have management’s primary responsibility for designing, implementing, maintaining and documenting internal control.
The Internal Audit unit lacks capacity and does not comply with all the standards. The OAG is not relying on the work of the Internal Audit function.
Staff members Contribute to internal control as well. Internal control is an explicit or implicit part of everyone’s duties. All staff members play a role in effecting control and should be responsible for reporting problems of operations, non-compliance with the code of conduct, or violations of policy.
The lack of skills and experience was identified as a major root cause for the ineffective functioning of internal controls.
External parties Also play an important role in the internal control process. They may contribute to achieving the organisation’s objectives, or may provide information useful to effect internal control. However, they are not responsible for the design, implementation, proper functioning, maintenance or documentation of the organisation’s internal control system.
Donors, partners in joint
ventures (PPPs), and the
Banking industry play a
significant role, however were
not able yet to address all
weaknesses.
There are currently a number of projects aiming at reforming PFM in the GoL, improving and modernising the public serve as a whole.
Supreme Audit Encourage and support the establishment of effective internal control in the government. The assessment of internal control is essential to the SAI’s compliance, financial and performance audits. They communicate their findings and recommendations to interested stakeholders.
The OAG has continuously alerted ministries and the legislature of significant weaknesses and concerns. These reports have not yet yielded the desired improvements.
Legislators Establish rules and directives regarding internal regulators control. They should contribute to a common understanding of internal control. Other parties interact with the organisation (beneficiaries, suppliers, etc.) and provide information regarding
The regularity framework was put in place, with the Treasury Regulations of 2014 being a significant step in the process of strengthening PFM.
105
achievement of its objectives.”
Risk Assessment Through TR (section 10(b)) chief accounting officers are charged with the responsibility of
appropriate risk management. There is currently no formal process that enables an
appropriate assessment of the risk maturity level as there is no proof that any of the generic
risk management steps have been implemented i.e. • Risk Identification
• Risk Evaluation
• Assessment Of The Risk Appetite Of The Organisation;
• Development Of Responses
In designing an internal control system, it is important that the control activity established is
proportionate to the risk. Fundamental to risk assessment is an ongoing, iterative process to
identify changed conditions (risk assessment cycle) and take actions as necessary. Risk
profiles and related controls have to be regularly revisited and reconsidered in order to have
assurance that the risk profile continues to be valid, that responses to risk remain
appropriately targeted and proportionate, and mitigating controls remain effective as risks
change over time.
Control Activities
The high degree of manual processes and use of documents require specific internal control
activities but which have been compromised. Bank Reconciliations, in a cash-base
accounting framework, is of such significance to ensure completeness and accuracy of the
financial records reported on, effective internal control and timely reporting, have an alarming
backlog of more than 12 months. Fixed Asset Registers are not maintained resulting in a
high risk that government property is not safeguarded, that all losses are timely reported and
investigated and that financial records are accurate. It is of concern that chief accounting
officers are not reviewing and following up on these backlogs.
It is only the payroll for public servants that are informed by an approved establishment and
with monthly payroll certification that is done after date of payment, controls are regarded as
ineffective. The manual system of using Casualty Returns to effect changes to the electronic
payroll has no audit trail to track timely and accurate processing of approved changes and as
such, the integrity of the payroll is doubtful. A pilot project on physical verification of
employees was conducted in 2014 with limited success but the absence of a comprehensive
and frequent verification procedure is a significant shortcoming.
Ministries have confirmed that the lack of capacity is one of the main root causes for not
maintaining effective internal control systems. There is inadequate segregation of duties
due to high vacancy rates experienced in comparison to approved organisational structures
for the finance and administration sections. The filling of posts is incomplete due to budget
constraints. A lack of skills and experience, specifically pertaining to financial management,
contributed to the ineffective functioning of internal control measures and procedures.
The Auditor General in its reports refers to the changing in comparative figures in the
financial statements. This is mainly due to allowing ministries access to prior financial years
for purpose of processing backdated transactions.

106
Performance management at ministry level is not working. The Ministry of Public Services
highlighted the fact that the individual performance management framework is not yet in
place and as such, performance-based incentives are automatically rewarded annually to all
employees.
Information and communication There is a significant doubt over the integrity of information. Both the payroll and financial
accounting system are deemed as not being up to date, accurate and complete. This
severely limits the level of making informed decisions and accuracy of reporting. The
significant delay for reporting on audited financial statements and oversight functions limits
the effectiveness of the entire internal control framework.
Information and communication machinery of central government leaves much to be desired;
information requests between departments and across Line Ministries are painfully slow;
there is no urgency in providing up-to-date information. Most, if not all line ministries have
serious internet challenges, to the extent that most government employees are forced to use
their personal email addresses for official internet communication since government internet
facilities cannot be trusted. In this modern era of ICT, Government websites are functioning
badly or not at all; therefore, obtaining useful government information electronically is very
difficult.
Monitoring
The significant delay in tabling the OAG findings and subsequent issuing of the PAC
resolutions and recommendations has a severe detrimental impact on the effectiveness and
efficiency of the monitoring and evaluation of audit findings. Ministries have not compiled
formal written plans to address audit findings which can be monitored and the impact or
success (rate of achievement) measured, evaluated for redress or change of strategies.
Internal monitoring, in terms of Chief Accounting Officers, is weak. Internal audit functions
provide very little to assure quality monitoring function. Most ministries have no dedicated
M&E units; the planning units perform this function
Significant revenue and expenditure (at least 9.4% of total domestic revenue) are processed
outside government budget; these are from non-tax government revenues as well as donor-
financed projects. Fiscal risk is very high to the extent that government has no idea of its
implicit and explicit contingent liabilities; monitoring of SOEs and parastatals is almost non-
existent. Whiles there control over management and selection of capital investment projects;
budget constraints hinder their successful implementation and maintenance. The
management of central government financial and non-financial assets is extremely poor.
There is some level of debt management strategy but this does not include PPPs, which are
high-risk areas. MTEF exists on paper but so far irrelevant to the entire fiscal forecasting and
budgeting process. Administration of domestic tax revenues is relatively strong; however, the
risk management environment is poor leaving room for tax evasion. Even though tax revenue
arrears are below 20% of total tax collections, they need to be monitored since they are
increasing overtime. Cash management and expenditure arrears management are of
concern. There is no framework for consolidating Central Government cash balances on a
periodic basis. This is the same situation for the stock of expenditure arrears, especially
those occurring outside IFMIS. Payroll controls are weak, likewise procurement
management.
107
4.3 PFM Strengths and Weaknesses
This section assesses the extent to which the PFM system, as measured by the performance
indicators, constitutes an enabling factor for achieving the planned fiscal and budgetary
outcomes that encompass aggregate fiscal discipline, strategic allocation of resources, and
efficient use of resources for service delivery.
Aggregate Fiscal Discipline
Aggregate fiscal discipline requires that the budget be delivered as planned, with effective
systems for ensuring financial compliance by all staff engaged in PFM activities. The PFM
functions that are focused on compliance must work well as measured by relevant PFM,
performance indicators. The most relevant of these indicators and their assessment results
indicate that compliance and fiscal discipline at the component level are inadequate, and that
performance needs significant changes to improve financial management systems that
support accounting and reporting:
• In-year control of spending. PI-1 (aggregate expenditure outturn) rated “D” and PI-2
(expenditure composition outturn) rated “D+”, implying a need for better information
systems to support control and provide budget reliability and credibility, and more
consistent and integrated reporting frameworks.
• In-year control of revenue. PI-3 Dimension 1 (aggregate revenue outturn) rated “B”,
but PI-3 Dimension 2 (revenue composition outturn) rated “C”, demonstrating a
problem for the individual taxes in that the collections do not match expectations at
disaggregated level
• Timely accounting and reporting. PI-27 (financial data integrity) rated “D+” and PI-28
Dimension 2 (timing of in-year budget reports) rated “D”, both poor results that put
into question management capacity to exercise control over bank accounts and
expenditures through the year, in addition the management and acquittal of suspense
and advance accounts . PI-29 (annual financial reports) rated “D+”, taken overall
these results demonstrate the urgent need for improvement in basic accounting
systems that operate more effectively and with proper audit trails and reconciliations
so that expenditure can be managed in accordance with budget intentions. However
there is marginal improvement in submission of annual financial statements by sub-
national government thanks to the EU funded Deepening Decentralisation
Programme (DDP). Improved accounting and reporting is also needed to remedy the
present situation where reports for several years from the Auditor General have given
qualified opinions on annual financial statements.
• Central control over cash. PI-21 Dimension 1 (consolidation of cash balances) rated
“D”, and PI-21 Dimension 2 (cash forecasting and monitoring) rated “D”, are poor
results, indicating probable higher borrowing costs and loss of interest but also
making the planning of government spending difficult .
• Adequate internal controls. The indicator for payroll controls, PI-23 is rated “D”
indicating that the controls are deficient or not working at all for salary spending which
is a large part, 34,7%, of the government budget 2015/16. For non-salary expenditure
controls, the overall rating is “C+”, indicating that the control framework as such is in
place but is not providing appropriate control. Internal audit functions are weak
108
leading to overall weakness in financial management (PI-26 rated D+). Of major
concern is the management and control of expenditure arrears (PI-22 rated D+);
whiles some effort has been made to report on expenditure arrears, they are not
comprehensive particularly with those outside IFMIS
• Adequate external controls. PI-30 (external audit) rated “D+” with an important
deficiency in reporting. Dimension 2 (Submission of audit reports to the legislature) is
rated “D” not because the Auditor General is late but because the report has to go to
MoF before it is submitted to Parliament. The last report was sent from the Auditor
General to the MoF within stipulated 90 days but it is still not tabled in the Parliament
150 days later, causing lack of transparency and making Parliament unable to
perform its constitutional accountability role. Dimension 4 (SAI independence) is
rated “D” as the Auditor General is not allowed to report directly to the Parliament,
neither does she have control of her staff as it is recruited on its behalf by the
Ministry of Public service under the Public Service Act. Parliamentary scrutiny of
audits reports is severely hampered by delays in tabling these reports; further lack of
executive action on both OAG and PAC reports endangers financial accountability
Strategic Allocation of Resources
Strategic allocation of resources requires planning and executing the budget to be in line with
government priorities aimed at achieving policy objectives. Some of the relevant indicators
and their ratings show that the upstream processes of budget formulation and budget
process perform fairly well but that policy objectives are too weak or undeveloped to have an
impact on the allocations in the downstream processes of in-year budget execution. In
addition, Processes are hampered by delays and deficient transparency and control:
• PI-14, PI-15 and PI-16; Policy based fiscal strategy and budgeting. Indicators for
macro-economic and fiscal forecasting, fiscal strategy and, medium-term perspective
in expenditure budgeting all score low, “D+”, “D+” and the latter with “C+”. The
Macro Department is currently developing useful analysis but it is not yet
implemented in the budget process and the budget documentation, as the forward
estimates in the budgets so far seem to be derived from incremental calculation
processes.
• Budget preparation process, PI-17, score “B” legislative scrutiny of budgets PI-18
score “C+”, showing that these processes are in place and working fairly well.
• Expenditure composition outturn. PI-2 rated “D+”, showing the final year-end result
did not deliver the resource allocation intended at the beginning of the year
• Predictability and control of the budget is showing disappointing results with the
exception of PI-19, revenue administration that obtained an overall scoring of “B”,
with strong controls. The weak scores under accounting and reporting demonstrate
the difficulty for budget managers to monitor and manage their budgets, and resource
allocation is jeopardised in these deficient structures.
• Fiscal risks, assets and liabilities are areas of concern. There are obvious and
systematic weaknesses in the systems for monitoring different risks leading to control
weaknesses and risk of considerable government losses. An exception is debt
management, PI-13, which is fairly well developed although lack of debt strategy is
giving the score of “C+”, in addition to non-recording and reporting on PPPs, which
poses significant fiscal risk to government. Economic analysis and selection of capital
project are quite robust (PI-11 rated B); however, the management of both financial
109
and non-financial assets (PI-12 rated D+) is very poor, especially with the non-
existence of fixed assets register and comprehensive equity investment listings.
Efficient Use of Resources for Service Delivery
Efficient service delivery requires that actual spending match budget allocation of resources
available for service delivery as planned, and costs are minimised. Non-compliance with the
budget may lead to a shift across expenditure categories.
The PFM system in Lesotho hampers efficient service delivery. The budget process does not
have a strong policy or strategic focus. There is not yet an applied medium-term fiscal
strategy to guide the budget process.
The most relevant indicators and their ratings show an appropriate budget development
process but inadequate performance in budget execution:
• PI-2 (expenditure composition outturn) is rated “D+”, a major concern for service
delivery as this indicator is crucial for providing the resources needed to meet the
policy intentions for the various economic sectors
• Transparent budget information. PI-4 (budget classification) rated “C”, PI-5
(comprehensive budget documentation) rated “C”, PI-8 (performance information for
service delivery) rated “D”, and PI-9 (public access to fiscal information) rated “D”.
The above indicate a general deficiency providing a good performance in delivering
on the requirement for transparency of information on public finances, except for the
recent publication of the first citizens' budget in 2016/2017.
• Policy-based budgeting with a multi-year perspective. PI-17 (budget preparation
process) is scoring “B” and PI-16 (medium-term perspective) rated “C+”, shows a
mixed result. The current budget process is able to deliver such a perspective, but it
does not have the correct tools to do the task.
• Competitive tendering processes. PI-24 (Procurement Management) rated “D”, is
demonstrating a need for an urgent total rehabilitation of the government
procurement system as both performance and controls are deficient and causing
considerable risks to the government.
Overall, these results show that the Government has strong incentives to continue and even
strengthening the PFM Reform Programme along the lines that have already been
established. Even if the challenges are considerable, there are great rewards to be reaped
in a near future. The budget development is at the core of the PFM reforms and there are
some low hanging fruits already in sight if the reform work is kept on track. Other urgent
areas are strengthening internal control and managing fiscal risk, which has the potential of
draining the government’s resources and damaging its credibility.
4.4 Performance Changes since a Previous Assessment
Table 0.1 (Executive Summary) above provides a summary of PFM performance change
since 2012 Assessment. The new PEFA Framework has 31 Performance Indicators divided
into 94 Dimensions as against the old (2011) Framework with 31 Indicators made up of 76
Dimensions. It is important to state that only 14 Dimensions are directly comparable between
the old and the new framework. Four dimensions appeared to have slipped in performance,

110
namely: Budget Classification, Quality of Debt Data Recording, Information on Expenditure
Commitment Ceilings, and Effectiveness of Expenditure Commitment Controls.
In all four cases, the assessment team opines that the 2012 assessment ratings were too
high based on the following:
• Budget Classification: This has remained unchanged since 2012; budget
Classification is based on administrative and economic categories compliant with
GFS 2001; COFOG has not been applied since 2012. The Government is working
towards GFS 2014, which will include COFOG;
• Quality of Debt Data Recording: In 2012 the team did not consider PPP in assessing
this dimension, probably because there were no ongoing PPP arrangements. In
2016, however, PPP was considered, firstly because a couple of ongoing PPP
arrangements, and secondly the non-existence of PPP Policy Guidelines and/or
Legislation;
• Information on Commitment Ceilings: Since 2012, expenditure commitments ceilings
are issued quarterly to budget entities; this has not changed;
• Effectiveness of Expenditure Commitment Controls: The 2012 Assessment ignored
commitments outside IFMIS; this practice is not new. The 2016 Assessment took
account of commitment controls both within IFMIS and outside IFMIS.
It is therefore fair to conclude that performance has remained unchanged since 2012 with
reference to the four dimensions outlined above.
Comparative analysis of 2016 assessment using the old (2011) methodology to 2012
assessment is summarised below under the three broad fiscal and budgetary outcomes;
annex 7.2 below provides detailed overview of performance changes per dimension:
Aggregate fiscal discipline: The analysis of the results points to deterioration of aggregate
fiscal discipline principally due to significant budget overruns even though revenue outturns
were close to targets. Unbudgeted increases in civil servants emoluments during the years
2014/2015 and 2015/2016 were the main contributing factor, coupled with expenditures
relating to staff capacity building initiatives. Again, huge backlogs and delays in accounts
reconciliations as a basis for monitoring budget execution contribute to fiscal indiscipline
Strategic resource allocation: Whiles expenditures out of contingency vote has been
consistently maintained within set limits, which is impressive, composition variances have
been extremely high, the impact of which is poor and ineffective resource allocation
according to original short and medium term strategic plans; this therefore defeats policy-
based budgeting intents. Comprehensiveness and transparency of fiscal information required
for proper social accountability appear to be fallen short of expectations. The existence of
IFMIS has had very limited positive impact on good financial management practices.
Procurement management has remained stagnant since 2012; nonetheless, the
establishment of independent procurement tribunal is seen as a positive step towards
transparency
Efficient service delivery across the entire government machinery has been disappointing;
there are no signs of improvement. This has been compounded by poor resource allocation
described above. There are still no mechanisms for tracking resources received by service
delivery units. Citizens have no means of verifying resources allocated to their

111
constituencies. Internal controls for both salary and non-salary expenditures has not
improved, especially so with payroll controls; payroll controls are weak leading to loss of
government resources as a result of payment of ghost workers. The general external
oversight functions of both the supreme audit institution and parliament have seen very little
or no improvements
112
5 Government Reform Process
A general process of improving PFM has been ongoing for many years in Lesotho and
interventions in the areas under consideration by the Government of Lesotho (GoL),
European Union (EU), and other donors have included:
• In 2001/ 02 the GoL launched a Public Service Improvement and Reform Programme
(PSIRP) designed to improve the delivery capacity, effectiveness, accountability and
transparency of public services. PSIRP had a three-part strategy that included:
o Improving Public Financial Management and Accountability;
o Improving service delivery through decentralisation, and;
o Improving Public Service Management.
• The second major intervention was the Capacity Building for Economic Planning
Programme (CBEP) designed to strengthen the capacity of the then Ministry of
Finance and Development Planning to improve government’s medium term
macroeconomic forecasting underpinning national development priorities.
By this time, PFM reforms were being supported by a range of Development Partners,
including the EU, the World Bank (Lesotho Institute of Accountants), Department for
International Development (DfID), United Nations Development Programme (UNDP) (Bureau
of Statistics (BoS) and M&E Framework), and the International Monetary Fund (IMF).
Concurrently with CBEP, the African Development Bank (AfDB) was implementing a similar
capacity-building programme and Irish Aid was supporting the Centre for Accounting Studies:
• This was followed by CBEPII (2008-2012) that focused on:
o Improved transparency and accountability in GOL revenue and expenditure
management;
o Development of an overarching development plan in place for the period
2012-2016;
o Strengthened capacity for planning and budgeting at national and sector
levels, and;
o Increased accuracy and reliability of National Accounts and statistical data
produced by BoS to underpin the national development planning
document/process.
Although a general process of improving PFM has been ongoing for many years the Public
Expenditure and Financial Accountability Assessment (PEFA) carried out in 2012 highlighted
and confirmed a significant number of reforms that are required to improve the effectiveness
of the overall PFM framework.
5.1 Approach to PFM Reforms
The PFM reforms are deriving their objectives from the Government of Lesotho’s overall
development programme which is guided by a long-term development framework, “Vision
2020” and the National Strategic Development Plan (NSDP) for the period 2012/13 to
2016/17. The NSDP sets out the strategies and means for realising the aspirations set out in

113
the Vision. The GoL in general and the Ministry of Finance (MoF) in particular have adopted
(in February 2013) an overarching multi donor-funded PFM Reform Action Plan covering the
Financial Years 2012/13 – 2017/18. The overall PFM Reform Action Plan is a wide-ranging
but interrelated approach to PFM reforms. The Development Partners have endorsed this
approach through committing, individually and jointly, to supporting GoL’s initiatives.
A number of Development Partners (DP) finance the PFM Reform Action Plan. However, the
Action Plan is GoL-owned and led at high-level through the Improvement Reform Steering
Committee (IRSC), and at operational level through Component Leaders who are senior
government officials, just below the level of Departments heads.
The principal stakeholders of EU-Lesotho co-operation are:
i. The European Union Delegation;
ii. The Ministry of Finance key departments and implementing units: National
Authorising Office; PFM Secretariat, Budget Department, Macroeconomic Policy
Management Department, Legal Department, Private Sector Development and
Financial Affairs Department;
iii. The Ministry of Development Planning relevant departments, including: Department
of Aid Coordination, and the Project Cycle Management Department, and;
iv. The World Bank; the African Development Bank, and the IMF.
The PFM Reform Action Plan covers the period of financial years 2012/13 to 2017/18
inclusive and has eight-technical and institutional development components
5.2 Recent and Ongoing Reform Actions
The table below gives an overview of the PFM Reform Action Plan covering the financial
years 2012/13 – 2017/18:
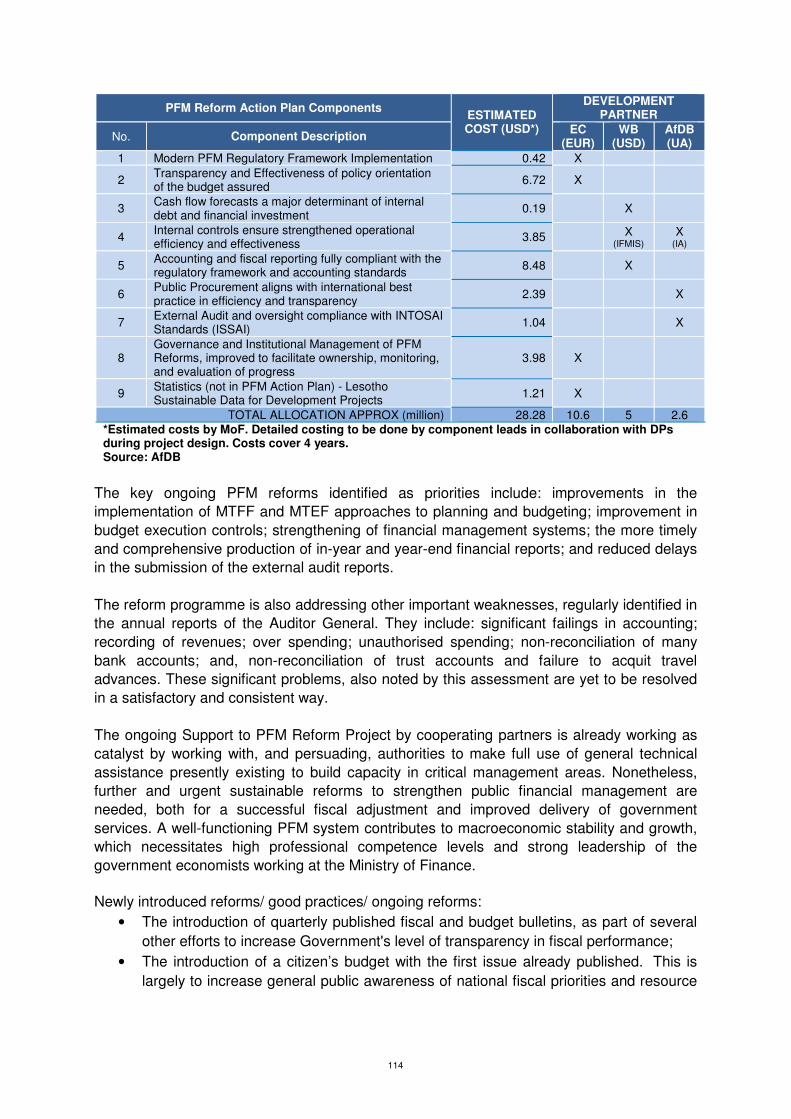
114
PFM Reform Action Plan Components ESTIMATED COST (USD*)
DEVELOPMENT PARTNER
No. Component Description EC
(EUR) WB
(USD) AfDB (UA)
1 Modern PFM Regulatory Framework Implementation 0.42 X
2 Transparency and Effectiveness of policy orientation of the budget assured
6.72 X
3 Cash flow forecasts a major determinant of internal debt and financial investment
0.19 X
4 Internal controls ensure strengthened operational efficiency and effectiveness
3.85 X (IFMIS)
X (IA)
5 Accounting and fiscal reporting fully compliant with the regulatory framework and accounting standards
8.48 X
6 Public Procurement aligns with international best practice in efficiency and transparency
2.39 X
7 External Audit and oversight compliance with INTOSAI Standards (ISSAI)
1.04 X
8 Governance and Institutional Management of PFM Reforms, improved to facilitate ownership, monitoring, and evaluation of progress
3.98 X
9 Statistics (not in PFM Action Plan) - Lesotho Sustainable Data for Development Projects
1.21 X
TOTAL ALLOCATION APPROX (million) 28.28 10.6 5 2.6 *Estimated costs by MoF. Detailed costing to be done by component leads in collaboration with DPs during project design. Costs cover 4 years. Source: AfDB
The key ongoing PFM reforms identified as priorities include: improvements in the
implementation of MTFF and MTEF approaches to planning and budgeting; improvement in
budget execution controls; strengthening of financial management systems; the more timely
and comprehensive production of in-year and year-end financial reports; and reduced delays
in the submission of the external audit reports.
The reform programme is also addressing other important weaknesses, regularly identified in
the annual reports of the Auditor General. They include: significant failings in accounting;
recording of revenues; over spending; unauthorised spending; non-reconciliation of many
bank accounts; and, non-reconciliation of trust accounts and failure to acquit travel
advances. These significant problems, also noted by this assessment are yet to be resolved
in a satisfactory and consistent way.
The ongoing Support to PFM Reform Project by cooperating partners is already working as
catalyst by working with, and persuading, authorities to make full use of general technical
assistance presently existing to build capacity in critical management areas. Nonetheless,
further and urgent sustainable reforms to strengthen public financial management are
needed, both for a successful fiscal adjustment and improved delivery of government
services. A well-functioning PFM system contributes to macroeconomic stability and growth,
which necessitates high professional competence levels and strong leadership of the
government economists working at the Ministry of Finance.
Newly introduced reforms/ good practices/ ongoing reforms:
• The introduction of quarterly published fiscal and budget bulletins, as part of several
other efforts to increase Government's level of transparency in fiscal performance;
• The introduction of a citizen’s budget with the first issue already published. This is
largely to increase general public awareness of national fiscal priorities and resource

115
allocation (as part of efforts for improving budget oversight) as well as secure active
participation in the budget process;
• Programme Performance Based Budgeting (PPBB) framework has been developed;
• The development of draft National Planning and Budget Regulation. The final draft
version for legal drafting is expected to be ready before end of December 2016. The
Department intends to issue new regulations in the 2017/18 fiscal year.
• An integrated budget calendar that links planning and the budget process and
provides ample time for the strategic phase of the budget cycle including its
circulation to MDAs has also been proposed in the draft planning and budget
regulations.
• Development of budget guidebook (i.e guidelines and procedures) is almost
completed;
• Several improvements have been made to the 2017/18 FY economic and fiscal
strategy document (Budget Strategy Paper) to ensure it has a policy effect and is
more coherent and consistent.
• Business process/ system user functional requirements for developing and
implementing a new budget planning, formulation and management system have
been developed, and currently awaiting testing on the proposed IFMIS upgrade
testing platform
• The development of a new integrated and multidimensional Chart of Accounts (CoA)
that incorporates several good international practices from GFSM 2014 statistical
reporting framework is currently work in progress.
5.3 Institutional Considerations
Government Leadership and Ownership
Government leadership and ownership is required for a more effective PFM reform process
by setting the objectives, direction, and pace of reforms, clarifying organizational
responsibilities for the reform process, and addressing, in a timely manner, any resistance to
change.
In the past, the government has expressed its will to take ownership of the reform process
and have done so from time to time. In the Lesotho Reform Action Plan, it states that:
“Political leadership and commitment shall be crucial for the accomplishment of objectives of
the plan and sustaining the momentum for reforms.” However, in recent years, governmental
crises have affected the reform process, with the dissolution of Parliament and subsequent
elections affecting the government's ability to exercise its leadership in economic reforms in
a consistent way. Recently, another ongoing government crisis brewing that can certainly
have an effect on focus and direction away from the long-term perspective needed to pursue
effective reforms.
Coordination across Government
Coordination across government is likely to contribute to a more prioritized and sequenced
reform agenda, as the existing capacities of different entities, and levels of government, are
considered in planning and implementing reforms. During the assessment, the team

116
observed that coordination of related processes and operations across government has been
insufficient, leading to time losses, differences in interpretations, lack of compliance and in
the end ineffective delivery. The reform project as such might function better as it has its
dedicated key staff and advisers, but the environment might at times make it difficult to
navigate and implement the reforms into the daily execution of PFM.
A Sustainable Reform Process
A sustainable reform process is likely to influence the impact of PFM reforms. One of the
serious threats to sustainability is the lack of human resources. There are long-standing
problems with lack of well-trained professional staff with respect to skills level as well as to
number of staff. This assessment has noted that there is a high vacancy rate in key
departments responsible for daily crucial PFM processes. These people should,
systematically be responsible for reform implementation. It would be necessary for
government to address this problem and develop an effective recruitment and retaining
policy. Moreover, even though Lesotho has received long-term support for PFM reform, this
assessment concludes that the reforms will need continued external support beyond the
current timeline before it can be sustainable. Further, full government commitment and the
manifestation of support across the entirety of the government machinery is required in order
to attract the necessary external funding.
Transparency of the PFM Programme
The Reform Programme’s documents, plans and progress reports are publicly accessible
and the cooperating partners disclose the programme financing, as the contributions bypass
the government budget. Regularly stakeholder interactions promotes transparency; this
should be sustained.

117
6 Annexes

118
Annex 1: Performance Indicator Summary
No. Indicator 2016
Score
Justification for 2016 Score
Pillar I: Budget Reliability PI-1 Aggregate Expenditure Outturn D Actual budget outturn compared to originally approved budget deviated
more than 15% in two of the last three completed fiscal years. Actual deviations were 1.1% in FY2013/2014, 25.9% in FY2014/2015, and 31.3% in FY2015/2016
PI-2 Expenditure Composition Outturn D+
2.1 Expenditure Composition by Function D Expenditure composition outturn by administrative heads, in FY2013/2014, FY2014/2015, and FY2015/2016 was above 15% in each of the three years; actual outturns were 27.3%, 37.9% and 31.1% respectively.
2.2 Expenditure Composition by Economic Type D In all three completed fiscal years under review, expenditure composition outturn by economic classification was more than 15%. Actual composition variances were 49%, 51% and 68.4% in FY2013/2014, FY2014/2015, and FY2015/2016 respectively.
2.3 Expenditure from Contingency A Actual expenditure charged to contingency vote is 0.7% on average; this is less than 3% of originally approved budget
PI-3 Revenue Outturn C+
3.1 Aggregate Revenue Outturn B Actual aggregate revenue was between 94% and 112% of originally approved revenue budget. Actual deviations were 91.2% in FY2013/2014, 100% in FY2014/2015, and 96.4% in FY2015/2016
3.2 Revenue Composition Variance C The revenue composition variance is less than 15% in two of the last three completed fiscal years; actual composition variances are 12.2%, 20.2% and 10.3% in FY2013/2014, FY2014/2015 and FY2015/2016 respectively
Pillar II: Transparency of Public Finances PI-4 Budget Classification C Budget formulation, execution and reporting are based on administrative and
economic classification using GFS 2001 standards PI-5 Budget Documentation C 4 basic elements and 1 additional element are complete which gives a C
score.
PI-6 Central Government Operations outside the Budget D
6.1 Expenditure outside Financial Reports D At least half of government expenditure from non-tax revenue and expenditure from donor-financed projects (more than 10% in total) are not captured in the financial reports
6.2 Revenue outside Financial Reports D Available evidence coupled with interactions with officials suggest that more than 10% of budgeted central government is outside its financial reports
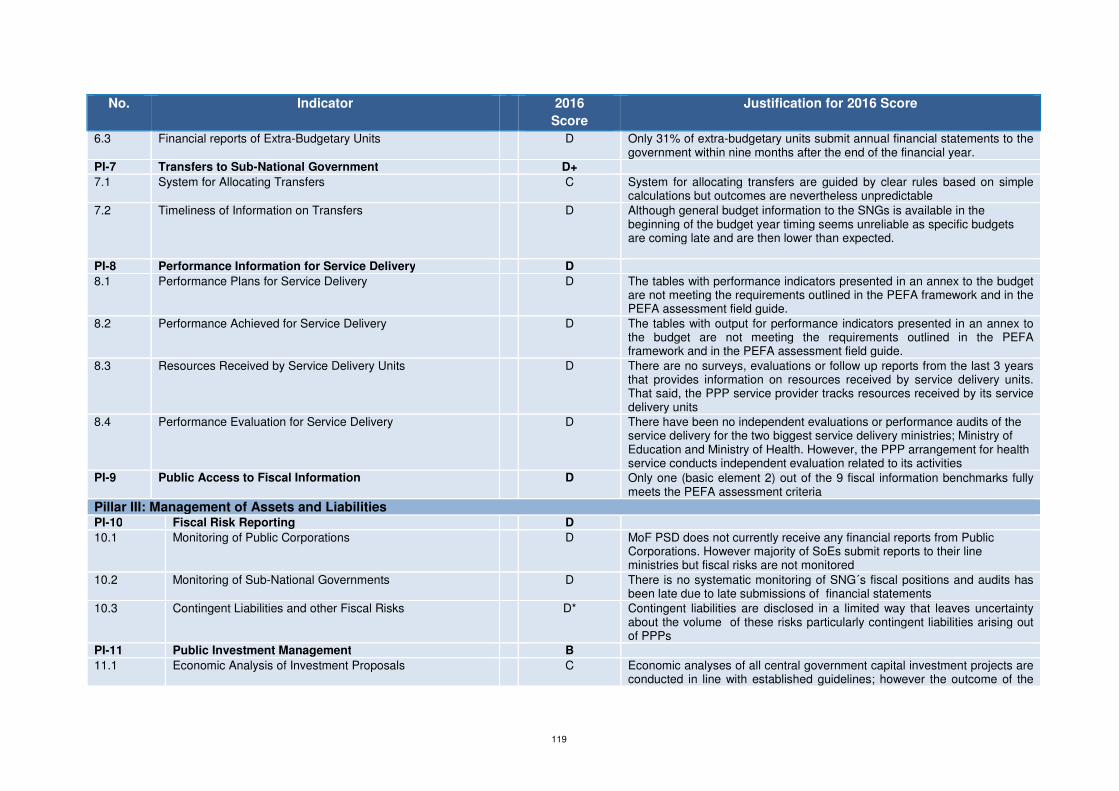
119
No. Indicator 2016
Score
Justification for 2016 Score
6.3 Financial reports of Extra-Budgetary Units D Only 31% of extra-budgetary units submit annual financial statements to the government within nine months after the end of the financial year.
PI-7 Transfers to Sub-National Government D+
7.1 System for Allocating Transfers C System for allocating transfers are guided by clear rules based on simple calculations but outcomes are nevertheless unpredictable
7.2 Timeliness of Information on Transfers D Although general budget information to the SNGs is available in the beginning of the budget year timing seems unreliable as specific budgets are coming late and are then lower than expected.
PI-8 Performance Information for Service Delivery D
8.1 Performance Plans for Service Delivery D The tables with performance indicators presented in an annex to the budget are not meeting the requirements outlined in the PEFA framework and in the PEFA assessment field guide.
8.2 Performance Achieved for Service Delivery D The tables with output for performance indicators presented in an annex to the budget are not meeting the requirements outlined in the PEFA framework and in the PEFA assessment field guide.
8.3 Resources Received by Service Delivery Units D There are no surveys, evaluations or follow up reports from the last 3 years that provides information on resources received by service delivery units. That said, the PPP service provider tracks resources received by its service delivery units
8.4 Performance Evaluation for Service Delivery D There have been no independent evaluations or performance audits of the service delivery for the two biggest service delivery ministries; Ministry of Education and Ministry of Health. However, the PPP arrangement for health service conducts independent evaluation related to its activities
PI-9 Public Access to Fiscal Information D Only one (basic element 2) out of the 9 fiscal information benchmarks fully meets the PEFA assessment criteria
Pillar III: Management of Assets and Liabilities PI-10 Fiscal Risk Reporting D
10.1 Monitoring of Public Corporations D MoF PSD does not currently receive any financial reports from Public Corporations. However majority of SoEs submit reports to their line ministries but fiscal risks are not monitored
10.2 Monitoring of Sub-National Governments D There is no systematic monitoring of SNG´s fiscal positions and audits has been late due to late submissions of financial statements
10.3 Contingent Liabilities and other Fiscal Risks D* Contingent liabilities are disclosed in a limited way that leaves uncertainty about the volume of these risks particularly contingent liabilities arising out of PPPs
PI-11 Public Investment Management B
11.1 Economic Analysis of Investment Proposals C Economic analyses of all central government capital investment projects are conducted in line with established guidelines; however the outcome of the

120
No. Indicator 2016
Score
Justification for 2016 Score
investment proposals are not published except for inter-ministerial use only
11.2 Investment Project Selection B Project selection is based on established (but not published) selection criteria. Prior to inclusion in the budget, Cabinet approves all project proposals that have passed the PSIC appraisal process
11.3 Investment Project Costing B Both investment cost and forward linked recurrent expenditures are provided for in both project proposals and MTEF budget documents for at least the first three years
11.4 Investment Project Monitoring B Monitoring and evaluation of all capital projects entail both physical progress of work and financial progress; nonetheless internal M&E reports are not published but those (which constitute more than 50% of total capital investments) by external evaluators are published
PI-12 Public Asset Management D+
12.1 Financial Asset Monitoring D Whereas MoF maintains a record of government equity holdings in SOEs, the information only shows the name of the company and the percentage share. Information on number of shares, cost and date of investments is not available
12.2 Non-Financial Asset Monitoring D The Government does not maintain a consolidated register of all fixed assets in its custody; that said, some line ministries do maintain a register of fixed assets funded by donors
12.3 Transparency of Asset Disposal C The legal and regulatory framework provide for fixed asset disposal procedures. The consolidated annual financial statements provide partial information on proceeds of assets disposed
PI-13 Debt Management C+
13.1 Recording and Reporting of Debts and Guarantees C Both domestic and foreign debts including guarantees are recorded and reconciled at least quarterly with information obtained from creditor statements. CS-DRMS generates monthly reports with statistical analyses. However, PPPs are neither recorded nor reported. Again, internal reconciliation challenges arising as a result of manual debt data entry onto IFMIS have not been resolved
13.2 Approval of Debts and Guarantees C The legal and regulatory framework grant authorisation to borrow both from domestic and external sources; the Minister of Finance is the sole person authorised to contract loans and issue guarantees on behalf of government and SOEs subject to Cabinet approval. Annual borrowing limits are approved by parliament and are within IMF thresholds. Nonetheless, political pressure overriding the Minister of Finance power to approve all loans remains a significant issue
13.3 Debt Management Strategy D The Ministry of Finance does not prepare a medium-term debt sustainability strategy to guide central government borrowing decisions; however there appears to be an informal debt management strategy in making borrowing decisions.

121
No. Indicator 2016
Score
Justification for 2016 Score
Pillar IV: Policy-Based Planning And Budgeting PI-14 Macro-Economic and Fiscal Forecasting D+
14.1 Macro-Economic Forecasting C The government prepares forecasts for key macroeconomic indicators for the budget year and the following two fiscal years; however these are not submitted to the Parliament systematically except when requested by parliament economic cluster
14.2 Fiscal Forecasting C The government prepares fiscal forecasts for the budget year and the following two fiscal years with aggregate revenue and expenditure estimates as well as anticipated deficit; however the underlying assumptions are not part of the budget submissions to Parliament
14.3 Macro-Fiscal Sensitivity Analysis D This kind of analysis is under development but is not yet documented and published. There is also no qualitative assessment of the impact of sensitivity analysis currently produced by the macro department
PI-15 Fiscal Strategy D+
15.1 Fiscal Impact of Policy Proposals D The government prepares estimates of the fiscal impact for some, but not all, proposed changes in revenue and expenditure policy for the budget year.
15.2 Fiscal Strategy Adoption C The Fiscal Strategy is reflected in the Budget Strategy Paper and also in the call Circular and seems to be for internal use..
15.3 Reporting on Fiscal Outcomes C There is a quarterly Budget and fiscal bulletin published for the last year by the MoF that contains some performance on Macroeconomic Developments, Budget and Fiscal Developments and ongoing PFM reforms. The bulletin gives an overview of the quarterly budget operations; revenue collection; recurrent budget performance and capital budget performance
PI-16 Medium-Term Perspective in Expenditure Budgeting C+
16.1 Medium Term Expenditure Estimates B The Annual Budget contained in the Budget book presents estimates of expenditure for the budget year and the two following fiscal years allocated by administrative and economic classification. The economic classification is according to GFS 2001, but COFOG is not applied.
16.2 Medium Term Expenditure Ceilings A Aggregate and ministry-level expenditure ceilings for the budget year and the two following fiscal years are part of the budget call circular and approved by the Cabinet before the budget circular is issued.
16.3 Alignment of Strategic Plans and Medium Term Budgets D Medium term strategic plans exist but are not costed or aligned to the budget process.
16.4 Consistency of Budget with Previous Year's Estimates D In general, the budget documents do not provide systematic explanations. In
the budget speech for the last three years, the Minister of Finance has made
some brief comments on the budget performance deviations of the last
budgets in the context of presenting the new budget. However, these
comments do not fulfil the PEFA framework requirements for consistency
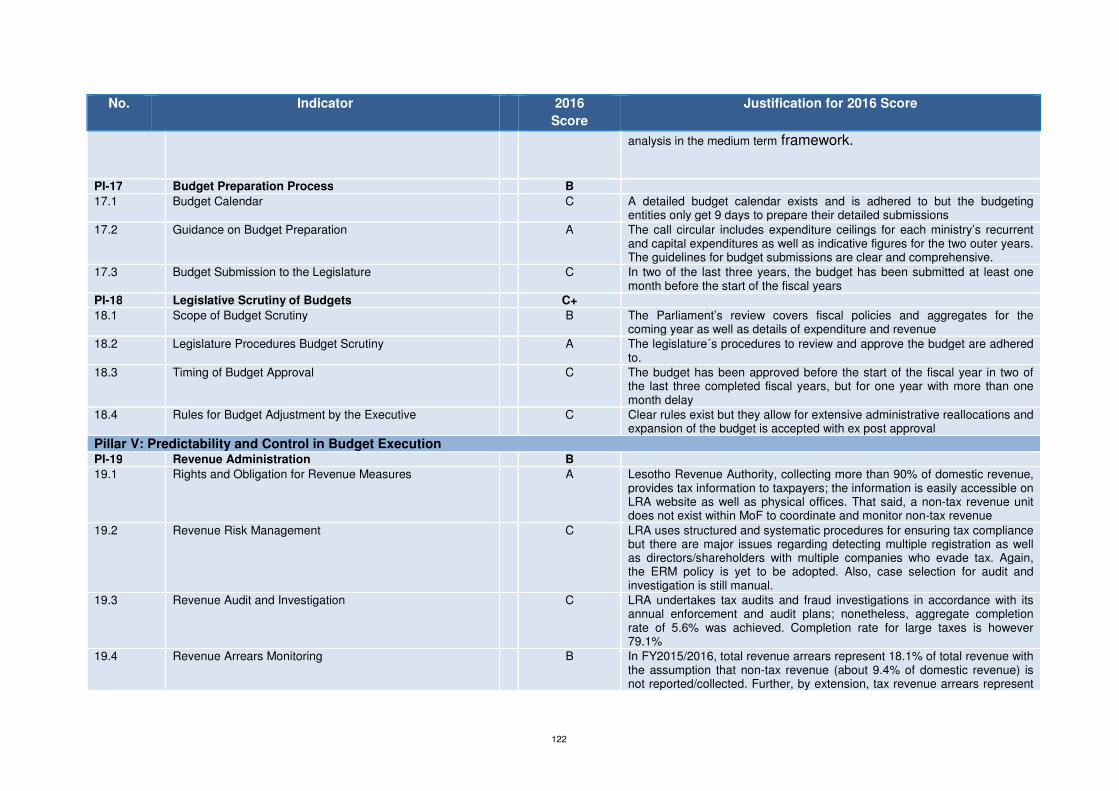
122
No. Indicator 2016
Score
Justification for 2016 Score
analysis in the medium term framework.
PI-17 Budget Preparation Process B
17.1 Budget Calendar C A detailed budget calendar exists and is adhered to but the budgeting entities only get 9 days to prepare their detailed submissions
17.2 Guidance on Budget Preparation A The call circular includes expenditure ceilings for each ministry’s recurrent and capital expenditures as well as indicative figures for the two outer years. The guidelines for budget submissions are clear and comprehensive.
17.3 Budget Submission to the Legislature C In two of the last three years, the budget has been submitted at least one month before the start of the fiscal years
PI-18 Legislative Scrutiny of Budgets C+
18.1 Scope of Budget Scrutiny B The Parliament’s review covers fiscal policies and aggregates for the coming year as well as details of expenditure and revenue
18.2 Legislature Procedures Budget Scrutiny A The legislature´s procedures to review and approve the budget are adhered to.
18.3 Timing of Budget Approval C The budget has been approved before the start of the fiscal year in two of the last three completed fiscal years, but for one year with more than one month delay
18.4 Rules for Budget Adjustment by the Executive C Clear rules exist but they allow for extensive administrative reallocations and expansion of the budget is accepted with ex post approval
Pillar V: Predictability and Control in Budget Execution PI-19 Revenue Administration B
19.1 Rights and Obligation for Revenue Measures A Lesotho Revenue Authority, collecting more than 90% of domestic revenue, provides tax information to taxpayers; the information is easily accessible on LRA website as well as physical offices. That said, a non-tax revenue unit does not exist within MoF to coordinate and monitor non-tax revenue
19.2 Revenue Risk Management C LRA uses structured and systematic procedures for ensuring tax compliance but there are major issues regarding detecting multiple registration as well as directors/shareholders with multiple companies who evade tax. Again, the ERM policy is yet to be adopted. Also, case selection for audit and investigation is still manual.
19.3 Revenue Audit and Investigation C LRA undertakes tax audits and fraud investigations in accordance with its annual enforcement and audit plans; nonetheless, aggregate completion rate of 5.6% was achieved. Completion rate for large taxes is however 79.1%
19.4 Revenue Arrears Monitoring B In FY2015/2016, total revenue arrears represent 18.1% of total revenue with the assumption that non-tax revenue (about 9.4% of domestic revenue) is not reported/collected. Further, by extension, tax revenue arrears represent

123
No. Indicator 2016
Score
Justification for 2016 Score
10.3% of total tax revenue and arrears more than 12 months are 41.8% of total tax arrears as at end of FY2015/2016
PI-20 Accounting for Revenues D+
20.1 Information on Revenue Collections D At present, both LRA and the Office of the Accountant General produce quarterly reports with information on tax and non-tax revenue according to type.
20.2 Transfer of Revenue Collections B Once a week, LRA transfers revenue collections to the Treasury Main Revenue Account at CBL. Non-tax revenue is also remitted weekly to the Treasury account
20.3 Revenue Account Reconciliation D At present, LRA does not do a complete reconciliation of tax assessment, collections, transfers and arrears; reconciliation is limited to collections and transfers only. Non-tax revenue is also not completely reconciled.
PI-21 Predictability of In-Year Resource Allocation C
21.1 Consolidation of Cash Balances D There is no TSA. Even though treasury managed bank balances are consolidated monthly, there are over 254 other government bank accounts (donor-financed projects and own revenue bank accounts) maintained and operated by line ministries that are not part of the monthly consolidation system
21.2 Cash Forecasting And Monitoring D Section 13 of the Treasury Regulations 2014 mandates all budget entities to prepare and submit annual cash flow plans to MoF for consolidation and monitoring; in practice however, this is not done.
21.3 Information on Commitment Ceilings B MoF issues quarterly expenditure commitment warrants to budget entities; actual cash releases are monthly.
21.4 Significance of In-Year Budget Adjustments B In-year budget reallocations are significant but done in a transparent manner. Once in each of the last three completed fiscal years, parliament passed ex-ante supplementary appropriations six months after the beginning of the fiscal year.
PI-22 Expenditure Arrears D+
22.1 Stock of Expenditure Arrears D There is no reliable data on the stock of expenditure arrears. The 2015/2016 figure of M58.578million, though reported in the 2015/2016 draft consolidated annual financial statements, is unreliable.
22.2 Expenditure Arrears Monitoring C Information on age-profiled stock of expenditure arrears is now generated annually and reported in the consolidated annual financial statements; however the expenditure report is not comprehensive as it does not include arrears outside IFMIS
PI-23 Payroll Controls D
23.1 Integration of Payroll And Personnel Records D There is no automatic integration or reconciliations between personnel records and the payroll system.
23.2 Management of Payroll Changes D Personnel records and the payroll are not updated at least quarterly and

124
No. Indicator 2016
Score
Justification for 2016 Score
incidents of retrospective adjustments happens so frequently that it has been highlighted as a challenge to ministries and the office of the Accountant General.
23.3 Internal Controls of Payroll D There are no controls to validate and ensure the integrity of the payroll data.
23.4 Payroll Audits D There were no payroll audits, inspections or surveys conducted during the past three years.
PI-24 Procurement Management D
24.1 Procurement Monitoring D There is no reliable record/database for monitoring procurement management
24.2 Procurement Methods D There is no record/database of what has been procured using which method. Details on the extent of deviations are not available centrally at PPAD.
24.3 Public Access to Procurement Information D Only one of the procurement elements is publicly available (that is, bidding opportunities in news papers)
24.4 Procurement Complaint Management D Procurement tribunal not yet fully functional PI-25 Internal Controls on Non-Salary Expenditure C+
25.1 Segregation of Duties A Appropriate segregation of duties is prescribed throughout the expenditure process and responsibilities are clearly laid down.
25.2 Effectiveness of Expenditure Commitment Controls C IFMIS functionality is capable of controlling commitments; however not all expenditures are processed through IFMIS.
25.3 Compliance with Payment Controls D Clear internal controls exist but they are rarely adhered to PI-26 Internal Audit D+
26.1 Coverage of The Internal Audit C Majority of line ministries and budget entities have functional internal audit units
26.2 Nature of Audits And Standards Applied D There is no evidence of the nature of audits conducted or that appropriate standards were applied
26.3 Implementation of Internal Audits and Reporting C Annual internal plans are prepared; majority of these plans are implemented. Some internal audit reports are issued to chief accounting officers
26.4 Response to Internal Audits D Even though periodic internal audit reports are prepared and issued to management, there is neither execution action nor responses to audit queries
Pillar VI: Accounting, Recording and Reporting PI-27 Financial Data Integrity D+
27.1 Bank Account Reconciliation D There is a significant backlog in bank reconciliations, 98% are 12 months or more in arrears.
27.2 Suspense Accounts D There are suspense balances dating back 2007/2008; no reconciliation and clearance takes place annually
27.3 Advance Accounts D There are advances dating back 2007/2008; no reconciliation and clearance
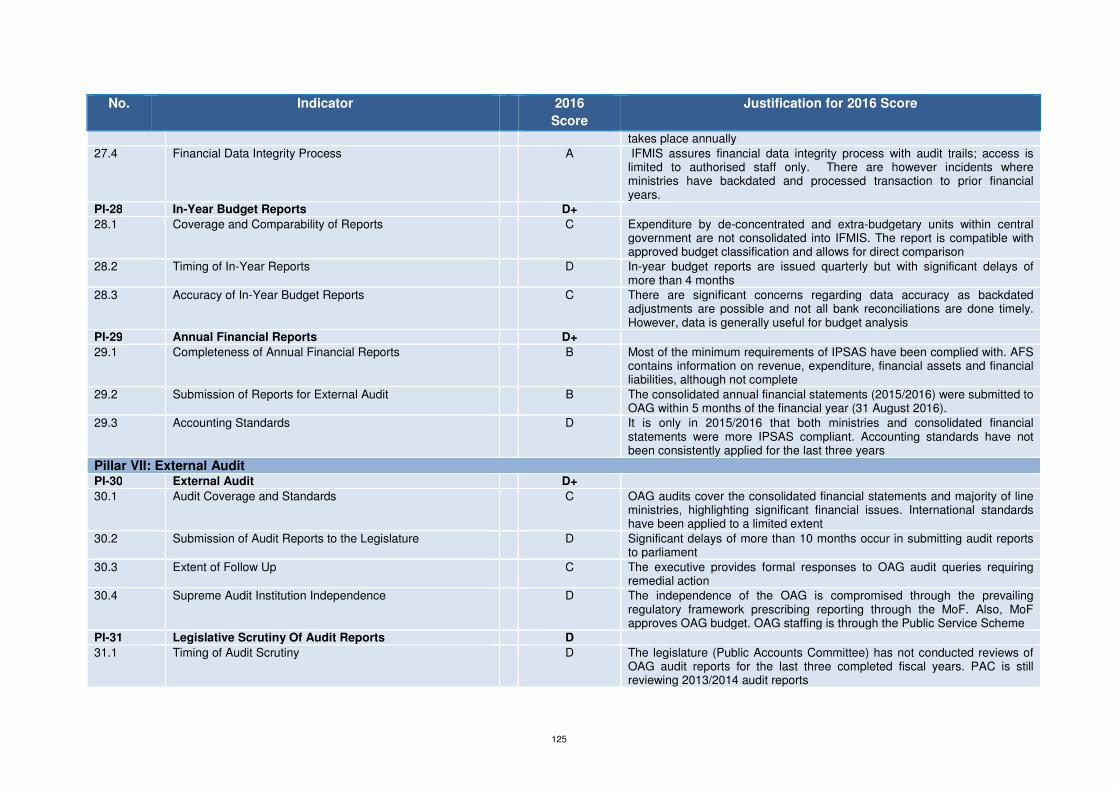
125
No. Indicator 2016
Score
Justification for 2016 Score
takes place annually
27.4 Financial Data Integrity Process A IFMIS assures financial data integrity process with audit trails; access is limited to authorised staff only. There are however incidents where ministries have backdated and processed transaction to prior financial years.
PI-28 In-Year Budget Reports D+
28.1 Coverage and Comparability of Reports C Expenditure by de-concentrated and extra-budgetary units within central government are not consolidated into IFMIS. The report is compatible with approved budget classification and allows for direct comparison
28.2 Timing of In-Year Reports D In-year budget reports are issued quarterly but with significant delays of more than 4 months
28.3 Accuracy of In-Year Budget Reports C There are significant concerns regarding data accuracy as backdated adjustments are possible and not all bank reconciliations are done timely. However, data is generally useful for budget analysis
PI-29 Annual Financial Reports D+
29.1 Completeness of Annual Financial Reports B Most of the minimum requirements of IPSAS have been complied with. AFS contains information on revenue, expenditure, financial assets and financial liabilities, although not complete
29.2 Submission of Reports for External Audit B The consolidated annual financial statements (2015/2016) were submitted to OAG within 5 months of the financial year (31 August 2016).
29.3 Accounting Standards D It is only in 2015/2016 that both ministries and consolidated financial statements were more IPSAS compliant. Accounting standards have not been consistently applied for the last three years
Pillar VII: External Audit PI-30 External Audit D+
30.1 Audit Coverage and Standards C OAG audits cover the consolidated financial statements and majority of line ministries, highlighting significant financial issues. International standards have been applied to a limited extent
30.2 Submission of Audit Reports to the Legislature D Significant delays of more than 10 months occur in submitting audit reports to parliament
30.3 Extent of Follow Up C The executive provides formal responses to OAG audit queries requiring remedial action
30.4 Supreme Audit Institution Independence D The independence of the OAG is compromised through the prevailing regulatory framework prescribing reporting through the MoF. Also, MoF approves OAG budget. OAG staffing is through the Public Service Scheme
PI-31 Legislative Scrutiny Of Audit Reports D
31.1 Timing of Audit Scrutiny D The legislature (Public Accounts Committee) has not conducted reviews of OAG audit reports for the last three completed fiscal years. PAC is still reviewing 2013/2014 audit reports

126
No. Indicator 2016
Score
Justification for 2016 Score
31.2 Hearing on Audit Findings D Even though PAC hearings include summoning chief accounting officers and senior staff, the last review is for FY2013/2014 which is still ongoing
31.3 Recommendations on Audit by the Legislature D PAC is still conducting hearing related to 2013/2014 OAG audit reports; it is more than 24 months behind schedule
31.4 Transparency of the Legislative Scrutiny of Audit Reports D PAC hearings exclude public attendance. The PAC reports, for the last three completed fiscal years 2013/2014, 2014/2015, and 2015/2016 are not published on the website neither are they available for purchase at reasonably low cost.
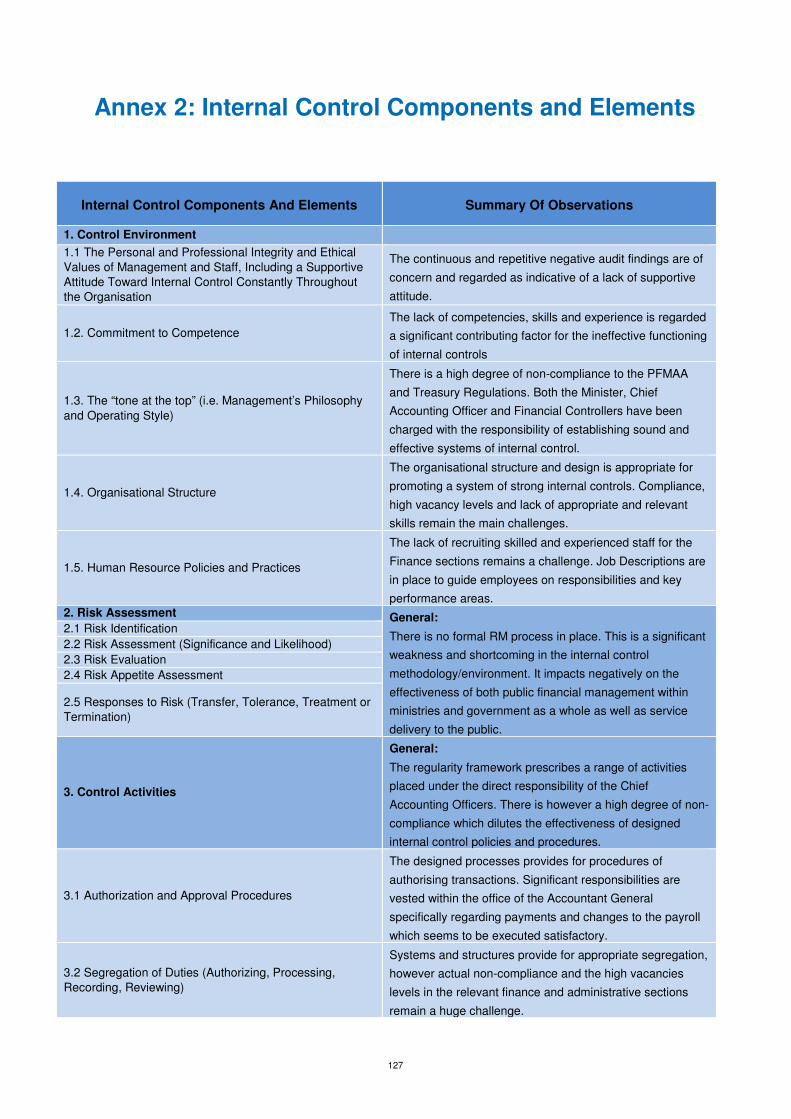
127
Annex 2: Internal Control Components and Elements
Internal Control Components And Elements Summary Of Observations
1. Control Environment 1.1 The Personal and Professional Integrity and Ethical
Values of Management and Staff, Including a Supportive
Attitude Toward Internal Control Constantly Throughout
the Organisation
The continuous and repetitive negative audit findings are of
concern and regarded as indicative of a lack of supportive
attitude.
1.2. Commitment to Competence
The lack of competencies, skills and experience is regarded
a significant contributing factor for the ineffective functioning
of internal controls
1.3. The “tone at the top” (i.e. Management’s Philosophy
and Operating Style)
There is a high degree of non-compliance to the PFMAA
and Treasury Regulations. Both the Minister, Chief
Accounting Officer and Financial Controllers have been
charged with the responsibility of establishing sound and
effective systems of internal control.
1.4. Organisational Structure
The organisational structure and design is appropriate for
promoting a system of strong internal controls. Compliance,
high vacancy levels and lack of appropriate and relevant
skills remain the main challenges.
1.5. Human Resource Policies and Practices
The lack of recruiting skilled and experienced staff for the
Finance sections remains a challenge. Job Descriptions are
in place to guide employees on responsibilities and key
performance areas. 2. Risk Assessment General:
There is no formal RM process in place. This is a significant
weakness and shortcoming in the internal control
methodology/environment. It impacts negatively on the
effectiveness of both public financial management within
ministries and government as a whole as well as service
delivery to the public.
2.1 Risk Identification
2.2 Risk Assessment (Significance and Likelihood)
2.3 Risk Evaluation
2.4 Risk Appetite Assessment
2.5 Responses to Risk (Transfer, Tolerance, Treatment or
Termination)
3. Control Activities
General:
The regularity framework prescribes a range of activities
placed under the direct responsibility of the Chief
Accounting Officers. There is however a high degree of non-
compliance which dilutes the effectiveness of designed
internal control policies and procedures.
3.1 Authorization and Approval Procedures
The designed processes provides for procedures of
authorising transactions. Significant responsibilities are
vested within the office of the Accountant General
specifically regarding payments and changes to the payroll
which seems to be executed satisfactory.
3.2 Segregation of Duties (Authorizing, Processing,
Recording, Reviewing)
Systems and structures provide for appropriate segregation,
however actual non-compliance and the high vacancies
levels in the relevant finance and administrative sections
remain a huge challenge.
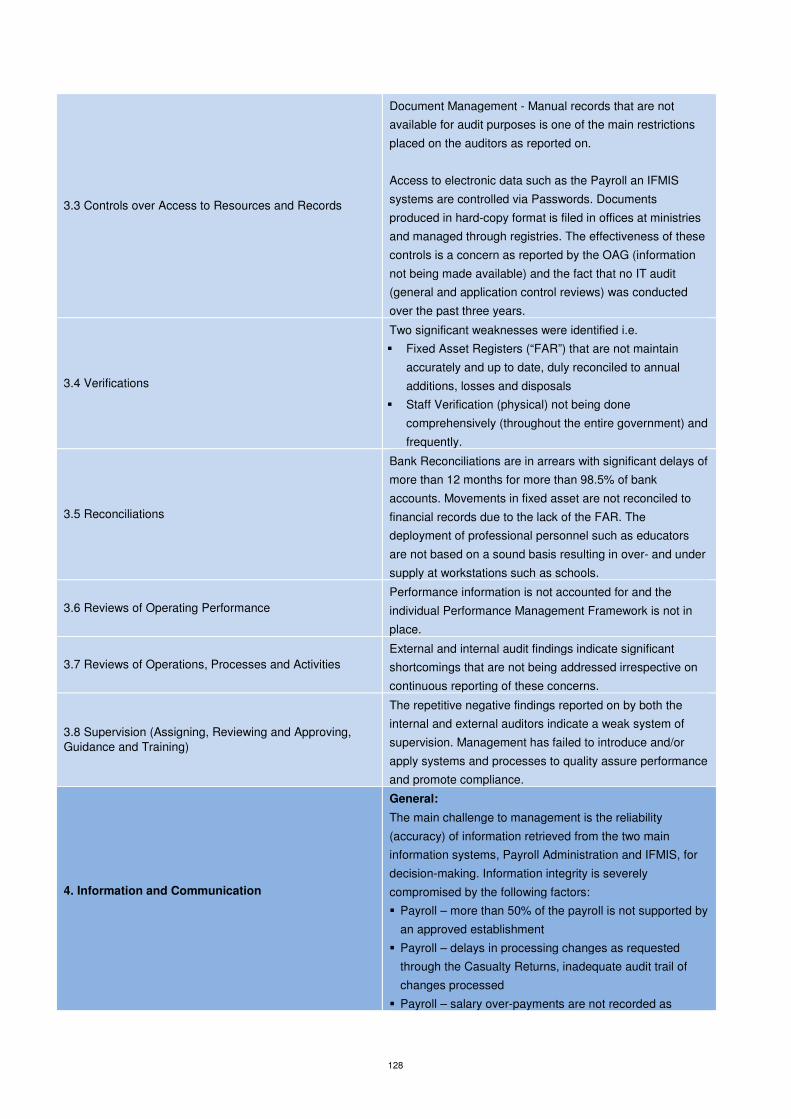
128
3.3 Controls over Access to Resources and Records
Document Management - Manual records that are not
available for audit purposes is one of the main restrictions
placed on the auditors as reported on.
Access to electronic data such as the Payroll an IFMIS
systems are controlled via Passwords. Documents
produced in hard-copy format is filed in offices at ministries
and managed through registries. The effectiveness of these
controls is a concern as reported by the OAG (information
not being made available) and the fact that no IT audit
(general and application control reviews) was conducted
over the past three years.
3.4 Verifications
Two significant weaknesses were identified i.e.
� Fixed Asset Registers (“FAR”) that are not maintain
accurately and up to date, duly reconciled to annual
additions, losses and disposals
� Staff Verification (physical) not being done
comprehensively (throughout the entire government) and
frequently.
3.5 Reconciliations
Bank Reconciliations are in arrears with significant delays of
more than 12 months for more than 98.5% of bank
accounts. Movements in fixed asset are not reconciled to
financial records due to the lack of the FAR. The
deployment of professional personnel such as educators
are not based on a sound basis resulting in over- and under
supply at workstations such as schools.
3.6 Reviews of Operating Performance
Performance information is not accounted for and the
individual Performance Management Framework is not in
place.
3.7 Reviews of Operations, Processes and Activities
External and internal audit findings indicate significant
shortcomings that are not being addressed irrespective on
continuous reporting of these concerns.
3.8 Supervision (Assigning, Reviewing and Approving,
Guidance and Training)
The repetitive negative findings reported on by both the
internal and external auditors indicate a weak system of
supervision. Management has failed to introduce and/or
apply systems and processes to quality assure performance
and promote compliance.
4. Information and Communication
General:
The main challenge to management is the reliability
(accuracy) of information retrieved from the two main
information systems, Payroll Administration and IFMIS, for
decision-making. Information integrity is severely
compromised by the following factors:
� Payroll – more than 50% of the payroll is not supported by
an approved establishment
� Payroll – delays in processing changes as requested
through the Casualty Returns, inadequate audit trail of
changes processed
� Payroll – salary over-payments are not recorded as

129
receivables in IFMIS (Suspense Accounts)
� IFMIS – Significant backlog in compiling Bank
Reconciliations
� IFMIS – unrestricted access to process transactions
backdated to previous financial years
� IFMIS – not all procurement (eg. Capital Expenditure)
recognised as Commitments
� Other Primary Records – the adoption of the IPSAS Cash
Basis of Accounting Framework requires supplementary
records to be maintained at ministries which were found to
be absent for example Fixed Asset Registers, Loss
Registers and Debtors Registers (Suspense Accounts
and Advances).
5. Monitoring
General:
As stated above, one main root cause for the identified
weaknesses in the internal control environment is the lack
accepting responsibility for ongoing monitoring in the
ministries. In addition, the Internal Audit unit’s capacity to
monitor, identify and timely report on the effectiveness and
efficiency of the internal control system is limited.
Reliance on independent annual reviews, assessments
such as performed by the OAG, PAC does not substitute
management’s monitoring responsibilities.
The significant delay in tabling the OAG findings and
subsequent issuing of the PAC resolutions and
recommendations have a severe detrimental impact on the
effectiveness and efficiency of the monitoring and
evaluation of audit findings. Ministries have not compiled
formal written plans to address audit findings which can be
monitored and the impact or success (rate of achievement)
measured, evaluated for redress or change of strategies.
5.1 Ongoing Monitoring
As stated above under general, ongoing monitoring remains
a significant challenge.
5.2 Evaluations
Review and evaluation is mainly conducted independently
by the OAG and Internal Auditors. Capacity constraints
however limit audit coverage, standards of the audits and
reports.
The repetitive nature of negative audit findings are mainly
as result of –
• The significance difference in time-frames between the
financial year audited and actual issuing of the audit
findings and the report on that year
• Lack of having an formal strategy and plan for example
a “Audit Intervention Plan” (“AIP”) to address the
identified weaknesses and shortcomings.
5.3 Management Responses
As discussed above, the responses and undertakings given
to both internal and external audit observations are not

130
formalised by way of a plan or working document. This
prevent management monitoring and conducting own
assessments of progress, risks and weaknesses to be
addressed.

131
Annex 3: Sources of Information

132
3A:
Table 1.2A - Analysis for PI-1: Fiscal Year 2013/2014 Data for year = 2013/14
Administrative or Functional Head Budget Actual Adjusted Budget
Deviation Absolute Deviation
Percent
Agriculture And Food Security 335,276,928.00 308,379,292.00 332,004,535.7 -23,625,243.7 23,625,243.7 7.1%
Health 1,743,543,787.00 1,665,371,837.00 1,726,526,334.4 -61,154,497.4 61,154,497.4 3.5%
Education And Training 1,966,439,499.00 1,996,209,726.00 1,947,246,524.7 48,963,201.3 48,963,201.3 2.5%
Finance 859,175,044.00 974,170,578.00 850,789,266.3 123,381,311.7 123,381,311.7 14.5%
Trade And Industry 231,433,047.00 101,001,867.00 229,174,198.7 -128,172,331.7 128,172,331.7 55.9%
Development Planning 815,153,812.00 760,868,624.00 807,197,693.3 -46,329,069.3 46,329,069.3 5.7%
Justice, Human Rights And Correctional Services
158,173,385.00 171,786,446.00 156,629,570.6 15,156,875.4 15,156,875.4 9.7%
Home Affairs 243,447,425.00 155,636,069.00 241,071,313.2 -85,435,244.2 85,435,244.2 35.4%
Prime Minister 96,976,953.00 110,665,096.00 96,030,432.1 14,634,663.9 14,634,663.9 15.2%
Communication, Science And Technology 142,252,956.00 163,434,494.00 140,864,529.2 22,569,964.8 22,569,964.8 16.0%
Law And Constitutional Affairs 48,698,204.00 53,155,934.00 48,222,896.5 4,933,037.5 4,933,037.5 10.2%
Foreign Affairs And International Relations
290,670,948.00 280,116,307.00 287,833,922.0 -7,717,615.0 7,717,615.0 2.7%
Public Works And Transport 1,132,583,427.00 905,858,850.00 1,121,529,110.5 -215,670,260.5 215,670,260.5 19.2%
Forestry And Land Reclamation 156,359,118.00 190,578,972.00 154,833,011.3 35,745,960.7 35,745,960.7 23.1%
Energy, Meteorology And Water Affairs 1,572,599,041.00 447,643,701.00 1,557,250,054.7 -
1,109,606,353.7 1,109,606,353.7 71.3%
Labour And Employment 53,439,989.00 54,259,650.00 52,918,400.4 1,341,249.6 1,341,249.6 2.5%
Tourism, Environment And Culture 94,692,256.00 75,139,974.00 93,768,034.3 -18,628,060.3 18,628,060.3 19.9%
Auditor General Office 23,288,149.00 26,891,032.00 23,060,850.5 3,830,181.5 3,830,181.5 16.6%
His Majesty's Office 61,929,624.00 23,463,257.00 61,325,174.3 -37,861,917.3 37,861,917.3 61.7%
Public Services Commission 6,601,545.00 6,893,649.00 6,537,112.2 356,536.8 356,536.8 5.5%
21 (= Sum Of Rest) 2,811,512,144.00 4,247,358,645.00 2,784,071,035.2 1,463,287,609.8 1,463,287,609.8 52.6%
Allocated Expenditure 12,844,247,281.00 12,718,884,000.00 12,718,884,000.0 0.0 3,468,401,186.2
Contingency 100,000,000.00 83,159,000.00
Total Expenditure 12,944,247,281.00 12,802,043,000.00
Overall (Pi-1) Variance
1.1%
Composition (Pi-2) Variance
-
27.3% Contingency Share Of Budget
0.6%

133
Table 1.2B: Analysis for PI-1 Fiscal Year 2014/2015 Data For Year = 2014/15
Administrative Or Functional Head Budget Actual Adjusted Budget
Deviation Absolute Deviation
Percent
Agriculture And Food Security 332,075,898.00 291,391,000.00 419,212,296.3 -127,821,296.3 127,821,296.3 30%
Health 1,719,433,207.00 1,566,764,000.00 2,170,610,837.6 -603,846,837.6 603,846,837.6 28%
Education And Training 2,049,558,256.00 1,941,061,000.00 2,587,360,384.1 -646,299,384.1 646,299,384.1 25%
Finance 902,231,656.00 930,332,000.00 1,138,976,380.5 -208,644,380.5 208,644,380.5 18%
Trade And Industry 156,589,163.00 134,575,000.00 197,678,009.8 -63,103,009.8 63,103,009.8 32%
Development Planning 811,679,252.00 787,179,000.00 1,024,663,112.2 -237,484,112.2 237,484,112.2 23%
Justice, Human Rights And Correctional Services
208,371,685.00 182,963,000.00 263,048,216.0 -80,085,216.0 80,085,216.0 30%
Home Affairs 221,004,218.00 195,565,000.00 278,995,513.6 -83,430,513.6 83,430,513.6 30%
Prime Minister 107,440,651.00 106,809,000.00 135,632,975.2 -28,823,975.2 28,823,975.2 21%
Communication, Science And Technology 356,599,597.00 280,263,000.00 450,170,990.5 -169,907,990.5 169,907,990.5 38%
Law And Constitutional Affairs 61,335,665.00 61,905,000.00 77,430,084.9 -15,525,084.9 15,525,084.9 20%
Foreign Affairs And International Relations
329,995,431.00 302,303,000.00 416,585,916.8 -114,282,916.8 114,282,916.8 27%
Public Works And Transport 828,291,326.00 1,149,473,000.00 1,045,634,178.5 103,838,821.5 103,838,821.5 10%
Forestry And Land Reclamation 212,824,922.00 207,365,000.00 268,669,978.2 -61,304,978.2 61,304,978.2 23%
Energy, Meteorology And Water Affairs 581,795,587.00 494,530,000.00 734,458,193.1 -239,928,193.1 239,928,193.1 33%
Labour And Employment 59,437,773.00 53,524,000.00 75,034,187.8 -21,510,187.8 21,510,187.8 29%
Tourism, Environment And Culture 146,436,145.00 117,904,000.00 184,860,849.5 -66,956,849.5 66,956,849.5 36%
Auditor General Office 27,378,859.00 26,101,000.00 34,563,045.4 -8,462,045.4 8,462,045.4 24%
His Majesty's Office 30,741,246.00 8,148,000.00 38,807,719.6 -30,659,719.6 30,659,719.6 79%
Public Services Commission 7,417,330.00 6,965,000.00 9,363,630.3 -2,398,630.3 2,398,630.3 26%
21 (= Sum Of Rest) 2,606,365,828.00 5,996,910,231.00 3,290,273,730.9 2,706,636,500.1 2,706,636,500.1 82%
Allocated Expenditure 11,757,003,695.00 14,842,030,231.00 14,842,030,231.0 0.0 5,620,950,643.1
Contingency 100,000,000.00 88,315,769.00
Total Expenditure 11,857,003,695.00 14,930,346,000.00
Overall (PI-1) Variance
25.9%
Composition (PI-2) Variance
-
37.9%
Contingency Share Of Budget
0.7%

134
Table 1.2C: Analysis for PI-1 Fiscal Year 2015/2016
Data For Year = 2015/16
Administrative Or Functional Head Budget Actual Adjusted Budget
Deviation Absolute Deviation
Percent
Agriculture And Food Security 318,492,774.00 279,412,000.00 419,170,803.7 -139,758,803.7 139,758,803.7 33.3%
Health 1,812,085,199.00 1,709,912,000.00 2,384,899,348.7 -674,987,348.7 674,987,348.7 28.3%
Education And Training 2,180,565,154.00 2,149,490,000.00 2,869,858,668.1 -720,368,668.1 720,368,668.1 25.1%
Finance 880,690,898.00 1,190,546,000.00 1,159,084,103.9 31,461,896.1 31,461,896.1 2.7%
Trade And Industry 89,756,814.00 83,046,000.00 118,129,637.3 -35,083,637.3 35,083,637.3 29.7%
Development Planning 861,647,425.00 858,685,000.00 1,134,020,841.8 -275,335,841.8 275,335,841.8 24.3%
Justice, Human Rights And Correctional Services
240,705,819.00 261,645,000.00 316,794,790.5 -55,149,790.5 55,149,790.5 17.4%
Home Affairs 271,723,517.00 285,544,000.00 357,617,422.8 -72,073,422.8 72,073,422.8 20.2%
Prime Minister 118,267,867.00 260,194,000.00 155,653,254.7 104,540,745.3 104,540,745.3 67.2%
Communication, Science And Technology 324,557,604.00 432,795,000.00 427,152,773.4 5,642,226.6 5,642,226.6 1.3%
Law And Constitutional Affairs 75,520,880.00 77,928,000.00 99,393,614.4 -21,465,614.4 21,465,614.4 21.6%
Foreign Affairs And International Relations
354,565,421.00 326,936,000.00 466,646,293.5 -139,710,293.5 139,710,293.5 29.9%
Public Works And Transport 764,785,479.00 913,343,000.00 1,006,540,085.3 -93,197,085.3 93,197,085.3 9.3%
Forestry And Land Reclamation 204,495,702.00 203,342,000.00 269,138,375.4 -65,796,375.4 65,796,375.4 24.4%
Energy, Meteorology And Water Affairs 147,782,613.00 169,902,000.00 194,497,840.2 -24,595,840.2 24,595,840.2 12.6%
Labour And Employment 50,248,246.00 49,089,000.00 66,132,105.3 -17,043,105.3 17043105.28 25.8%
Tourism, Environment And Culture 156,280,345.00 136,910,000.00 205,681,771.0 -68,771,771.0 68771771.04 33.4%
Auditor General Office 26,144,858.00 26,977,000.00 34,409,449.9 -7,432,449.9 7432449.871 21.6%
His Majesty's Office 77,954,834.00 7,885,000.00 102,596,960.1 -94,711,960.1 94711960.09 92.3%
Public Services Commission 7,570,537.00 6,901,000.00 9,963,642.3 -3,062,642.3 3,062,642.3 30.7%
21 (= Sum Of Rest) 3,303,999,886.00 6,715,319,592.00 4,348,419,809.8 2,366,899,782.2 2,366,899,782.2 54.4%
Allocated Expenditure 12,267,841,872.00 16,145,801,592.0 16,145,801,592.0 0.0 5,017,089,300.5
Contingency 100,000,000.00 96,291,408.00
Total Expenditure 12,367,841,872.00 16,242,093,000.00
Overall (PI-1) Variance
31.3%
Composition (PI-2) Variance
-
31.1%
Contingency Share Of Budget
0.8%
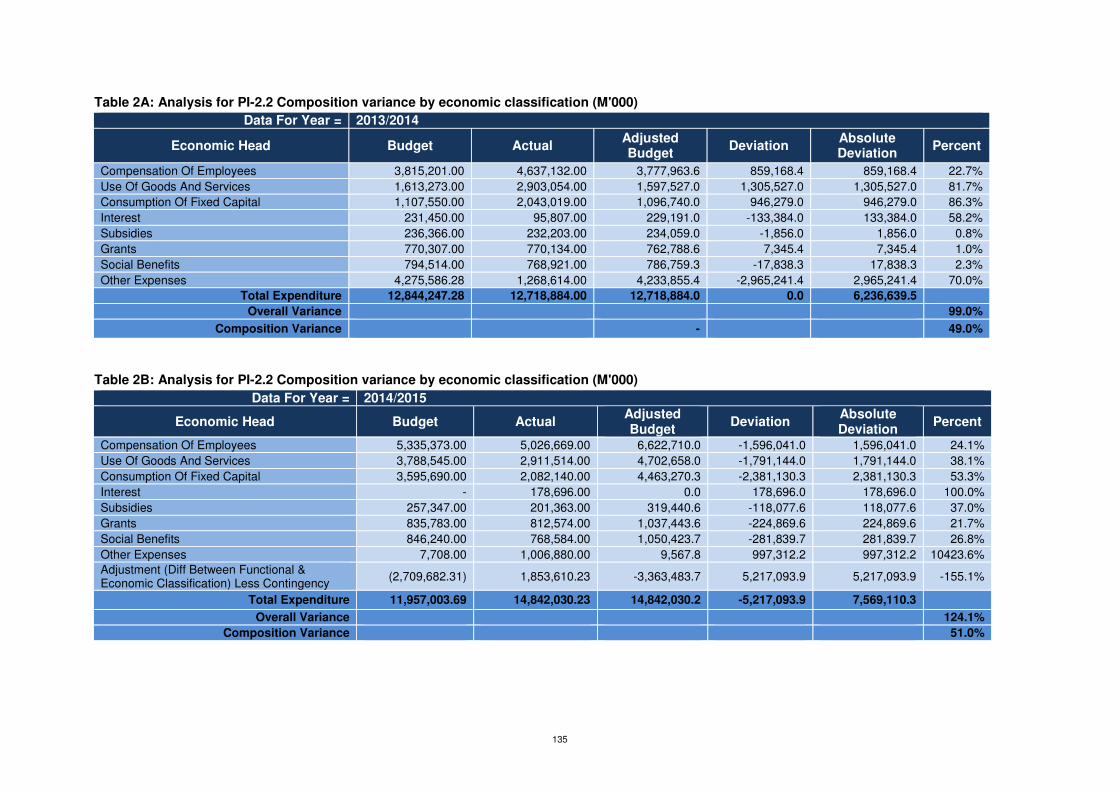
135
Table 2A: Analysis for PI-2.2 Composition variance by economic classification (M'000)
Data For Year = 2013/2014
Economic Head Budget Actual Adjusted Budget
Deviation Absolute Deviation
Percent
Compensation Of Employees 3,815,201.00 4,637,132.00 3,777,963.6 859,168.4 859,168.4 22.7%
Use Of Goods And Services 1,613,273.00 2,903,054.00 1,597,527.0 1,305,527.0 1,305,527.0 81.7%
Consumption Of Fixed Capital 1,107,550.00 2,043,019.00 1,096,740.0 946,279.0 946,279.0 86.3%
Interest 231,450.00 95,807.00 229,191.0 -133,384.0 133,384.0 58.2%
Subsidies 236,366.00 232,203.00 234,059.0 -1,856.0 1,856.0 0.8%
Grants 770,307.00 770,134.00 762,788.6 7,345.4 7,345.4 1.0%
Social Benefits 794,514.00 768,921.00 786,759.3 -17,838.3 17,838.3 2.3%
Other Expenses 4,275,586.28 1,268,614.00 4,233,855.4 -2,965,241.4 2,965,241.4 70.0%
Total Expenditure 12,844,247.28 12,718,884.00 12,718,884.0 0.0 6,236,639.5
Overall Variance
99.0%
Composition Variance
-
49.0%
Table 2B: Analysis for PI-2.2 Composition variance by economic classification (M'000)
Data For Year = 2014/2015
Economic Head Budget Actual Adjusted Budget
Deviation Absolute Deviation
Percent
Compensation Of Employees 5,335,373.00 5,026,669.00 6,622,710.0 -1,596,041.0 1,596,041.0 24.1%
Use Of Goods And Services 3,788,545.00 2,911,514.00 4,702,658.0 -1,791,144.0 1,791,144.0 38.1%
Consumption Of Fixed Capital 3,595,690.00 2,082,140.00 4,463,270.3 -2,381,130.3 2,381,130.3 53.3%
Interest - 178,696.00 0.0 178,696.0 178,696.0 100.0%
Subsidies 257,347.00 201,363.00 319,440.6 -118,077.6 118,077.6 37.0%
Grants 835,783.00 812,574.00 1,037,443.6 -224,869.6 224,869.6 21.7%
Social Benefits 846,240.00 768,584.00 1,050,423.7 -281,839.7 281,839.7 26.8%
Other Expenses 7,708.00 1,006,880.00 9,567.8 997,312.2 997,312.2 10423.6%
Adjustment (Diff Between Functional & Economic Classification) Less Contingency
(2,709,682.31) 1,853,610.23 -3,363,483.7 5,217,093.9 5,217,093.9 -155.1%
Total Expenditure 11,957,003.69 14,842,030.23 14,842,030.2 -5,217,093.9 7,569,110.3
Overall Variance
124.1%
Composition Variance
51.0%

136
Table 2C: Analysis for PI-2.2 Composition variance by economic classification (M'000)
Data For Year = 2015/2016
Economic Head Budget Actual Adjusted Budget
Deviation Absolute Deviation
Percent
Compensation Of Employees 5,585,495.00 5,606,712.00 7,233,192.0 -1,626,480.0 1,626,480.0 22.5%
Use Of Goods And Services 2,942,893.00 3,432,409.00 3,811,033.8 -378,624.8 378,624.8 9.9%
Consumption Of Fixed Capital 4,674,725.00 2,755,322.00 6,053,748.8 -3,298,426.8 3,298,426.8 54.5%
Interest 295,364.00 322,780.00 382,495.1 -59,715.1 59,715.1 15.6%
Subsidies 261,179.00 272,482.00 338,225.7 -65,743.7 65,743.7 19.4%
Grants 599,647.00 740,747.00 776,540.3 -35,793.3 35,793.3 4.6%
Social Benefits 865,741.00 1,060,927.00 1,121,130.9 -60,203.9 60,203.9 5.4%
Other Expenses 1,402,912.00 2,050,714.00 1,816,765.0 233,949.0 233,949.0 12.9%
Adjustment (Diff Between Functional & Economic Classification) Less Contingency
(4,160,114.13) (96,291.41) -5,387,329.9 5,291,038.5 5,291,038.5 -98.2%
Total Expenditure 12,467,841.87 16,145,801.59 16,145,801.6 0.0 11,049,975.0
Overall Variance
129.5%
Composition Variance
68.4%
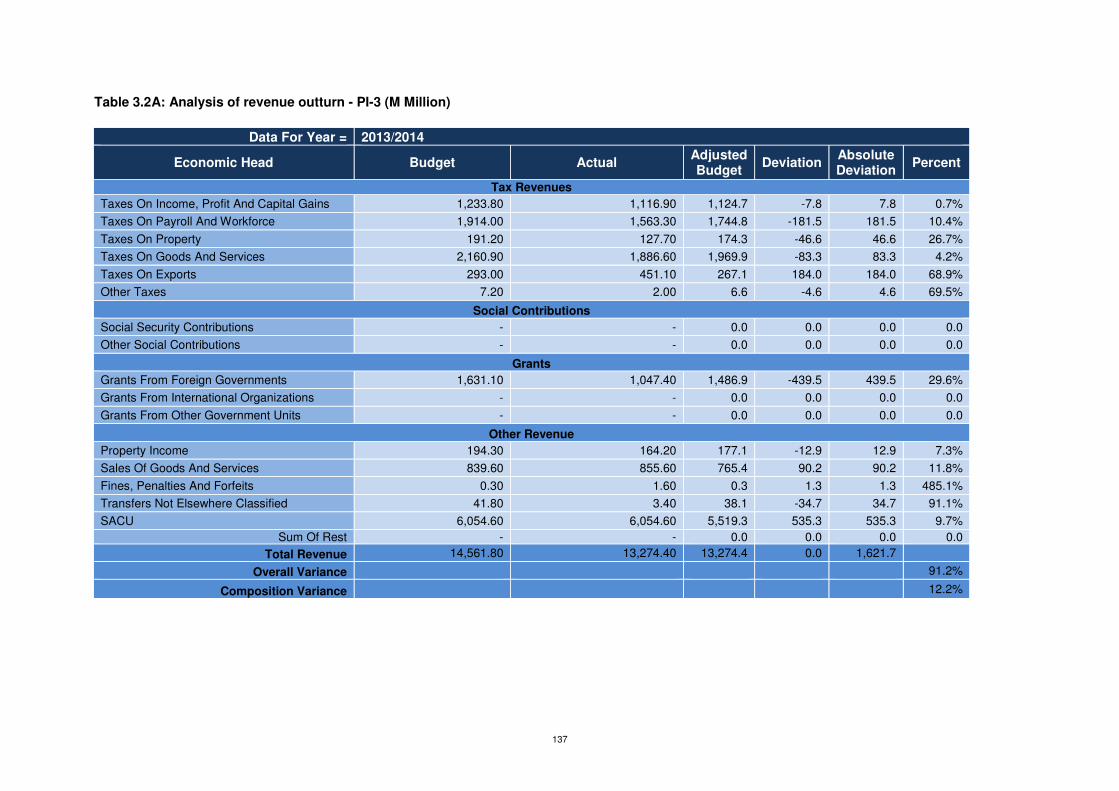
137
Table 3.2A: Analysis of revenue outturn - PI-3 (M Million)
Data For Year = 2013/2014
Economic Head Budget Actual Adjusted Budget
Deviation Absolute Deviation
Percent
Tax Revenues
Taxes On Income, Profit And Capital Gains 1,233.80 1,116.90 1,124.7 -7.8 7.8 0.7%
Taxes On Payroll And Workforce 1,914.00 1,563.30 1,744.8 -181.5 181.5 10.4%
Taxes On Property 191.20 127.70 174.3 -46.6 46.6 26.7%
Taxes On Goods And Services 2,160.90 1,886.60 1,969.9 -83.3 83.3 4.2%
Taxes On Exports 293.00 451.10 267.1 184.0 184.0 68.9%
Other Taxes 7.20 2.00 6.6 -4.6 4.6 69.5%
Social Contributions
Social Security Contributions - - 0.0 0.0 0.0 0.0
Other Social Contributions - - 0.0 0.0 0.0 0.0
Grants
Grants From Foreign Governments 1,631.10 1,047.40 1,486.9 -439.5 439.5 29.6%
Grants From International Organizations - - 0.0 0.0 0.0 0.0
Grants From Other Government Units - - 0.0 0.0 0.0 0.0
Other Revenue
Property Income 194.30 164.20 177.1 -12.9 12.9 7.3%
Sales Of Goods And Services 839.60 855.60 765.4 90.2 90.2 11.8%
Fines, Penalties And Forfeits 0.30 1.60 0.3 1.3 1.3 485.1%
Transfers Not Elsewhere Classified 41.80 3.40 38.1 -34.7 34.7 91.1%
SACU 6,054.60 6,054.60 5,519.3 535.3 535.3 9.7%
Sum Of Rest - - 0.0 0.0 0.0 0.0
Total Revenue 14,561.80 13,274.40 13,274.4 0.0 1,621.7
Overall Variance 91.2%
Composition Variance 12.2%

138
Table 3.2B: Analysis of revenue outturn - PI-3 (M Million) Data For Year = 2014/2015
Economic Head Budget Actual Adjusted Budget
Deviation Absolute Deviation
Percent
Tax Revenues
Taxes On Income, Profit And Capital Gains 1,328.00 1,306.83 1,328.7 -21.8 21.8 1.6%
Taxes On Payroll And Workforce 2,201.30 2,201.30 2,202.4 -1.1 1.1 0.0%
Taxes On Property 166.00 - 166.1 -166.1 166.1 100.0%
Taxes On Goods And Services 2,431.40 2,118.60 2,432.6 -314.0 314.0 12.9%
Taxes On Exports 227.70 - 227.8 -227.8 227.8 100.0%
Other Taxes 7.10 - 7.1 -7.1 7.1 100.0%
Social Contributions
Social Security Contributions - - 0.0 0.0 0.0 0.0
Other Social Contributions - - 0.0 0.0 0.0 0.0
Grants
Grants From Foreign Governments 1,043.90 325.78 1,044.4 -718.6 718.6 68.8%
Grants From International Organizations
0.0 0.0 0.0 0.0
Grants From Other Government Units
0.0 0.0 0.0 0.0
Other Revenue
Property Income 357.4 223.65 357.6 -133.9 133.9 37.5%
Sales Of Goods And Services 905.3 1,022.00 905.7 116.3 116.3 12.8%
Fines, Penalties And Forfeits 1.4 - 1.4 -1.4 1.4 100.0%
Transfers Not Elsewhere Classified 50.4 1,529.52 50.4 1,479.1 1,479.1 2933.3%
SACU 7,034.10 7,034.07 7,037.6 -3.5 3.5 0.0%
Sum Of Rest - - 0.0 0.0 0.0 #DIV/0!
Total Revenue 15,754.00 15,761.75 15,761.7 0.0 3,190.7
Overall Variance
100.0%
Composition Variance
-
20.2%
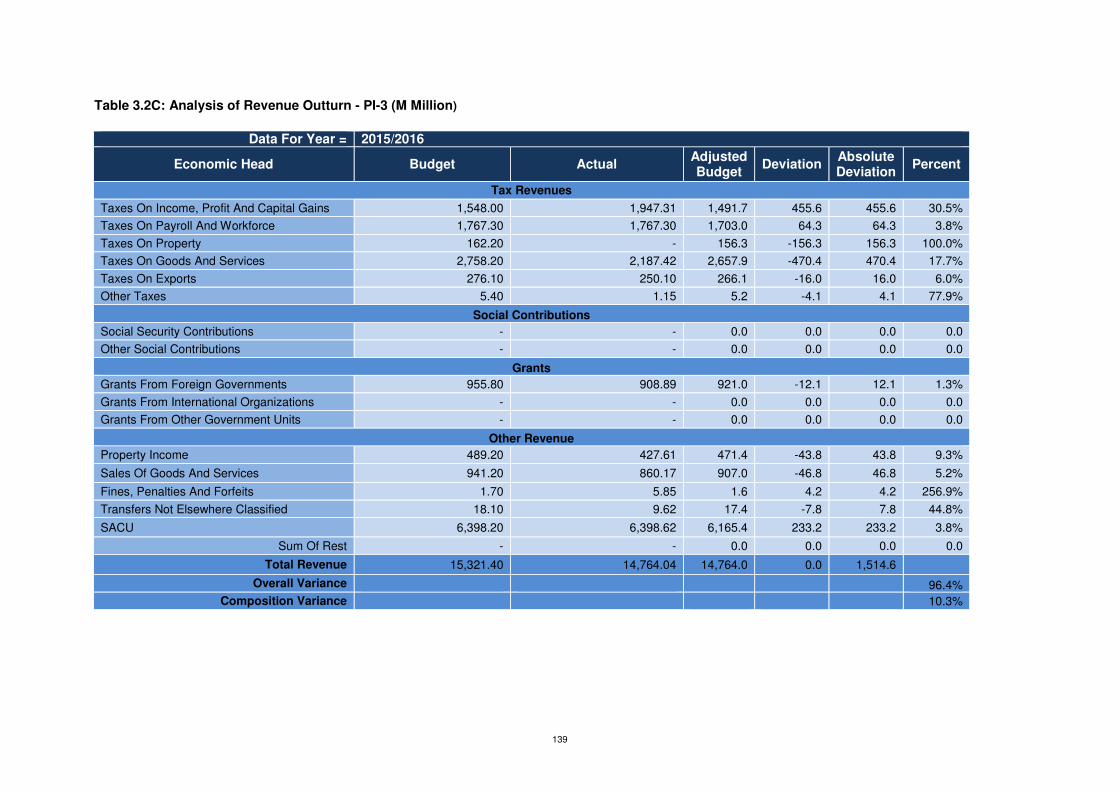
139
Table 3.2C: Analysis of Revenue Outturn - PI-3 (M Million)
Data For Year = 2015/2016
Economic Head Budget Actual Adjusted Budget
Deviation Absolute Deviation
Percent
Tax Revenues
Taxes On Income, Profit And Capital Gains 1,548.00 1,947.31 1,491.7 455.6 455.6 30.5%
Taxes On Payroll And Workforce 1,767.30 1,767.30 1,703.0 64.3 64.3 3.8%
Taxes On Property 162.20 - 156.3 -156.3 156.3 100.0%
Taxes On Goods And Services 2,758.20 2,187.42 2,657.9 -470.4 470.4 17.7%
Taxes On Exports 276.10 250.10 266.1 -16.0 16.0 6.0%
Other Taxes 5.40 1.15 5.2 -4.1 4.1 77.9%
Social Contributions
Social Security Contributions - - 0.0 0.0 0.0 0.0
Other Social Contributions - - 0.0 0.0 0.0 0.0
Grants
Grants From Foreign Governments 955.80 908.89 921.0 -12.1 12.1 1.3%
Grants From International Organizations - - 0.0 0.0 0.0 0.0
Grants From Other Government Units - - 0.0 0.0 0.0 0.0
Other Revenue
Property Income 489.20 427.61 471.4 -43.8 43.8 9.3%
Sales Of Goods And Services 941.20 860.17 907.0 -46.8 46.8 5.2%
Fines, Penalties And Forfeits 1.70 5.85 1.6 4.2 4.2 256.9%
Transfers Not Elsewhere Classified 18.10 9.62 17.4 -7.8 7.8 44.8%
SACU 6,398.20 6,398.62 6,165.4 233.2 233.2 3.8%
Sum Of Rest - - 0.0 0.0 0.0 0.0
Total Revenue 15,321.40 14,764.04 14,764.0 0.0 1,514.6
Overall Variance 96.4%
Composition Variance
10.3%
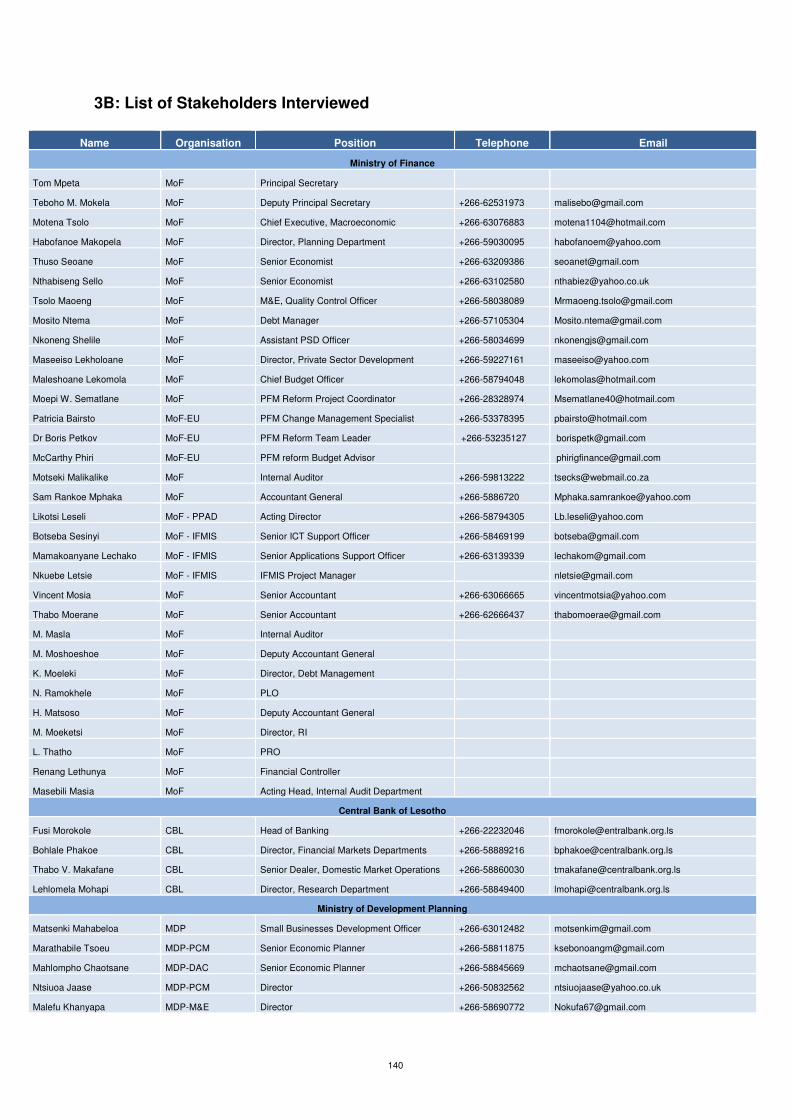
140
3B: List of Stakeholders Interviewed
Name Organisation Position Telephone Email
Ministry of Finance
Tom Mpeta MoF Principal Secretary
Teboho M. Mokela MoF Deputy Principal Secretary +266-62531973 [email protected]
Motena Tsolo MoF Chief Executive, Macroeconomic +266-63076883 [email protected]
Habofanoe Makopela MoF Director, Planning Department +266-59030095 [email protected]
Thuso Seoane MoF Senior Economist +266-63209386 [email protected]
Nthabiseng Sello MoF Senior Economist +266-63102580 [email protected]
Tsolo Maoeng MoF M&E, Quality Control Officer +266-58038089 [email protected]
Mosito Ntema MoF Debt Manager +266-57105304 [email protected]
Nkoneng Shelile MoF Assistant PSD Officer +266-58034699 [email protected]
Maseeiso Lekholoane MoF Director, Private Sector Development +266-59227161 [email protected]
Maleshoane Lekomola MoF Chief Budget Officer +266-58794048 [email protected]
Moepi W. Sematlane MoF PFM Reform Project Coordinator +266-28328974 [email protected]
Patricia Bairsto MoF-EU PFM Change Management Specialist +266-53378395 [email protected]
Dr Boris Petkov MoF-EU PFM Reform Team Leader +266-53235127 [email protected]
McCarthy Phiri MoF-EU PFM reform Budget Advisor [email protected]
Motseki Malikalike MoF Internal Auditor +266-59813222 [email protected]
Sam Rankoe Mphaka MoF Accountant General +266-5886720 [email protected]
Likotsi Leseli MoF - PPAD Acting Director +266-58794305 [email protected]
Botseba Sesinyi MoF - IFMIS Senior ICT Support Officer +266-58469199 [email protected]
Mamakoanyane Lechako MoF - IFMIS Senior Applications Support Officer +266-63139339 [email protected]
Nkuebe Letsie MoF - IFMIS IFMIS Project Manager [email protected]
Vincent Mosia MoF Senior Accountant +266-63066665 [email protected]
Thabo Moerane MoF Senior Accountant +266-62666437 [email protected]
M. Masla MoF Internal Auditor
M. Moshoeshoe MoF Deputy Accountant General
K. Moeleki MoF Director, Debt Management
N. Ramokhele MoF PLO
H. Matsoso MoF Deputy Accountant General
M. Moeketsi MoF Director, RI
L. Thatho MoF PRO
Renang Lethunya MoF Financial Controller
Masebili Masia MoF Acting Head, Internal Audit Department
Central Bank of Lesotho
Fusi Morokole CBL Head of Banking +266-22232046 [email protected]
Bohlale Phakoe CBL Director, Financial Markets Departments +266-58889216 [email protected]
Thabo V. Makafane CBL Senior Dealer, Domestic Market Operations +266-58860030 [email protected]
Lehlomela Mohapi CBL Director, Research Department +266-58849400 [email protected]
Ministry of Development Planning
Matsenki Mahabeloa MDP Small Businesses Development Officer +266-63012482 [email protected]
Marathabile Tsoeu MDP-PCM Senior Economic Planner +266-58811875 [email protected]
Mahlompho Chaotsane MDP-DAC Senior Economic Planner +266-58845669 [email protected]
Ntsiuoa Jaase MDP-PCM Director +266-50832562 [email protected]
Malefu Khanyapa MDP-M&E Director +266-58690772 [email protected]
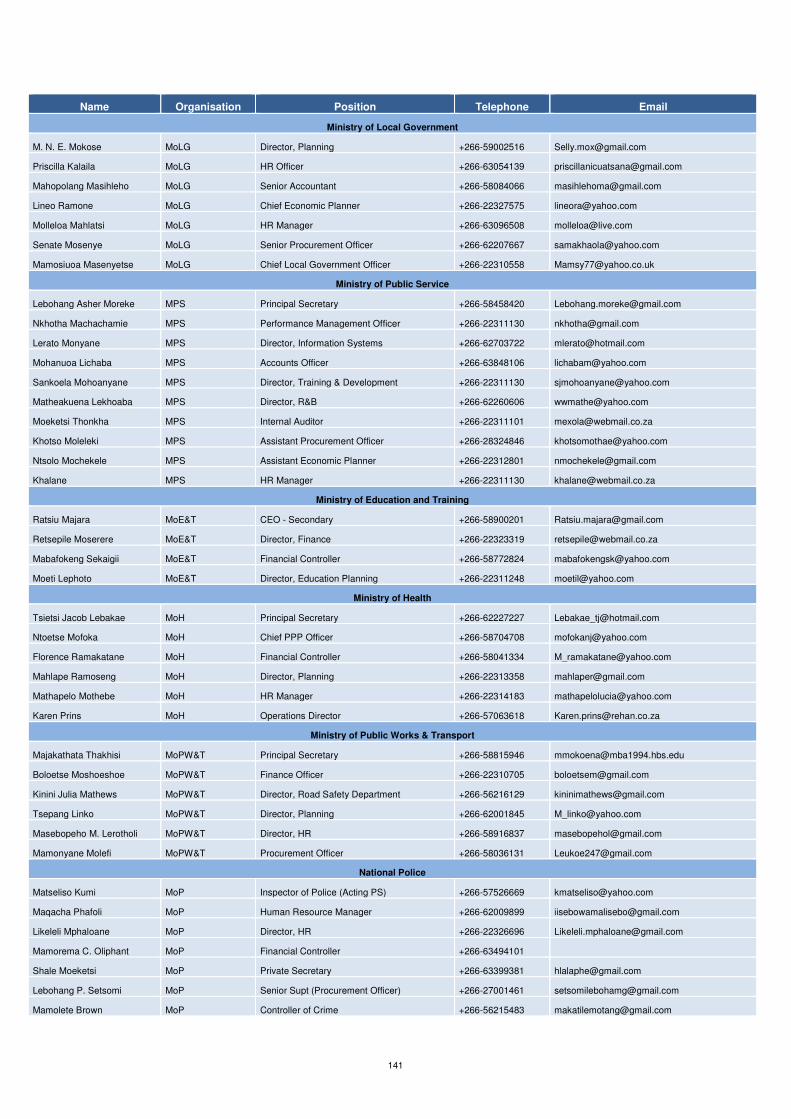
141
Name Organisation Position Telephone Email
Ministry of Local Government
M. N. E. Mokose MoLG Director, Planning +266-59002516 [email protected]
Priscilla Kalaila MoLG HR Officer +266-63054139 [email protected]
Mahopolang Masihleho MoLG Senior Accountant +266-58084066 [email protected]
Lineo Ramone MoLG Chief Economic Planner +266-22327575 [email protected]
Molleloa Mahlatsi MoLG HR Manager +266-63096508 [email protected]
Senate Mosenye MoLG Senior Procurement Officer +266-62207667 [email protected]
Mamosiuoa Masenyetse MoLG Chief Local Government Officer +266-22310558 [email protected]
Ministry of Public Service
Lebohang Asher Moreke MPS Principal Secretary +266-58458420 [email protected]
Nkhotha Machachamie MPS Performance Management Officer +266-22311130 [email protected]
Lerato Monyane MPS Director, Information Systems +266-62703722 [email protected]
Mohanuoa Lichaba MPS Accounts Officer +266-63848106 [email protected]
Sankoela Mohoanyane MPS Director, Training & Development +266-22311130 [email protected]
Matheakuena Lekhoaba MPS Director, R&B +266-62260606 [email protected]
Moeketsi Thonkha MPS Internal Auditor +266-22311101 [email protected]
Khotso Moleleki MPS Assistant Procurement Officer +266-28324846 [email protected]
Ntsolo Mochekele MPS Assistant Economic Planner +266-22312801 [email protected]
Khalane MPS HR Manager +266-22311130 [email protected]
Ministry of Education and Training
Ratsiu Majara MoE&T CEO - Secondary +266-58900201 [email protected]
Retsepile Moserere MoE&T Director, Finance +266-22323319 [email protected]
Mabafokeng Sekaigii MoE&T Financial Controller +266-58772824 [email protected]
Moeti Lephoto MoE&T Director, Education Planning +266-22311248 [email protected]
Ministry of Health
Tsietsi Jacob Lebakae MoH Principal Secretary +266-62227227 [email protected]
Ntoetse Mofoka MoH Chief PPP Officer +266-58704708 [email protected]
Florence Ramakatane MoH Financial Controller +266-58041334 [email protected]
Mahlape Ramoseng MoH Director, Planning +266-22313358 [email protected]
Mathapelo Mothebe MoH HR Manager +266-22314183 [email protected]
Karen Prins MoH Operations Director +266-57063618 [email protected]
Ministry of Public Works & Transport
Majakathata Thakhisi MoPW&T Principal Secretary +266-58815946 [email protected]
Boloetse Moshoeshoe MoPW&T Finance Officer +266-22310705 [email protected]
Kinini Julia Mathews MoPW&T Director, Road Safety Department +266-56216129 [email protected]
Tsepang Linko MoPW&T Director, Planning +266-62001845 [email protected]
Masebopeho M. Lerotholi MoPW&T Director, HR +266-58916837 [email protected]
Mamonyane Molefi MoPW&T Procurement Officer +266-58036131 [email protected]
National Police
Matseliso Kumi MoP Inspector of Police (Acting PS) +266-57526669 [email protected]
Maqacha Phafoli MoP Human Resource Manager +266-62009899 [email protected]
Likeleli Mphaloane MoP Director, HR +266-22326696 [email protected]
Mamorema C. Oliphant MoP Financial Controller +266-63494101
Shale Moeketsi MoP Private Secretary +266-63399381 [email protected]
Lebohang P. Setsomi MoP Senior Supt (Procurement Officer) +266-27001461 [email protected]
Mamolete Brown MoP Controller of Crime +266-56215483 [email protected]

142
Name Organisation Position Telephone Email
Tumisang Bereng MoP Director of Finance +266-62008461 [email protected]
Maleloko Lucia Petje MoP Inspector of Police (Revenue Office) +266-58998144 [email protected]
Office of the Auditor General
Lucy Liphafa OAG Auditor General +266-62883490 [email protected]
Kopano Mou OAG Assistant Auditor General +266-58854329 [email protected]
Refiloe Thakaso OAG Assistant Auditor General +266-58858283 [email protected]
Liello Matekane OAG Principal Auditor +266-62660071 [email protected]
National Assembly
Libuseng Majoro National Assembly Deputy Clerk +266-58870715 [email protected]
Mosito Lelimo National Assembly Assistant Deputy Clerk +266-57255705 [email protected]
Lerato Lehohla National Assembly Committee Clerk (Portfolio Committee) +266-58946473 [email protected]
Hon. Semano Sekatle National Assembly Chairman, Economic Cluster +266-58852305 [email protected]
Kenneth M. Dye National Assembly Consultant, Public Accounts Committee +1-6133166420 [email protected]
Ithabeleng Molefi National Assembly Committee Clerk (PAC) +266-58067377 [email protected]
Teboho Handy National Assembly Committee Clerk (PAC) +266-58793644
State Owned Enterprises/ Parastatals/ Extra-Budgetary Units
Soai Soai WASCO Accountant +266-22262167 [email protected]
Lerato Mokuoane WASCO Stores Accounting Manager +266-22262039 [email protected]
Tselane Mohapi WASCO Financial Accounting Manager +266-22262019 [email protected]
Mariam Ratsiu WASCO Credit Control Manager +266-22262031 [email protected]
L. Mochelanyane Lerotholi Poly Acting Bursar +266-63069940 [email protected]
Linthe Thomae LEC Acting General Manager, Finance +266-52272236 [email protected]
Lefa Motlalane LEC Head, Corporate Planning +266-52272257 [email protected]
Nqosa Mahao NUL Vice Chancellor +266-63058501 [email protected]
Mosan Masilo NUL SFO +266-50484966 [email protected]
Kenneth Hlasa NUL Bursar +266-62854437 [email protected]
Lesotho Revenue Authority
Lebohang Kaaba LRA Manager, Investigations +266-52115368 [email protected]
Mathato Thoothe LRA Senior Revenue Analyst +266-52215586 [email protected]
Lefielo Lefielo LRA Manager, Clearance +266-58020998 [email protected]
Kopano Ralitsebe LRA Senior Stakeholder Relations Office +266-62995449 [email protected]
Makahlolo Qhobela LRA Manager, LTPS +266-52215737 [email protected]
Ntseliseng Letsoela LRA Manager, Debt +266-52215047 [email protected]
Motlalepula Nkhabu LRA Manager, Audit +266-52215047 [email protected]
Ithabeleng Theko LRA Manager, Audit +266-52215738 [email protected]
Teboho Mosito LRA Manager, Case Selection +266-52215499 [email protected]
Reentseng Mosaase LRA Manager, Maseru Bridge +266-52215189 [email protected]
Munthatsi Dichaba LRA Senior Manager +266-52215131 [email protected]
Lieketseng Lipholo LRA Deputy Commissioner, Customs +266-63008085 [email protected]
Tseko Nyesemane LRA Deputy Commissioner, Customs +266-52215137 [email protected]
Bahlakoana Shelile LRA Deputy Commissioner, Intelligence +266-52215055 [email protected]
Development Partners
Dr. Michael Doyle EU Delegation Ambassador +266-22272212
Jyrki Torni EU Delegation First Secretary, Operations Manager +266-22272212 [email protected]
Janet Entwistle World Bank Country Representative [email protected]
Gert Van Der Linde World Bank Task Team Leader +27828076653 [email protected]

143
Name Organisation Position Telephone Email
Jenifer B. Wakhungu UNCDF Regional Technical Advisor +266-56048530 [email protected]
Guy Anderson IMF Technical Advisor [email protected]
Bruno Rocha IMF Technical Advisor
Devinder Goyal AfDB Regional Financial [email protected]
Civil Society Organisations/Non-State Actors
Fako Hakane LCCI Secretary General +266-62862592 [email protected]
Tseko A. Bohloa LCCI Consultant +266-58580415 [email protected]
Chareli Ramolise LCCI Member +266-62000213 [email protected]
Stephen Monyamane LCCI Member +266-51653043 [email protected]

144
3C: Documents consulted
General documentation Legal and Regulatory Framework
• The 1993 Constitution
• LRA Act 2001
• Audit Act 1973
• PFM & Accountability Act 2011
• Treasury Regulation 2014
• Public Service Act, Act No 1 of 2005 as amended
• Public Services Regulations 2008
• Procurement Regulations 2006
• Loans and Guarantees Act - Act 15 of 1967
• Local Loans Act - Act 13 of 2001
• Customs & Excise Act - Act 10 of 1982 as amended
• Income Tax Act 1993 as amended
• Revenues Appeals Tribunal Act 2005
• VAT Act 2001 as amended
Budget Documents
• National Budget 2013/2014 to 2016/2017
• Appropriations Acts 2013/2014; 2014/2015; 2015/2016; 2016/2017
• Budget Call Circular 2016/2017
• Budget Strategy Paper 2016/2017
• Budget Speeches 2013/2014 to 2016/2017
• Citizen's budget 2016/2017
• Budget & Fiscal bulletin quarter 1, 2, & 3 FY2015/2016
• Budget Calendar
Auditor-General Annual Reports
• AG audit report on GoL consolidated financial statements FY2012/2013
• AG audit report on GoL consolidated financial statements FY2013/2014
• Status of SOEs, district councils, parastatals audited by AG
Accountant General Reports/Treasury Documents
• Consolidated annual financial statements 2013/2014 to 2015/2016
• Treasury instructions on opening of bank accounts
• Chart of Accounts
• IPSAS implementation guide
• Guide to IPSAS Cash
Parliament
• Standing orders of the National Assembly
• Parliament Powers and Privileges Act 1994
• Report of Parliament Public Accounts Committee 2008/2009
Other official documents
• Lesotho Partnership Policy - November 2013

145
• IMF FAD Report: Strengthening Medium-Term Budget Planning, Cash Management and
Fiscal Reporting - September 2016
• LRA tax leaflet: Declare, Pay and Proceed to Border
• LRA tax leaflet: Tax Guide on Taxation of Employment Income
• LRA tax leaflet: Easy Guide to Filing Your Income Tax Return
• LRA tax leaflet: Taxation of Employment Income Tax – PAYE
• LRA Strategic Plan 2014-2019
• LRA Annual Progress Report 2015/2016, dated June 2016
• LRA Quarterly Report - Q1 2016/2017 & Q2 2016/2017
• Annual Debt Bulletin 2015/2016
• Lesotho National Indicative Programme under the 11th EDF for the period 2014-2020
• PFM Programme Estimate
• GFS 2014 Manual
• IFMIS Application Manual
• World Bank Credit Facility - support to PFM for USD5.5million, January 2014
• IMF Article IV Report, February 2016
• IMF Debt Sustainability Analysis for Government of Lesotho, June 201
• 2008 and 2012 PEFA Reports
• National Vision 2020 Document
• Lesotho PFM Reform Action Plan 2012-2017/2018
• World Bank Country Survey 2014
• Strategy paper on Government Bank Reconciliation, February 2016 - Arun Kumar
• African Governance Report IV, 2016
• Draft Development Cooperation Report, October 2016
• Audit Report - Effectiveness of IFMIS, January 2016
• Ministry of Education Strategic Plan 2016-2026
• LRA Charter
• Court of Appeal Judgment - between LRA and Zainab Moosa
• LRA annual enforcement plan
• LRA Public Ruling on VAT on hire purchase
• PFM Annual Report, 2016
• Transparency International Report on Lesotho - 2015
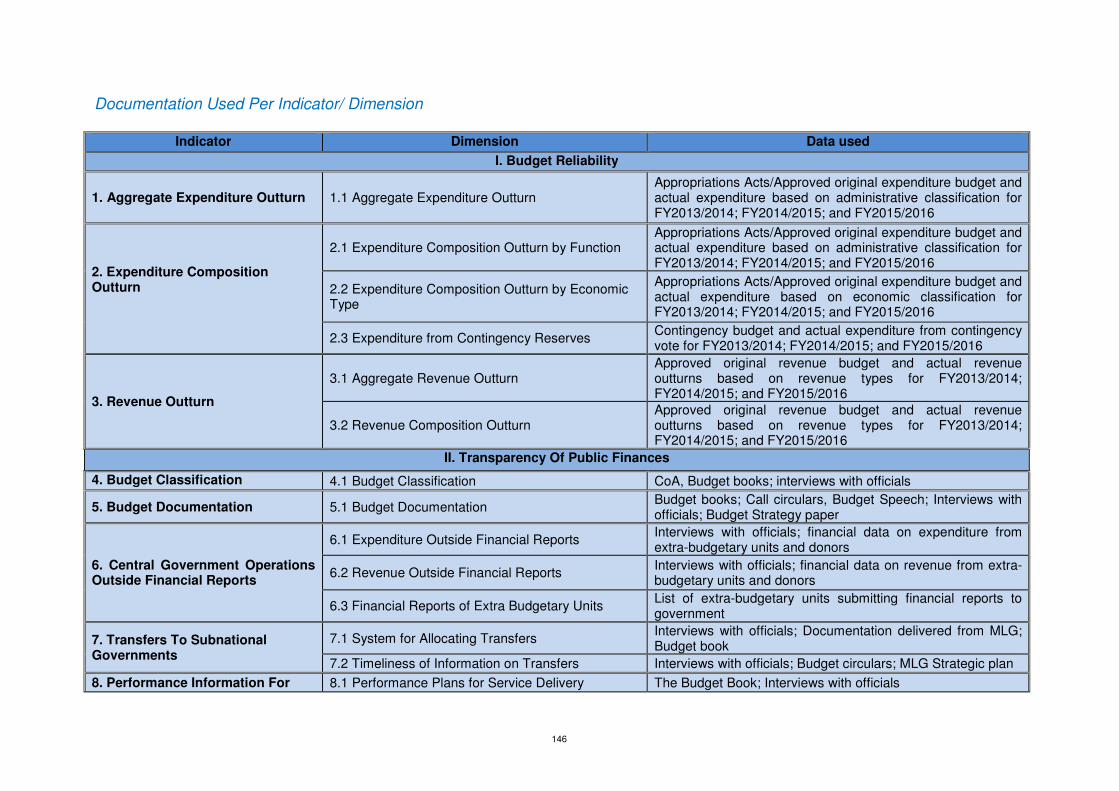
146
Documentation Used Per Indicator/ Dimension
Indicator Dimension Data used
I. Budget Reliability
1. Aggregate Expenditure Outturn 1.1 Aggregate Expenditure Outturn Appropriations Acts/Approved original expenditure budget and actual expenditure based on administrative classification for FY2013/2014; FY2014/2015; and FY2015/2016
2. Expenditure Composition Outturn
2.1 Expenditure Composition Outturn by Function Appropriations Acts/Approved original expenditure budget and actual expenditure based on administrative classification for FY2013/2014; FY2014/2015; and FY2015/2016
2.2 Expenditure Composition Outturn by Economic Type
Appropriations Acts/Approved original expenditure budget and actual expenditure based on economic classification for FY2013/2014; FY2014/2015; and FY2015/2016
2.3 Expenditure from Contingency Reserves Contingency budget and actual expenditure from contingency vote for FY2013/2014; FY2014/2015; and FY2015/2016
3. Revenue Outturn
3.1 Aggregate Revenue Outturn Approved original revenue budget and actual revenue outturns based on revenue types for FY2013/2014; FY2014/2015; and FY2015/2016
3.2 Revenue Composition Outturn Approved original revenue budget and actual revenue outturns based on revenue types for FY2013/2014; FY2014/2015; and FY2015/2016
II. Transparency Of Public Finances
4. Budget Classification 4.1 Budget Classification CoA, Budget books; interviews with officials
5. Budget Documentation 5.1 Budget Documentation Budget books; Call circulars, Budget Speech; Interviews with officials; Budget Strategy paper
6. Central Government Operations Outside Financial Reports
6.1 Expenditure Outside Financial Reports Interviews with officials; financial data on expenditure from extra-budgetary units and donors
6.2 Revenue Outside Financial Reports Interviews with officials; financial data on revenue from extra-budgetary units and donors
6.3 Financial Reports of Extra Budgetary Units List of extra-budgetary units submitting financial reports to government
7. Transfers To Subnational Governments
7.1 System for Allocating Transfers Interviews with officials; Documentation delivered from MLG; Budget book
7.2 Timeliness of Information on Transfers Interviews with officials; Budget circulars; MLG Strategic plan
8. Performance Information For 8.1 Performance Plans for Service Delivery The Budget Book; Interviews with officials

147
Service Delivery 8.2 Performance Achieved For Service Delivery The Budget Book; Interviews with officials
8.3 Resources Received By Service Delivery Units The Budget Book; Interviews with officials
8.4 Performance Evaluation For Service Delivery Interviews with officials
9. Public Access To Fiscal Information
9.1 Public Access To Fiscal Information Government website; Ministry of Finance website
III. Management Of Assets And Liabilities
10. Fiscal Risk Reporting
10.1 Monitoring of Public Corporations Interviews with officials; Audit information from OAG; Informal documentation from MoF PDS
10.2 Monitoring of Subnational Governments Interviews with officials; Audit information from OAG; Informal documentation from MoF PDS
10.3 Contingent Liabilities and Other Fiscal Risks Interviews with officials; Documentation from Accountant General; Consolidated financial statements
11. Public Investment Management
11.1 Economic Analysis of Investment Proposals Samples on investment proposals from Ministry of Education, Health, Public Works
11.2 Investment Project Selection Guidelines for investment project selection; copies of minutes of meetings
11.3 Investment Project Costing Samples on investment proposals from Ministry of Education, Health, Public Works
11.4 Investment Project Monitoring Samples of periodic monitoring and evaluation; copies of project completion reports
12. Public Asset Management
12.1 Financial Asset Monitoring List of government equities in public and private business entities
12.2 Nonfinancial Asset Monitoring Interviews with stakeholders; samples of fixed asset register from Ministry of Public Service, Ministry of Finance
12.3 Transparency of Asset Disposal Public Financial Management Law 2011; Procurement Regulations 2006
13. Debt Management
13.1 Recording and Reporting of Debt and Guarantees
Debt report from MoF debt department; 2015/2016 draft financial statement from Accountant General's Department
13.2 Approval of Debt and Guarantees Public Financial Management Law 2011; Loans and Guarantees Act 1967; Local Loans Act 2001
13.3 Debt Management Strategy Debt management strategy 2013; IMF Article IV report 2015 on Lesotho
IV. Policy-Based Fiscal Strategy And Budgeting
14. Macroeconomic and Fiscal Forecasting
14.1 Macroeconomic Forecasts Interviews with officials in MoF MPMD and CBL; MTEF; Budget book Working documents; Budget Speech; Debt
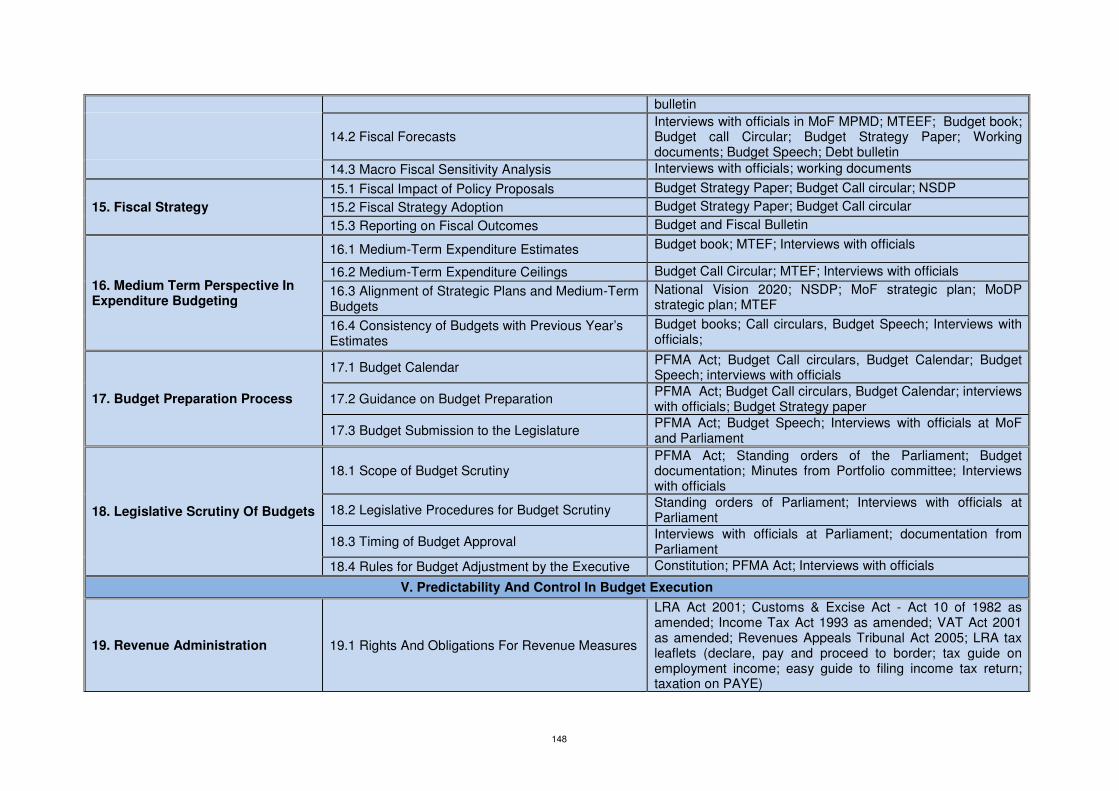
148
bulletin
14.2 Fiscal Forecasts Interviews with officials in MoF MPMD; MTEEF; Budget book; Budget call Circular; Budget Strategy Paper; Working documents; Budget Speech; Debt bulletin
14.3 Macro Fiscal Sensitivity Analysis Interviews with officials; working documents
15. Fiscal Strategy
15.1 Fiscal Impact of Policy Proposals Budget Strategy Paper; Budget Call circular; NSDP
15.2 Fiscal Strategy Adoption Budget Strategy Paper; Budget Call circular
15.3 Reporting on Fiscal Outcomes Budget and Fiscal Bulletin
16. Medium Term Perspective In Expenditure Budgeting
16.1 Medium-Term Expenditure Estimates Budget book; MTEF; Interviews with officials
16.2 Medium-Term Expenditure Ceilings Budget Call Circular; MTEF; Interviews with officials
16.3 Alignment of Strategic Plans and Medium-Term Budgets
National Vision 2020; NSDP; MoF strategic plan; MoDP strategic plan; MTEF
16.4 Consistency of Budgets with Previous Year’s Estimates
Budget books; Call circulars, Budget Speech; Interviews with officials;
17. Budget Preparation Process
17.1 Budget Calendar PFMA Act; Budget Call circulars, Budget Calendar; Budget Speech; interviews with officials
17.2 Guidance on Budget Preparation PFMA Act; Budget Call circulars, Budget Calendar; interviews with officials; Budget Strategy paper
17.3 Budget Submission to the Legislature PFMA Act; Budget Speech; Interviews with officials at MoF and Parliament
18. Legislative Scrutiny Of Budgets
18.1 Scope of Budget Scrutiny PFMA Act; Standing orders of the Parliament; Budget documentation; Minutes from Portfolio committee; Interviews with officials
18.2 Legislative Procedures for Budget Scrutiny Standing orders of Parliament; Interviews with officials at Parliament
18.3 Timing of Budget Approval Interviews with officials at Parliament; documentation from Parliament
18.4 Rules for Budget Adjustment by the Executive Constitution; PFMA Act; Interviews with officials
V. Predictability And Control In Budget Execution
19. Revenue Administration 19.1 Rights And Obligations For Revenue Measures
LRA Act 2001; Customs & Excise Act - Act 10 of 1982 as amended; Income Tax Act 1993 as amended; VAT Act 2001 as amended; Revenues Appeals Tribunal Act 2005; LRA tax leaflets (declare, pay and proceed to border; tax guide on employment income; easy guide to filing income tax return; taxation on PAYE)
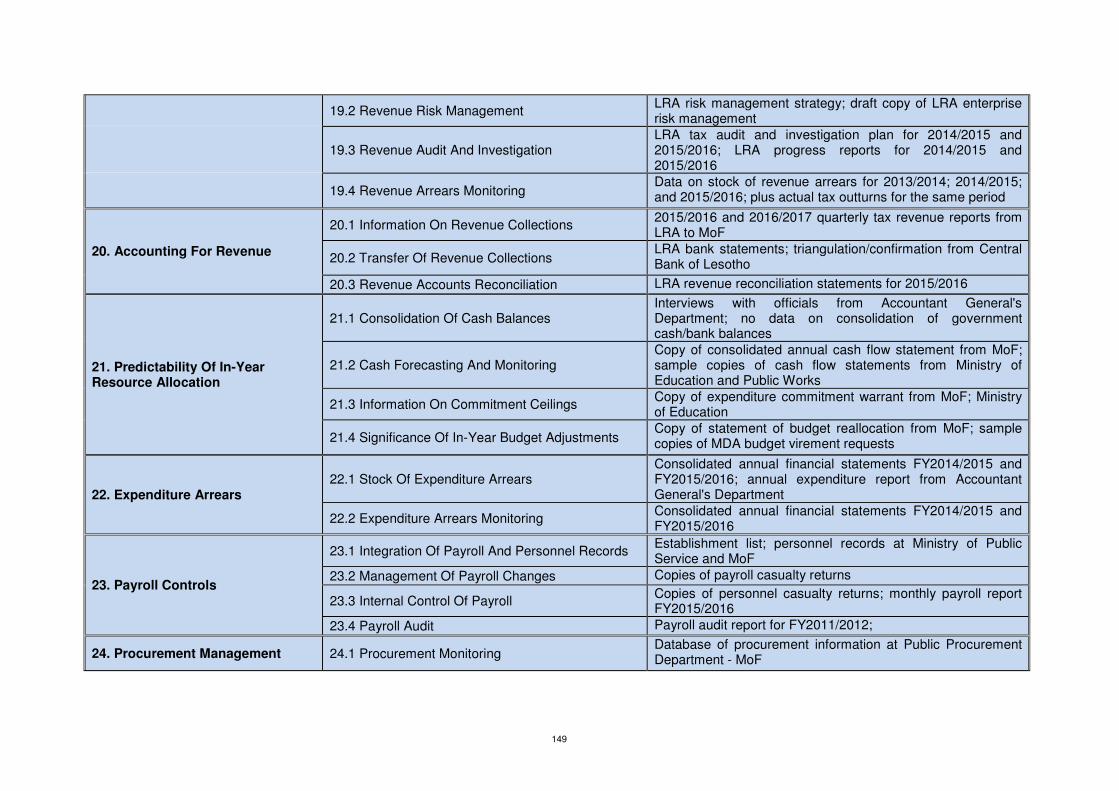
149
19.2 Revenue Risk Management LRA risk management strategy; draft copy of LRA enterprise risk management
19.3 Revenue Audit And Investigation LRA tax audit and investigation plan for 2014/2015 and 2015/2016; LRA progress reports for 2014/2015 and 2015/2016
19.4 Revenue Arrears Monitoring Data on stock of revenue arrears for 2013/2014; 2014/2015; and 2015/2016; plus actual tax outturns for the same period
20. Accounting For Revenue
20.1 Information On Revenue Collections 2015/2016 and 2016/2017 quarterly tax revenue reports from LRA to MoF
20.2 Transfer Of Revenue Collections LRA bank statements; triangulation/confirmation from Central Bank of Lesotho
20.3 Revenue Accounts Reconciliation LRA revenue reconciliation statements for 2015/2016
21. Predictability Of In-Year Resource Allocation
21.1 Consolidation Of Cash Balances Interviews with officials from Accountant General's Department; no data on consolidation of government cash/bank balances
21.2 Cash Forecasting And Monitoring Copy of consolidated annual cash flow statement from MoF; sample copies of cash flow statements from Ministry of Education and Public Works
21.3 Information On Commitment Ceilings Copy of expenditure commitment warrant from MoF; Ministry of Education
21.4 Significance Of In-Year Budget Adjustments Copy of statement of budget reallocation from MoF; sample copies of MDA budget virement requests
22. Expenditure Arrears 22.1 Stock Of Expenditure Arrears
Consolidated annual financial statements FY2014/2015 and FY2015/2016; annual expenditure report from Accountant General's Department
22.2 Expenditure Arrears Monitoring Consolidated annual financial statements FY2014/2015 and FY2015/2016
23. Payroll Controls
23.1 Integration Of Payroll And Personnel Records Establishment list; personnel records at Ministry of Public Service and MoF
23.2 Management Of Payroll Changes Copies of payroll casualty returns
23.3 Internal Control Of Payroll Copies of personnel casualty returns; monthly payroll report FY2015/2016
23.4 Payroll Audit Payroll audit report for FY2011/2012;
24. Procurement Management 24.1 Procurement Monitoring Database of procurement information at Public Procurement Department - MoF
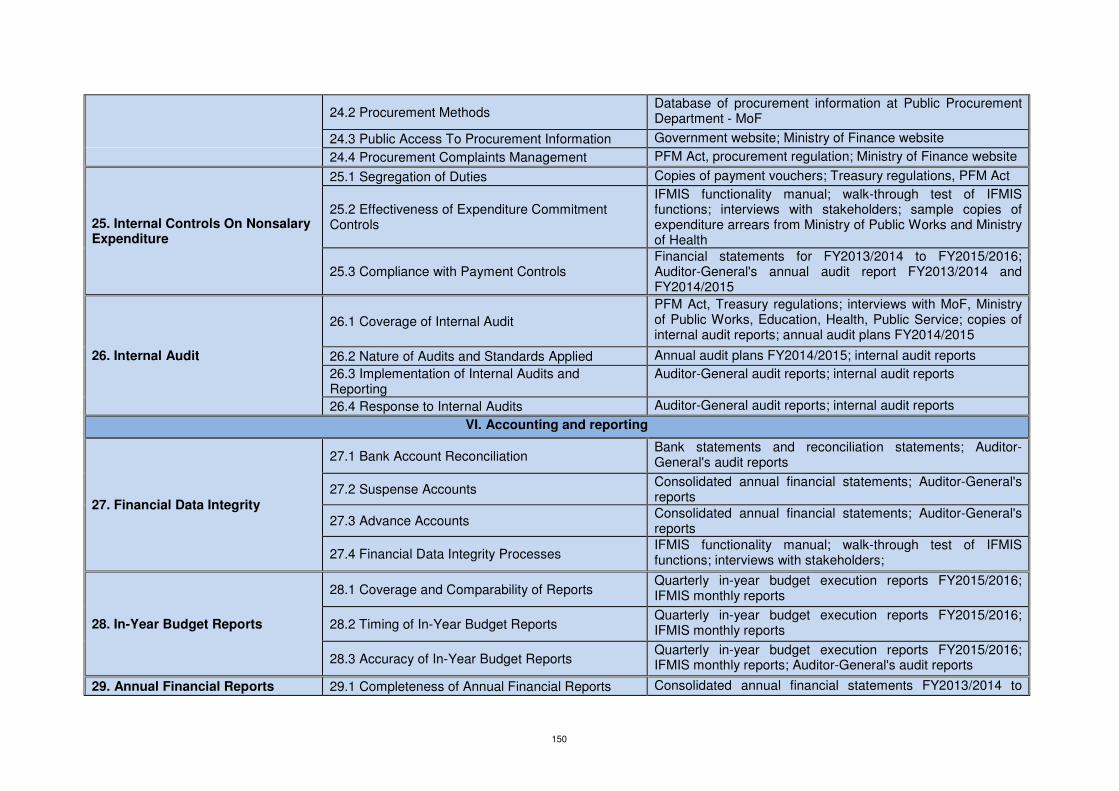
150
24.2 Procurement Methods Database of procurement information at Public Procurement Department - MoF
24.3 Public Access To Procurement Information Government website; Ministry of Finance website
24.4 Procurement Complaints Management PFM Act, procurement regulation; Ministry of Finance website
25. Internal Controls On Nonsalary Expenditure
25.1 Segregation of Duties Copies of payment vouchers; Treasury regulations, PFM Act
25.2 Effectiveness of Expenditure Commitment Controls
IFMIS functionality manual; walk-through test of IFMIS functions; interviews with stakeholders; sample copies of expenditure arrears from Ministry of Public Works and Ministry of Health
25.3 Compliance with Payment Controls Financial statements for FY2013/2014 to FY2015/2016; Auditor-General's annual audit report FY2013/2014 and FY2014/2015
26. Internal Audit
26.1 Coverage of Internal Audit
PFM Act, Treasury regulations; interviews with MoF, Ministry of Public Works, Education, Health, Public Service; copies of internal audit reports; annual audit plans FY2014/2015
26.2 Nature of Audits and Standards Applied Annual audit plans FY2014/2015; internal audit reports
26.3 Implementation of Internal Audits and Reporting
Auditor-General audit reports; internal audit reports
26.4 Response to Internal Audits Auditor-General audit reports; internal audit reports
VI. Accounting and reporting
27. Financial Data Integrity
27.1 Bank Account Reconciliation Bank statements and reconciliation statements; Auditor-General's audit reports
27.2 Suspense Accounts Consolidated annual financial statements; Auditor-General's reports
27.3 Advance Accounts Consolidated annual financial statements; Auditor-General's reports
27.4 Financial Data Integrity Processes IFMIS functionality manual; walk-through test of IFMIS functions; interviews with stakeholders;
28. In-Year Budget Reports
28.1 Coverage and Comparability of Reports Quarterly in-year budget execution reports FY2015/2016; IFMIS monthly reports
28.2 Timing of In-Year Budget Reports Quarterly in-year budget execution reports FY2015/2016; IFMIS monthly reports
28.3 Accuracy of In-Year Budget Reports Quarterly in-year budget execution reports FY2015/2016; IFMIS monthly reports; Auditor-General's audit reports
29. Annual Financial Reports 29.1 Completeness of Annual Financial Reports Consolidated annual financial statements FY2013/2014 to

151
FY2015/2016
29.2 Submission of Reports for External Audit Transmittal letter from Accountant General; confirmation from Auditor-General
29.3 Accounting Standards Consolidated annual financial statements FY2013/2014 to FY2015/2016
VII. External Scrutiny And Audit
30. External Audit
30.1 Audit Coverage and Standards Audit Act 1973; Audit manual; Auditor-General's audit reports; interviews
30.2 Submission of Audit Reports to the Legislature Transmittal letter from Auditor-General to Parliament; confirmation from parliament
30.3 External Audit Follow-Up Auditor-General audit reports;
30.4 Supreme Audit Institution Independence 1993 Constitution; Audit Act 1973; interview with Auditor-General
31. Legislative Scrutiny Of Audit Reports
31.1 Timing of Audit Report Scrutiny Hanzard/minutes from parliament; minutes from PAC; confirmation from CSOs; interviews with MoF, Public Works, Education, Health, Public Service
31.2 Hearings on Audit Findings Interaction with members of PAC; confirmation from CSOs; interviews with government officials from MDAs
31.3 Recommendations on Audit by the Legislature Report of PAC for FY2008/2009; interviews with PAC members; confirmation from CSOs
31.4 Transparency of Legislative Scrutiny of Audit Reports
Hanzard/minutes from parliament; minutes from PAC; confirmation from CSOs; interviews with MoF, Public Works, Education, Health, Public Service
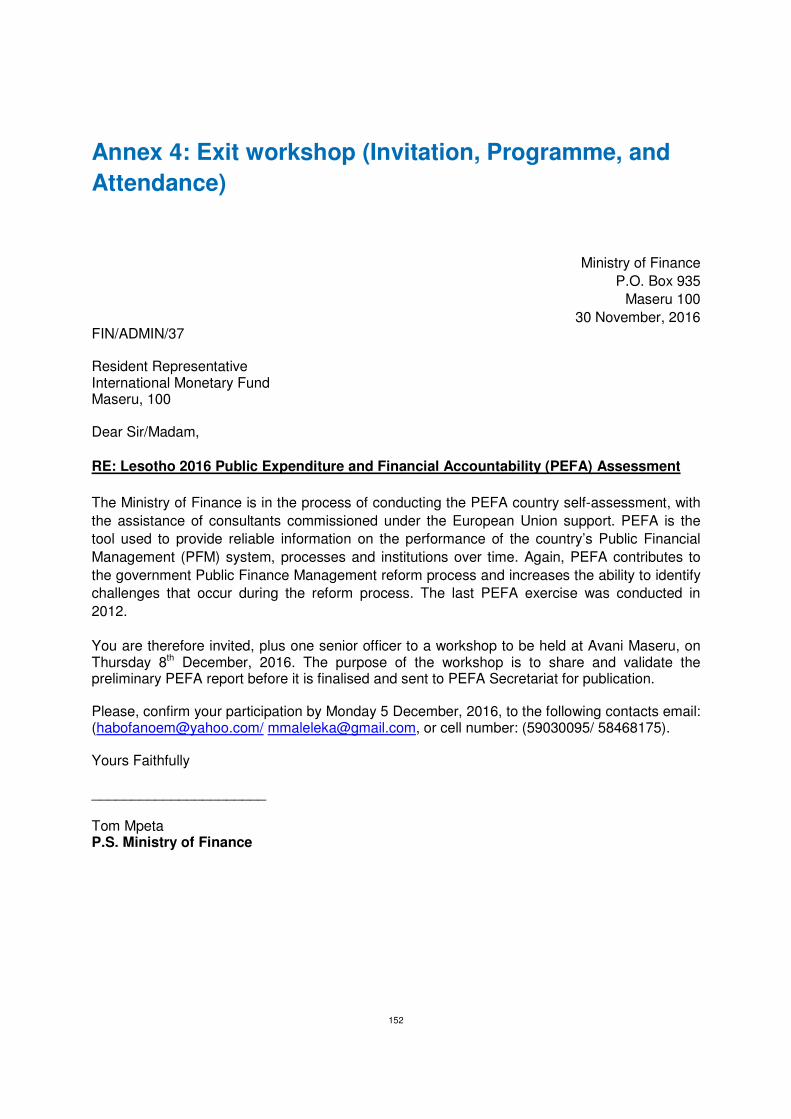
152
Annex 4: Exit workshop (Invitation, Programme, and
Attendance)
Ministry of Finance
P.O. Box 935
Maseru 100
30 November, 2016 FIN/ADMIN/37 Resident Representative International Monetary Fund Maseru, 100 Dear Sir/Madam,
RE: Lesotho 2016 Public Expenditure and Financial Accountability (PEFA) Assessment
The Ministry of Finance is in the process of conducting the PEFA country self-assessment, with
the assistance of consultants commissioned under the European Union support. PEFA is the
tool used to provide reliable information on the performance of the country’s Public Financial
Management (PFM) system, processes and institutions over time. Again, PEFA contributes to
the government Public Finance Management reform process and increases the ability to identify
challenges that occur during the reform process. The last PEFA exercise was conducted in
2012.
You are therefore invited, plus one senior officer to a workshop to be held at Avani Maseru, on Thursday 8th December, 2016. The purpose of the workshop is to share and validate the preliminary PEFA report before it is finalised and sent to PEFA Secretariat for publication. Please, confirm your participation by Monday 5 December, 2016, to the following contacts email: ([email protected]/ [email protected], or cell number: (59030095/ 58468175). Yours Faithfully ______________________ Tom Mpeta P.S. Ministry of Finance

153
Programme for the PEFA Workshop 8th
December, 2016
Organisers: PEFA Management and Oversight Team
Presenters: PEFA assessment team, Göran Steen and Charles Hegbor
Time: 09.00 – 16.00
Venue: Avani Maseru
08.30 Arrival and registration of participants
09.00 – 09.15 Opening of the workshop, P.S. Ministry of Finance: Mr. Tom
09.15 – 09.30 Presentation of the programme, purpose and objectives, the
Chair
09.30 – 10.30 Presentation of preliminary results of the PEFA assessment,
PEFA team
10.30 – 11.00 Tea/ coffee
11.00 -12.30 Presentation continues
12.30 – 14.00 Lunch
14.00 – 15.30 Discussions with input from participants and the PEFA team.
Session chaired by Project Coordinator Moepi Sematlane
15.30 - 16.00 Summing up, Conclusions. The way forward to finalise the
assessment
16.00 Closing of the workshop by Principal Secretary Tom Mpeta

154
NAME & SURNAME ORGANISATION REPRESENTED
AND DESIGNATION
CONTACT
NUMBERS
E-MAIL ADDRESS
Sematha Mohlalefi DCEO – CCPO 63580288 [email protected]
Soai Soai WASCO 62002044 [email protected]
Malerato Tsilo DCEO 58725598 [email protected]
Tebello Motelle LRA 63059934 [email protected]
Monono Makhoebe MoW 63026157 [email protected]
Makahlolo Qhobela Manager – LRA 63011565 [email protected]
Nthabiseng Phalatse MoAFS 53747271 [email protected]
Mabakubung Pitso MoF 58780710 [email protected]
Mahlompho Chaotsane MoDP 58845669 [email protected]
Patricia Bairsto PFMRS C – Change Management
and capacity development Advisor
53378395 [email protected]
Lebese Mochelanyane Lerotholi Polytechnic 63069940 [email protected]
Motseki Malikalike Internal Audit – MoF 59813222 [email protected]
Moeletsi Mokhothu MIS – MoF 58559322 [email protected]
Jyrki Torni EU 56754530
Nthabiseng sello Macro C2 – MoF 63102580 [email protected]
Liello Matekane OAG 62660071 [email protected]
Teboho ‘Mokela DPS – MoF 62531973 [email protected]
Thuso Seoane Macro – MoF 63209386 [email protected]
Lefielo Lefielo LRA 58020995 [email protected]
Moepi Sematlane PFM Secretariat 5896565 [email protected]
Lebohang Kaaba LRA – Investigations 52215368 [email protected]
Mokete Pule LRA – Debt Management 52215387 [email protected]
Likotsi Leseli PPAD – Director 22324235 [email protected]
McCarthy Phiri Advisor - PFMRS 51933826 [email protected]
Matebello Lebesa Internal Audit – MoF 58999832 [email protected]
Mosito Ntema Public Debt – MoF 57105301 [email protected]
Janet Entwistle Country Representative 22217000 [email protected]
Tsolo Maoeng PFM – MoF 28324748 [email protected]
Nkoneng Shelile PSD – MoF 58034699 [email protected]
Mathabo Seoli CMU – MoF 58868286 [email protected]
Reentseng Masoabi LRA - Custom 52215191 [email protected]
Libeo Monethi EP – MoAFS 22326235 [email protected]
Guy Anderson AGO - Advisor 50846100 [email protected]
Gordon Morrison NAO - Advisor [email protected]
V. N Kaila Linpico 51869147 [email protected]
Arun kimar Budget – MoF 68220374 [email protected]
Lineo Sekonyela LRA 63007401 [email protected]
Reabetsoe Ntho MoET 58782327 [email protected]
Mpho Kabelo MoAFS 59155407 [email protected]
Ezekiel Senti MoPPS 58885055 [email protected]
Thabo Moerane CMU – MoF 62666437 [email protected]

155
Theko Mohau MoF 63114100 [email protected]
Tseko A. Bohloa Lesotho Chamber of Commerce and
Industry
22311066/62850
415
[email protected] / [email protected]
Mohanuoa Lichaba MoPS 63848106 [email protected]
Mosa Masilo NUL 50484966 [email protected]
Tau Thabo Thizo sounds 58056612 [email protected]
Mokhanya Mantso Thizo Sounds 56714248
Mampoi Makhetha MoW 62846810 [email protected]
Mahlape Mori MoPPS 58086288 [email protected]
Peter Macharia NAO 56454544 [email protected]
George Senauoane NAO 68013204 [email protected]
M. Koto NAO 58844726 [email protected]
M. Nkhabu LRA 52215123 [email protected]
Tabitha Sekoati PFM 58778680 [email protected]
Botseba Sesinyi Treasury - IFMIS 58469199 [email protected]
Relebohile Ralitsebe Treasury - IFMIS 58851252 [email protected]
Maleshoane Lekomola Budget – MOF 58794048 [email protected]
Thato Molatseli HR - MOF 58138216 [email protected]
Nkuebe Letsie Treasury - IFMIS 6200670 [email protected]
Maliketso Malephane CEP – MOL 58766646 [email protected]
Habofanoe Makopela Planning Unit – MoF 59030095 [email protected]
Mamolemo Maleleka Planning Unit – MoF 58468175 [email protected]
Matlakala Mosito Planning Unit - MoF 58036876 [email protected]
Masoabi Makosholo MOLG 28360575 [email protected]
Charles Hegbor PEFA Expert
Goran Steen PEFA Expert (Team Leader)

156
Annex 5: Summary Assessment based on Old (2011)
Methodology
Table A7.1: Ratings by Indicator – Old Methodology, PEFA 2011 Framework
Performance Indicators S
co
rin
g
Meth
od
2012 2016
Dimension Ratings Overall Score
Dimension Ratings Overall Score (i) (ii) (iii) (iv) (i) (ii) (iii) (iv)
A – Credibility of the Budget
PI-1 Aggregate expenditure outturn compared to original approved budget
M1 B B D D
PI-2 Composition of expenditure outturn compared to original approved budget
M1 C A C+ D A D+
PI-3 Aggregate revenue outturn compared to original approved
M1 B B B B
PI-4 Stock and monitoring of expenditure payment arrears M1 NR C NR D C D+
B – Comprehensiveness and Transparency
PI-5 Classification of the budget M1 B B C C
PI-6 Comprehensiveness of information included in budget documentation M1 B B B B
PI-7 Extent of unreported government operations
M1 B D D+ C D D+
PI-8 Transparency of inter-governmental fiscal relations M2 B A D B C D D D+
PI-9 Oversight of aggregate fiscal risk from other public sector entities
M1 C D D+ D D D
PI-10 Public access to key fiscal information M1 D D D D
C – Policy Based Budgeting
PI-11 Orderliness and participation in the annual budget process M2 C A A B+ C A B B
PI-12 Multi-year perspective in fiscal planning, expenditure policy and budgeting
M2 C A C B B C A D C C+
D – Predictability and Control in Budget Execution
PI-13 Transparency of taxpayer obligations and liabilities
M2 D C C D+ C A C B
PI-14 Effectiveness of measures for taxpayer registration and tax assessment
M2 B B C B C B C C+
PI-15 Effectiveness in collection of tax payments
M1 D B D D+ D B D D+
PI-16 Predictability in the availability of funds for commitment of expenditures M1 D A B D+ D B B D+
PI-17 Recording and management of cash balances, debt and
M2 A D B B B D B C+
PI-18 Effectiveness of payroll controls M1 D D D D D D D D D D
PI-19 Competition, value for money and controls in procurement M2 B D D D D+ B D D D▲ D+
PI-20 Effectiveness of internal controls for non- salary Expenditure M1 B C D D+ C C D D+
PI-21 Effectiveness of internal audit M1 C B D D+ C B D D+
E – Accounting, Recording and Reporting
PI-22 Timeliness and regularity of accounts reconciliation
M2 D D D D D D
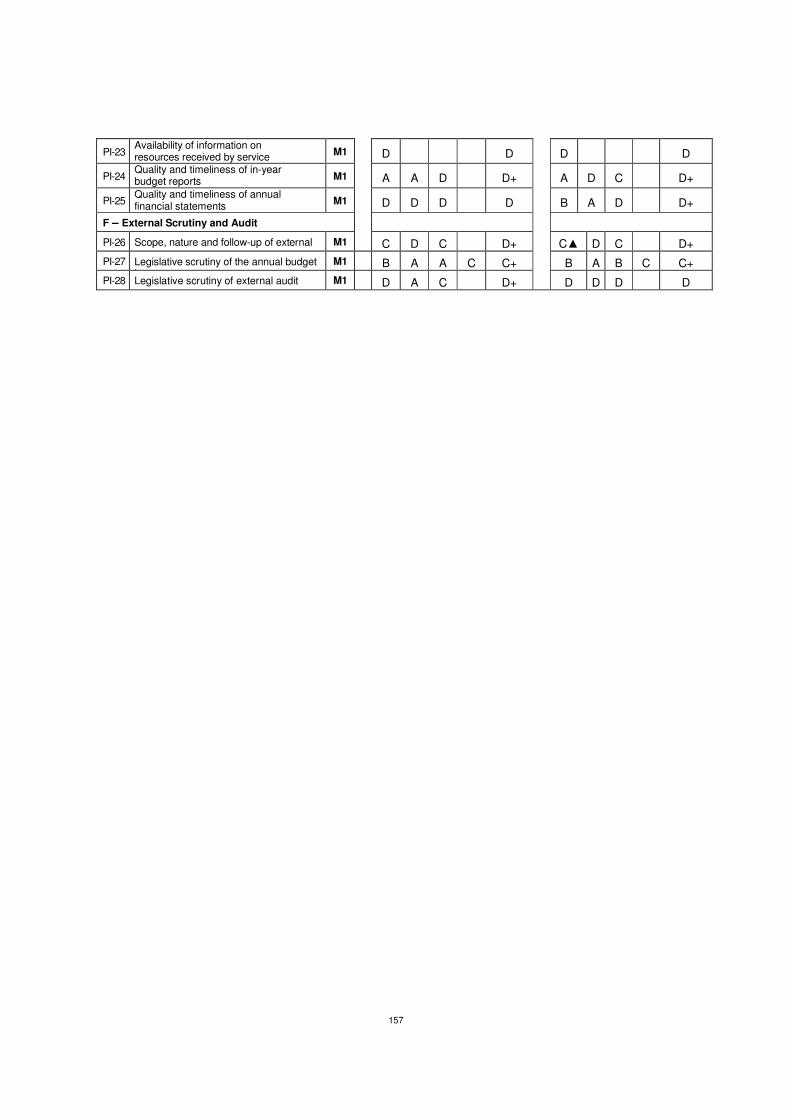
157
PI-23 Availability of information on resources received by service
M1 D D D D
PI-24 Quality and timeliness of in-year budget reports M1 A A D D+ A D C D+
PI-25 Quality and timeliness of annual financial statements
M1 D D D D B A D D+
F – External Scrutiny and Audit
PI-26 Scope, nature and follow-up of external audit
M1 C D C D+ C▲ D C D+
PI-27 Legislative scrutiny of the annual budget law
M1 B A A C C+ B A B C C+
PI-28 Legislative scrutiny of external audit reports
M1 D A C D+ D D D D
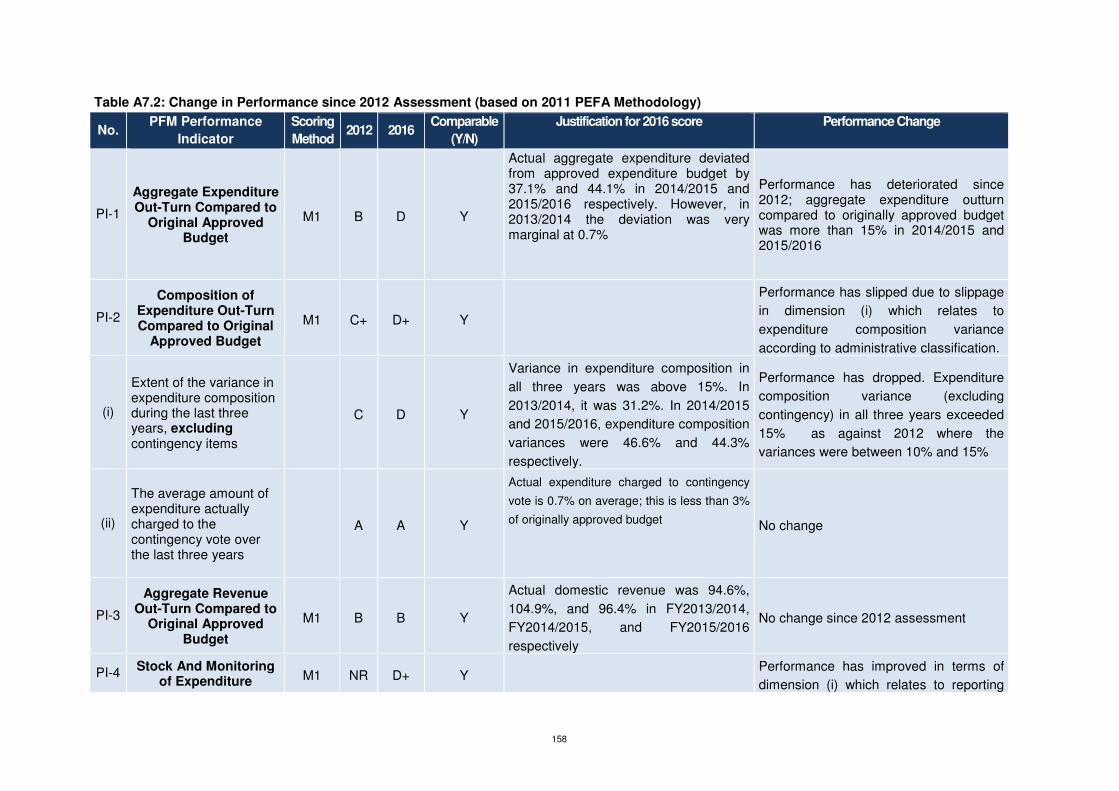
158
Table A7.2: Change in Performance since 2012 Assessment (based on 2011 PEFA Methodology)
No. PFM Performance
Indicator
Scoring
Method 2012 2016
Comparable
(Y/N)
Justification for 2016 score Performance Change
PI-1
Aggregate Expenditure Out-Turn Compared to
Original Approved Budget
M1 B D Y
Actual aggregate expenditure deviated from approved expenditure budget by 37.1% and 44.1% in 2014/2015 and 2015/2016 respectively. However, in 2013/2014 the deviation was very marginal at 0.7%
Performance has deteriorated since 2012; aggregate expenditure outturn compared to originally approved budget was more than 15% in 2014/2015 and 2015/2016
PI-2
Composition of Expenditure Out-Turn Compared to Original
Approved Budget
M1 C+ D+ Y
Performance has slipped due to slippage
in dimension (i) which relates to
expenditure composition variance
according to administrative classification.
(i)
Extent of the variance in expenditure composition during the last three years, excluding contingency items
C D Y
Variance in expenditure composition in
all three years was above 15%. In
2013/2014, it was 31.2%. In 2014/2015
and 2015/2016, expenditure composition
variances were 46.6% and 44.3%
respectively.
Performance has dropped. Expenditure
composition variance (excluding
contingency) in all three years exceeded
15% as against 2012 where the
variances were between 10% and 15%
(ii)
The average amount of expenditure actually charged to the contingency vote over the last three years
A A Y
Actual expenditure charged to contingency
vote is 0.7% on average; this is less than 3%
of originally approved budget No change
PI-3
Aggregate Revenue Out-Turn Compared to
Original Approved Budget
M1 B B Y
Actual domestic revenue was 94.6%,
104.9%, and 96.4% in FY2013/2014,
FY2014/2015, and FY2015/2016
respectively
No change since 2012 assessment
PI-4 Stock And Monitoring
of Expenditure M1 NR D+ Y Performance has improved in terms of
dimension (i) which relates to reporting

159
No. PFM Performance
Indicator
Scoring
Method 2012 2016
Comparable
(Y/N)
Justification for 2016 score Performance Change
Payment Arrears on expenditure arrears; this is done albeit
very limited by the Accountant General
(i)
Stock of expenditure payment arrears (as a percentage of actual
total expenditure for the corresponding fiscal year) and any recent change in the stock
NR D Y
Stock of expenditure arrears is more
than 10% of total government
expenditure in FY2015/2016 Performance improved due to information
on stock of expenditure arrears being
reported even though not comprehensive
(ii)
Availability of data for monitoring the stock of expenditure payment
arrears
C C Y
Data on expenditure arrears has been
generated at year-end 2015/2016; this
was included in the FY2015/2016
consolidated annual financial statements
No change
PI-5
Classification of the Budget
M1 B C Y
Budget formulation, execution and reporting
are based on administrative and economic
classification using GFS 2001 standards
In real terms, performance has not
changed; 2012 assessment was
overrated since COFOG has not been
applied since the last assessment.
PI-6 Comprehensiveness of Information included in Budget Documentation
M1 B B Y
The 2016/2017 budget meets 6 of the 9 information benchmarks No change in performance
PI-7 Extent of Unreported
Government Operations
M1 D+ D+ Y
No change in overall performance even though there is slippage in dimension (i) which deals with extra-budgetary expenditure excluding donor funds outside the national budget which stood at about 9.4% compared to 2012 which was below 5%
(i)
The level of extra-budgetary expenditure
(other than donor funded projects) which is unreported i.e. not
included in fiscal reports
B C Y
Available evidence indicates that 9.4% of extra-budgetary expenditure is not reported in the budget and annual financial statements
Performance dropped; in 2012 it was estimated that extra-budgetary expenditure excluded from national budget was between 1% and 5% as against 2016 which was estimated at 9.4% or more

160
No. PFM Performance
Indicator
Scoring
Method 2012 2016
Comparable
(Y/N)
Justification for 2016 score Performance Change
(ii)
Income/expenditure information on donor-
funded projects which is included in fiscal reports
D D Y
Information on donor funded projects and programmes that are included in the budgets and financial statements is significantly incomplete
No change
PI-8 Transparency of Inter-Governmental Fiscal
Relations M2 B D+ Y
Performance has deteriorated or
information provided to previous
assessment being incorrect
(i)
Transparent and rules based systems in the horizontal allocation among SN governments of unconditional and conditional transfers from central government (both budgeted and actual allocations)
B C Y
Central government fiscal transfers (for
up to 40%) to district councils is
governed by simple and transparent
rules Performance dropped or 2012 was
overrated and/or incorrect information
provided
(ii)
Timeliness of reliable information to SN governments on their allocations from central government for the coming year
A D Y
District councils are notified of their
reliable allocations only after they have
completed their annual budget estimates
Performance dropped or 2012 was
overrated and/or incorrect information
provided
(iii)
Extent to which consolidated fiscal data (at least on revenue and expenditure) is collected and reported for general government according to sectoral categories
D D Y
District councils financial information is
not consolidated into central government
financial reports No change
PI-9 Oversight of Aggregate Fiscal Risk from other Public Sector Entities
M1 D+ D Y
The performance has deteriorated or
dimension one was overrated in previous
assessment
(i) Extent of central government monitoring C D Y
The monitoring of AGAs and PEs fiscal
risk is very limited; most AGAs and PEs
Performance dropped or 2012 was
overrated

161
No. PFM Performance
Indicator
Scoring
Method 2012 2016
Comparable
(Y/N)
Justification for 2016 score Performance Change
of AGAs and PEs do not submit financial reports to central
government
(ii)
Extent of central government monitoring
of SN governments‟ fiscal position
D D Y
Though district councils submit annual
financial reports to central government,
this is significantly delayed; also no
systematic monitoring of district councils
takes place
No change
PI-
10 Public Access to Key
Fiscal Information M1 D D Y
None of the six information requirements
is made available to the public in a
timely manner; that said, external audit
reports are published with significant
delays of more than 12 months; in-year
budget execution reports are also made
available to the public but with more than
4 months delay
No change in overall score even though
there is marginal change in performance
due to the introduction of citizens budget
in FY2016/2017 budget year; however
this is insufficient to warrant a change in
overall score and performance
PI-
11
Orderliness and
Participation in the
Annual Budget
Process
M2 B+ B Y
The performance has deteriorated .The
budget has been approved before the
start of the fiscal year in two of the last
three completed fiscal years, but for one
year with more than three months delay
depending on non-functioning Parliament
in waiting for elections
(i)
Existence of and adherence to a fixed budget calendar
C C Y
A detailed annual budget calendar
exists; the calendar allows MDAs only 9
days to complete their budget
submissions to MoF
No change
(ii)
Clarity/comprehensiveness of and political involvement in the guidance on the
A A Y
The call circular includes expenditure ceilings
for each ministry’s recurrent and capital
expenditures as well as indicative figures for
No change

162
No. PFM Performance
Indicator
Scoring
Method 2012 2016
Comparable
(Y/N)
Justification for 2016 score Performance Change
preparation of budget submissions (budget circular or equivalent)
the two outer years. The guidelines for
budget submissions are clear and
comprehensive
(iii)
Timely budget approval by the legislature or similarly mandated body (within the last three years)
A B Y
The budget has been approved before the
start of the fiscal year in two of the last three
completed fiscal years, but for one year with
more than one month delay
Performance dropped due to late
passage of national budget by
parliament; note that parliament was
dissolved
PI-
12
Multi-Year Perspective
in Fiscal Planning,
Expenditure Policy and
Budgeting
M2 B C+ Y
The performance has deteriorated or
dimensions 2-4 was overrated in previous
assessment
(i)
Preparation of multi -year fiscal forecasts and functional allocations
C C Y An MTEF exists; however linkages to
annual budget process is meaningless No change
(ii)
Scope and frequency of debt sustainability analysis
A A Y
A debt sustainability analysis for both
domestic and external debt has been
undertaken annually as part of IMF
Article mission
No change
(iii)
Existence of sector strategies with multi-year costing of recurrent & investment expenditure
C D Y
Sector strategies exist but none has
complete costing of both investment and
forward linked recurrent expenditure
Performance dropped or 2012 was
overrated
(iv)
Linkages between investment budgets and forward expenditure estimates
B C Y
The linkages between sector strategies
and most investment projects are weak;
a limited number of these investment
projects have recurrent cost estimates
included in MTEF
Performance dropped or 2012 was
overrated
PI-
13
Transparency of Taxpayer Obligations
and Liabilities M2 D+ B Y
There has been significant improvement
in both scores and performance.
Dimension (i) improved from D to C due
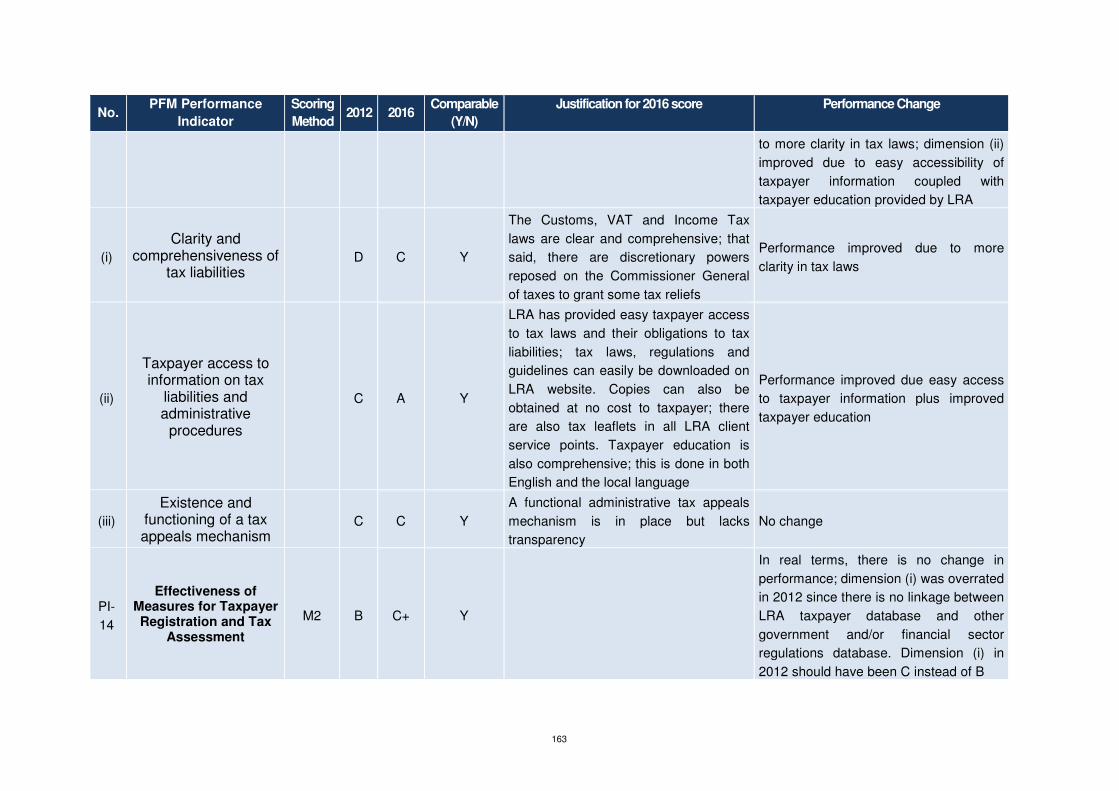
163
No. PFM Performance
Indicator
Scoring
Method 2012 2016
Comparable
(Y/N)
Justification for 2016 score Performance Change
to more clarity in tax laws; dimension (ii)
improved due to easy accessibility of
taxpayer information coupled with
taxpayer education provided by LRA
(i)
Clarity and comprehensiveness of
tax liabilities D C Y
The Customs, VAT and Income Tax
laws are clear and comprehensive; that
said, there are discretionary powers
reposed on the Commissioner General
of taxes to grant some tax reliefs
Performance improved due to more
clarity in tax laws
(ii)
Taxpayer access to information on tax
liabilities and administrative
procedures
C A Y
LRA has provided easy taxpayer access
to tax laws and their obligations to tax
liabilities; tax laws, regulations and
guidelines can easily be downloaded on
LRA website. Copies can also be
obtained at no cost to taxpayer; there
are also tax leaflets in all LRA client
service points. Taxpayer education is
also comprehensive; this is done in both
English and the local language
Performance improved due easy access
to taxpayer information plus improved
taxpayer education
(iii)
Existence and functioning of a tax appeals mechanism
C C Y
A functional administrative tax appeals
mechanism is in place but lacks
transparency
No change
PI-
14
Effectiveness of Measures for Taxpayer Registration and Tax
Assessment
M2 B C+ Y
In real terms, there is no change in
performance; dimension (i) was overrated
in 2012 since there is no linkage between
LRA taxpayer database and other
government and/or financial sector
regulations database. Dimension (i) in
2012 should have been C instead of B
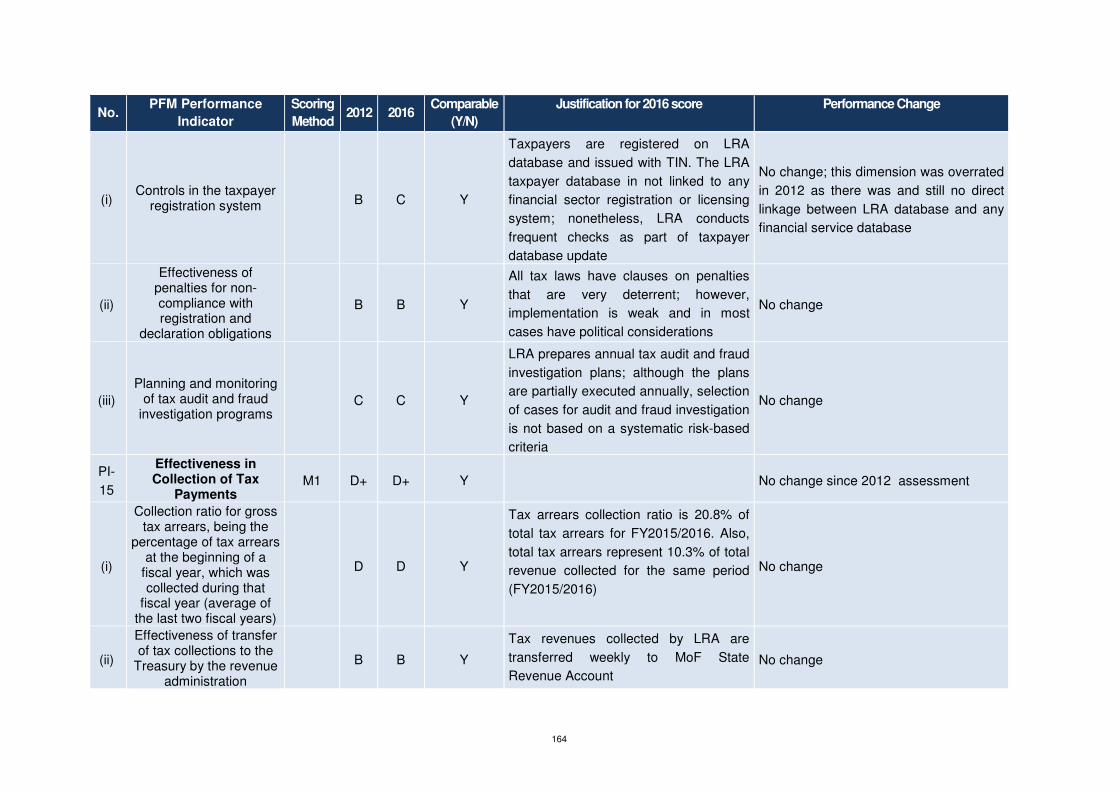
164
No. PFM Performance
Indicator
Scoring
Method 2012 2016
Comparable
(Y/N)
Justification for 2016 score Performance Change
(i) Controls in the taxpayer
registration system B C Y
Taxpayers are registered on LRA
database and issued with TIN. The LRA
taxpayer database in not linked to any
financial sector registration or licensing
system; nonetheless, LRA conducts
frequent checks as part of taxpayer
database update
No change; this dimension was overrated
in 2012 as there was and still no direct
linkage between LRA database and any
financial service database
(ii)
Effectiveness of penalties for non-compliance with registration and
declaration obligations
B B Y
All tax laws have clauses on penalties
that are very deterrent; however,
implementation is weak and in most
cases have political considerations
No change
(iii)
Planning and monitoring of tax audit and fraud
investigation programs C C Y
LRA prepares annual tax audit and fraud
investigation plans; although the plans
are partially executed annually, selection
of cases for audit and fraud investigation
is not based on a systematic risk-based
criteria
No change
PI-
15
Effectiveness in Collection of Tax
Payments M1 D+ D+ Y
No change since 2012 assessment
(i)
Collection ratio for gross tax arrears, being the
percentage of tax arrears at the beginning of a
fiscal year, which was collected during that
fiscal year (average of the last two fiscal years)
D D Y
Tax arrears collection ratio is 20.8% of
total tax arrears for FY2015/2016. Also,
total tax arrears represent 10.3% of total
revenue collected for the same period
(FY2015/2016)
No change
(ii)
Effectiveness of transfer of tax collections to the
Treasury by the revenue administration
B B Y
Tax revenues collected by LRA are
transferred weekly to MoF State
Revenue Account No change
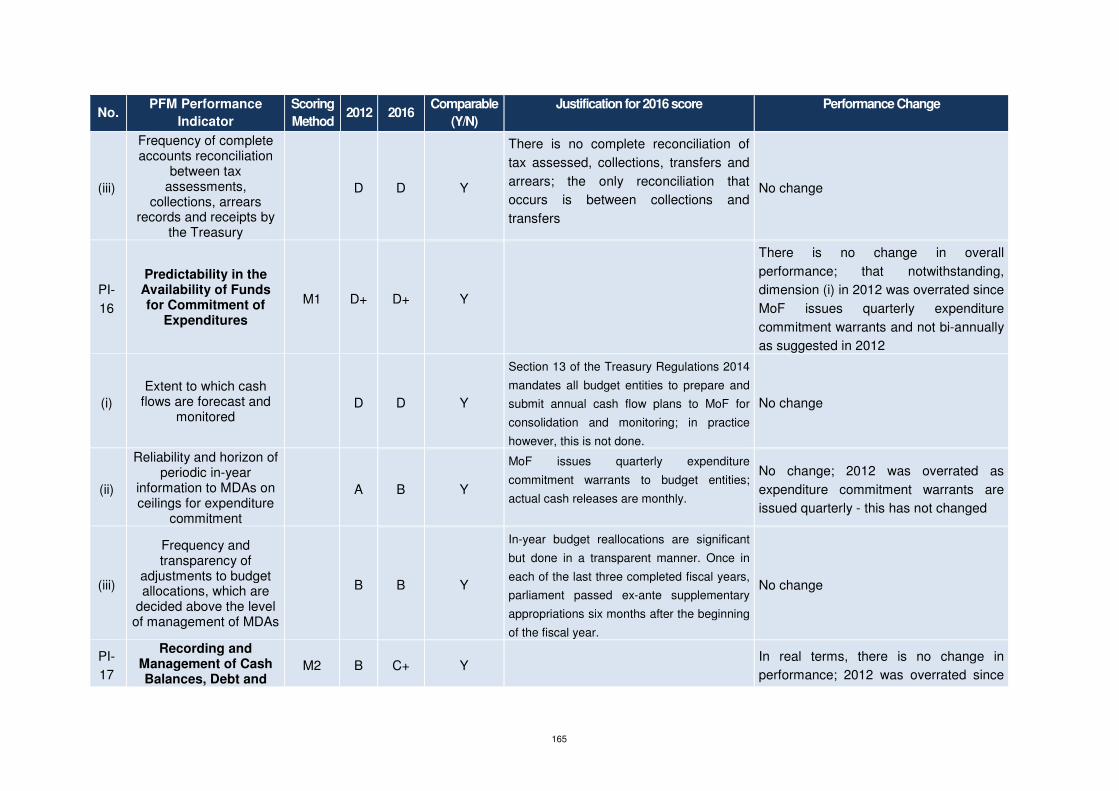
165
No. PFM Performance
Indicator
Scoring
Method 2012 2016
Comparable
(Y/N)
Justification for 2016 score Performance Change
(iii)
Frequency of complete accounts reconciliation
between tax assessments,
collections, arrears records and receipts by
the Treasury
D D Y
There is no complete reconciliation of
tax assessed, collections, transfers and
arrears; the only reconciliation that
occurs is between collections and
transfers
No change
PI-
16
Predictability in the Availability of Funds for Commitment of
Expenditures
M1 D+ D+ Y
There is no change in overall
performance; that notwithstanding,
dimension (i) in 2012 was overrated since
MoF issues quarterly expenditure
commitment warrants and not bi-annually
as suggested in 2012
(i)
Extent to which cash flows are forecast and
monitored D D Y
Section 13 of the Treasury Regulations 2014
mandates all budget entities to prepare and
submit annual cash flow plans to MoF for
consolidation and monitoring; in practice
however, this is not done.
No change
(ii)
Reliability and horizon of periodic in-year
information to MDAs on ceilings for expenditure
commitment
A B Y
MoF issues quarterly expenditure
commitment warrants to budget entities;
actual cash releases are monthly.
No change; 2012 was overrated as
expenditure commitment warrants are
issued quarterly - this has not changed
(iii)
Frequency and transparency of
adjustments to budget allocations, which are
decided above the level of management of MDAs
B B Y
In-year budget reallocations are significant
but done in a transparent manner. Once in
each of the last three completed fiscal years,
parliament passed ex-ante supplementary
appropriations six months after the beginning
of the fiscal year.
No change
PI-
17
Recording and Management of Cash Balances, Debt and
M2 B C+ Y In real terms, there is no change in
performance; 2012 was overrated since

166
No. PFM Performance
Indicator
Scoring
Method 2012 2016
Comparable
(Y/N)
Justification for 2016 score Performance Change
Guarantees PPPs were not considered in the
assessment. Dimension (i) in 2012
should have been B instead of A; this
would have resulted in an overall score of
C+ in 2012
(i)
Quality of debt data recording and reporting
A B Y
Both domestic and foreign debts including
guarantees are recorded and reconciled at
least quarterly with information obtained from
creditor statements. CS-DRMS generates
monthly reports with statistical analyses.
However, PPPs are neither recorded nor
reported. Again, internal reconciliation
challenges arising as a result of manual debt
data entry onto IFMIS have not been
resolved
No change; PPPs were not considered in
2012 assessment
(ii)
Extent of consolidation of the government's cash balances
D D Y
There is no TSA. Even though treasury
managed bank balances are consolidated
monthly, there are over 254 other
government bank accounts (donor-financed
projects and own revenue bank accounts)
maintained and operated by line ministries
that are not part of the monthly consolidation
system
No change
(iii)
Systems for contracting loans and issuance of
guarantees B B Y
The Minister of Finance is the sole
responsible government official
approving all central government loans
and guarantees; these borrowings are
made against approved legislative limits
and IMF thresholds
No change
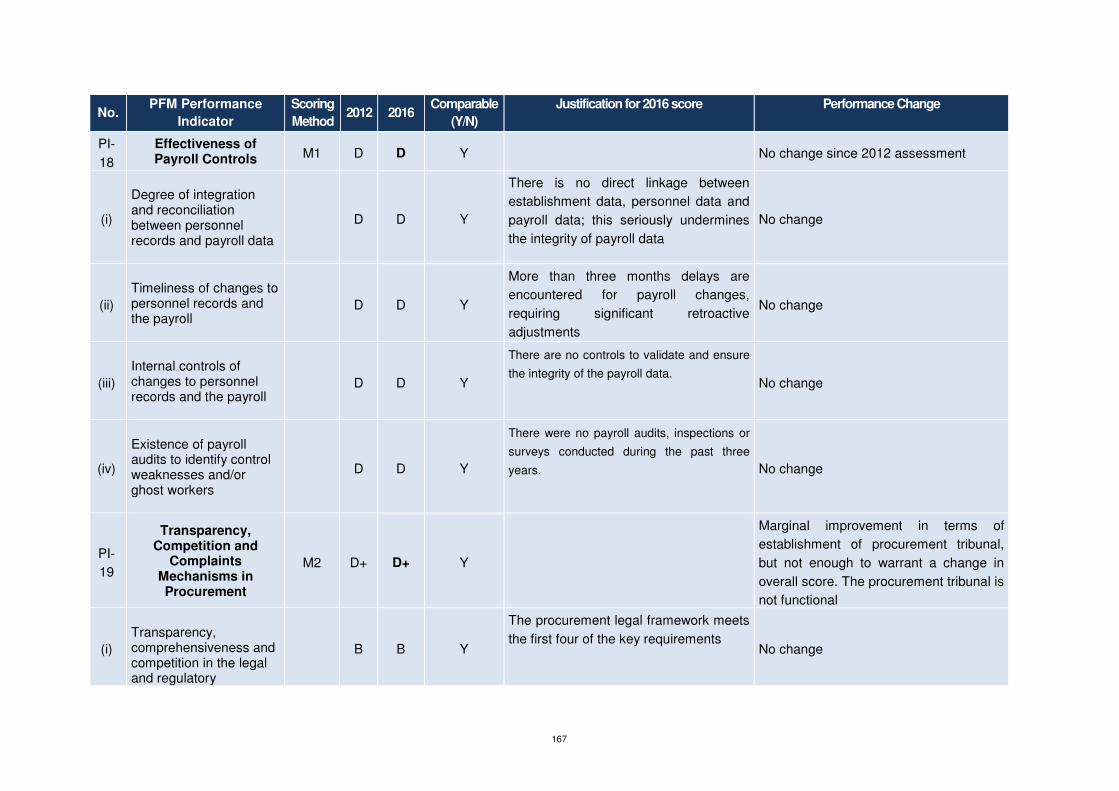
167
No. PFM Performance
Indicator
Scoring
Method 2012 2016
Comparable
(Y/N)
Justification for 2016 score Performance Change
PI-
18
Effectiveness of Payroll Controls M1 D D Y
No change since 2012 assessment
(i)
Degree of integration and reconciliation between personnel records and payroll data
D D Y
There is no direct linkage between
establishment data, personnel data and
payroll data; this seriously undermines
the integrity of payroll data
No change
(ii)
Timeliness of changes to personnel records and the payroll
D D Y
More than three months delays are
encountered for payroll changes,
requiring significant retroactive
adjustments
No change
(iii)
Internal controls of changes to personnel records and the payroll
D D Y
There are no controls to validate and ensure
the integrity of the payroll data. No change
(iv)
Existence of payroll audits to identify control weaknesses and/or ghost workers
D D Y
There were no payroll audits, inspections or
surveys conducted during the past three
years. No change
PI-
19
Transparency, Competition and
Complaints Mechanisms in Procurement
M2 D+ D+ Y
Marginal improvement in terms of
establishment of procurement tribunal,
but not enough to warrant a change in
overall score. The procurement tribunal is
not functional
(i)
Transparency, comprehensiveness and competition in the legal and regulatory
B B Y
The procurement legal framework meets
the first four of the key requirements No change

168
No. PFM Performance
Indicator
Scoring
Method 2012 2016
Comparable
(Y/N)
Justification for 2016 score Performance Change
framework
(ii)
Use of competitive procurement methods
D D Y
There is no reliable data on the use of
competitive procurement method No change
(iii)
Public access to complete, reliable and timely procurement information
D D Y
Whiles there is a system to make
available reliable procurement
information to the public, the government
does not systematically make available
key procurement information to the
public. Only bidding opportunities are
made public
No change
(iv)
Existence of an independent administrative procurement complaints system
D D▲ Y
There is no functional procurement
complaints review body; it has just been
established. Marginal improvement but insufficient to
warrant a change in score and
performance
PI-
20
Effectiveness of Internal Controls for
Non-Salary Expenditure
M1 D+ D+ Y
No change in overall score and
performance since 2012 assessment
(i)
Effectiveness of expenditure commitment controls
B C Y
There were no payroll audits, inspections or
surveys conducted during the past three
years.
No change; 2012 was overrated.
Expenditure commitment outside IFMIS
was not taken into account
(ii)
Comprehensiveness, relevance and understanding of other internal control rules/
C C Y
PFM law and treasury regulations
contain simple and basic financial
management rules which are
comprehended by accounting staff;
No change

169
No. PFM Performance
Indicator
Scoring
Method 2012 2016
Comparable
(Y/N)
Justification for 2016 score Performance Change
procedures
however some of these rules are too
excessive and bureaucratic leading to
some deficiencies
(iii)
Degree of compliance with rules for processing and recording transactions
D D Y
Comprehensive and clear rules exist but
compliance is a major concern
No change
PI-
21
Effectiveness of Internal Audit M1 D+ D+ Y
No change since 2012 assessment
(i)
Coverage and quality of the internal audit function
C C Y
Most central government entities have
functional internal audit units. 80% of
internal audit staff time is devoted to pre-
audit and the remaining to some
systems audit. IIA standards are not met
No change
(ii) Frequency and distribution of reports B B Y
At least quarterly internal audit reports
are issued with copies to management
of audited entity, the Auditor-General
and Ministry of Finance
No change
(iii)
Extent of management response to internal audit findings
D D Y
Even though internal audit
recommendations are issued, the
executive rarely provides responses;
very limited action is taken
No change
PI-
22
Timeliness and Regularity of Accounts
Reconciliation M2 D D Y
No change since 2012 assessment
(i) Regularity of bank reconciliations D D Y
There is significant backlog of bank
reconciliations; 98% of these bank
accounts are more than 12 months in
arrears in terms of reconciliation
No change
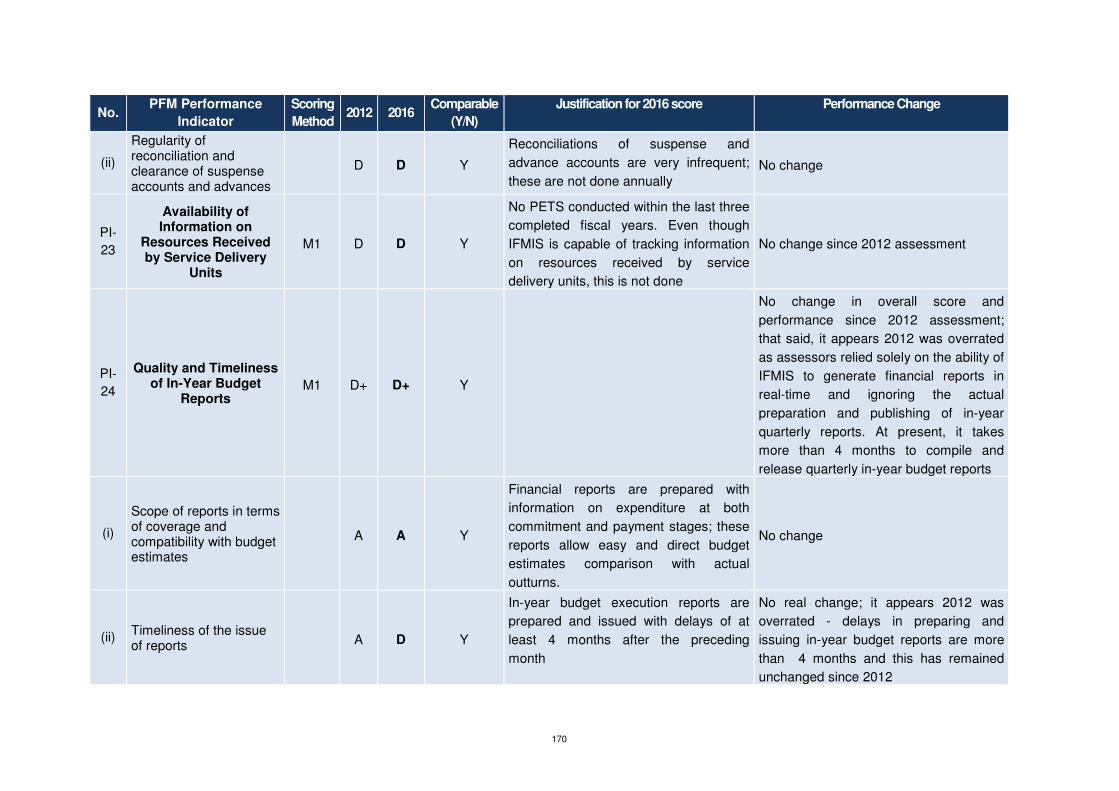
170
No. PFM Performance
Indicator
Scoring
Method 2012 2016
Comparable
(Y/N)
Justification for 2016 score Performance Change
(ii)
Regularity of reconciliation and clearance of suspense accounts and advances
D D Y
Reconciliations of suspense and
advance accounts are very infrequent;
these are not done annually No change
PI-
23
Availability of Information on
Resources Received by Service Delivery
Units
M1 D D Y
No PETS conducted within the last three
completed fiscal years. Even though
IFMIS is capable of tracking information
on resources received by service
delivery units, this is not done
No change since 2012 assessment
PI-
24
Quality and Timeliness of In-Year Budget
Reports M1 D+ D+ Y
No change in overall score and
performance since 2012 assessment;
that said, it appears 2012 was overrated
as assessors relied solely on the ability of
IFMIS to generate financial reports in
real-time and ignoring the actual
preparation and publishing of in-year
quarterly reports. At present, it takes
more than 4 months to compile and
release quarterly in-year budget reports
(i)
Scope of reports in terms of coverage and compatibility with budget estimates
A A Y
Financial reports are prepared with
information on expenditure at both
commitment and payment stages; these
reports allow easy and direct budget
estimates comparison with actual
outturns.
No change
(ii)
Timeliness of the issue of reports
A D Y
In-year budget execution reports are
prepared and issued with delays of at
least 4 months after the preceding
month
No real change; it appears 2012 was
overrated - delays in preparing and
issuing in-year budget reports are more
than 4 months and this has remained
unchanged since 2012
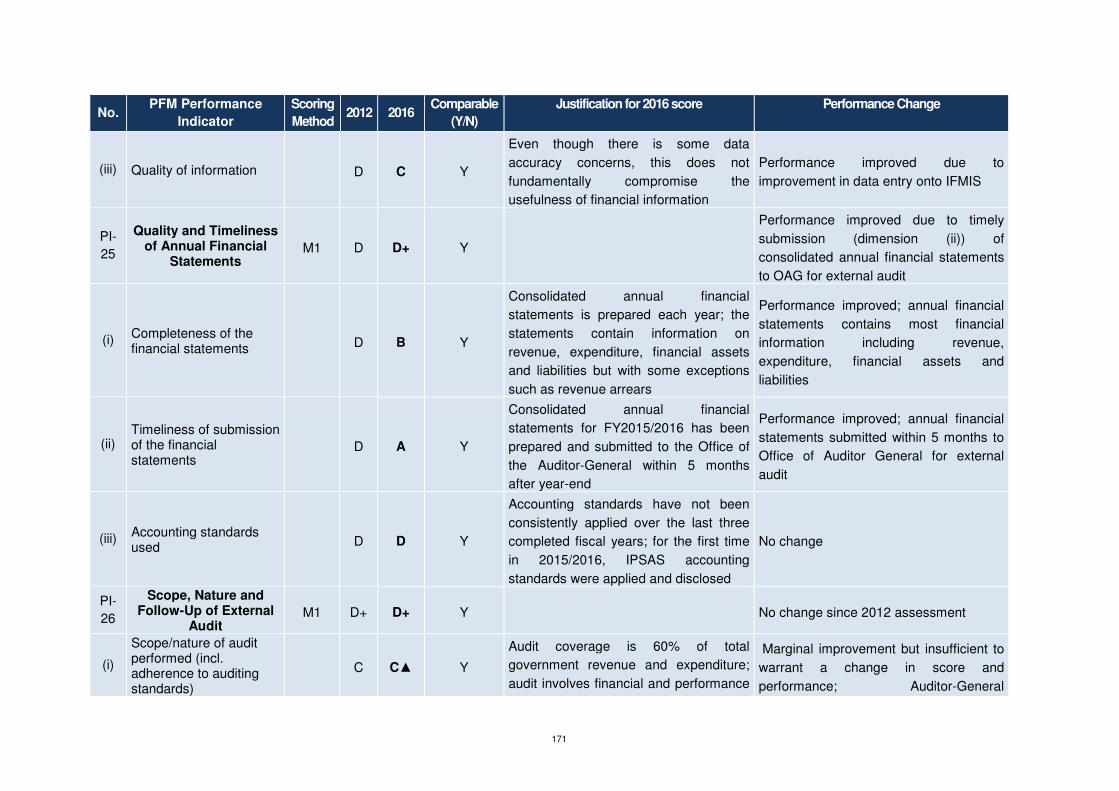
171
No. PFM Performance
Indicator
Scoring
Method 2012 2016
Comparable
(Y/N)
Justification for 2016 score Performance Change
(iii) Quality of information
D C Y
Even though there is some data
accuracy concerns, this does not
fundamentally compromise the
usefulness of financial information
Performance improved due to
improvement in data entry onto IFMIS
PI-
25
Quality and Timeliness of Annual Financial
Statements M1 D D+ Y
Performance improved due to timely
submission (dimension (ii)) of
consolidated annual financial statements
to OAG for external audit
(i) Completeness of the financial statements D B Y
Consolidated annual financial
statements is prepared each year; the
statements contain information on
revenue, expenditure, financial assets
and liabilities but with some exceptions
such as revenue arrears
Performance improved; annual financial
statements contains most financial
information including revenue,
expenditure, financial assets and
liabilities
(ii) Timeliness of submission of the financial statements
D A Y
Consolidated annual financial
statements for FY2015/2016 has been
prepared and submitted to the Office of
the Auditor-General within 5 months
after year-end
Performance improved; annual financial
statements submitted within 5 months to
Office of Auditor General for external
audit
(iii) Accounting standards used D D Y
Accounting standards have not been
consistently applied over the last three
completed fiscal years; for the first time
in 2015/2016, IPSAS accounting
standards were applied and disclosed
No change
PI-
26
Scope, Nature and Follow-Up of External
Audit M1 D+ D+ Y
No change since 2012 assessment
(i)
Scope/nature of audit performed (incl. adherence to auditing standards)
C C▲ Y
Audit coverage is 60% of total
government revenue and expenditure;
audit involves financial and performance
Marginal improvement but insufficient to
warrant a change in score and
performance; Auditor-General

172
No. PFM Performance
Indicator
Scoring
Method 2012 2016
Comparable
(Y/N)
Justification for 2016 score Performance Change
audit which meet some level of
international standards. A new audit law
has been enacted to enhance Auditor-
General independence but this is yet to
be fully implemented
independence enhanced through
enactment of new Audit Act but yet to be
fully operational; also audit standards has
improved marginally
(ii)
Timeliness of submission of audit reports to legislature
D D Y
There are significant delays in submitting
audit reports to parliament; the audit
report for 2014/2015 has not been
submitted to parliament at the time of
drafting this report - this is more than 12
months time lag
No change
(iii) Evidence of follow up on audit recommendations C C Y
The executive provides delayed formal
response to all audit findings; however,
there is little evidence of follow-up and
executive action
No change
PI-
27 Legislative Scrutiny of the Annual Budget Law M1 C+ C+ Y
No change in overall performance and
score since 2012 assessment
(i)
Scope of the legislature's scrutiny
B B Y
The Parliament’s review covers fiscal policies
and aggregates for the coming year as well
as details of expenditure and revenue No change
(ii)
Extent to which the legislature's procedures are well-established and respected
A A Y
The legislative procedures for
scrutinising the annual budget are well
established and adhered to; these
procedures include portfolio (sector)
committee and financial committee
sittings with specialised negotiations for
specialised budget entities such as that
of Office of the Auditor General
No change
(iii) Adequacy of time for the A B Y Parliament has only one month to review Performance has dropped; legislature
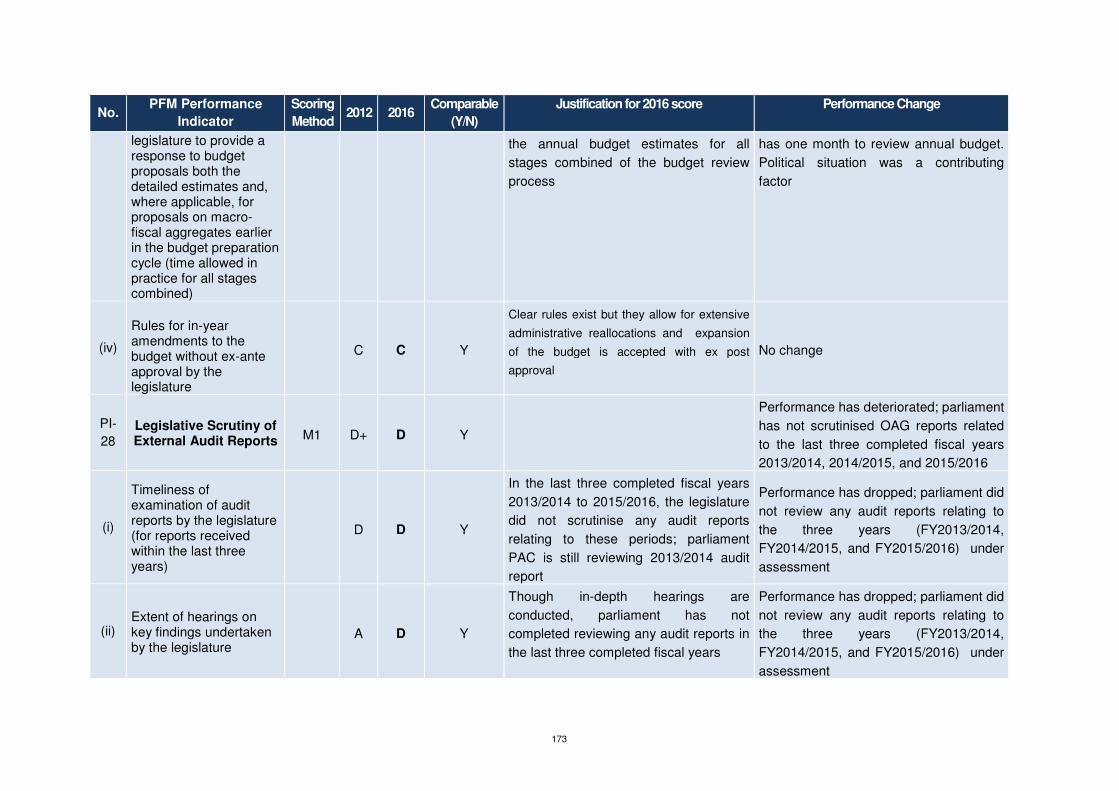
173
No. PFM Performance
Indicator
Scoring
Method 2012 2016
Comparable
(Y/N)
Justification for 2016 score Performance Change
legislature to provide a response to budget proposals both the detailed estimates and, where applicable, for proposals on macro-fiscal aggregates earlier in the budget preparation cycle (time allowed in practice for all stages combined)
the annual budget estimates for all
stages combined of the budget review
process
has one month to review annual budget.
Political situation was a contributing
factor
(iv)
Rules for in-year amendments to the budget without ex-ante approval by the legislature
C C Y
Clear rules exist but they allow for extensive
administrative reallocations and expansion
of the budget is accepted with ex post
approval
No change
PI-
28 Legislative Scrutiny of External Audit Reports M1 D+ D Y
Performance has deteriorated; parliament
has not scrutinised OAG reports related
to the last three completed fiscal years
2013/2014, 2014/2015, and 2015/2016
(i)
Timeliness of examination of audit reports by the legislature (for reports received within the last three years)
D D Y
In the last three completed fiscal years
2013/2014 to 2015/2016, the legislature
did not scrutinise any audit reports
relating to these periods; parliament
PAC is still reviewing 2013/2014 audit
report
Performance has dropped; parliament did
not review any audit reports relating to
the three years (FY2013/2014,
FY2014/2015, and FY2015/2016) under
assessment
(ii) Extent of hearings on key findings undertaken by the legislature
A D Y
Though in-depth hearings are
conducted, parliament has not
completed reviewing any audit reports in
the last three completed fiscal years
Performance has dropped; parliament did
not review any audit reports relating to
the three years (FY2013/2014,
FY2014/2015, and FY2015/2016) under
assessment
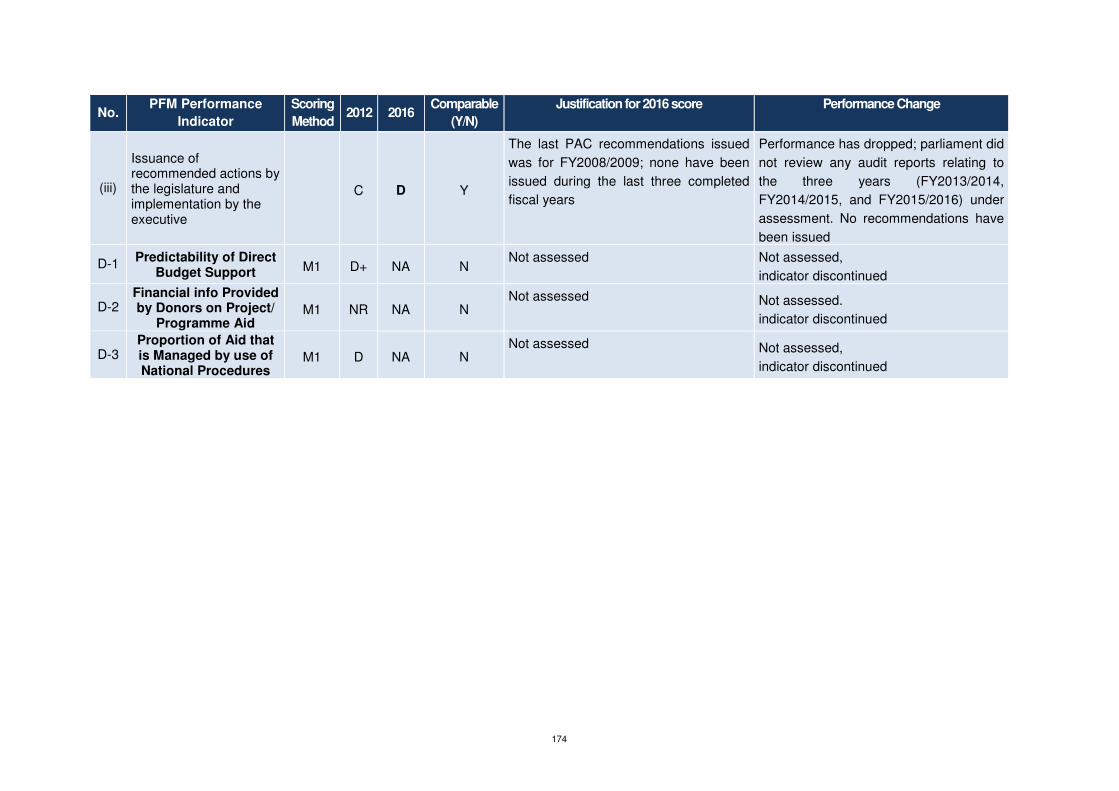
174
No. PFM Performance
Indicator
Scoring
Method 2012 2016
Comparable
(Y/N)
Justification for 2016 score Performance Change
(iii)
Issuance of recommended actions by the legislature and implementation by the executive
C D Y
The last PAC recommendations issued
was for FY2008/2009; none have been
issued during the last three completed
fiscal years
Performance has dropped; parliament did
not review any audit reports relating to
the three years (FY2013/2014,
FY2014/2015, and FY2015/2016) under
assessment. No recommendations have
been issued
D-1 Predictability of Direct
Budget Support M1 D+ NA N Not assessed Not assessed,
indicator discontinued
D-2 Financial info Provided by Donors on Project/
Programme Aid M1 NR NA N
Not assessed Not assessed.
indicator discontinued
D-3 Proportion of Aid that is Managed by use of National Procedures
M1 D NA N Not assessed Not assessed,
indicator discontinued

175
Table A7.2A: Analysis of Revenue Outturn - PI-3 (M Million) - Old (2011) methodology
Data for year = 2013/2014
Economic head budget actual adjusted budget
deviation absolute deviation
percent
Tax revenues
Taxes on income, profit and capital gains 1,233.80
1,116.90 1,166.7 -49.8 49.8 4.3%
Taxes on payroll and workforce 1,914.00
1,563.30 1,809.8 -246.5 246.5 13.6%
Taxes on property 191.20
127.70 180.8 -53.1 53.1 29.4%
Taxes on goods and services 2,160.90
1,886.60 2,043.3 -156.7 156.7 7.7%
Taxes on exports 293.00
451.10 277.1 174.0 174.0 62.8%
Other taxes 7.20
2.00 6.8 -4.8 4.8 70.6%
Social contributions
Social security contributions -
- 0.0 0.0 0.0 #DIV/0!
Other social contributions -
- 0.0 0.0 0.0 #DIV/0!
Grants
Grants from foreign governments 0.0 0.0 0.0 #DIV/0!
Grants from international organizations -
- 0.0 0.0 0.0 #DIV/0!
Grants from other government units -
- 0.0 0.0 0.0 #DIV/0!
Other revenue
Property income 194.30
164.20 183.7 -19.5 19.5 10.6%
Sales of goods and services 839.60
855.60 793.9 61.7 61.7 7.8%
Fines, penalties and forfeits 0.3 1.3 1.3 464.0%

176
0.30 1.60
Transfers not elsewhere classified 41.80
3.40 39.5 -36.1 36.1 91.4%
SACU 6,054.60
6,054.60 5,725.1 329.5 329.5 5.8%
Sum of rest -
- 0.0 0.0 0.0 #DIV/0!
Total revenue 12,930.70
12,227.00 12,227.0 0.0 1,133.1
overall variance
94.6%
Table A7.2B: Analysis of Revenue Outturn - PI-3 (M Million) - Old (2011) methodology
Data for year = 2014/2015
Economic head budget actual adjusted budget
deviation absolute deviation
percent
Tax revenues
Taxes on income, profit and capital gains 1,328.00
1,306.83 1,393.5 -86.7 86.7 6.2%
Taxes on payroll and workforce 2,201.30
2,201.30 2,309.9 -108.6 108.6 4.7%
Taxes on property 166.00
- 174.2 -174.2 174.2 100.0%
Taxes on goods and services 2,431.40
2,118.60 2,551.4 -432.8 432.8 17.0%
Taxes on exports 227.70
- 238.9 -238.9 238.9 100.0%
Other taxes 7.10
- 7.5 -7.5 7.5 100.0%
Social contributions
Social security contributions -
- 0.0 0.0 0.0 #DIV/0!
Other social contributions -
- 0.0 0.0 0.0 #DIV/0!
Grants
Grants from foreign governments 0.0 0.0 0.0 #DIV/0!
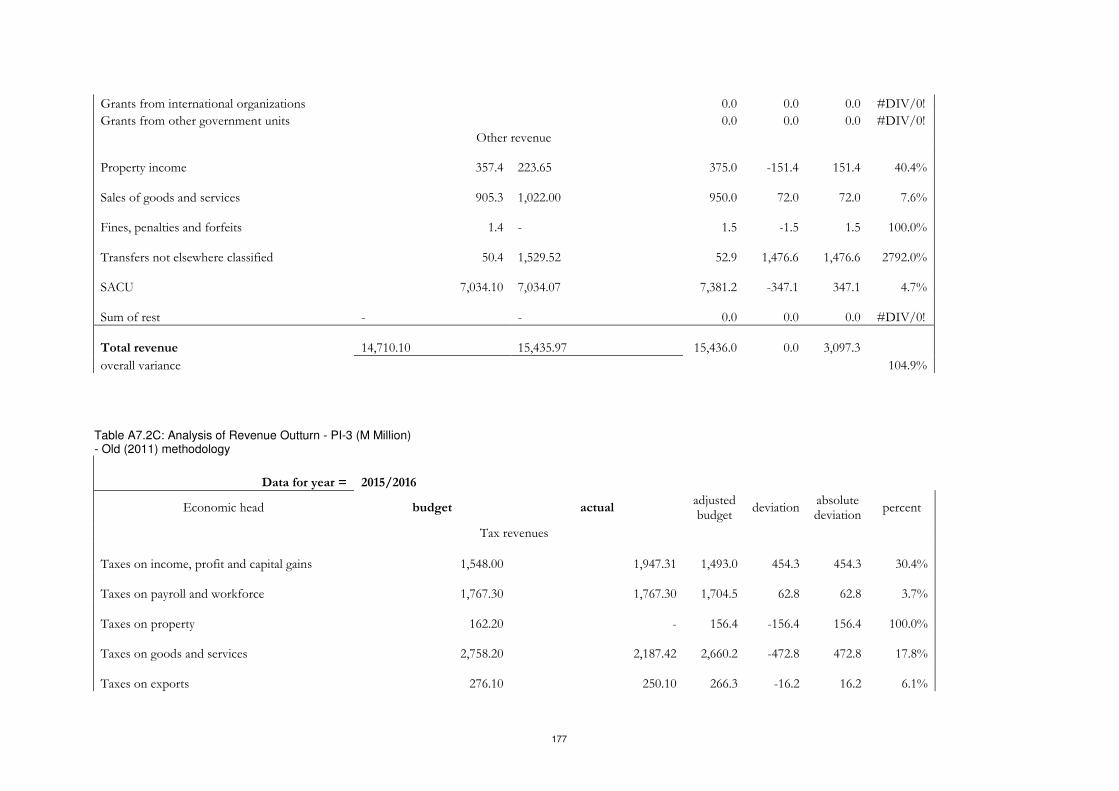
177
Grants from international organizations 0.0 0.0 0.0 #DIV/0!
Grants from other government units 0.0 0.0 0.0 #DIV/0!
Other revenue
Property income 357.4 223.65 375.0 -151.4 151.4 40.4%
Sales of goods and services 905.3 1,022.00 950.0 72.0 72.0 7.6%
Fines, penalties and forfeits 1.4 - 1.5 -1.5 1.5 100.0%
Transfers not elsewhere classified 50.4 1,529.52 52.9 1,476.6 1,476.6 2792.0%
SACU 7,034.10 7,034.07 7,381.2 -347.1 347.1 4.7%
Sum of rest -
- 0.0 0.0 0.0 #DIV/0!
Total revenue 14,710.10
15,435.97 15,436.0 0.0 3,097.3
overall variance
104.9% Table A7.2C: Analysis of Revenue Outturn - PI-3 (M Million) - Old (2011) methodology
Data for year = 2015/2016
Economic head budget actual adjusted budget
deviation absolute deviation
percent
Tax revenues
Taxes on income, profit and capital gains
1,548.00
1,947.31 1,493.0 454.3 454.3 30.4%
Taxes on payroll and workforce
1,767.30
1,767.30 1,704.5 62.8 62.8 3.7%
Taxes on property
162.20 - 156.4 -156.4 156.4 100.0%
Taxes on goods and services
2,758.20
2,187.42 2,660.2 -472.8 472.8 17.8%
Taxes on exports
276.10
250.10 266.3 -16.2 16.2 6.1%

178
Other taxes
5.40
1.15 5.2 -4.1 4.1 77.9%
Social contributions
Social security contributions -
- 0.0 0.0 0.0 #DIV/0!
Other social contributions -
- 0.0 0.0 0.0 #DIV/0!
Grants
Grants from foreign governments 0.0 0.0 0.0 #DIV/0!
Grants from international organizations -
- 0.0 0.0 0.0 #DIV/0!
Grants from other government units -
- 0.0 0.0 0.0 #DIV/0!
Other revenue
Property income
489.20
427.61 471.8 -44.2 44.2 9.4%
Sales of goods and services
941.20
860.17 907.8 -47.6 47.6 5.2%
Fines, penalties and forfeits
1.70
5.85 1.6 4.2 4.2 256.6%
Transfers not elsewhere classified
18.10
9.62 17.5 -7.8 7.8 44.9%
SACU
6,398.20
6,398.62 6,170.9 227.8 227.8 3.7%
Sum of rest -
- 0.0 0.0 0.0 #DIV/0!
Total revenue
14,365.60
13,855.15 13,855.1 0.0 1,498.2
overall variance
96.4%
Table A7.2D - Results Matrix (2011 methodology)
Year Total revenue deviation
2013/2014 94.6%
2014/2015 104.9%
2015/2016 96.4%
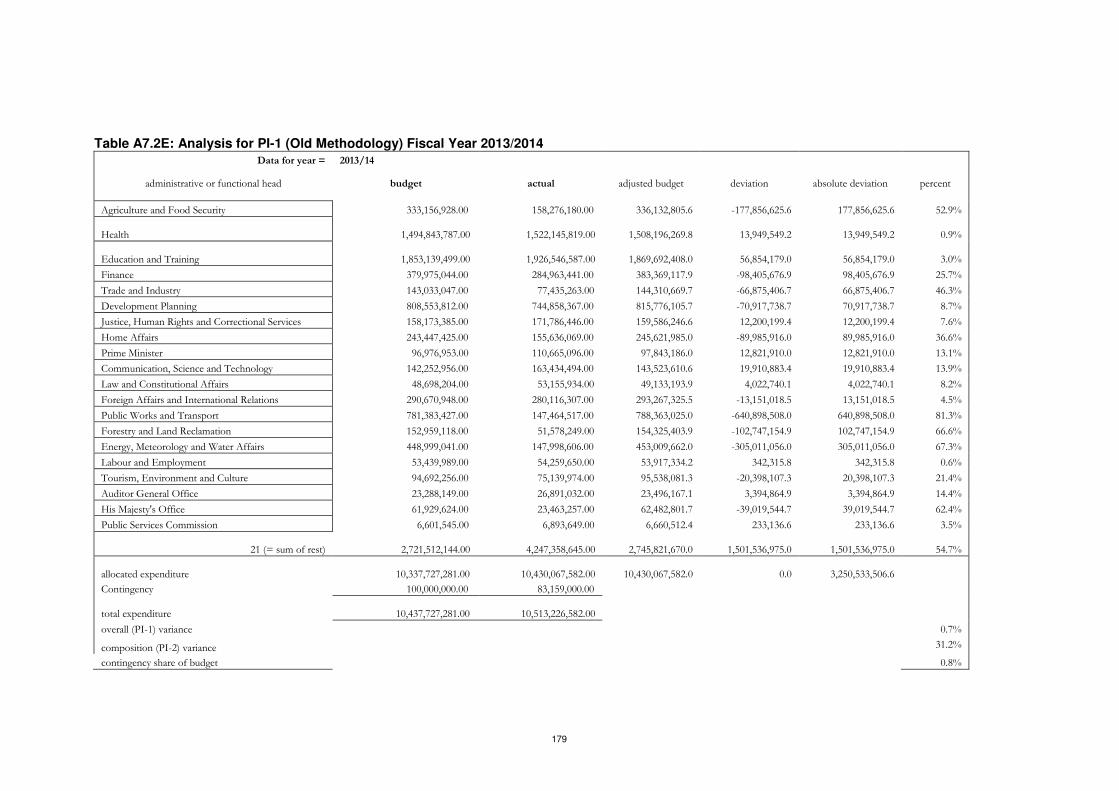
179
Table A7.2E: Analysis for PI-1 (Old Methodology) Fiscal Year 2013/2014 Data for year = 2013/14
administrative or functional head budget actual adjusted budget deviation absolute deviation percent
Agriculture and Food Security 333,156,928.00 158,276,180.00 336,132,805.6 -177,856,625.6 177,856,625.6 52.9%
Health 1,494,843,787.00
1,522,145,819.00 1,508,196,269.8 13,949,549.2 13,949,549.2 0.9%
Education and Training 1,853,139,499.00
1,926,546,587.00 1,869,692,408.0 56,854,179.0 56,854,179.0 3.0%
Finance 379,975,044.00 284,963,441.00 383,369,117.9 -98,405,676.9 98,405,676.9 25.7%
Trade and Industry 143,033,047.00 77,435,263.00 144,310,669.7 -66,875,406.7 66,875,406.7 46.3%
Development Planning 808,553,812.00 744,858,367.00 815,776,105.7 -70,917,738.7 70,917,738.7 8.7%
Justice, Human Rights and Correctional Services 158,173,385.00 171,786,446.00 159,586,246.6 12,200,199.4 12,200,199.4 7.6%
Home Affairs 243,447,425.00 155,636,069.00 245,621,985.0 -89,985,916.0 89,985,916.0 36.6%
Prime Minister 96,976,953.00 110,665,096.00 97,843,186.0 12,821,910.0 12,821,910.0 13.1%
Communication, Science and Technology 142,252,956.00 163,434,494.00 143,523,610.6 19,910,883.4 19,910,883.4 13.9%
Law and Constitutional Affairs 48,698,204.00 53,155,934.00 49,133,193.9 4,022,740.1 4,022,740.1 8.2%
Foreign Affairs and International Relations 290,670,948.00 280,116,307.00 293,267,325.5 -13,151,018.5 13,151,018.5 4.5%
Public Works and Transport 781,383,427.00 147,464,517.00 788,363,025.0 -640,898,508.0 640,898,508.0 81.3%
Forestry and Land Reclamation 152,959,118.00 51,578,249.00 154,325,403.9 -102,747,154.9 102,747,154.9 66.6%
Energy, Meteorology and Water Affairs 448,999,041.00 147,998,606.00 453,009,662.0 -305,011,056.0 305,011,056.0 67.3%
Labour and Employment 53,439,989.00 54,259,650.00 53,917,334.2 342,315.8 342,315.8 0.6%
Tourism, Environment and Culture 94,692,256.00 75,139,974.00 95,538,081.3 -20,398,107.3 20,398,107.3 21.4%
Auditor General Office 23,288,149.00 26,891,032.00 23,496,167.1 3,394,864.9 3,394,864.9 14.4%
His Majesty's Office 61,929,624.00 23,463,257.00 62,482,801.7 -39,019,544.7 39,019,544.7 62.4%
Public Services Commission 6,601,545.00 6,893,649.00 6,660,512.4 233,136.6 233,136.6 3.5%
21 (= sum of rest) 2,721,512,144.00
4,247,358,645.00 2,745,821,670.0 1,501,536,975.0 1,501,536,975.0 54.7%
allocated expenditure 10,337,727,281.00
10,430,067,582.00 10,430,067,582.0 0.0 3,250,533,506.6
Contingency 100,000,000.00 83,159,000.00
total expenditure 10,437,727,281.00
10,513,226,582.00
overall (PI-1) variance
0.7%
composition (PI-2) variance 31.2%
contingency share of budget
0.8%
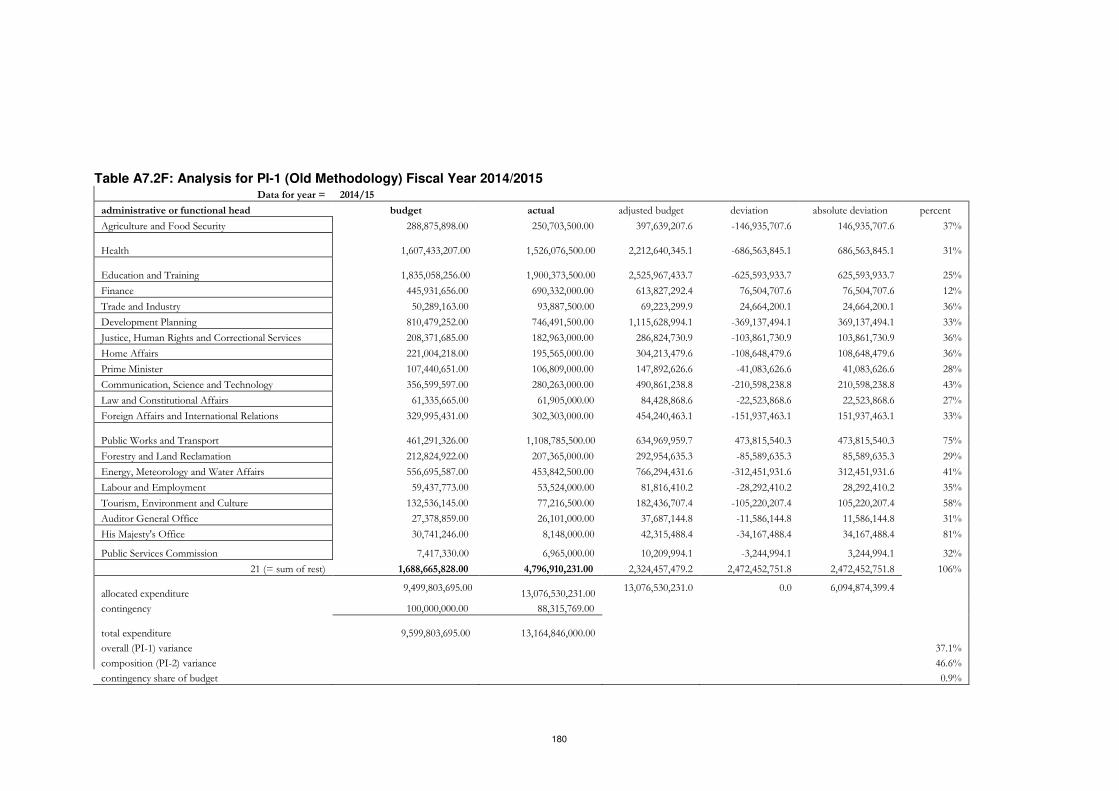
180
Table A7.2F: Analysis for PI-1 (Old Methodology) Fiscal Year 2014/2015 Data for year = 2014/15
administrative or functional head budget actual adjusted budget deviation absolute deviation percent
Agriculture and Food Security 288,875,898.00 250,703,500.00 397,639,207.6 -146,935,707.6 146,935,707.6 37%
Health 1,607,433,207.00
1,526,076,500.00 2,212,640,345.1 -686,563,845.1 686,563,845.1 31%
Education and Training 1,835,058,256.00
1,900,373,500.00 2,525,967,433.7 -625,593,933.7 625,593,933.7 25%
Finance 445,931,656.00 690,332,000.00 613,827,292.4 76,504,707.6 76,504,707.6 12%
Trade and Industry 50,289,163.00 93,887,500.00 69,223,299.9 24,664,200.1 24,664,200.1 36%
Development Planning 810,479,252.00 746,491,500.00 1,115,628,994.1 -369,137,494.1 369,137,494.1 33%
Justice, Human Rights and Correctional Services 208,371,685.00 182,963,000.00 286,824,730.9 -103,861,730.9 103,861,730.9 36%
Home Affairs 221,004,218.00 195,565,000.00 304,213,479.6 -108,648,479.6 108,648,479.6 36%
Prime Minister 107,440,651.00 106,809,000.00 147,892,626.6 -41,083,626.6 41,083,626.6 28%
Communication, Science and Technology 356,599,597.00 280,263,000.00 490,861,238.8 -210,598,238.8 210,598,238.8 43%
Law and Constitutional Affairs 61,335,665.00 61,905,000.00 84,428,868.6 -22,523,868.6 22,523,868.6 27%
Foreign Affairs and International Relations 329,995,431.00 302,303,000.00 454,240,463.1 -151,937,463.1 151,937,463.1 33%
Public Works and Transport 461,291,326.00
1,108,785,500.00 634,969,959.7 473,815,540.3 473,815,540.3 75%
Forestry and Land Reclamation 212,824,922.00 207,365,000.00 292,954,635.3 -85,589,635.3 85,589,635.3 29%
Energy, Meteorology and Water Affairs 556,695,587.00 453,842,500.00 766,294,431.6 -312,451,931.6 312,451,931.6 41%
Labour and Employment 59,437,773.00 53,524,000.00 81,816,410.2 -28,292,410.2 28,292,410.2 35%
Tourism, Environment and Culture 132,536,145.00 77,216,500.00 182,436,707.4 -105,220,207.4 105,220,207.4 58%
Auditor General Office 27,378,859.00 26,101,000.00 37,687,144.8 -11,586,144.8 11,586,144.8 31%
His Majesty's Office 30,741,246.00 8,148,000.00 42,315,488.4 -34,167,488.4 34,167,488.4 81%
Public Services Commission 7,417,330.00 6,965,000.00 10,209,994.1 -3,244,994.1 3,244,994.1 32%
21 (= sum of rest) 1,688,665,828.00 4,796,910,231.00 2,324,457,479.2 2,472,452,751.8 2,472,452,751.8 106%
allocated expenditure 9,499,803,695.00
13,076,530,231.00
13,076,530,231.0 0.0 6,094,874,399.4
contingency 100,000,000.00 88,315,769.00
total expenditure 9,599,803,695.00
13,164,846,000.00
overall (PI-1) variance
37.1%
composition (PI-2) variance
46.6%
contingency share of budget 0.9%
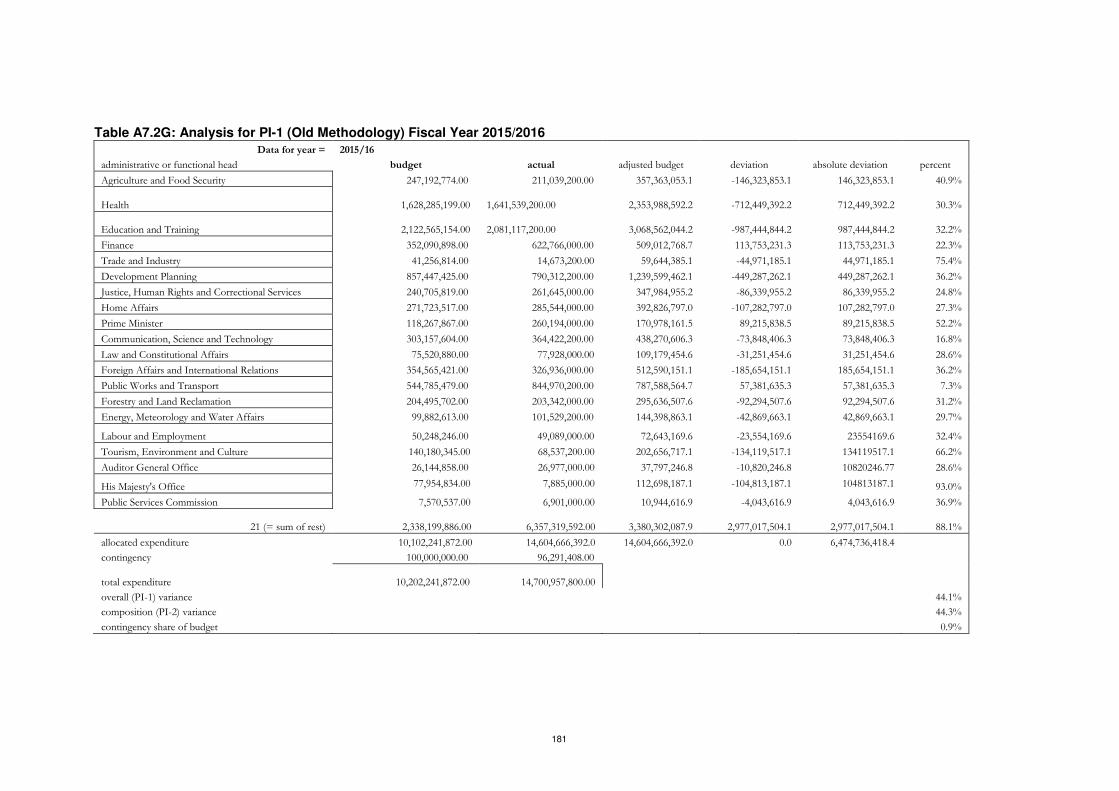
181
Table A7.2G: Analysis for PI-1 (Old Methodology) Fiscal Year 2015/2016
Data for year = 2015/16
administrative or functional head budget actual adjusted budget deviation absolute deviation percent
Agriculture and Food Security 247,192,774.00 211,039,200.00 357,363,053.1 -146,323,853.1 146,323,853.1 40.9%
Health 1,628,285,199.00 1,641,539,200.00 2,353,988,592.2 -712,449,392.2 712,449,392.2 30.3%
Education and Training 2,122,565,154.00 2,081,117,200.00 3,068,562,044.2 -987,444,844.2 987,444,844.2 32.2%
Finance 352,090,898.00 622,766,000.00 509,012,768.7 113,753,231.3 113,753,231.3 22.3%
Trade and Industry 41,256,814.00 14,673,200.00 59,644,385.1 -44,971,185.1 44,971,185.1 75.4%
Development Planning 857,447,425.00 790,312,200.00 1,239,599,462.1 -449,287,262.1 449,287,262.1 36.2%
Justice, Human Rights and Correctional Services 240,705,819.00 261,645,000.00 347,984,955.2 -86,339,955.2 86,339,955.2 24.8%
Home Affairs 271,723,517.00 285,544,000.00 392,826,797.0 -107,282,797.0 107,282,797.0 27.3%
Prime Minister 118,267,867.00 260,194,000.00 170,978,161.5 89,215,838.5 89,215,838.5 52.2%
Communication, Science and Technology 303,157,604.00 364,422,200.00 438,270,606.3 -73,848,406.3 73,848,406.3 16.8%
Law and Constitutional Affairs 75,520,880.00 77,928,000.00 109,179,454.6 -31,251,454.6 31,251,454.6 28.6%
Foreign Affairs and International Relations 354,565,421.00 326,936,000.00 512,590,151.1 -185,654,151.1 185,654,151.1 36.2%
Public Works and Transport 544,785,479.00 844,970,200.00 787,588,564.7 57,381,635.3 57,381,635.3 7.3%
Forestry and Land Reclamation 204,495,702.00 203,342,000.00 295,636,507.6 -92,294,507.6 92,294,507.6 31.2%
Energy, Meteorology and Water Affairs 99,882,613.00 101,529,200.00 144,398,863.1 -42,869,663.1 42,869,663.1 29.7%
Labour and Employment 50,248,246.00 49,089,000.00 72,643,169.6 -23,554,169.6 23554169.6 32.4%
Tourism, Environment and Culture 140,180,345.00 68,537,200.00 202,656,717.1 -134,119,517.1 134119517.1 66.2%
Auditor General Office 26,144,858.00 26,977,000.00 37,797,246.8 -10,820,246.8 10820246.77 28.6%
His Majesty's Office 77,954,834.00 7,885,000.00 112,698,187.1 -104,813,187.1 104813187.1 93.0%
Public Services Commission 7,570,537.00 6,901,000.00 10,944,616.9 -4,043,616.9 4,043,616.9 36.9%
21 (= sum of rest) 2,338,199,886.00
6,357,319,592.00 3,380,302,087.9 2,977,017,504.1 2,977,017,504.1 88.1%
allocated expenditure 10,102,241,872.00 14,604,666,392.0 14,604,666,392.0 0.0 6,474,736,418.4
contingency 100,000,000.00 96,291,408.00
total expenditure 10,202,241,872.00
14,700,957,800.00
overall (PI-1) variance
44.1%
composition (PI-2) variance
44.3%
contingency share of budget 0.9%
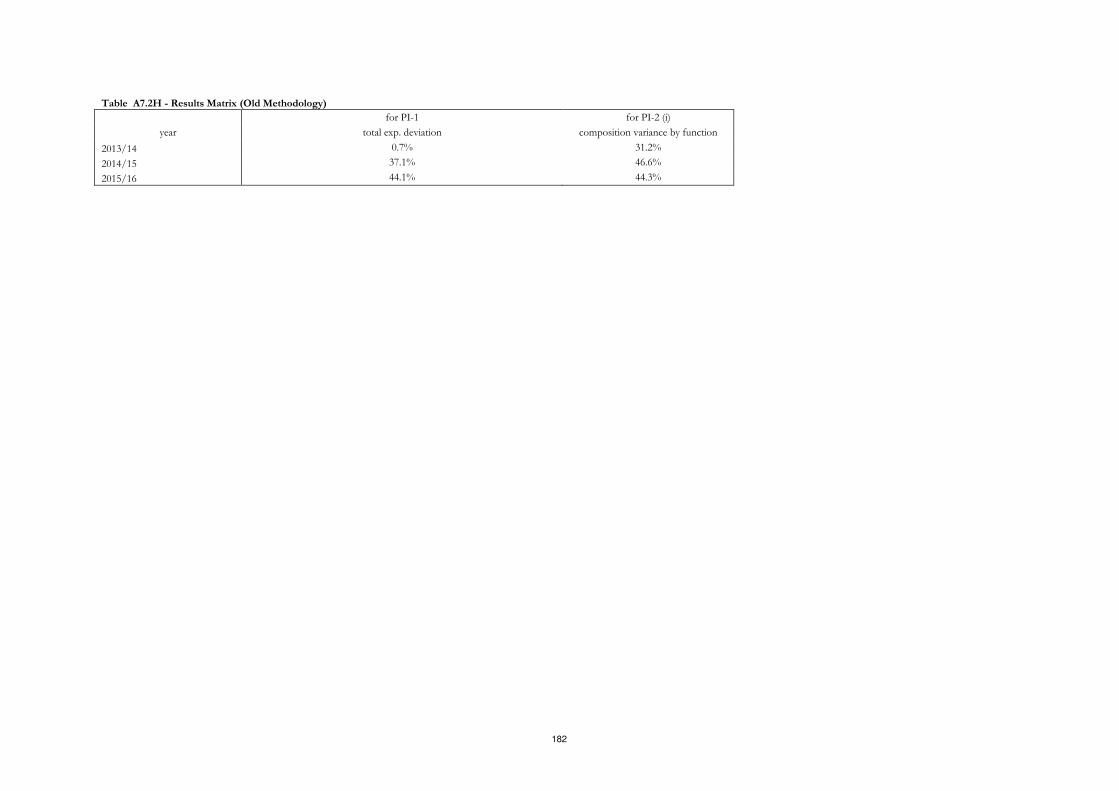
182
Table A7.2H - Results Matrix (Old Methodology)
for PI-1 for PI-2 (i)
year total exp. deviation composition variance by function
2013/14 0.7% 31.2%
2014/15 37.1% 46.6%
2015/16 44.1% 44.3%

183
Annex 6: PEFA Check Accreditation
PEFA assessment report of the Kingdom of Lesotho
The quality assurance process followed in the production of this report satisfies
all the requirements of the PEFA Secretariat and hence receives the ‘PEFA
CHECK’.
PEFA Secretariat
April 5, 2017