Pediatric Malnutrition: Putting New definitions into...
76
LINDA PHELAN RD,CSR, LD FEBRUARY 28, 2016 PEDIATRIC MALNUTRITION: PUTTING NEW DEFINITIONS INTO PRACTICE
-
Upload
phungkhuong -
Category
Documents
-
view
225 -
download
2
Transcript of Pediatric Malnutrition: Putting New definitions into...
L I N D A P H E L A N R D , C S R , L D F E B R U A R Y 2 8 , 2 0 1 6
PEDIATRIC MALNUTRITION: PUTTING NEW DEFINITIONS INTO PRACTICE

OBJECTIVES
• Review new consensus guidelines for pediatric malnutrition • Review KDOQI guidelines for nutrition • Review subjective global nutrition assessment • Review nutrition focused physical exam in pediatrics • Discuss uremic failure to thrive in children • Compare/contrast • Recommendations for pediatric renal patients

DEFINING PEDIATRIC MALNUTRITION PARADIGM SHIFT TOWARD ETIOLOGY-RELATED
DEFINITIONS MEHTA NM ET AL. JPEN 2013; 37:460-481.
• Acknowledges probable under recognition of pediatric malnutrition despite
reported incidence of 6-51% of hospitalized children • Cites: Lack of uniform definitions Lack of continuity among nutrition screening practices Failure to prioritize nutrition as part of patient care
• Current terminology (protein-energy malnutrition, marasmus, kwashiorkor) does not account for various etiologies or interactions that account for pediatric undernutrition
• Proposed a better definition for Pediatric Malnutrition to achieve 6 goals

1) Early identification 2) Comparison of prevalence
between studies and centers
3) Uniform screening tools 4) Thresholds for
interventions 5) Collection of meaningful
nutrition data 6) Impact of malnutrition and
its treatment on patient outcomes
GOALS FOR DEFINITION OF PEDIATRIC MALNUTRITION
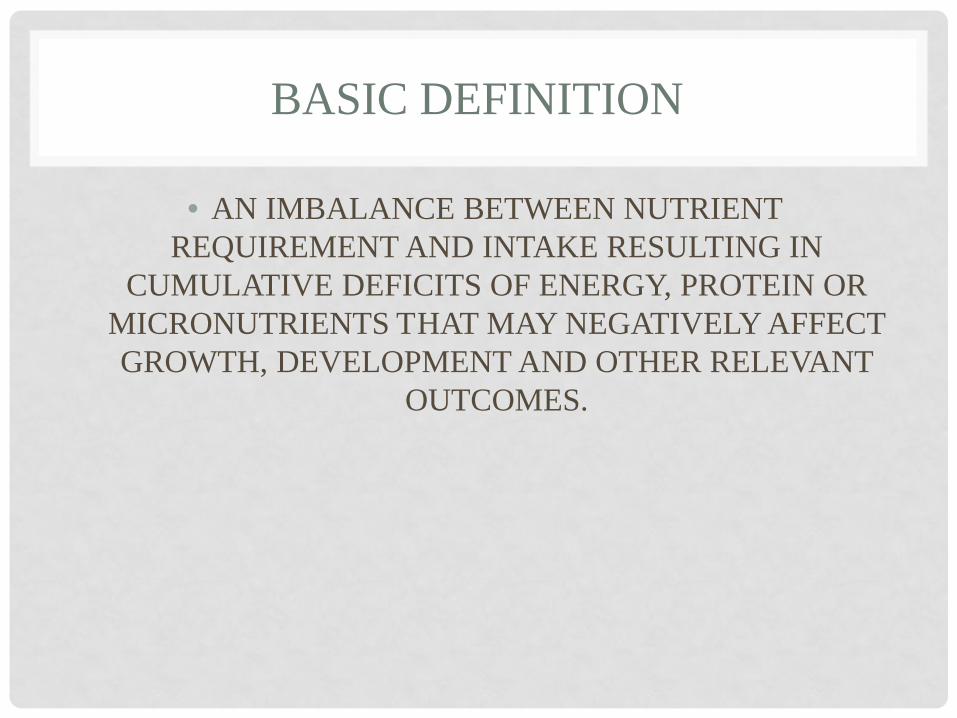
BASIC DEFINITION
• AN IMBALANCE BETWEEN NUTRIENT REQUIREMENT AND INTAKE RESULTING IN
CUMULATIVE DEFICITS OF ENERGY, PROTEIN OR MICRONUTRIENTS THAT MAY NEGATIVELY AFFECT GROWTH, DEVELOPMENT AND OTHER RELEVANT
OUTCOMES.

Table 3. Main Classification and Definitions/Characteristics of Pediatric Malnutrition.
Nilesh M. Mehta et al. JPEN J Parenter Enteral Nutr 2013;37:460-481
Copyright © by The American Society for Parenteral and Enteral Nutrition
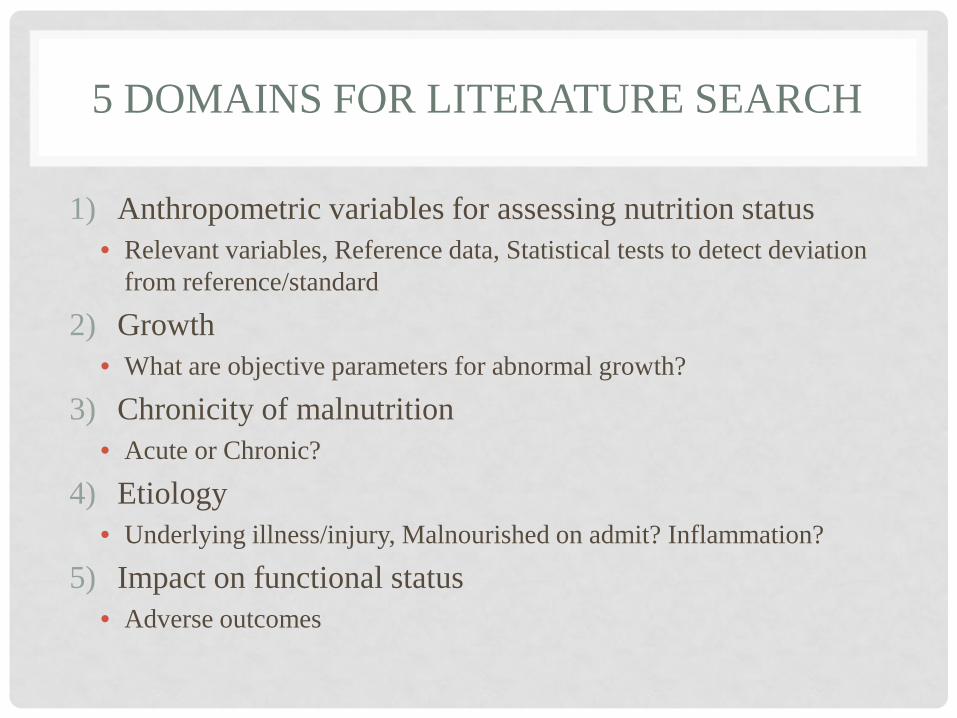
5 DOMAINS FOR LITERATURE SEARCH
1) Anthropometric variables for assessing nutrition status • Relevant variables, Reference data, Statistical tests to detect deviation
from reference/standard
2) Growth • What are objective parameters for abnormal growth?
3) Chronicity of malnutrition • Acute or Chronic?
4) Etiology • Underlying illness/injury, Malnourished on admit? Inflammation?
5) Impact on functional status • Adverse outcomes
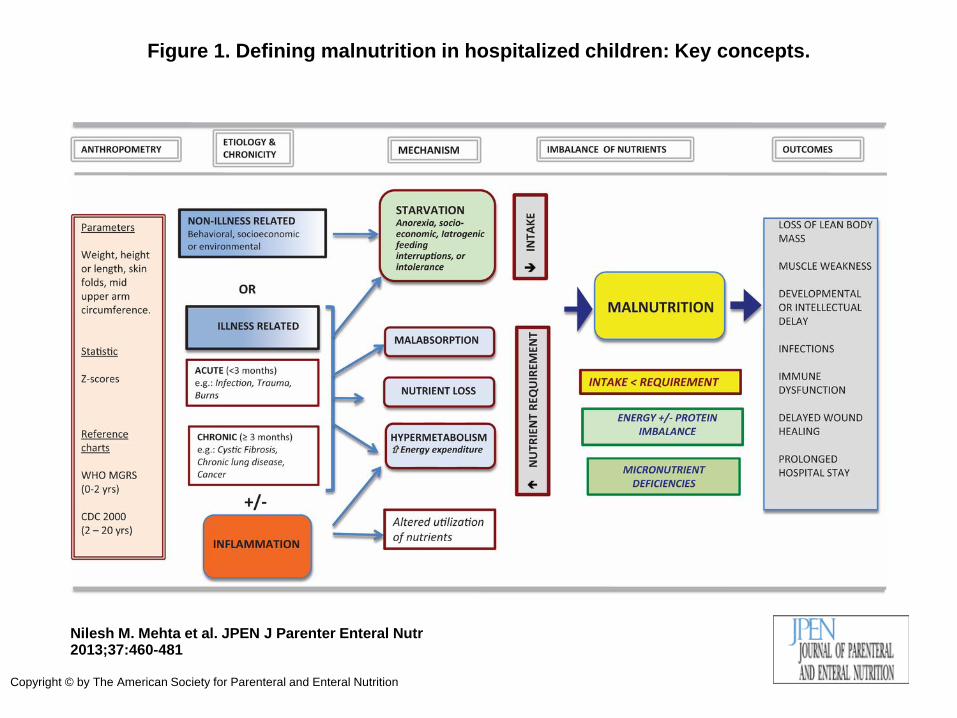
Figure 1. Defining malnutrition in hospitalized children: Key concepts.
Nilesh M. Mehta et al. JPEN J Parenter Enteral Nutr 2013;37:460-481
Copyright © by The American Society for Parenteral and Enteral Nutrition

ONE YEAR LATER…… A S P E N & A N D W O R K G R O U P I S S U E C O N S E N S U S
G U I D E L I N E S

• CONSENSUS STATEMENT OF THE ACADEMY OF NUTRITION AND DIETETICS/AMERICAN SOCIETY FOR PARENTERAL AND ENTERAL NUTRITION: INDICATORS RECOMMENDED FOR THE IDENTIFICATION AND DOCUMENTATION OF PEDIATRIC MALNUTRITION (UNDERNUTRITION)
Becker P, Carney LN et al. Nutr Clin Pract. 2015 Feb;30(1):147-61. J Acad Nutr Diet. 2014 Dec;114(12):1988-2000.
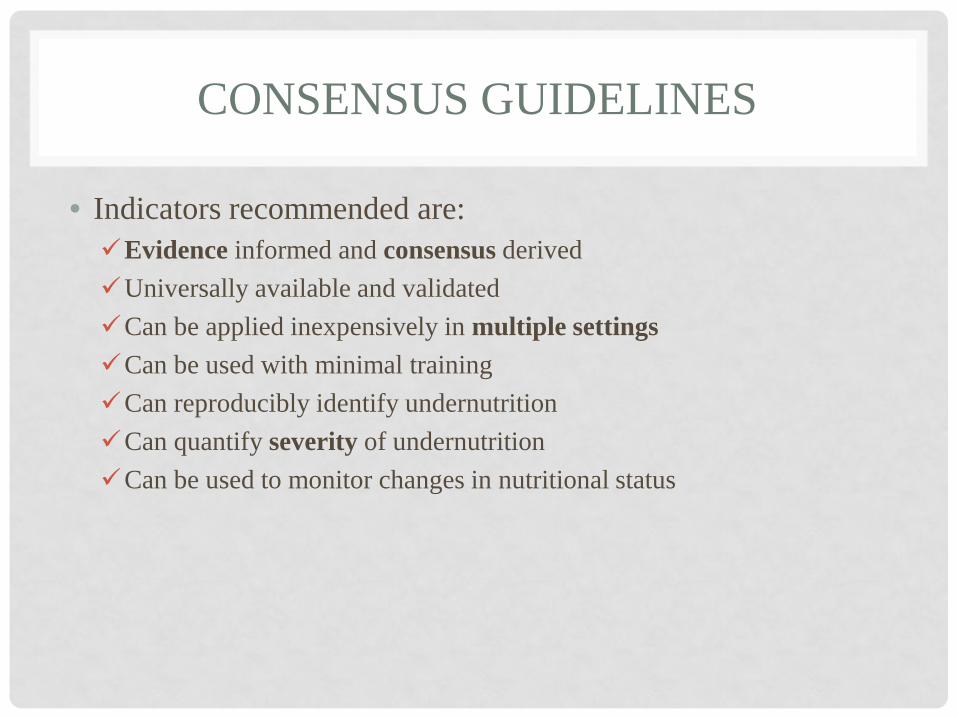
CONSENSUS GUIDELINES
• Indicators recommended are: Evidence informed and consensus derived Universally available and validated Can be applied inexpensively in multiple settings Can be used with minimal training Can reproducibly identify undernutrition Can quantify severity of undernutrition Can be used to monitor changes in nutritional status

Table 3. Primary Indicators When Single Data Point Available. 71 -74,76,77 .
Patricia Becker et al. Nutr Clin Pract 2014;30:147-161
Copyright © by The American Society for Parenteral and Enteral Nutrition

Table 4. Primary Indicators When 2 or More Data Points Available. 71 -74,76,77 .
Patricia Becker et al. Nutr Clin Pract 2014;30:147-161
Copyright © by The American Society for Parenteral and Enteral Nutrition

Table 1. Resources for Determining z Scores for Anthropometrics.
Patricia Becker et al. Nutr Clin Pract 2014;30:147-161
Copyright © by The American Society for Parenteral and Enteral Nutrition

Mehta et al.
• Wt, Ht, HC (<2), BMI • Use WHO (<2) & CDC (>2) • Use corrected age until 3 yrs • Express anthros as Z scores • MUAC • Consider TSF, MAMC, HGS • Define acute as < 3 mo’s • Define chronic as > 3 mo’s • Illness related or non-illness • Consider inflammation • Determine those at highest risk
for hospital acquired malnutrition
Consensus Guidelines
• Wt for Ht (Length) Z score • BMI for age Z score • Ht/Length for age Z score • MUAC
If 2 or more data points:
• Wt gain velocity (< 2 ) • Wt loss (2-20) • Decline in wt for ht(length) Z sc • Inadequate nutrient intake
Assigns degree of malnutrition as mild, moderate or severe

KDOQI NUTRITION GUIDELINES FOR CHILDREN WITH CKD
• Do the KDOQI guidelines include the indicators recommended by Mehta et al and/or Consensus Guidelines?
• Parameters for assessing nutritional status are discussed in Recommendation 1 and 2: • Wt (EDW), Ht (length) and HC for age percentile or z score (SDS) • Ht (length) Velocity for age percentile or z score (SDS) • BMI for height age percentile or z score (SDS) • nPCR in HD adolescents • Frequency recommendations are included • Dietary intake compared to estimated needs
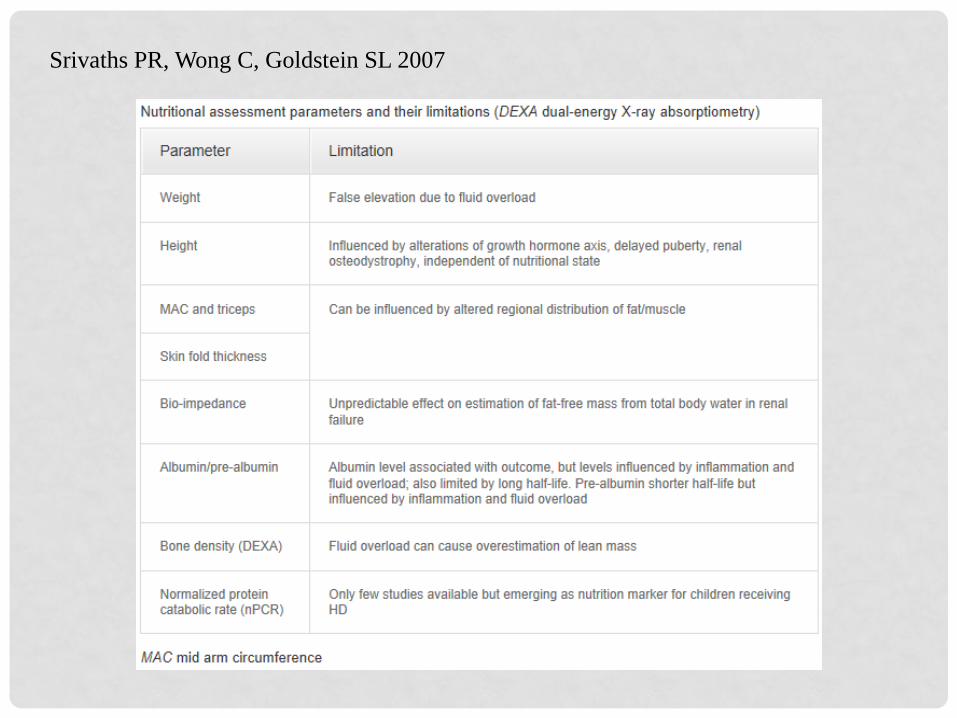
Srivaths PR, Wong C, Goldstein SL 2007

Consensus
• Wt for Ht (Length) z score • BMI for age z score • Ht/Length for age z score • MUAC
If 2 or more data points: • Wt gain velocity (< 2 ) • Wt loss (2-20) • Decline in wt for ht(length) z sc • Inadequate nutrient intake
KDOQI
• No – but implies with BMI • No – uses BMI for ht age z sc • Yes • No • No – uses Ht velocity for age • Not specifically* • No – but implies with BMI • Yes
*KDOQI does recommend measurement of wt, ht and HC routinely, the use SDS (Z scores) and monitoring changes over time.

Consensus
• Assigns degree of malnutrition: o Mild o Moderate o Severe
KDOQI
• Uses BMI for ht age that is < 5th percentile as definition for malnutrition (Recommendation 4.4)

WHY THE DIFFERENCES?
• KDOQI suggests using only BMI’s and not wt for ht
measurements. BMI tables are available with WHO growth charts for 0-2. Mehta also recommends using BMI. The use of z scores recommended by all.
• Fluid overload (and dehydration) will affect wt measurement
as well as MUAC and TSF.

325 children (Kenya) between 3 mo’s and 5 yrs admitted for dehydration Children measured upon admit and again 48 hrs later

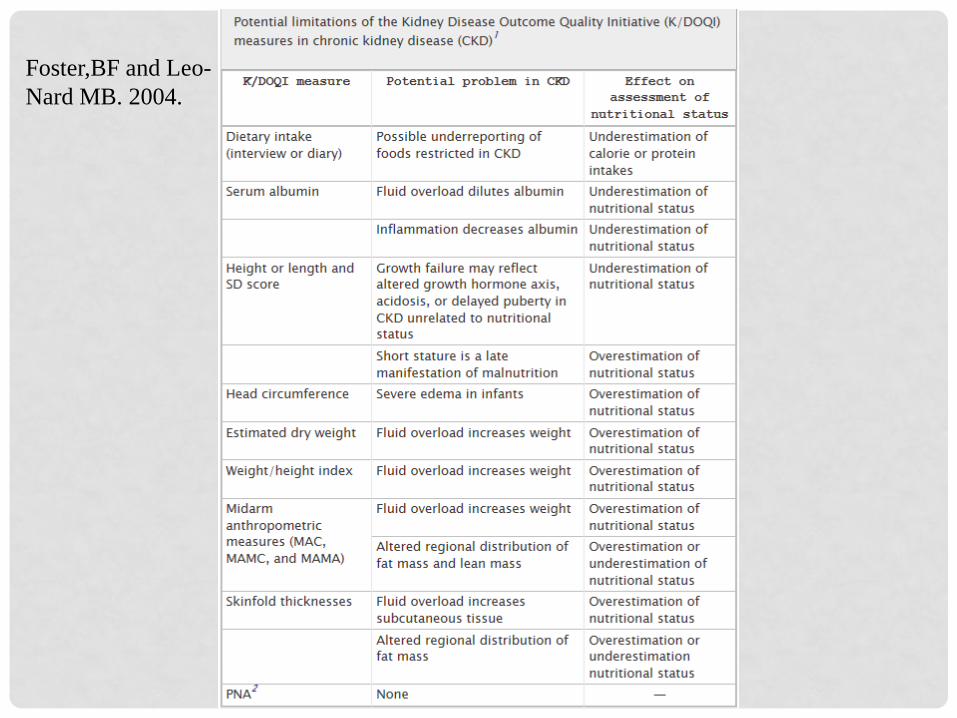
Foster,BF and Leo- Nard MB. 2004.

WHY THE DIFFERENCES?
• Fluid overload representing 10% of BW results in BMI z score 0.5-1.0 SD greater than what it would be at dry wt. • 5 parameters helpful in determining dry wt.
• Wt • Presence of edema • Blood pressure • Certain labs (decreased Na, decreased Albumin) • Diet interview – rapid wt gain in absence of significant increase in
calories or decrease in physical activity.

WHY THE DIFFERENCES?
• In non CKD children a continued decrease in wt velocity resulting from undernutrition can leading to stunting. Stunting therefore is a reasonable definition of long term malnutrition in otherwise healthy children.
• In CKD, there are multifactorial causes of stunting that may
not be related to a decrease in wt velocity. Using wt velocity ignores fluid issues and may oversimplify the cause of growth failure in CKD. A decline in ht velocity warrants a thorough evaluation of ALL possible causes which include adequacy of nutrient intake.
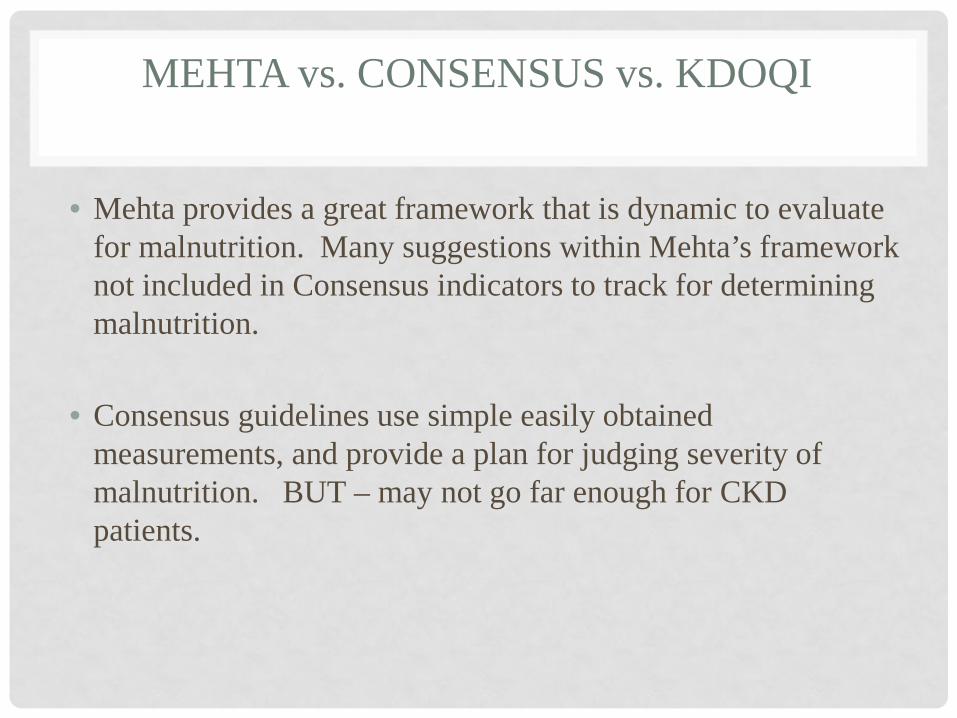
MEHTA vs. CONSENSUS vs. KDOQI
• Mehta provides a great framework that is dynamic to evaluate for malnutrition. Many suggestions within Mehta’s framework not included in Consensus indicators to track for determining malnutrition.
• Consensus guidelines use simple easily obtained
measurements, and provide a plan for judging severity of malnutrition. BUT – may not go far enough for CKD patients.

MEHTA - CONSENSUS – KDOQI
• KDOQI incorporates many similar measurements suggested by Mehta and Consensus.
• A major omission with KDOQI is the MUAC measurement – if done in a CKD child it must be in context with fluid status.
• Other recommendations in KDOQI – bone disease management , electrolyte management, metabolic acidosis and growth hormone – expands on other reasons for growth (height/length) failure. (More on this later)


13y 5m (161 months), male
Value Imperial %ile Z-score 50%ile
Weight (kg) 27.3 60.2 lb 0% -3.48 47.8
Stature (cm) 141 55.5 in 1% -2.28 159
Wt-for-stature (kg)
BMI-for-age 13.7 0% -3.39 18.7
Ht age is 10 years BMI for ht age Z score is -1.4 Using chronological age: Meets criteria for Severe
Malnutrition Using ht age: Meets criteria for Mild Malnutrition
Interpretation using single data point criteria

14y 2m (170 months), male
Value Imperial %ile Z-score 50%ile
Weight (kg) 40.824 90 lb 9% -1.37 51.9
Stature (cm) 146.1 57.5 in 1% -2.25 165
Wt-for-stature (kg)
BMI-for-age 19.1 48% -0.06 19.2
Interpretation using single data point
Ht age is 10y 9m BMI for ht age is 0.79 Using Chronological age: not malnourished
Using Ht age: well nourished BUT NO IMPROVEMENT IN GROWTH VELOCITY SINCE REGAINING WT

OTHER NUTRITION ASSESSMENT TOOLS FOR PEDIATRIC MALNUTRITION
Subjective Global Nutrition Assessment
(SGNA) And
Pediatric Nutrition Focused Physical Exam (NFPR)

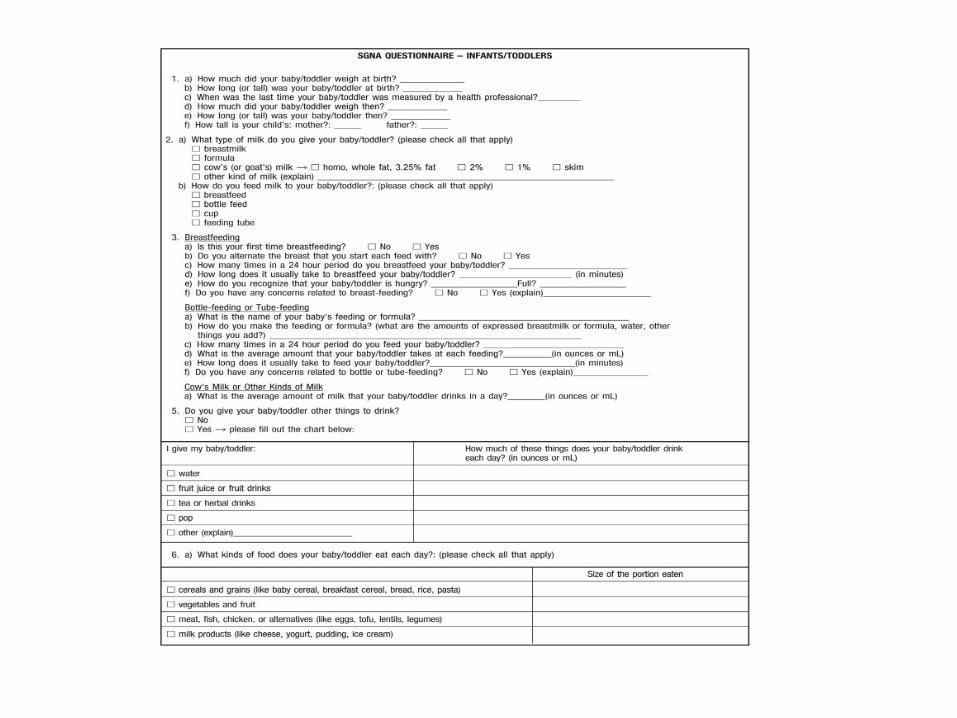
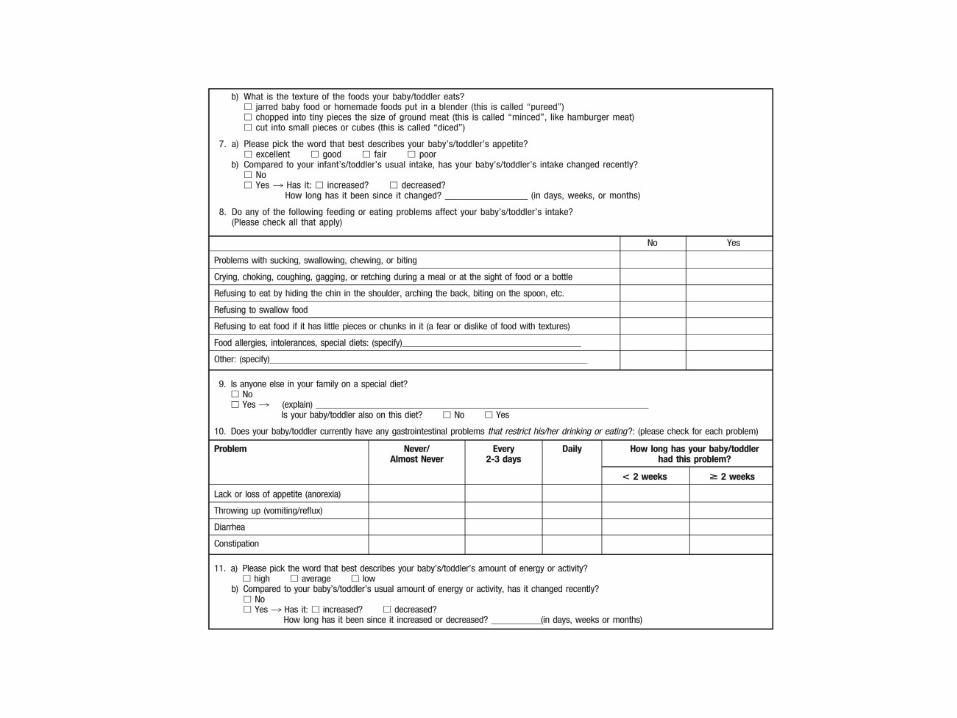
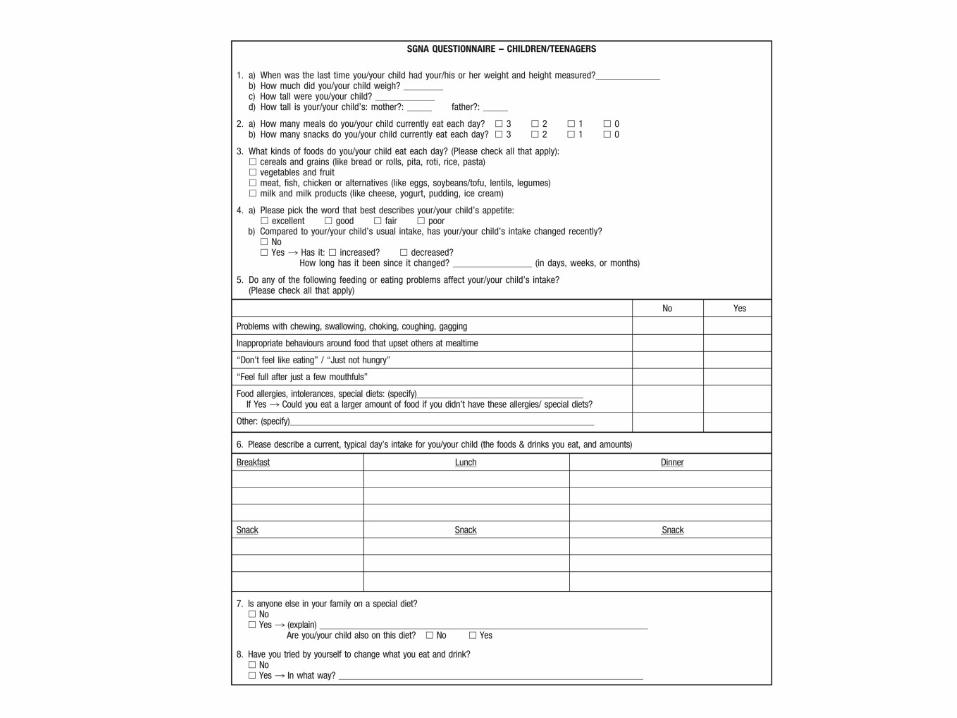
SUBJECTIVE GLOBAL NUTRITION ASSESSMENT
• Baker et al (1982) – 34 yrs ago showed subjective clinical judgement a valid reproducible technique to evaluate nutritional status in adult
• Subjective Global Assessment (1990-2000) – shown in numerous studies to be a valid structured clinical approach. Recommended in the 2000 KDOQI Nutrition Guidelines for adults
• Secker DJ and Jeejeebhoy KN (2007) –developed and tested in surgical pediatric pts. Used in evaluating 175 children; ages 31days to 17.9 years

SGNA
• Secker DJ and Jeejeebhoy KN (2007) o Defined 3 classifications Well nourished Moderately malnourished Severely malnourished
o Found higher rates of infection and longer post-op hospitalization o Objective measures: Albumin, transferrin, total lymphocyte count were
unable to make these predictions
SGNA
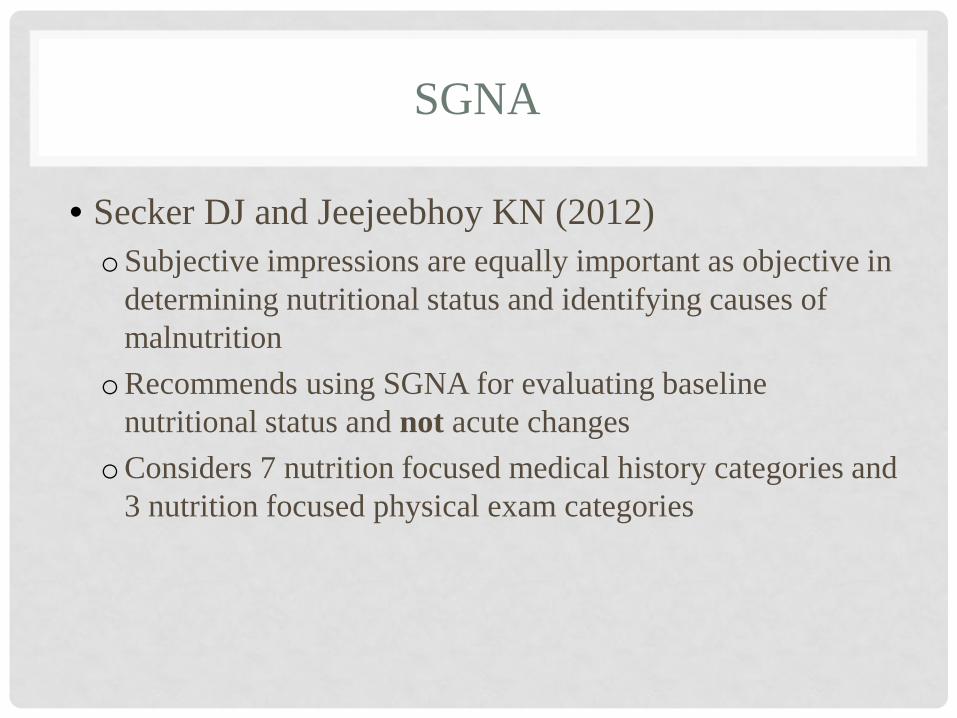
• Secker DJ and Jeejeebhoy KN (2012) oSubjective impressions are equally important as objective in
determining nutritional status and identifying causes of malnutrition
oRecommends using SGNA for evaluating baseline nutritional status and not acute changes
oConsiders 7 nutrition focused medical history categories and 3 nutrition focused physical exam categories


Examples of moderate or severe metabolic stress conditions that should be considered when using the Subjective Global Nutrition Assessment tool for pediatric populations.
Donna J. Secker, Khursheed N. Jeejeebhoy. JAND. 2012; 112:424-431

Donna J. Secker, Khursheed N. Jeejeebhoy. JAND. 2012; 112:424-431


NUTRITION FOCUSED PHYSICAL EXAM
NFPE

NFPE
• Complete nutrition assessment includes:
• Medical Record Review • Anthropometric Measurements • Diet/Nutrition Intake • Interview • Physical Exam
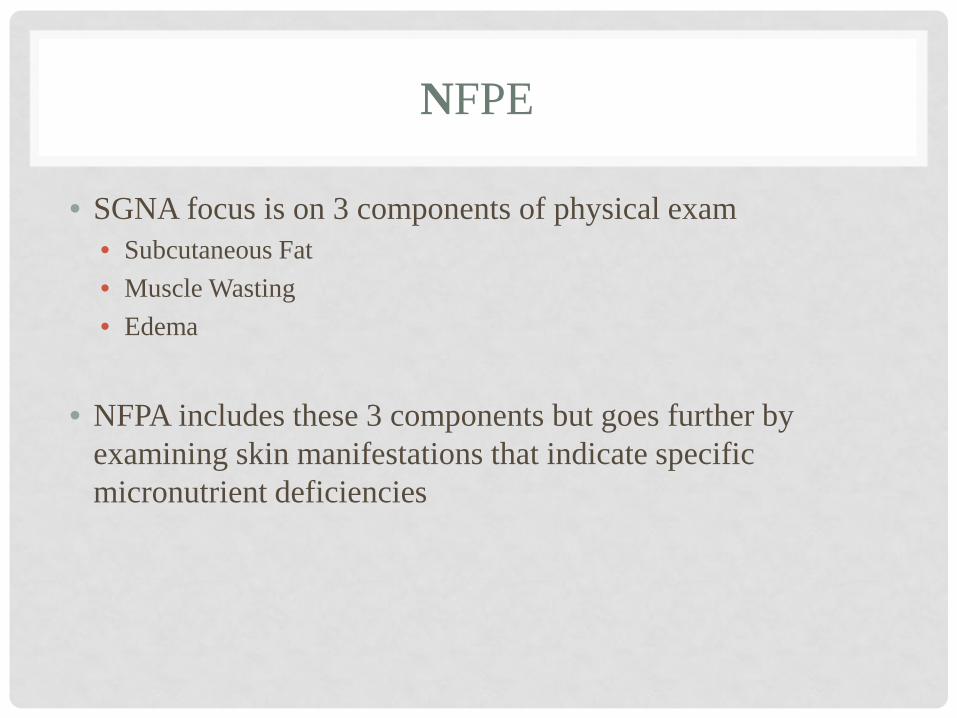
• SGNA focus is on 3 components of physical exam • Subcutaneous Fat • Muscle Wasting • Edema
• NFPA includes these 3 components but goes further by
examining skin manifestations that indicate specific micronutrient deficiencies
NFPE

NFPE
• Begin by reviewing history, obtaining data. • Use this information to focus your exam on areas of
concern. • Gather tools: disposable gloves, penlight, tongue
depressor

Table 1. Common Pediatric Diagnoses and Possible Nutrient Deficiencies. 24 .
Kelly Green Corkins Nutr Clin Pract 2015;30:203-209
Copyright © by The American Society for Parenteral and Enteral Nutrition

Table 2. Nutrition Concerns Based on Physical Examination.
Kelly Green Corkins Nutr Clin Pract 2015;30:203-209
Copyright © by The American Society for Parenteral and Enteral Nutrition

NFPE
• Recent publications describe skin manifestations to look for in children o Corkins KG. Nutrition-focused physical examination in pediatric
patients. Nutri Clin Pract. 2015: 30:203-209. o Wolff J and Mordarski B. Pediatric Nutrition Focused Physical Exam
Pocket Guide. 2015. Academy of Nutrition and Dietetics.
• These physical manifestations (hair, skin, nails, face, neck mouth, tongue, eyes etc.) are described extensively in the adult literature as well. They are the same!

LET’S GET BACK TO RENAL
UREMIC FAILURE TO THRIVE IN CHILDREN
E X PA N D I N G O N T H O S E O T H E R R E A S O N S F O R F T T I N C H I L D R E N W I T H C K D

INTERNATIONAL SOCIETY OF RENAL NUTRITION AND METABOLISM (ISRNM)
• Select panel met during 2006 and issued position paper
published in 2008 • Considered both adults and children with CKD • Cited confusion with multiple definitions and terminology • Purpose was to develop uniform definition for presence of loss
of muscle and fat tissues, presence of malnutrition and/or presence of inflammation.
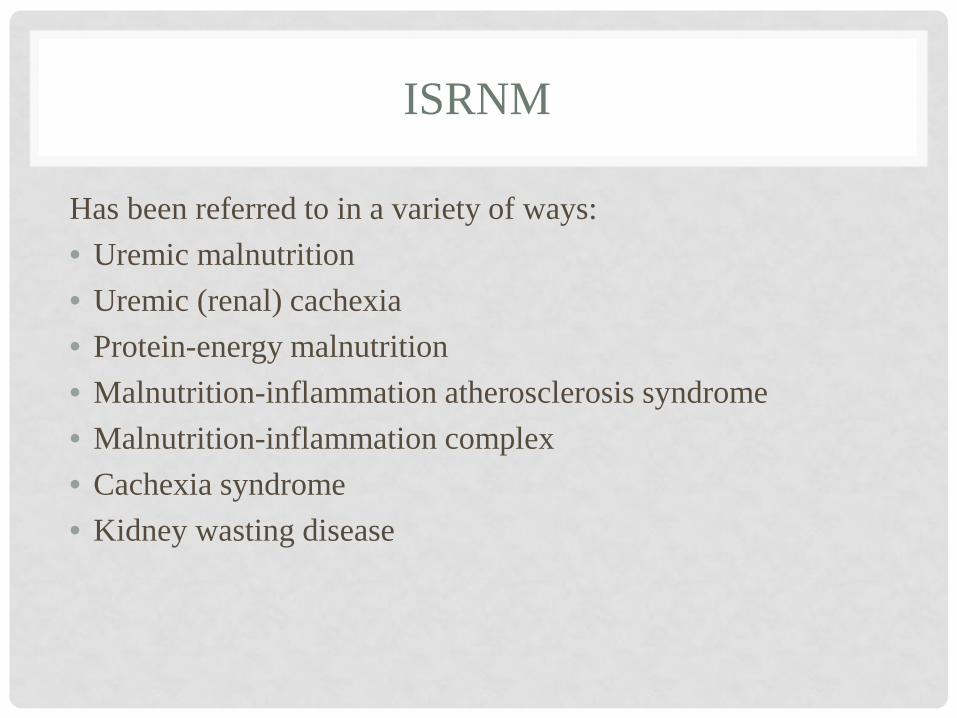
ISRNM
Has been referred to in a variety of ways: • Uremic malnutrition • Uremic (renal) cachexia • Protein-energy malnutrition • Malnutrition-inflammation atherosclerosis syndrome • Malnutrition-inflammation complex • Cachexia syndrome • Kidney wasting disease

A state of metabolic and nutritional derangement characterized by “decreased body stores of protein and energy fuels (body protein and fat masses)” in both adults and children with chronic kidney disease
Protein-Energy Wasting
PEW
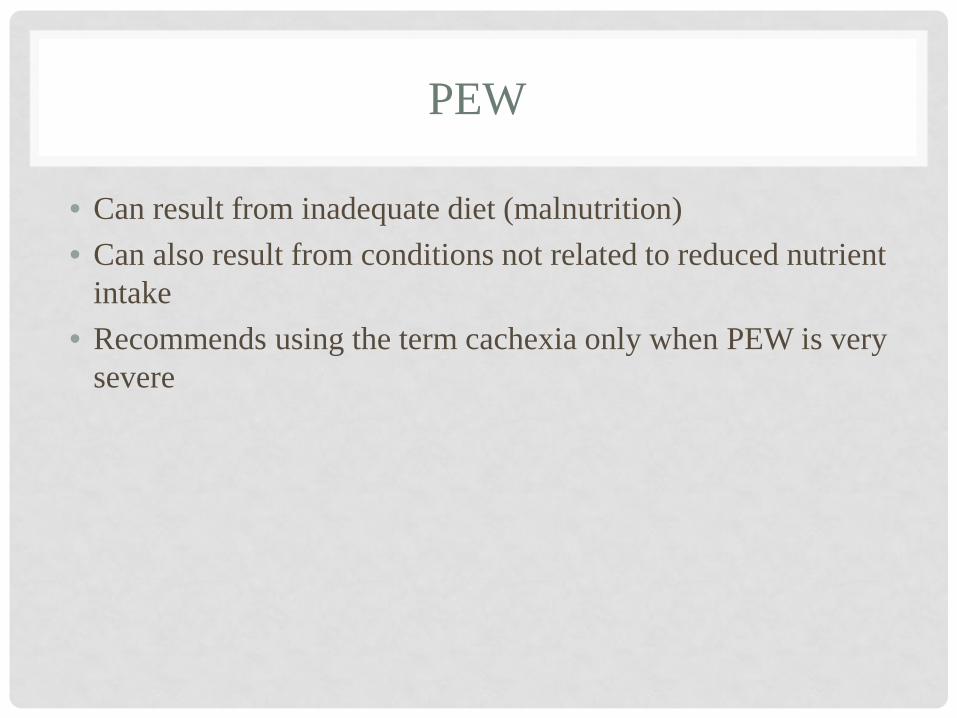
PEW
• Can result from inadequate diet (malnutrition) • Can also result from conditions not related to reduced nutrient
intake • Recommends using the term cachexia only when PEW is very
severe
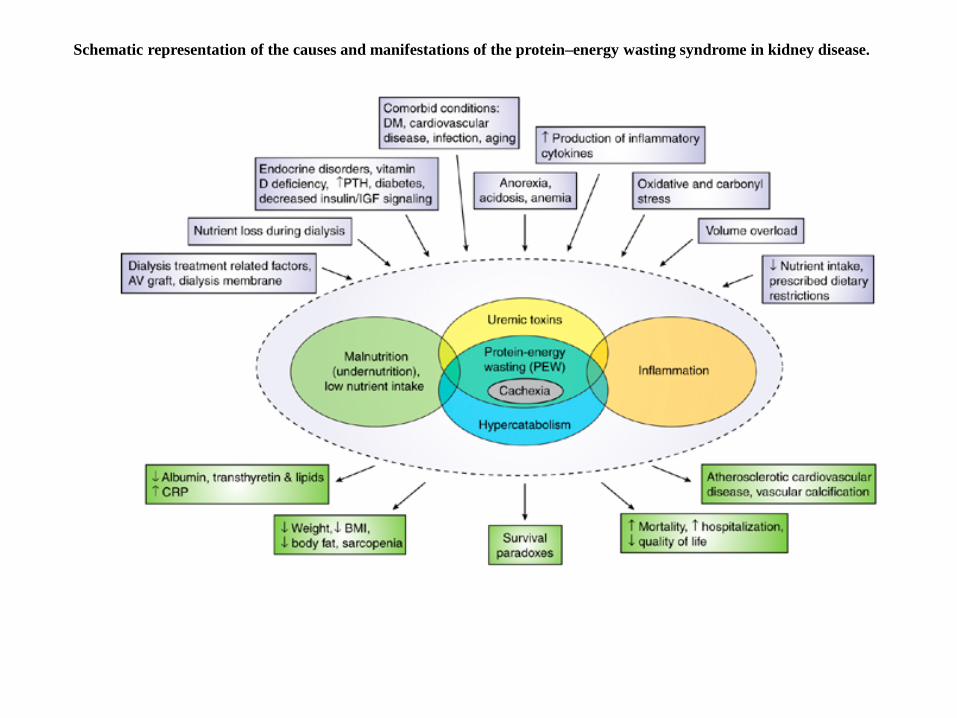
Schematic representation of the causes and manifestations of the protein–energy wasting syndrome in kidney disease.
PEW
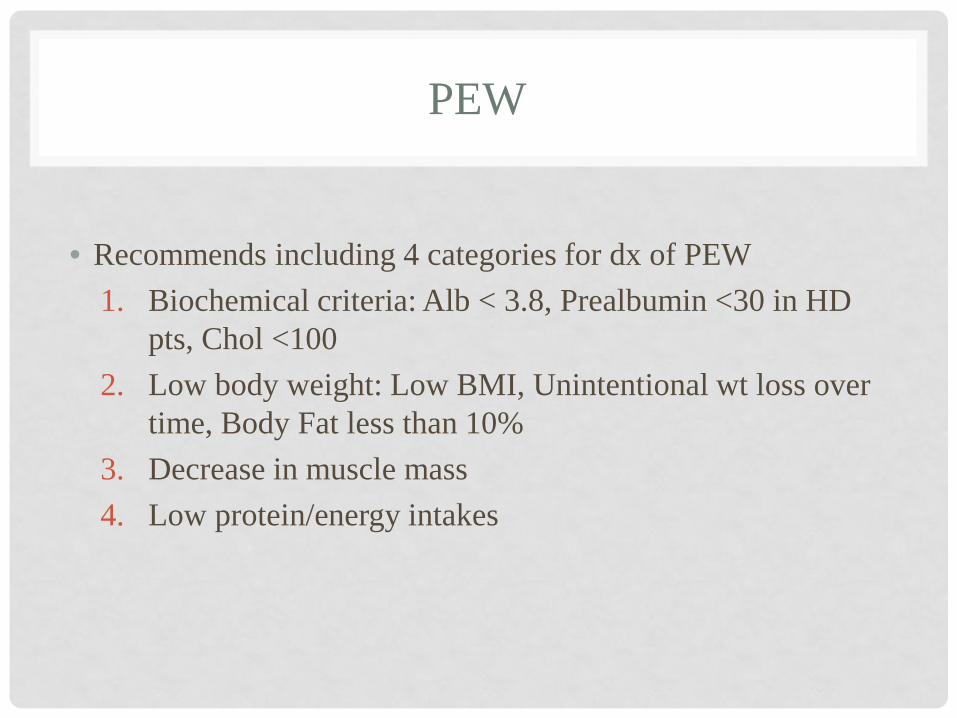
• Recommends including 4 categories for dx of PEW
1. Biochemical criteria: Alb < 3.8, Prealbumin <30 in HD pts, Chol <100
2. Low body weight: Low BMI, Unintentional wt loss over time, Body Fat less than 10%
3. Decrease in muscle mass 4. Low protein/energy intakes
But does this schematic and criteria really apply to children??

Abraham AG, Mak RH, Mitsnefes M, White C, Moxey-Mims M, Warady B, Furth SL. Protein energy wasting in children with chronic kidney disease. Pediatr
Nephrol (2014) 29:1231-1238
• 528 children (median age 12 yrs) using data from CKid study (CKD stages 1-3) • Proposed modification to the diagnostic categories from ISRNM to apply to
children • 5 categories were: 1. Biochemical: Chol < 100, Alb < 3.8, Transferrin < 140, CRP >3 2. Reduced body mass: BMI for ht age < 5th or decrease of >10% over 1 yr 3. Reduced muscle mass: MUAC for ht age < 5th percentile or decrease of >10% 4. Decreased appetite: reported as fair, poor or very poor over week before study 5. Poor growth: Ht for age < 3% or decreased growth velocity
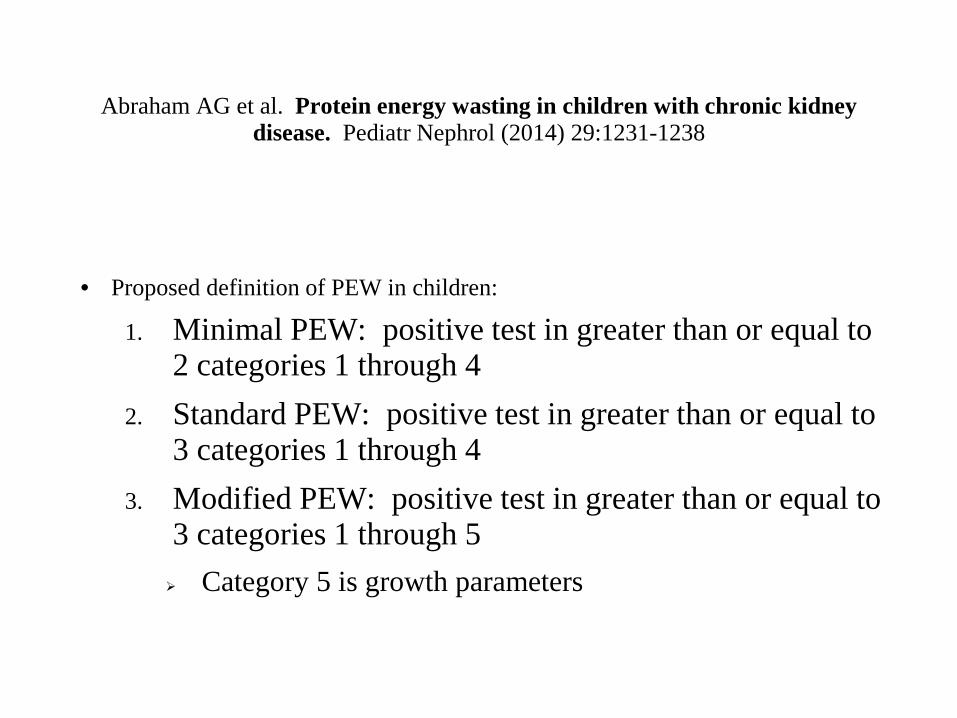
Abraham AG et al. Protein energy wasting in children with chronic kidney disease. Pediatr Nephrol (2014) 29:1231-1238
• Proposed definition of PEW in children:
1. Minimal PEW: positive test in greater than or equal to 2 categories 1 through 4
2. Standard PEW: positive test in greater than or equal to 3 categories 1 through 4
3. Modified PEW: positive test in greater than or equal to 3 categories 1 through 5 Category 5 is growth parameters
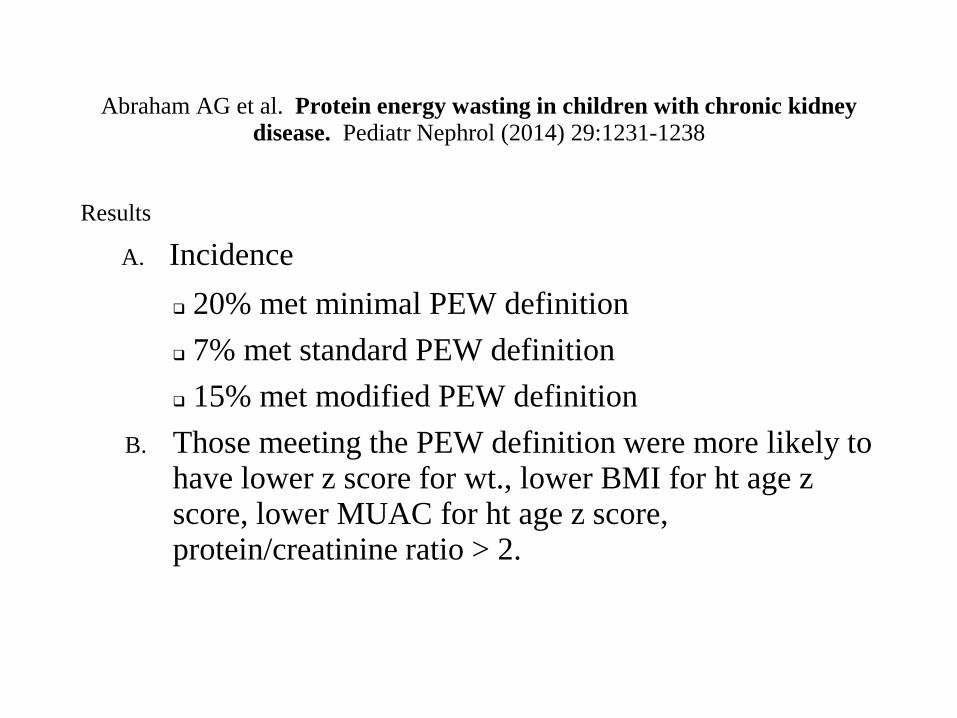
Abraham AG et al. Protein energy wasting in children with chronic kidney disease. Pediatr Nephrol (2014) 29:1231-1238
Results
A. Incidence 20% met minimal PEW definition 7% met standard PEW definition 15% met modified PEW definition
B. Those meeting the PEW definition were more likely to have lower z score for wt., lower BMI for ht age z score, lower MUAC for ht age z score, protein/creatinine ratio > 2.
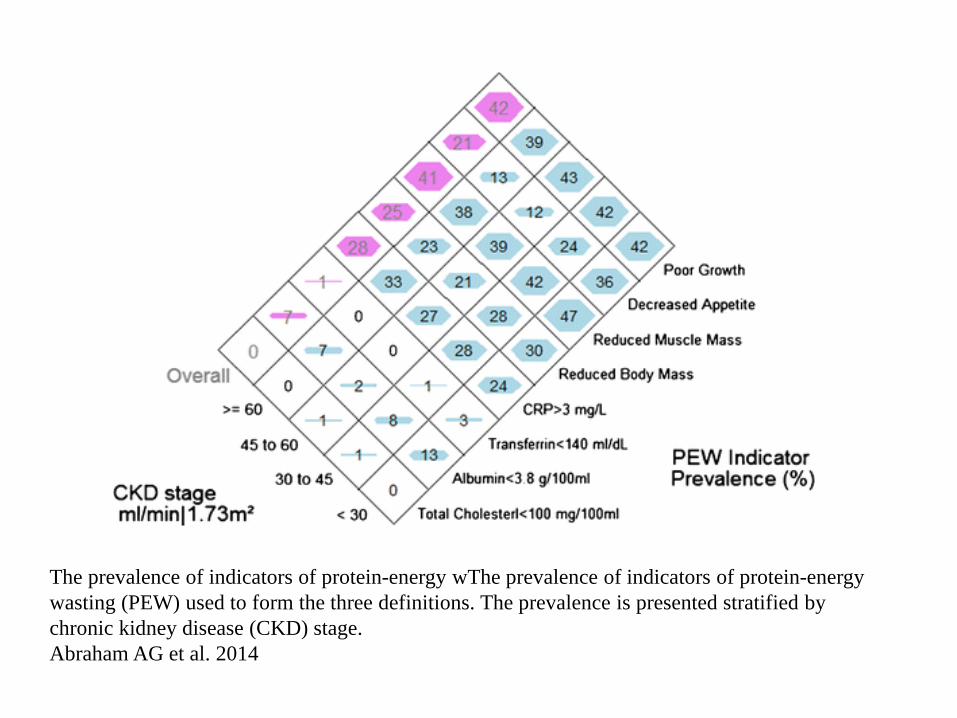
The prevalence of indicators of protein-energy wThe prevalence of indicators of protein-energy wasting (PEW) used to form the three definitions. The prevalence is presented stratified by chronic kidney disease (CKD) stage. Abraham AG et al. 2014

The prevalence of protein-energy wasting (PEW) as classified using the three definitions adopted in this study: Abraham AG eta al. 2015.
Abraham AG et al. Protein energy wasting in children with chronic kidney disease. Pediatr Nephrol (2014) 29:1231-1238
CONCLUSION
Growth a better standard for diagnosing PEW in children with CKD than weight-based criteria.
Any definition of PEW in children must include growth criteria.

Nourbakhsh N, Rhee CM, Kalantar-Zadeh, K. Protein-energy wasting and uremic failure to thrive in children with chronic kidney disease: They are not
small adults. Pedatr Nephrol (2014) 29: 2249-2252.
• Editorial commentary agreeing that growth parameters should be used in
definition of PEW in children. • Suggested using the term “Uremic Failure to Thrive” to differentiate criteria
used to determine PEW in adults vs the criteria used to determine PEW in children
• Comments that MUAC, BMI for ht age, growth velocity is strongly applicable for measurement Uremic Failure to Thrive.
• Suggests using dietary intake records rather than subjective reporting of appetite • Made adaptations to the schematic representation of PEW to account for the
issues in children
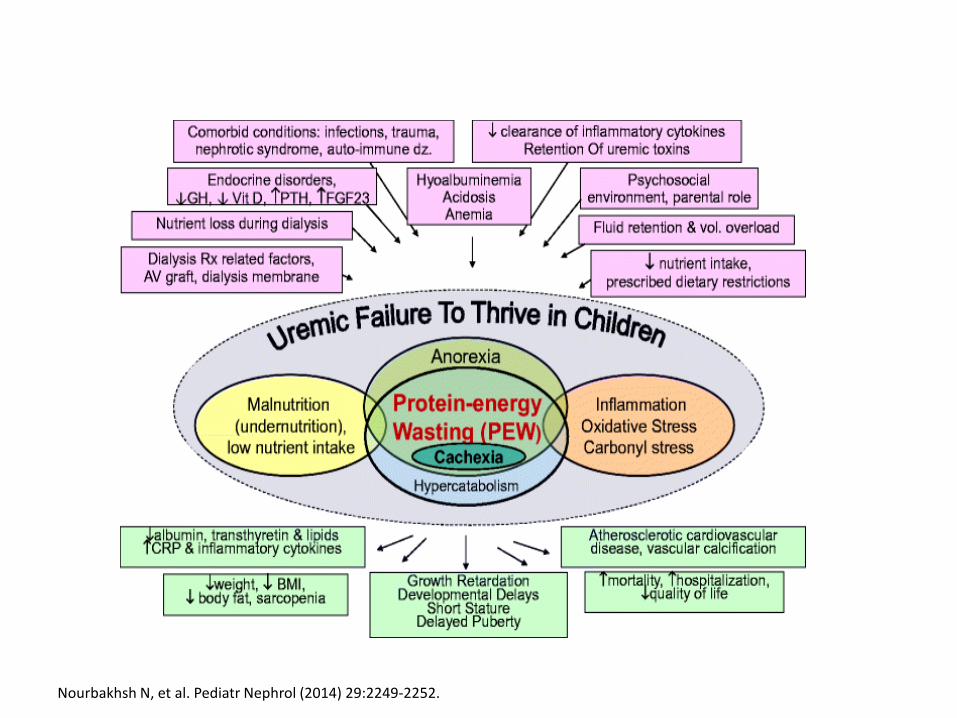
Nourbakhsh N, et al. Pediatr Nephrol (2014) 29:2249-2252.

CONCLUSION
• The new Consensus guidelines for Pediatric Malnutrition foster evaluation that is consistent among practitioners and among a variety of health care settings.
• Most of the data points recommended can also be utilized for
evaluating children with CKD. • Data points recommended must be evaluated in the context of fluid
status and the concept of “uremic failure to thrive” to determine whether growth failure in children with CKD is truly due to malnutrition.
• The accurate determination of growth failure due to malnutrition or
to “uremic failure to thrive” can further guide appropriate care.
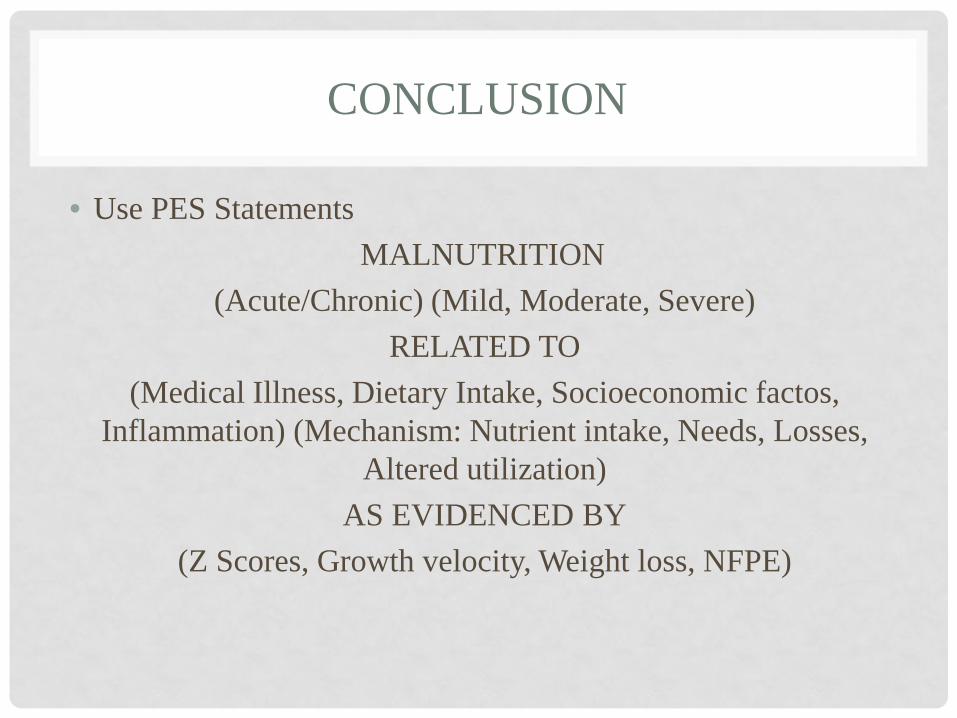
CONCLUSION
• Use PES Statements MALNUTRITION
(Acute/Chronic) (Mild, Moderate, Severe) RELATED TO
(Medical Illness, Dietary Intake, Socioeconomic factos, Inflammation) (Mechanism: Nutrient intake, Needs, Losses,
Altered utilization) AS EVIDENCED BY
(Z Scores, Growth velocity, Weight loss, NFPE)
CONCLUSION
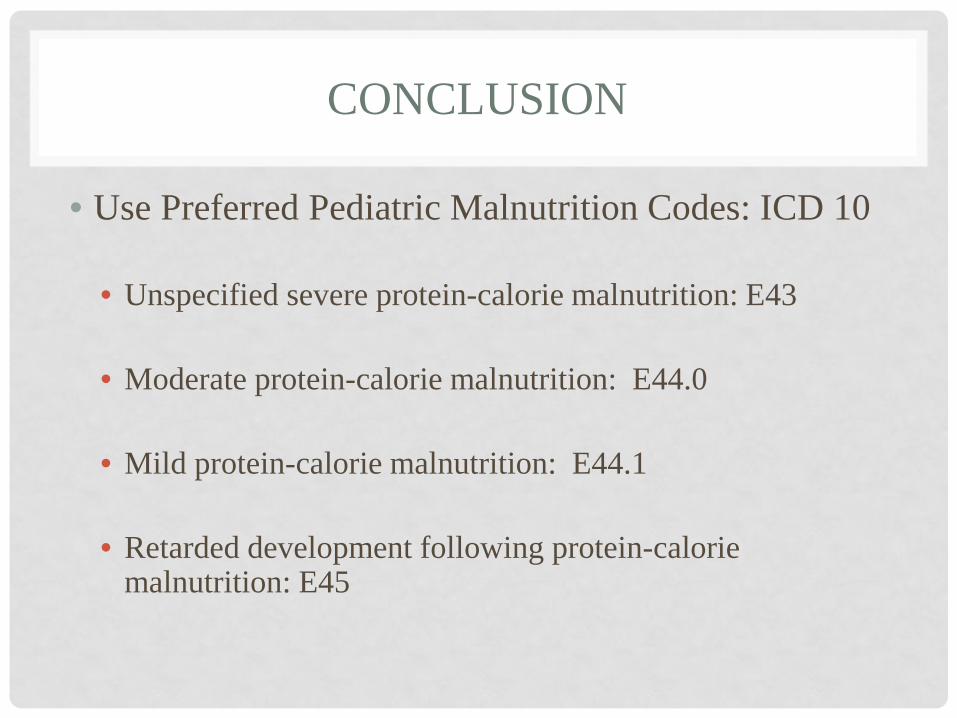
• Use Preferred Pediatric Malnutrition Codes: ICD 10
• Unspecified severe protein-calorie malnutrition: E43
• Moderate protein-calorie malnutrition: E44.0
• Mild protein-calorie malnutrition: E44.1 • Retarded development following protein-calorie
malnutrition: E45

CONCLUSION
• Avoid other malnutrition codes: • Kwashiorkor: E40 • Nutritional marasmus: E41 • Unspecified protein-calorie malnutrition: E46
WHY?
They do not specify severity!
REFERENCES
1) Abraham AG, et al. Protein energy wasting in children with chronic kidney disease. Pediatr Nephrol. 2014; 29:1231-1238.
2) Becker P, et al. Consensus statement of the Academy of Nutrition and Dietetics/American Society for Parenteral and Enteral Nutrtition: Indicators recommended for the identification and documentation of pediatric malnutrition (undernutrition). Nutr Clin Pract. 2015; Feb 30(1):147-161.
3) Corkin KG. Nutrition focused physical examination in pediatric patients. Nutr Clin Pract. 2015;30:203-209.
4) deOnis M, Yip R, and Mei Z. The development of MUAC for age reference data recommended by a WHO expert committee. Bulletin of the World Health Organization. 1997; 75 (1): 11-18.

REFERENCES
5) Fouque D, et al. A proposed nomenclature and diagnostic criteria for protein energy wasting in acute and chronic kidney disease, Kidney International. 2008; 73:391-398.
6) Foster BJ and Leonard MB. Measuring nutritional status in children with chronic kidney disease. Am J Clin Nutr. 2004; 80:801-814.
7) Frisancho, AF. New norms of upper limb fat and muscle areas for the assessment of nutritional status. Am J Clin Nutr. 1981; 34:2540-2545.
8) Mehta NM, et al. Defining pediatric malnutrition: A paradigm shift toward etiology-related definitions. JPEN. 2013;37:460-481.
9) Mordarski B and Wolff J. (eds) Pediatric Nutrition Focused Physical Exam Pocket Guide. Acad of Nutrition and Dietetics. 2015.

REFERENCES
10) Mwangome et al. Are diagnostic criteria for acute malnutrition affected by hydration status in hospitalized children? A repeated measures study. Nutrition Journal. 2011; 10: 92
11) Nourbakhsh, N, Rhee CM, Kalantar-Zadeh K. Protein-energy wasting and uremic failure to thrive in children with chronic kidney disease: they are not small adults. Pediatr Nephrol. 2014;29:2249-2252.
12) Secker DJ and Jeejeebhoy KN. Subjective global nutritional assessment for children. Am J Clin Nutr. 2007; 85:1083-1089.
REFERENCES
13) Secker DJ and Jeejeebhoy KN. How to perform subjective global nutritional assessment in children. J Acad Nutr Diet. 2012; 112:424-431.
14) Srivaths, PR, Wong C, Goldstein SL. 2009. Nutrition aspects in children receiving maintenance hemodialysis: impact on outcome. Pediatr Nephrol. 24 (5): 951-957.