Pedestrian Safety Enforcement Operations
81
Pedestrian Safety Enforcement Operations Wil Price, National Highway Traffic Safety Administration Ranjit Walia, Civic Eye Collaborative, LLC Sgt Richard Ruth, Orlando Police Department George Branyan, Washington, DC DOT June 18, 2015
Transcript of Pedestrian Safety Enforcement Operations
Pedestrian Safety Enforcement Operations
Wil Price, National Highway Traffic Safety Administration
Ranjit Walia, Civic Eye Collaborative, LLC
Sgt Richard Ruth, Orlando Police Department
George Branyan, Washington, DC DOT
June 18, 2015

Today’s Presentation
Introduction and housekeeping
Audio issues? Dial into the phone line instead of using “mic & speakers”
PBIC Trainings and Webinars www.pedbikeinfo.org/training
Registration and Archives at pedbikeinfo.org/webinars
PBIC News and updates on Facebook www.facebook.com/pedbike
Questions at the end
National Highway Traffic Safety Administration
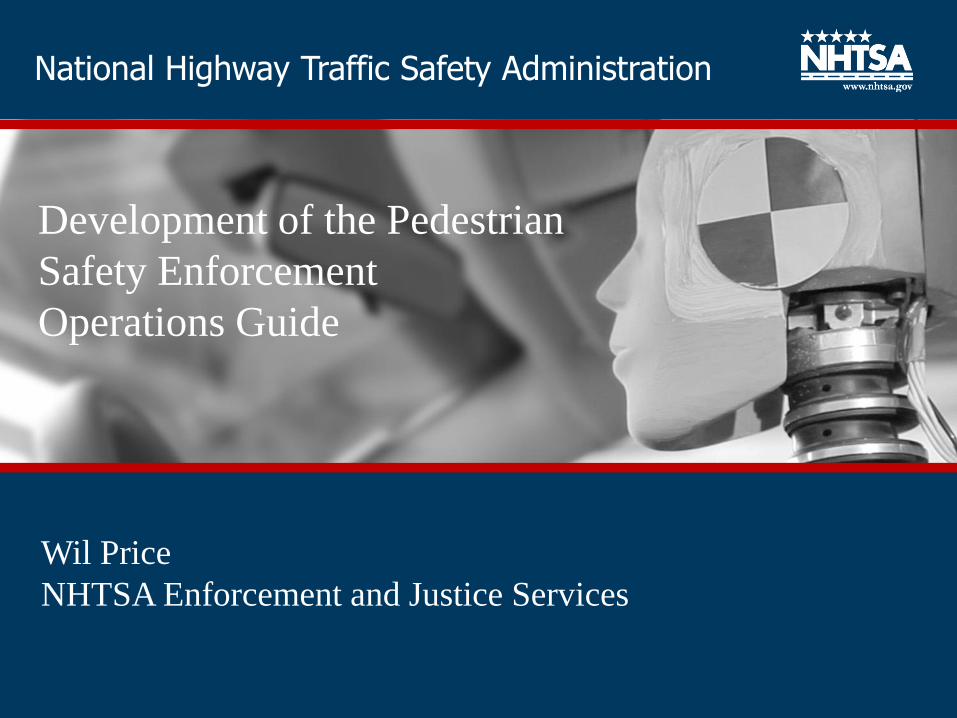
Wil Price
NHTSA Enforcement and Justice Services
Development of the Pedestrian
Safety Enforcement
Operations Guide
Safer drivers. Safer cars. Safer roads.
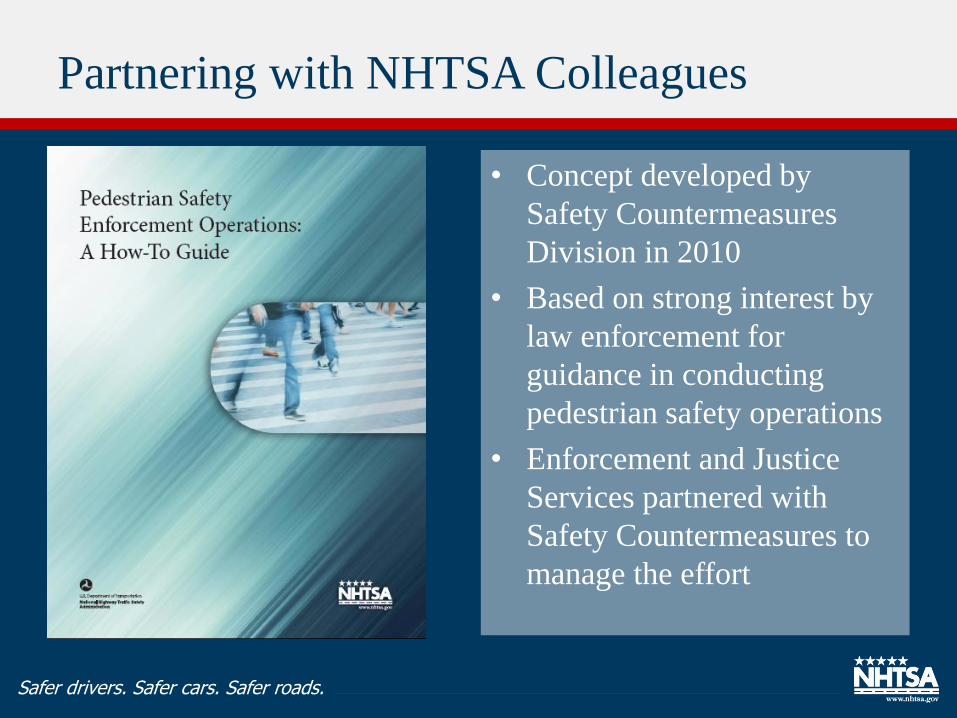
Partnering with NHTSA Colleagues
• Concept developed by
Safety Countermeasures
Division in 2010
• Based on strong interest by
law enforcement for
guidance in conducting
pedestrian safety operations
• Enforcement and Justice
Services partnered with
Safety Countermeasures to
manage the effort
Safer drivers. Safer cars. Safer roads.
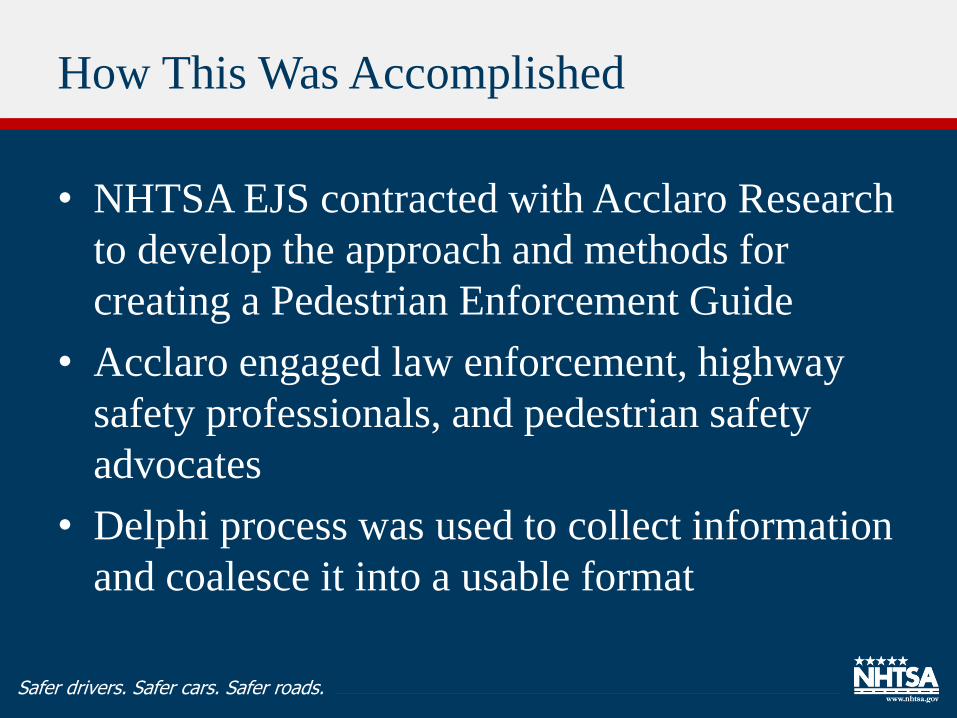
• NHTSA EJS contracted with Acclaro Research
to develop the approach and methods for
creating a Pedestrian Enforcement Guide
• Acclaro engaged law enforcement, highway
safety professionals, and pedestrian safety
advocates
• Delphi process was used to collect information
and coalesce it into a usable format
How This Was Accomplished
Safer drivers. Safer cars. Safer roads.
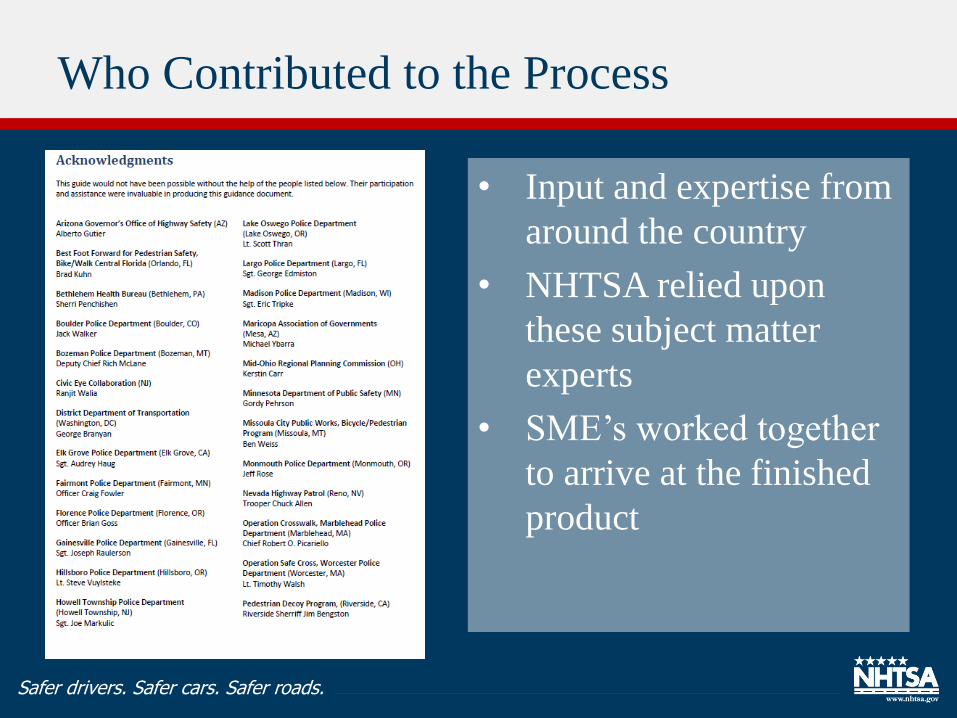
Who Contributed to the Process
• Input and expertise from
around the country
• NHTSA relied upon
these subject matter
experts
• SME’s worked together
to arrive at the finished
product
Safer drivers. Safer cars. Safer roads.
www.transportation.gov/mayors-challenge
5

Safer drivers. Safer cars. Safer roads.
http://www.nhtsa.gov/Pedestrians
Document is located under “Guide and Guidelines”
Available at no cost to download
Guide is Available on Line

NJ Pedestrian Safety Enforcement Webinar
June 18, 2015

Pedestrian Safety in New Jersey
• Pedestrian Safety Focus State • Sta;s;cs tell some of the story. During 2003-‐2010:
– 1003 pedestrian fatali;es, an average of 125 each year – 40,150 injuries , an average of 5,000 a year – Injury rates have been declining, but fatali;es have remained steady
• NJ has a high pedestrian fatality rate -‐ at 1.58 per 100,000 popula;on it’s 11th worst in the na;on (2010)
• In 2010, 25% of traffic fatali;es in New Jersey were pedestrians
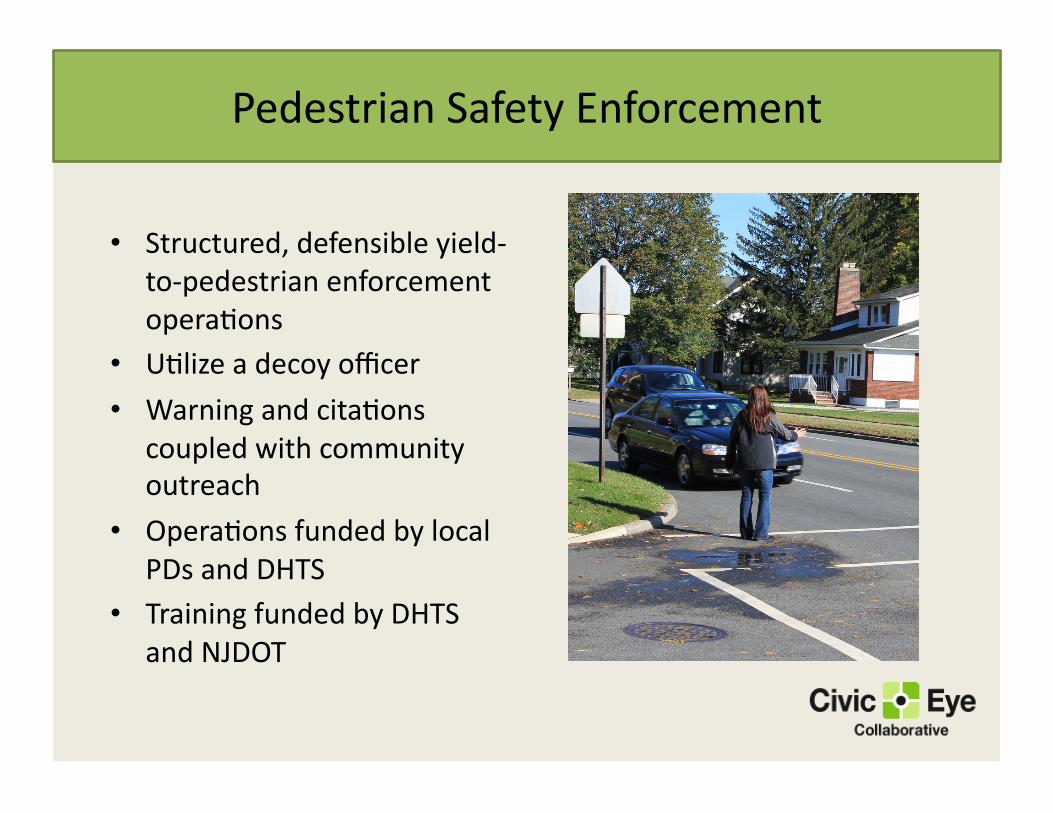
Pedestrian Safety Enforcement
• Structured, defensible yield-‐to-‐pedestrian enforcement opera;ons
• U;lize a decoy officer
• Warning and cita;ons coupled with community outreach
• Opera;ons funded by local PDs and DHTS
• Training funded by DHTS and NJDOT
Pedestrian Safety Enforcement (PSE)
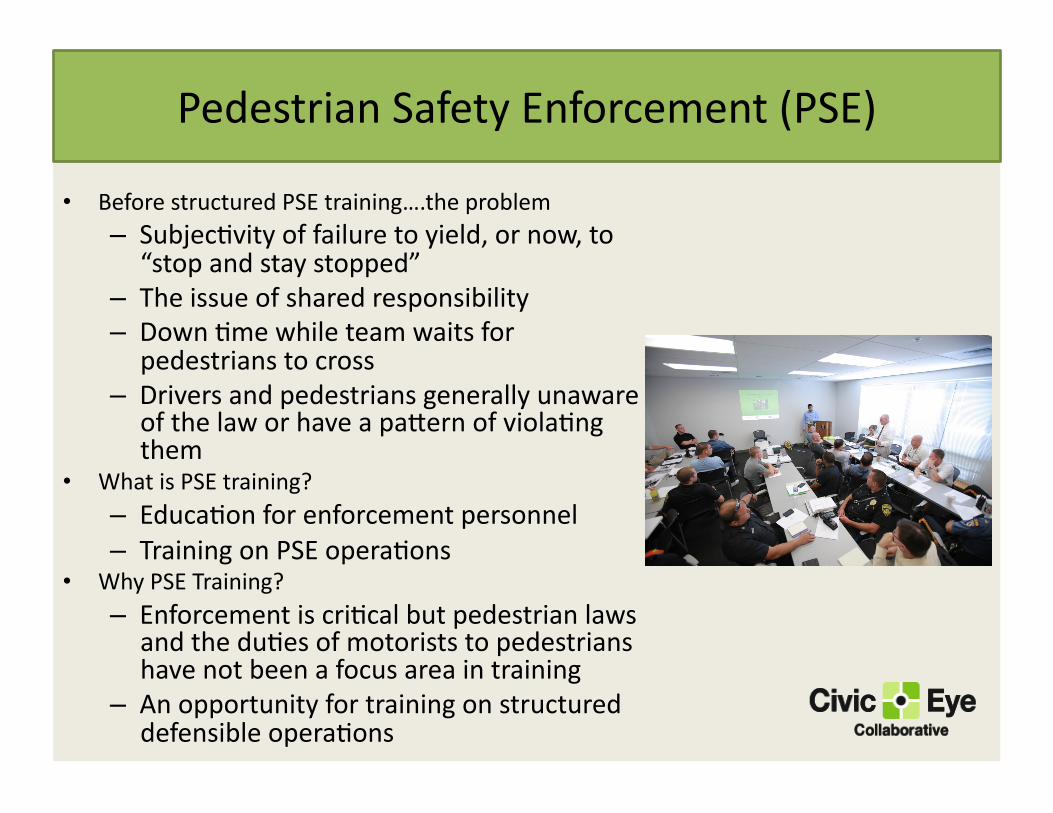
• Before structured PSE training….the problem – Subjec;vity of failure to yield, or now, to
“stop and stay stopped” – The issue of shared responsibility – Down ;me while team waits for
pedestrians to cross – Drivers and pedestrians generally unaware
of the law or have a pa[ern of viola;ng them
• What is PSE training? – Educa;on for enforcement personnel – Training on PSE opera;ons
• Why PSE Training? – Enforcement is cri;cal but pedestrian laws
and the du;es of motorists to pedestrians have not been a focus area in training
– An opportunity for training on structured defensible opera;ons
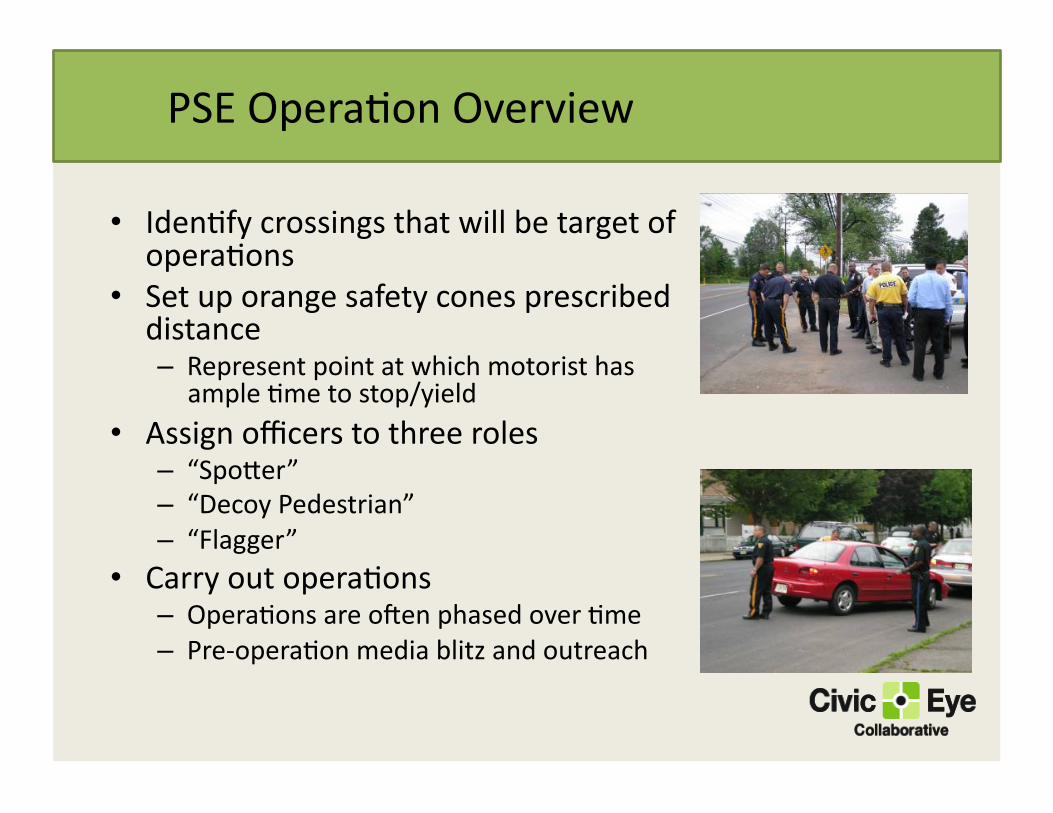
PSE Opera;on Overview
• Iden;fy crossings that will be target of opera;ons
• Set up orange safety cones prescribed distance – Represent point at which motorist has
ample ;me to stop/yield • Assign officers to three roles
– “Spo[er” – “Decoy Pedestrian” – “Flagger”
• Carry out opera;ons – Opera;ons are oaen phased over ;me – Pre-‐opera;on media blitz and outreach

Structured Opera;on Plan: • Can achieve sustained behavioral change
– More =me consuming and resource intensive
• Components to plan: – Training
– Engineering – Striping, “Stop for Pedestrian” Signs, Advanced Stop Bars
– Educa=on • To Motorists – Flyers, Sandwich Board Signs, Warnings • To Public – Feedback Signs, Flyers, Media Outreach • Feedback System – Feedback Signs
– Enforcement • Schedule (6 weeks; intense in beginning and ramp down • Loca=ons (4 loca=ons per community)
– Rotate loca=ons
– Data Collec=on (Op=onal) (4 enforcement loca=ons + 4 control points per community)
“Spot” operations: Sporadic operations over the course of the year
Temporary change in behavior if conducted in isolation More effective as reinforcement to structured 3E operations
BACKGROUND FINDINGS Evalua;on of NJ’s PSE Program

History and Current Prac;ce
• PSE 2007 – Pilot workshops – NJDOT and DHTS support and buy-‐in
• PSE 2008 – Began “Regional Trainings” – Tested “structured” opera;ons in South Orange and Montclair
• Effec;ve but resource intensive – Program was very popular with many training requests
History and Current Prac;ce
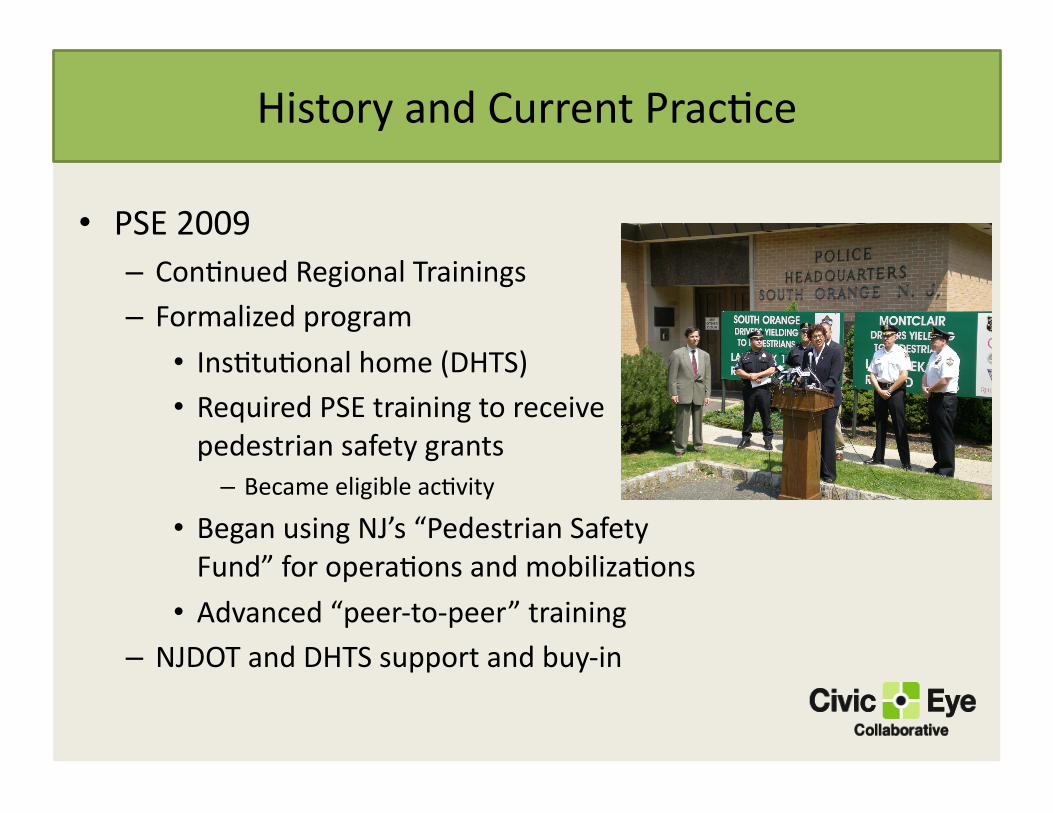
• PSE 2009 – Con;nued Regional Trainings – Formalized program
• Ins;tu;onal home (DHTS) • Required PSE training to receive pedestrian safety grants
– Became eligible ac;vity
• Began using NJ’s “Pedestrian Safety Fund” for opera;ons and mobiliza;ons
• Advanced “peer-‐to-‐peer” training – NJDOT and DHTS support and buy-‐in
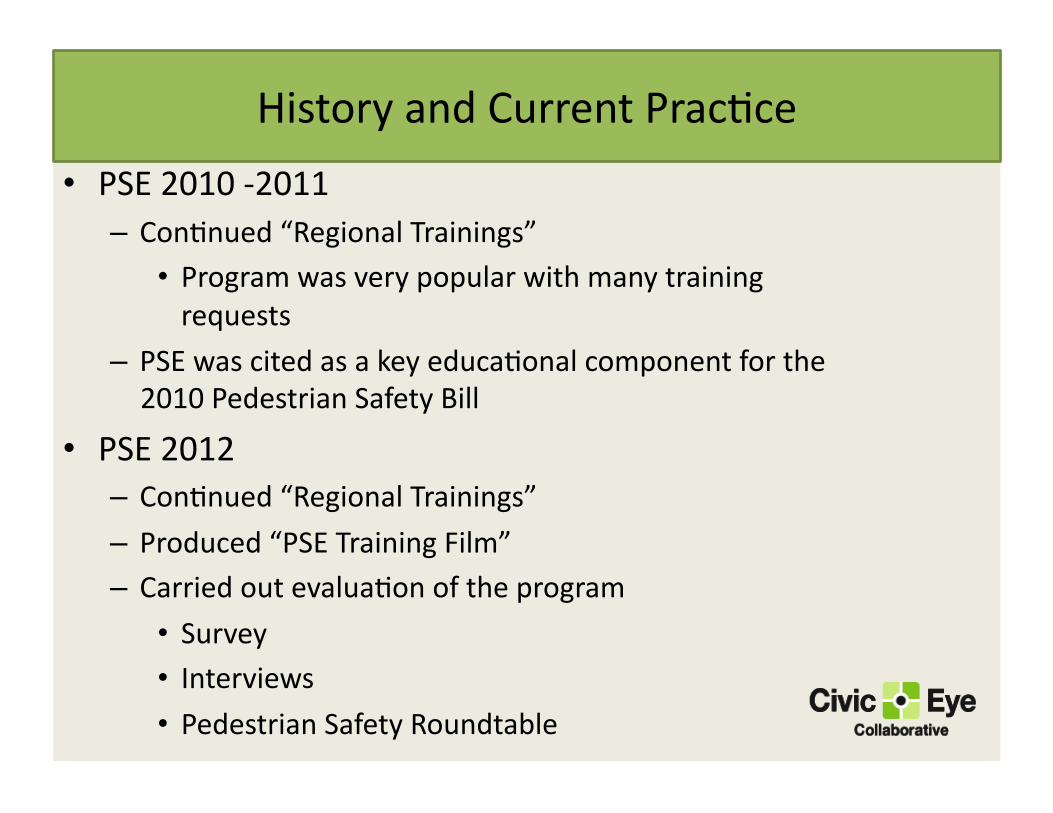
History and Current Prac;ce
• PSE 2010 -‐2011 – Con;nued “Regional Trainings”
• Program was very popular with many training requests
– PSE was cited as a key educa;onal component for the 2010 Pedestrian Safety Bill
• PSE 2012 – Con;nued “Regional Trainings” – Produced “PSE Training Film” – Carried out evalua;on of the program
• Survey • Interviews • Pedestrian Safety Roundtable

• PSE 2013-‐2015 – Regional Trainings stopped in 2014
• Missing a dedicated person to push the program
– PSE trainings primarily carried out by peer-‐to-‐peer training or departments are already well versed in opera;ons
• Roll Call film used as both refresher as well as for training
– PSE embedded as key component in NJ Street Smart Pedestrian Safety campaign

Survey
Distribu=on
• Online survey • June-‐July 2012 • Sent to most police
departments in NJ
• 165 responses • 152 police departments
represented
Topics
• The importance of pedestrian safety
• Motorist and pedestrian behavior around crosswalks
• The safety and maintenance condi;on of crosswalks
• PSE opera;ons, funding, efficacy, public communica;on

Survey: Pedestrian Safety Need
How important is pedestrian safety in your community? a) to community leaders/the public 55% significant issue
30% moderate importance
b) to your police department 65% significant issue
28% moderate importance

Survey: Findings
• Public knowledge of “stop and stay stopped” – 53% Good – 41% Moderate
• Are pedestrians disregarding crosswalks an issue in your community?
– 71% Yes – 29% No
• Has your department worked with organiza;ons that address traffic safety?
– 62% AAA – 22% Brain Injury Assoc. – 43% Other

Survey: Findings
• 35% (23) PDs cited PSE opera;ons as being the catalyst for changes to traffic control and roadway engineering for pedestrians
• 76% of respondents said that PSE is the only safety ini;a;ve for pedestrians they carry out
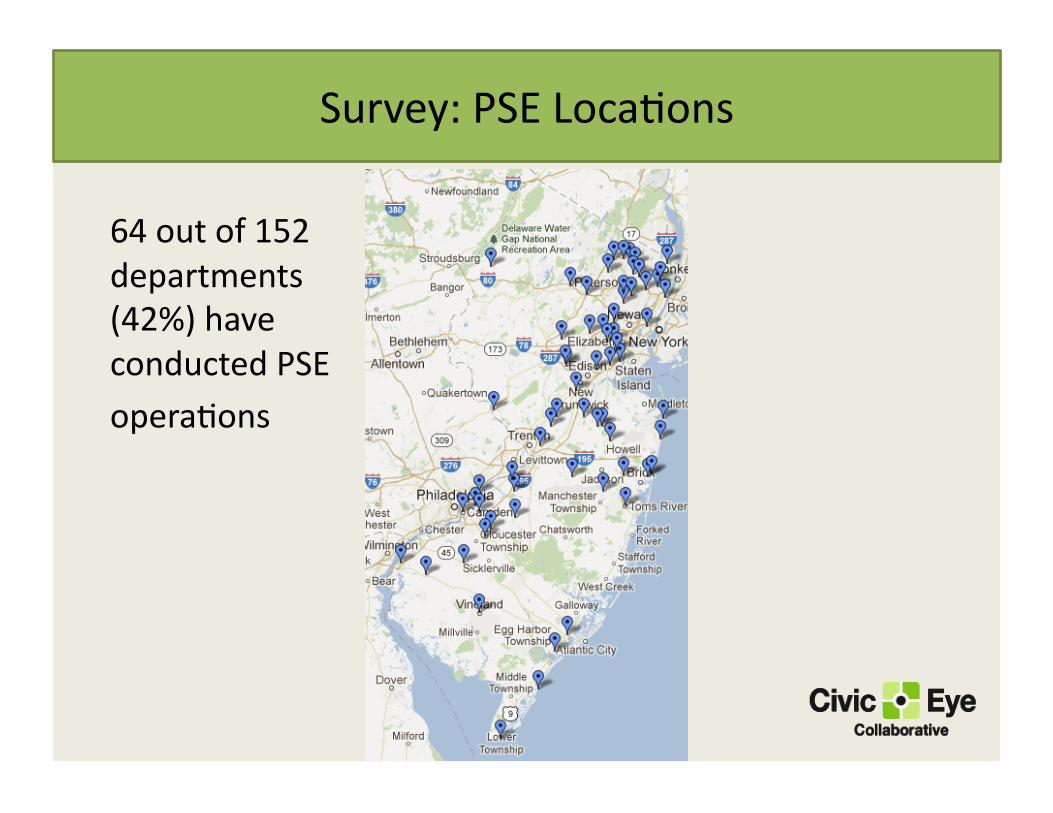
Survey: PSE Loca;ons
64 out of 152 departments (42%) have conducted PSE opera;ons
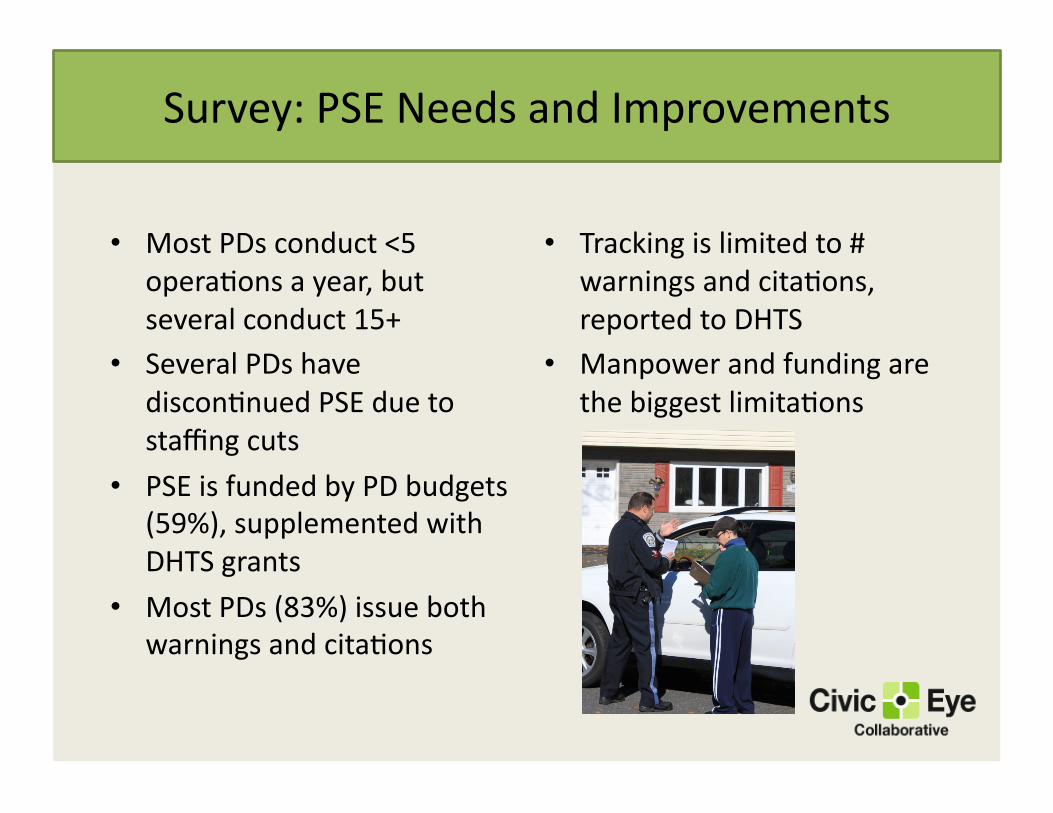
Survey: PSE Needs and Improvements
• Most PDs conduct <5 opera;ons a year, but several conduct 15+
• Several PDs have discon;nued PSE due to staffing cuts
• PSE is funded by PD budgets (59%), supplemented with DHTS grants
• Most PDs (83%) issue both warnings and cita;ons
• Tracking is limited to # warnings and cita;ons, reported to DHTS
• Manpower and funding are the biggest limita;ons
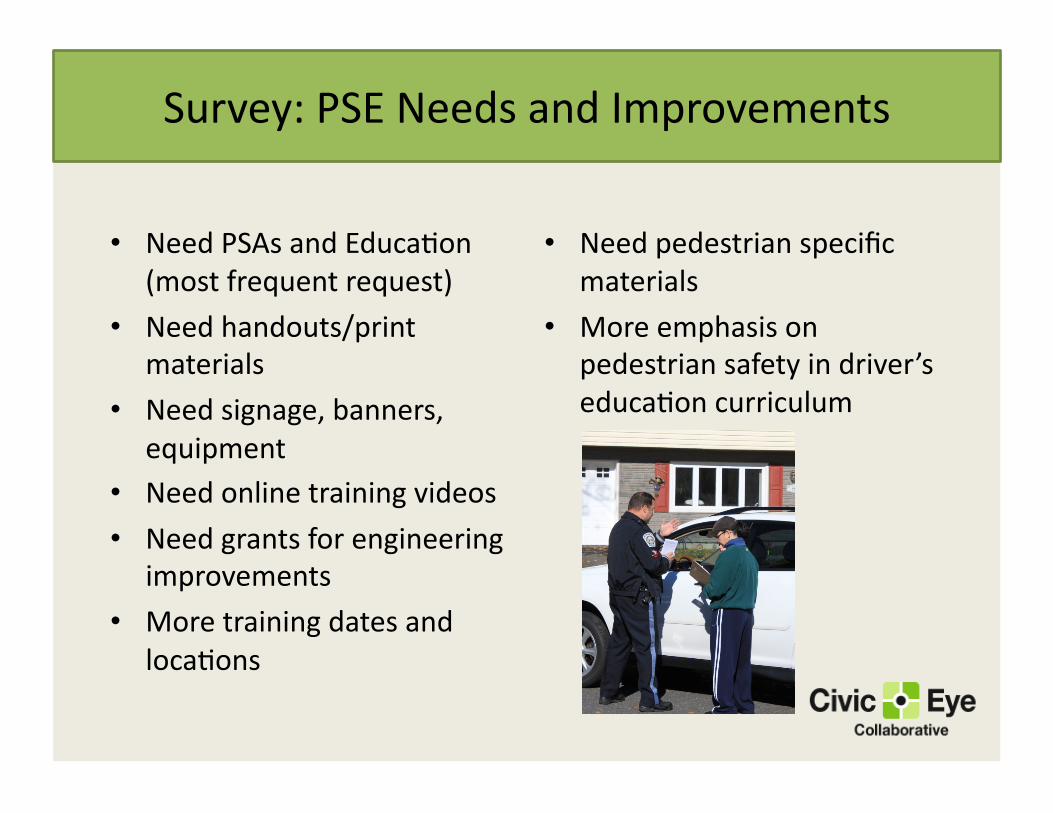
Survey: PSE Needs and Improvements
• Need PSAs and Educa;on (most frequent request)
• Need handouts/print materials
• Need signage, banners, equipment
• Need online training videos • Need grants for engineering
improvements
• More training dates and loca;ons
• Need pedestrian specific materials
• More emphasis on pedestrian safety in driver’s educa;on curriculum

Survey: Educa;onal Ini;a;ves
Answer Number of Responses
Notification of local newspapers 27
Flyers distributed in public buildings 10
Flyers distributed in schools 9
Posts on local news websites or blogs
16
Use of variable message signs 24
Public presentations 13
Other 11
None 16

Survey: Training in PSE
Answer Response Percent
Have not received training 82 54%
Fellow officers in our Department 35 23%
Officers from Departments in neighboring towns
12 8%
Workshop sponsored by the Division of Highway Traffic Safety
51 34%
Other 7 5%
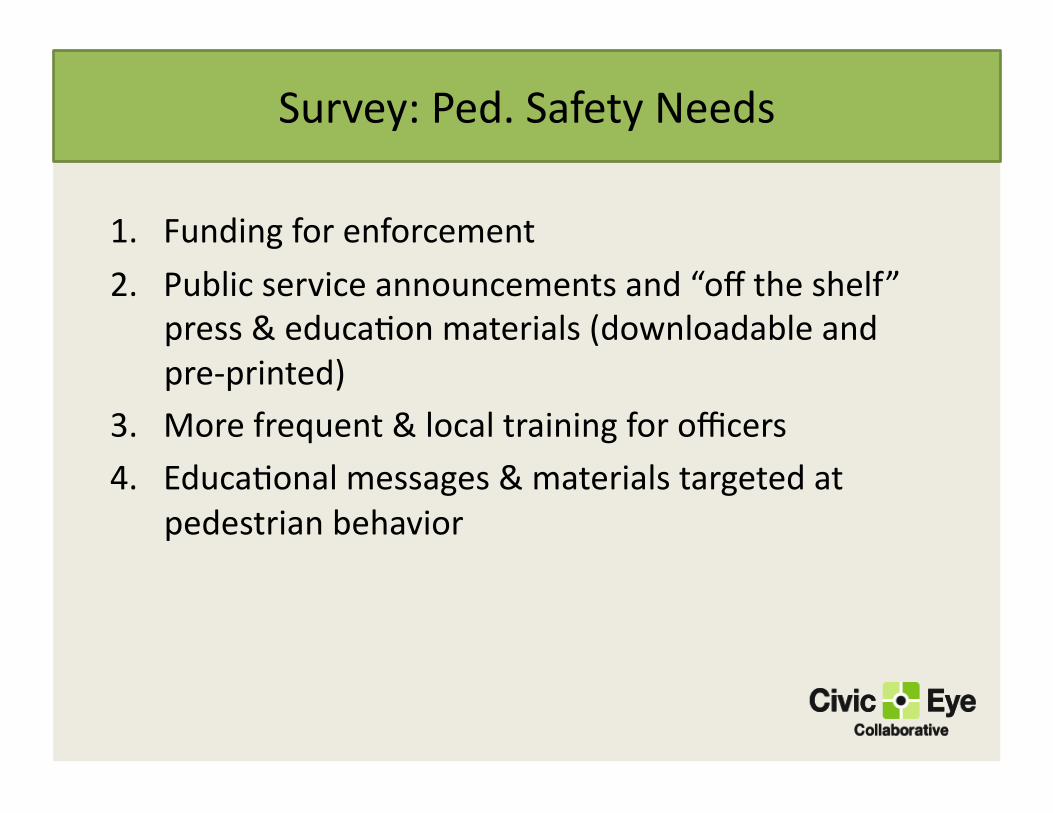
Survey: Ped. Safety Needs
1. Funding for enforcement
2. Public service announcements and “off the shelf” press & educa;on materials (downloadable and pre-‐printed)
3. More frequent & local training for officers 4. Educa;onal messages & materials targeted at
pedestrian behavior

CLOSING THOUGHTS

Findings
• We need to address pedestrian educa;on and compliance in general, but specifically with enforcement opera;ons
• The most effec;ve PSE opera;ons are “structured” opera;ons – They are needed and are effec;ve – Resource and exper;se intensive
• PSE should be applied to a corridor – Exploring that in Essex County
• Most effec;ve as partnerships
– Police are good at enforcement, not the media and coordina;on
– Advocates, Schools, Planners, and Engineers all have a role
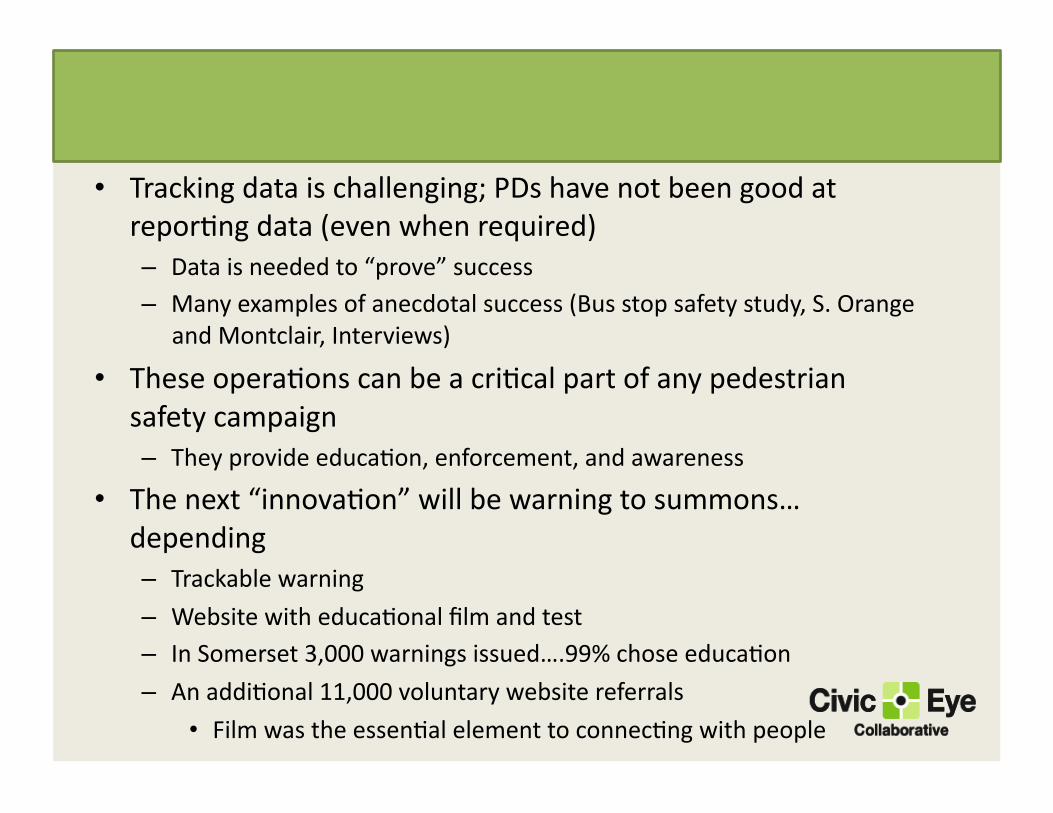
• Tracking data is challenging; PDs have not been good at repor;ng data (even when required) – Data is needed to “prove” success – Many examples of anecdotal success (Bus stop safety study, S. Orange
and Montclair, Interviews)
• These opera;ons can be a cri;cal part of any pedestrian safety campaign – They provide educa;on, enforcement, and awareness
• The next “innova;on” will be warning to summons…depending – Trackable warning – Website with educa;onal film and test – In Somerset 3,000 warnings issued….99% chose educa;on
– An addi;onal 11,000 voluntary website referrals • Film was the essen;al element to connec;ng with people

• Need steady funds and a dedicated staffer to push PSE and innovate with it. – The issue is having dedicated funds/staff
• The enormity of the problem demands more funding like “click it or ;cket” or MADD/alcohol enforcement – Right now dedicated funding is “belts and booze”

Q AND A
PSE Roll Call Film: h[ps://vimeo.com/122566691
PSE Descrip;ve Film: h[ps://vimeo.com/17448828
Ranjit Walia Principal, Civic Eye Collaborative LLC [email protected] 908-403-5688

ORLANDO POLICE DEPARTMENT PEDESTRIAN SAFETY
INITIATIVES

DANGEROUS BY DESIGN:
• Orlando – Kissimmee tops the list in 2011 and 2014 • Pedestrian Death Index, census population, walkers, etc. • Not adjacent or contiguous, cities are tied solely through tourism • Appx 45 miles apart • Population on any given day much greater than census indicates
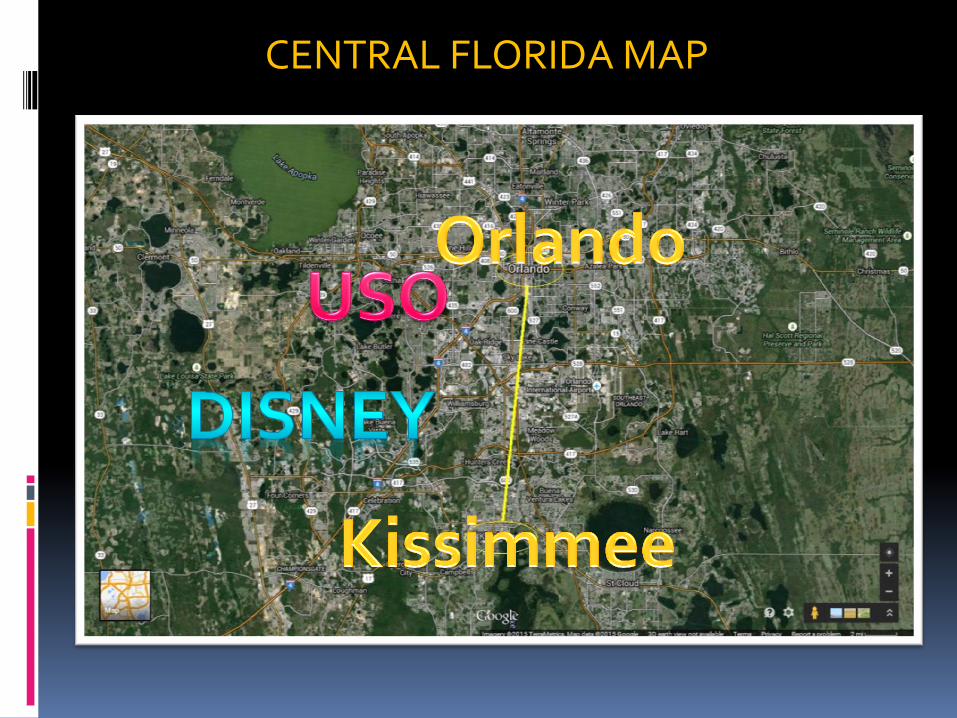
CENTRAL FLORIDA MAP

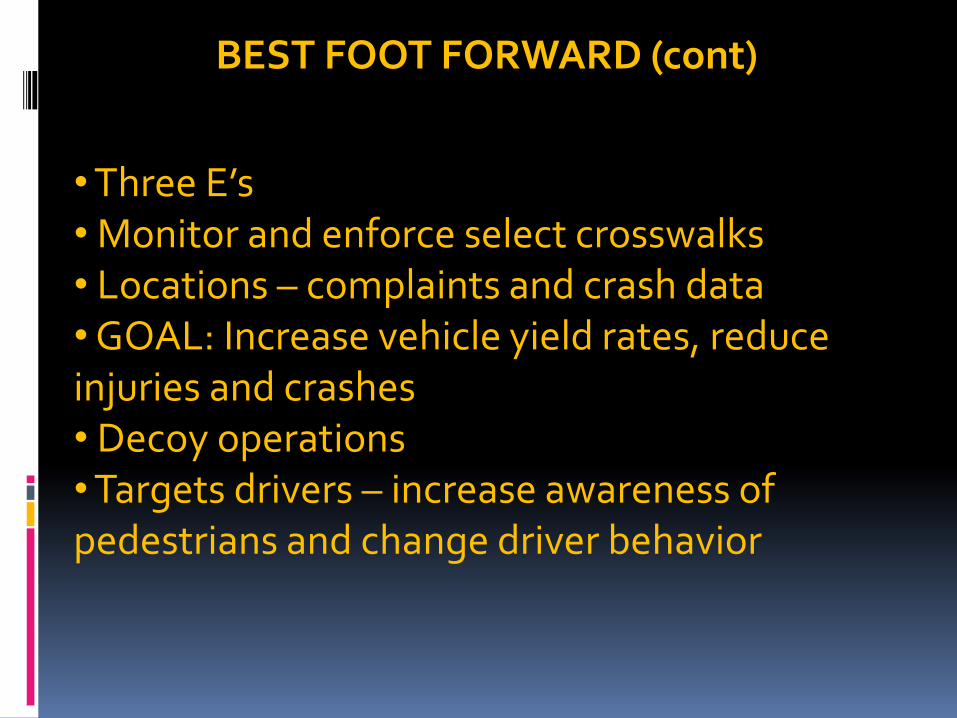
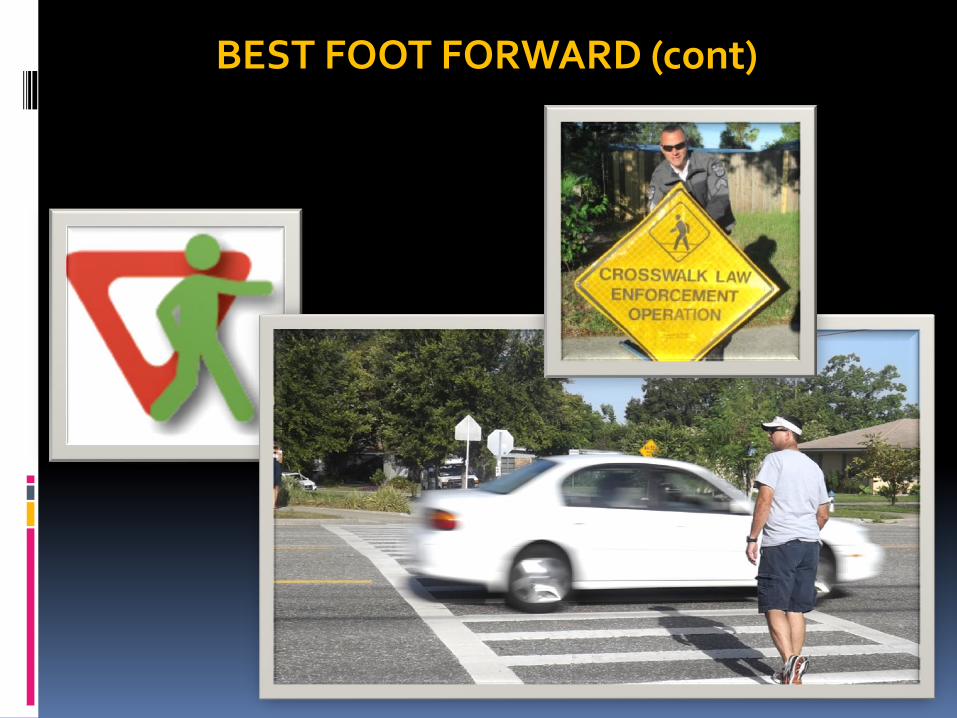
OPERATION: BEST FOOT FORWARD
• Formed in 2012 • Coalition of private and governmental entities • City of Orlando and Orlando Police • Orange County and Sheriff’s Office •MetroPlan Orlando • Bike-Walk Central Florida • Lynx – buses • FDOT • Public Schools • Hospitals
BEST FOOT FORWARD (cont)
• Three E’s • Monitor and enforce select crosswalks • Locations – complaints and crash data • GOAL: Increase vehicle yield rates, reduce injuries and crashes • Decoy operations • Targets drivers – increase awareness of pedestrians and change driver behavior
BEST FOOT FORWARD (cont)

BFF RESULTS
• Yield Rates have improved at many crosswalks
-Under 30 MPH - Signalized intersections - RRFB and Enhanced Crosswalks - Engineering - traffic islands/slip lanes - Reduced # of crashes and injuries
• Mid-block crossings on 35+ MPH are the still worst for yield rates • Pedestrian Fatalities - No Change
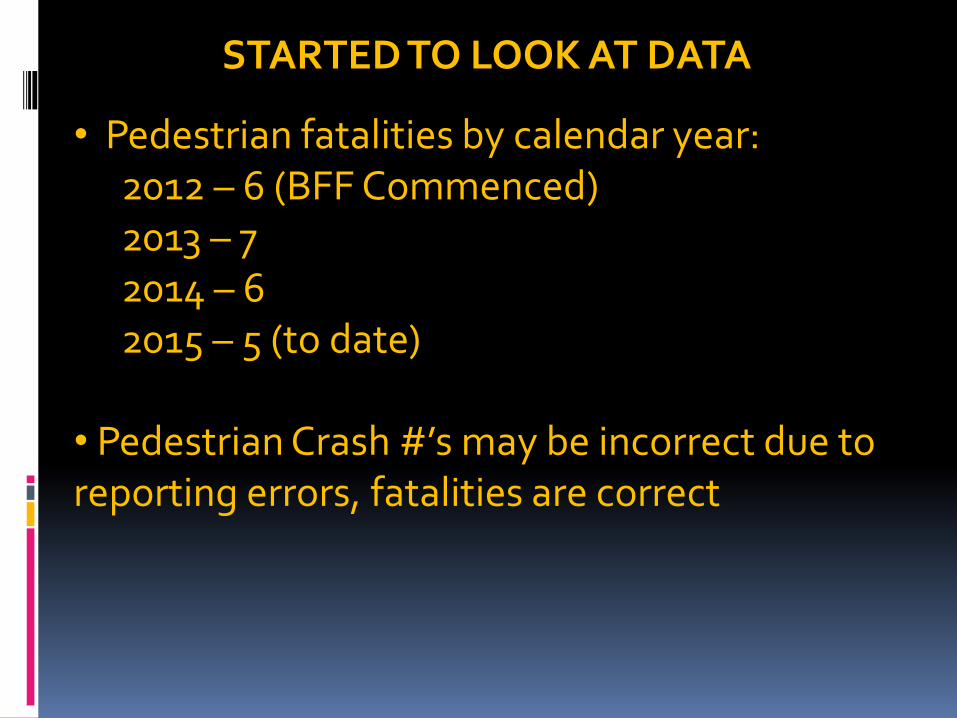
STARTED TO LOOK AT DATA
• Pedestrian fatalities by calendar year: 2012 – 6 (BFF Commenced) 2013 – 7 2014 – 6 2015 – 5 (to date)
• Pedestrian Crash #’s may be incorrect due to reporting errors, fatalities are correct
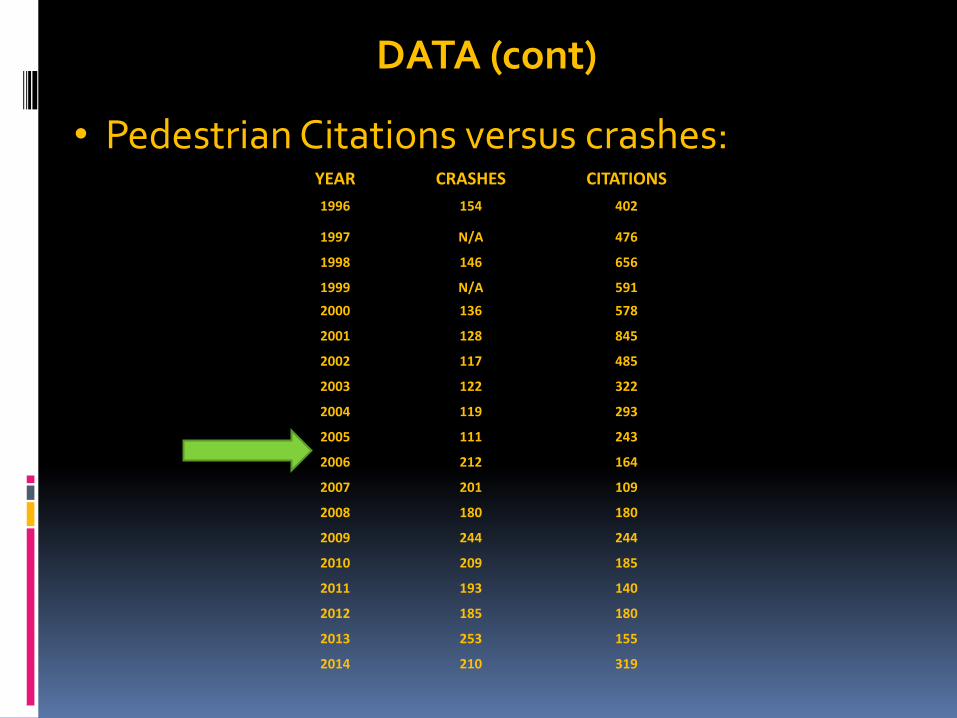
DATA (cont)
• Pedestrian Citations versus crashes:
YEAR CRASHES CITATIONS
1996 154 402
1997 N/A 476
1998 146 656
1999 N/A 591
2000 136 578
2001 128 845
2002 117 485
2003 122 322
2004 119 293
2005 111 243
2006 212 164
2007 201 109
2008 180 180
2009 244 244
2010 209 185
2011 193 140
2012 185 180
2013 253 155
2014 210 319

EVERYDAY OBSERVATIONS
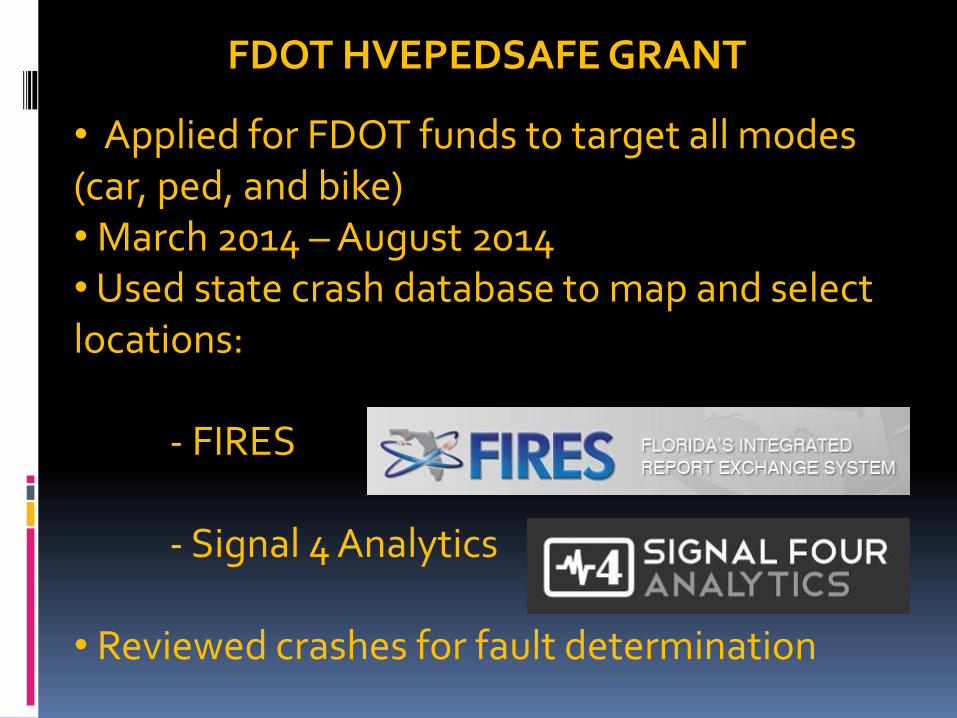
FDOT HVEPEDSAFE GRANT
• Applied for FDOT funds to target all modes (car, ped, and bike) • March 2014 – August 2014 • Used state crash database to map and select locations: - FIRES - Signal 4 Analytics • Reviewed crashes for fault determination

FDOT HVEPEDSAFE GRANT (cont)
• Education through Enforcement - Issue more citations to pedestrians •70% of our pedestrian crashes were fault of the pedestrian. • Traffic Homicide Unit (Fatal or Great Bodily Injury) pedestrian crashes over last 7 years – Pedestrian at fault 92% of the time.

FDOT HVEPEDSAFE GRANT (cont)
• Selected locations from mapping of the pedestrian crashes:
FDOT HVEPEDSAFE GRANT (cont)
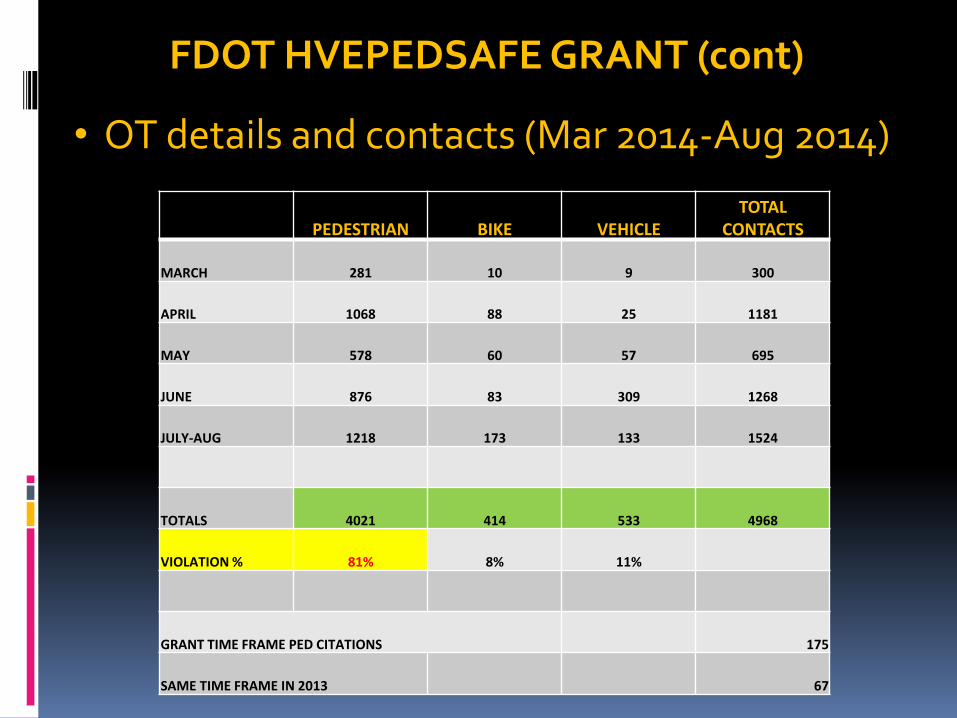
• OT details and contacts (Mar 2014-Aug 2014)
PEDESTRIAN BIKE VEHICLE TOTAL
CONTACTS
MARCH 281 10 9 300
APRIL 1068 88 25 1181
MAY 578 60 57 695
JUNE 876 83 309 1268
JULY-AUG 1218 173 133 1524
TOTALS 4021 414 533 4968
VIOLATION % 81% 8% 11%
GRANT TIME FRAME PED CITATIONS 175
SAME TIME FRAME IN 2013 67

FUTURE INITIATIVES
• Short-term: Ped crashes below 200/year •Long-term: Ped crashes below 100/year •Entire Agency commitment to daily education through enforcement • Additional FDOT Grants to increase enforcement opportunities • Balanced enforcement details based upon “At Fault” percentages • Continue to increase citations to violators in all 3 modes to affect behavior change • Correct reporting errors to ensure best data • Reinstitute programs and PSA’s in schools
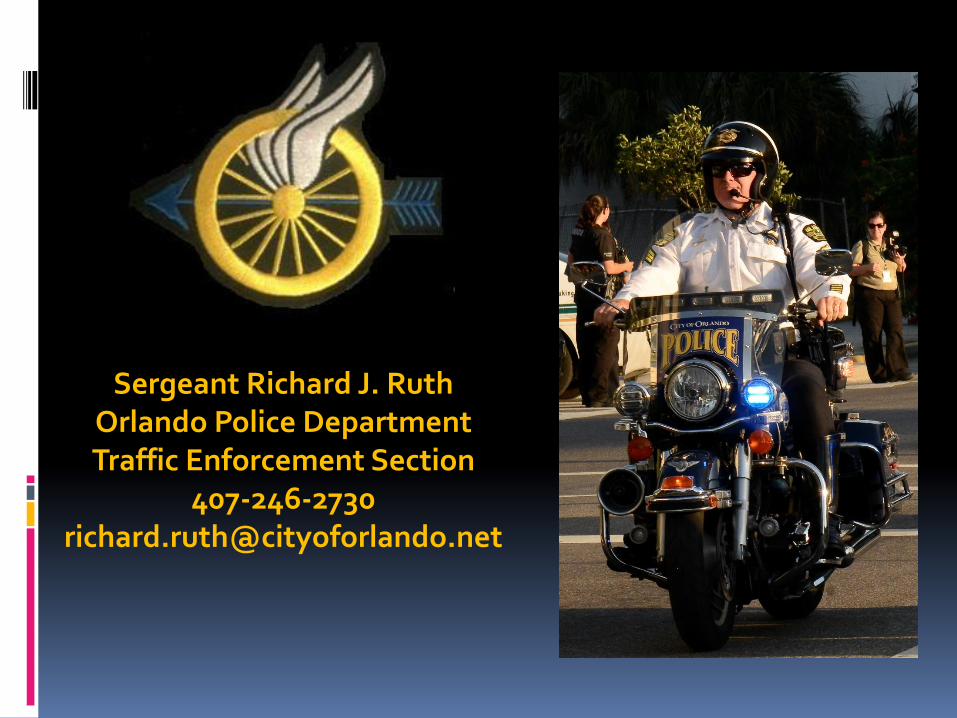
Sergeant Richard J. Ruth Orlando Police Department Traffic Enforcement Section
407-246-2730 [email protected]

George Branyan
Pedestrian Program Coordinator
District Department of Transportation
June 18, 2015
Pedestrian Safety Enforcement Program
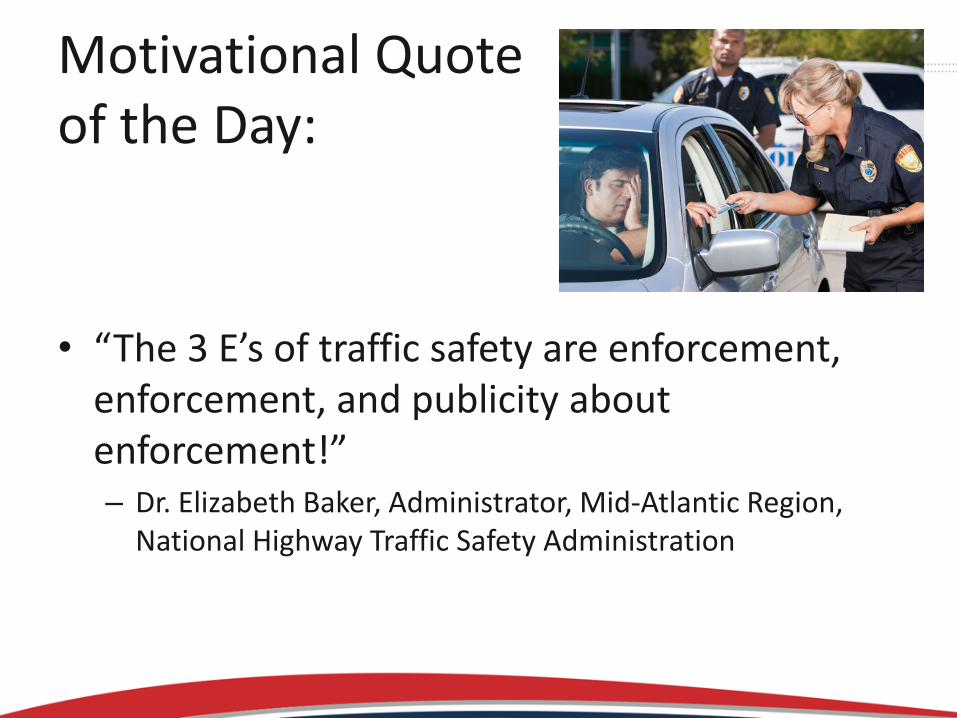
Motivational Quote of the Day:
• “The 3 E’s of traffic safety are enforcement, enforcement, and publicity about enforcement!” – Dr. Elizabeth Baker, Administrator, Mid-Atlantic Region,
National Highway Traffic Safety Administration
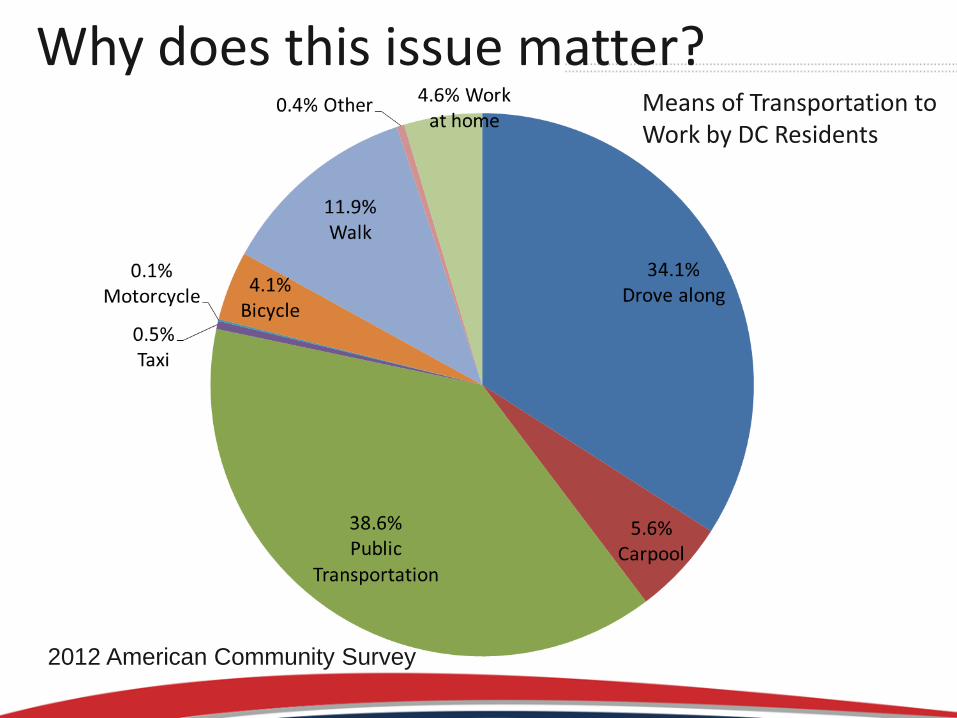
2012 American Community Survey
Why does this issue matter? Means of Transportation to Work by DC Residents
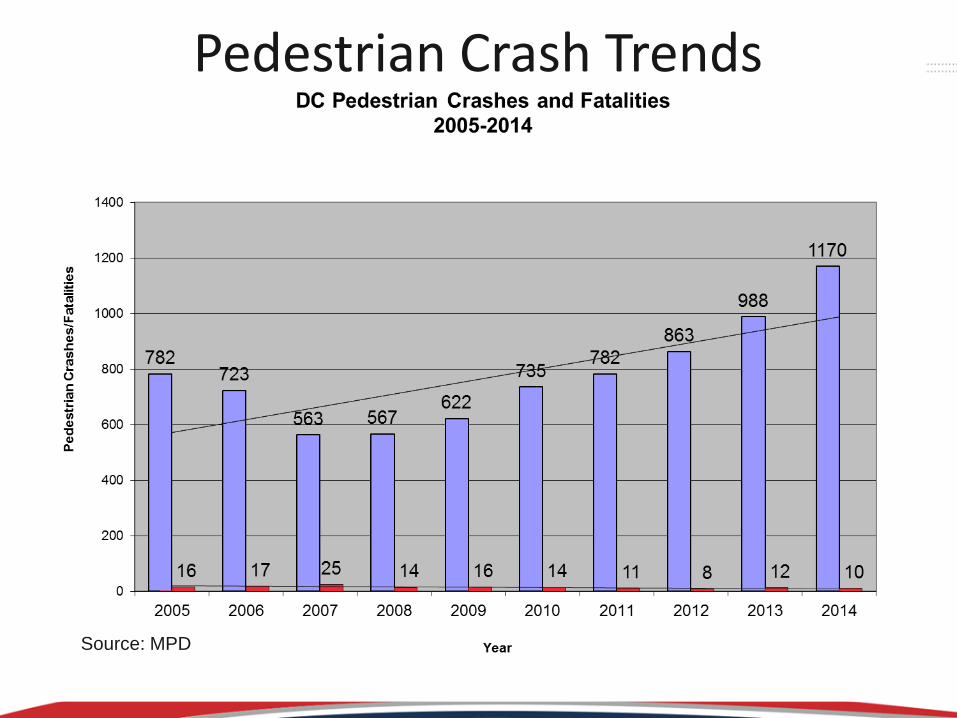
Pedestrian Crash Trends
Source: MPD
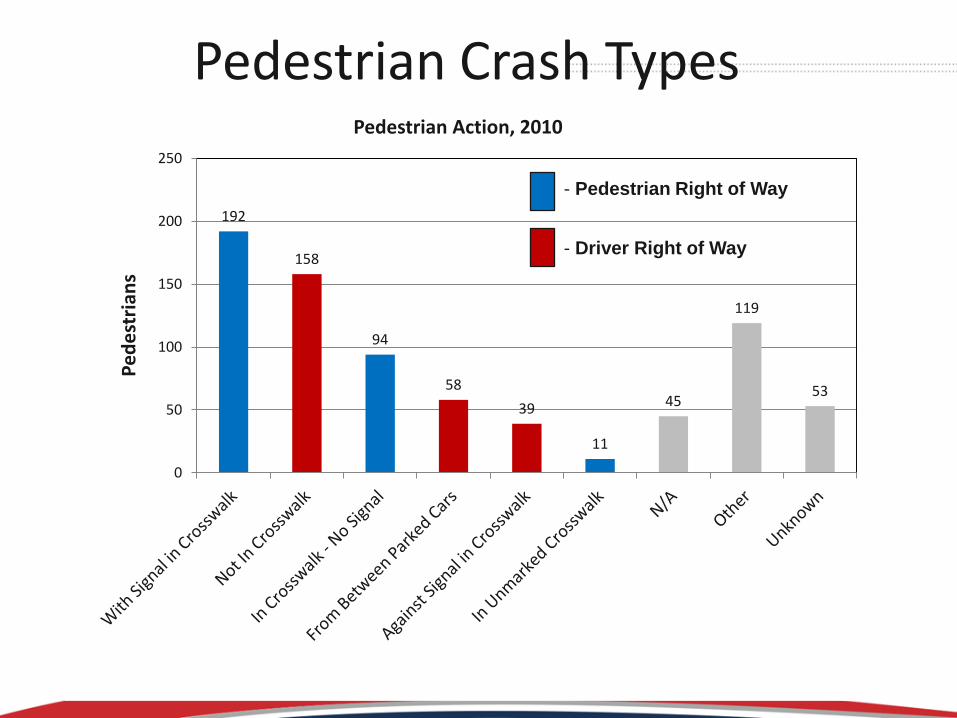
192
158
94
58
39
11
45
119
53
0
50
100
150
200
250
Pedestrian Action, 2010
Pedestrian Crash Types
- Driver Right of Way
- Pedestrian Right of Way
Pe
de
stri
ans

Pedestrian Crash Types and Injury Severity
Pedestrian Action Fatal Disabling Non
Disabling
Complaint
not Visible Other
No
Injury N/A Unknown Summary
With Signal in
Crosswalk 0 15 44 98 6 22 4 3 192
Not In Crosswalk 5 20 47 61 5 8 3 9 158
In Crosswalk - No
Signal 0 15 34 29 1 12 3 0 94
From Between
Parked Cars 1 7 22 16 3 6 0 3 58
Against Signal in
Crosswalk 1 8 11 10 0 4 2 3 39
In Unmarked
Crosswalk 0 3 4 2 0 1 0 1 11
N/A 1 2 4 12 1 18 7 0 45
Other 1 14 23 53 8 12 4 4 119
Unknown 5 4 15 20 3 3 1 2 53
2010 Data

Vehicle Speed and Pedestrian Crash Severity
Speeding Enforcement IS Pedestrian Safety Enforcement!
Effective Enforcement
Strategies
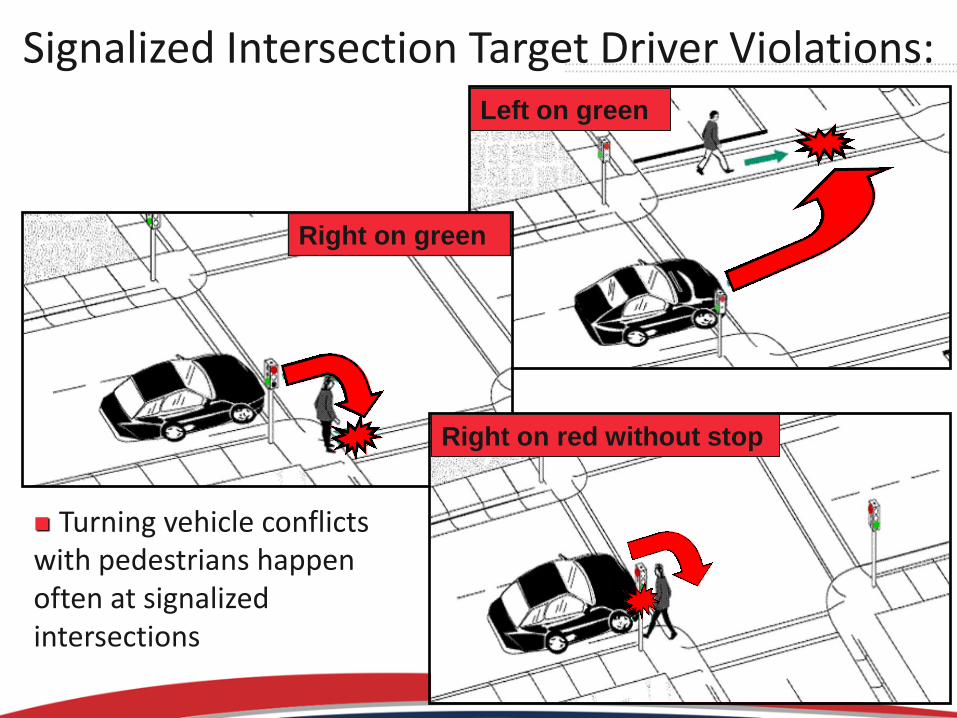
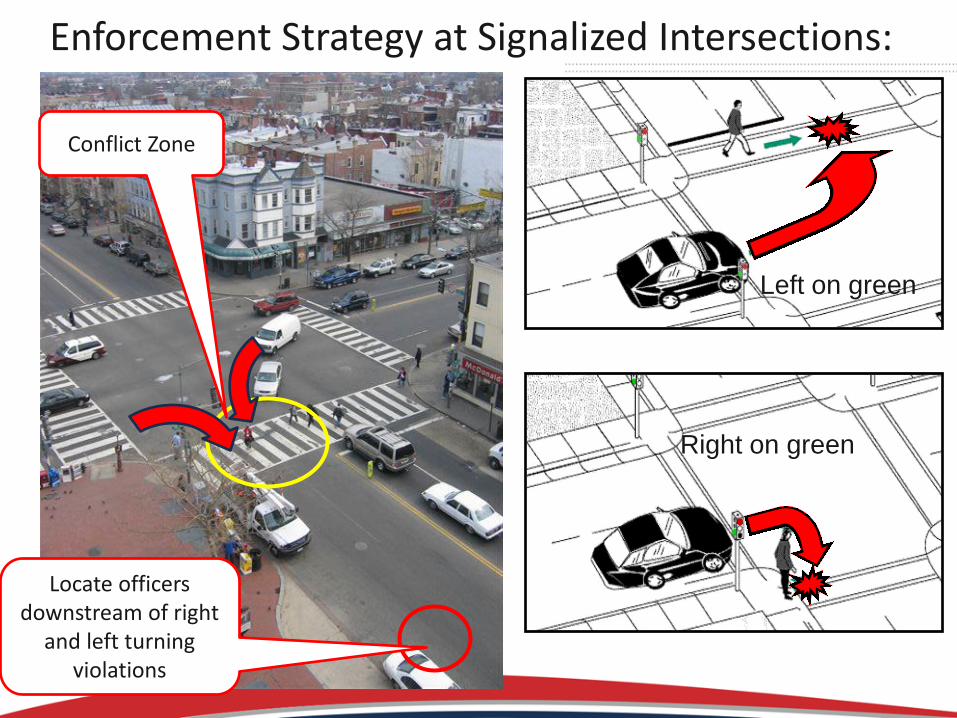
Left on green
Signalized Intersection Target Driver Violations:
Right on green
Right on red without stop
Turning vehicle conflicts with pedestrians happen often at signalized intersections

Uncontrolled Crosswalk Target Driver Violation:
Uncontrolled crosswalk-
Fail to stop/yield

DDOT/MPD Pedestrian-Bicycle Program: • Training Program: Since 2005, over 600 MPD officers have
received a half-day training on pedestrian and bicycle safety enforcement.
• Mandatory MPD Pedestrian/Bicycle distance learning module went on-line in 2011.
• DDOT overtime funds for traffic safety enforcement
• DDOT Traffic Control Officers
• “Street Smart” Regional Education-Enforcement Campaign
• DDOT-MPD “Road Rules” Education-Enforcement Campaign
• Vision Zero Initiative, 2015
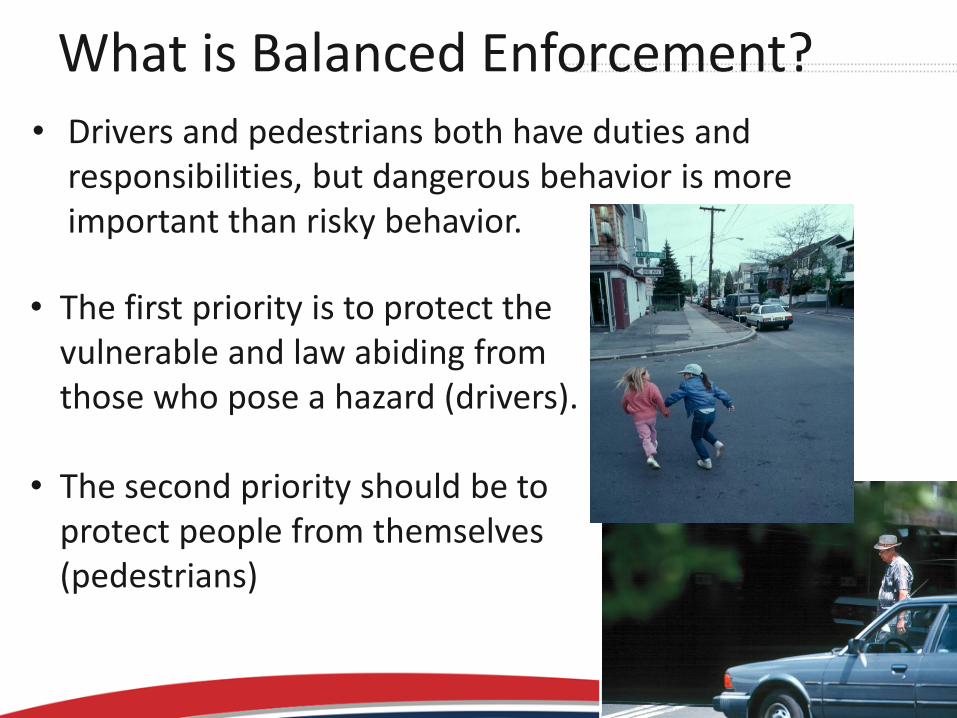
What is Balanced Enforcement? • Drivers and pedestrians both have duties and
responsibilities, but dangerous behavior is more important than risky behavior.
• The first priority is to protect the vulnerable and law abiding from those who pose a hazard (drivers).
• The second priority should be to
protect people from themselves (pedestrians)
Right on green
Left on green
Enforcement Strategy at Signalized Intersections:
Locate officers downstream of right
and left turning violations
Conflict Zone
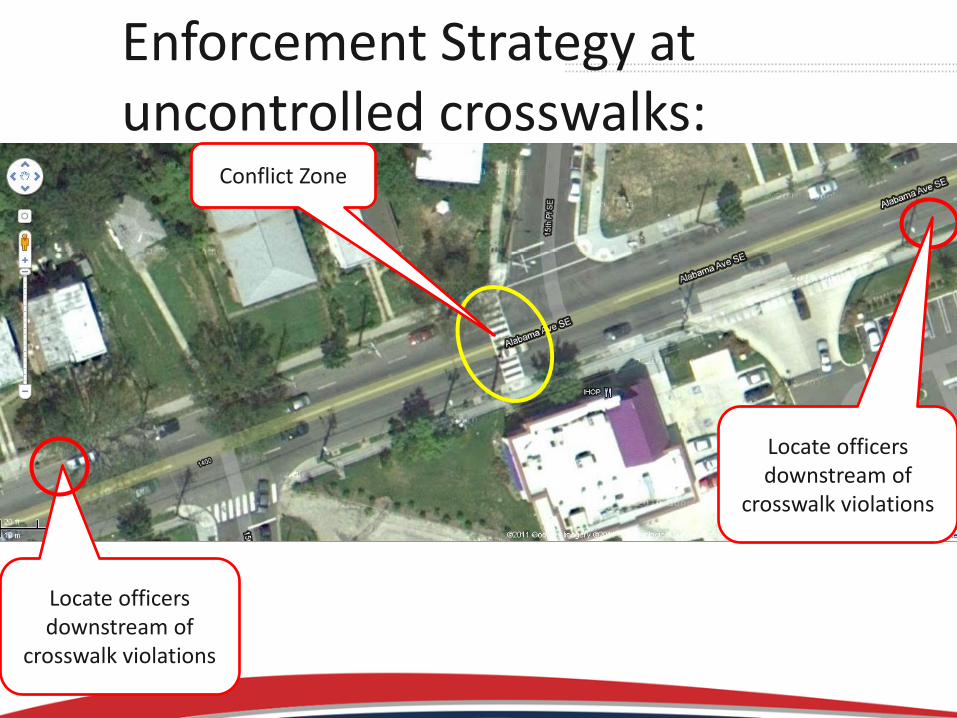
Enforcement Strategy at uncontrolled crosswalks:
Locate officers downstream of
crosswalk violations
Locate officers downstream of
crosswalk violations
Conflict Zone

Setting up a Targeted Crosswalk Enforcement Operation (aka “Crosswalk Sting” or Decoy Operation, 25 mph posted)
B
A
88’
Cone
Cone
161’
161’
BB
AA
88’
Cone
Cone
161’
161’
Location Warning: Best locations are collector and minor arterial streets in mixed commercial/residential neighborhoods with posted speed limits at no more than 30 mph and 2 or 4 lanes maximum. Higher volume, multi-lane roads can be very challenging and may not be appropriate, without other engineering countermeasures.

Setting up a Targeted Crosswalk Enforcement Operation (aka “Crosswalk Sting” or Decoy Operation)

Enforcement at uncontrolled crosswalks
Crosswalk located here
Pullover team located here

Strategies for Effective Jaywalking Enforcement
• Focus primarily on people who walk into the path of a vehicle with the right of way.
• Look for jaywalkers who put themselves in a hazardous situation by interfering with a driver’s right of way
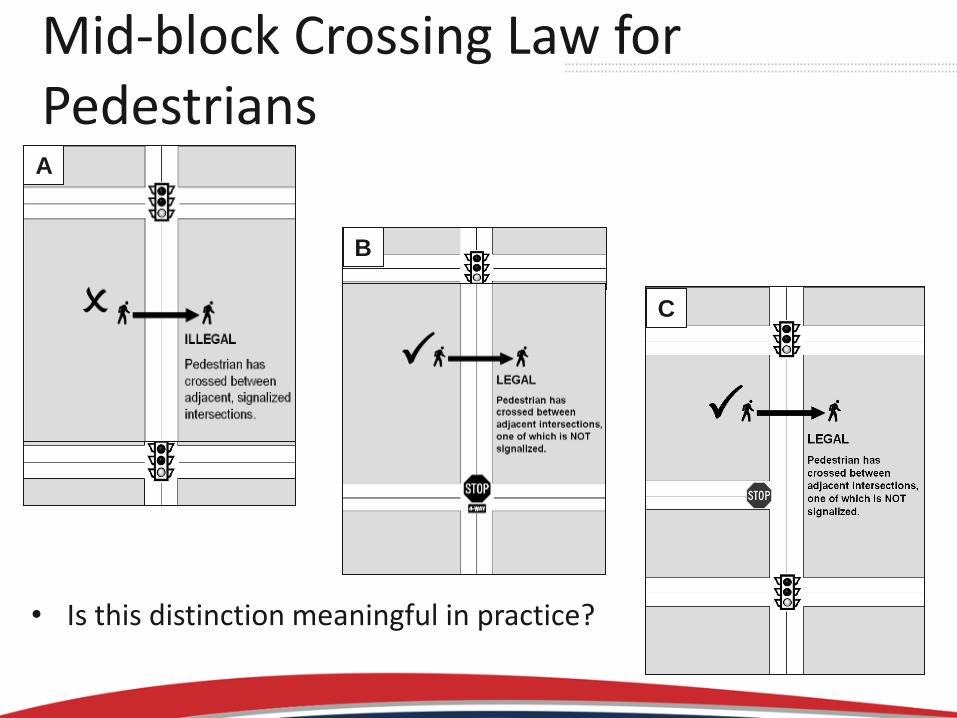
Mid-block Crossing Law for Pedestrians
• Is this distinction meaningful in practice?
A
B
C

Pitfalls of Aggressive Jaywalking Enforcement
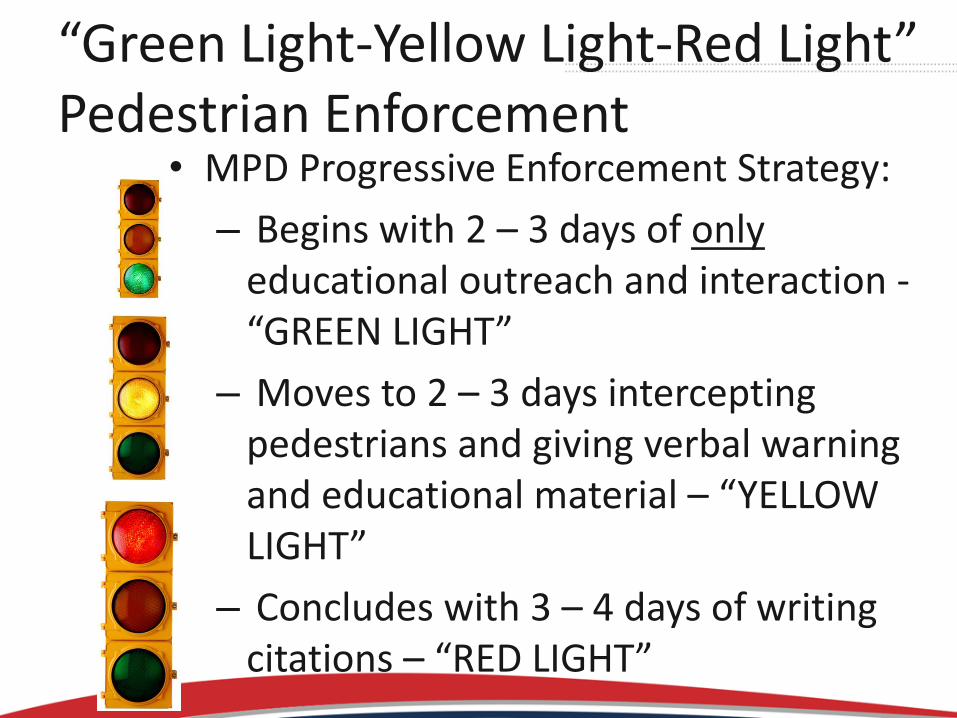
“Green Light-Yellow Light-Red Light” Pedestrian Enforcement
• MPD Progressive Enforcement Strategy:
– Begins with 2 – 3 days of only educational outreach and interaction - “GREEN LIGHT”
– Moves to 2 – 3 days intercepting pedestrians and giving verbal warning and educational material – “YELLOW LIGHT”
– Concludes with 3 – 4 days of writing citations – “RED LIGHT”

Educating Pedestrians & Drivers • Fall and Spring Street Smart educational handouts.
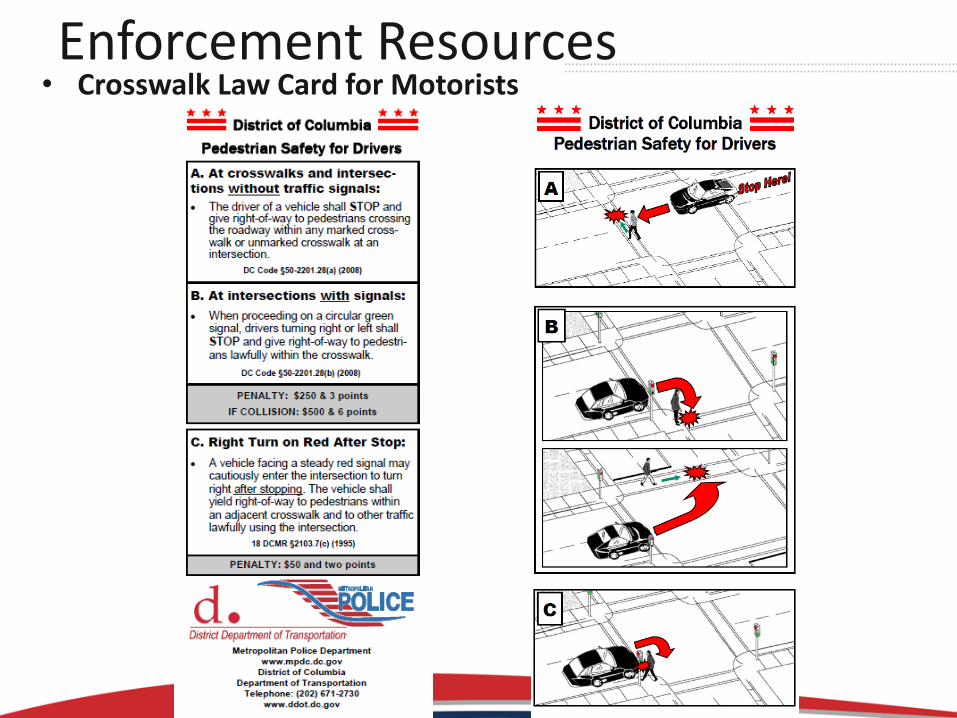
Enforcement Resources • Crosswalk Law Card for Motorists
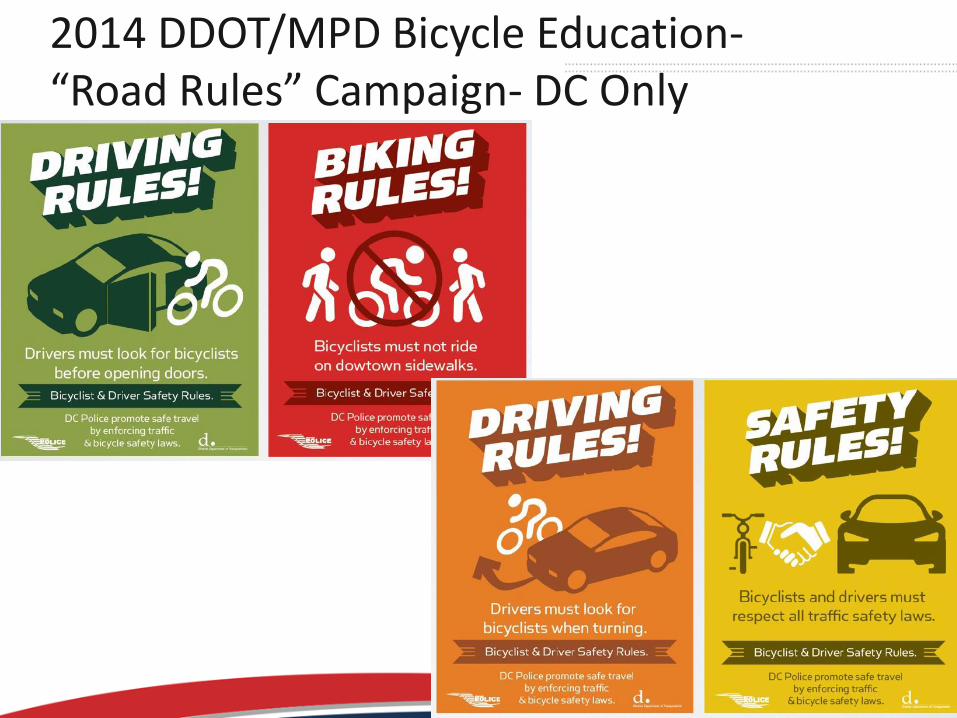
2014 DDOT/MPD Bicycle Education- “Road Rules” Campaign- DC Only
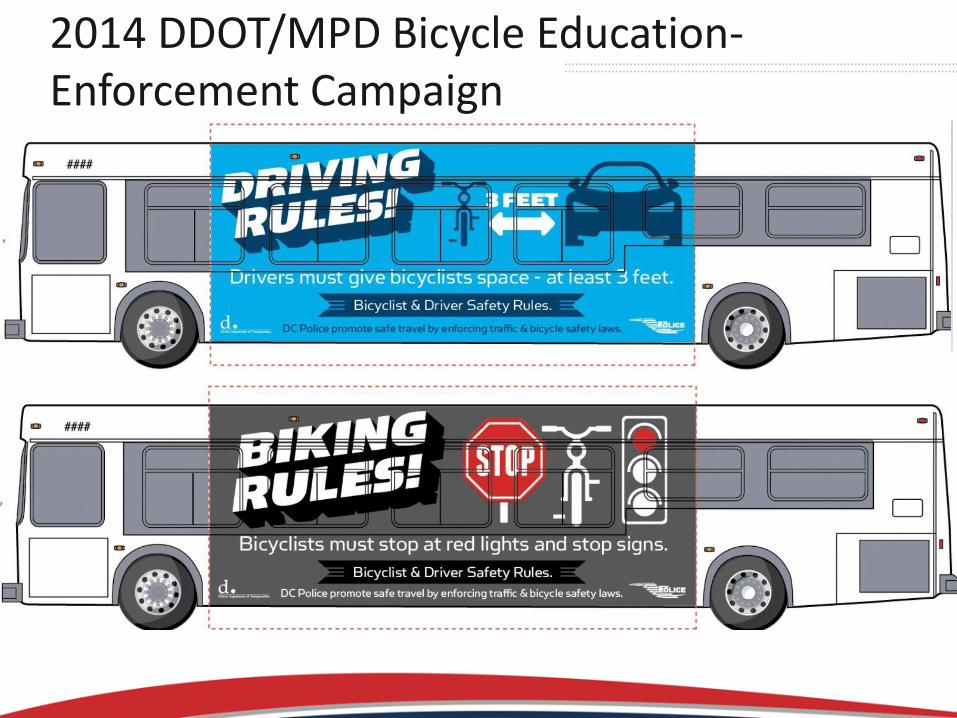
2014 DDOT/MPD Bicycle Education-Enforcement Campaign

The STREET SMART Campaign: • Conducted since 2002 • Washington and Baltimore metro areas • Funded mainly by highway safety grant funds (DC, MD, VA) • Targets pedestrians, drivers and cyclists • English and Spanish • Fall and spring campaigns since 2007
Publicity about Enforcement
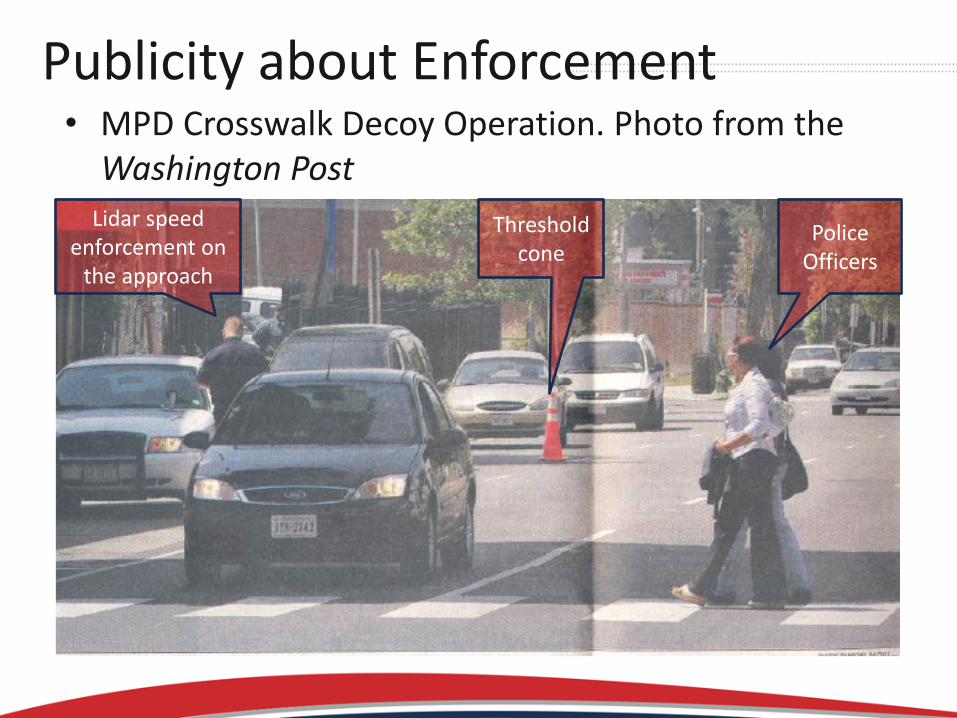
Publicity about Enforcement • MPD Crosswalk Decoy Operation. Photo from the
Washington Post
Police Officers
Lidar speed enforcement on
the approach
Threshold cone
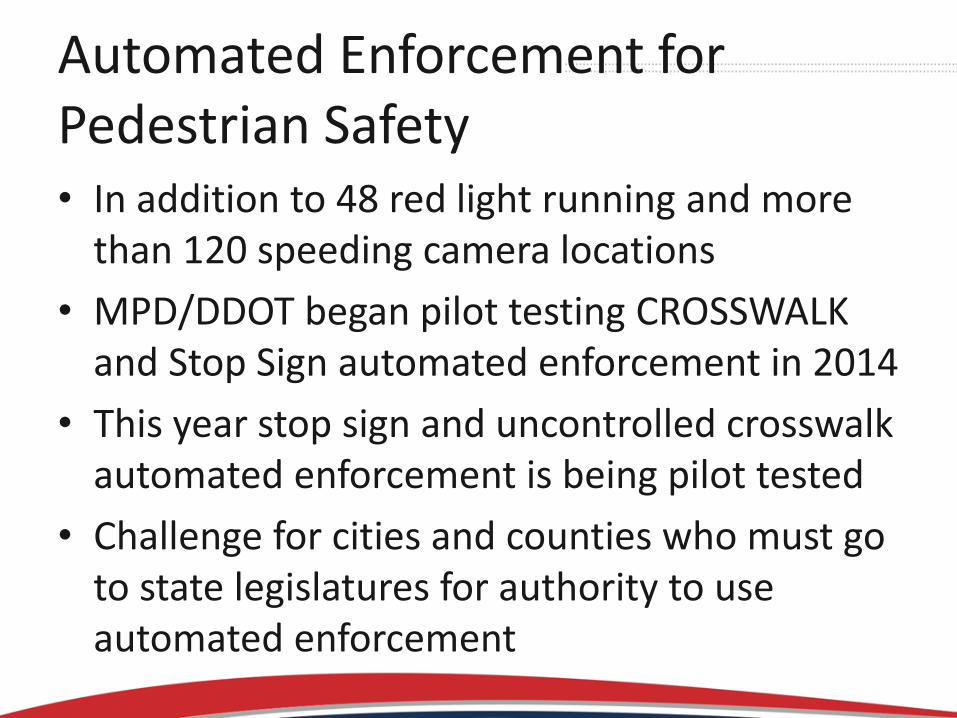
Automated Enforcement for Pedestrian Safety • In addition to 48 red light running and more
than 120 speeding camera locations
• MPD/DDOT began pilot testing CROSSWALK and Stop Sign automated enforcement in 2014
• This year stop sign and uncontrolled crosswalk automated enforcement is being pilot tested
• Challenge for cities and counties who must go to state legislatures for authority to use automated enforcement

Thank you !
George Branyan
Pedestrian Program Coordinator
DC Department of Transportation
202-671-2561
Thank You!
Archive at www.pedbikeinfo.org/webinars
Downloadable/streaming recording and presentation slides
Questions? [email protected]