(PED) 돼지유행성설사병 백신을 잘 활용하자!! · 2019. 1. 28. · 위한 ped 백신 접종 프로그램을 전략적으로 수립할 필요가 있다. 3. 돼지유행성설사병(ped)의
Upload
gabriel-reillyCategory
view
54download
0description

PED School Grade Reports
(with thanks to Valley High School)
ACE
August 3, 2012
Dr. Russ Romans
District Accountability Manager


Valley High School Points 61.5 – Grade ‘C’
3.5 additional points needed for ‘B’
• PED yet to identify ‘Priority’ and ‘Focus’ Schools• All “F and Priority” Schools get Instructional Audit from PED• All “D” and Focus” Schools get Instructional Audit from District• SIG Schools not audited
How do we compare to Statistical Peers?School Grade Points
Albuquerque High C 63.9
Del Norte C 57.7
Manzano C 62.4
Valley High School C 61.5

How do we compare with NM Peers?


Current Standing

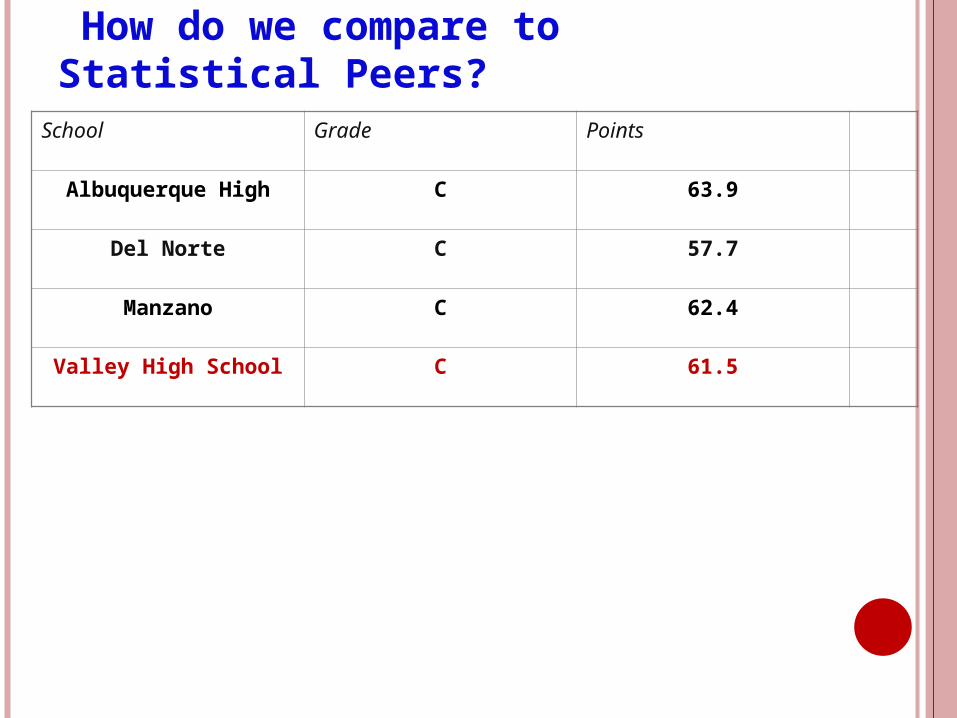
Math and Reading PerformanceCURRENT STANDING – (15.4 out of 30 POINTS)
Two components: Part I - Status % Proficient 9.8 out of 20 points Part II - % Proficient Using VAM 5.6 out of 10 points
Total15.4
points

Status: Percent Proficient and Above (9.8 out of 20 points)

School History

CURRENT STANDING – Part 2% PROFICIENT USING Value Added Modeling
(5.6 out of 10 POINTS)
% Proficient Using VAM Your students are compared to other students that are like
them in the state
Gender, Race/Ethnicity, Lunch Status, Special Education Status, English Language Learner Status, Full Academic Year Status
Considering these characteristics, PED predicts how well your students and students similar to yours should perform.
If you meet or exceed the predicted target, you receive a higher percentile ranking…
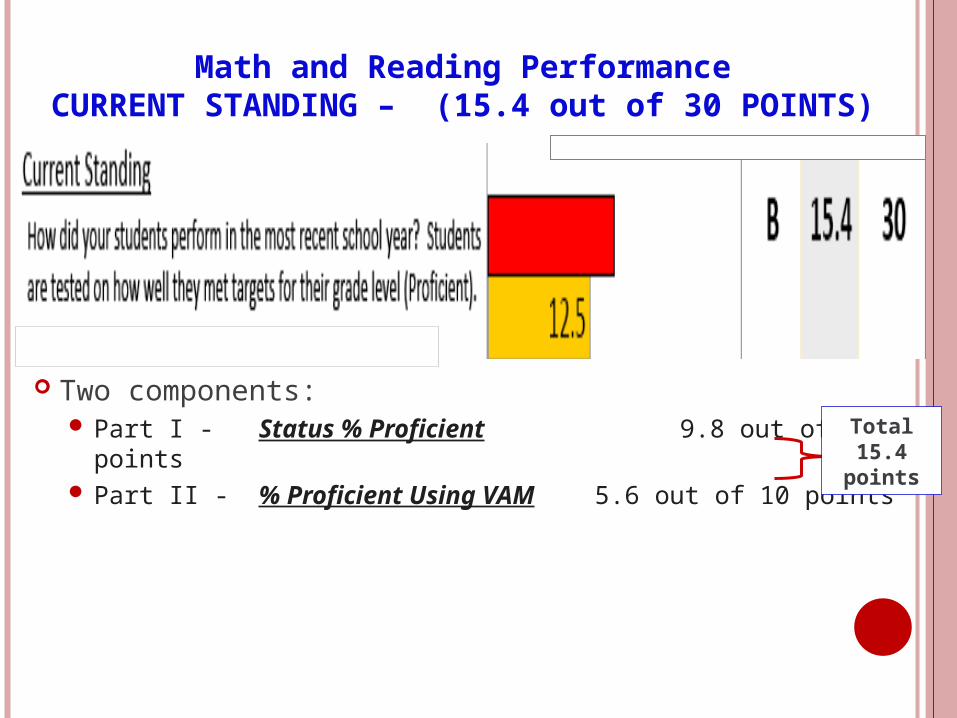
% PROFICIENT USING VAM (5.6 out of 10)
• The target for your school is based on your school’s characteristics• All schools that are similar in demographics get the same targets• So PED can rank all the schools in the state on the same scale• You are ranked by how well you met your target
School Growth

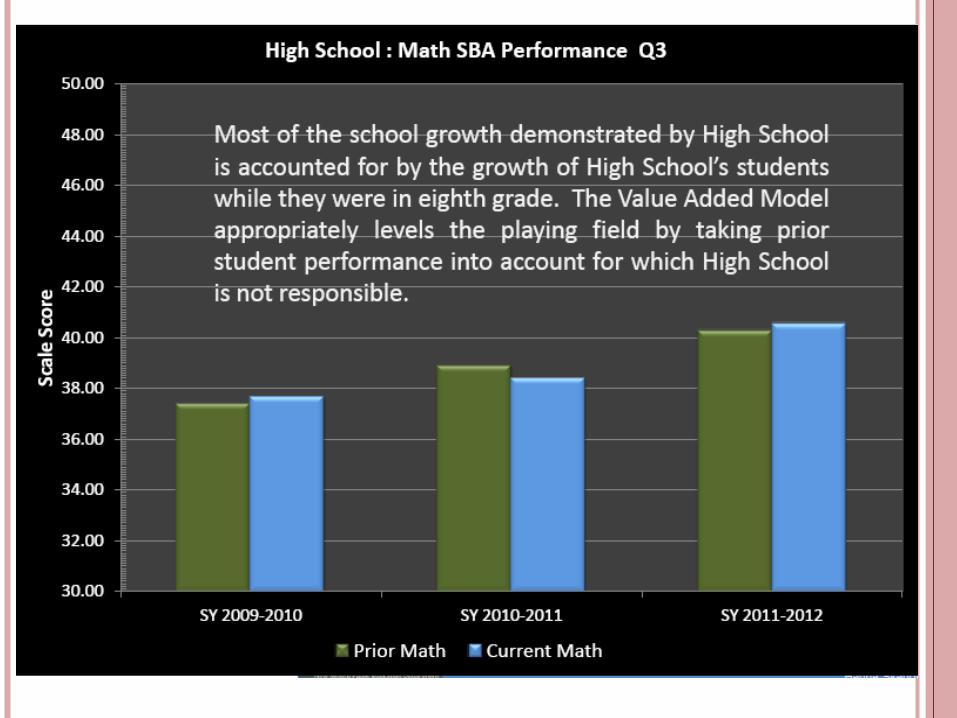
School Growth – Highest 75% (Q3) 10.7 out of 15 points

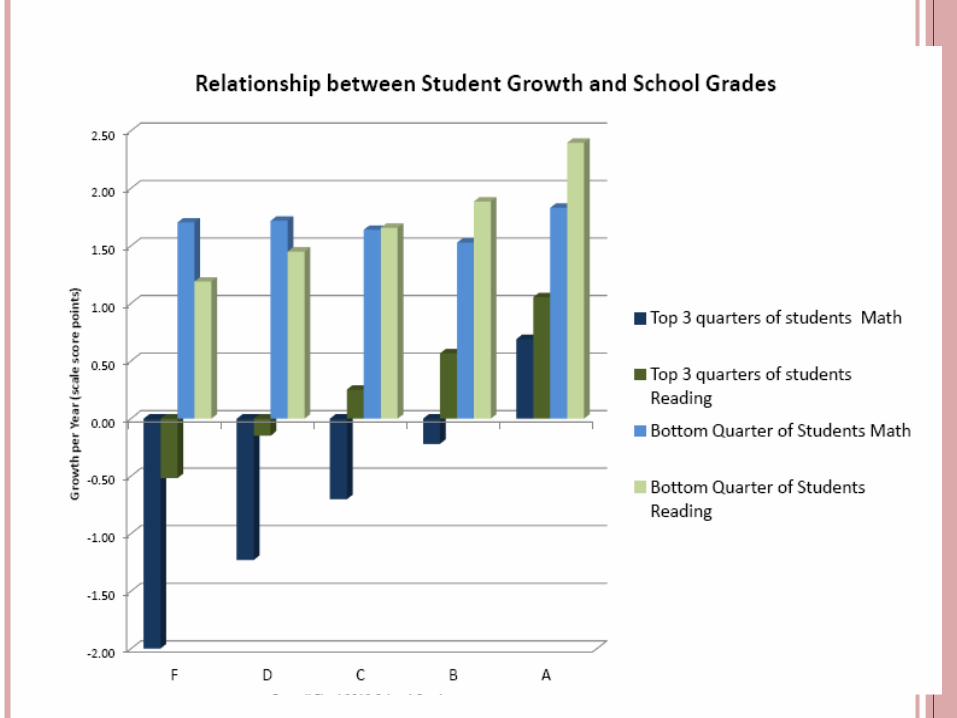
Student Growth
Calculated for ‘Q1’ lowest performing group (Lowest 25%) and ‘Q3’ highest performing group (Upper 75%)
Student’s prior test scores used to estimate how they should perform today
Growth is the average change in scaled score points each year
“0” means scored as expected + or positive means scores higher than
expected - or negative means scores lower than
expected


Growth of Lowest Performing Students Q1(7.7 out of 15 points)


Which translates to...


Opportunity to Learn(6.1 out of 8 POINTS)


Graduation(11.5 out of 17 POINTS)

Graduation
The basis for the 4 and 5 year rate is 95%
For example:a school with an 85% 4-year rate and
95% 5-year rate earns the following4-Year points = 85/95 x 8 = 3.58
5-Year points = 95/95 x 4 = 4.00


Target Graduation Rates


College & Career Readiness(8.6 out of 15 POINTS)

College & Career Readiness

College & Career Readiness Students that attempted
a college course career prep curriculum or college admission assessment
Percentage computed from those students that met benchmark for participation
Percent of successful students multiplied by 10 Best single outcome used for students participating in
multiple college/career efforts Number of students successfully meeting benchmarks
Number of students participating Each student counted once in denominator Numerator from Participation

Bonus Points(1.5 out of 5 POINTS)

School Growth Targets


Participation


Questions?Strategies?

More Information at...
PED Website for School Reports http://www.ped.state.nm.us/
Thank You!


![Suite bourguignonne [Op.17] - Sheet music · Vierne Suite Bourguignonne VI. Danse Rustique op. 17,N0.6 Risoluto * Ped * Ped POCO. c. poco ped ped * - Suitc Bourguignonnc Dim. poco](https://static.fdocuments.in/doc/165x107/60e74254f045117af729d4a6/suite-bourguignonne-op17-sheet-music-vierne-suite-bourguignonne-vi-danse-rustique.jpg)