RESEARCH Open Access An FPGA-based high-speed … FPGA-based high-speed network performance...
10
RESEARCH Open Access An FPGA-based high-speed network performance measurement for RFC 2544 Yong Wang 1* , Yong Liu 2 , Xiaoling Tao 3 and Qian He 3 Abstract Aiming at the problem that existing network performance measurements have low accuracy for (Request for Comments) RFC 2544, this paper proposes a high-speed network performance measurement based on field-programmable gate array (FPGA). The active measurement method is used to generate probe data frames, and a passive measurement method is employed to count network traffic. According to the statistical laws based on throughput variation, interval stretching mechanism is used to dynamically adjust interframe gap. When our approach approaches the maximum throughput, the network performance parameters are achieved. A prototype based on NetFPGA is also implemented for evaluation. Experimental results show that our approach can be applied in high-speed network and the latency can be accurate to the nanosecond. Compared with network performance measurement using software to send probe data frames and a similar work based on FPGA, our approach can be more flexible and the evaluation data are more accurate. Keywords: RFC 2544; Active measurement; Passive measurement; Traffic generator; Interval stretching; Network performance measurement 1 Introduction The explosive growth in Internet deployment for a con- stantly growing variety of applications has created a massive increase in demand for network performance parameters, such as throughput, latency, and packet loss rate [1-6], which are very important for providing differ- entiated network services. Accurate network performance parameters can help to improve the quality of network services, including active and passive resource manage- ment, traffic engineering, as well as providing quality of service (QoS) guarantees for end-user applications. In par- ticular, as modern network management systems shift their focus forward service-level and application-level management, the network monitoring process requires more data to be collected in a higher frequency. With the development of new network applications and value-added services, network traffic characteristics have become more and more complex. Different applica- tions have different flow characteristics and behavioral characteristics, so it is not enough to analyze only using mathematical simulation and the classical queuing theory mode. But through the result of the network per- formance parameters and its analysis, we could simulate the Internet environment accurately, which helps us to optimize the network and design the network equipment to a certain extent. Different network applications have different require- ments for QoS. For example, file transfer services re- quire low packet loss rate and high throughput, and real-time multimedia services demand low latency [7]. Through network measurement, the users can detect network congestion, locate network performance bottle- necks, and provide the basis for the network resource optimization. Faced with an increasingly serious threat to network security, the large-scale network measurements are used to analyze and assess the network performance in abnor- mal circumstances so early warning can be provided to prevent large-scale network attacks. Therefore, network measurement method also has become an important mean to protect the network security and prevent large- scale network attacks. The most frequent used methods are ping and tracer- oute. By calculating the time between sending the * Correspondence: [email protected] 1 CSIP Guangxi Center, Guilin University of Electronic Technology, Guilin 541004, China Full list of author information is available at the end of the article © 2015 Wang et al. This is an Open Access article distributed under the terms of the Creative Commons Attribution License (http://creativecommons.org/licenses/by/2.0), which permits unrestricted use, distribution, and reproduction in any medium, provided the original work is properly credited. Wang et al. EURASIP Journal on Wireless Communications and Networking 2015, 2015:2 http://jwcn.eurasipjournals.com/content/2015/1/2
Transcript of RESEARCH Open Access An FPGA-based high-speed … FPGA-based high-speed network performance...
Wang et al. EURASIP Journal on Wireless Communications and Networking 2015, 2015:2http://jwcn.eurasipjournals.com/content/2015/1/2
RESEARCH Open Access
An FPGA-based high-speed network performancemeasurement for RFC 2544Yong Wang1*, Yong Liu2, Xiaoling Tao3 and Qian He3
Abstract
Aiming at the problem that existing network performance measurements have low accuracy for (Request for Comments)RFC 2544, this paper proposes a high-speed network performance measurement based on field-programmablegate array (FPGA). The active measurement method is used to generate probe data frames, and a passive measurementmethod is employed to count network traffic. According to the statistical laws based on throughput variation, intervalstretching mechanism is used to dynamically adjust interframe gap. When our approach approaches the maximumthroughput, the network performance parameters are achieved. A prototype based on NetFPGA is also implementedfor evaluation. Experimental results show that our approach can be applied in high-speed network and the latencycan be accurate to the nanosecond. Compared with network performance measurement using software to sendprobe data frames and a similar work based on FPGA, our approach can be more flexible and the evaluation dataare more accurate.
Keywords: RFC 2544; Active measurement; Passive measurement; Traffic generator; Interval stretching; Networkperformance measurement
1 IntroductionThe explosive growth in Internet deployment for a con-stantly growing variety of applications has created amassive increase in demand for network performanceparameters, such as throughput, latency, and packet lossrate [1-6], which are very important for providing differ-entiated network services. Accurate network performanceparameters can help to improve the quality of networkservices, including active and passive resource manage-ment, traffic engineering, as well as providing quality ofservice (QoS) guarantees for end-user applications. In par-ticular, as modern network management systems shifttheir focus forward service-level and application-levelmanagement, the network monitoring process requiresmore data to be collected in a higher frequency.With the development of new network applications
and value-added services, network traffic characteristicshave become more and more complex. Different applica-tions have different flow characteristics and behavioralcharacteristics, so it is not enough to analyze only using
* Correspondence: [email protected] Guangxi Center, Guilin University of Electronic Technology, Guilin541004, ChinaFull list of author information is available at the end of the article
© 2015 Wang et al. This is an Open Access arti(http://creativecommons.org/licenses/by/2.0), wprovided the original work is properly credited
mathematical simulation and the classical queuingtheory mode. But through the result of the network per-formance parameters and its analysis, we could simulatethe Internet environment accurately, which helps us tooptimize the network and design the network equipmentto a certain extent.Different network applications have different require-
ments for QoS. For example, file transfer services re-quire low packet loss rate and high throughput, andreal-time multimedia services demand low latency [7].Through network measurement, the users can detectnetwork congestion, locate network performance bottle-necks, and provide the basis for the network resourceoptimization.Faced with an increasingly serious threat to network
security, the large-scale network measurements are usedto analyze and assess the network performance in abnor-mal circumstances so early warning can be provided toprevent large-scale network attacks. Therefore, networkmeasurement method also has become an importantmean to protect the network security and prevent large-scale network attacks.The most frequent used methods are ping and tracer-
oute. By calculating the time between sending the
cle distributed under the terms of the Creative Commons Attribution Licensehich permits unrestricted use, distribution, and reproduction in any medium,.
Wang et al. EURASIP Journal on Wireless Communications and Networking 2015, 2015:2 Page 2 of 10http://jwcn.eurasipjournals.com/content/2015/1/2
Internet Control Message Protocol (ICMP) or UserDatagram Protocol (UDP) packet and receiving the re-sponse packet, the end-loop time can be obtained, butthe processing rate restricts the performance of theabove solutions, which only enables the latency to beaccurate to the milliseconds. Transmission ControlProtocol (TCP) state detection [8] performs analysis ofTCP flows. It utilizes TCP data packets and its acknow-ledgement (ACK) packets to measure the throughputand latency. Unfortunately, the results are only closer tothe actual network. Using the software [9,10] to generatetest flow can be easy to achieve, but its results are diffi-cult to make the users satisfy to a certain extent becauseit could create an extra overhead when generating thetest flows constantly. It usually is not suitable to be de-ployed in high-speed network. In addition, common net-work performance analyzers, such as SmartBits andTestCenter, are too expensive to be suitable for generalperformance benchmarks.In this paper, an FPGA-based high-speed network per-
formance measurement for RFC 2544 [11] is proposed.The active measurement method is employed to gener-ate a lot of probe data frames set by the user. The pas-sive measurement method is used to precisely countnetwork traffic of each Ethernet interface and other re-lated parameters through Register I/O in real time. Ac-cording to the change of throughput, it dynamicallyadjusts the interframe gap to reach the limit of networkperformance. Our approach not only gets the latencythat is accurate to the nanosecond but also can be ap-plied in high-speed network.The rest of this paper is organized as follows. Section 2
discusses related work on network performance measure-ment. In Section 3, we put forward the network perform-ance measurement benchmarks. The design of ourapproach is shown in Section 4. Then in Section 5, experi-mental tests and performance analysis are given. Section 6concludes the paper.
2 Related workCurrently, the majority of existing network performancemeasurement methods is software-based and concen-trates on the measurement of throughput, latency,packet loss rate, and so on. The network performancemeasurement techniques are divided into two categories[12]. One is the active measurement method and theother is passive measurement method. The active meas-urement method usually does not require collaborationamong multiple nodes, which is very flexible. It is alsoeasy to operate. A methodology that estimates packetloss rate between arbitrary end hosts without control oneither end is developed in [13]. Using UDP by default totransmit Domain Name Service (DNS) queries actively,it takes advantage of the retransmission behavior of
deployed DNS servers to conduct measurements, but itneeds much more resources than others, which couldbring some difficulties to some extent. Sending probeframes or Internet Protocol (IP) packets to conduct themeasurements is another solution. The network trafficconfigured by the users is needed to generate in the cli-ent windows. When the data flows are sent or received,it should count the network traffic. Then, the related pa-rameters, such as latency, packet loss rate, and through-put, are calculated. The hardware-based method canprocess network traffic at much higher data rates. Ahardware circuit is tested using an FPGA device whichconducts an Ethernet tester [14] compliant with thethroughput and latency tests specified by the RFC 2544for 10/100 Mbps Ethernet networks; the usual limita-tions added by several hardware and software layers canbe overcome by implementing a frame generator directlyin an FPGA device, but it is only deployed in 10/100 MbpsEthernet networks. It is also not flexible enough. A trafficgenerator [15,16] based on FPGA can achieve full gigabitlink utilization, which motivates us to do it better.The passive measurement method does not take up
network bandwidth and has less impact on the network.It can also help us to get accurate results. To calculateper-application packet loss, [17] periodically retrievesthe expired flows from the two passive monitoring sen-sors. Allowing pinpointing loss events for specific classesof traffic, the packet loss rate of individual traffic flowscan be measured. Since it gets the related informationperiodically, the packet loss rate is difficult to be achievedin real time. The recognition of lost and retransmittedpackets and segments for packet-based methods is one ofchallenges in passive round-trip time (RTT) measurement.To overcome this problem, [18] proposes an estimationtechnique for RTT measurement based on flow monitor-ing. It calculates RTT from five-tuple flow measurement,which identifies the flow, as well as start time and end timefor each flow record, but it should run much more timeand its results are not accurate.
3 BenchmarksRFC 2544 provides a lot of parameters applied in differentnetwork equipment test. In this paper, the latency,throughput, and packet loss rate in our approach are pro-vided to conduct network performance measurement.
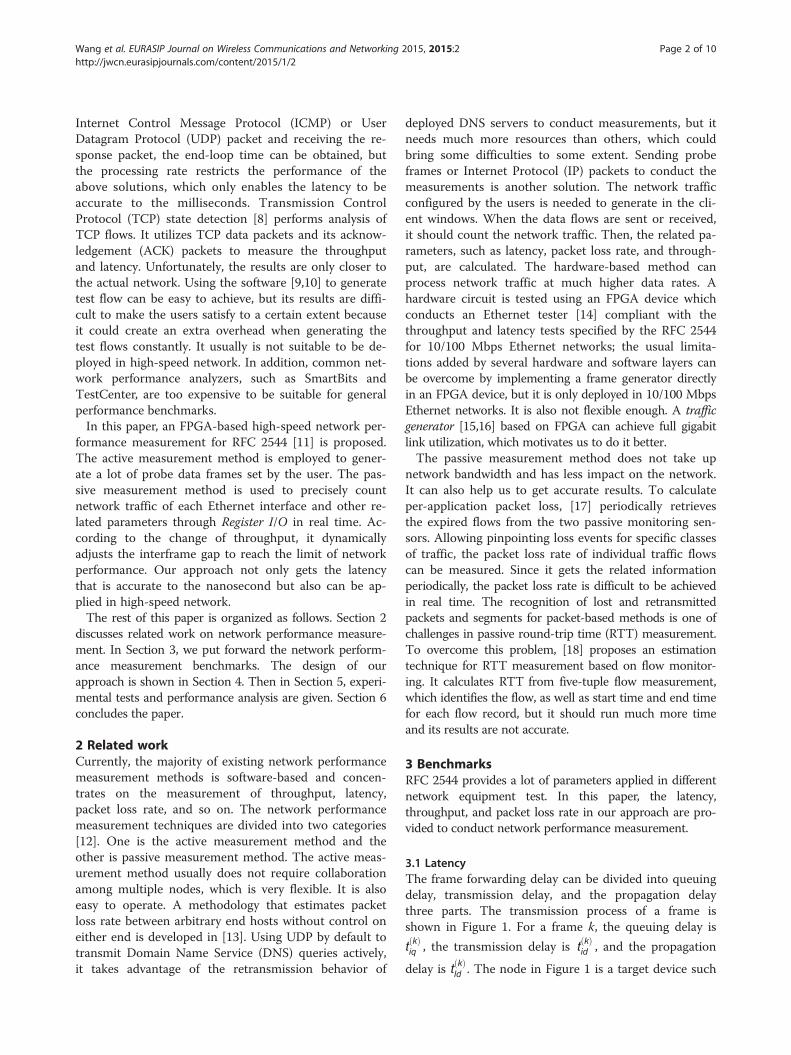
3.1 LatencyThe frame forwarding delay can be divided into queuingdelay, transmission delay, and the propagation delaythree parts. The transmission process of a frame isshown in Figure 1. For a frame k, the queuing delay is
tkð Þiq , the transmission delay is t
kð Þid , and the propagation
delay is t kð Þld . The node in Figure 1 is a target device such
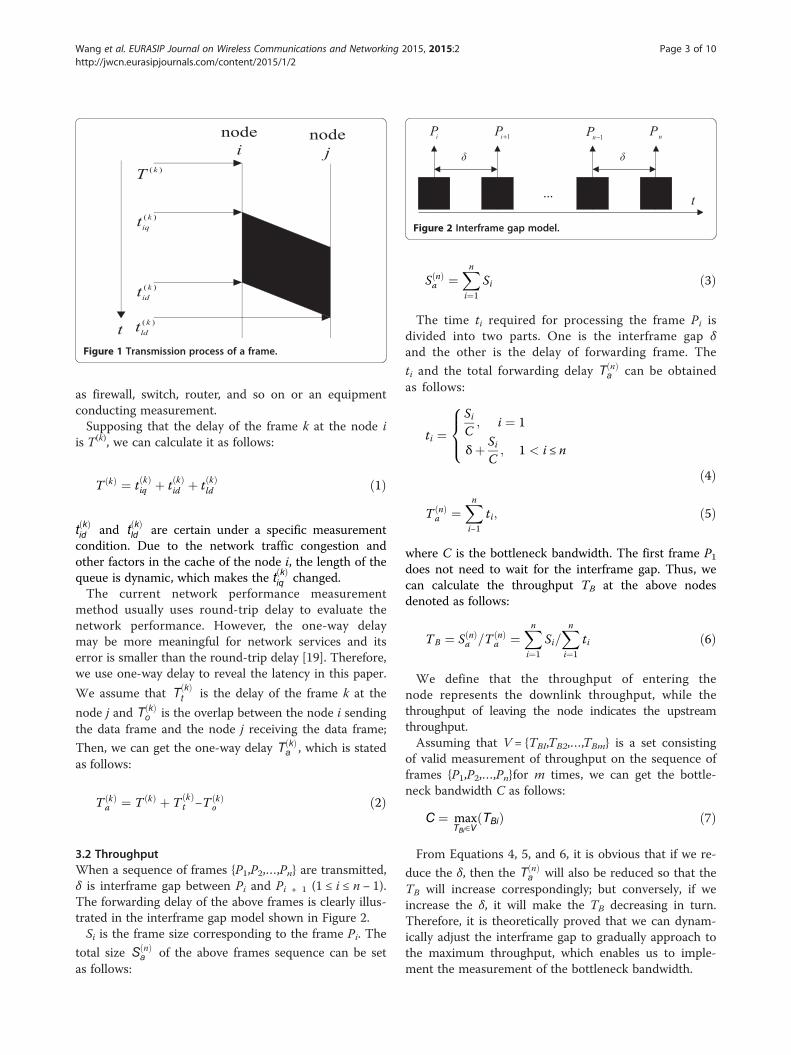
Figure 1 Transmission process of a frame.
Figure 2 Interframe gap model.
Wang et al. EURASIP Journal on Wireless Communications and Networking 2015, 2015:2 Page 3 of 10http://jwcn.eurasipjournals.com/content/2015/1/2
as firewall, switch, router, and so on or an equipmentconducting measurement.Supposing that the delay of the frame k at the node i
is T(k), we can calculate it as follows:
T kð Þ ¼ t kð Þiq þ t kð Þ
id þ t kð Þld ð1Þ
tkð Þid and t
kð Þld are certain under a specific measurement
condition. Due to the network traffic congestion andother factors in the cache of the node i, the length of thequeue is dynamic, which makes the t
kð Þiq changed.
The current network performance measurementmethod usually uses round-trip delay to evaluate thenetwork performance. However, the one-way delaymay be more meaningful for network services and itserror is smaller than the round-trip delay [19]. Therefore,we use one-way delay to reveal the latency in this paper.
We assume that Tkð Þt is the delay of the frame k at the
node j and T kð Þo is the overlap between the node i sending
the data frame and the node j receiving the data frame;
Then, we can get the one-way delay T kð Þa , which is stated
as follows:
T kð Þa ¼ T kð Þ þ T kð Þ
t −T kð Þo ð2Þ
3.2 ThroughputWhen a sequence of frames {P1,P2,…,Pn} are transmitted,δ is interframe gap between Pi and Pi + 1 (1 ≤ i ≤ n − 1).The forwarding delay of the above frames is clearly illus-trated in the interframe gap model shown in Figure 2.Si is the frame size corresponding to the frame Pi. The
total size S nð Þa of the above frames sequence can be set
as follows:
S nð Þa ¼
Xni¼1
Si ð3Þ
The time ti required for processing the frame Pi isdivided into two parts. One is the interframe gap δand the other is the delay of forwarding frame. The
ti and the total forwarding delay T nð Þa can be obtained
as follows:
ti ¼SiC; i ¼ 1
δþ SiC; 1 < i ≤ n
8><>:
ð4Þ
T nð Þa ¼
Xni−1
ti; ð5Þ
where C is the bottleneck bandwidth. The first frame P1does not need to wait for the interframe gap. Thus, wecan calculate the throughput TB at the above nodesdenoted as follows:
TB ¼ S nð Þa =T nð Þ
a ¼Xni¼1
Si=Xni¼1
ti ð6Þ
We define that the throughput of entering thenode represents the downlink throughput, while thethroughput of leaving the node indicates the upstreamthroughput.Assuming that V = {TBI,TB2,…,TBm} is a set consisting
of valid measurement of throughput on the sequence offrames {P1,P2,…,Pn}for m times, we can get the bottle-neck bandwidth C as follows:
C ¼ maxTBi∈V
TBið Þ ð7Þ
From Equations 4, 5, and 6, it is obvious that if we re-
duce the δ, then the T nð Þa will also be reduced so that the
TB will increase correspondingly; but conversely, if weincrease the δ, it will make the TB decreasing in turn.Therefore, it is theoretically proved that we can dynam-ically adjust the interframe gap to gradually approach tothe maximum throughput, which enables us to imple-ment the measurement of the bottleneck bandwidth.
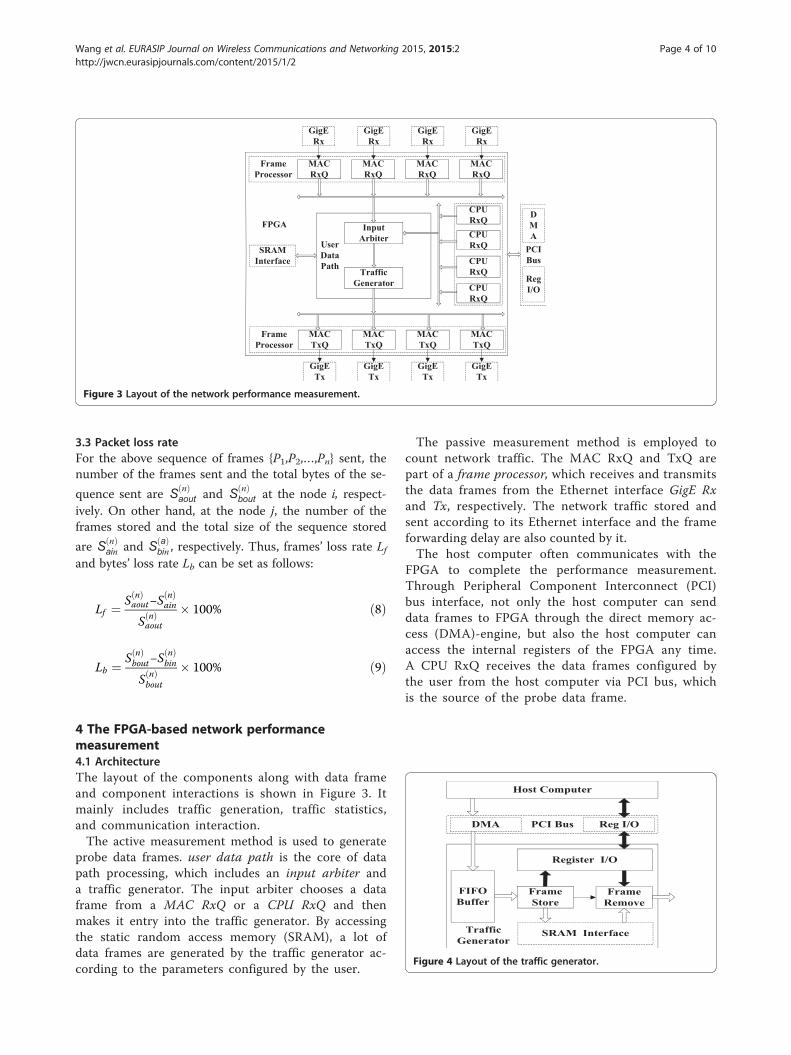
Figure 3 Layout of the network performance measurement.
Figure 4 Layout of the traffic generator.
Wang et al. EURASIP Journal on Wireless Communications and Networking 2015, 2015:2 Page 4 of 10http://jwcn.eurasipjournals.com/content/2015/1/2
3.3 Packet loss rateFor the above sequence of frames {P1,P2,…,Pn} sent, thenumber of the frames sent and the total bytes of the se-
quence sent are Snð Þaout and S
nð Þbout at the node i, respect-
ively. On other hand, at the node j, the number of theframes stored and the total size of the sequence stored
are Snð Þain and S
að Þbin , respectively. Thus, frames’ loss rate Lf
and bytes’ loss rate Lb can be set as follows:
Lf ¼ S nð Þaout−S
nð Þain
S nð Þaout
� 100% ð8Þ
Lb ¼ S nð Þbout−S
nð Þbin
S nð Þbout
� 100% ð9Þ
4 The FPGA-based network performancemeasurement4.1 ArchitectureThe layout of the components along with data frameand component interactions is shown in Figure 3. Itmainly includes traffic generation, traffic statistics,and communication interaction.The active measurement method is used to generate
probe data frames. user data path is the core of datapath processing, which includes an input arbiter anda traffic generator. The input arbiter chooses a dataframe from a MAC RxQ or a CPU RxQ and thenmakes it entry into the traffic generator. By accessingthe static random access memory (SRAM), a lot ofdata frames are generated by the traffic generator ac-cording to the parameters configured by the user.
The passive measurement method is employed tocount network traffic. The MAC RxQ and TxQ arepart of a frame processor, which receives and transmitsthe data frames from the Ethernet interface GigE Rxand Tx, respectively. The network traffic stored andsent according to its Ethernet interface and the frameforwarding delay are also counted by it.The host computer often communicates with the
FPGA to complete the performance measurement.Through Peripheral Component Interconnect (PCI)bus interface, not only the host computer can senddata frames to FPGA through the direct memory ac-cess (DMA)-engine, but also the host computer canaccess the internal registers of the FPGA any time.A CPU RxQ receives the data frames configured bythe user from the host computer via PCI bus, whichis the source of the probe data frame.
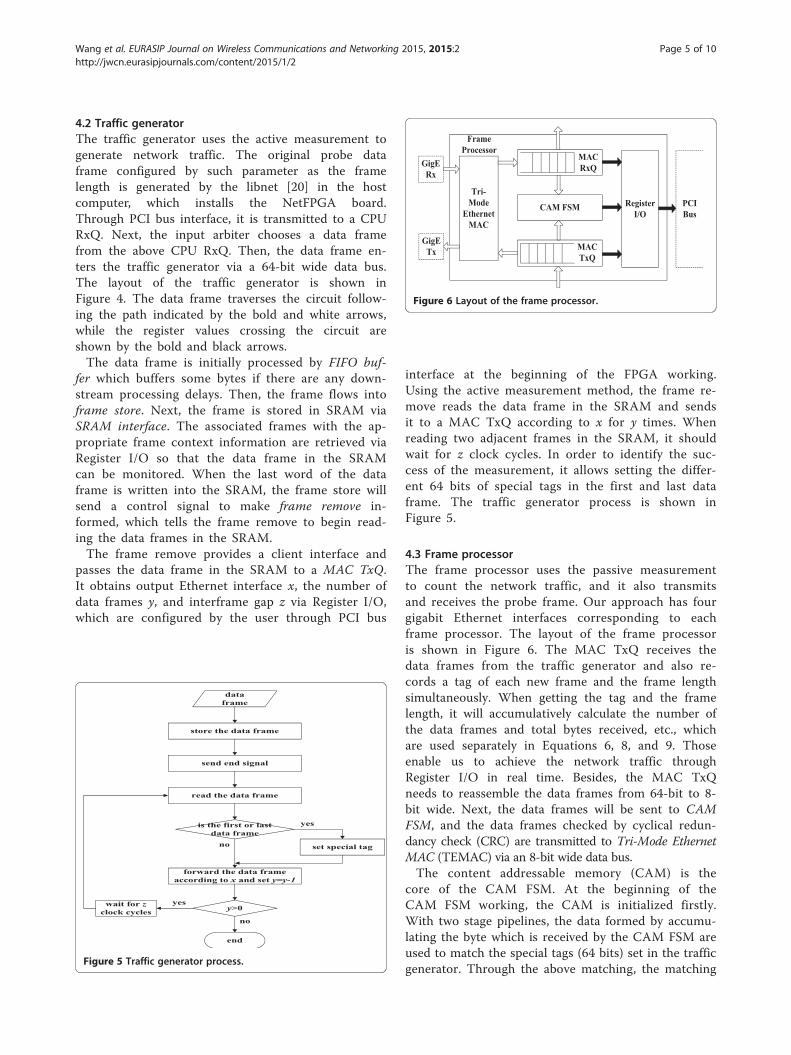
Figure 6 Layout of the frame processor.
Wang et al. EURASIP Journal on Wireless Communications and Networking 2015, 2015:2 Page 5 of 10http://jwcn.eurasipjournals.com/content/2015/1/2
4.2 Traffic generatorThe traffic generator uses the active measurement togenerate network traffic. The original probe dataframe configured by such parameter as the framelength is generated by the libnet [20] in the hostcomputer, which installs the NetFPGA board.Through PCI bus interface, it is transmitted to a CPURxQ. Next, the input arbiter chooses a data framefrom the above CPU RxQ. Then, the data frame en-ters the traffic generator via a 64-bit wide data bus.The layout of the traffic generator is shown inFigure 4. The data frame traverses the circuit follow-ing the path indicated by the bold and white arrows,while the register values crossing the circuit areshown by the bold and black arrows.The data frame is initially processed by FIFO buf-
fer which buffers some bytes if there are any down-stream processing delays. Then, the frame flows intoframe store. Next, the frame is stored in SRAM viaSRAM interface. The associated frames with the ap-propriate frame context information are retrieved viaRegister I/O so that the data frame in the SRAMcan be monitored. When the last word of the dataframe is written into the SRAM, the frame store willsend a control signal to make frame remove in-formed, which tells the frame remove to begin read-ing the data frames in the SRAM.The frame remove provides a client interface and
passes the data frame in the SRAM to a MAC TxQ.It obtains output Ethernet interface x, the number ofdata frames y, and interframe gap z via Register I/O,which are configured by the user through PCI bus
Figure 5 Traffic generator process.
interface at the beginning of the FPGA working.Using the active measurement method, the frame re-move reads the data frame in the SRAM and sendsit to a MAC TxQ according to x for y times. Whenreading two adjacent frames in the SRAM, it shouldwait for z clock cycles. In order to identify the suc-cess of the measurement, it allows setting the differ-ent 64 bits of special tags in the first and last dataframe. The traffic generator process is shown inFigure 5.
4.3 Frame processorThe frame processor uses the passive measurementto count the network traffic, and it also transmitsand receives the probe frame. Our approach has fourgigabit Ethernet interfaces corresponding to eachframe processor. The layout of the frame processoris shown in Figure 6. The MAC TxQ receives thedata frames from the traffic generator and also re-cords a tag of each new frame and the frame lengthsimultaneously. When getting the tag and the framelength, it will accumulatively calculate the number ofthe data frames and total bytes received, etc., whichare used separately in Equations 6, 8, and 9. Thoseenable us to achieve the network traffic throughRegister I/O in real time. Besides, the MAC TxQneeds to reassemble the data frames from 64-bit to 8-bit wide. Next, the data frames will be sent to CAMFSM, and the data frames checked by cyclical redun-dancy check (CRC) are transmitted to Tri-Mode EthernetMAC (TEMAC) via an 8-bit wide data bus.The content addressable memory (CAM) is the
core of the CAM FSM. At the beginning of theCAM FSM working, the CAM is initialized firstly.With two stage pipelines, the data formed by accumu-lating the byte which is received by the CAM FSM areused to match the special tags (64 bits) set in the trafficgenerator. Through the above matching, the matching
Wang et al. EURASIP Journal on Wireless Communications and Networking 2015, 2015:2 Page 6 of 10http://jwcn.eurasipjournals.com/content/2015/1/2
mark of the data frame and its valid mark are re-corded. For one thing, the total data frame transmis-sion time can be achieved by clock cycles, which isused in Equation 6. For another thing, using thevalid mark can help us to avoid invalid statisticsabout clock cycles when the tag in the data framesis missing.The TEMAC generated by the intellectual property
(IP) core of Xilinx is used to process the dataframes. It sends data frames to the GigE Tx and re-ceives data frames from the GigE Rx. The MAC RxQis similar with the MAC TxQ, which is just in a dif-ferent transmission direction. When the MAC TxQsends a data frame, a counter is opened; while theMAC RxQ finishes receiving that data frame, theabove counter is closed by the MAC TxQ immedi-ately. By their collaboration, the latency shown inEquation 2, which is accurate to the nanosecond,can be obtained.
4.4 Interval stretchingThe interval stretching is used to dynamically adjustthe interframe gap, which enables the traffic gener-ator to generate the perfect network traffic, so theaccurate measurements can be conducted. Accordingto the statistical laws based on throughput variation,our approach dynamically adjusts the interframe gapto generate probe data frames and count networktraffic again and again. When it approaches the limitof the network, the network performance parametersare achieved. To find an optimized interval is important
ba lb rbba
ra ba bala
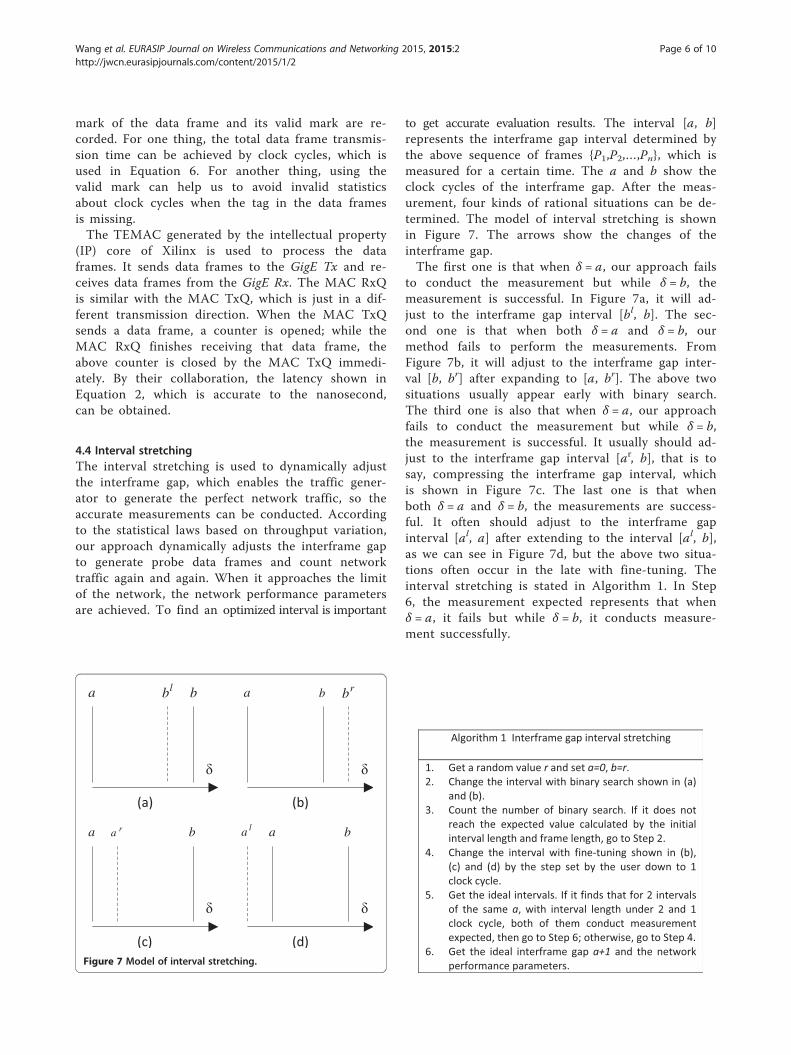
Figure 7 Model of interval stretching.
to get accurate evaluation results. The interval [a, b]represents the interframe gap interval determined bythe above sequence of frames {P1,P2,…,Pn}, which ismeasured for a certain time. The a and b show theclock cycles of the interframe gap. After the meas-urement, four kinds of rational situations can be de-termined. The model of interval stretching is shownin Figure 7. The arrows show the changes of theinterframe gap.The first one is that when δ = a, our approach fails
to conduct the measurement but while δ = b, themeasurement is successful. In Figure 7a, it will ad-just to the interframe gap interval [bl, b]. The sec-ond one is that when both δ = a and δ = b, ourmethod fails to perform the measurements. FromFigure 7b, it will adjust to the interframe gap inter-val [b, br] after expanding to [a, br]. The above twosituations usually appear early with binary search.The third one is also that when δ = a, our approachfails to conduct the measurement but while δ = b,the measurement is successful. It usually should ad-just to the interframe gap interval [ar, b], that is tosay, compressing the interframe gap interval, whichis shown in Figure 7c. The last one is that whenboth δ = a and δ = b, the measurements are success-ful. It often should adjust to the interframe gapinterval [al, a] after extending to the interval [al, b],as we can see in Figure 7d, but the above two situa-tions often occur in the late with fine-tuning. Theinterval stretching is stated in Algorithm 1. In Step6, the measurement expected represents that whenδ = a, it fails but while δ = b, it conducts measure-ment successfully.
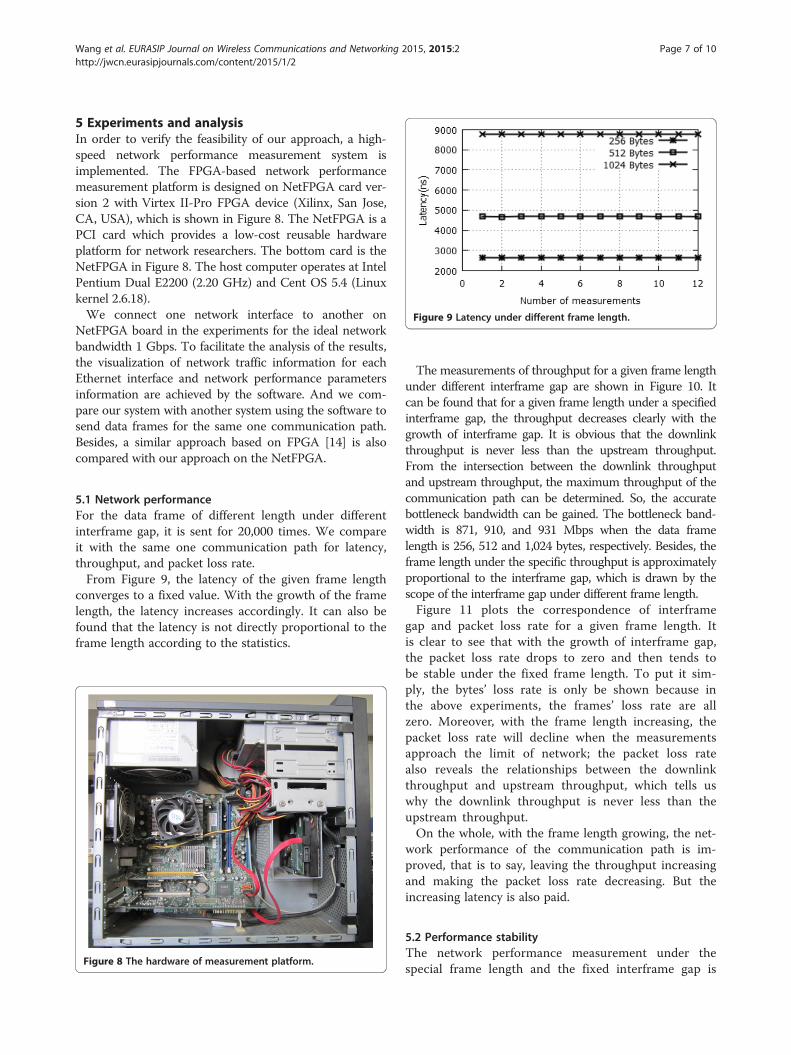
Figure 9 Latency under different frame length.
Wang et al. EURASIP Journal on Wireless Communications and Networking 2015, 2015:2 Page 7 of 10http://jwcn.eurasipjournals.com/content/2015/1/2
5 Experiments and analysisIn order to verify the feasibility of our approach, a high-speed network performance measurement system isimplemented. The FPGA-based network performancemeasurement platform is designed on NetFPGA card ver-sion 2 with Virtex II-Pro FPGA device (Xilinx, San Jose,CA, USA), which is shown in Figure 8. The NetFPGA is aPCI card which provides a low-cost reusable hardwareplatform for network researchers. The bottom card is theNetFPGA in Figure 8. The host computer operates at IntelPentium Dual E2200 (2.20 GHz) and Cent OS 5.4 (Linuxkernel 2.6.18).We connect one network interface to another on
NetFPGA board in the experiments for the ideal networkbandwidth 1 Gbps. To facilitate the analysis of the results,the visualization of network traffic information for eachEthernet interface and network performance parametersinformation are achieved by the software. And we com-pare our system with another system using the software tosend data frames for the same one communication path.Besides, a similar approach based on FPGA [14] is alsocompared with our approach on the NetFPGA.
5.1 Network performanceFor the data frame of different length under differentinterframe gap, it is sent for 20,000 times. We compareit with the same one communication path for latency,throughput, and packet loss rate.From Figure 9, the latency of the given frame length
converges to a fixed value. With the growth of the framelength, the latency increases accordingly. It can also befound that the latency is not directly proportional to theframe length according to the statistics.
Figure 8 The hardware of measurement platform.
The measurements of throughput for a given frame lengthunder different interframe gap are shown in Figure 10. Itcan be found that for a given frame length under a specifiedinterframe gap, the throughput decreases clearly with thegrowth of interframe gap. It is obvious that the downlinkthroughput is never less than the upstream throughput.From the intersection between the downlink throughputand upstream throughput, the maximum throughput of thecommunication path can be determined. So, the accuratebottleneck bandwidth can be gained. The bottleneck band-width is 871, 910, and 931 Mbps when the data framelength is 256, 512 and 1,024 bytes, respectively. Besides, theframe length under the specific throughput is approximatelyproportional to the interframe gap, which is drawn by thescope of the interframe gap under different frame length.Figure 11 plots the correspondence of interframe
gap and packet loss rate for a given frame length. Itis clear to see that with the growth of interframe gap,the packet loss rate drops to zero and then tends tobe stable under the fixed frame length. To put it sim-ply, the bytes’ loss rate is only be shown because inthe above experiments, the frames’ loss rate are allzero. Moreover, with the frame length increasing, thepacket loss rate will decline when the measurementsapproach the limit of network; the packet loss ratealso reveals the relationships between the downlinkthroughput and upstream throughput, which tells uswhy the downlink throughput is never less than theupstream throughput.On the whole, with the frame length growing, the net-
work performance of the communication path is im-proved, that is to say, leaving the throughput increasingand making the packet loss rate decreasing. But theincreasing latency is also paid.
5.2 Performance stabilityThe network performance measurement under thespecial frame length and the fixed interframe gap is
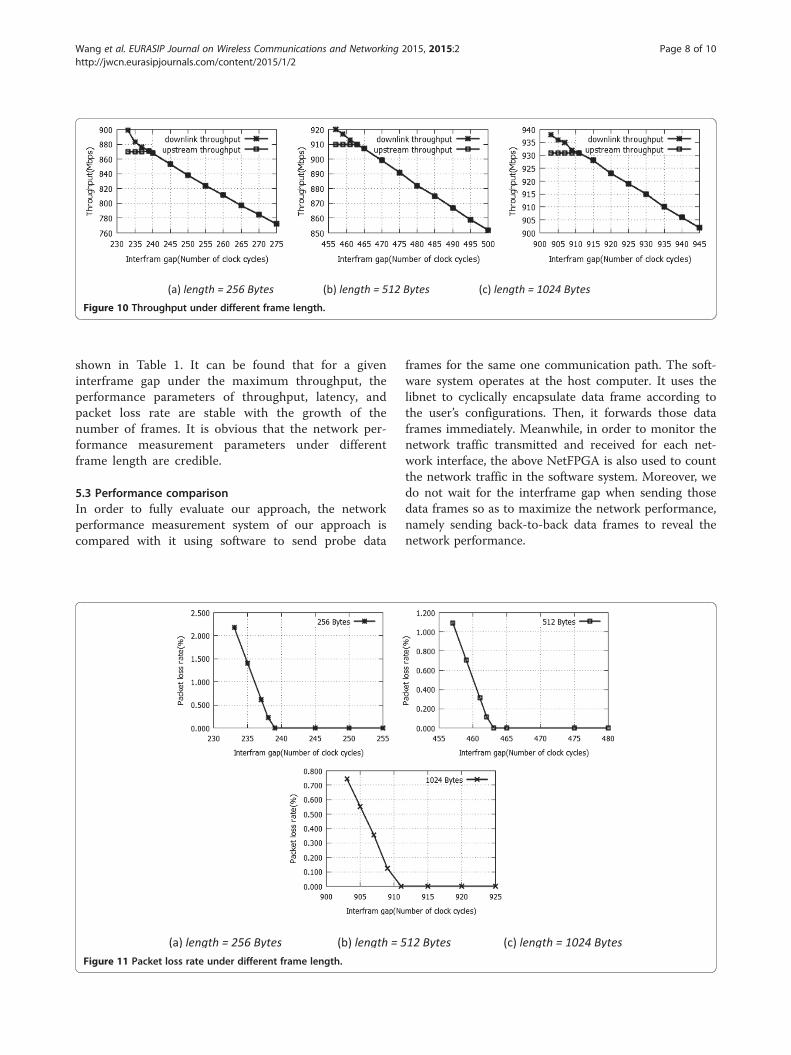
Figure 10 Throughput under different frame length.
Wang et al. EURASIP Journal on Wireless Communications and Networking 2015, 2015:2 Page 8 of 10http://jwcn.eurasipjournals.com/content/2015/1/2
shown in Table 1. It can be found that for a giveninterframe gap under the maximum throughput, theperformance parameters of throughput, latency, andpacket loss rate are stable with the growth of thenumber of frames. It is obvious that the network per-formance measurement parameters under differentframe length are credible.
5.3 Performance comparisonIn order to fully evaluate our approach, the networkperformance measurement system of our approach iscompared with it using software to send probe data
Figure 11 Packet loss rate under different frame length.
frames for the same one communication path. The soft-ware system operates at the host computer. It uses thelibnet to cyclically encapsulate data frame according tothe user’s configurations. Then, it forwards those dataframes immediately. Meanwhile, in order to monitor thenetwork traffic transmitted and received for each net-work interface, the above NetFPGA is also used to countthe network traffic in the software system. Moreover, wedo not wait for the interframe gap when sending thosedata frames so as to maximize the network performance,namely sending back-to-back data frames to reveal thenetwork performance.
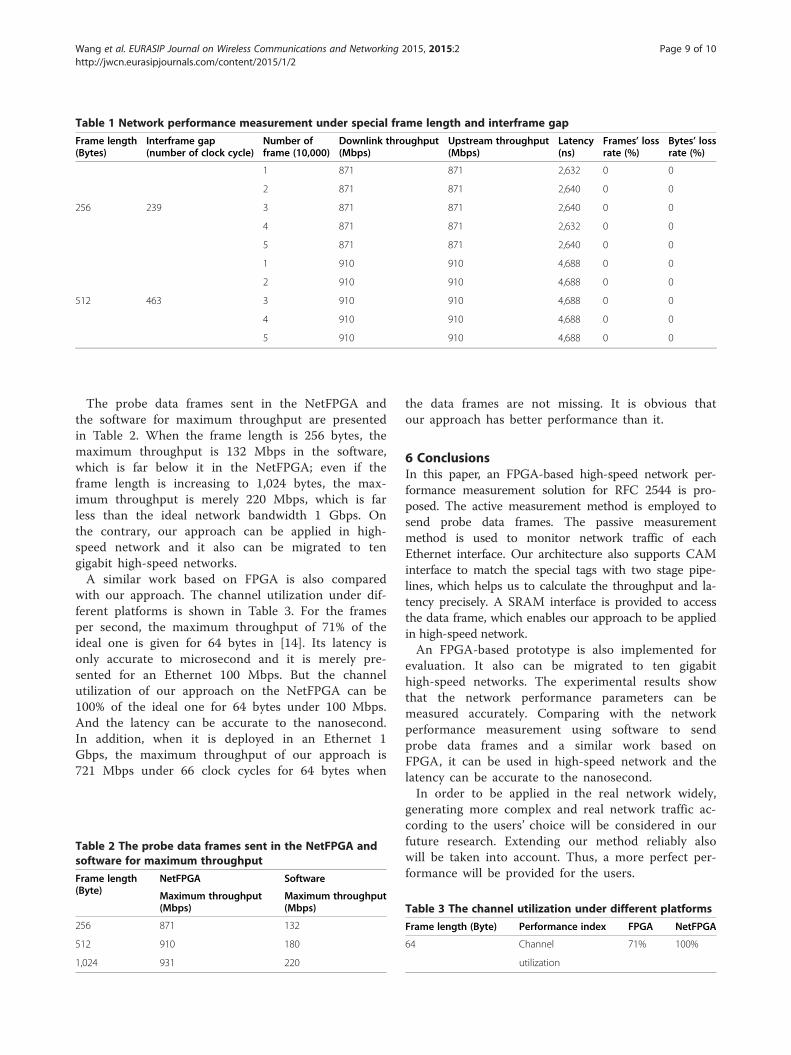
Table 1 Network performance measurement under special frame length and interframe gap
Frame length(Bytes)
Interframe gap(number of clock cycle)
Number offrame (10,000)
Downlink throughput(Mbps)
Upstream throughput(Mbps)
Latency(ns)
Frames’ lossrate (%)
Bytes’ lossrate (%)
1 871 871 2,632 0 0
2 871 871 2,640 0 0
256 239 3 871 871 2,640 0 0
4 871 871 2,632 0 0
5 871 871 2,640 0 0
1 910 910 4,688 0 0
2 910 910 4,688 0 0
512 463 3 910 910 4,688 0 0
4 910 910 4,688 0 0
5 910 910 4,688 0 0
Wang et al. EURASIP Journal on Wireless Communications and Networking 2015, 2015:2 Page 9 of 10http://jwcn.eurasipjournals.com/content/2015/1/2
The probe data frames sent in the NetFPGA andthe software for maximum throughput are presentedin Table 2. When the frame length is 256 bytes, themaximum throughput is 132 Mbps in the software,which is far below it in the NetFPGA; even if theframe length is increasing to 1,024 bytes, the max-imum throughput is merely 220 Mbps, which is farless than the ideal network bandwidth 1 Gbps. Onthe contrary, our approach can be applied in high-speed network and it also can be migrated to tengigabit high-speed networks.A similar work based on FPGA is also compared
with our approach. The channel utilization under dif-ferent platforms is shown in Table 3. For the framesper second, the maximum throughput of 71% of theideal one is given for 64 bytes in [14]. Its latency isonly accurate to microsecond and it is merely pre-sented for an Ethernet 100 Mbps. But the channelutilization of our approach on the NetFPGA can be100% of the ideal one for 64 bytes under 100 Mbps.And the latency can be accurate to the nanosecond.In addition, when it is deployed in an Ethernet 1Gbps, the maximum throughput of our approach is721 Mbps under 66 clock cycles for 64 bytes when
Table 2 The probe data frames sent in the NetFPGA andsoftware for maximum throughput
Frame length(Byte)
NetFPGA Software
Maximum throughput(Mbps)
Maximum throughput(Mbps)
256 871 132
512 910 180
1,024 931 220
the data frames are not missing. It is obvious thatour approach has better performance than it.
6 ConclusionsIn this paper, an FPGA-based high-speed network per-formance measurement solution for RFC 2544 is pro-posed. The active measurement method is employed tosend probe data frames. The passive measurementmethod is used to monitor network traffic of eachEthernet interface. Our architecture also supports CAMinterface to match the special tags with two stage pipe-lines, which helps us to calculate the throughput and la-tency precisely. A SRAM interface is provided to accessthe data frame, which enables our approach to be appliedin high-speed network.An FPGA-based prototype is also implemented for
evaluation. It also can be migrated to ten gigabithigh-speed networks. The experimental results showthat the network performance parameters can bemeasured accurately. Comparing with the networkperformance measurement using software to sendprobe data frames and a similar work based onFPGA, it can be used in high-speed network and thelatency can be accurate to the nanosecond.In order to be applied in the real network widely,
generating more complex and real network traffic ac-cording to the users’ choice will be considered in ourfuture research. Extending our method reliably alsowill be taken into account. Thus, a more perfect per-formance will be provided for the users.
Table 3 The channel utilization under different platforms
Frame length (Byte) Performance index FPGA NetFPGA
64 Channel 71% 100%
utilization
Wang et al. EURASIP Journal on Wireless Communications and Networking 2015, 2015:2 Page 10 of 10http://jwcn.eurasipjournals.com/content/2015/1/2
Competing interestsThe authors have declared that no competing interests exist.
Authors’ informationYong Wang was born in 1964. He received his PhD in East China Universityof Science and Technology, Shanghai, China, in 2005. He is currently aprofessor at Guilin University of Electronic Technology. His research interestsmainly include intelligent control application and network management.Yong Liu was born in 1987. He received his B.S in Wuhan Textile University,Wuhan, China, in 2011. He is currently a graduate student in the Departmentof Computer Science and Engineering at the Guilin University of ElectronicTechnology. His research interest is mainly on compute network andapplication.Tao Xiaoling was born in 1977. She received her B.S and M.S in Guilin Universityof Electronic Technology, Guilin, China, in 1999 and 2008. She is currently anassociate professor at Guilin University of Electronic Technology. Her researchinterest is mainly on network security.Qian He was born in 1979. He received his PhD in Beijing University of Postsand Telecommunications, Beijing, China, in 2011. He is currently a professorat Guilin University of Electronic Technology. His research interests lie innetwork security and distribute computing.
AcknowledgementsThe manuscript was received last November 2013; accepted February 2014.This work is supported by the National Natural Science Foundation of China(No. 61163058, 61172053, and 61201250).
Author details1CSIP Guangxi Center, Guilin University of Electronic Technology, Guilin541004, China. 2College of Computer Science and Engineering, GuilinUniversity of Electronic Technology, Guilin 541004, China. 3College ofInformation and Communication, Guilin University of Electronic Technology,Guilin 541004, China.
Received: 23 December 2013 Accepted: 28 August 2014Published: 26 June 2015
References1. YT Han, IY Hwang, CC Kim et al., A new attainable TCP throughput
measurement tool for long distance high speed networks. IEEE CommunLett 14(10), 990–992 (2010)
2. Y Zhao, M Song, J Wang et al., Throughput Measurement-Based AccessPoint Selection for Multi-rate Wireless LANs, Wireless Algorithms, Systems,and Applications (Springer Berlin Heidelberg, Berlin, Germany, 2009),pp. 509–518
3. S Meiling, TC Schmidt, M Wahlisch, Large-scale Measurement and Analysis ofOne-Way Delay in Hybrid Multicast Networks (IEEE LCN 2012, Clearwater,Florida, USA, 2012), pp. 513–520
4. L Angrisani, D Capriglione, L Ferrigno et al., Type A Uncertainty in JitterMeasurements in Communication Networks (IEEE I2MTC 2011, Hangzhou,China, 2011), pp. 1–6
5. F Baccelli, S Machiraju, D Veitch et al., On Optimal Probing for Delay and LossMeasurement. Proceedings of the 7th ACM SIGCOMM conference onInternet measurement, San Diego, CA, USA, 2007, pp. 291–302
6. C Wang, J Liu, B Li et al., LRED: a robust and responsive AQM algorithmusing packet loss ratio measurement. Parallel Distribute Syst IEEE Transac18(1), 29–43 (2007)
7. A Kovac, M Halas, Analysis of influence of network performanceparameters on VoIP call quality. Knowledge in Telecommun TechnolOptics, 26–30 (2010)
8. H Oda, H Hisamatsu, H Noborio, A New Available Bandwidth MeasurementMethod Based on ImTCP (DICTAP2012, Bangkok, Thailand, 2012), pp. 343–347
9. F Lifu, Y Dongming, T Bihua et al., Technique for Network PerformanceMeasurement Based on RFC 2544 (IEEE CICN2012, Mathura, Uttar Pradesh,India, 2012), pp. 200–204
10. V Tanyingyong, M Hidell, P Sjodin, Using Hardware Classification to ImprovePC-Based OpenFlow Switching (IEEE HPSR 2011, Cartagena, Spain, 2011),pp. 215–221
11. S Bradner, J McQuaid, Benchmarking Methodology for Network InterconnectDevices (RFC 2544, Fremont, 1999)
12. Z Cai, W Zhao, J Yin et al., Using Passive Measuring to Calibrate Active MeasuringLatency, Information Networking, Convergence in Broadband and MobileNetworking (Springer Berlin Heidelberg, Berlin, Germany, 2005), pp. 198–206
13. YA Wang, C Huang, J Li et al., Queen: Estimating Packet Loss Rate betweenArbitrary Internet Hosts, Passive and Active Network Measurement (SpringerBerlin Heidelberg, Berlin, Germany, 2009), pp. 57–66
14. CB Both, C Battisti, FA Kuentzer et al., FPGA implementation andperformance evaluation of an RFC 2544 compliant Ethernet test set. Int JHigh Perform Syst Architecture 2(2), 107–115 (2009)
15. J Wu, J Zhang, Z Han et al., The Implementation of a High Speed EthernetTraffic Generator Based on FPGA. Adv Mater Res 433, 7530–7534 (2012)
16. A Tockhorn, P Danielis, D Timmermann, A Configurable FPGA-BasedTraffic Generator for High-Performance Tests of Packet Processing Systems(ICIMP 2011, St.Maarten, The Netherlands Antilles, 2011), pp. 14–19
17. A Friedl, S Ubik, A Kapravelos et al., Realistic Passive Packet Loss Measurementfor High-Speed Networks, Proceedings of the First International Workshop onTraffic Monitoring and Analysis (Springer Berlin Heidelberg, Berlin,Germany, 2009), pp. 1–7
18. F Strohmeier, P Dorfinger, B Trammell, Network Performance Evaluation Based onFlow Data (IEEE IWCMC 2011, Istanbul, Turkey, 2011), pp. 1585–1589
19. T Jones, Network Performance Measurement: Accuracy in Highspeed ProvideNetworks (IEEE MIPRO 2011, Opatija, Croatia, 2011), pp. 489–493
20. MD Schiffman, The Libnet Packet Construction Library, 2005.http://libnet.sourceforge.net/
doi:10.1186/1687-1499-2015-2Cite this article as: Wang et al.: An FPGA-based high-speed networkperformance measurement for RFC 2544. EURASIP Journal on WirelessCommunications and Networking 2015 1:2.
Submit your manuscript to a journal and benefi t from:
7 Convenient online submission
7 Rigorous peer review
7 Immediate publication on acceptance
7 Open access: articles freely available online
7 High visibility within the fi eld
7 Retaining the copyright to your article
Submit your next manuscript at 7 springeropen.com