Incorporating uncertainty into conceptual design of … Incorporating uncertainty into conceptual...
17
1 Incorporating uncertainty into conceptual design of space system architectures Daniel E. Hastings, Annalisa L. Weigel, Myles A. Walton MIT Engineering Systems Division & Department of Aeronautics and Astronautics Abstract The environment in which space systems are developed and operated can be classified as nothing less than dynamic. However, it is clear that the methods and tools relied on in conceptual design are based on static assumptions and leave little room for anything more than snapshots of the product and its environment. This paper introduces an approach to challenge that model and instead quantify and compare space system architectures around the central theme of uncertainty, with emphasis on policy uncertainty, as well as, technical and market uncertainty. Two cases of implementation are presented and three generalized principles are proposed that flow from the analysis: 1) engineering systems must be designed with uncertainty as one of the central organizing principles, 2) since engineering systems have management and social dimensions and thus involve human interactions, there is an irreducible uncertainty associated with these dimensions that will affect the design of the system, and 3) uncertainty in use may allow the engineering system to satisfy quite different missions from the original one intended. Introduction There has been much debate about what constitutes an engineering system and if there are any fundamental principles underlying the design and operation of these systems. In this paper we examine a particular class of engineering systems as a paradigm for what can be learned about the broader notions of engineering systems. The class of engineering systems that we will consider is military and commercial space system architectures. We will take the point of view in this paper that engineering systems are complex systems that are technologically enabled (i.e. depend for their existence on products created by technology and using technology). They are also systems that involve interactions at the enterprise or societal levels. The term space system architecture is used here to cover all the aspects of the space system and their interactions and interfaces that allow the function to be delivered to the users. For example, the Global Position System (GPS) [1] space system architecture delivers real time precise position and timing information to users on a worldwide basis. It is composed of 24 satellites in Medium Earth Orbit (MEO) that emit timing signals, a set of distributed ground stations that communicate with the satellites, a set of command and control centers that periodically inform the satellites of their positions and the user handsets that calculate time and position based on the signals from four GPS satellites. We choose to focus on military and commercial space systems rather than scientific space systems (e.g Hubble or Galileo) because they have the following properties. They are technologically enabled, complex (literally “rocket science”), global in scale (literally in the sense that the functions of such systems can be delivered all over the globe) and involve direct interactions with large numbers of people (in the military case with large numbers of dispersed forces, both friendly and hostile, in the commercial case with large markets needing
Transcript of Incorporating uncertainty into conceptual design of … Incorporating uncertainty into conceptual...

1
Incorporating uncertainty into conceptual design ofspace system architectures
Daniel E. Hastings, Annalisa L. Weigel, Myles A. Walton
MIT Engineering Systems Division &Department of Aeronautics and Astronautics
AbstractThe environment in which space systems are developed and operated can be classified as nothingless than dynamic. However, it is clear that the methods and tools relied on in conceptual designare based on static assumptions and leave little room for anything more than snapshots of theproduct and its environment. This paper introduces an approach to challenge that model andinstead quantify and compare space system architectures around the central theme of uncertainty,with emphasis on policy uncertainty, as well as, technical and market uncertainty. Two cases ofimplementation are presented and three generalized principles are proposed that flow from theanalysis: 1) engineering systems must be designed with uncertainty as one of the centralorganizing principles, 2) since engineering systems have management and social dimensions andthus involve human interactions, there is an irreducible uncertainty associated with thesedimensions that will affect the design of the system, and 3) uncertainty in use may allow theengineering system to satisfy quite different missions from the original one intended.
IntroductionThere has been much debate about what constitutes an engineering system and if there are anyfundamental principles underlying the design and operation of these systems. In this paper weexamine a particular class of engineering systems as a paradigm for what can be learned aboutthe broader notions of engineering systems. The class of engineering systems that we willconsider is military and commercial space system architectures. We will take the point of view inthis paper that engineering systems are complex systems that are technologically enabled (i.e.depend for their existence on products created by technology and using technology). They arealso systems that involve interactions at the enterprise or societal levels.
The term space system architecture is used here to cover all the aspects of the space system andtheir interactions and interfaces that allow the function to be delivered to the users. For example,the Global Position System (GPS) [1] space system architecture delivers real time preciseposition and timing information to users on a worldwide basis. It is composed of 24 satellites inMedium Earth Orbit (MEO) that emit timing signals, a set of distributed ground stations thatcommunicate with the satellites, a set of command and control centers that periodically informthe satellites of their positions and the user handsets that calculate time and position based on thesignals from four GPS satellites. We choose to focus on military and commercial space systemsrather than scientific space systems (e.g Hubble or Galileo) because they have the followingproperties. They are technologically enabled, complex (literally “rocket science”), global in scale(literally in the sense that the functions of such systems can be delivered all over the globe) andinvolve direct interactions with large numbers of people (in the military case with large numbersof dispersed forces, both friendly and hostile, in the commercial case with large markets needing

2
communications or remote sensing). Typically, scientific systems have direct interactions withsmall numbers of scientists and the interaction at the societal level is through the support ofnational governments. For example, Hubble operations are funded through NASA that is fundedby the US Congress but the direct recipients of the functions of Hubble are a small number ofastronomers.
An excellent example of a complex space system architecture can be seen by looking at thesystems that provide worldwide military communications. The national military strategy relieson information superiority and the need for worldwide communications has increaseddramatically in recent years. In Desert Storm, the total data rate required was 100 Mbps whileAllied Force, which deployed a force only 10% of the size of that used in Desert Storm forces,required 250 Mbps. This increased data rate was provided largely by commercial geo-synchronous satellite communication architectures (over 75% by the end of Allied Force)supplemented by highly protected military communication satellites. The highly protectedmilitary satellite communications architecture right now is several MILSTAR satellites [1].These are designed to provide worldwide communications to the National Command Authorityin the event of a nuclear conflict. Thus, the architecture consists of some very complex andexpensive satellites along with ground stations combined with less expensive commercialsatellites with more capacity but owned by different stakeholders.
The DoD also makes heavy use of other complex satellite architectures. The Defense SupportProgram (DSP) [1] provides missile warning at both the strategic and tactical level. This consistsof a set of geo-synchronous infrared sensing satellites, a set of communication links, and adistributed set of information fusion centers as well as trained operators who interpret the data.The Global Positioning System as discussed above provides precision navigation and timingservices worldwide.
DSP, MILSTAR and GPS are all examples of (military) space system architectures. They have anumber of characteristics that are of interest from the viewpoint of engineering systems. On thepositive side, they are very high performance systems. In the case of DSP they give the US astrategic warning capability that only the Soviets matched. In the case of GPS, they have helpedcreate a whole new industry based around knowing one’s position (Hertz NeverLost, plowingwith GPS etc) as well as leading to a new way of fighting wars where bombs can be aimed asaccurately as bullets. However, they have proven to be expensive to build (MILSTAR costingover a billion per satellite) and/or operate (GPS costing hundreds of millions a year to operateeven though the satellite cost is only approximately 30 million per unit).
These space system architectures traditionally define “cutting edge technology”. However, whilemost often these architectures, once constructed, deliver excellent performance, it is extremelyrare that they deliver the initially promised performance on the initially proposed cost andschedule. There are several reasons for this but a large amount of the blame lies in the fact thatthere is a little understanding of how to incorporate uncertainty into the design process.
The development of space systems is subject to not only cost, technical and market uncertainties,but also to uncertainties from the policy domain. This paper introduces an approach to quantifyand compare space system architectures under uncertainty, with emphasis on policy uncertaintyas well as technical and market uncertainty. We then use the results to draw larger conclusionswith respect to engineering systems.

3
The structure of the paper is as follows. We first define the major sources of uncertaintyassociated with military and commercial space system architectures. We then describe how weconstruct simulations of space system architectures in a way that allow both structured andunstructured uncertainty to be included and allow us to see large tradespaces of architectures andnot just point designs. We then describe two specific architectural tradespaces. One is for anionospheric mapper that will allow improvement in the ability to predict the effect of theionosphere on GPS signals. The second is for a broadband communications architecture that willdeliver space based T1 links to portable users on a worldwide basis. We use these twoarchitectures as examples to illustrate the effects of market based, policy and technicaluncertainty on the design of these types of systems. Finally we wrap up by considering thebroader lessons for engineering systems.
Major Sources of UncertaintyIt is not trivial that this paper’s content is focused on uncertainty, rather than risk. Uncertainty inthis context is defined as our inability to deterministically predict an architecture’s value to thestakeholders of the system, i.e. company, customer, shareholders, users etc. This is in contrast tothe term risk that almost always reflects a negative meaning of the probability of loss or injury.The delineation is important, as it opens the research to aspects of uncertainty that may in fact bepositive.
Table 1: Uncertainty Categorization
Development Uncertainty Operational Uncertainty
Political Uncertainty- uncertainty ofdevelopment funding instability
Political Uncertainty- uncertainty ofoperational funding instability
Requirements Uncertainty-uncertainty of requirements stability
Lifetime Uncertainty - uncertainty ofperforming to requirements in a givenlifetime
Development Cost Uncertainty-uncertainty of developing within agiven budget
Obsolescence Uncertainty – uncertainty ofperforming to evolving expectation in a givenlifetime
Development Schedule Uncertainty-uncertainty of developing within agiven schedule profile
Integration Uncertainty – uncertainty ofoperating within other necessary systems
Development TechnologyUncertainty- uncertainty oftechnology to provide performancebenefits
Operations Cost Uncertainty – uncertainty ofmeeting operations cost targets
Market Uncertainty-uncertainty in meetingdemands of an unknown market
Model Uncertainty
The first step in any uncertainty analysis should be to develop a holistic view of uncertainties ofpotential architectures that enumerates all of the primary sources of risk over the lifecycle of the

4
space system. The uncertainty structure that was developed is presented in Table 1. Thischaracterization helps to both encompass the various types of uncertainty but also serves as aframework for discussion.
From an aerospace perspective, the life-cycle view on uncertainty is significant because itsoperational existence is as significant as the development perspective. The reason this istypically overlooked is that the contractors and buyers are imminently interested in delivery ofthe product within time and fiscal constraints. The operational context is therefore a secondarypriority. However, this framework gives us the opportunity to focus on the life-cycle uncertaintyas life-cycle value has evolved to a design driver and decision criteria.
Quantifying Uncertainty in Space System ArchitecturesRisk and uncertainty are major decision criteria in the pursuit of space system design, and yet theability to quantify and provide uncertainty information is not satisfactory. From interviews withspace architects and policy decision makers, uncertainty and risk analysis in conceptual design inthe space industry at present can be characterized as qualitative, expert driven and point based.Moreover, uncertainties are evaluated individually, assessed and addressed as unique and anycalculations of these uncertainties are not embedded in the end models of the designs. Finally,they are usually accounted for after a point design of an architecture has been chosen.
A more complete approach to design would provide a method for enabling the quantificationand aggregation of uncertainty, as well as an approach to integrate that information into thedesign models in the earliest stage of the design. We present two examples of incorporatinguncertainty into the conceptual design of space systems in this paper. Both are enabled by aconceptual design technique that provides for the exploration of potential architectures that webriefly describe in the next section.
Modeling of Space System Architectures: GINA and MATEGINA and MATE analysis techniques enable mathematical modeling of many architecturecandidates, and evaluation of those candidates in various cost-performance tradespaces. GINA isthe Generalized Information Network Analogy methodology, which had its beginnings at MIT.MATE is the Multi-Attribute Tradespace Exploration methodology, which also had itsbeginnings at MIT and built upon the GINA work.
The GINA methodology [2, 3], allows for the rapid comparison of space systems bymathematically modeling them as information transfer networks. GINA "is a hybrid ofinformation network flow analysis, signal and antenna theory, space systems engineering andeconometrics, and specifies measurable, unambiguous metrics for the cost, capability,performance and adaptability of any space system" whose mission is communications,navigation or remote sensing. GINA specifies satellite system attributes as either part of a"design vector" or a "constants vector." Attributes in the design vector vary across a givenrange, and distinguish one space system from another. Attributes in the constants vector remainunchanged across all space systems under consideration.
Rapid increases in computing power allowed GINA to expand over the years. Further work bythe Space Systems Laboratory extended GINA analysis to examine thousands of architecturessimultaneously, whereas Shaw [3] examined hundreds simultaneously. Jilla et al. [4] worked on

5
incorporating optimization algorithms into GINA to efficiently search a very large tradespaceenabled hundreds of thousands of architectures to be analyzed simultaneously.
MATE builds upon the GINA research, and generalizes space system performance modelingfrom an absolute cost-per-function scale to a scale based on the concept of utility in economictheory. As in GINA, MATE separates architecture attributes into two categories: Design vectorand constants vector. The performance measure for MATE is not cost-per-function like GINA,but a utility of the space system. Overall utility is measured on several component dimensionsby using certainty equivalent lotteries with the space system customer. While utility is not anabsolute measure, it is a useful relative measure for comparing how well different space systemcandidates satisfy a user's needs [5].
MATE has been applied to a series of space system designs projects, including B-TOS and C-TOS. B-TOS is a terrestrial observer swarm of symbiotic distributed satellites whose mission isto map the ionosphere. BTOS is the first example case that is discussed using the GINA/MATEframework. C-TOS undertook the detailed design of the space part of the architecture defined inB-TOS.
B-TOS Case StudyB-TOS is a space-based atmospheric mapping mission to characterize the structure of theionosphere using topside sounding techniques. Accomplishment of this mission on a globalbasis enables more precise corrections to GPS. The three primary goals of B-TOS are:
• Measurement of the ionosphere topside electron density profile• Measurement of angle of arrival of signals from ground-based beacons• Measurement of localized ionospheric turbulence
To accomplish these goals, the B-TOS space system uses a swarm architecture of distributedsmall satellites in multiple collaborating clusters. B-TOS is required to maintain at least aminimum altitude for topside sounding, operate at a frozen orbital inclination of 63.4 degrees,and use the Tracking and Data Relay Satellite System operated by NASA for communicationwith the ground. This is shown in Fig 1.
Figure 1. Conceptual rendering of a swarm of mother and daughter satellites performing topside sounding.

6
GINA and MATE analysis techniques were used to develop the B-TOS mission architecturecandidates. The B-TOS GINA/MATE design vector and resulting tradespace enumeration isshown in Table 2. The completely enumerated B-TOS tradespace encompassed over 4000unique architectures for the mission. Each architecture was evaluated for how much utility itprovided the end user, as well as how much the architecture cost. The mapping of these twomeasures into utility-cost space produces a Pareto optimal frontier of B-TOS architectures asshown in Figure 2. A Pareto optimal solution is one that can’t be improved in one dimensionwithout sacrificing “goodness” in another dimension. Five architectures along the frontier areespecially interesting, as they represent places on the frontier where its slope changes. These arethe points labeled A, B, C, D, and E on Figure 2 and their corresponding design vector values areshown in Table 3 and Table 4 [6].
Table 2. B-TOS design vector variables and values.
Design Vector Variable Values
Circular orbit altitude (km) 1100, 1300
Number of orbital planes 1, 2, 3, 4, 5
Number of swarms per plane 1, 2, 3, 4, 5
Number of satellites per swarm 4, 7, 10, 13
Radius of swarm (km) 0.18, 1.5, 8.75, 50
Payload capability 5 configurations of number of sounding antennas andcapability, short and long range communicationcapability, and on-board data processing capability
Table 3. B-TOS Pareto optimal frontier architecture attributes.
Point A B C D EAltitude (km)Num of PlanesSwarms/Plane 1 1 1 1 2Satellites/Swarm 4 7 10 13 13Swarm Radius (km) 0.18 1.5 8.75 50 50Functionality Study
<-- 1100 --><-- 1 -->
<-- #5 -->
Table 4. B-TOS payload functionality attributes for Pareto optimal architectures A, B, C, D, and E.
Functionality Study
Spacecraft Type Mother Daughter
Number 1 3+
Payload (Tx) Yes NoPayload (Rx) Yes Yes
Processing Yes No
TDRSS Link Yes No
Intra-Swarm Link Yes Yes
5
7
0.98
0.985
0.99
0.995
1
100 1000
Lifecycle Cost ($M)
Uti
lity
A
ED
C
B
0.98
0.985
0.99
0.995
1
100 1000
Lifecycle Cost ($M)
Uti
lity
AA
EEDD
CC
BB
Figure 2. The B-TOS architecture tradespace plotted in cost-utility space.
In the discussions that follow, architecture candidates will frequently be represented in cost-utility space as they are in Figure 2. Each dot on Figure 2 represents a single and unique spacesystem architecture that can accomplish the mission, with its corresponding cost and utility.Note that the representation in Fig. 2 does not take uncertainty into account. Each pointrepresents an architecture that is assumed to deliver its nominal performance at its nominal cost.Plots like this are most useful for illustrating how easy it is to define a bad point design (i.e. onethat deliver low utility at high cost) and for finding the optimal front of architectures (i.e.,A,B,C,D,E). We will return to the BTOS case study to discuss policy uncertainty and itsimpacts, but first we introduce a second case study and an uncertainty analysis approach thatexplores the potential of portfolios of solutions as a means to manage uncertainty.
Broadband Case Study ExampleThe struggle of delivering broadband infrastructure has been the focus of a number of recentcommercial endeavors, ranging in implementation concepts from wired options like cable andDSL to wireless delivery options either through ground, air or space based sources. The mostsuccessful implementations thus far have been through ground-based systems; however, there arealso companies seriously exploring the capabilities a space-based platform provides. Theprimary benefits of a space broadband system over that of any ground based system is that spacesystems have less reliance on any preexisting ground infrastructure and can serve changingand/or rapidly growing markets more effectively through the repositioning of satellites andadding more capacity to the systems through increasing the complement of space assets orsatellite upgrades. Locations where satellite based services have advantages over land-basedsystems include economically developing nations with little pre-existing infrastructure, sea based

8
platforms and air based platforms, and remote locations that have little access to land basedsystems. Space based broadband systems also have the potential to compete even in marketswhere infrastructure is widespread and competitors already serve customers. This phenomenoncan be seen in the satellite TV industry where satellite based TV broadcast customers represent asignificant share of the overall market. Through competitive pricing strategies and productdifferentiation, DirecTV and others have proven that space based systems are viable competitorswith other platforms.
This case study explores the systems analysis of such a space based broadband architecture. Thiscommercial venture allows the demonstration of the uncertainty analysis framework in a contextthat includes aspects of model and market uncertainty. Numerous examples of the effects ofmarket uncertainty can be seen on the space industry, ranging from uncertainties in launchvehicle capacity to meet the evolving needs of low earth satellite delivery to market uncertaintiesthat defined bankruptcies in the case of Iridium and GlobalStar space systems. Where the majordecision criteria for a complex system is market driven, market uncertainties should always beconsidered
The goal of the systems analysis is to explore the tradespace of potential architectures that satisfya recognized need for a broadband communications infrastructure. The major feature of thearchitectural concept consists of a satellite network complemented by ground stations. While wehave chosen to model a space system to service this market, we have not defined the details ofthe architecture and have left them open for defining the tradespace. Six tradable parameters inthe design vector define the boundaries of the tradespace. These are altitude, inclination,satellites per plane, number of orbital planes, payload power, and the area of the phased arrayantenna. These characteristics and their possible values are given in Table 5.
Table 5: Design vector for the Broadband Communication Satellite System
Name Description Potential ValuesAltitude Altitude for a defined circular orbit LEO(1500km),
MEO(20184km),GEO(35786km)
Inclination The inclination of the circular orbits. 0-90˚Satellites per Plane The number of satellites in each of the
occupied planes1-8
Number of Planes The number of orbital planes that thesatellite constellation occupies
1-10
Payload Power Downlink power from an individualsatellite
1kW-10kW
Phased Array Area Area in square meters of the total phasedarray antenna area
1-5m2
In addition to the six elements in the design vector, there are also a number of variables that areheld constant for all architectures in the tradespace or computed as intermediate variablesthrough the GINA approach.

9
Design Vector
Simulation Modules
Satellite sizing
Orbit analysis
Coverage analysis
Capacity Analysis
Launch analysis
Cost Analysis
Performance assessment
Constants Vector
Figure 3: Systems Simulation Flow
Figure 3 describes the simulation flow that was employed in this case study, based on work byKashitani [7]. The model is initiated with the definition of a constants vector that containsparameters of the designs that should remain constant across all of the architectures that arebeing evaluated. Examples of constants in the Broadband model are scientific constants, such asthe earth’s radius, and conversion factors. Other constants that are included in the Broadbandmodel are market constants such as market size and distribution, satellite sizing ratios, andlaunch vehicle performance. Each box in Figure 3 represents an individual software module andeach arrow represents the flow of inputs and outputs.
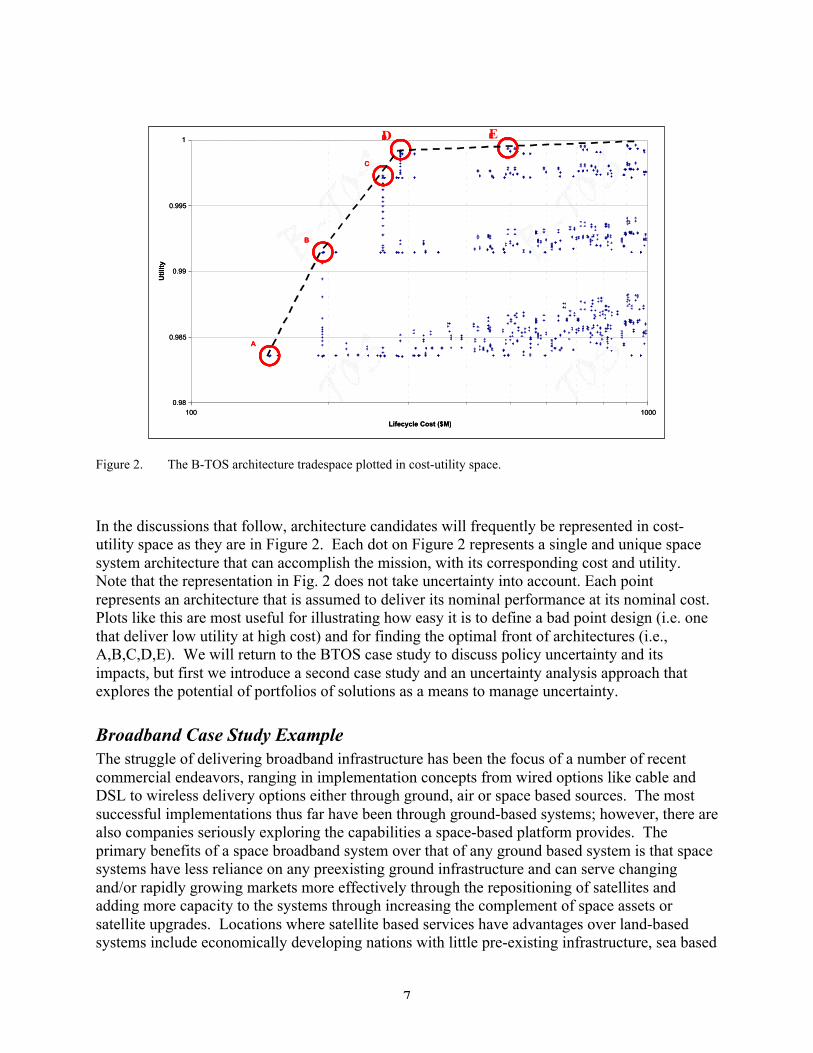
Model ResultsFrom the broadband GINA model, thousands of architectures were evaluated. A set of Paretooptimal architectures in terms of subscriber hours and total system cost were found. In Fig. 4only the architectures on the optimal front are shown. The architectures in the upper right of theplot are LEO based systems (such as Teledesic) while the ones in the lower left are GEO basedsystems such as Spaceway.
10
Figure 4: Commercial Broadband System Pareto Optimal Front
Market and Model UncertaintyWe have introduced two case studies. We first look at market and model uncertainties associatedwith the broadband case and then consider policy uncertainty associated with the mappingmission.
Table 6 presents the various sources of uncertainty that were considered in the Broadband casestudy. Because the Broadband GINA model is relatively coarse, a good deal of the uncertaintywe are quantifying arises from the rules of thumb that are being used in the model simulation togenerate results. However, because of the commercial nature of the case, market uncertaintiesare also introduced.
Table 6: Sources of uncertainty considered in Broadband Case
Total Market SizeMarket CapturePayload Power per Unit MassMass Fraction of the Payload with respect to Dry MassFraction of Dry Mass in WetmassDensity of SatelliteDiscount RateTheoretical First Unit Cost per Kilogram
11
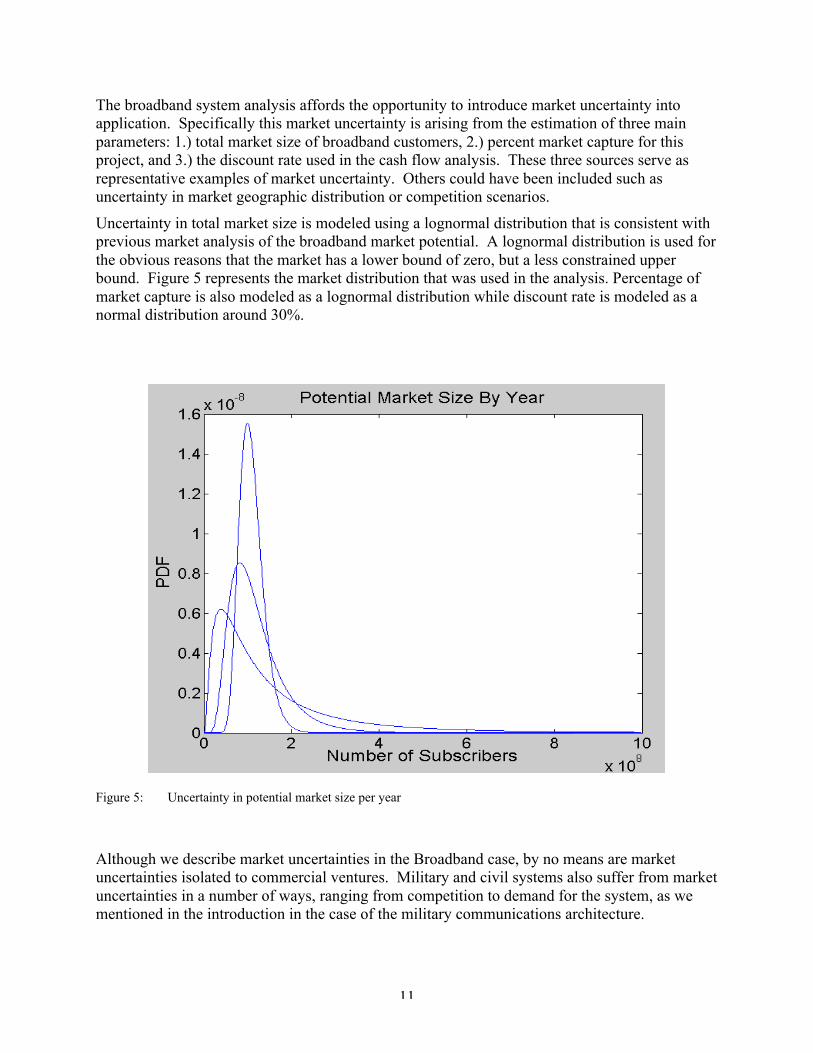
The broadband system analysis affords the opportunity to introduce market uncertainty intoapplication. Specifically this market uncertainty is arising from the estimation of three mainparameters: 1.) total market size of broadband customers, 2.) percent market capture for thisproject, and 3.) the discount rate used in the cash flow analysis. These three sources serve asrepresentative examples of market uncertainty. Others could have been included such asuncertainty in market geographic distribution or competition scenarios.
Uncertainty in total market size is modeled using a lognormal distribution that is consistent withprevious market analysis of the broadband market potential. A lognormal distribution is used forthe obvious reasons that the market has a lower bound of zero, but a less constrained upperbound. Figure 5 represents the market distribution that was used in the analysis. Percentage ofmarket capture is also modeled as a lognormal distribution while discount rate is modeled as anormal distribution around 30%.
Figure 5: Uncertainty in potential market size per year
Although we describe market uncertainties in the Broadband case, by no means are marketuncertainties isolated to commercial ventures. Military and civil systems also suffer from marketuncertainties in a number of ways, ranging from competition to demand for the system, as wementioned in the introduction in the case of the military communications architecture.
12
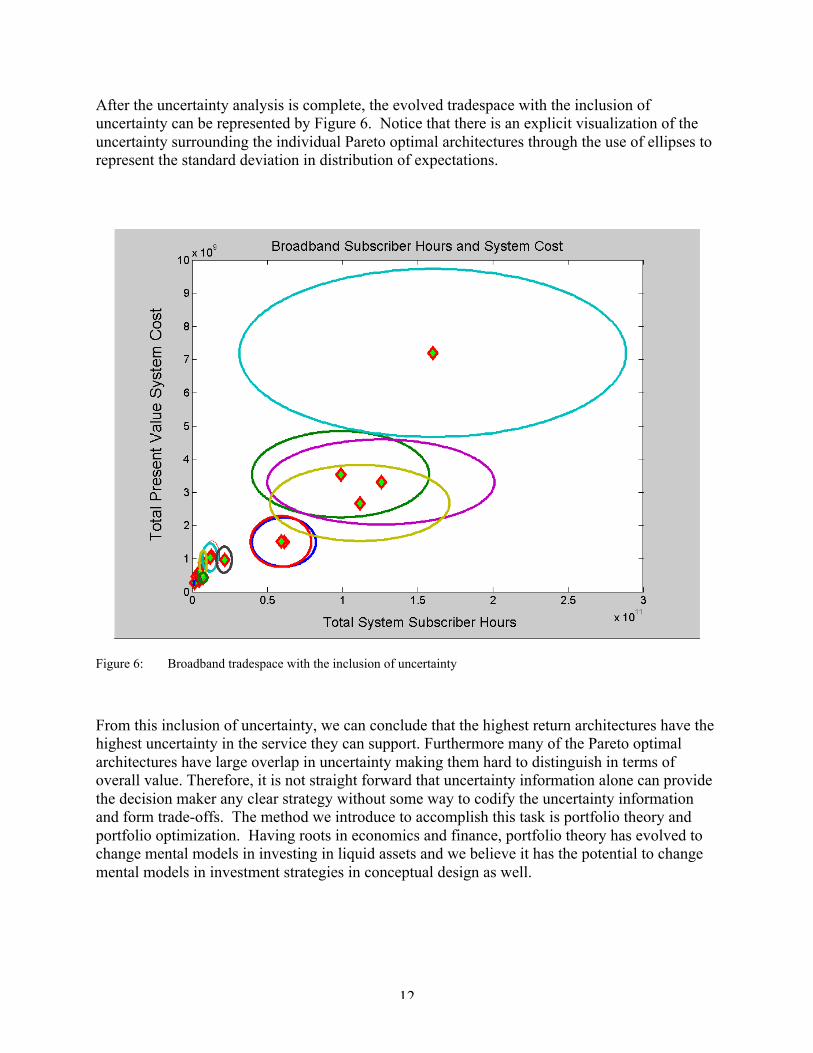
After the uncertainty analysis is complete, the evolved tradespace with the inclusion ofuncertainty can be represented by Figure 6. Notice that there is an explicit visualization of theuncertainty surrounding the individual Pareto optimal architectures through the use of ellipses torepresent the standard deviation in distribution of expectations.
Figure 6: Broadband tradespace with the inclusion of uncertainty
From this inclusion of uncertainty, we can conclude that the highest return architectures have thehighest uncertainty in the service they can support. Furthermore many of the Pareto optimalarchitectures have large overlap in uncertainty making them hard to distinguish in terms ofoverall value. Therefore, it is not straight forward that uncertainty information alone can providethe decision maker any clear strategy without some way to codify the uncertainty informationand form trade-offs. The method we introduce to accomplish this task is portfolio theory andportfolio optimization. Having roots in economics and finance, portfolio theory has evolved tochange mental models in investing in liquid assets and we believe it has the potential to changemental models in investment strategies in conceptual design as well.
13
Portfolio Theory Applied to Space SystemsBased around the central premise of maximizing return subject to a given level of risk aversion,portfolio theory has evolved since its introduction by Markowitz to a central paradigm ininvestment [8]. We briefly explain and apply portfolio theory to the broadband commercialspace systems previously described to point out the potential that such an approach can have onthe design of space systems.
Once the outcome distributions for individual architectures have been captured, portfolio theorycan be directly applied to the problem of identifying an optimal investment strategy for adecision maker to pursue. [By investment strategy here we imply investment of resources (time,money, etc.) in architectural designs to develop]. Equation 1 presents the portfolio optimizationalgorithm, where r represent the expected value from the architecture, k represent the riskaversion coefficient, Q represents the covariance matrix and w is the vector that contains therelative investment of each architecture in the tradespace.
0..
1..
2max
1
?
=
−
�=
wTS
wTS
Qwwk
wr
n
ii
TT
(1)
Equation 1: Portfolio Optimization Algorithm
The power of portfolio optimization is the ability to allow trade-offs of portfolios along the lineof value and uncertainty, subject to a given decision makers level of aversion to risk. Further,the approach incorporates the idea of uncorrelated behavior under uncertain conditions which inthe end allow for diversification of investment that can result in higher returns for a given levelof uncertainty than would otherwise be possible.
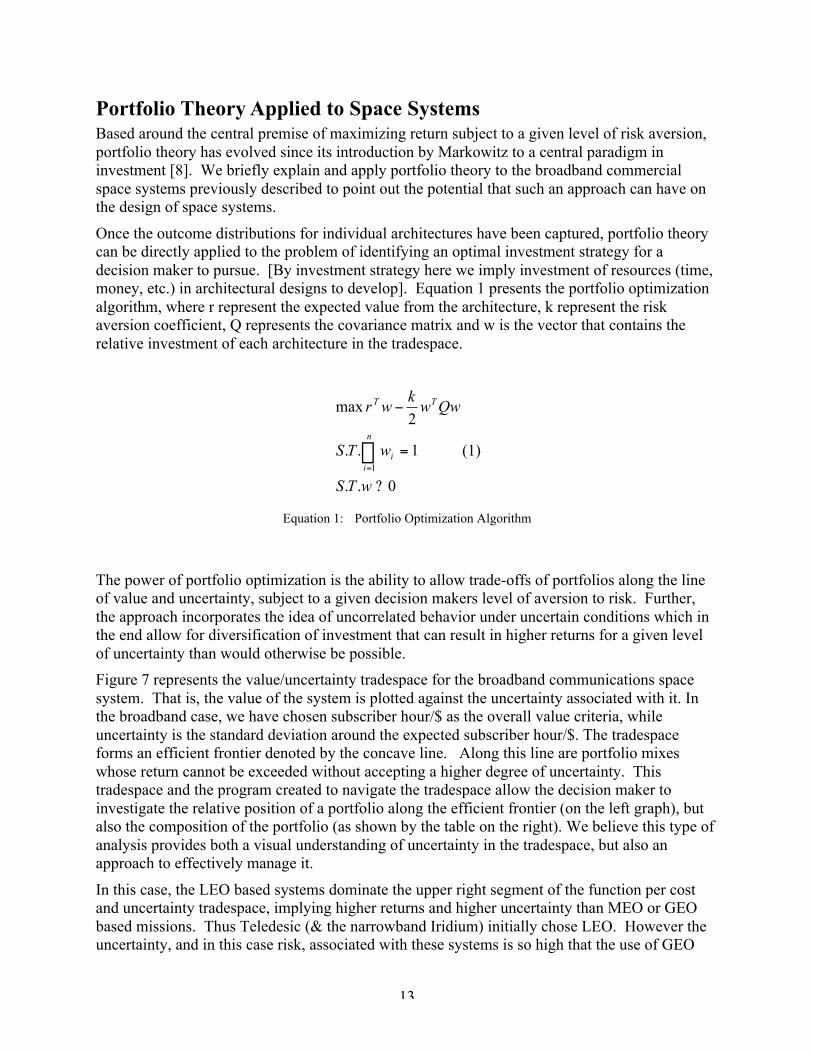
Figure 7 represents the value/uncertainty tradespace for the broadband communications spacesystem. That is, the value of the system is plotted against the uncertainty associated with it. Inthe broadband case, we have chosen subscriber hour/$ as the overall value criteria, whileuncertainty is the standard deviation around the expected subscriber hour/$. The tradespaceforms an efficient frontier denoted by the concave line. Along this line are portfolio mixeswhose return cannot be exceeded without accepting a higher degree of uncertainty. Thistradespace and the program created to navigate the tradespace allow the decision maker toinvestigate the relative position of a portfolio along the efficient frontier (on the left graph), butalso the composition of the portfolio (as shown by the table on the right). We believe this type ofanalysis provides both a visual understanding of uncertainty in the tradespace, but also anapproach to effectively manage it.
In this case, the LEO based systems dominate the upper right segment of the function per costand uncertainty tradespace, implying higher returns and higher uncertainty than MEO or GEObased missions. Thus Teledesic (& the narrowband Iridium) initially chose LEO. However theuncertainty, and in this case risk, associated with these systems is so high that the use of GEO

14
based designs, while returning lower performance, can be a better choice for a risk aversedecision maker. This is the path that most other commercial systems have chosen to take. Eventhe commercial systems that initially went with more risk have been forced by the market realtiesof raising money to focus on the MEO and GEO systems. More generally, this case illustratesthat the best way to consider the design may be to consider portfolios of architectures and carrybalanced diverse sets of designs as long as the possibility exists to diversify uncertainty.
Figure 7: Portfolio Tradespace of Broadband Communications System
Policy UncertaintyIn the last section, we analyzed market/model uncertainties. In this section, we consider adifferent class of uncertainties namely policy uncertainties but model them with the sameconceptual approach.
Budget changes are the most frequently reported action taken by policy makers, and it is not hardto understand why. Government and military space system programs are subject to budgetapprovals each year by their own agencies as well as the Congress. Each year, a program’sbudget can – and frequently does – change. For fiscal years 1996-1998, 32% of defenseprograms experienced a budget reduction, 53% experience a budget increase and only 15%

15
received the budget they requested. Hence a space architect can conclude that the probabilitythat the budget will be changed is much larger than the probability that it will stay on thenominal plan. Thus, budget uncertainty is perhaps the most pervasive policy uncertainty facinggovernment and military systems today. This is due to the nature of the competing stakeholderdemands that are balanced and adjudicated through the budget resolution process each year.Since these are constantly shifting, the budget for any given system will be subject to this kind ofuncertainty. Thus this uncertainty is irreducible based on human behavior and the nature of thebudget process. Unlike technical uncertainty, which can often be reduced this kind is unlikely tochange except in dire emergencies.
Potential effects of budget uncertainty can be examined during conceptual design of spacesystem architectures, and these effects can better inform architecture choices that will be robustto budget changes. After space system architectures are modeled with GINA and MATEtechniques, the effects of budget changes can be explored by varying the yearly budget allocationfor the program. When the yearly budget level is pushed below the nominal yearly budget levelfor a given architecture, that architecture’s schedule will need to be extended to accommodatethe lower yearly budget level. Using historical data relating program schedule extension data toresulting program cost increases, the extra cost of extending the program schedule can becalculated. This is the cost a program bears if it should fall subject to a budget reduction.
A government space system program manager contemplating which of many Pareto optimalarchitectures to choose should be aware of how each of those Pareto architectures behavesrelative to varying yearly program budget levels. Program budget increases or appropriationsequal to requests will not in theory inhibit a program from meeting its original cost and schedulegoals. However, budget reductions are likely to do this. If an architecture is initially selected,and later the Congress chooses to reduce the budget available each year for that program, theprogram will likely incur a cost overrun as well as a schedule slippage according to historicaldata. These effects in turn draw increased Congressional oversight to a program, increasing itschances for being cancelled altogether in future years. This is one vivid example of why aprogram manager should be concerned about budget uncertainty on his or her program, and inparticular, about downside risks.
Perfo
rman
ce
Cost cmaxcmin
pmin
pmaxCritical stage transition point variables:• pmax and pmin defines the range of acceptable
performance for the program
• cmax represents the cost of the architecture on the pareto front with pmax
• cmin represents the cost of the architecture on the pareto front with pmin
Figure 8. Parameters associated with Pareto front set of architectures in cost and performance space.
16
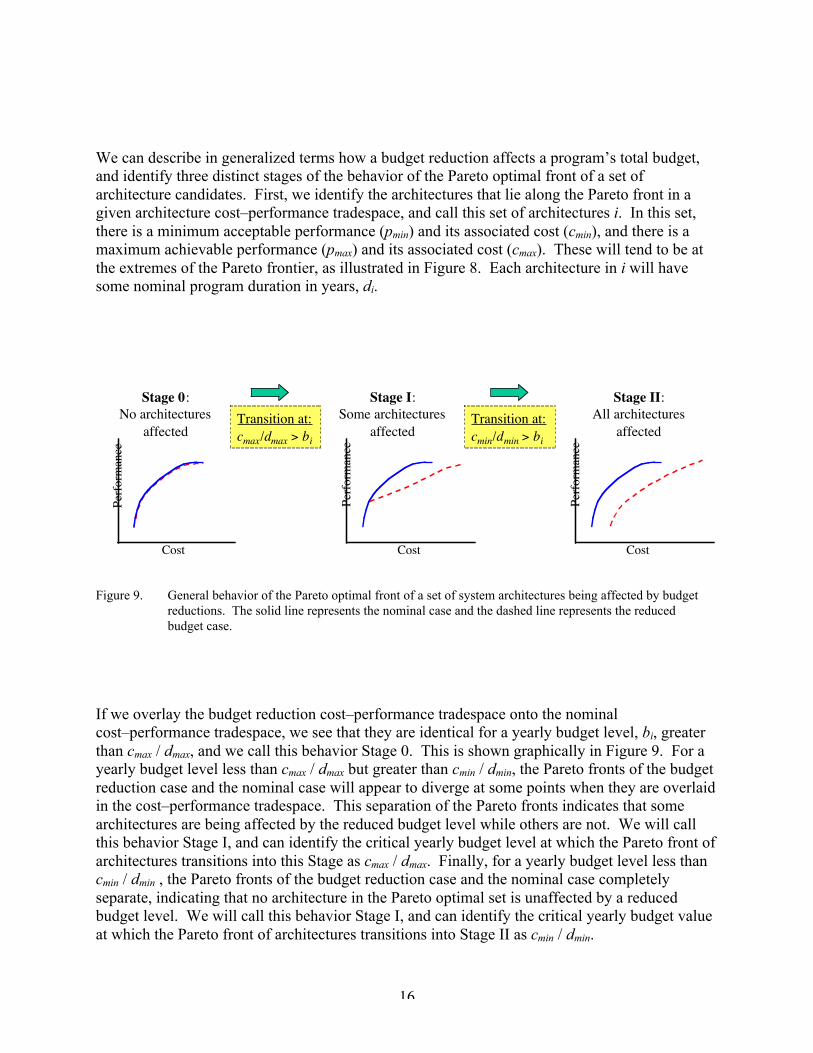
We can describe in generalized terms how a budget reduction affects a program’s total budget,and identify three distinct stages of the behavior of the Pareto optimal front of a set ofarchitecture candidates. First, we identify the architectures that lie along the Pareto front in agiven architecture cost–performance tradespace, and call this set of architectures i. In this set,there is a minimum acceptable performance (pmin) and its associated cost (cmin), and there is amaximum achievable performance (pmax) and its associated cost (cmax). These will tend to be atthe extremes of the Pareto frontier, as illustrated in Figure 8. Each architecture in i will havesome nominal program duration in years, di.
Stage 0:No architectures
affected
Stage I:Some architectures
affected
Stage II:All architectures
affectedTransition at:cmax/dmax > bi
Transition at:cmin/dmin > bi
Perfo
rman
ce
Perfo
rman
ce
Perfo
rman
ce
Cost Cost Cost
Figure 9. General behavior of the Pareto optimal front of a set of system architectures being affected by budgetreductions. The solid line represents the nominal case and the dashed line represents the reducedbudget case.
If we overlay the budget reduction cost–performance tradespace onto the nominalcost–performance tradespace, we see that they are identical for a yearly budget level, bi, greaterthan cmax / dmax, and we call this behavior Stage 0. This is shown graphically in Figure 9. For ayearly budget level less than cmax / dmax but greater than cmin / dmin, the Pareto fronts of the budgetreduction case and the nominal case will appear to diverge at some points when they are overlaidin the cost–performance tradespace. This separation of the Pareto fronts indicates that somearchitectures are being affected by the reduced budget level while others are not. We will callthis behavior Stage I, and can identify the critical yearly budget level at which the Pareto front ofarchitectures transitions into this Stage as cmax / dmax. Finally, for a yearly budget level less thancmin / dmin , the Pareto fronts of the budget reduction case and the nominal case completelyseparate, indicating that no architecture in the Pareto optimal set is unaffected by a reducedbudget level. We will call this behavior Stage I, and can identify the critical yearly budget valueat which the Pareto front of architectures transitions into Stage II as cmin / dmin.

17
These Stages identified above are guidelines for a program manager. A range of likely yearlyprogram budgets can be examined to determine if they put the program architecture Pareto frontinto Stage 0, I, or II. If a program falls in Stage 0 for all likely yearly budgets, then a programmanager can feel more confident in selecting any architecture candidate since they are all robustto the anticipated range of budget uncertainty. If a program falls in Stage I, then a programmanager may want to consider robustness to budget uncertainty as a criteria in selecting a finalsystem architecture, since cost and schedule overruns that can result from budget uncertainty willincrease oversight and the probability of cancellation later on. Lastly, if a program falls in StageII, then none of the architecture candidates are robust to budget uncertainty, and a programmanager will want to take some action to avoid potential repercussions in the program’s future.These might include (but are not limited to) generating new budget-robust architecturecandidates to choose from, seeking increased protection from budget uncertainty from agencydirectors, or making a stronger case to appropriators for a larger budget.
Case study application: B-TOSThe budget uncertainty analysis was applied to the B-TOS mission. The performance and costattributes of the Pareto optimal set of five architectures is shown in Figure 10, along with thecritical values that describe the transition points between Stages 0, I, and II. The five Paretooptimal architectures in cost–performance tradespace are shown in Figure 2, and are labeled A,B, C, D, and E. Figure 10 (a) – (d) graphically shows the overlay of the nominal and the budgetreduction cases for decreasing levels of yearly program budgets.
We find that the Stage 0 to Stage I transition occurs at $80.3M/yr, and the Stage I to Stage IItransition occurs at $18.6M/yr. Since B-TOS is a small military mission, the likelihood of itsinitially receiving or sustaining an $80M/yr budget is probably very small (typically suchmissions stay under $20-50M/yr). Thus, a program manager concerned with budget uncertaintymay not want to choose architecture candidate E, even though it is the highest performingarchitecture, because it is adversely affected by yearly budgets below $80M/yr. If the programmanager foresees that a yearly budget of perhaps $25M/yr is far more likely for a small militarymission, then architecture candidate A would be a good choice, because it is robust to budgetuncertainty. But if the yearly budgets for small military missions are more likely to be in the$5M - $10M /yr range, then none of these Pareto front architecture candidates for B-TOS wouldbe robust to budget uncertainty. So what is the B-TOS program manager to do now?Unfortunately, a small military mission is unlikely to warrant the agency director making aspecial effort to fence this one particular program’s budget, and it is also unlikely to attract muchsupport from appropriators who have larger concerns. If these are the case, the program managerand the program team may then wish to return to the drawing board and come up with lessexpensive architecture alternatives, or perhaps descope the program’s requirements in an effortto create a budget robust architecture choice.