DEVELOPMENT OF A PARACORPOREAL...
185
DEVELOPMENT OF A PARACORPOREAL RESPIRATORY ASSIST LUNG (PRAL) by Robert George Svitek B.S. in Bioengineering, University of Pittsburgh, 2000 Submitted to the Graduate Faculty of the School of Engineering in Partial Fulfillment of the Requirements for the degree of Doctor of Philosophy University of Pittsburgh 2006
Transcript of DEVELOPMENT OF A PARACORPOREAL...

DEVELOPMENT OF A PARACORPOREAL RESPIRATORY ASSIST LUNG (PRAL)
by
Robert George Svitek
B.S. in Bioengineering, University of Pittsburgh, 2000
Submitted to the Graduate Faculty of
the School of Engineering in Partial Fulfillment
of the Requirements for the degree of
Doctor of Philosophy
University of Pittsburgh
2006
ii
UNIVERSITY OF PITTSBURGH
SCHOOL OF ENGINEERING
This dissertation was presented
by
Robert G. Svitek
It was defended on
June 6, 2006
and approved by
Harvey S. Borovetz, PhD, Professor
William R. Wagner, PhD, Professor
Brack G. Hattler, MD, PhD, Professor
William J. Federspiel, PhD, Professor
Dissertation Director: William J. Federspiel, PhD, Professor

iii
DEVELOPMENT OF A PARACORPOREAL RESPIRATORY ASSIST LUNG
Robert G. Svitek, PhD
University of Pittsburgh, 2006
A Paracorporeal Respiratory Assist Lung (PRAL) was developed for supplemental
gas exchange to allow the native lungs of acute lung failure patients time to heal. The
device consisted of a rotating annular microporous hollow fiber membrane bundle. The
rotation augmented the gas exchange efficiency of the device at constant flowrate
thereby uncoupling gas exchange and flowrate. The rotating fibers also enabled the
PRAL to pump the blood without the need for an additional pump or arterial cannulation.
A prototype was manufactured with an overall surface area of 0.42 m2, and CO2
removal rates were 101 ml/min at a blood flowrates of 0.75 L/min. When rotated at 1500
RPM, CO2 removal increased by 92 % and O2 transfer increased by 88% over the
stationary bundle during an in vitro bovine blood study. The pumping of the rotating fiber
bundle was assessed, and at 1500 RPM the PRAL generated 750 ml/min against 52
mmHg pressure in water. Hemolysis of the device was assessed using in vitro bovine
blood from a slaughterhouse. Plasma free hemoglobin levels were higher than the
control, and we found that the roughness of the rotating fibers was the cause of much of
the blood trauma.
iv
TABLE OF CONTENTS
PREFACE
1.0 BACKGROUND
1.1 INTRODUCTION
1.2 PRINCIPLES OF GAS EXCHANGE IN BLOOD OXYGENATORS
1.3 CO2 REMOVAL DEVICES
2.0 PARACORPOREAL RESPIRATORY ASSIST LUNG (PRAL)
2.1 INTRODUCTION
2.2 ROTATION IN OTHER OXYGENATOR TECHNOLOGY
2.3 FEASIBILITY OF LOW FLOW CO2 REMOVAL
2.4 MANUFACTURING PRAL PROTOTYPES
2.4.1 Generation I
2.4.2 Generation II
2.4.3 Generation III
3.0 GAS EXCHANGE AND PUMPING
3.1 INTRODUCTION
3.2 METHODS
3.2.1 In Vitro Gas Exchange
3.2.2 Pumping
3.3 RESULTS AND DISCUSSION
3.3.1 Generation I – Gas Exchange in Water
3.3.2 Generation II – Gas Exchange in Water
3.3.3 Generation III – Gas Exchange in Water and Blood
xiii
1
1
4
7
11
11
13
15
16
17
20
21
26
26
26
26
29
31
31
33
35

v
3.3.4 Generation I – Pumping in Water
3.3.5 Generation II – Pumping in Water
3.3.6 Generation III – Pumping in Blood Analogue
3.4 SUMMARY
4.0 EVALUATION OF UNIFORM FLOW IN THE PRAL
4.1 INTRODUCTION
4.2 GAS EXCHANGE IN WATER FOR EACH DIFFUSER
4.3 QUALITATIVE FLOW VISUALIZATION
4.4 OUTER GAP AXIAL CONCENTRATION
4.5 SUMMARY
5.0 MECHANISMS FOR GAS EXCHANGE ENHANCEMENT IN THE PRAL
5.1 INTRODUCTION
5.2 ANALYTICAL MODEL OF RELATIVE VELOCITY IN THE FIBER BUNDLE
5.3 SELECTIVE PERFUSION – GENERATION I AND II
5.4 MODEL PREDICTION – GENERATION III
5.5 SELECTIVE PERFUSION – GENERATION III
5.6 SUMMARY
6.0 EFFECT OF FIBER BUNDLE POROSITY ON GAS EXCHANGE
6.1 INTRODUCTION
6.2 METHODS
6.3 GAS EXCHANGE RESULTS IN WATER – EFFECT OF POROSITY
6.4 CFD MODEL
6.5 CFD MODEL RESULTS
6.6 PARTICLE IMAGE VELOCIMETRY
38
39
39
43
45
45
46
47
49
52
53
53
54
59
65
67
71
74
74
77
79
80
82
87

vi
6.7 PIV RESULTS
6.8 SUMMARY
7.0 HEMOLYSIS
7.1 INTRODUCTION
7.2 MATERIALS AND METHODS
7.3 RESULTS AND DISCUSSION
8.0 MECHANISMS FOR HEMOLYSIS
8.1 INTRODUCTION – OUTER GAP
8.2 METHODS
8.3 RESULTS AND DISCUSSION – OUTER GAP
8.4 INTRODUCTION – INNER GAP
8.5 RESULTS AND DISCUSSION – INNER GAP
8.6 SUMMARY
9.0 MODELING CO2 REMOVAL IN A BLOOD OXYGENATOR
9.1 INTRODUCTION
9.1.1 Transport Equations – Oxygen
9.1.2 Transport Equations – Carbon Dioxide
9.2 METHODS
9.2.1 Prototype Description
9.2.2 In vitro Gas Exchange
9.3 RESULTS
9.4 DISCUSSION
10.0 CONCLUSIONS
APPENDIX
BIBLIOGRAPHY
88
92
93
93
95
99
111
111
117
117
124
127
129
130
130
132
135
139
140
142
145
150
154
156
159
vii
LIST OF TABLES
Table 2-1: Description of PRAL Generations
Table 5-1: Surface area based on sweep gas flow measurements in selective perfusion experiments
Table 6-1: Fiber bundle characteristics
Table 7-1: Summary of NIHp showing effect of seals and fibers in the PRAL
Table 9-1: Physical Constants for O2
Table 9-2: Physical Constants for CO2
Table 9-3: Characteristics of Prototype Fiber Bundle Modules
17
62
78
106
135
139
141

viii
LIST OF FIGURES
Figure 1.1 Number of deaths per 100,000 caused by COPD from 1960-1992
Figure 1.2 Commercially available membrane oxygenator
Figure 1.3 A schematic of CO2 removal in a single fiber within an artificial lung
Figure 2.1 Schematic of PRAL connected to patient
Figure 2.2 CO2 removal versus flow rate at different inlet CO2 concentrations
Figure 2.3 Drawing of Generation I PRAL device
Figure 2.4 Generation I PRAL prototype
Figure 2.5 Generation I PRAL center diffusers
Figure 2.6 Drawing of Generation II PRAL device
Figure 2.7 Generation II PRAL prototype
Figure 2.8 Drawing of Generation III PRAL device
Figure 2.9 Schematic of Generation III PRAL
Figure 2.10 Generation III PRAL prototype
Figure 2.11 Fiber bundle cage designs for Generation III PRAL
Figure 2.12 Stationary center diffusers
Figure 3.1 Gas exchange setup
Figure 3.2 Schematic of Pumping test loop
Figure 3.3 Gas exchange per area for Generation I: CO2 (left) O2 (right)
Figure 3.4 Gas exchange per area for Generation II: CO2 (left) O2 (right)
Figure 3.5 Gas exchange per area for Generation III: CO2 (left) O2 (right)
Figure 3.6 Gas transfer per area for Generation III in blood at 0.75 L/min
2
5
6
11
16
18
19
20
21
21
22
23
23
24
24
28
30
31
33
35
36
ix
Figure 3.7 Gas transfer in blood for Generation III at 0.75 L/min
Figure 3.8 Pump curves for Generation
Figure 3.9 Pump curves for Generation II at 1500 RPM
Figure 3.10 Pump curves for the Original PRAL in water and blood analogue
Figure 3.11 Theoretical pump curve meets pumping requirements
Figure 3.12 Nondimensionalized pump curves
Figure 4.1 Diffusers tested for uniform flow
Figure 4.2 Gas transfer per area for different diffuser designs
Figure 4.3 Schematic of Flow Visualization Setup
Figure 4.4 Flow visualization (a) as dye first enters the fiber bundle (b) several seconds after dye has entered the fiber bundle
Figure 4.5 Ports along axial length of bundle
Figure 4.6 Axial partial pressure along the length of the bundle at no rotation Left: PCO2; Right: PO2
Figure 4.7 Pressure drop across PRAL device (solid line) and kinetic pressure of jet in Four Hole diffuser (dashed)
Figure 5.1 Generation I – Normalized Relative velocity as a function of normalized radial distance into fiber bundle
Figure 5.2 Generation I – Gas exchange predictions compared to experimental measurements
Figure 5.3 Schematic of selective perfusion for Generation I and II
Figure 5.4 Generation I – Surface area measurements for different regions in the fiber bundle
Figure 5.5 Selective perfusion in Generation I at a water flowrate of 1.5 L/min
Figure 5.6 Surface area of Generation II inner layer based on pressure drop versus sweep gas flowrate measurements
Figure 5.7 Selective perfusion of Generation II
36
38
39
40
42
43
46
47
48
48
50
50
52
57
58
59
61
62
64
65
x
Figure 5.8 Generation III – Normalized Relative velocity as a function of normalized radial distance into fiber bundle
Figure 5.9 Theoretical CO2 removal as a function of rotation rate
Figure 5.10 Selective perfusion for Generation III
Figure 5.11 Selective perfusion for the original fiber bundle for normal flow Left: CO2 removal per area; Right: O2 supplied per area
Figure 5.12 Percent increase over stationary case for different layers of the fiber bundle
Figure 6.1 Mathematical model predictions of relative velocity in the fiber bundle for porosities of 0.83 (top line) and 0.43 (bottom line)
Figure 6.2 Mathematical model predictions of relative velocity in the fiber bundle for porosities of 0.83 (top line) and 0.43 (bottom line)
Figure 6.3 Microscopic view of (a) Original fiber bundle (no spacers); and (b) Bundle with spacers
Figure 6.4 CO2 and O2 transfer in water for different fiber bundle designs
Figure 6.5 Mesh of fiber bundle used in CFD model
Figure 6.6 CFD Velocity profiles of Original Bundle (left) and Bundle with Spacers (right)
Figure 6.7 Comparison of angular relative velocity prediction for original fiber bundle: analytical model (left) and CFD model (right)
Figure 6.8 Comparison of angular relative velocity prediction for Spacers fiber bundle: analytical model (left) and CFD model (right)
Figure 6.9 Schematic of gap flow during selective perfusion studies
Figure 6.10 Selective perfusion for the original fiber bundle for gap flow Left: CO2 removal per area; Right: O2 supplied per area
Figure 6.11 Percent increase in CO2 removal per area over stationary case with flow introduced in the outer gap
Figure 6.12 PIV measurements at 130 RPM
Figure 6.13 PIV measurements at 500 RPM
66
67
68
69
70
75
76
78
79
81
83
83
84
85
86
86
89
89

xi
Figure 6.14 PIV measurements at 1500 RPM
Figure 6.15 Schematic representation of Taylor Vortices
Figure 7.1 Schematic of mock circulatory loops for in vitro hemolysis testing
Figure 7.2 Two fiber support structure designs (cages)
Figure 7.3 Hemolysis for the PRAL
Figure 7.4 Hemolysis for the PRAL without seals
Figure 7.5 Hemolysis for the PRAL with a 6 mm outer gap
Figure 7.6 Hemolysis for the PRAL without fibers
Figure 7.7 Hemolysis for the smooth cylinder
Figure 7.8 Hemolysis for the PRAL without diffuser
Figure 7.9 Hemolysis for the PRAL with the strut cage
Figure 7.10 Flow around a cylinder at Reynolds number of 26
Figure 8.1 Threshold shear stress versus exposure time for complete red blood cell (RBC) destruction
Figure 8.2 Schematic of angular velocity profile in Taylor vortex flow in the gap between the rotating fiber bundle and stationary outer housing
Figure 8.3 Model predictions of the power dissipated into the gap between a smooth rotating cylinder and stationary housing in Taylor vortex flow
Figure 8.4 Model predictions of the shear stress in the gap between a smooth rotating cylinder and stationary housing in Taylor vortex flow
Figure 8.5 Net power dissipated for a 2 mm outer gap versus rotation rate
Figure 8.6 Shear stress for a 2 mm outer gap versus rotation rate
Figure 8.7 Net power dissipated for a 6 mm outer gap versus rotation rate
Figure 8.8 Shear stress for a 6 mm outer gap versus rotation rate
Figure 8.9 Effect of roughness on net power dissipated to the fluid
90
90
96
98
100
101
103
104
104
106
107
108
112
114
116
116
118
119
120
120
122
xii
Figure 8.10 The PRAL is above the threshold for turbulence in the inner gap
Figure 8.11 Theoretical power dissipation in the inner gap
Figure 8.12 Theoretical shear stress in the inner gap
Figure 8.13 Net power dissipated for the PRAL with and without the diffuser
Figure 8.14 Net power dissipated due to the turbulence in the inner gap
Figure 9.1 Schematic of oxygenator module
Figure 9.2 Gas exchange characterization loop for water and blood tests
Figure 9.3 Gas exchange rates versus flowrate for the first module (long, thin bundle) in water. Left: CO2 removed. Right: O2 supplied
Figure 9.4 Dimensionless mass transfer correlation for the first module
Figure 9.5 Comparison of measured (symbols) and predicted (line) CO2 removal in blood for the first module at various flowrates
Figure 9.6 Comparison of measured (symbols) and predicted (line) O2 transfer in blood for the first module versus flowrate
Figure 9.7 Comparison of measured (filled bars) and predicted (dashed bars) CO2 and O2 transfer in the second module (short, thick bundle)
125
126
126
128
128
141
142
146
147
148
149
150
xiii
PREFACE
I would like to thank my thesis advisor and mentor Dr. William Federspiel for the
opportunity to work in the Medical Devices Laboratory. His guidance has taught me how
to solve challenging engineering problems by formulating mathematical models to
understand the physics of the problem and also by teaching me how to design and
execute experiments. He has also provided me the opportunity to gain valuable
industrial experience by allowing me to collaborate with Alung Technologies, Inc. during
the initial research and development phase of the commercialization of the PRAL. I
hope that the work presented here will be a valuable contribution to the future work
performed at the Medical Devices Laboratory.
I would also like to thank my committee members Dr. Harvey Borovetz, Dr. William
Wagner, and Dr. Brack Hattler who devoted their time to help guide this research. Their
expertise spans many years of research and development on oxygenators at the
University of Pittsburgh. I was very fortunate to have an advisor and committee
members that are regarded as the experts in the field.
I am very appreciative of all the people that have helped me along the way at the
Medical Devices Laboratory. The lab has always maintained a spirit of cooperation
across the various projects, and the input from others was helpful in analyzing results
from a different perspective. I wish everybody at the lab the best of luck in achieving his
or her future goals.

xiv
Finally, I would like to thank my wife Gennifer who has supported and encouraged
me during college and graduate school. Her patience and understanding has allowed
me to focus on a career that I hope will be very rewarding as we begin our family. I look
forward to a happy and exciting future.
This work was funded by the Commonwealth of Pennsylvania, the National Tissue
Engineering Consortium (NTEC), U.S. Army Medical Research and Material Command
Grant Number DAMD17-02-0717, and also by National Institutes of Health (NIH), the
National Heart, Lung, and Blood Institute (NHLBI) Grant Number RO1 HL70051.
- 1 -
1 BACKGROUND
1.0 BACKGROUND
1.1 INTRODUCTION
Lung disease is the number three killer in America and is responsible for nearly 350,000
deaths every year [1]. The current treatment of lung disease utilizes mechanical
ventilation, which can lead to further lung damage due to high pressure and volume
delivered to the lungs. An alternative treatment utilizes an artificial lung to supply O2 and
remove CO2 to enable the lungs of the patient to heal. This chapter describes a
prevalent lung disease, Chronic Obstructive Pulmonary Disease (COPD), and the
current treatments that utilize mechanical ventilation or a membrane oxygenator. The
basic principles of gas exchange in a membrane oxygenator are described and current
applications of the membrane oxygenator are also discussed. The objective of this
project is to develop a self-pumping, highly efficient membrane oxygenator and the
basic goals of the project are described in this chapter.
Chronic Obstructive Pulmonary Disease (COPD) is a lung disease characterized by
airflow obstruction, dyspnea, and increased blood CO2 content and affects
approximately 4%-10% of adults [2]. In 1998, almost 662,000 hospitalizations were
attributed to COPD, and 2,530,000 hospitalizations (7.0% of total hospitalizations) had
COPD listed as a contributing cause of the hospitalization. The estimated direct medical
costs in 1993 for treating COPD were $14.7 billion. Deaths associated with COPD have
- 2 -
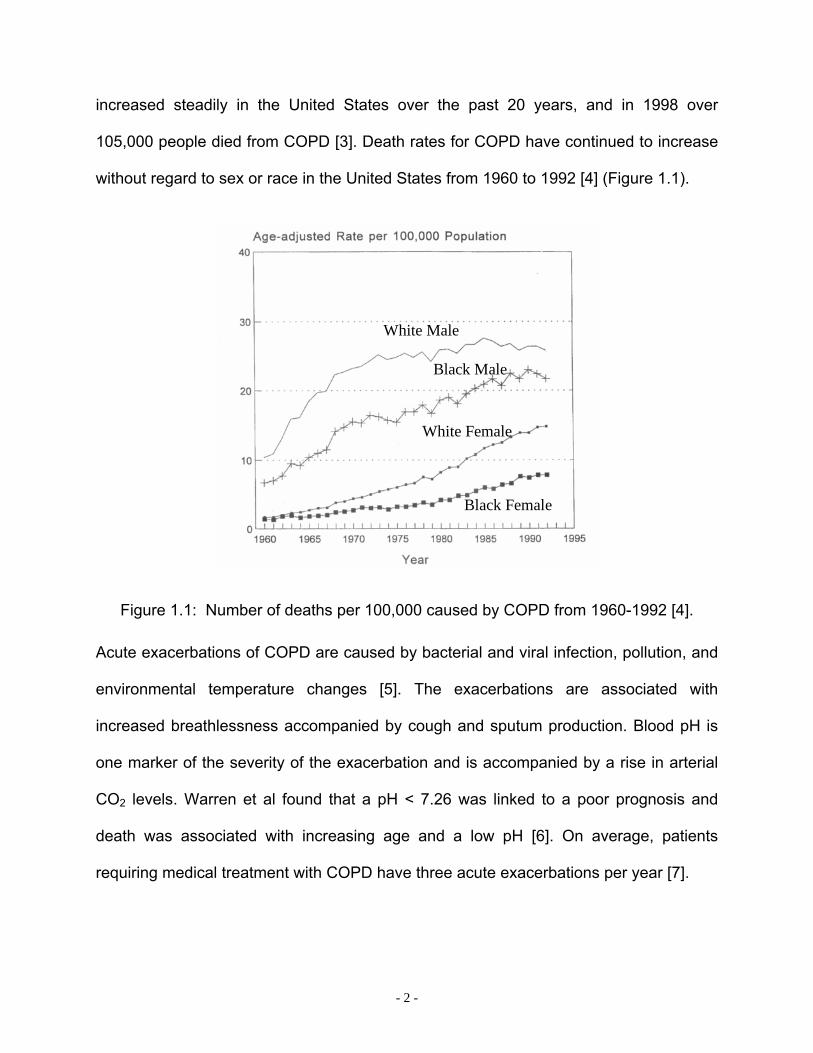
increased steadily in the United States over the past 20 years, and in 1998 over
105,000 people died from COPD [3]. Death rates for COPD have continued to increase
without regard to sex or race in the United States from 1960 to 1992 [4] (Figure 1.1).
White Male
Black Female
Black Male
White Female
Figure 1.1: Number of deaths per 100,000 caused by COPD from 1960-1992 [4].
Acute exacerbations of COPD are caused by bacterial and viral infection, pollution, and
environmental temperature changes [5]. The exacerbations are associated with
increased breathlessness accompanied by cough and sputum production. Blood pH is
one marker of the severity of the exacerbation and is accompanied by a rise in arterial
CO2 levels. Warren et al found that a pH < 7.26 was linked to a poor prognosis and
death was associated with increasing age and a low pH [6]. On average, patients
requiring medical treatment with COPD have three acute exacerbations per year [7].
- 3 -
Acute exacerbations may be reversible if the lungs can be temporarily supported and
allowed to heal [8-12]. Severe exacerbations are associated with respiratory failure and
hospital admission. Recently, non-invasive ventilation (NIV) has been explored as a
treatment regimen for acute exacerbations, but often fails to return pH and arterial CO2
to normal levels [13]. Inhaled corticosteroids and bronchodilators are being investigated
to reduce exacerbations in patients with COPD, but have yet to demonstrate increased
survival over the long term [10].
The most common treatment for severe acute exacerbation of COPD is invasive
mechanical ventilation, involving patient sedation and intubation. Mechanical ventilation
delivers oxygen to the lungs using high volumes and pressures to achieve adequate
gas exchange. The increased volume and pressure causes increased expiratory muscle
recruitment and increased work of breathing [8]. The additional workload on the lungs
causes inflammation, mucous plugging, and bronchospasm that increase the workload
further [11]. The cycle continues as the condition of the patient worsens and often
results in multi-organ failure and death [5]. One study found that barotraumas, damage
to the lungs due to high-pressure ventilation, developed in 19% of patients with COPD,
treated with mechanical ventilation [14]. Mechanical ventilation is uncomfortable and
painful resulting in poor sleep cycles, which may prolong ventilator time and costs [11].
These conditions cause alveolar damage, which further aggravates the respiratory
insufficiency in many patients and results in unsuccessful therapy.
The goal of mechanical ventilation is to temporarily supply oxygen and remove
carbon dioxide to allow the lungs to rest and return to spontaneous breathing. The
survival rate of patients treated with mechanical ventilation is inversely correlated with
- 4 -
the amount of time spent on the ventilator [15]. Chances for successful therapy increase
the sooner the patient can be extubated and returned to unassisted breathing.
Premature extubation followed by reintubation has been associated with increased
mortality (27% versus 2.6% if successfully extubated) [15]. The length of time a patient
spends on a ventilator is crucial for determining the outcome of the therapy, and
optimized weaning protocols have yet to be established. Increased time spent on the
ventilator also increases the risk of developing nosocomial pneumonia. Ventilator-
associated pneumonia causes higher medical costs and prolonged hospitalization [16].
Heyland et al. found that patients who developed ventilator-associated pneumonia
spent an average of 4.3 days longer than patients who did not develop pneumonia [17].
Several other studies have suggested that mortality attributable to ventilator-associated
pneumonia is greater than 20% [18].
1.2 PRINCIPLES OF GAS EXCHANGE IN BLOOD OXYGENATORS
An alternative treatment to mechanical ventilation employs a blood oxygenator (artificial
lung) to assist gas exchange and to help restore respiratory function while alleviating
the complications with mechanical ventilation. The therapy relies on implementation of
the oxygenator through intravascular [19-23], intrathroacic [24-26], or paracorporeal [27-
29] placement of the device. The latest technology in blood oxygenator design
exchanges O2 and CO2 through microporous, hollow fiber membranes potted together
in a bundle configuration. Figure 1.2 is a picture of a commercially available oxygenator
(Capiox, Terumo Cardiovascular Systems, Ann Arbor, Michigan) and a microscopic

- 5 -
view of the hollow fiber membrane bundle that provides the gas exchange ability of the
device. Pure O2 or air flows through the lumens of the fibers and blood flows around the
outside of the fibers.
Blood Outlet
Heat Exchanger
Blood Inlet
Gas Inlet
Gas Outlet
Water Ports Hollow
Fibers
1 µm200 µmFiber Lumen
Microporous Wall
Bundle of Fibers
Figure 1.2: Commercially available membrane oxygenator (top); bundle of hollow fiber membranes (bottom left); microporous structure of fibers (bottom right).
Oxygen exchange is determined by the fiber bundle geometry and surface area, gas
side partial pressure, hemoglobin concentration, and blood flowrate. Oxygen diffuses
from the fibers where the pO2 is high, into the blood where the pO2 is low. Oxygen binds
to hemoglobin until full saturation, and any excess O2 is dissolved into the plasma. The
rated flow of an oxygenator is a term used to describe the minimum flowrate at which
- 6 -
blood can enter the device with 75% hemoglobin saturation and leave the oxygenator
with 100% hemoglobin saturation [30].
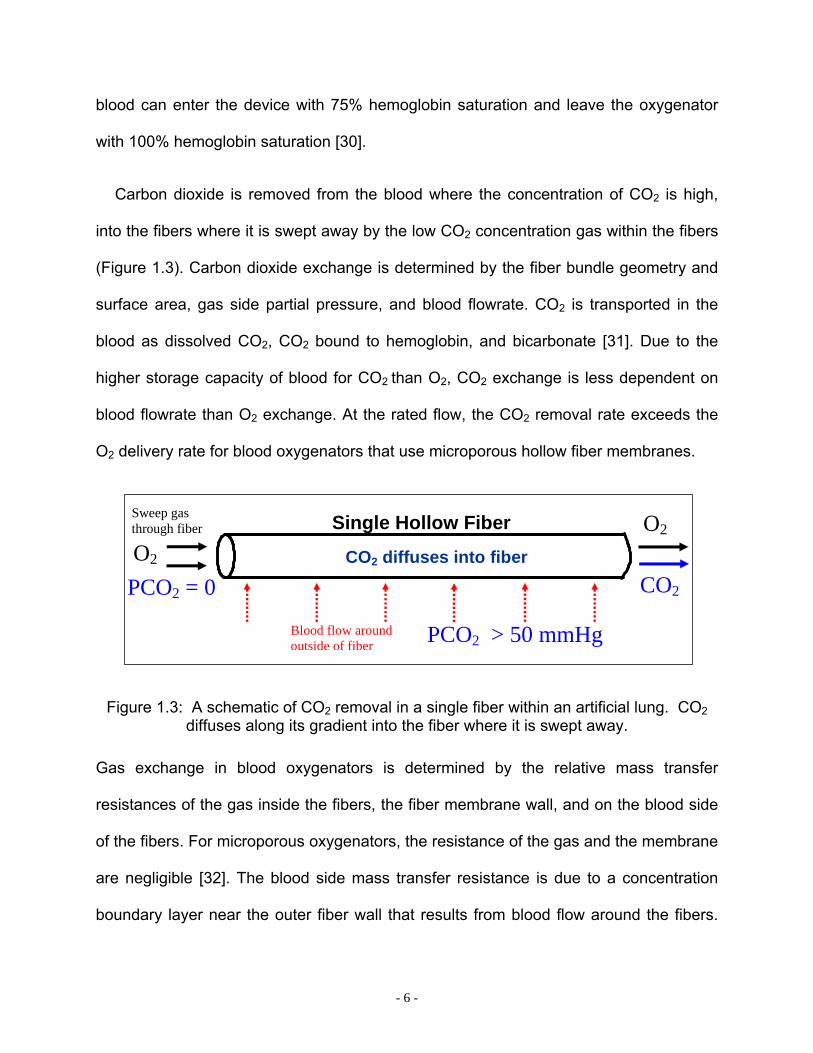
Carbon dioxide is removed from the blood where the concentration of CO2 is high,
into the fibers where it is swept away by the low CO2 concentration gas within the fibers
(Figure 1.3). Carbon dioxide exchange is determined by the fiber bundle geometry and
surface area, gas side partial pressure, and blood flowrate. CO2 is transported in the
blood as dissolved CO2, CO2 bound to hemoglobin, and bicarbonate [31]. Due to the
higher storage capacity of blood for CO2 than O2, CO2 exchange is less dependent on
blood flowrate than O2 exchange. At the rated flow, the CO2 removal rate exceeds the
O2 delivery rate for blood oxygenators that use microporous hollow fiber membranes.
O2
O2Sweep gas through fiber Single Hollow Fiber
PCO2 > 50 mmHg
CO2 diffuses into fiber CO2PCO2 = 0
Blood flow around outside of fiber
Figure 1.3: A schematic of CO2 removal in a single fiber within an artificial lung. CO2 diffuses along its gradient into the fiber where it is swept away.
Gas exchange in blood oxygenators is determined by the relative mass transfer
resistances of the gas inside the fibers, the fiber membrane wall, and on the blood side
of the fibers. For microporous oxygenators, the resistance of the gas and the membrane
are negligible [32]. The blood side mass transfer resistance is due to a concentration
boundary layer near the outer fiber wall that results from blood flow around the fibers.

- 7 -
The kinematic viscosity and the velocity of the blood are key factors that determine the
size of this boundary layer. A detailed analysis of the equations governing mass transfer
in membrane oxygenators is described in Chapter 9. Commercially available artificial
lungs are passive, i.e. they have stationary fibers mandating the velocity of the blood to
be directly dependent on the flowrate through the device. Therefore, fiber bundle
surface area is increased until adequate gas exchange can be achieved at a given
flowrate.
1.3 CO2 REMOVAL DEVICES
The blood oxygenator can be intracorporeal or extracorporeal. Intravenous devices are
a subset of intracorporeal devices and are designed to be inserted into a vein through a
surgical or percutaneous incision in the leg. The IVOX was one such intravascular
device that underwent human clinical trials in the mid 1990s [33]. The IVOX was
capable of removing 30% of CO2 production in a normocapnic adult, but human clinical
trials were halted when the gas exchange levels were deemed insufficient. The Hattler
Catheter (HC) is another intravascular oxygenator that is in development and awaiting
clinical trials. Like the IVOX, the HC is inserted through the femoral vein into the vena
cava. The HC employs a centrally located pulsating balloon that increases the mixing of
blood around the fibers to enhance gas exchange 50-300% above a non-pulsating
device [19]. The highly integrated membrane oxygenator (HIMOX) is another
intravascular gas exchange device that incorporates a pump within the bundle to help
move blood across the fibers. This technology is in the early phases of development

- 8 -
and current research focuses on the insertion and deployment of the device [34-36].
Intravascular blood oxygenators have limited gas exchange ability because the
restriction of vessel size limits the surface area of the device. Intravascular oxygenators
also suffer from limited patient mobility [37, 38].
Extracorporeal CO2 removal (ECCO2R) was tested in the late 1970s by Kolobow and
Gattinoni [39-48] This technique incorporated mechanical ventilation and a blood
oxygenator to supplement the CO2 removal. The blood was taken from the patient and
passed through a pump, artificial lung, and heat exchanger. A simplified version of
ECCO2R is arteriovenous CO2 removal (AVCO2R), in which the pump is eliminated in
place of an arterial cannulation and low resistance hollow fiber membrane oxygenator.
The arteriovenous pressure gradient drives blood through the oxygenator at a flowrate
proportional to the arteriovenous gradient and inversely proportional to the resistance of
the oxygenator and cannula. AVCO2R was tested in an acute animal model of ARDS
and demonstrated the ability to remove 100-200 ml/min of CO2 [29, 49, 50] at flowrates
of 0.75-1.5 L/min. Studies of AVCO2R recently expanded into human clinical trials [50,
51]. Mechanical ventilation parameters such as tidal volume, minute ventilation, and
peak pressure were reduced as a direct result of the low flow CO2 removal of AVCO2R.
This technology is currently being commercialized by a German based company called
Novalung [52, 53]. AVCO2R has several drawbacks. The arterial cannulation can lead
to blood loss due to the high arterial blood pressure in the vessel in combination with
the anticoagulated patient. Another drawback is the large surface area (2.5 m2) required
by the oxygenator to provide adequate gas exchange [54, 55]. The large surface area
can lead to thrombosis in areas of stagnation, and neutrophil activation related to
- 9 -
adsorbed proteins and shear forces [56-59]. Reducing the surface area of the
membrane oxygenator is possible by increasing the gas exchange efficiency of the
device. This increased efficiency can be achieved by incorporating active mixing into the
membrane oxygenator, such as a pulsating balloon [19, 20, 60-62] or a rotating fiber
bundle [63].
In this project, we propose to design a system that improves upon the clinical
success of AVCO2R by eliminating the arterial cannulation and eliminating the
dependence on the patient arteriovenous pressure gradient to provide flow. The design
objectives of the system are:
1) CO2 removal rates of 100-120 ml/min at a blood flowrate of 0.75 L/min or less.
2) Fiber membrane surface area less than 0.5 m2.
3) Priming volume less than 300 ml.
4) Generate pumping pressure of 80-100 mmHg at a flowrate of 0.75 L/min to
enable percutaneous insertion of a dual lumen venous cannula.
5) In vitro hemolysis levels comparable to a commercially available oxygenator.
The proposed system is envisioned to provide CO2 removal to allow the native lungs
time to heal. The low flowrate and priming volume of the system are targeted to create
an approach that can be implemented as easily as acute hemodialysis. To achieve
these objectives, the device incorporates a rotating fiber bundle to increase the gas
exchange efficiency above that achieved with commercially available passive
oxygenators. The rotating fiber bundle also generates pressure to facilitate pumping,
which enables a percutaneous insertion of a dual lumen venovenous cannula.
- 10 -
This thesis describes the design and development of the Paracorporeal Respiratory
Assist Lung (PRAL). A model of CO2 removal versus flowrate is provided in Chapter 2 to
show feasibility of removing 100-120 ml/min of CO2 at flowrates less than 0.75 L/min.
Chapter 2 also describes other oxygenator technologies that have utilized rotation to
enhance gas exchange. Finally, detailed drawings and the manufacturing procedures
for building PRAL prototypes is provided.
Chapter 3 discusses the gas exchange and pumping results for each PRAL
prototype. The gas exchange was tested in water for all prototypes and in blood for the
Generation III design. The pumping was tested in water and a glycerol-water blood
analogue solution. We investigated uniform radial flow in the PRAL fiber bundle in
Chapter 4. A model was developed to predict gas exchange in the different PRAL
prototype designs. This model is discussed in Chapter 5. A technique called selective
perfusion was used to measure gas exchange in localized regions of the fiber bundle in
each prototype. The model predicted that gas exchange increases with porosity of the
fiber bundle. Chapter 6 shows the model predictions and then describes how 3 fiber
bundles were manufactured with increased porosity. Gas exchange efficiency was
measured in water for each bundle. Chapter 7 covers the experimental hemolysis of the
PRAL and Chapter 8 discusses calculations of shear stress due to the rotating fiber
bundle. Chapter 9 is a theoretical model of CO2 exchange in hollow fiber oxygenators.
The theory is tested on two different fiber bundle designs.

- 11 -
2 PARACORPOREAL RESPIRATORY ASSIST LUNG (PRAL)
2.0 PARACORPOREAL RESPIRATORY ASSIST LUNG (PRAL)
2.1 INTRODUCTION
The goal of this project is to develop a Paracorporeal Respiratory Assist Lung (PRAL) to
provide CO2 removal at a low blood flowrate for the treatment of respiratory failure,
particularly acute exacerbations of COPD. A representation of the PRAL connected to a
patient is shown in Figure 2.1. The PRAL is comprised of an annular hollow fiber
membrane bundle that is rotated to increase the gas exchange efficiency of the device
and pump blood. A percutaneous dual lumen cannula, which is inserted through the
femoral vein and placed into the vena cava, provides blood flow to and from the PRAL.
Figure 2.1: Schematic of PRAL connected to patient.
- 12 -
The rotating fiber bundle provides several distinct advantages over current passive
(i.e. no mechanical motion), oxygenators like that used in AVCO2R (see Chapter 1).
Gas exchange can be augmented by increasing the fiber bundle rotation rate while
maintaining a constant low blood flowrate. Passive oxygenators depend on increased
flowrate to achieve higher levels of gas exchange. The increase in gas exchange
efficiency due to rotation also enables a lower membrane surface area than that
required by passive oxygenators. The reduction in surface area leads to decreased
platelet activation and reduced thrombosis due to surface-related effects [55].
Additionally, the rotating fiber bundle generates pumping pressure to enable cannulation
from the venous side without the need for an arterial cannulation. Unlike the PRAL, the
passive oxygenators used in AVCO2R require a separate pump, or rely on the
arteriovenous pressure gradient of the patient, to provide flow through the device.
Venous cannulation of the PRAL may reduce the inherent blood loss and bleeding risks
associated with arterial cannulation [55].
The following sections give a summary of previous work on oxygenators that
implement rotation to provide gas exchange enhancement and pumping ability. Also,
the methods for building PRAL prototypes used in this research are described. The gas
exchange and pumping performance of the prototypes is described in Chapter 3.

- 13 -
2.2 ROTATION IN OTHER OXYGENATOR TECHNOLOGIES
Several investigators in the 1970s used rotation to increase gas exchange in artificial
lungs made from flat microporous membrane sheets [64-66]. These devices were large
in size due to the inherently low gas exchange surface area to blood volume ratio of
membrane sheets. Other investigators have attempted to use rotation in disk shaped
oxygenators, but the devices exhibited high hemolysis levels due to their complex
construction and operation [67-69]}.
Gaylor fabricated the Taylor-Vortex oxygenator in the mid 1970s, a device with
enhanced gas exchange as a function of rotation [64]. This device was composed of a
rotating inner cylinder and stationary outer housing, both lined with sheets of
microporous membranes. Oxygen gas exchange efficiency in blood was 240 ml/min/m2
for a 0.3 m2 device at 5 LPM blood flow. Although this efficiency was considerably
higher than passive artificial lungs at the time, the device was 25 cm in diameter and 63
cm in length, which resulted in an inordinately large device.
Makarewicz and Mockros [70] manufactured a pumping artificial lung (PAL) by
rotating an annular bank of hollow fiber membranes within the housing of a modified
Biomedicus BP-80 pump head. The 0.6 m2 device exhibited CO2 transfer efficiencies of
37-120 ml/min/m2 from 1-5 LPM blood flow and generated 1.0 LPM flow against 100
mmHg pressure at 1500 RPM. Unlike the Taylor-Vortex oxygenator, gas exchange was
independent of rotation rate [22]. Thus, gas exchange enhancement was only achieved
by increasing the flowrate through the artificial lung. The concept of a rotating fiber
bundle to increase gas exchange in an artificial lung was patented in 1999 by Dr. James
- 14 -
Maloney [71]. In vivo gas exchange in a dog produced O2 exchange of 40 ml/min at 200
RPM to 60 ml/min at 600 RPM. The rotating fiber bundle also generated pumping
pressure eliminating the need for a separate pump.
Wu et al. [72] described a rotating disk oxygenator that enhanced gas exchange with
rotation and pumps with the intent of ambulatory respiratory support for 21 days for
adults. A 0.50 m2 prototype exhibited CO2 exchange efficiency of 370 ml/min/m2 in
blood at 5 L/min. The device pumped to pressures of 400 mmHg at 5 L/min at a rotation
rate of 2000 RPM. Hemolysis caused by rotation was comparable to ventricular assist
devices (VAD) with a normalized index of hemolysis (NIH) of 0.068 g/100L. This
technology is being developed by a company called Ension, Inc., and another
application of the rotating disk oxygenator is to provide cardiopulmonary support in the
pediatric patient population [73].
CardioVention, Inc. commercialized the CORxTM integrated cardiopulmonary bypass
circuit. This system was comprised of a passive oxygenator combined with a centrifugal
pump into one compact unit, roughly the size of a can of soda. This device also
incorporated an air elimination technology. The artificial lung was composed of
microporous polypropylene hollow fibers with a total surface area of 1.2 m2. The
compact nature of the system led to reduced hemodilution of the patient and less overall
foreign surface-blood contact. An in vivo study in calves showed that the CORx system
exhibited better gas exchange, more constant hematocrit, and comparable hemolysis to
a standard oxygenator during a 6 hour period [74]. The disadvantage of this system and
any other system that integrates a separate pump with a bundle of hollow fibers was the
passive nature of the device. The only way to increase the relative velocity between the

- 15 -
fibers and the blood in the CORx was to increase the overall flowrate through the
device.
2.3 FEASIBILITY OF LOW FLOW CO2 REMOVAL
We investigated the possibility of removing 100-120 ml/min of CO2 at flowrates of less
than 750 ml/min by developing a model based on the CO2 dissociation curve in blood.
CO2 elimination by the membrane oxygenator can be calculated as:
)(2 outinb CCQVCO −= where VCO2 is the carbon dioxide removed from the blood by the
oxygenator (ml CO2/min), Qb is the flowrate of blood through the oxygenator (ml
blood/min), Cin is the concentration of CO2 coming into the oxygenator (ml CO2/ml
blood), and Cout is the concentration of CO2 in the blood leaving the oxygenator (ml
CO2/ml blood). Carbon dioxide is present in the blood in the form of dissolved CO2,
bicarbonate ions (HCO3), and CO2 bound to hemoglobin. The concentration can be
expressed in terms of the partial pressure through an empirical relationship of the CO2
dissociation curve [31]: 3773.0211489.0 COPC = (C is the concentration in ml CO2/ml blood;
PCO2 is the partial pressure in mmHg). Using these relationships, the CO2 removal rate
as a function of blood flowrate was plotted for different outlet CO2 partial pressure
(Figure 2.2). At a blood flowrate of 400 ml/min or greater, 100-120 ml/min of CO2 can be
removed, leaving the pCO2 in the blood exiting the oxygenator at 10 mmHg or greater.

- 16 -
200 300 400 500 600 700 8000
20
40
60
80
100
120
140
160
180
200
220
Blood Flow (cc/min)
VC
O2
(ml/m
in)
PCO2 = 30PCO2 = 20PCO2 = 10
Target CO2 Removal
Exit pCO2
Figure 2.2: CO2 removal versus flow rate at different inlet CO2 concentrations.
The model predicted that the target CO2 removal can be achieved at flowrates as low as
400 ml/min. Three generations of PRAL prototypes were then manufactured and tested.
2.4 MANUFACTURING PRAL PROTOTYPES
The rationale for each PRAL prototype design was based on experimental gas
exchange results, which are described in Chapter 3. The fiber bundles for each design
were annular in shape and the ends of the bundle were made to enable gas flow by
gluing the bundle of fibers together in a 1 cm annular ring and toming the ends of the
fibers to allow gas to flow through the lumens of the fibers. The procedure of gluing and
toming the fibers is known as ‘potting’ the bundle. The glued part of the fiber bundle is
- 17 -
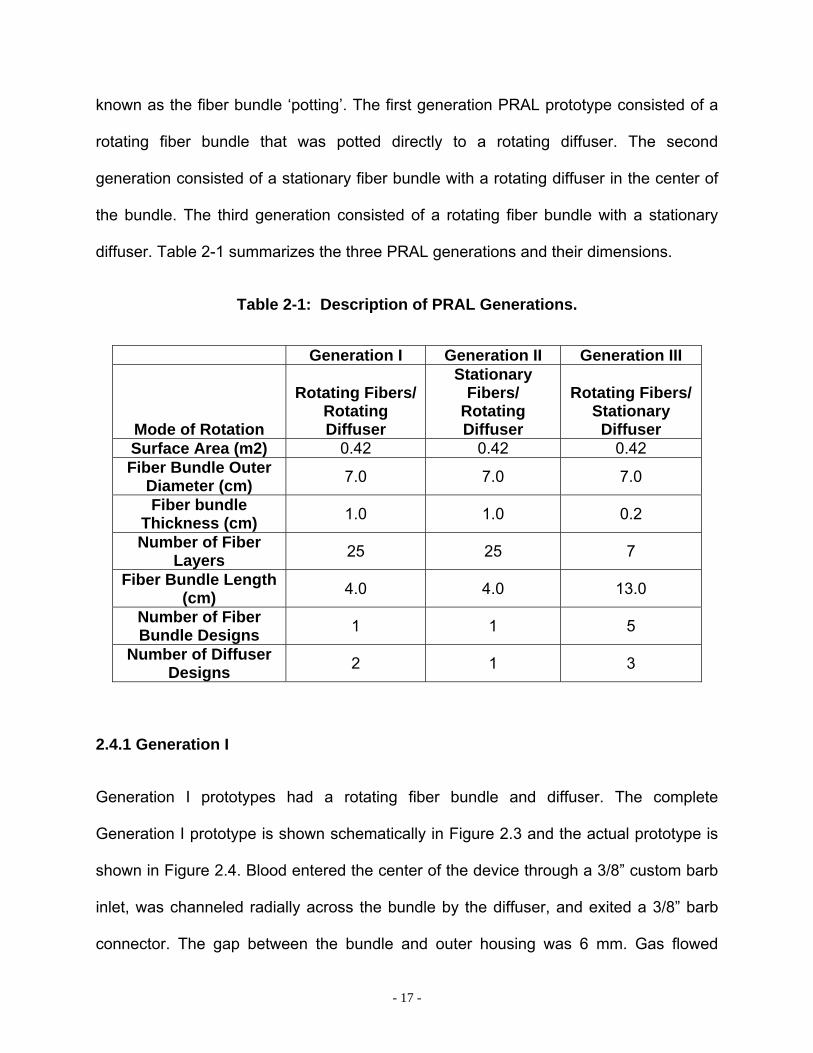
known as the fiber bundle ‘potting’. The first generation PRAL prototype consisted of a
rotating fiber bundle that was potted directly to a rotating diffuser. The second
generation consisted of a stationary fiber bundle with a rotating diffuser in the center of
the bundle. The third generation consisted of a rotating fiber bundle with a stationary
diffuser. Table 2-1 summarizes the three PRAL generations and their dimensions.
Table 2-1: Description of PRAL Generations.
Generation I Generation II Generation III
Mode of Rotation
Rotating Fibers/Rotating Diffuser
Stationary Fibers/
Rotating Diffuser
Rotating Fibers/ Stationary Diffuser
Surface Area (m2) 0.42 0.42 0.42 Fiber Bundle Outer
Diameter (cm) 7.0 7.0 7.0
Fiber bundle Thickness (cm) 1.0 1.0 0.2
Number of Fiber Layers 25 25 7
Fiber Bundle Length (cm) 4.0 4.0 13.0
Number of Fiber Bundle Designs 1 1 5
Number of Diffuser Designs 2 1 3
2.4.1 Generation I
Generation I prototypes had a rotating fiber bundle and diffuser. The complete
Generation I prototype is shown schematically in Figure 2.3 and the actual prototype is
shown in Figure 2.4. Blood entered the center of the device through a 3/8” custom barb
inlet, was channeled radially across the bundle by the diffuser, and exited a 3/8” barb
connector. The gap between the bundle and outer housing was 6 mm. Gas flowed
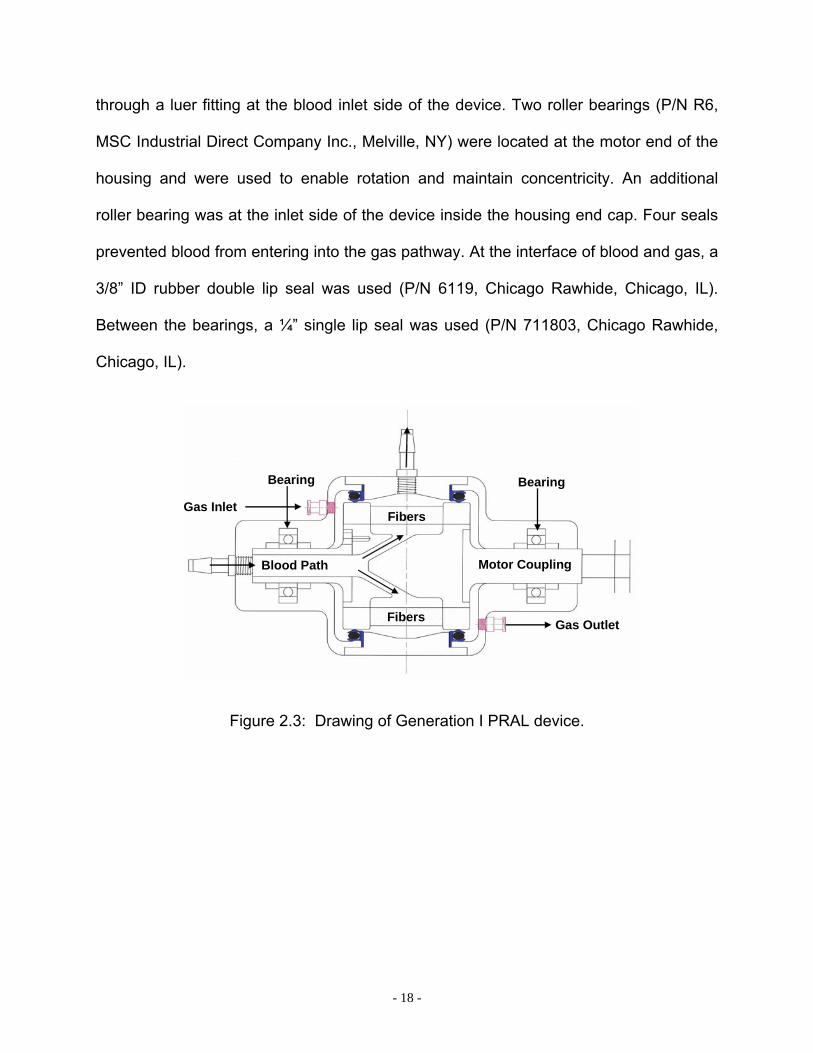
- 18 -
through a luer fitting at the blood inlet side of the device. Two roller bearings (P/N R6,
MSC Industrial Direct Company Inc., Melville, NY) were located at the motor end of the
housing and were used to enable rotation and maintain concentricity. An additional
roller bearing was at the inlet side of the device inside the housing end cap. Four seals
prevented blood from entering into the gas pathway. At the interface of blood and gas, a
3/8” ID rubber double lip seal was used (P/N 6119, Chicago Rawhide, Chicago, IL).
Between the bearings, a ¼” single lip seal was used (P/N 711803, Chicago Rawhide,
Chicago, IL).
Blood Path Motor Coupling
Bearing Bearing
Gas Inlet
Gas Outlet
Fibers
Fibers
Figure 2.3: Drawing of Generation I PRAL device.
- 19 -
Gas Inlet Gas Outlet
Motor Coupling
Blood Inlet
Blood Outlet
BearingsBearing
Seals Seals
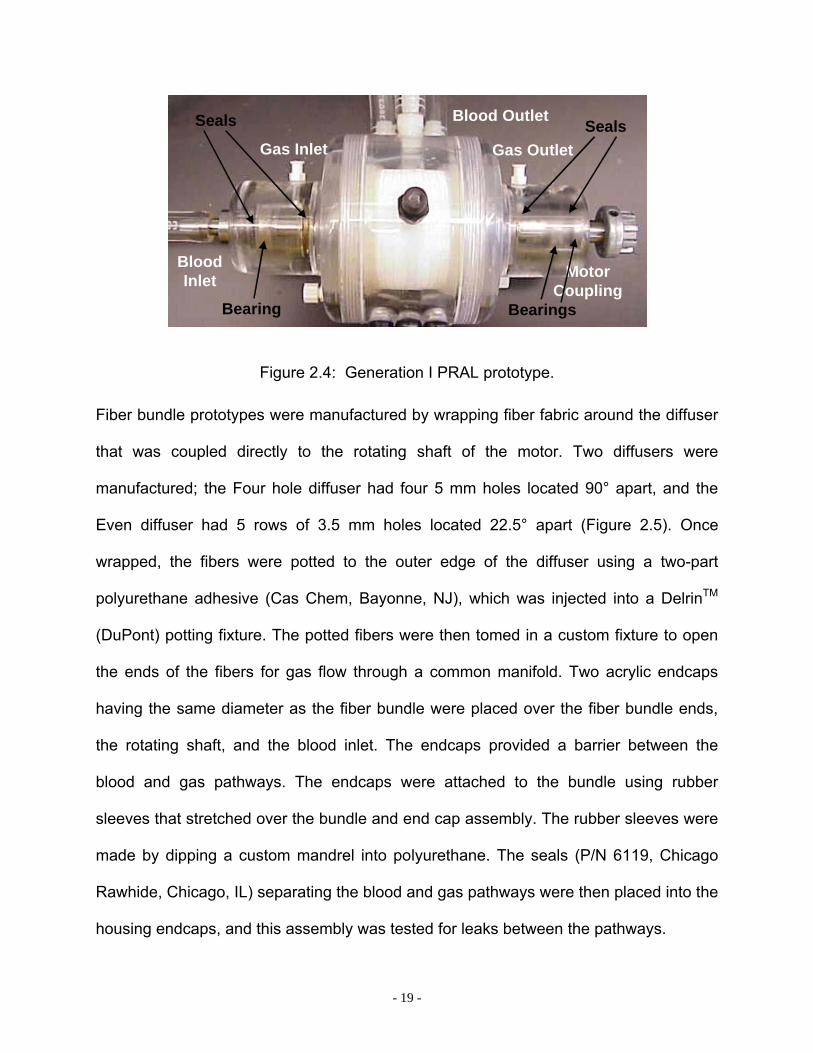
Figure 2.4: Generation I PRAL prototype.
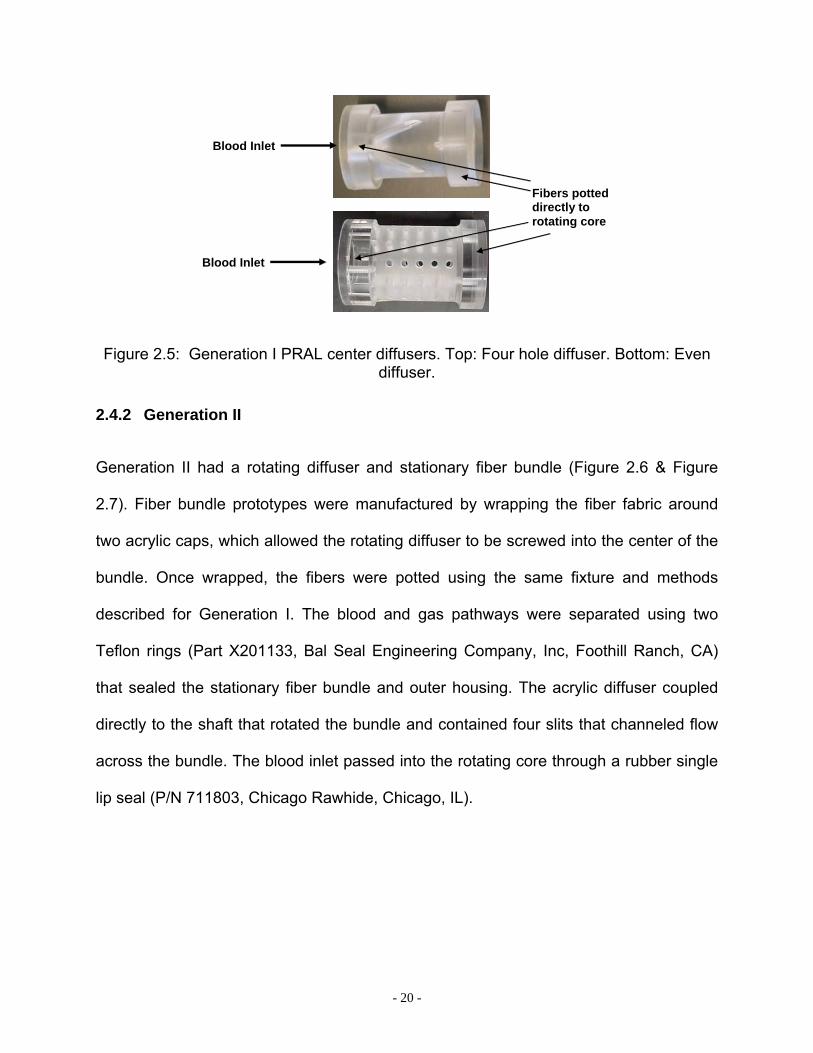
Fiber bundle prototypes were manufactured by wrapping fiber fabric around the diffuser
that was coupled directly to the rotating shaft of the motor. Two diffusers were
manufactured; the Four hole diffuser had four 5 mm holes located 90° apart, and the
Even diffuser had 5 rows of 3.5 mm holes located 22.5° apart (Figure 2.5). Once
wrapped, the fibers were potted to the outer edge of the diffuser using a two-part
polyurethane adhesive (Cas Chem, Bayonne, NJ), which was injected into a DelrinTM
(DuPont) potting fixture. The potted fibers were then tomed in a custom fixture to open
the ends of the fibers for gas flow through a common manifold. Two acrylic endcaps
having the same diameter as the fiber bundle were placed over the fiber bundle ends,
the rotating shaft, and the blood inlet. The endcaps provided a barrier between the
blood and gas pathways. The endcaps were attached to the bundle using rubber
sleeves that stretched over the bundle and end cap assembly. The rubber sleeves were
made by dipping a custom mandrel into polyurethane. The seals (P/N 6119, Chicago
Rawhide, Chicago, IL) separating the blood and gas pathways were then placed into the
housing endcaps, and this assembly was tested for leaks between the pathways.
- 20 -
Blood Inlet
Blood Inlet
Fibers potted directly to rotating core
Figure 2.5: Generation I PRAL center diffusers. Top: Four hole diffuser. Bottom: Even diffuser.
2.4.2 Generation II
Generation II had a rotating diffuser and stationary fiber bundle (Figure 2.6 & Figure
2.7). Fiber bundle prototypes were manufactured by wrapping the fiber fabric around
two acrylic caps, which allowed the rotating diffuser to be screwed into the center of the
bundle. Once wrapped, the fibers were potted using the same fixture and methods
described for Generation I. The blood and gas pathways were separated using two
Teflon rings (Part X201133, Bal Seal Engineering Company, Inc, Foothill Ranch, CA)
that sealed the stationary fiber bundle and outer housing. The acrylic diffuser coupled
directly to the shaft that rotated the bundle and contained four slits that channeled flow
across the bundle. The blood inlet passed into the rotating core through a rubber single
lip seal (P/N 711803, Chicago Rawhide, Chicago, IL).

- 21 -
Blood Inlet
Fibers
Fibers
Diffuser
Seal
Motor Coupling
Teflon Seal
Bearings
Figure 2.6: Drawing of Generation II PRAL device.
Shaft connected to motor
Rotating Core
Blood Inlet
Blood Outlet
Gas Inlet
Teflon Ring –Separate Gas/Blood Pathway
Figure 2.7: Generation II PRAL prototype.
2.4.3 Generation III
Generation III had a rotating fiber bundle with a stationary core. A schematic of
Generation III is shown in Figure 2.8 and Figure 2.9, and a picture of the prototype is
shown in Figure 2.10. Fiber bundles were manufactured by wrapping the fiber fabric
around a cage support structure that enabled rotation of the bundle without applying
torque to the fibers. The cage structure coupled directly to the shaft that rotated the

- 22 -
bundle. Two different support structures were manufactured. One was a strut cage, and
the other was a porous cage (see Figure 2.11). The strut cage was made by soldering
1.5 mm stainless steel rods to a stainless steel ring (O.D. 6.6 cm) to which the fiber
bundle was potted. Once wrapped, the fibers were potted to the support structure using
a two-part polyurethane adhesive (Cas Chem, Bayonne, NJ) injected into a DelrinTM
(DuPont, Wilmington, DE) potting fixture. The potted fibers were then tomed in a custom
fixture to open the ends of the fibers for gas flow through a common manifold. The
potted bundle was placed over the stationary diffuser. A threaded cap provided a blood-
gas barrier between the bundle and the diffuser. The same acrylic endcaps as in
Generation I were placed over the fiber bundle ends onto the threaded cap, but over the
rotating shaft and blood inlet. The endcaps provided a barrier between the blood and
gas pathways. The endcaps were attached to the bundle using sleeves that stretched
over the bundle and end cap assembly. The sleeves were made by dipping a custom
mandrel into polyurethane. The stationary core was screwed to the blood inlet which
was fixed into the upstream end cap with a 0.50” set screw. The bundle assembly was
then placed into the outer housing and end-caps were screwed to the housing.
Diffuser
Endcap
Blood Inlet Motor Coupling
Fibers
Figure 2.8: Drawing of Generation III PRAL device.

- 23 -
StationaryCore
Rotating Annular Bundle Between Stationary Core and
Housing
Housing
Blood Inlet
Blood Outlet
Gas Inlet
Figure 2.9: Schematic of Generation III PRAL.
Gas Inlet
Gas Outlet
Blood Inlet
Blood Outlet
Figure 2.10: Generation III PRAL prototype.

- 24 -
STRUT
POROUS
Figure 2.11: Fiber bundle cage designs for Generation III PRAL.
Three stationary center diffusers were made from acrylic for the Generation III prototype
and are shown in Figure 2.12. The length of each diffuser was 12 cm. Flow entered the
hole in the center of the diffuser and was channeled across the fibers depending on the
hole pattern of the diffuser. The Four-hole diffuser is shown in the far left hand side of
Figure 2.12. The flow entered at the proximal end of the fiber bundle through a ¼”
diameter hole and exited out of four radial 10 mm diameter holes.
Figure 2.12: Stationary center diffusers. Left: Four-hole Diffuser. Middle: Even Diffuser. Right: Axial Diffuser

- 25 -
The Even diffuser is shown in the middle of Figure 2.12. This diffuser had a center
bore diameter of 1 inch and had four rows of five radial holes that decrease in size
along the length of the device from 6, 5, 4, 3.5, and 3.5 mm in diameter. The Axial
diffuser is shown in the far right hand side of Figure 2.12. This diffuser had an inlet hole
with a diameter of ½ inch and consisted of one row of five 7.5 mm diameter holes.
Chapter 4 discusses the effect of the diffuser design on gas exchange. The following
chapter describes the gas exchange and pumping tests that were performed to
characterize the PRAL prototypes.
- 26 -
3 GAS EXCHANGE
3.0 GAS EXCHANGE AND PUMPING
3.1 INTRODUCTION
The PRAL utilizes a rotating fiber bundle to increase gas exchange efficiency and pump
blood. Higher gas exchange efficiency allows less fiber surface area and lower blood
flowrates than in passive oxygenators. Three PRAL prototypes were manufactured
(described in Chapter 2). Generation I incorporated a rotating fiber bundle that was
potted directly to the center diffuser. Generation II incorporated a rotating core with a
stationary fiber bundle. Generation III incorporated a rotating fiber bundle with a
stationary diffuser. This chapter describes the gas exchange and pumping
characterizations of each generation in water, and Generation III in bovine blood.
3.2 METHODS
3.2.1 In vitro gas exchange
The gas exchange of the PRAL prototypes was characterized in water and bovine blood
from a local slaughterhouse. A flow loop was constructed for both water and blood
testing that consisted of a reservoir, a centrifugal pump (for Water - March
Manufacturing, LC-2CP-MD, Glenview IL; for Blood – Medtronic, Biomedicus BP-80X,

- 27 -
Minneapolis, MN), a commercial oxygenator (AffinityTM, Medtronic, Minneapolis MN)
used as a deoxygenator, and the PRAL prototype (Figure 3.1). Tygon tubing (P/N R-
3603, Cole Parmer, Vernon Hills, IL) connected the outflow port of the reservoir to the
inlet of the centrifugal pump. The pump was used in conjunction with a Hoffman clamp
(Cole Parmer, Vernon Hills, IL) to set the flowrate. Sweep gas through the commercial
oxygenator was a N2/CO2 mix adjusted with a gas blender (Cole Parmer, PMM2-
010032, Vernon Hills, IL) to set the inlet conditions in accordance with the Association
for the Advancement of Medical Devices (AAMI) standards [75]: O2 inlet saturation 65
+/- 5% and inlet pCO2 of 45 +/- 5 mmHg. The test fluid flowed from the commercial
oxygenator into the PRAL and then back to the reservoir. The flowrate was measured
using a flow probe (Transonic Systems, Inc, T110, Ithaca, NY). O2 partial pressures at
the inlet and outlet of the device were measured using a blood-gas analyzer (ABL-505
Radiometer, Copenhagen, Denmark). The concentration and saturation of hemoglobin
was measured with an OSM3 Hemoximeter (Radiometer, Copenhagen, Denmark). Pure
oxygen sweep gas flowed under vacuum through the PRAL fiber lumens at 6.5 L/min.
The gas then flowed through a moisture trap and through a Top Trak flow meter, which
displays the mass flowrate in units of L/min at a reference temperature and pressure
(Sierra Instruments, 822-13-OV1 PV1-V1, Monterey CA). A vacuum pump (Barnant,
400-3910, Barrington, IL) and needle valve were used to maintain constant sweep gas
flow through the device. A CO2 analyzer (Physiodyne, CO2-44B, Quogue, NY) was
used to measure the concentration of CO2 exiting the gas stream of the PRAL. The
blood was filtered with 40 µm pore size filters (P/N SQ40S, Pall Biomedical, Fajardo,
PR) on the day of collection to remove any hair or extraneous particles due to the

- 28 -
collection process, and Gentamycin (0.1 g/mL blood) was added to prevent infection.
The gas exchange for Generation I was evaluated in water at 1.5 and 3.0 L/min. The
gas exchange for Generation II was evaluated in water at 1.5 L/min. The gas exchange
for Generation III was evaluated in water at 3.0 L/min and in blood at 0.75 L/min.
Reservoir
PumpDeoxygenator
PRAL
O2 inlet
Moisture Trap
FlowMeter
Vacuum Pump
CO2analyzer
Water/Blood Flow Path
Oxygen Flow Path
Figure 3.1: Gas exchange setup.
Oxygen transfer rates in blood (VO2) were calculated using the following relationship
[76]:
[ ])()( 2222inout
Tin
Oout
OOO SSCPPQV −+−= α ( 3.1 )
where Q is the blood flow rate, αΟ2 is the solubility of O2 (3.16E-4 ml O2/ml
blood/cmHg), and )( 22in
Oout
O PP − is the difference in partial pressure between the inlet and
outlet of the device. CT is the hemoglobin binding capacity of blood (0.167 ml O2/ml
blood), and )( inout SS − is the change in saturation of the hemoglobin from the inlet to the
outlet. O2 transfer in water was calculated by setting ∆S equal to zero in Equation 3.1
- 29 -
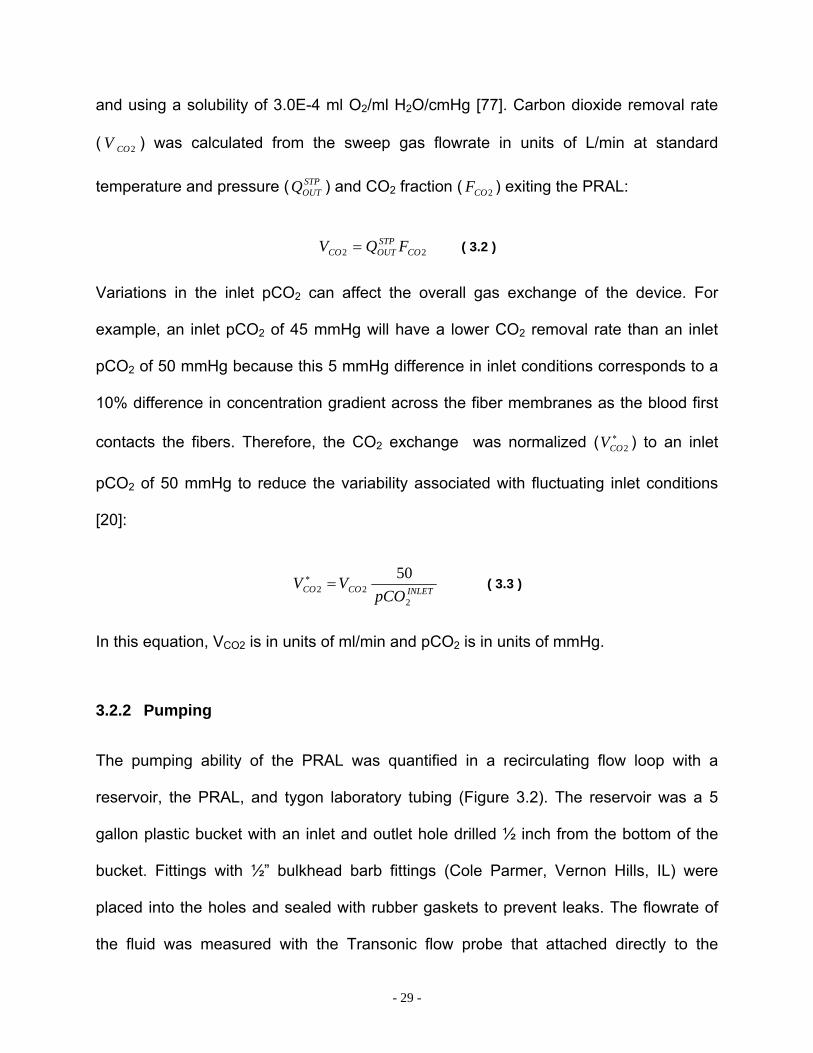
and using a solubility of 3.0E-4 ml O2/ml H2O/cmHg [77]. Carbon dioxide removal rate
( 2COV ) was calculated from the sweep gas flowrate in units of L/min at standard
temperature and pressure ( STPOUTQ ) and CO2 fraction ( 2COF ) exiting the PRAL:
22 COSTPOUTCO FQV = ( 3.2 )
Variations in the inlet pCO2 can affect the overall gas exchange of the device. For
example, an inlet pCO2 of 45 mmHg will have a lower CO2 removal rate than an inlet
pCO2 of 50 mmHg because this 5 mmHg difference in inlet conditions corresponds to a
10% difference in concentration gradient across the fiber membranes as the blood first
contacts the fibers. Therefore, the CO2 exchange was normalized ( ∗2COV ) to an inlet
pCO2 of 50 mmHg to reduce the variability associated with fluctuating inlet conditions
[20]:
INLETCOCO pCOVV
222
50=∗ ( 3.3 )
In this equation, VCO2 is in units of ml/min and pCO2 is in units of mmHg.
3.2.2 Pumping
The pumping ability of the PRAL was quantified in a recirculating flow loop with a
reservoir, the PRAL, and tygon laboratory tubing (Figure 3.2). The reservoir was a 5
gallon plastic bucket with an inlet and outlet hole drilled ½ inch from the bottom of the
bucket. Fittings with ½” bulkhead barb fittings (Cole Parmer, Vernon Hills, IL) were
placed into the holes and sealed with rubber gaskets to prevent leaks. The flowrate of
the fluid was measured with the Transonic flow probe that attached directly to the
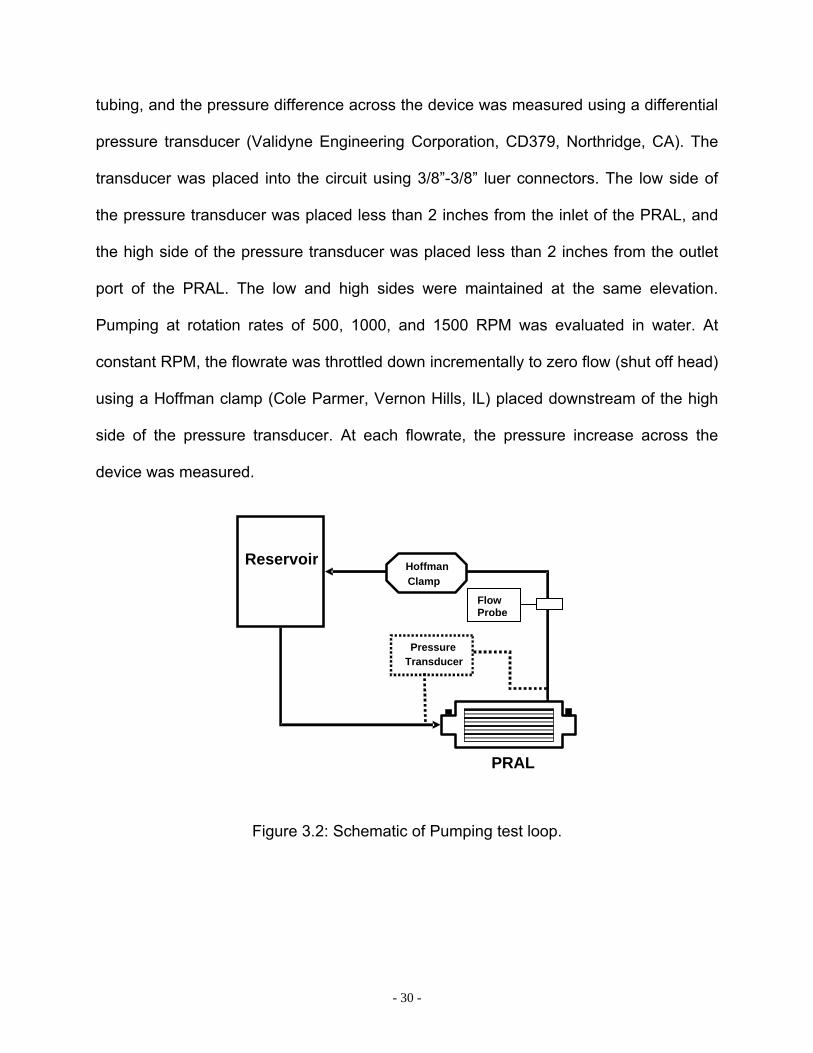
- 30 -
tubing, and the pressure difference across the device was measured using a differential
pressure transducer (Validyne Engineering Corporation, CD379, Northridge, CA). The
transducer was placed into the circuit using 3/8”-3/8” luer connectors. The low side of
the pressure transducer was placed less than 2 inches from the inlet of the PRAL, and
the high side of the pressure transducer was placed less than 2 inches from the outlet
port of the PRAL. The low and high sides were maintained at the same elevation.
Pumping at rotation rates of 500, 1000, and 1500 RPM was evaluated in water. At
constant RPM, the flowrate was throttled down incrementally to zero flow (shut off head)
using a Hoffman clamp (Cole Parmer, Vernon Hills, IL) placed downstream of the high
side of the pressure transducer. At each flowrate, the pressure increase across the
device was measured.
Figure 3.2: Schematic of Pumping test loop.
Reservoir
PRAL
Pressure Transducer
Hoffman Clamp
Flow Probe
- 31 -
3.3 RESULTS AND DISCUSSION
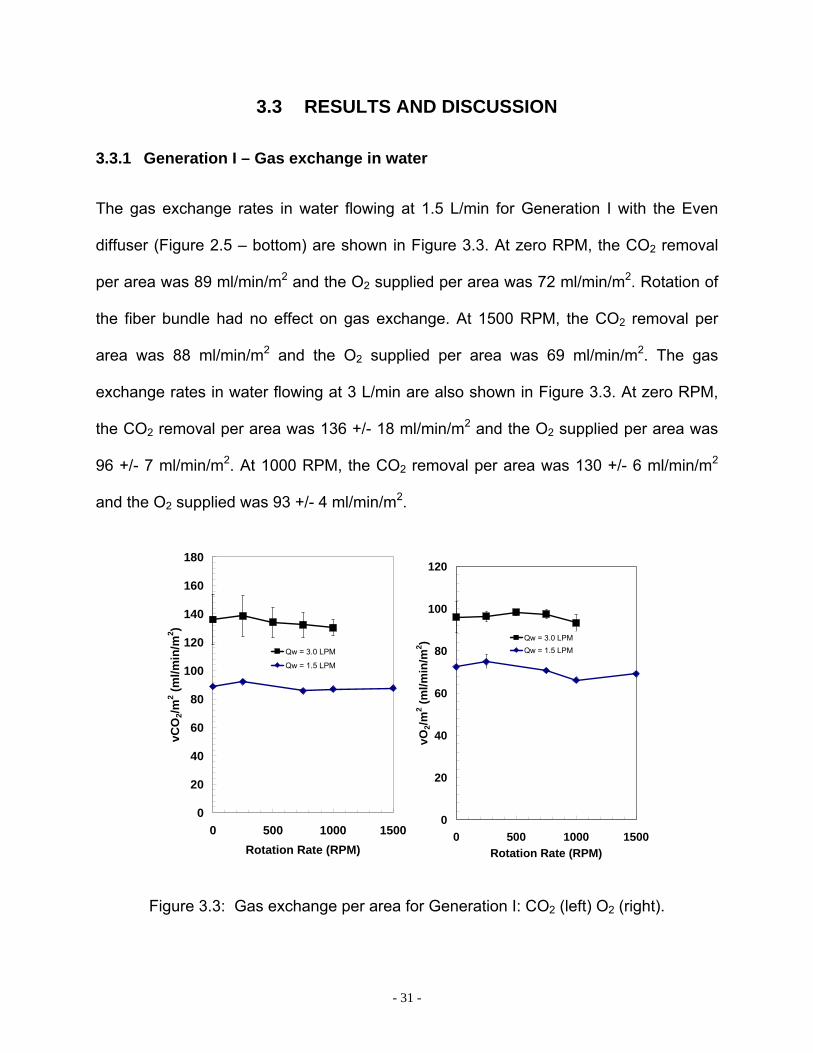
3.3.1 Generation I – Gas exchange in water
The gas exchange rates in water flowing at 1.5 L/min for Generation I with the Even
diffuser (Figure 2.5 – bottom) are shown in Figure 3.3. At zero RPM, the CO2 removal
per area was 89 ml/min/m2 and the O2 supplied per area was 72 ml/min/m2. Rotation of
the fiber bundle had no effect on gas exchange. At 1500 RPM, the CO2 removal per
area was 88 ml/min/m2 and the O2 supplied per area was 69 ml/min/m2. The gas
exchange rates in water flowing at 3 L/min are also shown in Figure 3.3. At zero RPM,
the CO2 removal per area was 136 +/- 18 ml/min/m2 and the O2 supplied per area was
96 +/- 7 ml/min/m2. At 1000 RPM, the CO2 removal per area was 130 +/- 6 ml/min/m2
and the O2 supplied was 93 +/- 4 ml/min/m2.
0
20
40
60
80
100
120
140
160
180
0 500 1000 1500Rotation Rate (RPM)
vCO
2/m2 (m
l/min
/m2 )
Qw = 3.0 LPM
Qw = 1.5 LPM
0
20
40
60
80
100
120
0 500 1000 1500Rotation Rate (RPM)
vO2/m
2 (ml/m
in/m
2 ) Qw = 3.0 LPMQw = 1.5 LPM
Figure 3.3: Gas exchange per area for Generation I: CO2 (left) O2 (right).

- 32 -
Gas exchange efficiency of hollow fiber membrane devices like the PRAL is dependent
on the relative velocity between the fluid and the fibers. We hypothesized that relative
velocity was low between the fibers and the fluid in the Generation I prototype because
the fibers were potted directly to the rotating diffuser. Fluid enters the center of the
diffuser with zero angular velocity and is accelerated to the same angular velocity as the
fibers through the rotation of the diffuser. Therefore, the relative angular velocity
between the fluid and the fibers is zero as the fluid enters the fiber bundle. The drag
force of the fibers acts on the fluid elements entraining the fluid within the rotating
bundle and maintaining zero relative velocity as the fluid moves radially through the
bundle toward the outer fiber layers. We hypothesized that relative velocity existed in
the outer fiber layers of the Generation I prototype due to the shear force imposed by
the stationary housing surrounding the fiber bundle. The shear force at the housing wall
opposes the drag force of the fiber bundle to generate relative velocity in the outer
layers depending on the relative magnitudes of the shear and drag forces. We believed
that the relative velocity in the outer layers had no effect on gas exchange with rotation
because the gradient for gas transfer was reduced by the inner fiber layers before the
fluid had reached the outer layers.
We tested the hypothesis that the rotating diffuser in Generation I generated no
relative velocity by fabricating the Generation II prototype, which had a stationary fiber
bundle and a rotating diffuser in the center of the bundle. In this prototype, the fluid
entered the diffuser with zero angular velocity and was accelerated by the rotation of the
diffuser before entering the stationary fiber bundle. In this design, we hypothesized that

- 33 -
the fluid would enter the bundle with high relative velocity and therefore exhibit an
increase in gas exchange with rotation rate.
3.3.2 Generation II – Gas Exchange in Water
Rotation of the center core with a stationary fiber bundle had no effect on gas exchange
in water at 1.5 L/min (Figure 3.4). At zero rotation CO2 removal per area was 100 +/- 0
ml/min/m2, and at 1500 RPM, CO2 removal was 93 +/- 1 ml/min/m2. No effect of rotation
was observed on O2 transfer. At zero rotation O2 supplied per area was 67 +/- 1
ml/min/m2, and at 1500 RPM, O2 supplied was 61 +/- 1 ml/min/m2.
0
20
40
60
80
100
120
0 500 1000 1500Rotation Rate (RPM)
vCO
2/m2 (m
l/min
/m2 )
0
10
20
30
40
50
60
70
80
0 500 1000 1500Rotation Rate (RPM)
vO2/m
2 (ml/m
in/m
2 )
Figure 3.4: Gas exchange per area for Generation II: CO2 (left) O2 (right).
The Generation II prototype flow path was designed with a rotating diffuser and
stationary fiber bundle so that fluid would be introduced into the bundle with high

- 34 -
relative angular velocity. Through experiments in water, we showed that gas exchange
was not increased by rotation of the diffuser. We hypothesized that the drag force
caused by the fibers in both the Generation I and II prototypes was entraining the fluid
within the fiber bundle generating zero relative velocity and hence no increase in gas
exchange with rotation. We formulated a mathematical model to investigate the role of
the drag and shear forces acting on the fluid elements within the fiber bundle. The
model predicted that the drag force due to the rotating fibers was significantly higher
than the shear force resulting in zero relative angular velocity within the first outer layer
of fibers. The model also predicted that the drag force increased with the thickness of
the fiber bundle. The model is described in Chapter 4, and experimental measurements
of gas exchange in the outer layers of fibers (experiments known as selective perfusion)
are also presented in Chapter 5 to investigate the penetration of relative velocity into the
fiber bundle.
We fabricated the Generation III prototype to include stationary walls on the inner and
outer layers of the fiber bundle. We also decreased the thickness of the fiber bundle
from 25 layers to 7 layers maintaining the same surface area as the earlier prototypes
by increasing the length of the bundle from 4 cm to 13 cm. We hypothesized that
stationary walls on the inside and outside of the rotating fiber bundle would create shear
stress to oppose the drag force of the rotating fiber bundle. We decreased the number
of layers to reduce the drag force and enable relative velocity to penetrate further into
the fiber bundle than in the previous PRAL prototypes.

- 35 -
3.3.3 Generation III – Gas exchange in water and blood
Gas exchange increased with rotation in water for the PRAL Generation III (Figure 3.5).
The CO2 exchange per area increased from 78 +/- 4 ml/min/m2 at zero rotation to 189
+/- 2 ml/min/m2 at 1500 RPM. The O2 exchange per area increased from 42 +/- 2
ml/min/m2 at zero rotation to 104 +/- 5 ml/min/m2 at 1500 RPM.
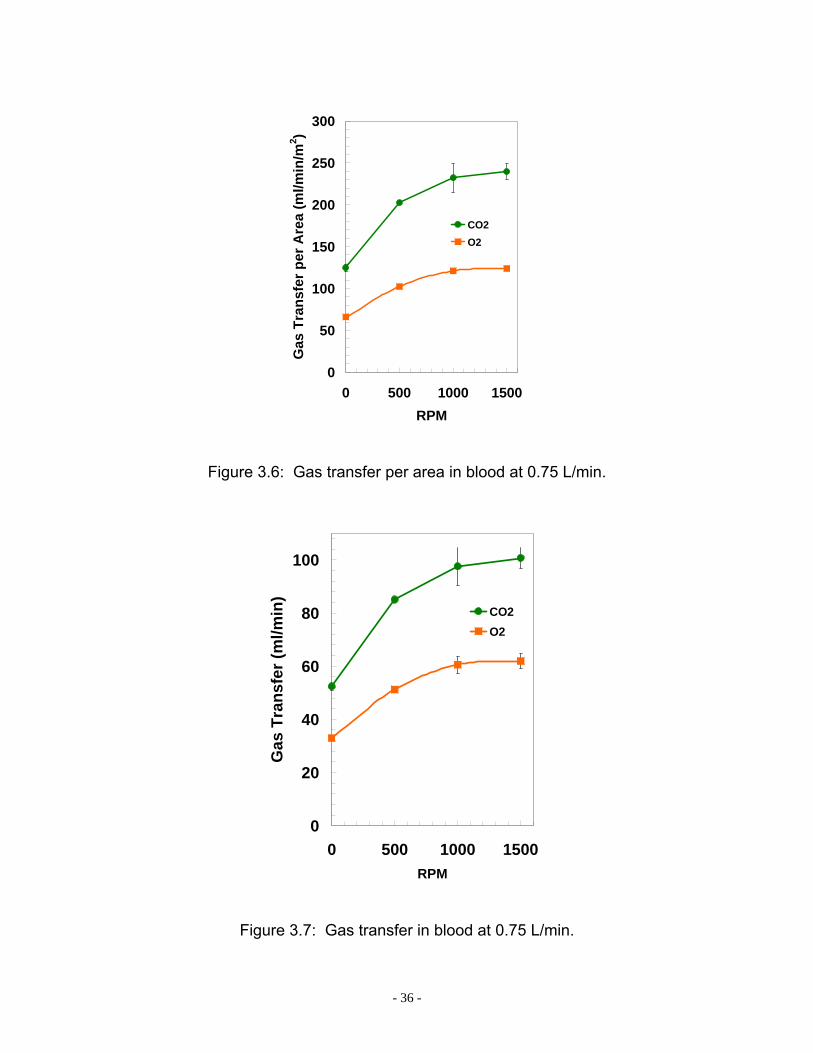
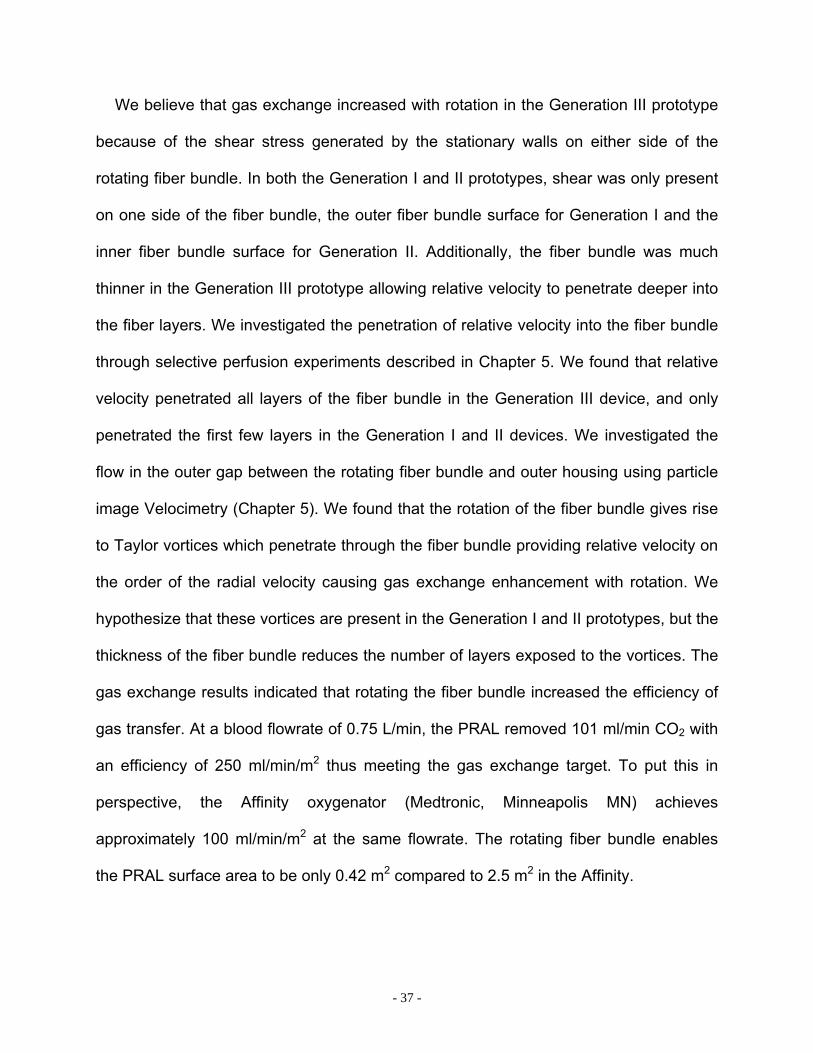
The gas exchange of the PRAL in blood at 0.75 L/min is shown in Figure 3.6 and
Figure 3.7 as a function of rotation rate. The CO2 removal per fiber bundle surface area
was 125 +/- 4 ml/min/m2 at 0 RPM and increased to 240 +/- 9 ml/min/m2 at 1500 RPM.
The O2 supplied per fiber bundle surface area increased from 66 +/- 0 ml/min/m2 to 124
+/- 6 ml/min/m2. Maximum overall gas exchange occurred at 1500 RPM with 101 ml/min
of CO2 removed and 62 ml/min of O2 supplied.
0
50
100
150
200
250
0 500 1000 1500Rotation Rate (RPM)
vCO
2/m2 (m
l/min
/m2 )
0
20
40
60
80
100
120
0 500 1000 1500Rotation Rate (RPM)
vO2/m
2 (ml/m
in/m
2 )
Figure 3.5: CO2 exchange per area (left) and O2 exchange per area (right) for
Generation III.
- 36 -
0
50
100
150
200
250
300
0 500 1000 1500RPM
Gas
Tra
nsfe
r per
Are
a (m
l/min
/m2 )
CO2O2
Figure 3.6: Gas transfer per area in blood at 0.75 L/min.
0
20
40
60
80
100
0 500 1000 1500RPM
Gas
Tra
nsfe
r (m
l/min
)
CO2O2
Figure 3.7: Gas transfer in blood at 0.75 L/min.
- 37 -
We believe that gas exchange increased with rotation in the Generation III prototype
because of the shear stress generated by the stationary walls on either side of the
rotating fiber bundle. In both the Generation I and II prototypes, shear was only present
on one side of the fiber bundle, the outer fiber bundle surface for Generation I and the
inner fiber bundle surface for Generation II. Additionally, the fiber bundle was much
thinner in the Generation III prototype allowing relative velocity to penetrate deeper into
the fiber layers. We investigated the penetration of relative velocity into the fiber bundle
through selective perfusion experiments described in Chapter 5. We found that relative
velocity penetrated all layers of the fiber bundle in the Generation III device, and only
penetrated the first few layers in the Generation I and II devices. We investigated the
flow in the outer gap between the rotating fiber bundle and outer housing using particle
image Velocimetry (Chapter 5). We found that the rotation of the fiber bundle gives rise
to Taylor vortices which penetrate through the fiber bundle providing relative velocity on
the order of the radial velocity causing gas exchange enhancement with rotation. We
hypothesize that these vortices are present in the Generation I and II prototypes, but the
thickness of the fiber bundle reduces the number of layers exposed to the vortices. The
gas exchange results indicated that rotating the fiber bundle increased the efficiency of
gas transfer. At a blood flowrate of 0.75 L/min, the PRAL removed 101 ml/min CO2 with
an efficiency of 250 ml/min/m2 thus meeting the gas exchange target. To put this in
perspective, the Affinity oxygenator (Medtronic, Minneapolis MN) achieves
approximately 100 ml/min/m2 at the same flowrate. The rotating fiber bundle enables
the PRAL surface area to be only 0.42 m2 compared to 2.5 m2 in the Affinity.
- 38 -
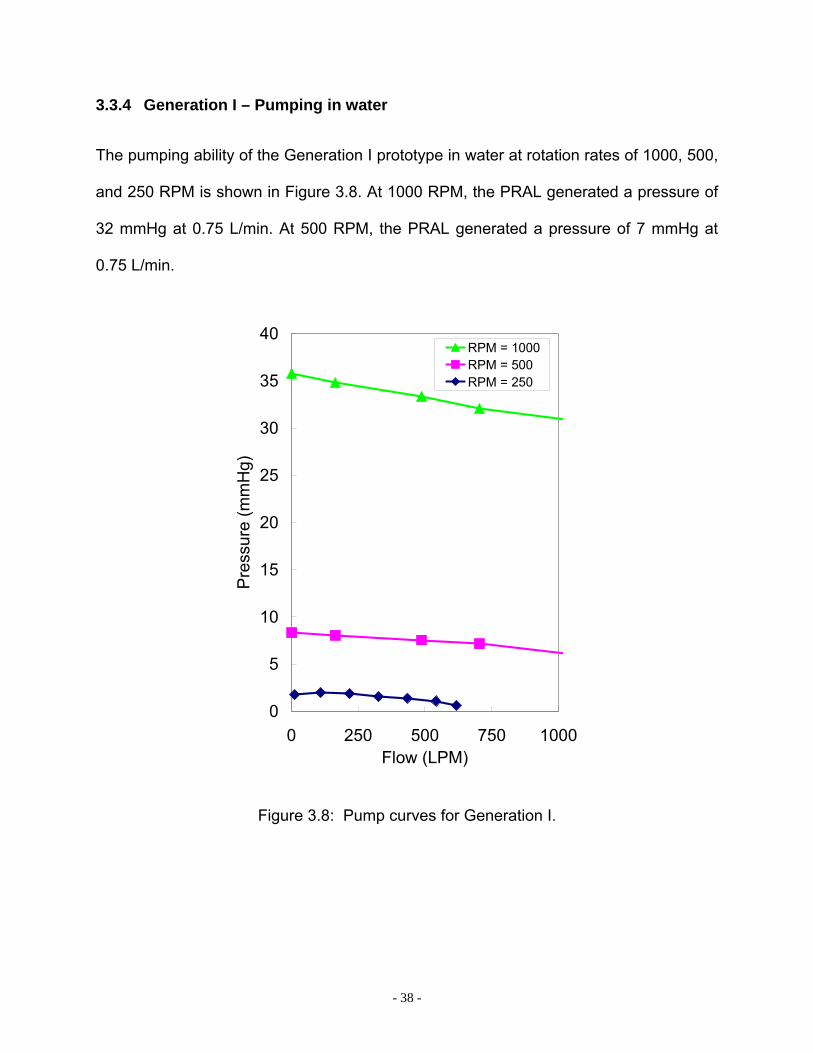
3.3.4 Generation I – Pumping in water
The pumping ability of the Generation I prototype in water at rotation rates of 1000, 500,
and 250 RPM is shown in Figure 3.8. At 1000 RPM, the PRAL generated a pressure of
32 mmHg at 0.75 L/min. At 500 RPM, the PRAL generated a pressure of 7 mmHg at
0.75 L/min.
0
5
10
15
20
25
30
35
40
0 250 500 750 1000Flow (LPM)
Pre
ssur
e (m
mH
g)
RPM = 1000RPM = 500RPM = 250
Figure 3.8: Pump curves for Generation I.
- 39 -
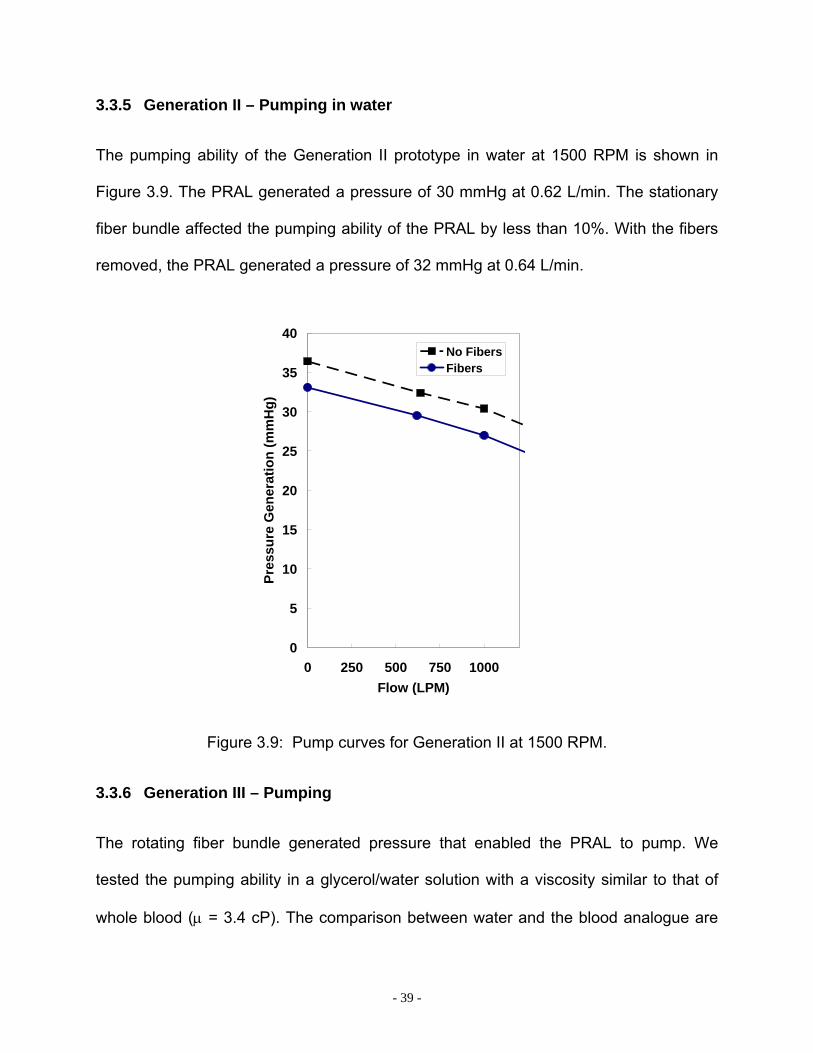
3.3.5 Generation II – Pumping in water
The pumping ability of the Generation II prototype in water at 1500 RPM is shown in
Figure 3.9. The PRAL generated a pressure of 30 mmHg at 0.62 L/min. The stationary
fiber bundle affected the pumping ability of the PRAL by less than 10%. With the fibers
removed, the PRAL generated a pressure of 32 mmHg at 0.64 L/min.
0
5
10
15
20
25
30
35
40
0 250 500 750 1000Flow (LPM)
Pres
sure
Gen
erat
ion
(mm
Hg)
No FibersFibers
Figure 3.9: Pump curves for Generation II at 1500 RPM.
3.3.6 Generation III – Pumping
The rotating fiber bundle generated pressure that enabled the PRAL to pump. We
tested the pumping ability in a glycerol/water solution with a viscosity similar to that of
whole blood (µ = 3.4 cP). The comparison between water and the blood analogue are
- 40 -
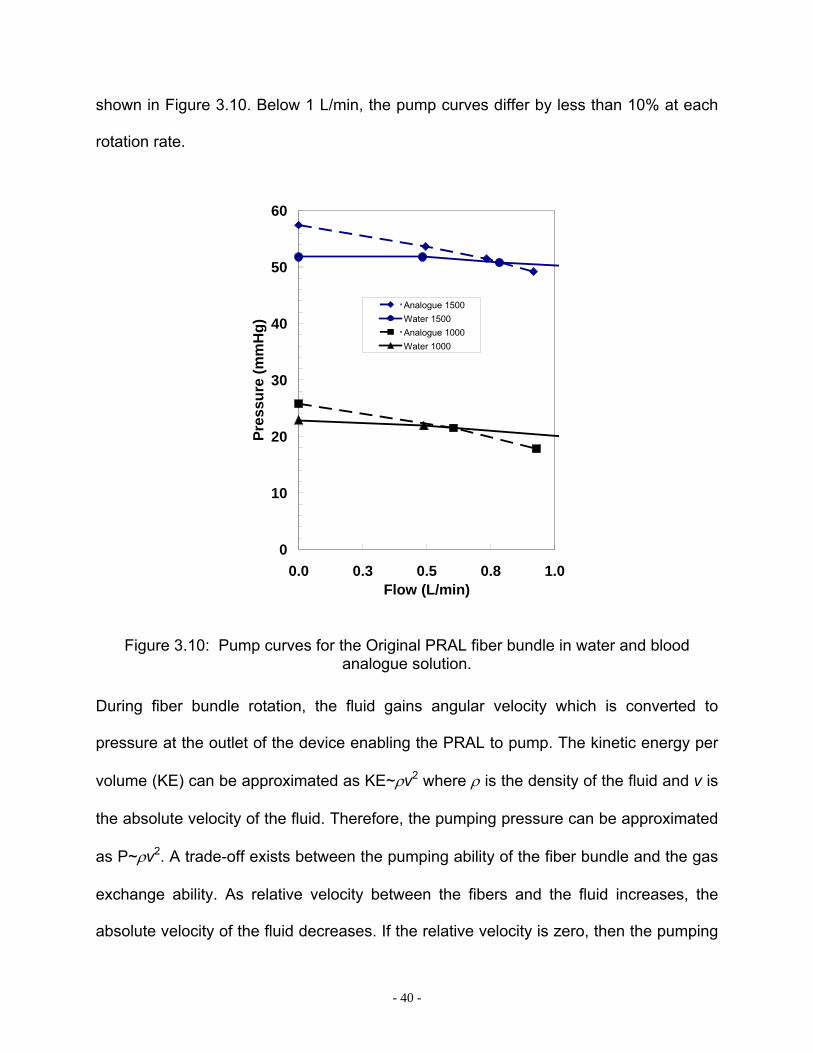
shown in Figure 3.10. Below 1 L/min, the pump curves differ by less than 10% at each
rotation rate.
0
10
20
30
40
50
60
0.0 0.3 0.5 0.8 1.0Flow (L/min)
Pres
sure
(mm
Hg)
Analogue 1500Water 1500Analogue 1000Water 1000
Figure 3.10: Pump curves for the Original PRAL fiber bundle in water and blood analogue solution.
During fiber bundle rotation, the fluid gains angular velocity which is converted to
pressure at the outlet of the device enabling the PRAL to pump. The kinetic energy per
volume (KE) can be approximated as KE~ρv2 where ρ is the density of the fluid and v is
the absolute velocity of the fluid. Therefore, the pumping pressure can be approximated
as P~ρv2. A trade-off exists between the pumping ability of the fiber bundle and the gas
exchange ability. As relative velocity between the fibers and the fluid increases, the
absolute velocity of the fluid decreases. If the relative velocity is zero, then the pumping

- 41 -
pressure generated by the rotating fiber bundle is maximal, but the gas exchange will
not be affected by rotation. As the relative velocity increases, the gas exchange
increases due to rotation, but the pumping ability of the device decreases. In Generation
I, the relative velocity between the fibers and the fluid was zero as shown by the lack of
increase in gas exchange with rotation. In Generation III, the relative velocity was
increased with rotation since the gas exchange was increased. Our PIV studies
indicated that the relative velocity was on the order of the radial velocity. If we subtract
out the radial velocity from the angular velocity, we can estimate the absolute velocity of
the fluid exiting the fiber bundle. Although relative velocity exists within the PRAL fiber
bundle and increases gas exchange, the absolute velocity is still within 90% of the
angular velocity of the fiber bundle enabling the Generation III fiber bundle to generate
nearly the same pressure as the Generation I prototype.
We estimated the pressure that the PRAL needed to generate from the pressure-flow
relationship of a dual lumen cannula commonly used in pediatric ECMO (Origen
Biomedical, [78]). The cannula is 18 Fr and in the flow range of 0.5-0.75 L/min the
pressure drop ranges from 80-100 mmHg. Figure 3.11 is the Generation III pumping
ability with the estimated pressure drop of the proposed cannula (hatched region). The
PRAL prototype generated 52 mmHg at 750 ml/min at 1500 RPM, approximately half of
the required pumping ability.
Dimensional analysis is one approach for estimating the effect of geometric variables
on the pump performance curves [79]. The dependent variables are the head generated
by the pump, h, the angular frequency of the fiber bundle, ω , the outer diameter of the
fiber bundle d, and the flowrate, Q. The rotation rate that will generate 80-100 mmHg

- 42 -
pressure can be calculated by transforming the dependent variables into two
dimensionless groups, the head coefficient defined as 22dghCH ϖ
= and the flow
coefficient defined as 3dQCQ ϖ
= where g is the gravitational constant. Transforming the
data in this way collapses the pump curves into one universal curve (Figure 3.12) that
can be used to estimate the PRAL pumping ability at any angular frequency. The
theoretical pumping ability at 2000 RPM is shown in Figure 3.11 as a solid line. At this
angular frequency, the PRAL pump curve is within the pressure-flow characteristics of
the cannula, indicating that this cannula can be used for our application.
0
20
40
60
80
100
0 250 500 750 1000Flow (ml/min)
Pres
sure
(mm
Hg)
2000 theory
1500
1000
Pumping Requirements18Fr Dual Lumen Cannula
Figure 3.11: Theoretical pump curve meets pumping requirements.

- 43 -
0
0.01
0.02
0.03
0.04
0.05
0.06
0.07
0.08
0 0.2 0.4 0.6Flow Coefficient*1000
Hea
d C
oeffi
cien
t
0
0.01
0.02
0.03
0.04
0.05
0.06
0.07
0.08
0 0.2 0.4 0.6Flow Coefficient*1000
Hea
d C
oeffi
cien
t
22dghCH ϖ
=
3dQCQ ϖ
=
Figure 3.12: Nondimensionalized pump curves.
3.4 SUMMARY
The goal of the PRAL was to provide CO2 removal at a blood flowrate less than 0.75
L/min to allow the native lungs time to heal. The fiber bundle was rotated to increase
gas exchange and enable the PRAL to pump. Generation I and II prototypes did not
exhibit an increase in gas exchange with rotation. The Generation III PRAL exhibited an
increase in gas exchange with rotation of the fiber bundle. The main differences
between Generations I and II and Generation III was that Generation III was
manufactured with 7 layers instead of 25 and rotated between two stationary walls. We
have shown that the pumping in the Generation III design is adequate to provide flow
through an 18 Fr commercially available cannula.

- 44 -
The remaining chapters in this thesis describe the experimental and computational
methods and results that were used to gain an understanding of the mechanism for gas
exchange enhancement that was present in Generation III, but not in Generations I and
II.

- 45 -
4.0 EVALUATION OF UNIFORM FLOW IN THE PRAL
4.1 INTRODUCTION
The Generation III PRAL exhibited increased gas exchange with rotation whereas the
Generation I and II PRAL did not. The fiber bundle thickness of the Generation III
prototype was only 7 layers compared to 25 layers in the previous designs. The
decreased thickness of the Generation III fiber bundle led to an increased penetration of
relative angular velocity into the fiber bundle during rotation and therefore increased gas
exchange. Decreasing the thickness of the fiber bundle also decreased the resistance
to flow in the radial direction of the bundle. If the resistance is too low, the radial flow
entering the bundle will jet along the path of least resistance becoming nonuniform
through the fiber bundle and leading to lower overall gas exchange. We evaluated 3
diffuser designs for their effect on flow distribution by measuring gas exchange for each
design. We injected light sensitive dye into the flow to observe the uniformity of flow as
it exited the fiber bundle. We also measured the local concentration of O2 and CO2 in
the outer gap surrounding the fiber bundle to test for uniformity. We determined that the
resistance in the Generation III fiber bundle is high enough to create uniform radial flow
independent of the diffuser design.
- 46 -
4.2 GAS EXCHANGE IN WATER FOR EACH DIFFUSER
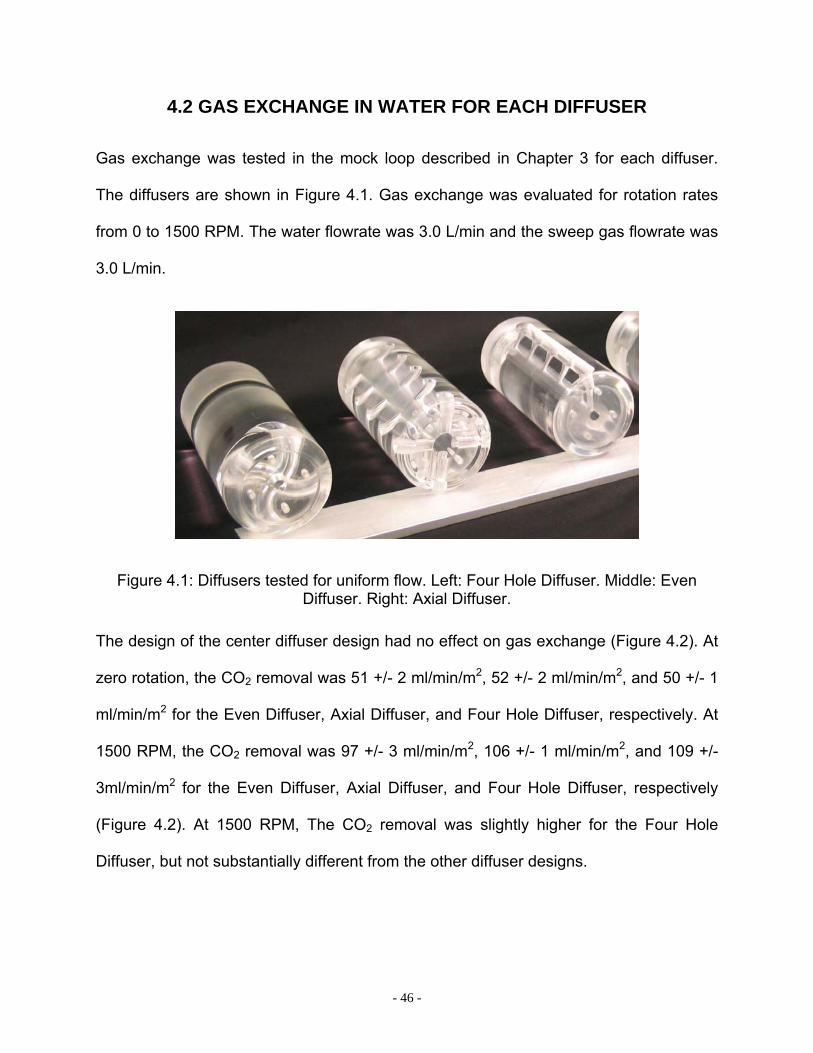
Gas exchange was tested in the mock loop described in Chapter 3 for each diffuser.
The diffusers are shown in Figure 4.1. Gas exchange was evaluated for rotation rates
from 0 to 1500 RPM. The water flowrate was 3.0 L/min and the sweep gas flowrate was
3.0 L/min.
Figure 4.1: Diffusers tested for uniform flow. Left: Four Hole Diffuser. Middle: Even Diffuser. Right: Axial Diffuser.
The design of the center diffuser design had no effect on gas exchange (Figure 4.2). At
zero rotation, the CO2 removal was 51 +/- 2 ml/min/m2, 52 +/- 2 ml/min/m2, and 50 +/- 1
ml/min/m2 for the Even Diffuser, Axial Diffuser, and Four Hole Diffuser, respectively. At
1500 RPM, the CO2 removal was 97 +/- 3 ml/min/m2, 106 +/- 1 ml/min/m2, and 109 +/-
3ml/min/m2 for the Even Diffuser, Axial Diffuser, and Four Hole Diffuser, respectively
(Figure 4.2). At 1500 RPM, The CO2 removal was slightly higher for the Four Hole
Diffuser, but not substantially different from the other diffuser designs.

- 47 -
0
20
40
60
80
100
120
0 500 1000 1500RPM
vCO
2/m2 (m
l/min
/m2 )
Even Diffuser
4 holes
Axial Diffuser
0
20
40
60
80
100
120
140
0 500 1000 1500RPM
vO2/m
2 (ml/m
in/m
2 )
Even Diffuser
4 holes
Axial Diffuser
Figure 4.2: Gas transfer per area for different diffuser designs.
4.3 QUALITATIVE FLOW VISUALIZATION
The setup for flow visualization is shown in Figure 4.3. Water was pumped in a single
pass loop from a reservoir through the PRAL at no rotation and into a sink drain. Light
sensitive dye (Food Coloring, Giant Eagle, Pittsburgh, PA) was injected as a 10 cc
bolus upstream of the centrifugal pump. The dye became well-mixed into the bulk flow
within the centrifugal pump, then flowed into the PRAL. The dye entered the PRAL inlet
at 3 L/min and images of the PRAL were recorded with a digital camcorder. The images
were broken into individual frames and viewed using IrfanView 3.0 software.

- 48 -
Reservoir
Pump
PRAL
Sink Drain
Flow Meter
Dye Injection
PortCamera
Figure 4.3: Schematic of Flow Visualization Setup.
All three stationary diffusers were tested, and the strut cage was used in all designs.
Figure 4.4(a) and Figure 4.4(b) show snapshots of flow through the fiber bundle with the
Even Diffuser as the dye initially enters the fiber bundle and several seconds later.
Initially, the flow appears to be entering the fiber bundle very nonuniformly at the
downstream end of the device, but over time the fluid became more uniformly
distributed throughout the bundle. This process was repeated for each diffuser three
times. In all cases, the flow became uniform within several seconds after the first
appearance of dye indicating that regardless of the diffuser design the resistance of the
fiber bundle caused flow to become uniform.
Figure 4.4: Flow visualization (a) as dye first enters the fiber bundle; (b) several seconds after dye has entered the fiber bundle.
- 49 -
The flow visualization studies confirmed that flow through the fiber bundle was
uniform. Although the flow appeared to be nonuniform at first, the flow became uniform
within several seconds. The reason for this was that the transit time for the flow to reach
the upstream half of the bundle was longer than the transit time for fluid penetrating the
bundle at the downstream half. Therefore, the dye appeared at the downstream end of
the bundle first, and then appeared everywhere as the dye reached all areas of the
bundle. The uniform flow visualized in these studies validated the experimental result
that gas exchange was independent of the diffuser design.
4.4 OUTER GAP AXIAL CONCENTRATION
We measured concentrations of O2 and CO2 in the outer gap between the rotating fiber
bundle and stationary housing at 0 and 1500 RPM for the Four Hole diffuser. The
concentrations of O2 and CO2 were measured at three axial positions along the length
of the fiber bundle. Three 1 mm holes were drilled and tapped at a distance from each
other of 5.5 mm so that luer connections could be used to draw samples (Figure 4.5).
Samples were drawn at each axial location simultaneously into a syringe. The samples
were drawn slowly to prevent disrupting the flow in the gap.

- 50 -
1 2 3
Figure 4.5: Ports along axial length of bundle.
The pO2 and pCO2 concentrations for each axial port are plotted in Figure 4.5 for zero
rotation and a bundle rotation rate of 1500 RPM. At zero rotation, the pCO2 values were
the same for all three axial ports. During rotation at 1500 RPM, the pCO2 values
decreased from 32 +/- 3 mmHg at Port 1 to 19 +/- 0 mmHg at Port 3 (p=0.0004). The
results trended the same way for O2. The stationary bundle pO2 values were the same
for all three axial ports. During rotation at 1500 RPM, the pO2 values increased from
302 +/- 3 mmHg at Port 1 to 504 +/- 0 at Port 3 (p=0.00009).
0
5
10
15
20
25
30
35
40
45
0RPM
PCO
2 (m
mH
g)
Port #1
Port #2
Port #3
0
100
200
300
400
500
0RPM
PO2 (
mm
Hg)
Port #1
Port #2
Port #3
Figure 4.6: Axial partial pressure along the length of the bundle at no rotation. Left: PCO2; Right: PO2.

- 51 -
The axial concentration measurements at zero rotation confirmed that flow through
the bundle was uniform because the concentration was the same at all axial points. If
flow through the bundle was nonuniform, we expect that the concentration would have
varied along the length of the bundle. At regions of lower flow, the pCO2 would have
dropped to lower levels than at regions of higher flow.
Uniform flow in the PRAL fiber bundle depends on the resistance of the fiber bundle
compared to the magnitude of the kinetic pressure exiting the holes in the diffuser. The
kinetic pressure at one of the holes in the Four Hole diffuser was calculated as
2
21 VPkin ρ≈ where ρ is the density of the fluid, and V is the velocity of the fluid exiting the
hole calculated as the flowrate divided by the cross-sectional area of the hole. If the
pressure drop across the bundle is greater than the kinetic pressure of the flow exiting
the diffuser hole, then the flow will be uniform. We placed pressure taps immediately
upstream and downstream of the PRAL and measured pressure drop across the device
as a function of flowrate at zero RPM. We also measured the pressure drop across the
device without the fiber bundle in the device to determine the pressure drop across the
inlet and outlet ports. The pressure drop across the inlet and outlet ports was subtracted
from the pressure drop across the complete device to determine the pressure drop
across the fiber bundle. Figure 4.7 is a plot of the pressure drop across the bundle as a
function of flowrate and the kinetic pressure at one of the holes in the diffuser. The
pressure drop across the bundle is at least 10 times the kinetic pressure of the fluid
exiting one of the holes in the diffuser at all flowrates. Therefore, the resistance of the
fiber bundle creates uniform flow within the PRAL.
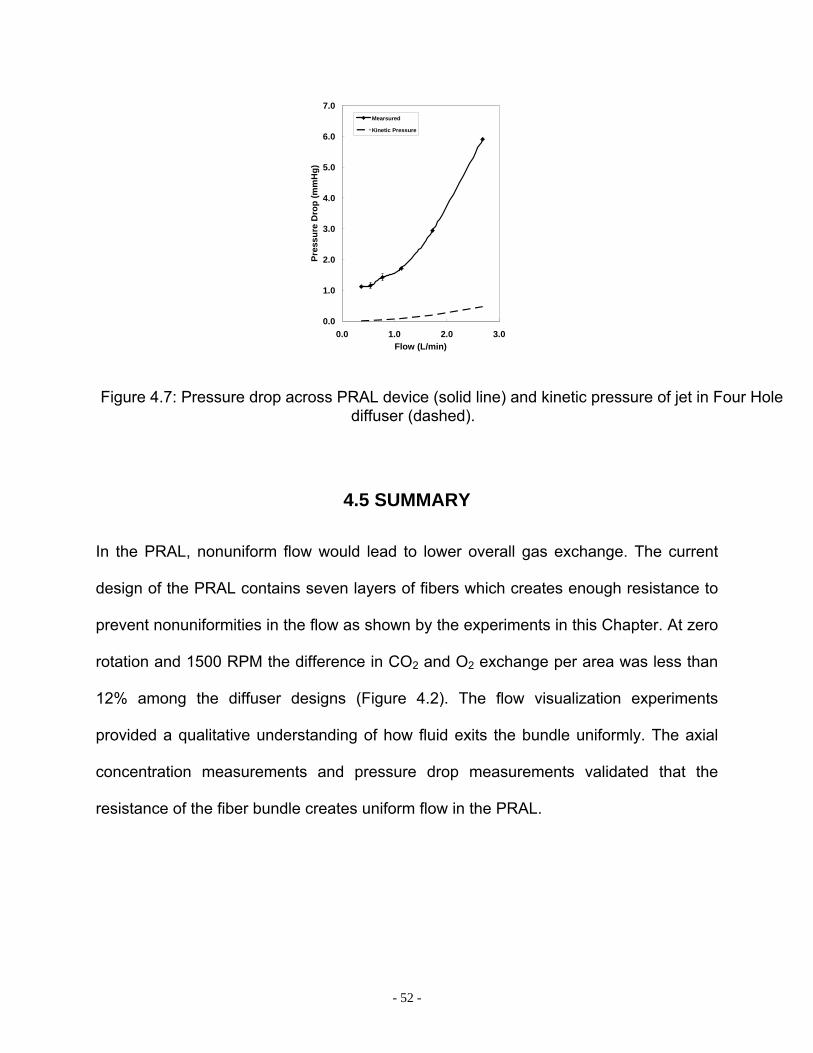
- 52 -
0.0
1.0
2.0
3.0
4.0
5.0
6.0
7.0
0.0 1.0 2.0 3.0Flow (L/min)
Pres
sure
Dro
p (m
mH
g)
Mearsured
Kinetic Pressure
Figure 4.7: Pressure drop across PRAL device (solid line) and kinetic pressure of jet in Four Hole diffuser (dashed).
4.5 SUMMARY
In the PRAL, nonuniform flow would lead to lower overall gas exchange. The current
design of the PRAL contains seven layers of fibers which creates enough resistance to
prevent nonuniformities in the flow as shown by the experiments in this Chapter. At zero
rotation and 1500 RPM the difference in CO2 and O2 exchange per area was less than
12% among the diffuser designs (Figure 4.2). The flow visualization experiments
provided a qualitative understanding of how fluid exits the bundle uniformly. The axial
concentration measurements and pressure drop measurements validated that the
resistance of the fiber bundle creates uniform flow in the PRAL.
- 53 -
5.0 MECHANISMS FOR GAS EXCHANGE ENHANCEMENT DUE TO ROTATION IN THE PRAL
5.1 INTRODUCTION
Gas exchange rates in hollow fiber membrane oxygenators are dependent on the
velocity difference (relative velocity) between the blood and the fibers. One of the goals
in rotating the fiber bundle (or diffuser) in the PRAL is to increase relative velocity to
augment gas exchange without increasing the flowrate of blood through the device. The
magnitude of the relative velocity in the fiber bundle depends on the balance of shear
and drag forces acting on the fluid within the fiber bundle. The drag force is due to the
tightly packed fibers that tend to entrain the fluid during rotation. The shear force results
from the stationary walls surrounding the bundle that acts in the direction opposite of
fiber bundle rotation. If the drag force is much greater than the shear force the fluid
elements become entrained in the rotating fiber bundle and gas exchange is not a
function of rotation rate. In the gas exchange tests discussed in Chapter 3, rotation had
no effect on gas exchange in the Generation I and II PRAL prototypes, whereas in the
Generation III prototype a rotation rate of 1500 RPM produced a 93% increase in gas
exchange. We developed a mathematical model of the drag and shear forces within the
fiber bundle to determine the relative velocity profile within the fiber bundle for each
PRAL prototype. The relative velocity was then input into a mass transfer correlation to
predict the gas exchange rates as a function of rotation rate. The model predicted that
the drag force was high enough to reduce the relative angular velocity to zero within the
first few layers of fibers. The penetration of relative velocity into the bundle was tested
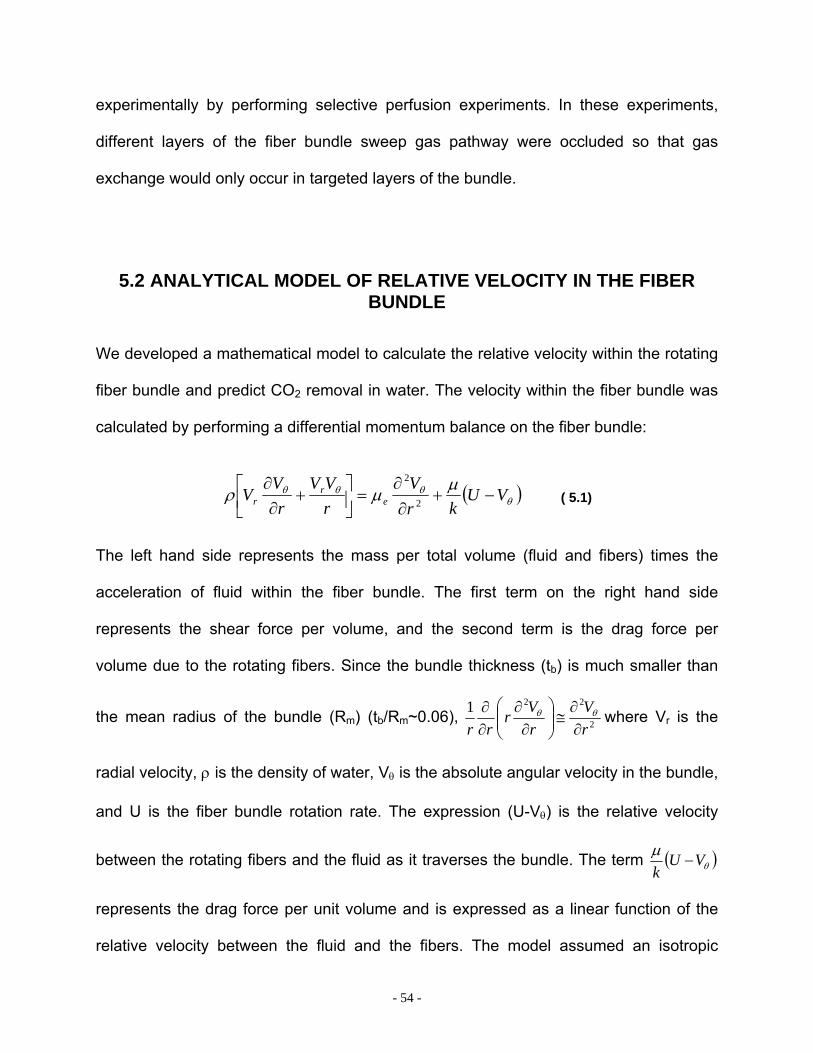
- 54 -
experimentally by performing selective perfusion experiments. In these experiments,
different layers of the fiber bundle sweep gas pathway were occluded so that gas
exchange would only occur in targeted layers of the bundle.
5.2 ANALYTICAL MODEL OF RELATIVE VELOCITY IN THE FIBER BUNDLE
We developed a mathematical model to calculate the relative velocity within the rotating
fiber bundle and predict CO2 removal in water. The velocity within the fiber bundle was
calculated by performing a differential momentum balance on the fiber bundle:
( )θθθθ µµρ VU
krV
rVV
rV
V er
r −+∂
∂=⎥⎦
⎤⎢⎣
⎡ +∂
∂2
2
( 5.1)
The left hand side represents the mass per total volume (fluid and fibers) times the
acceleration of fluid within the fiber bundle. The first term on the right hand side
represents the shear force per volume, and the second term is the drag force per
volume due to the rotating fibers. Since the bundle thickness (tb) is much smaller than
the mean radius of the bundle (Rm) (tb/Rm~0.06), 2
221rV
rVr
rr ∂∂
≅⎟⎟⎠
⎞⎜⎜⎝
⎛∂
∂∂∂ θθ where Vr is the
radial velocity, ρ is the density of water, Vθ is the absolute angular velocity in the bundle,
and U is the fiber bundle rotation rate. The expression (U-Vθ) is the relative velocity
between the rotating fibers and the fluid as it traverses the bundle. The term ( )θµ VUk
−
represents the drag force per unit volume and is expressed as a linear function of the
relative velocity between the fluid and the fibers. The model assumed an isotropic
- 55 -
porous medium with the permeability, k derived from the Blake-Kozeny porous media
model 2
2
)1(150 ε
ε
−= f
dk [80] where df, is the fiber diameter, ε is the bundle porosity, µe is a
Brinkman viscosity that assumes matching of the shear stress at the fluid-fiber interface
[80] defined as ( )( )εµµ −+= 15.21e , µ is the viscosity of the fluid. In addition to angular
velocity, the fluid moves through the bundle in the radial direction. The radial velocity
was calculated by dividing the flowrate by the bundle cross-sectional area Lr
QVrad επ2= .
For Generation I, the boundary condition at the inner radius of the fiber bundle was zero
angular velocity, Vθ=0 because the diffuser and bundle rotate together. The boundary
condition at the outer radius of the fiber bundle was constant shear stress determined
as gap
oRδω
µτ = where Ro is the outer radius of the fiber bundle, and δgap is the gap width
between the rotating bundle and stationary housing. For the Generation I prototype, Ro
= 3.5 cm and δgap was 10 mm. The left hand side of Equation 5.1 was assumed to be
zero because a dimensional analysis indicated that the left hand side was an order of
magnitude lower than either the drag force or the shear force. Equation 5.1 was solved
using the built in ordinary differential solver ‘ODE23’ in MATLAB. The solution to this
equation is the absolute angular velocity of the fluid. The relative angular velocity was
determined by subtracting the absolute angular velocity from the fiber bundle velocity:
θθ VUV rel −=, . The gas exchange of the rotating fiber bundle was then calculated by the
relationship
LMwCO PAkV ∆=2 (5.2)

- 56 -
In this equation, kw is the mass transfer coefficient in water, A is the fiber bundle surface
area, and
⎟⎟⎠
⎞⎜⎜⎝
⎛
−
−−
=∆
gin
gout
outinLM
PPPP
PPP
ln
)( is the log-mean partial pressure difference between the
CO2 in the water and the gas within the fibers. The mass transfer coefficient was
determined from an empirical correlation of the form: 3/1Re ScaSh b= [81, 82] where
Sh is the Sherwood number, Re is the Reynolds number, and Sc is the Schmidt
number. The Sherwood number is defined as: ww
fw
Ddk
Shα
= where αw is the solubility of
CO2 in water and Dw is the diffusivity of CO2 in water. The coefficients a,b depend on
the fiber bundle geometry and were determined experimentally in a stationary fiber
bundle by measuring the gas exchange as a function of flowrate. The details of
determining the coefficients a,b are described in Chapter 9. The Reynolds number is
defined as µ
ρ frel dV=Re where df is the diameter of an individual fiber, ρ is the fluid
density and µ is the fluid viscosity. The magnitude of the relative velocity (angular and
radial) was determined as 22, rrelrel VVV += θ . The expression for the mass transfer
coefficient becomes:
( )brel
bbfwww VdDak )3/1()1(3/2 −−= υα ( 5.3)
This expression was inserted into Equation 5.2 at each rotation rate to predict the gas
exchange of the rotating fiber bundle.

- 57 -
The model was evaluated at 3 L/min and assumed that the sweep gas flow was high
enough that the partial pressure of CO2 in the fibers was Pg=0. Figure 5.1 is a plot of the
relative angular velocity in the Generation I fiber bundle normalized to the radial velocity
at 750 RPM versus the normalized radial distance into the bundle. At the inner radius
(r/h = 0), the fluid enters the bundle with zero relative angular velocity because the
diffuser and fiber bundle rotate together. According to the model, the angular relative
velocity remains zero throughout the bundle because the fluid is entrained in the
rotating fiber except in the 10% of the bundle nearest the stationary housing (r/h = 0.9
through r/h =1). The model predicts that the shear stress caused by the stationary
housing penetrates into the bundle and creates a relative velocity that is 60% of the
radial velocity in the outer fiber layer. The CO2 removal in Generation I as a function of
rotation is shown in Figure 5.2 along with the experimental measurements at 3 L/min.
The predictions are consistent with the gas exchange measurements that rotation had
no effect on gas exchange.
0 0.2 0.4 0.6 0.8 10
0.1
0.2
0.3
0.4
0.5
0.6
0.7
rad
rel
VVθ
hr
RPM = 750
Figure 5.1: Generation I – Normalized relative velocity as a function of normalized radial distance into fiber bundle.
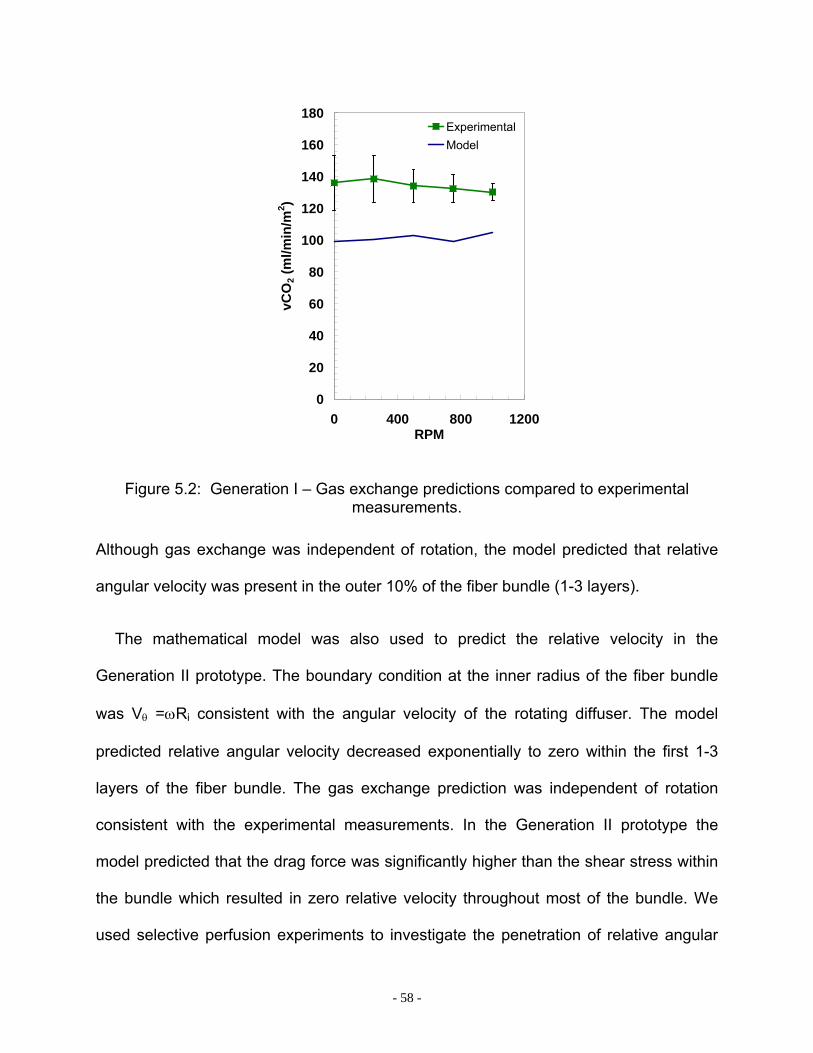
- 58 -
0
20
40
60
80
100
120
140
160
180
0 400 800 1200RPM
vCO
2 (m
l/min
/m2 )
ExperimentalModel
Figure 5.2: Generation I – Gas exchange predictions compared to experimental measurements.
Although gas exchange was independent of rotation, the model predicted that relative
angular velocity was present in the outer 10% of the fiber bundle (1-3 layers).
The mathematical model was also used to predict the relative velocity in the
Generation II prototype. The boundary condition at the inner radius of the fiber bundle
was Vθ =ωRi consistent with the angular velocity of the rotating diffuser. The model
predicted relative angular velocity decreased exponentially to zero within the first 1-3
layers of the fiber bundle. The gas exchange prediction was independent of rotation
consistent with the experimental measurements. In the Generation II prototype the
model predicted that the drag force was significantly higher than the shear stress within
the bundle which resulted in zero relative velocity throughout most of the bundle. We
used selective perfusion experiments to investigate the penetration of relative angular

- 59 -
velocity into the fiber bundle predicted by the model and evaluate gas exchange as a
function of rotation in the fiber layers adjacent to the surfaces surrounding the fiber
bundle.
5.3 SELECTIVE PERFUSION – GENERATION I AND II
The mathematical model predicted that relative velocity existed in the fiber layers
adjacent to the stationary wall surrounding the fiber bundle in Generation I and the fiber
layers adjacent to the rotating core in Generation II. We evaluated these predictions
experimentally by measuring gas exchange in specific layers of the fiber bundle. This
method has been called selective perfusion and has been used previously to obtain
localized measurements of CO2 removal in different regions of the bundle in a pulsating
balloon catheter [83]. Fiber layers were blocked off using either pressure sensitive
adhesive (tape) rings or silicone sealant. Figure 5.3 is a schematic of the cross-section
of the fiber bundle with the fibers open (left) and selective perfusion of the inner layer
(middle) and selective perfusion of the outer layer (right).
All Fibers Open Inner Layer Open Outer Layer Open
Open Fibers
Figure 5.3: Schematic of selective profusion for Generation I and II.
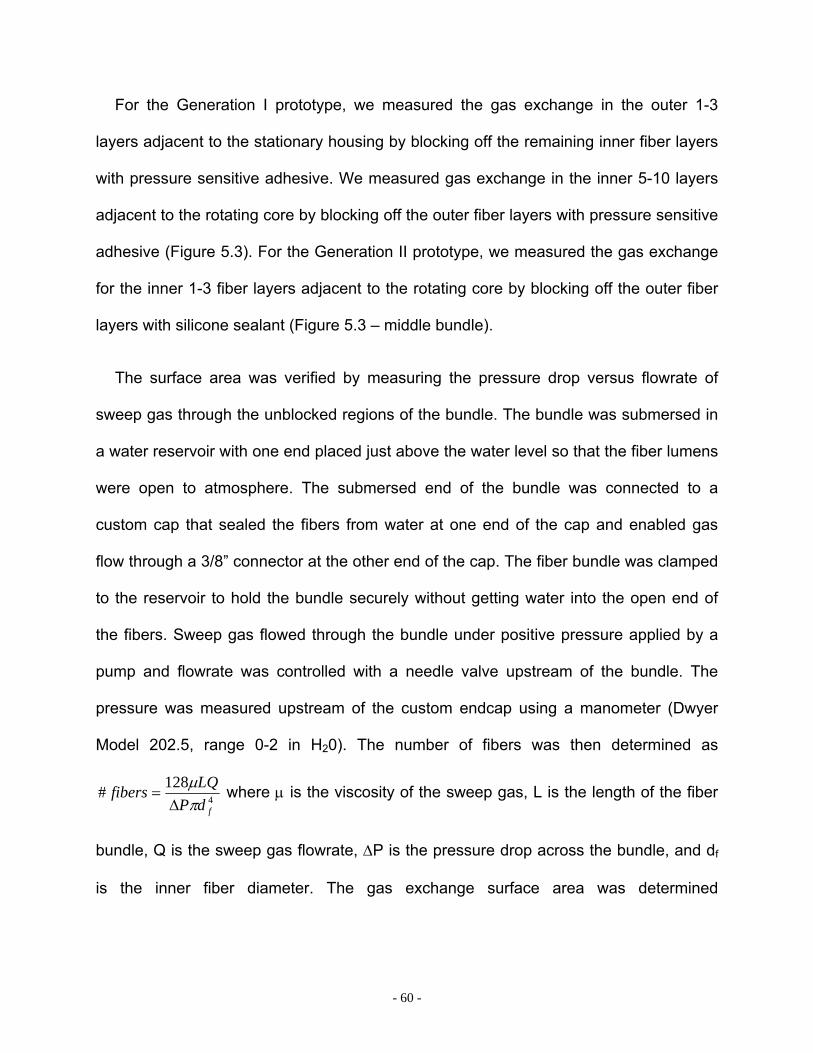
- 60 -
For the Generation I prototype, we measured the gas exchange in the outer 1-3
layers adjacent to the stationary housing by blocking off the remaining inner fiber layers
with pressure sensitive adhesive. We measured gas exchange in the inner 5-10 layers
adjacent to the rotating core by blocking off the outer fiber layers with pressure sensitive
adhesive (Figure 5.3). For the Generation II prototype, we measured the gas exchange
for the inner 1-3 fiber layers adjacent to the rotating core by blocking off the outer fiber
layers with silicone sealant (Figure 5.3 – middle bundle).
The surface area was verified by measuring the pressure drop versus flowrate of
sweep gas through the unblocked regions of the bundle. The bundle was submersed in
a water reservoir with one end placed just above the water level so that the fiber lumens
were open to atmosphere. The submersed end of the bundle was connected to a
custom cap that sealed the fibers from water at one end of the cap and enabled gas
flow through a 3/8” connector at the other end of the cap. The fiber bundle was clamped
to the reservoir to hold the bundle securely without getting water into the open end of
the fibers. Sweep gas flowed through the bundle under positive pressure applied by a
pump and flowrate was controlled with a needle valve upstream of the bundle. The
pressure was measured upstream of the custom endcap using a manometer (Dwyer
Model 202.5, range 0-2 in H20). The number of fibers was then determined as
4
128#fdP
LQfibersπµ
∆= where µ is the viscosity of the sweep gas, L is the length of the fiber
bundle, Q is the sweep gas flowrate, ∆P is the pressure drop across the bundle, and df
is the inner fiber diameter. The gas exchange surface area was determined

- 61 -
as 4
4# fdfibersSA π
∗= . The surface area was averaged over all the sweep gas flow rates
tested.
During the selective perfusion experiments, the gas exchange loop was the same as
that described in Chapter 3. Selective perfusion studies for Generation I and Generation
II were performed at 1.5 L/min and 23º C. The sweep gas flowrate through each region
during the selective perfusion experiments was 6.5 L/min. The surface area for each
fiber region tested in the selective perfusion experiments was independent of gas
flowrate and is shown in Figure 5.4.
0
0.1
0.2
0.3
0.4
0.5
0.6
0.7
0.0 2.0 4.0 6.0 8.0Flowrate (LPM)
Surf
ace
Are
a (m
2 )
1-3 outer layers5-10 outer layersUnblocked BundleInner Fibers
Figure 5.4: Generation I – Surface area measurements during selective perfusion experiments for different regions in the fiber bundle.
The actual surface area of the unblocked fiber bundle was 0.42 m2 based on the
number of fibers used to manufacture the fiber bundle producing an error of 16%. The
measured surface area of the fiber regions is shown in Table 5-1.

- 62 -
Table 5-1: Surface area based on sweep gas flow measurements in selective perfusion experiments.
Fiber Layers (Generation I)
Measured Surface Area (m2)
All layers 0.50 +/- 0.01 m2 Outer 1-3 Layers 0.05 +/- 0.00 m2 Outer 5-10 Layers 0.16 +/- 0.01 m2 Inner 5-10 Layers 0.11 +/- 0.01 m2
The CO2 removal per area for the outer 1-3 layers increased with rotation from 286 +/- 4
ml/min/m2 at zero rotation to 428 +/- 3 ml/min/m2 at 1500 RPM (Figure 5.5). The inner 5-
10 layers potted to the rotating core exhibited no increase in gas exchange with rotation
and exhibited CO2 removal per area of 221 ml/min/m2 at zero rotation to 231 +/- 2
ml/min/m2 at 1500 RPM.
0
50
100
150
200
250
300
350
400
450
500
0 500 1000 1500 2000Rotation Rate (RPM)
vCO
2/m2 (m
l/min
/m2 )
Outer 1-3 Layers
Inner 5-10 Layers
All Layers
Outer 5-10 Layers
Figure 5.5: Selective perfusion in Generation I at a water flowrate of 1.5 L/min.
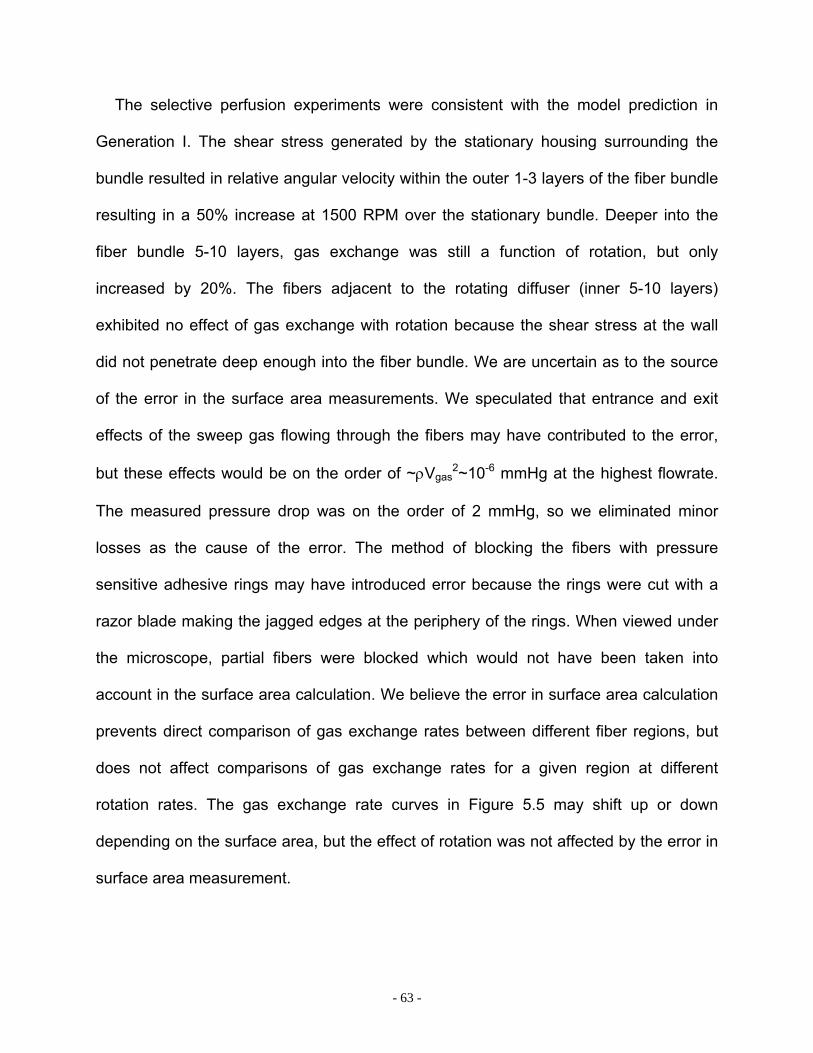
- 63 -
The selective perfusion experiments were consistent with the model prediction in
Generation I. The shear stress generated by the stationary housing surrounding the
bundle resulted in relative angular velocity within the outer 1-3 layers of the fiber bundle
resulting in a 50% increase at 1500 RPM over the stationary bundle. Deeper into the
fiber bundle 5-10 layers, gas exchange was still a function of rotation, but only
increased by 20%. The fibers adjacent to the rotating diffuser (inner 5-10 layers)
exhibited no effect of gas exchange with rotation because the shear stress at the wall
did not penetrate deep enough into the fiber bundle. We are uncertain as to the source
of the error in the surface area measurements. We speculated that entrance and exit
effects of the sweep gas flowing through the fibers may have contributed to the error,
but these effects would be on the order of ~ρVgas2~10-6 mmHg at the highest flowrate.
The measured pressure drop was on the order of 2 mmHg, so we eliminated minor
losses as the cause of the error. The method of blocking the fibers with pressure
sensitive adhesive rings may have introduced error because the rings were cut with a
razor blade making the jagged edges at the periphery of the rings. When viewed under
the microscope, partial fibers were blocked which would not have been taken into
account in the surface area calculation. We believe the error in surface area calculation
prevents direct comparison of gas exchange rates between different fiber regions, but
does not affect comparisons of gas exchange rates for a given region at different
rotation rates. The gas exchange rate curves in Figure 5.5 may shift up or down
depending on the surface area, but the effect of rotation was not affected by the error in
surface area measurement.

- 64 -
We used silicone sealant to block off outer fibers in the Generation II prototype in an
attempt to better seal the fiber layers than with the tape in Generation I. The outer
layers were blocked leaving the inner layer open for gas flow. The surface area
calculated from the sweep gas pressure drop measurements in Generation II prototype
decreased with sweep gas flowrate and on average was 0.01 +/- 0.00 m2 (Figure 5.6).
The inner layer adjacent to the rotating core exhibited an increase in CO2 removal with
rotation from 834 +/- 2 ml/min/m2 at zero rotation to 1186 +/- 1 ml/min/m2 at 1500 RPM
(Figure 5.7). Relative angular velocity was present in the inner fiber layer but drops to
zero as fluid moves radially through the bundle.
0
0.002
0.004
0.006
0.008
0.01
0.012
0 2 4 6 8Gas Flowrate (LPM)
Surf
ace
Are
a (m
2 )
Figure 5.6: Surface area of Generation II inner layer based on pressure drop versus sweep gas flowrate measurements.
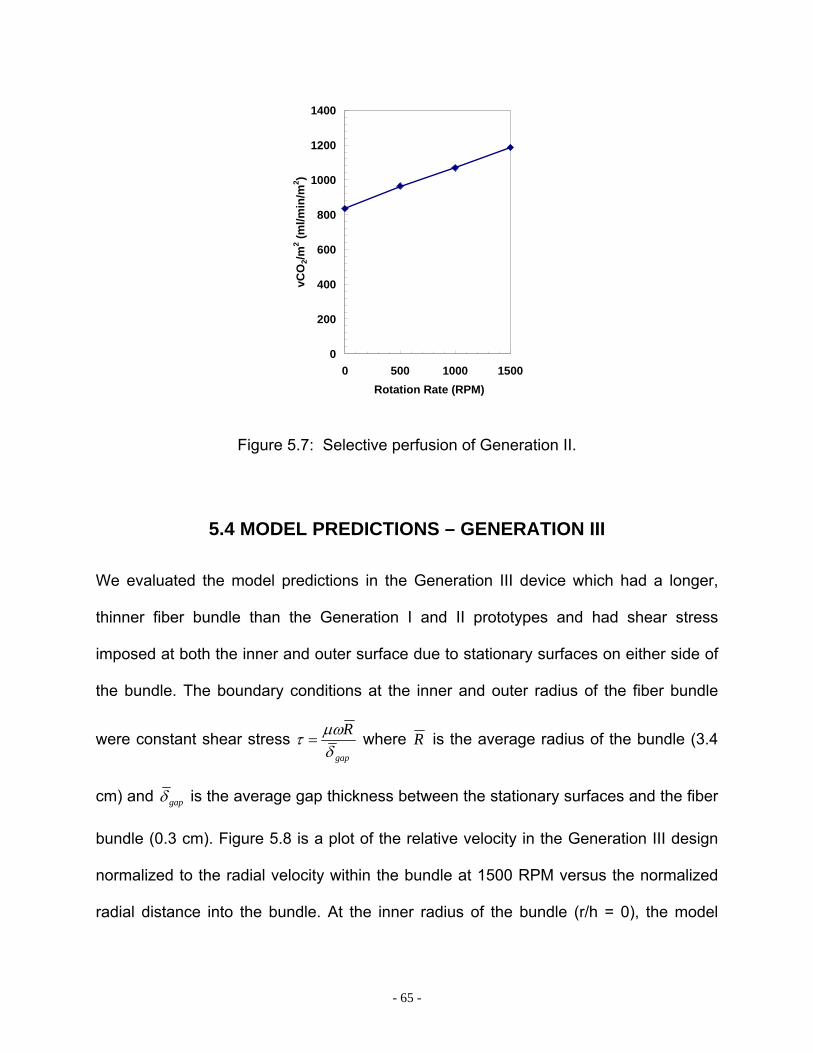
- 65 -
0
200
400
600
800
1000
1200
1400
0 500 1000 1500 Rotation Rate (RPM)
vCO
2/m2 (m
l/min
/m2 )
Figure 5.7: Selective perfusion of Generation II.
5.4 MODEL PREDICTIONS – GENERATION III
We evaluated the model predictions in the Generation III device which had a longer,
thinner fiber bundle than the Generation I and II prototypes and had shear stress
imposed at both the inner and outer surface due to stationary surfaces on either side of
the bundle. The boundary conditions at the inner and outer radius of the fiber bundle
were constant shear stress gap
Rδµωτ = where R is the average radius of the bundle (3.4
cm) and gapδ is the average gap thickness between the stationary surfaces and the fiber
bundle (0.3 cm). Figure 5.8 is a plot of the relative velocity in the Generation III design
normalized to the radial velocity within the bundle at 1500 RPM versus the normalized
radial distance into the bundle. At the inner radius of the bundle (r/h = 0), the model
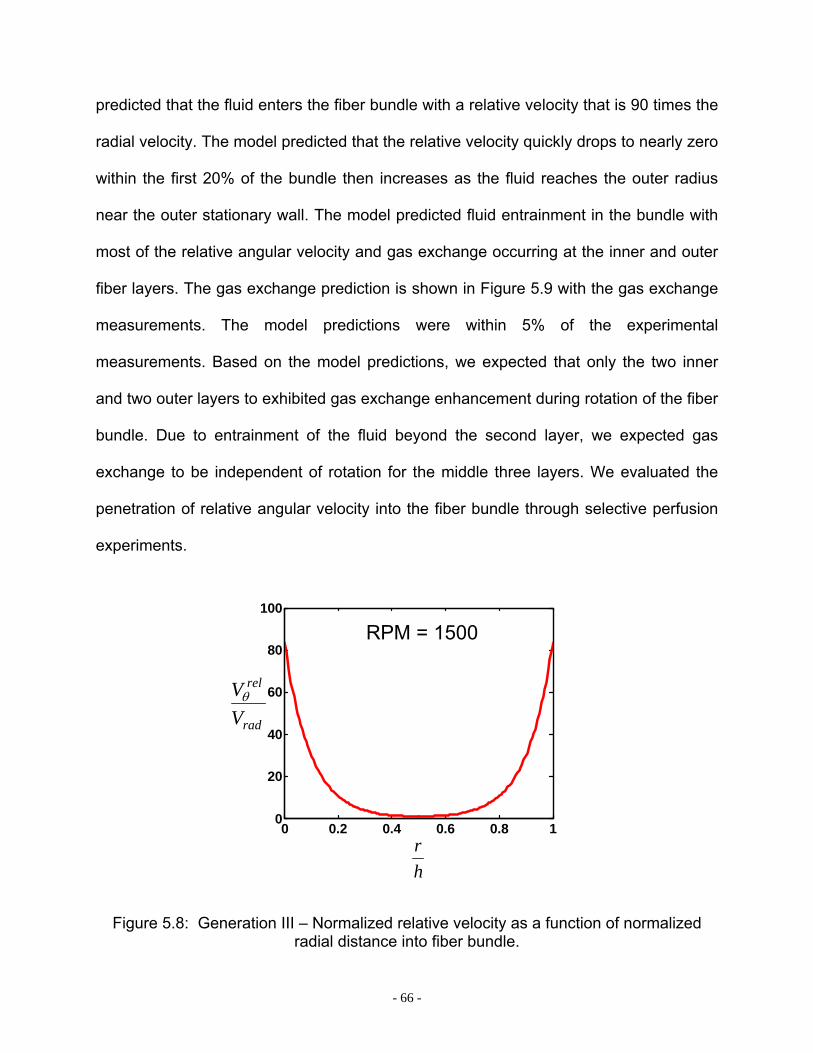
- 66 -
predicted that the fluid enters the fiber bundle with a relative velocity that is 90 times the
radial velocity. The model predicted that the relative velocity quickly drops to nearly zero
within the first 20% of the bundle then increases as the fluid reaches the outer radius
near the outer stationary wall. The model predicted fluid entrainment in the bundle with
most of the relative angular velocity and gas exchange occurring at the inner and outer
fiber layers. The gas exchange prediction is shown in Figure 5.9 with the gas exchange
measurements. The model predictions were within 5% of the experimental
measurements. Based on the model predictions, we expected that only the two inner
and two outer layers to exhibited gas exchange enhancement during rotation of the fiber
bundle. Due to entrainment of the fluid beyond the second layer, we expected gas
exchange to be independent of rotation for the middle three layers. We evaluated the
penetration of relative angular velocity into the fiber bundle through selective perfusion
experiments.
0 0.2 0.4 0.6 0.8 10
20
40
60
80
100
rad
rel
VVθ
hr
RPM = 1500
Figure 5.8: Generation III – Normalized relative velocity as a function of normalized radial distance into fiber bundle.
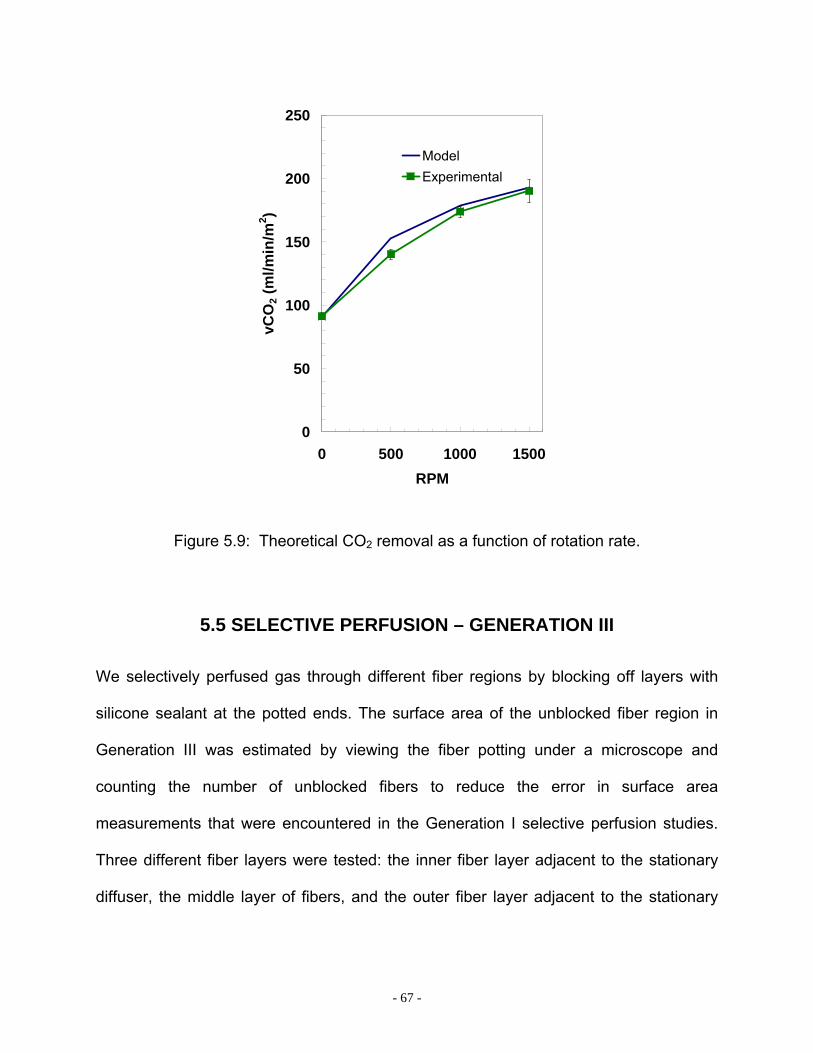
- 67 -
0
50
100
150
200
250
0 500 1000 1500RPM
vCO
2 (m
l/min
/m2 )
ModelExperimental
Figure 5.9: Theoretical CO2 removal as a function of rotation rate.
5.5 SELECTIVE PERFUSION – GENERATION III
We selectively perfused gas through different fiber regions by blocking off layers with
silicone sealant at the potted ends. The surface area of the unblocked fiber region in
Generation III was estimated by viewing the fiber potting under a microscope and
counting the number of unblocked fibers to reduce the error in surface area
measurements that were encountered in the Generation I selective perfusion studies.
Three different fiber layers were tested: the inner fiber layer adjacent to the stationary
diffuser, the middle layer of fibers, and the outer fiber layer adjacent to the stationary
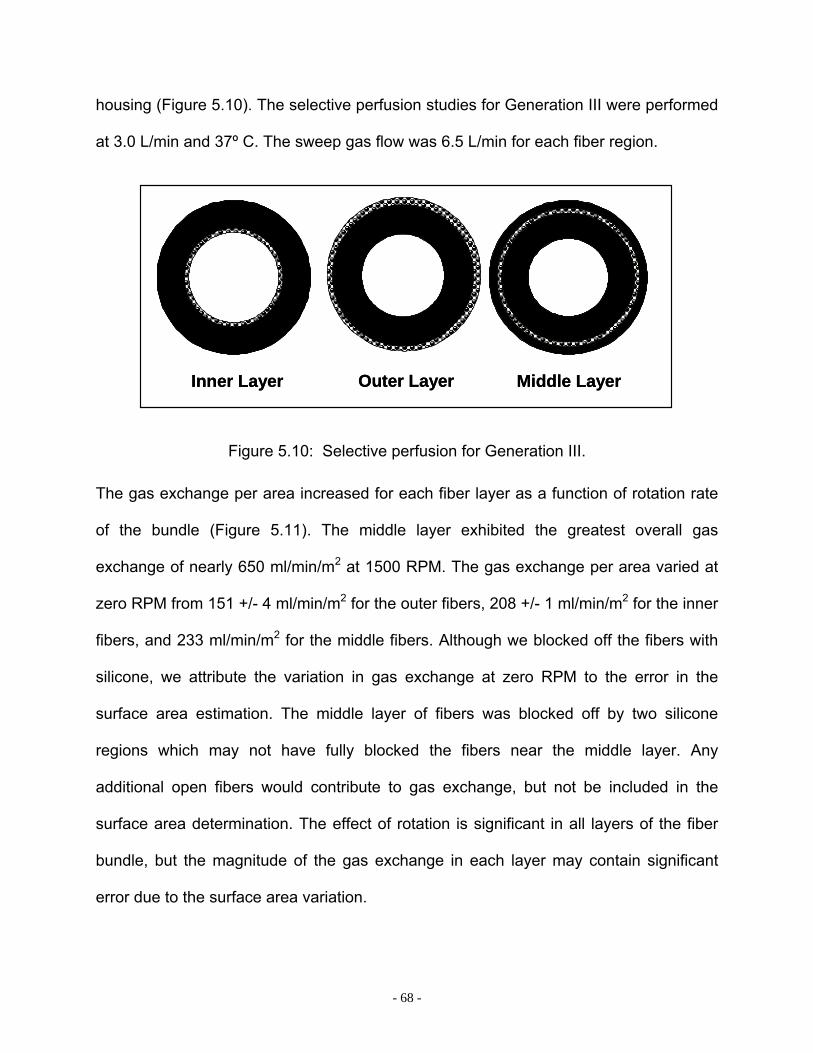
- 68 -
housing (Figure 5.10). The selective perfusion studies for Generation III were performed
at 3.0 L/min and 37º C. The sweep gas flow was 6.5 L/min for each fiber region.
Inner Layer Outer Layer Middle LayerInner Layer Outer Layer Middle Layer
Figure 5.10: Selective perfusion for Generation III.
The gas exchange per area increased for each fiber layer as a function of rotation rate
of the bundle (Figure 5.11). The middle layer exhibited the greatest overall gas
exchange of nearly 650 ml/min/m2 at 1500 RPM. The gas exchange per area varied at
zero RPM from 151 +/- 4 ml/min/m2 for the outer fibers, 208 +/- 1 ml/min/m2 for the inner
fibers, and 233 ml/min/m2 for the middle fibers. Although we blocked off the fibers with
silicone, we attribute the variation in gas exchange at zero RPM to the error in the
surface area estimation. The middle layer of fibers was blocked off by two silicone
regions which may not have fully blocked the fibers near the middle layer. Any
additional open fibers would contribute to gas exchange, but not be included in the
surface area determination. The effect of rotation is significant in all layers of the fiber
bundle, but the magnitude of the gas exchange in each layer may contain significant
error due to the surface area variation.

- 69 -
0
50
100
150
200
250
300
350
400
0 500 1000 1500Rotation Rate (RPM)
vO2/m
2 (ml/m
in/m
2 )
Inner FibersOuter FibersMiddle Fibers
0
100
200
300
400
500
600
700
800
0 500 1000 1500Rotation Rate (RPM)
vCO
2/m2 (m
l/min
/m2 )
Outer Fibers
Inner Fibers
Middle Fibers
0
50
100
150
200
250
300
350
400
0 500 1000 1500Rotation Rate (RPM)
vO2/m
2 (ml/m
in/m
2 )
Inner FibersOuter FibersMiddle Fibers
0
100
200
300
400
500
600
700
800
0 500 1000 1500Rotation Rate (RPM)
vCO
2/m2 (m
l/min
/m2 )
Outer Fibers
Inner Fibers
Middle Fibers
Normal FlowNormal Flow Normal FlowNormal Flow
Figure 5.11: Selective perfusion for the original fiber bundle for normal flow. Left: CO2 removal per area; Right: O2 supplied per area.
The gas exchange in the outer layer was the highest when the data was normalized as
the percent increase over zero rotation (Figure 5.12). The inner fiber layer CO2 removal
increased 153% at 1500 RPM compared to zero RPM, the middle fiber layer increased
182%, and the outer layer increased 255%.
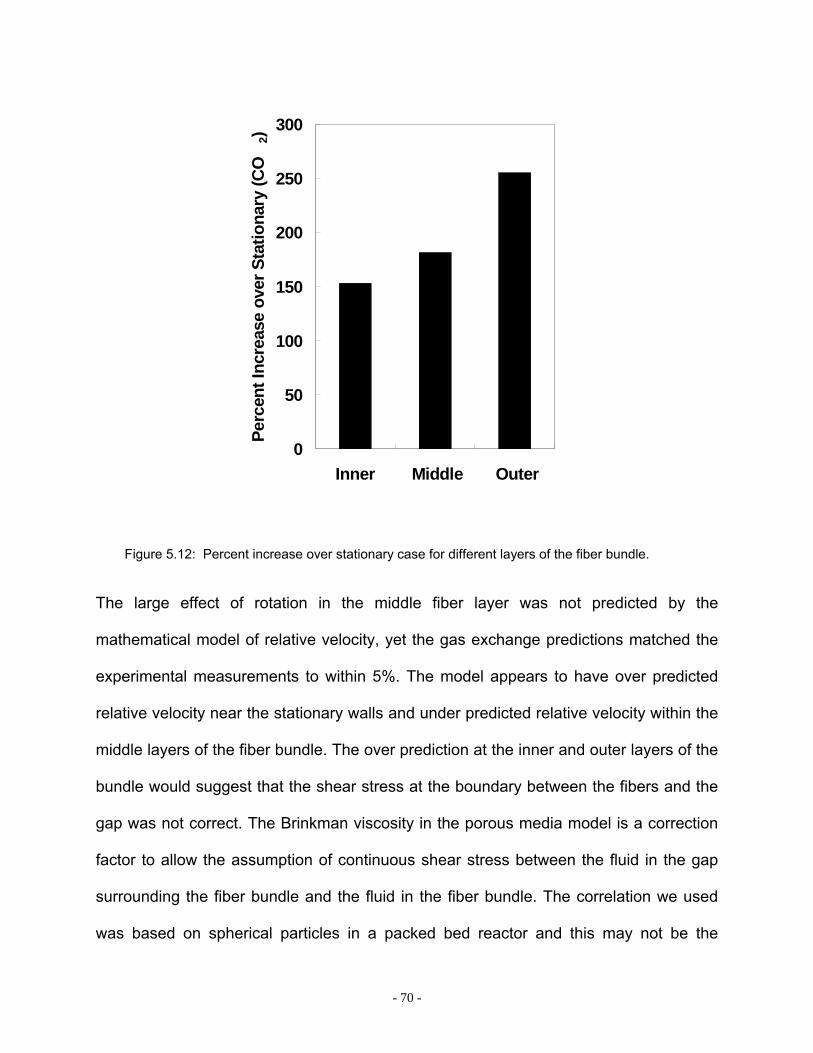
- 70 -
0
50
100
150
200
250
300
Inner Middle Outer
Perc
ent I
ncre
ase
over
Sta
tiona
ry (C
O2)
Figure 5.12: Percent increase over stationary case for different layers of the fiber bundle.
The large effect of rotation in the middle fiber layer was not predicted by the
mathematical model of relative velocity, yet the gas exchange predictions matched the
experimental measurements to within 5%. The model appears to have over predicted
relative velocity near the stationary walls and under predicted relative velocity within the
middle layers of the fiber bundle. The over prediction at the inner and outer layers of the
bundle would suggest that the shear stress at the boundary between the fibers and the
gap was not correct. The Brinkman viscosity in the porous media model is a correction
factor to allow the assumption of continuous shear stress between the fluid in the gap
surrounding the fiber bundle and the fluid in the fiber bundle. The correlation we used
was based on spherical particles in a packed bed reactor and this may not be the
- 71 -
correct effective viscosity for an oxygenator fiber bundle. We believed that the model
could be made more accurate by determining the correct effective viscosity for the
oxygenator fiber bundle. The relative velocity in the middle fiber layers was dictated by
the permeability of the fiber bundle. The Blake-Kozeny approximation of permeability
may not have been valid for the PRAL fiber bundle. By determining the correct
permeability, we believed that the model could be made more accurate and correctly
predict the relative velocity profile within the bundle. Despite the discrepancy between
the model and the gas exchange results, the model appeared to capture the physics of
gas exchange enhancement due to the rotating fiber bundle.
Increasing the relative velocity in the fiber bundle may be achieved by reducing the
drag force per volume, ( )θµ VUk
FD −= acting on the fluid elements. One way to
decrease the drag force is by increasing the permeability of the fiber bundle. One way to
increase the permeability of the fiber bundle is to increase the porosity. In Chapter 6.0,
the effect of increasing the fiber bundle porosity is explored in the mathematical model,
and then tested experimentally by manufacturing fiber bundles with increased porosity.
5.6 SUMMARY
A mathematical model was developed to calculate the relative velocity in the fiber
bundle based on an angular momentum balance. The relative velocity is a function of
the relative magnitudes of the shear and drag forces acting on the fluid within the
bundle. The fiber bundle was modeled as a porous medium using an empirical

- 72 -
permeability coefficient that was a function of the fiber bundle porosity. In the
Generation I prototype, the model predicted that the relative velocity was zero
throughout the entire fiber bundle except in the outer fiber layer next to the stationary
outer housing. The model agreed with the experimental result that gas exchange was
not a function of rotation in the Generation I prototype. We tested the model prediction
that relative velocity was present in the outer layers by performing selective perfusion
experiments where the inner fiber layers were blocked and gas exchange was
measured in only the outer layers. The selective perfusion experiments were consistent
with the model prediction. The outer 1-3 layers exhibited an increase in gas exchange
with rotation while the inner layers did not.
In the Generation III prototype, the model predicted that relative velocity was present
in the inner and outer 20% of the fiber bundle and zero in the middle of the fiber bundle.
The gas exchange predictions were within 5% of the experimental measurements. The
selective perfusion experiments were not consistent with the model prediction that the
relative velocity is near zero in the middle of the bundle. Experimentally, the middle
layer of fibers exhibited a 175% increase in gas exchange at 1500 RPM over the
stationary case. We speculated that the model was not accurately predicting the relative
velocity because the length scale of the porous media model was on the order of
magnitude as the penetration distance of the relative velocity. Since the gas exchange
predictions were within 5%, we believed that the model was overpredicting the relative
velocity at the inner and outer surfaces and underpredicting the relative velocity in the
middle layers. Despite the discrepancy between the model and selective perfusion
experiments, the model appeared to explain the mechanism behind gas exchange

- 73 -
enhancement in the PRAL. We used the model to investigate the effect of increasing
the fiber bundle porosity to increase the penetration of relative velocity into the bundle.
These studies are discussed in Chapter 6.

- 74 -
4 EFFECT OF FIBER BUNDLE POROSITY
6.0 EFFECT OF FIBER BUNDLE POROSITY ON GAS EXCHANGE
6.1 INTRODUCTION
The mathematical model discussed in Chapter 5 predicted that the drag force of the
rotating fiber bundle entrained the fluid elements within the bundle reducing the relative
angular velocity between the fibers and the fluid. We hypothesized that increasing the
spacing between the fibers (porosity) would decrease the drag force and generate
higher relative velocity to increase the overall gas exchange efficiency of the device. In
order to decrease the drag force in the model, the porosity was increased from 0.43 to
0.83 by increasing the fiber bundle thickness from 0.2 cm to 0.4 cm (decreasing the
inner radius of the bundle from 3.3 cm to 3.1 cm) to simulate more spacing between the
fiber layers. The model predictions of relative velocity are shown in Figure 6.1 for the
Generation III prototype with a porosity of 0.43 and the bundle with a porosity of 0.83.
According to the model, as porosity is increased, the fluid becomes less entrained within
the rotating bundle. The predicted normalized relative velocity at the inner radius
increased from 90 for a porosity of 0.43 to over 500 for a porosity of 0.83. The
penetration of relative velocity into the fiber bundle also increased with higher porosity.
The relative velocity went to nearly zero within the first 20% of the fiber bundle when the
porosity was 0.43. When the porosity was 0.83, the model predicted that the relative
velocity remained high in the bundle for the first 40% of the bundle.
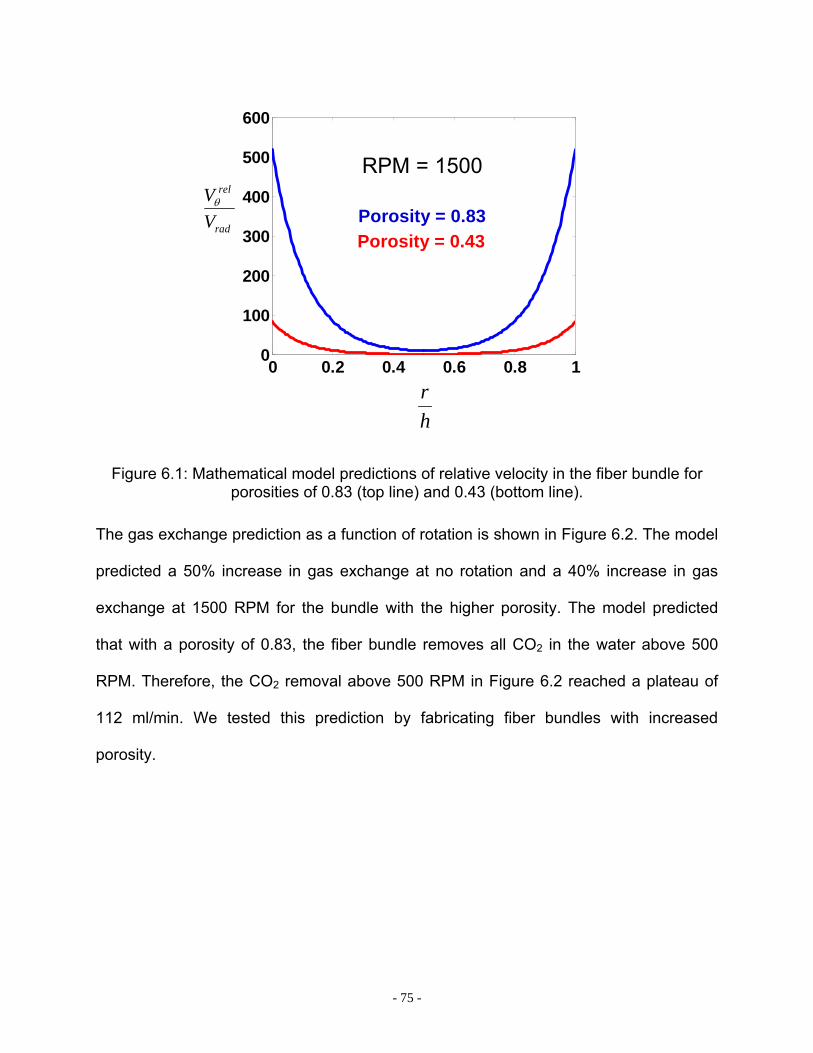
- 75 -
0 0.2 0.4 0.6 0.8 10
100
200
300
400
500
600
hr
rad
rel
VVθ
Porosity = 0.83Porosity = 0.43
RPM = 1500
Figure 6.1: Mathematical model predictions of relative velocity in the fiber bundle for porosities of 0.83 (top line) and 0.43 (bottom line).
The gas exchange prediction as a function of rotation is shown in Figure 6.2. The model
predicted a 50% increase in gas exchange at no rotation and a 40% increase in gas
exchange at 1500 RPM for the bundle with the higher porosity. The model predicted
that with a porosity of 0.83, the fiber bundle removes all CO2 in the water above 500
RPM. Therefore, the CO2 removal above 500 RPM in Figure 6.2 reached a plateau of
112 ml/min. We tested this prediction by fabricating fiber bundles with increased
porosity.
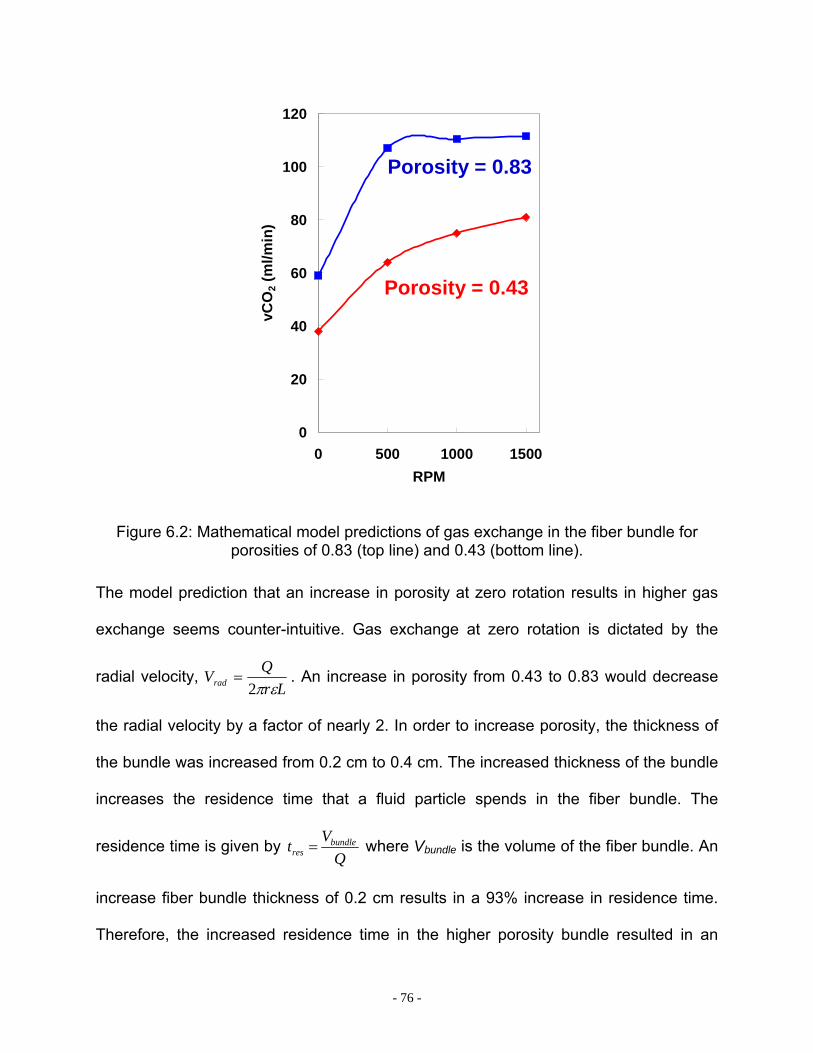
- 76 -
0
20
40
60
80
100
120
0 500 1000 1500RPM
vCO
2 (m
l/min
)
Porosity = 0.83
Porosity = 0.43
Figure 6.2: Mathematical model predictions of gas exchange in the fiber bundle for porosities of 0.83 (top line) and 0.43 (bottom line).
The model prediction that an increase in porosity at zero rotation results in higher gas
exchange seems counter-intuitive. Gas exchange at zero rotation is dictated by the
radial velocity, Lr
QVrad επ2= . An increase in porosity from 0.43 to 0.83 would decrease
the radial velocity by a factor of nearly 2. In order to increase porosity, the thickness of
the bundle was increased from 0.2 cm to 0.4 cm. The increased thickness of the bundle
increases the residence time that a fluid particle spends in the fiber bundle. The
residence time is given by Q
Vt bundleres = where Vbundle is the volume of the fiber bundle. An
increase fiber bundle thickness of 0.2 cm results in a 93% increase in residence time.
Therefore, the increased residence time in the higher porosity bundle resulted in an
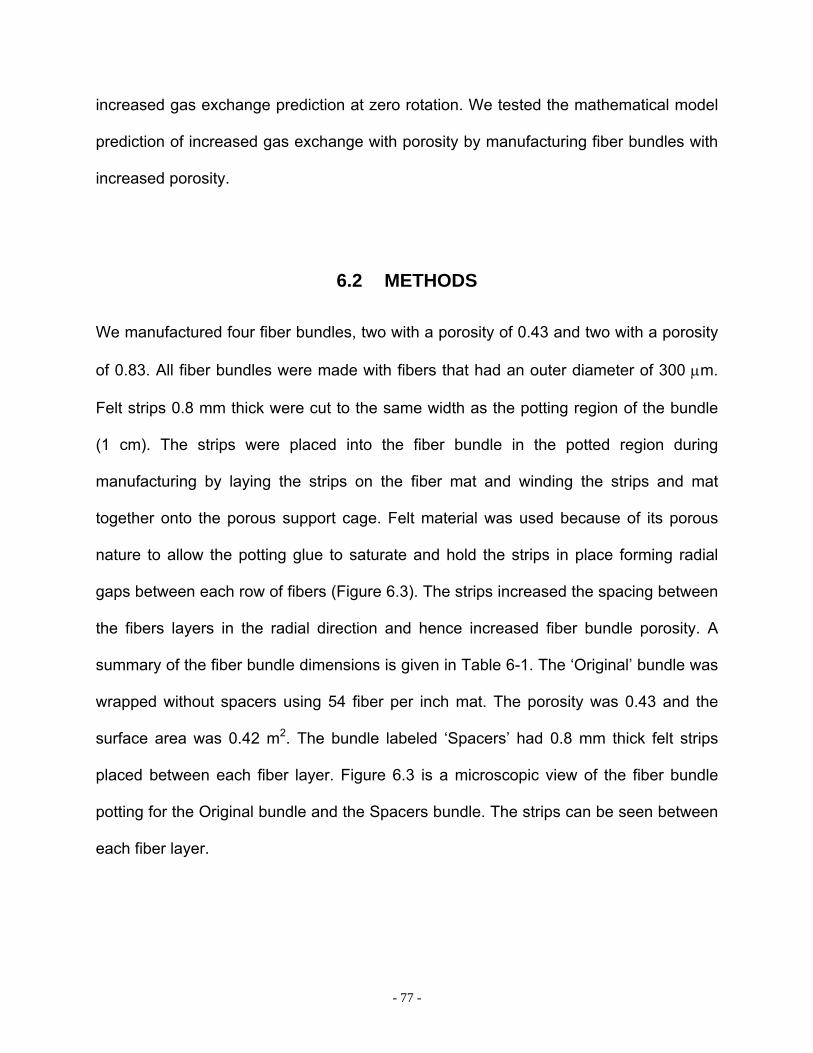
- 77 -
increased gas exchange prediction at zero rotation. We tested the mathematical model
prediction of increased gas exchange with porosity by manufacturing fiber bundles with
increased porosity.
6.2 METHODS
We manufactured four fiber bundles, two with a porosity of 0.43 and two with a porosity
of 0.83. All fiber bundles were made with fibers that had an outer diameter of 300 µm.
Felt strips 0.8 mm thick were cut to the same width as the potting region of the bundle
(1 cm). The strips were placed into the fiber bundle in the potted region during
manufacturing by laying the strips on the fiber mat and winding the strips and mat
together onto the porous support cage. Felt material was used because of its porous
nature to allow the potting glue to saturate and hold the strips in place forming radial
gaps between each row of fibers (Figure 6.3). The strips increased the spacing between
the fibers layers in the radial direction and hence increased fiber bundle porosity. A
summary of the fiber bundle dimensions is given in Table 6-1. The ‘Original’ bundle was
wrapped without spacers using 54 fiber per inch mat. The porosity was 0.43 and the
surface area was 0.42 m2. The bundle labeled ‘Spacers’ had 0.8 mm thick felt strips
placed between each fiber layer. Figure 6.3 is a microscopic view of the fiber bundle
potting for the Original bundle and the Spacers bundle. The strips can be seen between
each fiber layer.
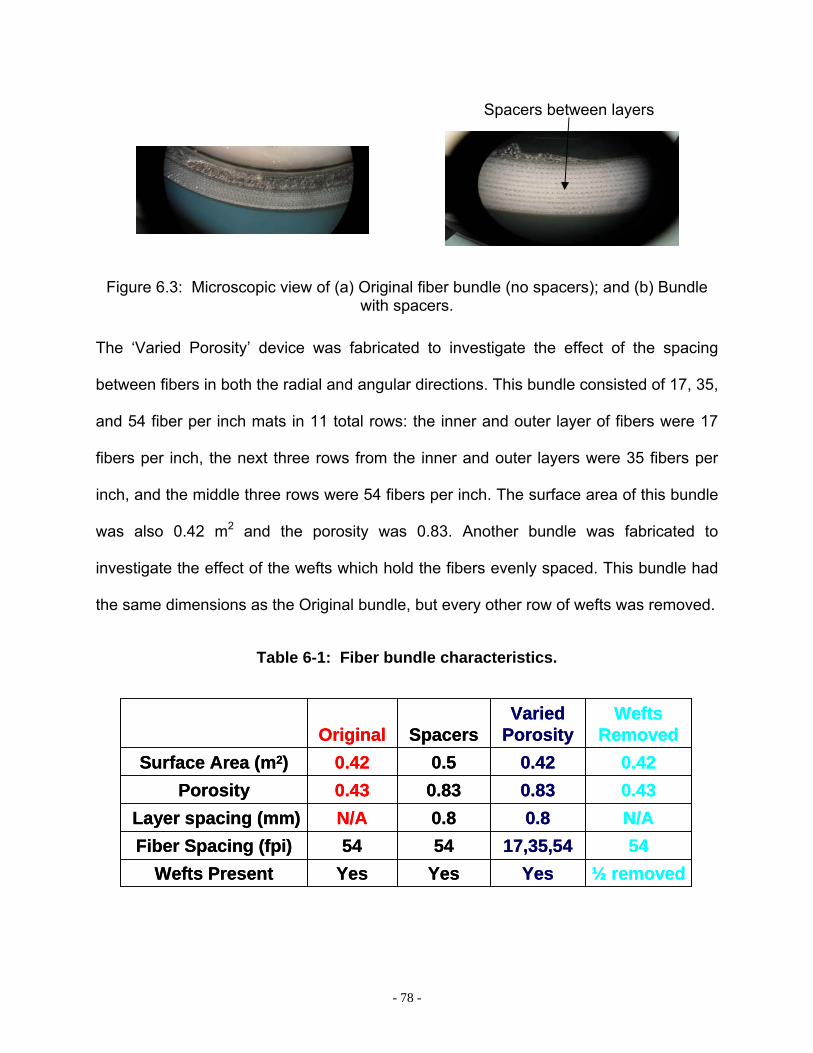
- 78 -
Figure 6.3: Microscopic view of (a) Original fiber bundle (no spacers); and (b) Bundle with spacers.
The ‘Varied Porosity’ device was fabricated to investigate the effect of the spacing
between fibers in both the radial and angular directions. This bundle consisted of 17, 35,
and 54 fiber per inch mats in 11 total rows: the inner and outer layer of fibers were 17
fibers per inch, the next three rows from the inner and outer layers were 35 fibers per
inch, and the middle three rows were 54 fibers per inch. The surface area of this bundle
was also 0.42 m2 and the porosity was 0.83. Another bundle was fabricated to
investigate the effect of the wefts which hold the fibers evenly spaced. This bundle had
the same dimensions as the Original bundle, but every other row of wefts was removed.
Table 6-1: Fiber bundle characteristics.
5417,35,545454Fiber Spacing (fpi)N/A0.80.8N/ALayer spacing (mm)
Yes
0.430.42
Original
Yes
0.830.5
Spacers
½ removedYesWefts Present
0.430.83Porosity0.420.42Surface Area (m2)
Wefts Removed
Varied Porosity
5417,35,545454Fiber Spacing (fpi)N/A0.80.8N/ALayer spacing (mm)
Yes
0.430.42
Original
Yes
0.830.5
Spacers
½ removedYesWefts Present
0.430.83Porosity0.420.42Surface Area (m2)
Wefts Removed
Varied Porosity
Spacers between layers

- 79 -
6.3 GAS EXCHANGE RESULTS IN WATER – EFFECT OF POROSITY
Porosity did not increase the gas exchange efficiency of the PRAL. The gas exchange
for the four fiber bundles in water flowing at 3 L/min is shown in Figure 6.4 for rotation
rates from 0 to 1500 RPM. All four fiber bundle designs exhibited an increase in gas
exchange with rotation. At 1500 RPM, the Original design had the highest CO2
exchange efficiency of 190 +/- 9 ml/min/m2 and the Varied Porosity bundle had the
lowest CO2 efficiency of 172 +/- 7 ml/min/m2. The O2 gas exchange efficiency trended
the same as the CO2 efficiency with the Original design exhibiting the highest O2
exchange efficiency of 120 +/- 2 ml/min/m2 and the Varied Porosity bundle exhibiting the
lowest O2 efficiency of 103 +/- 0 ml/min/m2 at 1500 RPM.
0
40
80
120
160
200
0 500 1000 1500Rotation Rate (RPM)
vCO
2/m2 (m
l/min
/m2 )
Varied Porosity
Original
Spacers
1/2 WeftsRemoved
0
20
40
60
80
100
120
140
0 500 1000 1500Rotation Rate (RPM)
vO2/m
2 (ml/m
in/m
2 )
Varied Porosity
Original
Spacers
1/2 WeftsRemoved
Figure 6.4: CO2 and O2 transfer in water for different fiber bundle designs.
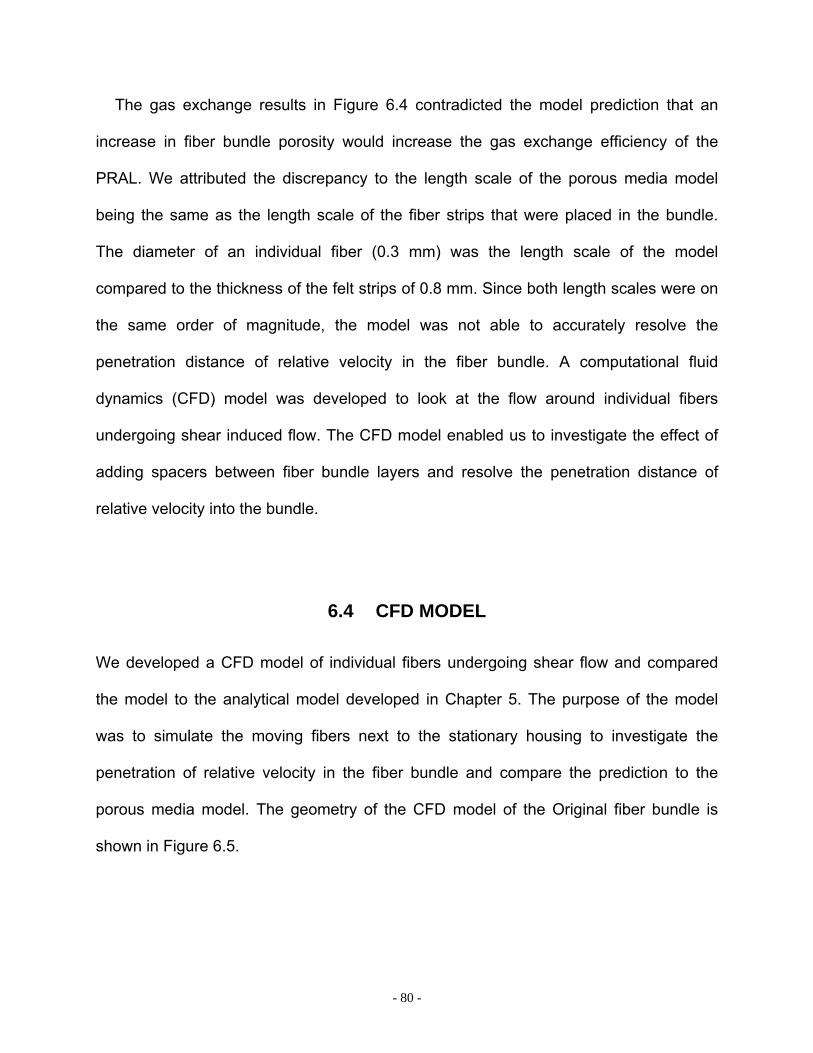
- 80 -
The gas exchange results in Figure 6.4 contradicted the model prediction that an
increase in fiber bundle porosity would increase the gas exchange efficiency of the
PRAL. We attributed the discrepancy to the length scale of the porous media model
being the same as the length scale of the fiber strips that were placed in the bundle.
The diameter of an individual fiber (0.3 mm) was the length scale of the model
compared to the thickness of the felt strips of 0.8 mm. Since both length scales were on
the same order of magnitude, the model was not able to accurately resolve the
penetration distance of relative velocity in the fiber bundle. A computational fluid
dynamics (CFD) model was developed to look at the flow around individual fibers
undergoing shear induced flow. The CFD model enabled us to investigate the effect of
adding spacers between fiber bundle layers and resolve the penetration distance of
relative velocity into the bundle.
6.4 CFD MODEL
We developed a CFD model of individual fibers undergoing shear flow and compared
the model to the analytical model developed in Chapter 5. The purpose of the model
was to simulate the moving fibers next to the stationary housing to investigate the
penetration of relative velocity in the fiber bundle and compare the prediction to the
porous media model. The geometry of the CFD model of the Original fiber bundle is
shown in Figure 6.5.
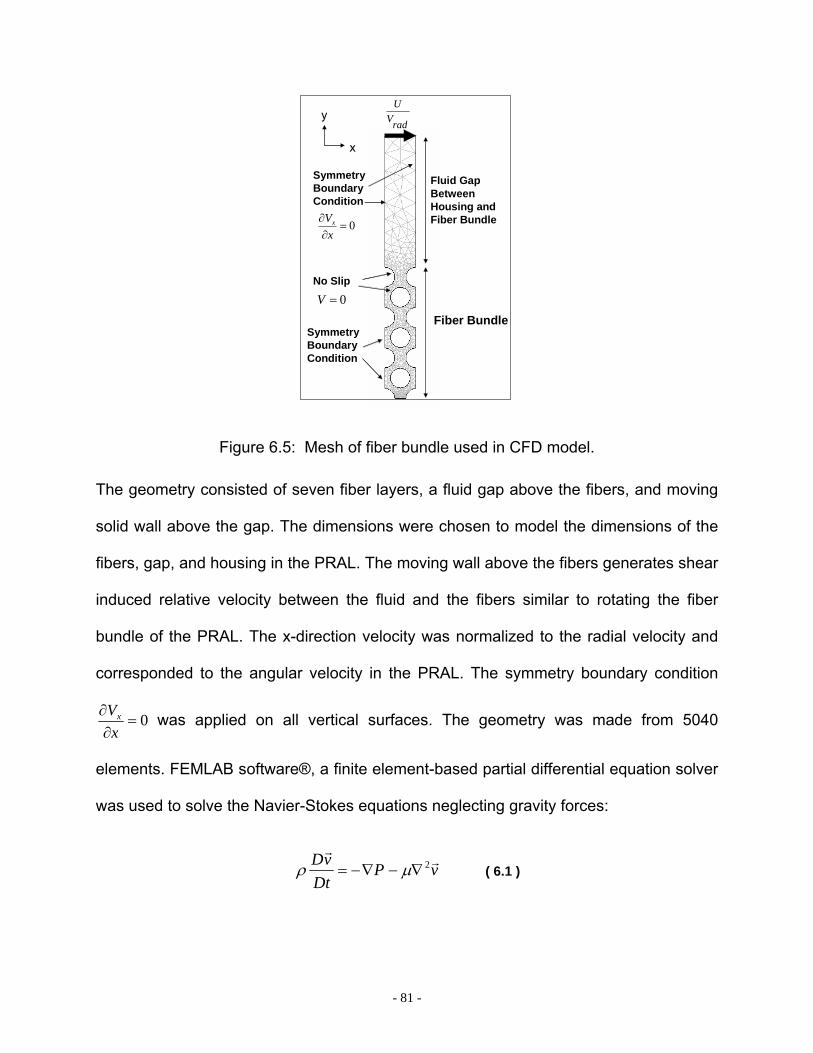
- 81 -
No Slip
radVU
Symmetry BoundaryCondition
0=∂
∂xVx
y
x
0=V
Fluid GapBetweenHousing andFiber Bundle
Fiber BundleSymmetry BoundaryCondition
Figure 6.5: Mesh of fiber bundle used in CFD model.
The geometry consisted of seven fiber layers, a fluid gap above the fibers, and moving
solid wall above the gap. The dimensions were chosen to model the dimensions of the
fibers, gap, and housing in the PRAL. The moving wall above the fibers generates shear
induced relative velocity between the fluid and the fibers similar to rotating the fiber
bundle of the PRAL. The x-direction velocity was normalized to the radial velocity and
corresponded to the angular velocity in the PRAL. The symmetry boundary condition
0=∂
∂xVx was applied on all vertical surfaces. The geometry was made from 5040
elements. FEMLAB software®, a finite element-based partial differential equation solver
was used to solve the Navier-Stokes equations neglecting gravity forces:
vPDt
vD rr
2∇−∇−= µρ ( 6.1 )
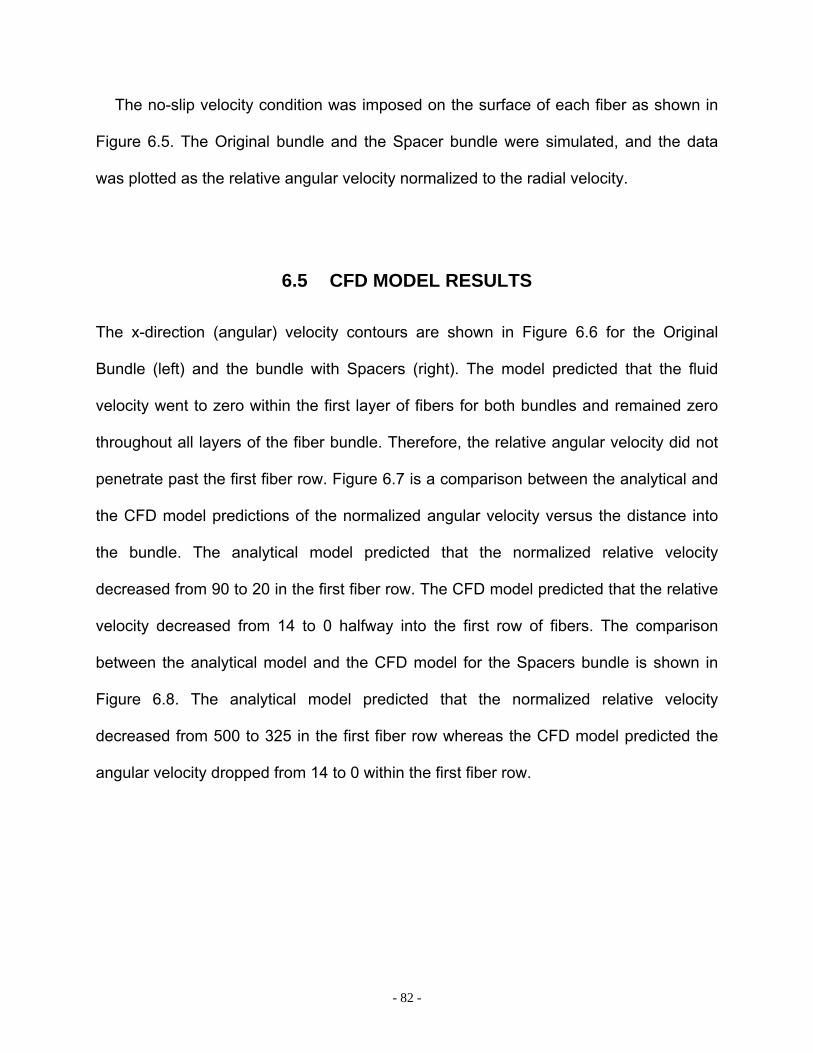
- 82 -
The no-slip velocity condition was imposed on the surface of each fiber as shown in
Figure 6.5. The Original bundle and the Spacer bundle were simulated, and the data
was plotted as the relative angular velocity normalized to the radial velocity.
6.5 CFD MODEL RESULTS
The x-direction (angular) velocity contours are shown in Figure 6.6 for the Original
Bundle (left) and the bundle with Spacers (right). The model predicted that the fluid
velocity went to zero within the first layer of fibers for both bundles and remained zero
throughout all layers of the fiber bundle. Therefore, the relative angular velocity did not
penetrate past the first fiber row. Figure 6.7 is a comparison between the analytical and
the CFD model predictions of the normalized angular velocity versus the distance into
the bundle. The analytical model predicted that the normalized relative velocity
decreased from 90 to 20 in the first fiber row. The CFD model predicted that the relative
velocity decreased from 14 to 0 halfway into the first row of fibers. The comparison
between the analytical model and the CFD model for the Spacers bundle is shown in
Figure 6.8. The analytical model predicted that the normalized relative velocity
decreased from 500 to 325 in the first fiber row whereas the CFD model predicted the
angular velocity dropped from 14 to 0 within the first fiber row.
- 83 -
Direction of flow Direction of flow
ε = 0.42Re = 0.5
ε = 0.80Re = 0.5
Bundlewithspacersbetweenlayers
Figure 6.6: CFD Velocity profiles of Original Bundle (left) and Bundle with Spacers (right).
ε = 0.42Re = 0.5
Distance into fiber bundle
1st Fiber Row
Original
rad
rel
VV ,θ
16
12
8
4
0
rad
rel
VV ,θ
Original
1st Fiber Row
Figure 6.7: Comparison of angular relative velocity prediction for original fiber bundle: analytical model (left) and CFD model (right).

- 84 -
ε = 0.80Re = 0.5
rad
rel
VV ,θ
1st Fiber Row
Spacers between layers
12
8
4
0
16
Distance into fiber bundle
rad
rel
VV ,θ
Spacers between layers
Distance into fiber bundle
1st Fiber Row
Figure 6.8: Comparison of angular relative velocity prediction for Spacers fiber bundle: analytical model (left) and CFD model (right).
The large discrepancy between the analytical model and the CFD model predictions
confirmed that the scale of the porous media model could not resolve the effect of
adding spacers to the fiber bundle. The CFD model was consistent with the
experimental result that adding increasing the porosity of the fiber bundle by adding
spacers did not increase the relative velocity in the fiber bundle and therefore did not
increase gas exchange. However, the CFD model did not explain why the middle layers
of fibers exhibited an increase in gas exchange with rotation in the selective perfusion
studies presented in Chapter 5. We hypothesized that the rotating fiber bundle was
creating recirculation currents (Taylor vortices) in the outer gap resulting in relative
velocity throughout all layers of the fiber bundle. We tested this hypothesis using
selective perfusion experiments in the Original fiber bundle by introducing flow in the
outer gap surrounding the fiber bundle instead of the radially through the fiber bundle
(Figure 6.9). If Taylor vortices were the cause of increased gas exchange then the inner
and middle fibers would exhibit an increase in gas exchange with rotation when flow
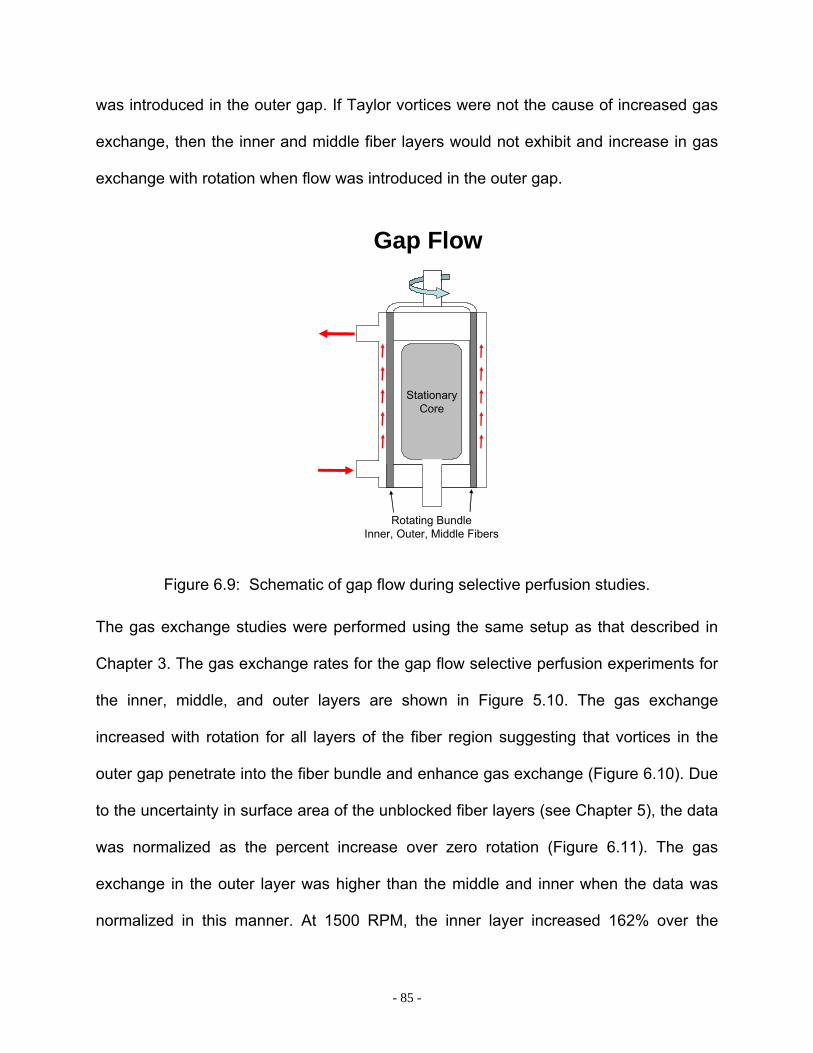
- 85 -
was introduced in the outer gap. If Taylor vortices were not the cause of increased gas
exchange, then the inner and middle fiber layers would not exhibit and increase in gas
exchange with rotation when flow was introduced in the outer gap.
Rotating BundleInner, Outer, Middle Fibers
StationaryCore
Gap Flow
Figure 6.9: Schematic of gap flow during selective perfusion studies.
The gas exchange studies were performed using the same setup as that described in
Chapter 3. The gas exchange rates for the gap flow selective perfusion experiments for
the inner, middle, and outer layers are shown in Figure 5.10. The gas exchange
increased with rotation for all layers of the fiber region suggesting that vortices in the
outer gap penetrate into the fiber bundle and enhance gas exchange (Figure 6.10). Due
to the uncertainty in surface area of the unblocked fiber layers (see Chapter 5), the data
was normalized as the percent increase over zero rotation (Figure 6.11). The gas
exchange in the outer layer was higher than the middle and inner when the data was
normalized in this manner. At 1500 RPM, the inner layer increased 162% over the
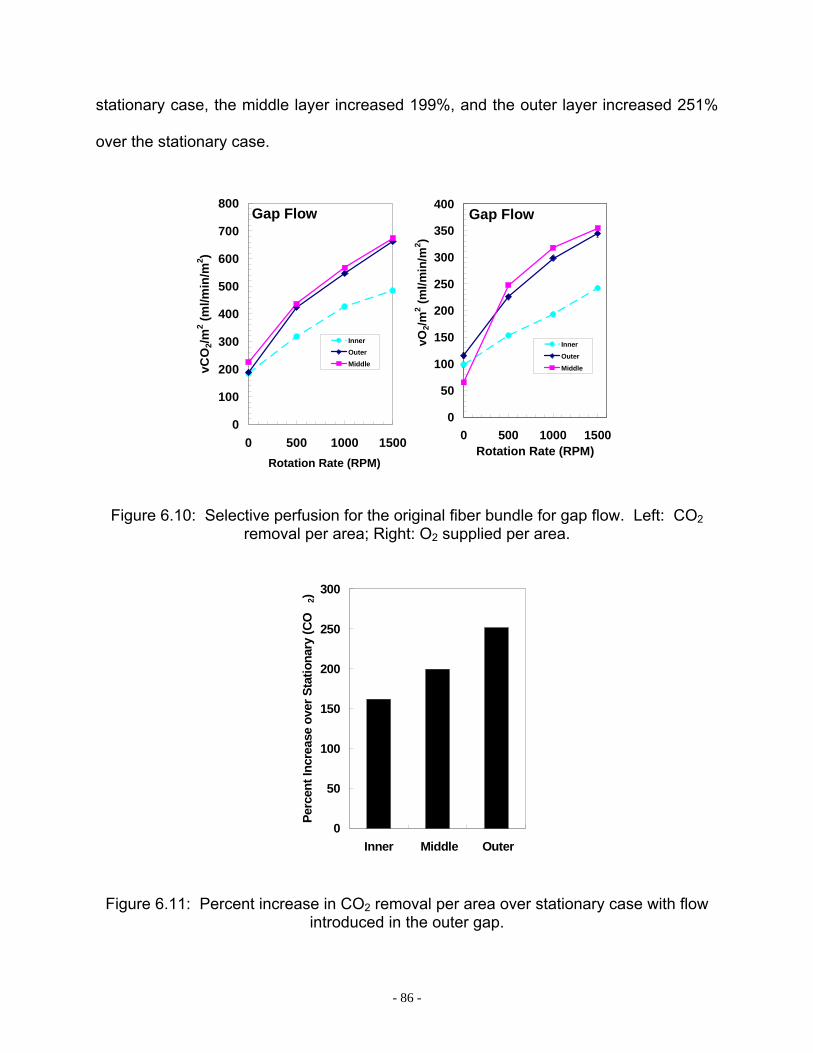
- 86 -
stationary case, the middle layer increased 199%, and the outer layer increased 251%
over the stationary case.
0
50
100
150
200
250
300
350
400
0 500 1000 1500Rotation Rate (RPM)
vO2/m
2 (ml/m
in/m
2 )
Inner
Outer
Middle
Gap Flow
0
100
200
300
400
500
600
700
800
0 500 1000 1500Rotation Rate (RPM)
vCO
2/m2 (m
l/min
/m2 )
InnerOuterMiddle
Gap Flow
Figure 6.10: Selective perfusion for the original fiber bundle for gap flow. Left: CO2 removal per area; Right: O2 supplied per area.
0
50
100
150
200
250
300
Inner Middle Outer
Perc
ent I
ncre
ase
over
Sta
tiona
ry (C
O2)
Figure 6.11: Percent increase in CO2 removal per area over stationary case with flow introduced in the outer gap.
- 87 -
Taylor vortices caused by the rotating fiber bundle appear to be the cause of
increased gas exchange in the PRAL. The vortices form in the gap between the rotating
bundle and stationary outer housing and penetrate throughout the fiber bundle. The
effect of the vortices on gas exchange decreased from the outer to inner layers (Figure
6.11). As fiber bundle thickness increases, the penetration of vortices would likely
decrease which explains why gas exchange was not a function of rotation in the thicker
fiber bundles in the Generation I and II prototypes.
We investigated the fluid dynamics in the PRAL using flow visualization and Particle
Image Velocimetry (PIV) to gain a better understanding of the mechanism for increased
gas exchange in the PRAL.
6.6 PARTICLE IMAGE VELOCIMETRY (ADAPTED FROM [84])
We used particle image velocimetry to investigate the flow field in the gap between the
rotating fiber bundle and the stationary outer housing. The results presented in this
section were obtained in a direct collaboration with Stephanus Budilarto, Ph.D. We used
the images to determine the magnitude of fluid velocity. We fabricated a flat surface
from clear acrylic that mounted onto the side of the PRAL housing halfway between the
inlet and outlet of the device to enable optical access into the device. We used a
Nd:YAB laser (Solo PIV III 15 Hz, New Wave Research Inc., Fremont, CA) that emitted
a 532-nm laser pulse. A Kodak CCD camera (Megaplus ES 1.0, Eastman Kodak
Company, San Diego, CA) and a 60 mm cylindrical lens (Edmund Optics, Barrington,
NJ) was used to capture two sequential images within microseconds apart. XCAP-

- 88 -
standard v.2.2 imaging software (EPIX Inc, Buffalo Grove, IL) was used to operate the
camera. Neutrally buoyant fluorescent polymer microspheres (35-6c, Duke Scientific,
Palo Alto, CA) were used as the tracing particle to measure the flow field in the PRAL,
which was filled with water and de-aired. The inlet and outlet of the device were
clamped off, and the fiber bundle was rotated at 130, 500, and 1500 RPM. The digital
camera was located directly above the PRAL with the focal region on the flat surface
above the gap between the rotating fiber bundle and outer housing. An optical long pass
glass filter (OG 550, Edmund Optic Inc., Barrington, NJ) was placed in front of the
camera to eliminate the reflection of the laser light on the fiber bundle surface.
The fluid velocity in the outer gap was calculated from the two acquired images using
fuzzy logic enhanced PIV software (PIVPROC 6.53) developed by Wernet and the US
NASA Glenn Research Center. The images were divided into 64X64 pixels with 50%
overlapped interrogation areas. The average instantaneous velocity in each
interrogation area was calculated by dividing the average displacement of the particles
by the time separation between images. Fifteen instantaneous pairs of images were
used to calculate the ensemble-averaged velocity distribution of the fluid for each
rotation rate.
6.7 PIV RESULTS
The fiber bundle rotation sets up Taylor vortices in the gap between the bundle and the
stationary outer housing. The diameter of the vortices is roughly the width of the gap. At
all rotation rates, the vortices are laminar. At 130 RPM and 500 RPM the vortices are

- 89 -
stable, and at 1500 RPM the vortices become wavy. Figures Figure 6.12 — Figure 6.14
are two images of velocity vectors for each bundle rotation rate at different time points
and the same location in the gap between the rotating fiber bundle and the stationary
outer housing. The maximum velocity for each rotation rate occurred at the point where
the two vortices met. At 130 RPM, 500 RPM, and 1500 RPM, the maximum velocity
was 0.9 cm/s, 4 cm/s, and 5 cm/s, respectively.
-1 -0.8 -0.6 -0.4 -0.2 0 0.2 0.4 0.6 0.8 1
-0.8 -0.6 -0.4 -0.2 0 0.2 0.4 0.6 0.8
Stationary Outer Housing Stationary Outer Housing
Rotating Fiber Bundle Rotating Fiber Bundle
Figure 6.12: PIV measurements at 130 RPM.
-5 -4 -3 -2 -1 0 1 2 3 4 5 6
-4 -3 -2 -1 0 1 2 3 4
Stationary Outer Housing Stationary Outer Housing
Rotating Fiber Bundle Rotating Fiber Bundle
Figure 6.13: PIV measurements at 500 RPM.

- 90 -
-25 -20 -15 -10 -5 0 5 10 15 20 25-30 -25 -20 -15 -10 -5 0 5 10 15 20 25
Stationary Outer Housing Stationary Outer Housing
Rotating Fiber Bundle Rotating Fiber Bundle
Figure 6.14: PIV measurements at 1500 RPM.
The PIV results are consistent with the current understanding of Taylor vortices in the
literature [85]. Figure 6.15 is a representation of Taylor vortices in the gap between a
rotating cylinder and stationary housing.
δgap
Ro
Ri
Rotating FiberBundle/Cylinder
TaylorVortices
ω
StationaryOuter Housing
Figure 6.15. Schematic representation of Taylor Vortices.
The nature of the vortices changes with rotation rate from laminar and steady, to
laminar and wavy, and finally turbulent. The thresholds for these flow regimes are
determined by the Taylor number:

- 91 -
2/1)(
⎟⎟⎠
⎞⎜⎜⎝
⎛ −−=
i
ioioi
RRRRRR
Taυ
ϖ ( 6.2 )
Steady Vortices: 40 < Ta < 800
Wavy Vortices: 800 < Ta < 2000
Turbulent Vortices: 2000 < Ta < 10000-15000
Turbulence: Ta > 15000
In the PRAL, the maximum Taylor number was 1300, and as shown in the PIV images,
the flow was laminar. Although velocity measurements cannot be made within the fiber
bundle, the vortices appear to be penetrating into the fiber bundle. The selective
perfusion studies verified the penetration of the vortices since all layers of the
Generation III fiber bundle exhibited gas exchange with rotation. We conclude that the
Taylor vortices are the mechanism behind gas exchange enhancement in the PRAL.
The analytical model from Chapter 5 predicted that increasing the porosity of the fiber
bundle would increase the relative velocity between the fibers and the fluid and
therefore increase gas exchange efficiency. To test the model, we manufactured two
fiber bundles with porosities greater than the Original PRAL fiber bundle and one fiber
bundle with half of the wefts removed and measured the gas exchange of all the
bundles in water. The gas exchange rates were the same for all fiber bundle designs
thus contradicting the analytical model predictions.
- 92 -
6.8 SUMMARY
We developed a CFD model to investigate the penetration of relative velocity into the
fiber bundle due to the shear flow in the case of a moving surface next to the fiber
bundle. The plot of the velocity of the fluid in the bundle showed that the relative velocity
between the fluid and the fibers goes to zero within the first layer of fibers. Increasing
the spacing between the layers as we did in the ‘Spacer’ fiber bundle did not change the
result that relative velocity is zero beyond the first fiber layer. The CFD model is
consistent with the experimental result that adding spacers between the layers did not
enable relative velocity to penetrate into the fiber bundle. We hypothesized that the
enhanced gas exchange in the middle fiber layers was due to Taylor vortices that form
in the gap between the rotating fiber bundle. We verified the presence of vortices using
PIV and found that the magnitude of the velocity in the vortices is on the same order of
magnitude as the radial velocity in the bundle.

- 93 -
5 ANALYSIS OF FLOW PATHS
6 HEMOLYSIS
7.0 HEMOLYSIS
7.1 INTRODUCTION
Hemolysis, or the destruction of red blood cells, is a concern for any blood contacting
medical device. Hemolysis occurs when a blood cell is exposed to shear stress for a
long enough period of time to rupture the cell. After cell rupture, the free hemoglobin
binds with haptoglobin, and the hemoglobin-haptoglobin complex is then scavenged
and degraded by monocytes or macrophages. However, if the levels of plasma free
hemoglobin exceed 130-160 mg/dL in vivo, the scavenging mechanisms become
saturated, hemoglobinuria occurs, and organ failure soon follows [86, 87].
Hemolysis has been studied extensively in the blood pump industry. Many variables
play a role in the design of the pump and have an impact on hemolysis. For example,
the seals and bearings have been shown to cause hemolysis due to heat generation
caused by the friction of the rotating shaft against the seal [88, 89]. The clearance
between the impeller and the casing has been shown to affect hemolysis because of the
exposure of blood cells to high shear stress. The shape and rotation rate of the impeller
also has an impact on hemolysis [90, 91].

- 94 -
Computational fluid dynamics (CFD) has become an important tool for designing
blood pumps. Investigators have calculated the pathlines of particles flowing through the
pump and predicted hemolysis from an empirically derived correlation involving shear
stress and exposure time of a blood element moving along the pathline [92-107].
Investigators have been able to redesign the geometry of the pump to reduce hemolysis
by reducing the exposure time of blood elements to shear stress.
For CFD simulations of the PRAL, computational power is not sufficient to model
each individual fiber within the rotating fiber bundle. One approach to overcoming
computational limitations is to approximate the fiber bundle as a porous media. Shear
stress within the bundle would be calculated based on an average superficial velocity as
an approximation to the local velocity around the fibers in the rotating bundle. Another
approach is to model the individual fibers in a smaller section of the fiber bundle. This
approach would more accurately resolve the velocity around the individual fibers, and
would require proper scale-up of the domain to accurately predict the influence of the
entire bundle on hemolysis. We believe that the shear stress within the bundle may not
be traumatic to blood cells due to the entrainment of the fluid in the rotating fiber bundle.
A more important application of CFD in the PRAL would be to investigate the shear
stress in the gap between the rotating bundle and stationary outer housing. The
exposure time of a fluid particle to shear stress in this gap varies as the particle moves
through the vortices in the gap. Future studies of the PRAL using CFD will focus on
determining the magnitude of shear stress in the gap to predict hemolysis. CFD will be a
useful tool for reducing hemolysis in the PRAL. Blood experiments must still be
performed to fully understand the impact of design changes on hemolysis.

- 95 -
This chapter details the in vitro evaluation of hemolysis in the PRAL and several
variables that we investigated for their contribution to hemolysis. These variables
included the seals, the shear stress in the outer gap between the fiber bundle and
housing, the shear stress in the inner gap between the diffuser and fiber bundle, the
support cage, and the outlet port. We concluded that the seals did not contribute
significantly to hemolysis. The shear stress in the gap between the rotating fiber bundle
and stationary outer housing did not contribute to hemolysis, but the surface roughness
of the fiber bundle may be responsible for increased levels of hemolysis. The inner gap
between the rotating bundle and the stationary diffuser was not a source of hemolysis
and neither was the outlet port. A support cage made of circular struts exhibited higher
hemolysis than a support cage made of a porous sheet.
7.2 MATERIALS AND METHODS
The in vitro hemolysis evaluation of the PRAL was performed by comparing the level of
plasma free hemoglobin generated by the PRAL to the level generated by a
commercially available oxygenator. The control loop consisted of a blood reservoir
(Affinity Blood Reservoir, Medtronic, Minneapolis, MN), a commercially available
oxygenator (Terumo Capiox or the Cobe Optima) and a Biomedicus pump (BPX-80,
Medtronic, Minneapolis, MN). The integral heat exchanger in the oxygenator was used
to maintain the temperature at 37 C. The flowrate through the control loop was 4 L/min.
The PRAL loop consisted of a main loop containing the same blood reservoir as the
control loop, a Biomedicus pump, and a bypass loop which branched off of the main
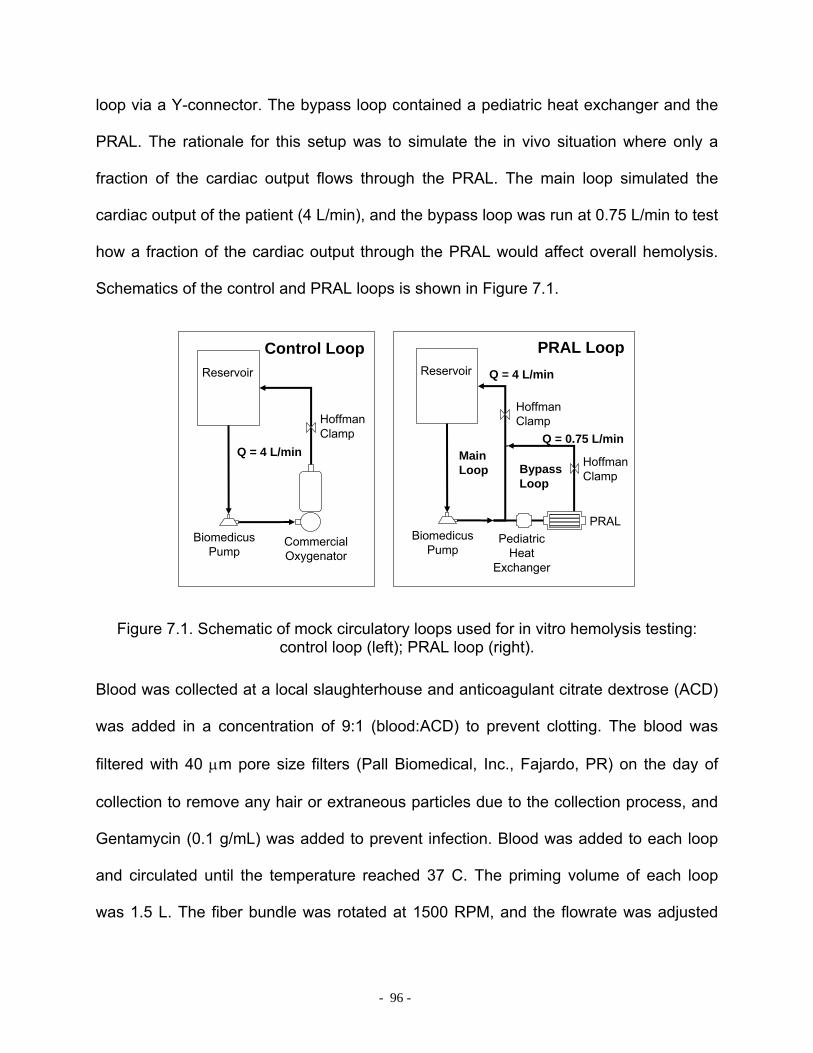
- 96 -
loop via a Y-connector. The bypass loop contained a pediatric heat exchanger and the
PRAL. The rationale for this setup was to simulate the in vivo situation where only a
fraction of the cardiac output flows through the PRAL. The main loop simulated the
cardiac output of the patient (4 L/min), and the bypass loop was run at 0.75 L/min to test
how a fraction of the cardiac output through the PRAL would affect overall hemolysis.
Schematics of the control and PRAL loops is shown in Figure 7.1.
Reservoir
BiomedicusPump
CommercialOxygenator
HoffmanClamp
Control LoopReservoir
BiomedicusPump
PRAL Loop
PediatricHeat
Exchanger
PRAL
HoffmanClamp
HoffmanClamp
Q = 4 L/min
Q = 4 L/min
Q = 0.75 L/minMainLoop Bypass
Loop
Figure 7.1. Schematic of mock circulatory loops used for in vitro hemolysis testing: control loop (left); PRAL loop (right).
Blood was collected at a local slaughterhouse and anticoagulant citrate dextrose (ACD)
was added in a concentration of 9:1 (blood:ACD) to prevent clotting. The blood was
filtered with 40 µm pore size filters (Pall Biomedical, Inc., Fajardo, PR) on the day of
collection to remove any hair or extraneous particles due to the collection process, and
Gentamycin (0.1 g/mL) was added to prevent infection. Blood was added to each loop
and circulated until the temperature reached 37 C. The priming volume of each loop
was 1.5 L. The fiber bundle was rotated at 1500 RPM, and the flowrate was adjusted

- 97 -
with a Hoffman clamp. Samples (4 ml) were drawn from each loop every half hour for
the first 2 hours and every hour thereafter for the duration of the 6-hour evaluation.
Each sample was used to measure hematocrit and plasma free hemoglobin. Hematocrit
was measured with a capillary tube spun down for 3 minutes in a microhematocrit
centrifuge (International Equipment Co., IEC MB, Needham Hts, MA). The remainder of
the sample was spun down in a centrifuge at 3400 RPM for 15 minutes. The
supernatant plasma was siphoned off into an Eppendorf tube and spun down again at
10000 RPM for another 15 minutes. The purified plasma was transferred to a cuvette
and analyzed in a spectrophotometer (Thermo Spectronic Genesys 5) at a wavelength
of 540 nm. The absorption of light by the spectrophotometer was calibrated to known
levels of PfHb.
We measured the increase in PfHb over time for the PRAL device, and then changed
one variable and repeated the test to determine the effect of the variable on hemolysis.
Reassembly of the PRAL was required to test each variable, so different batches of
blood were used for each test, and the tests were performed on different days with the
same control loop for each test. To determine the effect of the seals, we removed the
seals and replaced them with delrin rings leaving a 0.005” clearance between the rings
and the rotating shaft. Saline was perfused into the gap at a flowrate of 10 ml/hr to
prevent blood from contacting the bearings. To test the effect of shear stress in the
outer gap, we cut the fibers out of the device and rotated the porous support cage. In a
separate test, we increased the gap from 2 mm to 6 mm by reducing the fiber bundle
diameter from 7.0 cm to 6.2 cm. The effect of the surface roughness of the fiber bundle
was investigated by testing a smooth solid core cylinder made of acrylic with the same

- 98 -
dimensions as the fiber bundle (outer radius 7.0 cm). The effect of the inner gap on
hemolysis was investigated by removing the stationary center diffuser. Two different
cage designs were investigated to determine their contribution to blood damage in the
PRAL. One cage was made of six stainless steel struts, and the second cage was
fabricated from a porous stainless steel sheet formed into a cylinder. The two cage
designs are shown in Figure 7.2.
STRUT
POROUS
Figure 7.2: Two fiber support structure designs (cages).
The effect of the cage was evaluated in an earlier PRAL prototype with only 0.25 m2
surface area and the setup did not contain a bypass loop. All other tests contained the
bypass loop and the surface area was 0.42 m2 if fibers were present. Both loops were
flushed with tap water immediately after the test to rinse any remaining blood out of the
circuit.
The normalized index of hemolysis (NIH) is one common index of blood damage. For
the control loop, NIH was expressed according to the equation

- 99 -
QtHCTVPfHbNIH⋅∆
⋅−⋅⋅∆=
100))100/1( where ∆PfHb was the change in plasma free
hemoglobin level, V was the priming volume of the circuit, HCT was the Hematocrit of
the blood sample, Q was the flowrate of blood, and ∆t was the time duration of the test.
In clinical practice, the flowrate through the pump and oxygenator in the control loop, is
at or near the cardiac output of the patient. Therefore, in these studies the NIH for the
control loop was normalized to the flowrate through the device, Q. During clinical use of
the PRAL, only a fraction of the cardiac output will flow through the PRAL and will then
mix with the venous return of the patient. The total liberated hemoglobin in the blood of
the patient will be only a fraction of that caused by the PRAL. Therefore, the increase in
plasma free hemoglobin in these studies was normalized by the cardiac output in a
typical patient, or the flowrate through the main loop, QM. The NIH for the PRAL loop
was defined as M
P QtHCTVPfHbNIH⋅∆
⋅−⋅⋅∆=
100))100/1( where QM was the flow through
the main loop. Normalizing the data by QM enabled a more appropriate comparison
between the control oxygenator that captures all cardiac output of the patient and the
PRAL which only captures a fraction of the cardiac output of the patient.
7.3 RESULTS AND DISCUSSION
The hemolysis of the PRAL was compared to a commercially available oxygenator that
is routinely used in applications such as CPB and ECMO. The rationale for these
experiments was that if in vitro hemolysis levels in the PRAL were comparable to
hemolysis levels in a commercially used oxygenator then the PRAL would be more

- 100 -
likely to be safe to use in vivo from a blood damage standpoint. In the comparison test
between the PRAL and the commercial oxygenator, we found that the increase in PfHb
in the PRAL was substantially higher than in the control loop. The PfHb levels for the
PRAL with the fiber bundle rotating at 1500 RPM increased from 34 mg/dL to 333
mg/dL (Figure 7.3) with a NIHP of 0.24. The increase in PfHb in the control loop was
from 34 mg/dL to 81 mg/dL, with an NIH of 0.03 g/100L.
0
50
100
150
200
250
300
350
400
0 100 200 300 400time (min)
PFH
b (m
g/dL
)
PRAL
CONTROL
Figure 7.3: Hemolysis for the PRAL.
The increase in PfHb in the PRAL relative to the control indicated that blood damage
could be a serious concern in the PRAL. We systematically evaluated specific
components within the PRAL for their contribution to hemolysis. The first variable tested
was the seals that prevent blood from entering the gas pathway. The hemolysis test
was repeated with the three blood contacting seals removed from the PRAL. The PfHb
level versus time for the PRAL without the seals is shown in Figure 7.4. Removing the

- 101 -
seals did not reduce hemolysis in the PRAL. The plasma free hemoglobin level
increased from 30 mg/dL to 332 mg/dL. The seals were determined not to be the source
of hemolysis in the PRAL since PfHb increased the same as when the seals were
present.
0
50
100
150
200
250
300
350
0 100 200 300 400time (min)
PFH
b (m
g/dL
)
PRAL - NO SEALS
CONTROL
Figure 7.4: Hemolysis for the PRAL without seals.
Heat generation is a common problem in blood pumps that contain seals around a
rotating shaft [108, 109]. Infusion of heparinized saline around the rotating shaft can
flush the area with fresh fluid to reduce heat and stagnation [110, 111]. Seals made of
ferromagnetic fluid are another solution that shown promise in minimizing blood damage
[109]. Finally, a magnetic coupling could also be used to rotate the bundle to eliminate
the seal and bearing altogether [112, 113]. Seals are necessary in the PRAL to protect
the bearings from blood contact and prevent air embolism from the sweep gas. The
current design of the PRAL contains four seals, three of which contact blood. Two of the
seals are placed into the endcaps of the device and the third seal is seated between the
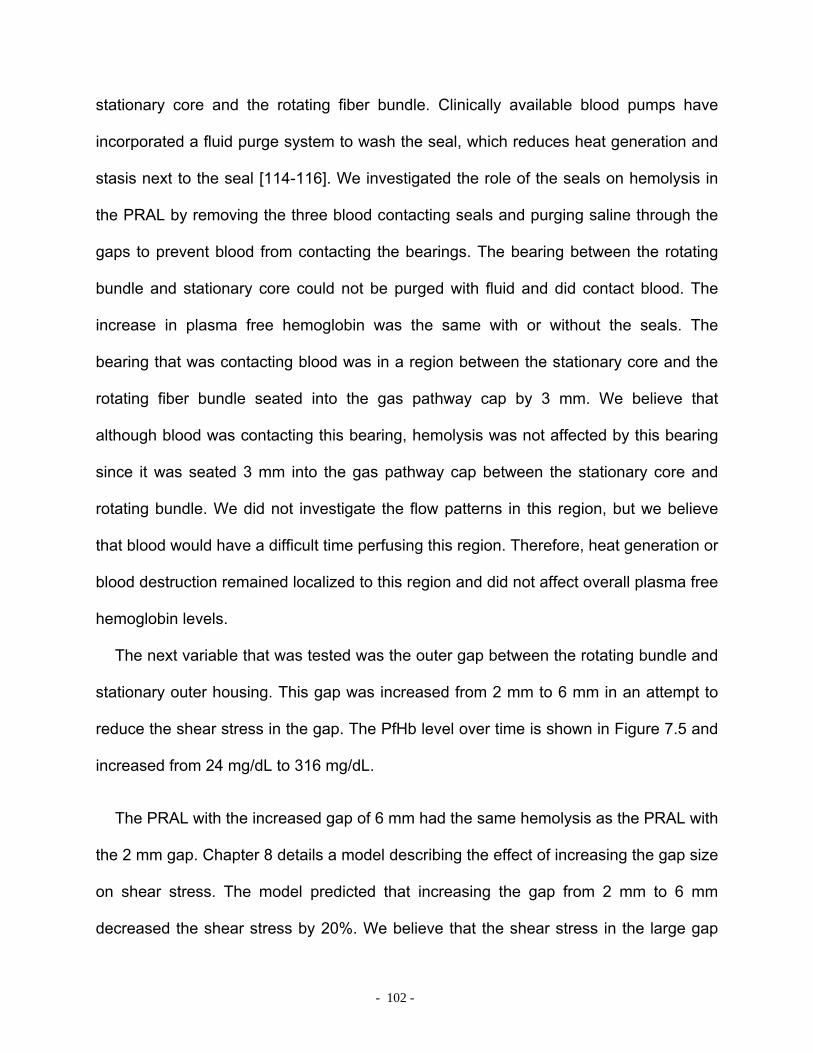
- 102 -
stationary core and the rotating fiber bundle. Clinically available blood pumps have
incorporated a fluid purge system to wash the seal, which reduces heat generation and
stasis next to the seal [114-116]. We investigated the role of the seals on hemolysis in
the PRAL by removing the three blood contacting seals and purging saline through the
gaps to prevent blood from contacting the bearings. The bearing between the rotating
bundle and stationary core could not be purged with fluid and did contact blood. The
increase in plasma free hemoglobin was the same with or without the seals. The
bearing that was contacting blood was in a region between the stationary core and the
rotating fiber bundle seated into the gas pathway cap by 3 mm. We believe that
although blood was contacting this bearing, hemolysis was not affected by this bearing
since it was seated 3 mm into the gas pathway cap between the stationary core and
rotating bundle. We did not investigate the flow patterns in this region, but we believe
that blood would have a difficult time perfusing this region. Therefore, heat generation or
blood destruction remained localized to this region and did not affect overall plasma free
hemoglobin levels.
The next variable that was tested was the outer gap between the rotating bundle and
stationary outer housing. This gap was increased from 2 mm to 6 mm in an attempt to
reduce the shear stress in the gap. The PfHb level over time is shown in Figure 7.5 and
increased from 24 mg/dL to 316 mg/dL.
The PRAL with the increased gap of 6 mm had the same hemolysis as the PRAL with
the 2 mm gap. Chapter 8 details a model describing the effect of increasing the gap size
on shear stress. The model predicted that increasing the gap from 2 mm to 6 mm
decreased the shear stress by 20%. We believe that the shear stress in the large gap
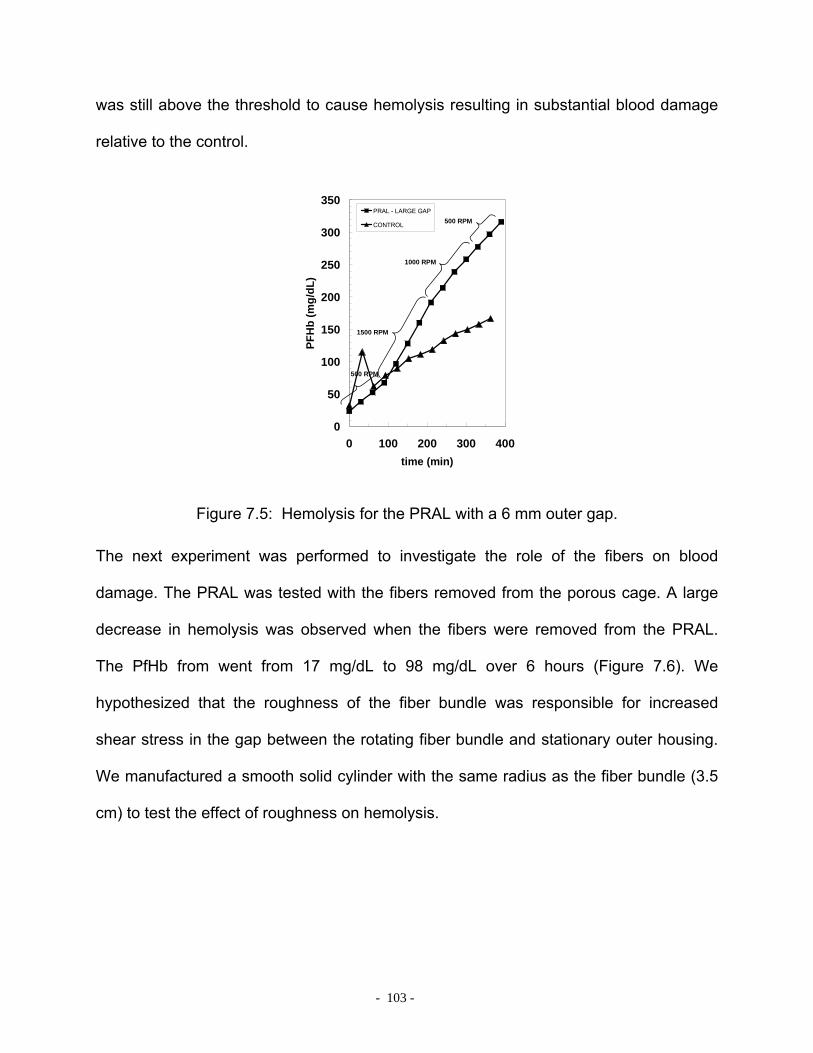
- 103 -
was still above the threshold to cause hemolysis resulting in substantial blood damage
relative to the control.
0
50
100
150
200
250
300
350
0 100 200 300 400time (min)
PFH
b (m
g/dL
)
PRAL - LARGE GAP
CONTROL
500 RPM
1500 RPM
1000 RPM
500 RPM
Figure 7.5: Hemolysis for the PRAL with a 6 mm outer gap.
The next experiment was performed to investigate the role of the fibers on blood
damage. The PRAL was tested with the fibers removed from the porous cage. A large
decrease in hemolysis was observed when the fibers were removed from the PRAL.
The PfHb from went from 17 mg/dL to 98 mg/dL over 6 hours (Figure 7.6). We
hypothesized that the roughness of the fiber bundle was responsible for increased
shear stress in the gap between the rotating fiber bundle and stationary outer housing.
We manufactured a smooth solid cylinder with the same radius as the fiber bundle (3.5
cm) to test the effect of roughness on hemolysis.

- 104 -
0
50
100
150
200
250
300
350
400
0 100 200 300 400time (min)
PFH
b (m
g/dL
)
PRAL - NO FIBERS
CONTROL
Figure 7.6: Hemolysis for the PRAL without fibers.
The PfHb level for the solid core was the same as the PRAL with the fibers removed
(Figure 7.7).
0
50
100
150
200
250
300
350
400
0 100 200 300 400time (min)
PFH
b (m
g/dL
)
CONTROLSOLID CORE
Figure 7.7: Hemolysis for the smooth cylinder.
The plasma free hemoglobin levels were greatly reduced when the fibers were removed
from the PRAL. We suspect that for the device without fibers the high porosity of the

- 105 -
cage did not create Taylor vortices so the shear stress in the gap between the rotating
cage and outer housing was much lower than when the fibers were present. However,
this does not necessarily imply that Taylor vortices cause hemolysis. The solid cylinder
model generated Taylor vortices but had similar plasma free hemoglobin levels as the
porous cage. Therefore, we suspect that the rotating fiber bundle creates higher shear
stress due to the rough surface of the bundle compared to the smooth surface of the
solid cylinder model. Surface roughness has been shown to be a contributing cause of
hemolysis in blood pumps [117-121]. Maruyama et al measured the shear stress in a
couette viscometer and found the shear stress doubled when the roughness on cylinder
was increased from 0.2 µm to 2 µm [117]. Van den Berg et al measured the effect of
surface roughness on power dissipation in Taylor vortex flow and found that surface
roughness increased the friction and therefore the shear stress in Taylor flow similar to
the roughness of a pipe surface increases the shear stress in turbulent pipe flow [122].
In Chapter 8, we describe the effect of surface roughness on power dissipation
measurements.
A summary of the blood damage presented as NIHp due to the seals and fibers is
shown in Table 7-1. We also tested the effect of the shear stress in the inner gap
between the diffuser and rotating bundle by removing the stationary diffuser.
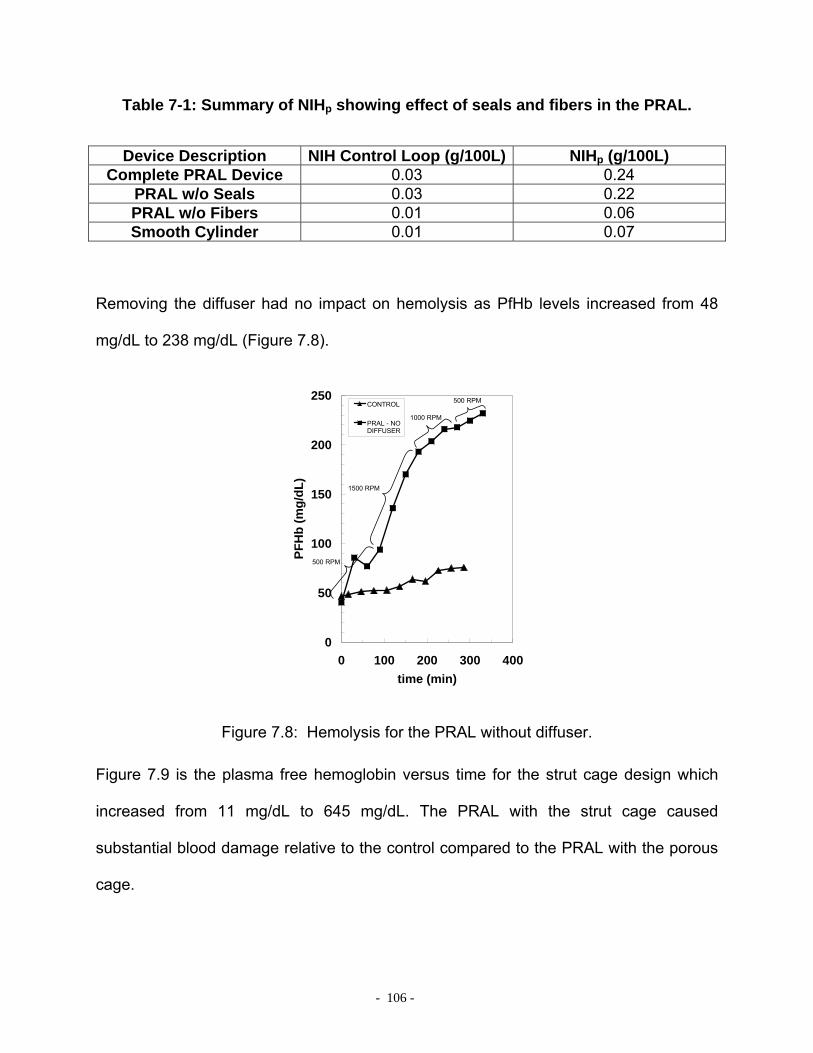
- 106 -
Table 7-1: Summary of NIHp showing effect of seals and fibers in the PRAL.
Device Description NIH Control Loop (g/100L) NIHp (g/100L) Complete PRAL Device 0.03 0.24
PRAL w/o Seals 0.03 0.22 PRAL w/o Fibers 0.01 0.06 Smooth Cylinder 0.01 0.07
Removing the diffuser had no impact on hemolysis as PfHb levels increased from 48
mg/dL to 238 mg/dL (Figure 7.8).
0
50
100
150
200
250
0 100 200 300 400time (min)
PFH
b (m
g/dL
)
CONTROL
PRAL - NODIFFUSER
500 RPM
1500 RPM
1000 RPM
500 RPM
Figure 7.8: Hemolysis for the PRAL without diffuser.
Figure 7.9 is the plasma free hemoglobin versus time for the strut cage design which
increased from 11 mg/dL to 645 mg/dL. The PRAL with the strut cage caused
substantial blood damage relative to the control compared to the PRAL with the porous
cage.

- 107 -
0
100
200
300
400
500
600
700
0 100 200 300 400time (min)
PFH
b (m
g/dL
)
STRUT CAGECONTROL
Figure 7.9: Hemolysis for the PRAL with the strut cage.
One hypothesis for the high hemolysis was that the strut cage caused localized eddies
and turbulence in the wake of the struts during rotation. The flow past the struts can be
described by the Reynolds number ~(ωR)ds/ν where ω is the rotation rate of the cage, R
is the radius of the fiber bundle cage (33 mm), ds is the strut diameter (1.5 mm), and ν is
the kinematic viscosity of blood (0.023 cm2/s). Figure 7.10 is an illustration of flow past a
cylinder for a Reynolds number of 26 [123]. The flow becomes separated into two
vortices in the strut wake as flow moves left to right past the cylinder. Above a Reynolds
number of 100, the flow transitions into turbulence in the wake behind the cylinder. At a
fiber bundle rotation rate of 1500 RPM, the Reynolds number for flow past a strut is on
the order of 1000 causing flow separation and turbulence. Turbulent flow would result in
higher shear stress than seen in the porous cage design and may explain the high
levels of hemolysis the strut design.
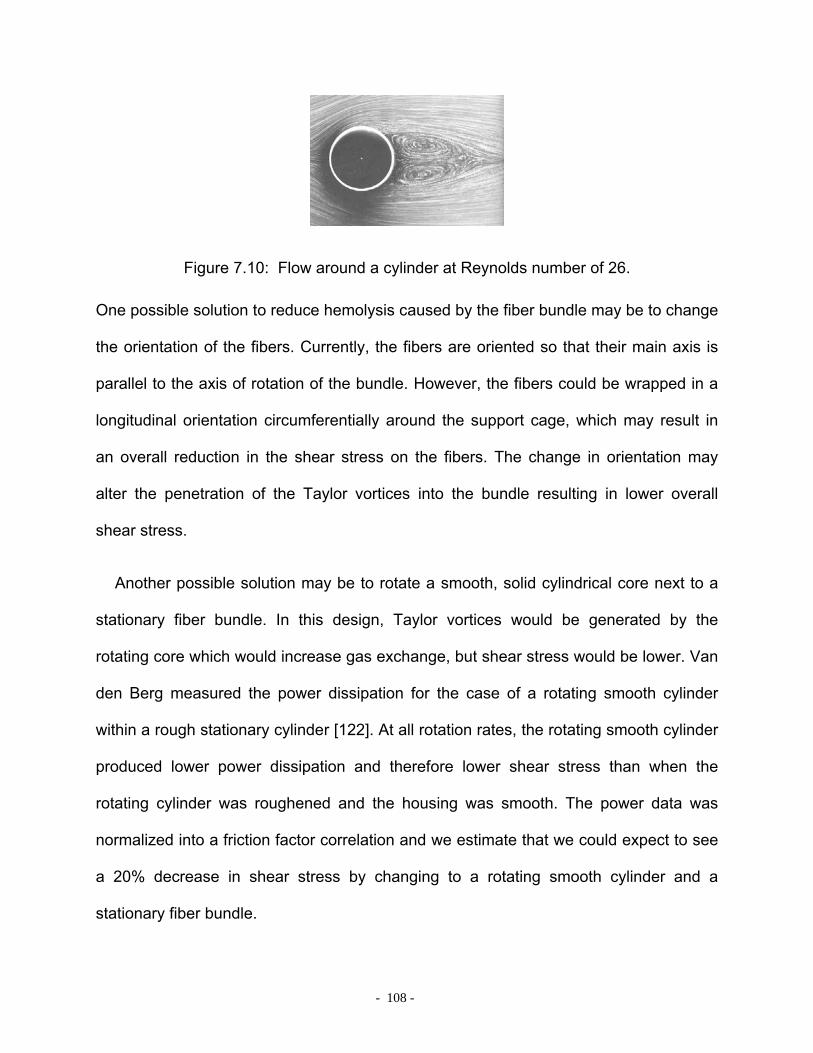
- 108 -
Figure 7.10: Flow around a cylinder at Reynolds number of 26.
One possible solution to reduce hemolysis caused by the fiber bundle may be to change
the orientation of the fibers. Currently, the fibers are oriented so that their main axis is
parallel to the axis of rotation of the bundle. However, the fibers could be wrapped in a
longitudinal orientation circumferentially around the support cage, which may result in
an overall reduction in the shear stress on the fibers. The change in orientation may
alter the penetration of the Taylor vortices into the bundle resulting in lower overall
shear stress.
Another possible solution may be to rotate a smooth, solid cylindrical core next to a
stationary fiber bundle. In this design, Taylor vortices would be generated by the
rotating core which would increase gas exchange, but shear stress would be lower. Van
den Berg measured the power dissipation for the case of a rotating smooth cylinder
within a rough stationary cylinder [122]. At all rotation rates, the rotating smooth cylinder
produced lower power dissipation and therefore lower shear stress than when the
rotating cylinder was roughened and the housing was smooth. The power data was
normalized into a friction factor correlation and we estimate that we could expect to see
a 20% decrease in shear stress by changing to a rotating smooth cylinder and a
stationary fiber bundle.

- 109 -
The outlet port of the PRAL is a 3/8” barb-fitting tangent to the outer housing. We
hypothesized that this region could be traumatic to red blood cells because of the nature
of the flow in this area. The blood elements transition from being in Taylor-vortex flow
caused by the rotating bundle to the outlet port. Medtronic has shown that the shape of
the outlet port of the Biomedicus BP-80 pump has a dramatic effect on hemolysis [105].
Through CFD analysis of the pump outlet, Medtronic redesigned the port into a ‘cut-
water’ geometry, which reduced hemolysis by 20%.
We investigated the effect of the outlet port by gluing a 2-layer patch of fibers over
the outlet port and testing the hemolysis of the solid core model in an attempt to reduce
the chaotic nature of the flow as it transitions to pipe flow in the outlet. We hypothesized
that the two layers of fibers would create more uniform flow through the outlet port due
to the resistance of the fiber layers. The PfHb levels over time for the PRAL with and
without the fiber layers over the outlet port were the same (data not shown). We also
increased the diameter of the outlet port from a 3/8” barb to a ½” barb. We hypothesized
that by increasing the diameter; we could slow that flow down and reduce the shear
stress in the vicinity of the outlet port. No difference in PfHb levels was observed for the
two different port sizes (data not shown). We concluded that the outlet port was not a
major source of hemolysis in the PRAL.
Although PfHb levels were much higher for the PRAL device relative to the control,
several comments are warranted concerning in vitro plasma free hemoglobin tests. To
our knowledge, the plasma free hemoglobin levels measured in vitro do not correlate to
the performance of the device in vivo, nor does the NIH have any predictive ability as to
how a medical device will perform in vivo. In vitro PfHb levels are affected by many

- 110 -
factors including but not limited to flowrate, blood loop priming volume, hematocrit, total
protein concentration, and pH [124]. Investigators have attempted to normalize for some
of the variables that can affect PfHb levels. The NIH for example was developed to
analyze blood pumps that operate in flow ranges consistent with adult cardiac output.
However, the NIH may not be applicable to medical devices that operate in low flow
ranges. Tamari et al evaluated the effect of flowrate on the NIH in the Biomedicus BP-
50 [125]. The NIH for a flowrate of 1.78 L/min was 0.029 +/- 0.005 g/100L whereas the
NIH at a flowrate of 0.3 L/min was 0.135 +/- 0.022 g/100L with p=0.0000. Although the
NIH is meant to normalize for the effect of flowrate on hemolysis, the NIH does not
appear to be an appropriate comparison for devices that operate at different flow rates.
We developed a bypass setup to better compare how the PRAL would perform in vivo
relative to a device that operates near the cardiac output of the patient. The NIHP
provided a better comparison between the PRAL and the control oxygenator that
captures the full cardiac output of the patient. The NIHP was still considerably higher at
0.239 than the NIH of the control for each test indicating that hemolysis still needs to be
addressed in the PRAL.

- 111 -
7 MECHANISMS FOR HEMOLYSIS
8.0 MECHANISMS FOR HEMOLYSIS
8.1 INTRODUCTION – OUTER GAP
Hemolysis is a function of shear stress and the time of exposure of red blood cells to
that shear stress. When the shear stress exceeds a threshold value, the blood cell
ruptures releasing hemoglobin. Several investigators have attempted to quantify the
threshold level of shear stress and the exposure time that causes hemolysis. Leverett et
al reported a threshold shear stress of 1500 dynes/cm2 at an exposure time of 120 s for
complete red blood cell destruction [126]. Sutera and Mehrjardi reported the threshold
limit to be 2500 dynes/cm2 at an exposure time of 240 s [127-129]. Paul et al found a
threshold of 4250 dynes/cm2 at an exposure time of 0.425 s and 3750 dynes/cm2 at an
exposure time of 1.4 s [130]. Mockros et al [32] summarized the available literature and
developed a blood damage threshold based on time and shear stress: 212 ktk
+=τ
where τ is the shear stress, t is the exposure time of red cells to that shear stress and k1
and k2 are empirical constants 104 dynes2s/cm4 and 2.2E6 dynes2/cm4, respectively.
The threshold is shown in Figure 8.1 in the exposure time range of 0.001 s to 100 s.
Above and exposure time of 0.1 s, the threshold shear stress for complete red blood cell
damage is 1500 dynes/cm2.

- 112 -
1
10
100
1000
10000
0.001 0.1 10 1000Exposure Time (s)
Shea
r Str
ess
(dyn
es/c
m2 )
Complete RBC Destruction
Sub-lethal RBC Destruction
Figure 8.1: Threshold shear stress versus exposure time for complete red blood cell (RBC) destruction.
Another model has been used extensively to predict hemolysis from an empirically
derived correlation involving shear stress and exposure time of a blood element moving
along the pathline [92-107]. Hemolysis is expressed in terms of the change in plasma
free hemoglobin (∆PfHb) in mg/dL per total hemoglobin (Hb):
785.0416.271062.3 tHbPfHb
⋅⋅×=∆ − τ (8.1)
where τ is the shear stress (Pa) acting on a fluid particle and t (s) is the amount of time
that the fluid particle is exposed to that shear stress. This model has been used in
conjunction with CFD to redesign blood pumps to reduce hemolysis. This chapter
describes measurements of the shear stress in the gaps surrounding the rotating fiber
bundle in an attempt to relate this shear stress to the available literature data
concerning blood damage.

- 113 -
In Chapter 7, we evaluated the hemolysis in the PRAL and found that the primary
cause of hemolysis in the PRAL appeared to be the roughness of the rotating fiber
bundle. The solid cylinder and the rotating bundle both produce Taylor vortices in the
outer gap, but the solid cylinder generated much lower PfHb levels than the fiber
bundle. In this chapter, we measured the power dissipated into the fluid due to Taylor
vortices for both the smooth solid cylinder and the fiber bundle and compared our
measurements to a theoretical model. The shear stress in the outer gap was then
calculated from the power measurements.
The shear stress acting on the fluid is due to the torque transferred by the motor to
the rotating fiber bundle. In Taylor-vortex flow, the angular velocity decreases
exponentially in the boundary layer adjacent to the rotating fiber bundle, remains
constant in the center of the gap, and decreases exponentially to zero in the boundary
layer adjacent to the stationary outer housing. The shear stress is maximum in the
boundary layers and is very low in the region between the boundary layers where the
fluid nearly rotates as a solid body (Figure 8.2) [131].

- 114 -
Inne
r Bou
ndar
y La
yer
Out
er B
ound
ary
Laye
r
Angular VelocityProfile
Gap Thickness
Rot
atin
g Fi
ber B
undl
e
Stat
iona
ry O
uter
Hou
singLow Shear Stress
Figure 8.2: Schematic of angular velocity profile in Taylor vortex flow in the gap between the rotating fiber bundle and stationary outer housing.
The shear stress is a function of the boundary layer thickness, rotation rate, gap
thickness, and torque exerted on the fluid.
Several investigators have developed empirical relationships to calculate the torque
exerted on the fluid for co-rotating smooth cylinders, and from these relationships the
shear stress can be determined [132]. The empirical relationship for the torque, T is:
5.14/7
2/32 Re
)1(45.1
ηηρυ−
= LT400 < Re < 10000 (8.2)
where o
i
RR
=η is a dimensionless radii ratio and υ
ϖ )(Re ioi RRR −
= is the angular
Reynolds number. From the torque, the power dissipated into the fluid can be found by
multiplying the torque and angular frequency: TP ω= . The boundary layer thickness can
be calculated by the following equation.

- 115 -
GRRRR
io
oi
)(Re
−=
πδ (8.3)
where L
TG 2ρυ= is a dimensionless torque. Finally, the shear stress in the boundary
layer is given by:
δγω
ρντo
i
RR 2
= (8.4)
where γ is the an empirically determined constant with a value of 0.5 [133]. We used this
model to predict the power dissipation in the outer gap for the PRAL Generation III
device. Figure 8.3 is the predicted power dissipation into the fluid surrounding the
rotating fiber bundle for gap thicknesses of 2 mm and 6 mm. The fluid was water so that
the model could be tested easily using a liquid with well known properties. Power
dissipation increases with rotation rate and reaches 5.5 W for the 2 mm gap simulation.
Increasing the gap to 6 mm decreased the power dissipation at 1500 RPM to 3.5 W.
The shear stress predictions are plotted in Figure 8.4. The effect of increasing the gap
size increased as the rotation rate increased. For the 2 mm gap, the shear stress at
1500 RPM was calculated to be 272 dynes/cm2 compared to 175 dynes/cm2 when the
gap was 6 mm.

- 116 -
0
1
2
3
4
5
6
0 500 1000 1500 2000RPM
Pred
icte
d Po
wer
(W)
2 mm6 mm
Figure 8.3: Model predictions of the power dissipated into the gap between a smooth rotating cylinder and stationary housing in Taylor vortex flow.
0
50
100
150
200
250
300
0 500 1000 1500 2000RPM
Shea
r Str
ess
(dyn
es/c
m2 )
2 mm
6 mm
Figure 8.4: Model predictions of the shear stress in the gap between a smooth rotating cylinder and stationary housing in Taylor vortex flow.

- 117 -
8.2 METHODS
We tested the theoretical model using the Generation III device in water. The PRAL was
placed in the pumping loop described in Chapter 3. A voltmeter was connected in
parallel with the motor to measure the voltage input to the motor, and an ammeter was
connected in series with the motor to measure the current input to the motor. The power
input to the motor was determined by multiplying the voltage and current. Based on the
efficiency of the motor obtained from the manufacturer specifications, the power
delivered to the shaft was determined. We also measured the power dissipation for the
smooth solid cylinder. The seals were removed during the assembly of the device to
eliminate the power required to overcome the friction in the seals. After the device was
assembled, the power consumed by the bearings was characterized by rotating the
device in air and measuring the power input to the motor. Then, water was added to the
device removing all air from the circuit. At each rotation rate, the power input to the
motor was measured as well as the pressure and flow generated by the rotating fiber
bundle. The power dissipated to the fluid through Taylor vortices was determined from
the shaft power minus the pressure and flow work and minus the power consumed by
the bearings.
8.3 RESULTS AND DISCUSSION – OUTER GAP
The power dissipation versus rotation rate for the fiber bundle, solid cylinder, and
theoretical prediction with the 2 mm gap is shown in Figure 8.5. For the fiber bundle, the
deviation between theory and experiment increased with rotation rate. At 500 RPM, we
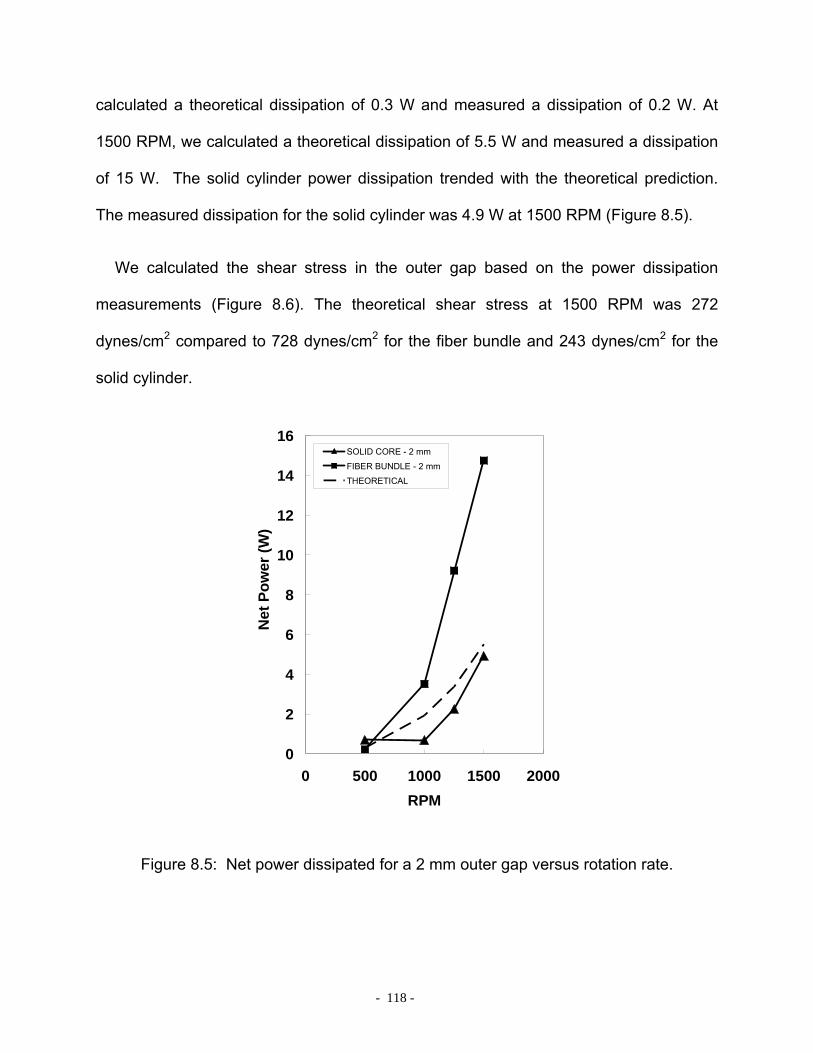
- 118 -
calculated a theoretical dissipation of 0.3 W and measured a dissipation of 0.2 W. At
1500 RPM, we calculated a theoretical dissipation of 5.5 W and measured a dissipation
of 15 W. The solid cylinder power dissipation trended with the theoretical prediction.
The measured dissipation for the solid cylinder was 4.9 W at 1500 RPM (Figure 8.5).
We calculated the shear stress in the outer gap based on the power dissipation
measurements (Figure 8.6). The theoretical shear stress at 1500 RPM was 272
dynes/cm2 compared to 728 dynes/cm2 for the fiber bundle and 243 dynes/cm2 for the
solid cylinder.
0
2
4
6
8
10
12
14
16
0 500 1000 1500 2000RPM
Net
Pow
er (W
)
SOLID CORE - 2 mm
FIBER BUNDLE - 2 mm
THEORETICAL
Figure 8.5: Net power dissipated for a 2 mm outer gap versus rotation rate.
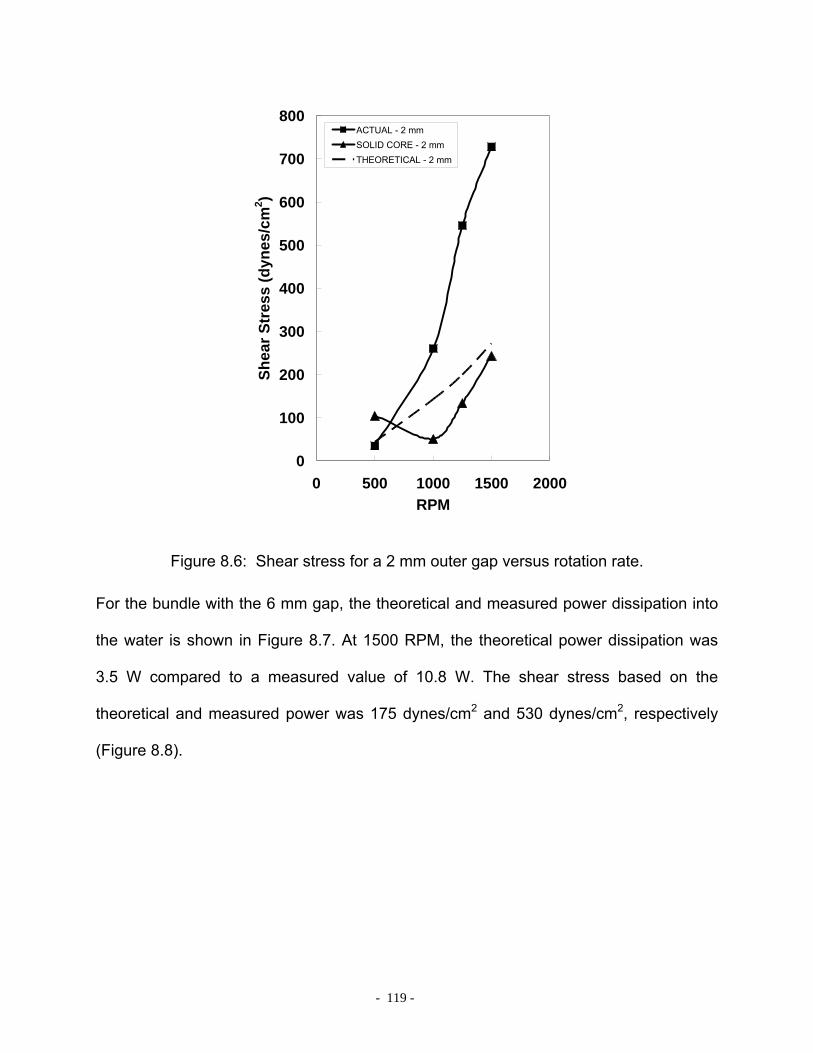
- 119 -
0
100
200
300
400
500
600
700
800
0 500 1000 1500 2000RPM
Shea
r Str
ess
(dyn
es/c
m2 )
ACTUAL - 2 mmSOLID CORE - 2 mmTHEORETICAL - 2 mm
Figure 8.6: Shear stress for a 2 mm outer gap versus rotation rate.
For the bundle with the 6 mm gap, the theoretical and measured power dissipation into
the water is shown in Figure 8.7. At 1500 RPM, the theoretical power dissipation was
3.5 W compared to a measured value of 10.8 W. The shear stress based on the
theoretical and measured power was 175 dynes/cm2 and 530 dynes/cm2, respectively
(Figure 8.8).
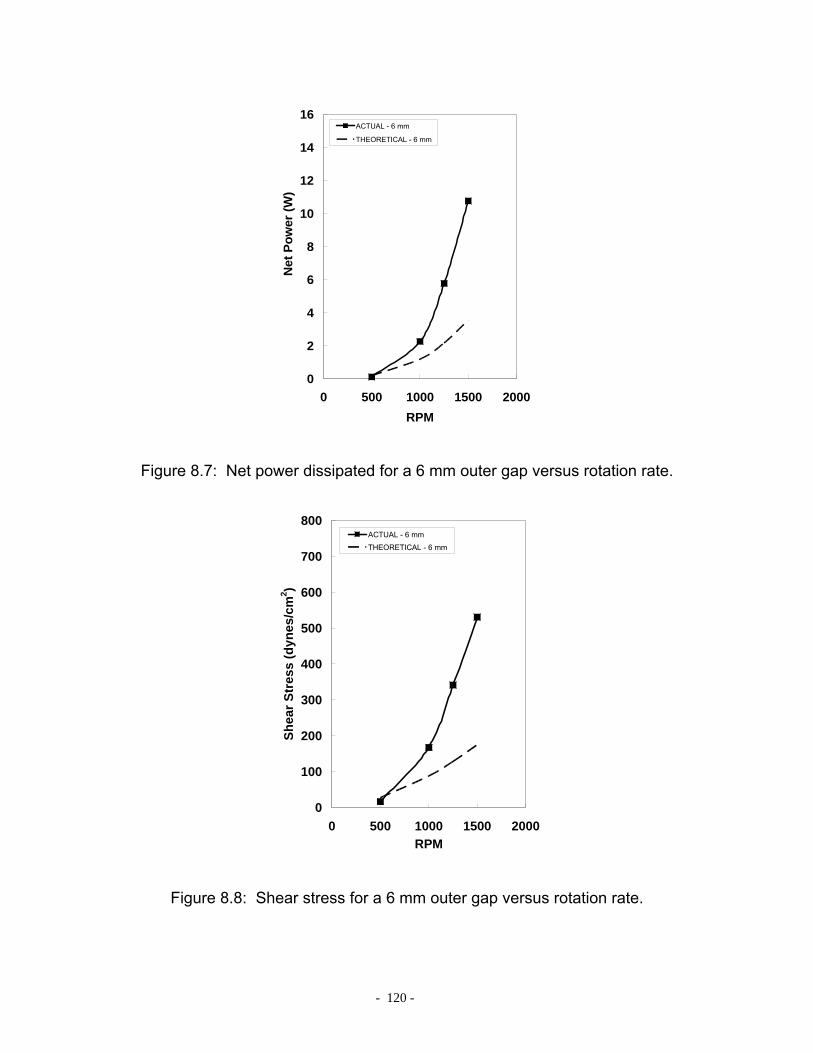
- 120 -
0
2
4
6
8
10
12
14
16
0 500 1000 1500 2000RPM
Net
Pow
er (W
)
ACTUAL - 6 mm
THEORETICAL - 6 mm
Figure 8.7: Net power dissipated for a 6 mm outer gap versus rotation rate.
0
100
200
300
400
500
600
700
800
0 500 1000 1500 2000RPM
Shea
r Str
ess
(dyn
es/c
m2 )
ACTUAL - 6 mm
THEORETICAL - 6 mm
Figure 8.8: Shear stress for a 6 mm outer gap versus rotation rate.

- 121 -
Van den Berg et al investigated the effect of cylinder roughness on power dissipation
by placing 0.3 cm strips in a longitudinal orientation circumferentially around the rotating
cylinder. They developed a correlation for power dissipation versus rotation rate and
found the roughness of the rotating cylinder increased the Reynolds number
dependence from 1.5 to 1.88 [122]. We compared the correlation for rough cylinders to
the bundle with the 6 mm gap because the gap ratio Ri/Ro was within 10% of the Van
den Berg device.
The effect of roughness on power dissipation is shown in Figure 8.9 with the
measured power from the 6 mm gap device and the prediction using the smooth
cylinder correlation and the rough correlation. The power dissipation of the 6 mm device
lies between the smooth and rough cylinder correlation. The fibers have a diameter of
0.03 cm compared to the 0.3 cm strips used by van den Berg, so we expect that since
our roughness was less than that of van den Berg, our device would lie somewhere
between the smooth and rough cylinder predictions.
The increased shear stress in the fiber bundle compared to the solid core is
consistent with the hemolysis results in Chapter 7. The roughness of the fiber bundle
generates high shear stress and therefore higher hemolysis in the gap between the
rotating bundle and stationary housing.
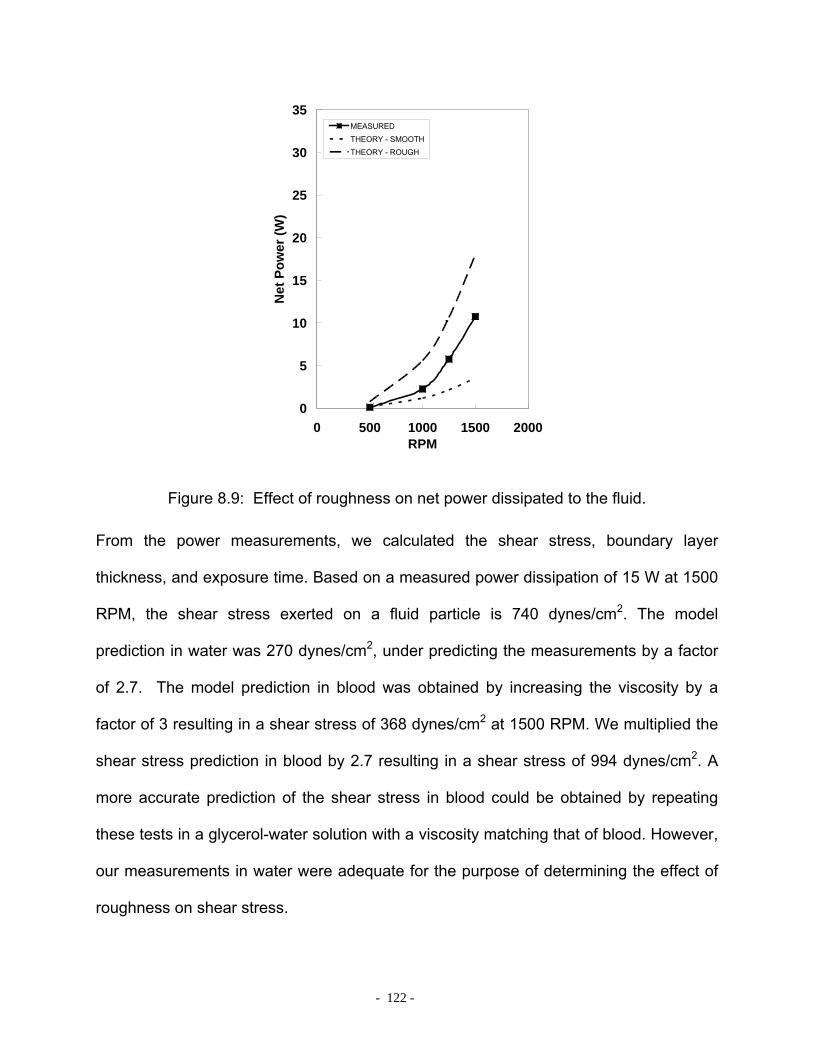
- 122 -
0
5
10
15
20
25
30
35
0 500 1000 1500 2000RPM
Net
Pow
er (W
)
MEASUREDTHEORY - SMOOTHTHEORY - ROUGH
Figure 8.9: Effect of roughness on net power dissipated to the fluid.
From the power measurements, we calculated the shear stress, boundary layer
thickness, and exposure time. Based on a measured power dissipation of 15 W at 1500
RPM, the shear stress exerted on a fluid particle is 740 dynes/cm2. The model
prediction in water was 270 dynes/cm2, under predicting the measurements by a factor
of 2.7. The model prediction in blood was obtained by increasing the viscosity by a
factor of 3 resulting in a shear stress of 368 dynes/cm2 at 1500 RPM. We multiplied the
shear stress prediction in blood by 2.7 resulting in a shear stress of 994 dynes/cm2. A
more accurate prediction of the shear stress in blood could be obtained by repeating
these tests in a glycerol-water solution with a viscosity matching that of blood. However,
our measurements in water were adequate for the purpose of determining the effect of
roughness on shear stress.
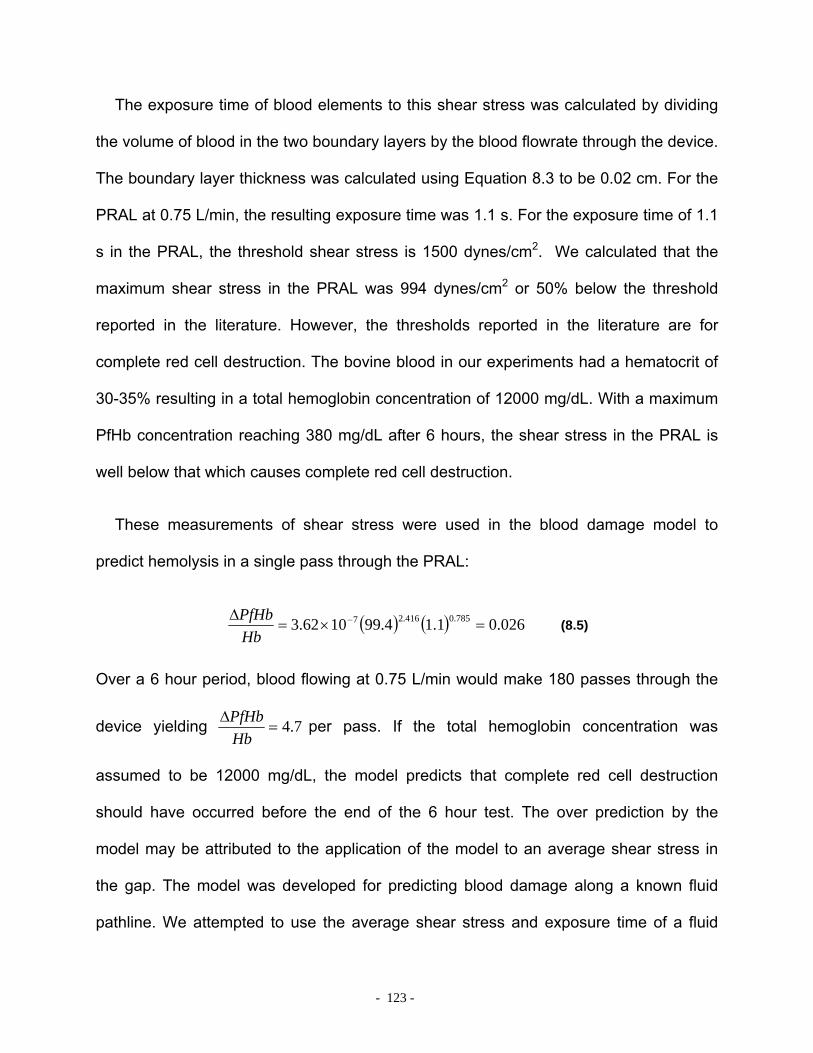
- 123 -
The exposure time of blood elements to this shear stress was calculated by dividing
the volume of blood in the two boundary layers by the blood flowrate through the device.
The boundary layer thickness was calculated using Equation 8.3 to be 0.02 cm. For the
PRAL at 0.75 L/min, the resulting exposure time was 1.1 s. For the exposure time of 1.1
s in the PRAL, the threshold shear stress is 1500 dynes/cm2. We calculated that the
maximum shear stress in the PRAL was 994 dynes/cm2 or 50% below the threshold
reported in the literature. However, the thresholds reported in the literature are for
complete red cell destruction. The bovine blood in our experiments had a hematocrit of
30-35% resulting in a total hemoglobin concentration of 12000 mg/dL. With a maximum
PfHb concentration reaching 380 mg/dL after 6 hours, the shear stress in the PRAL is
well below that which causes complete red cell destruction.
These measurements of shear stress were used in the blood damage model to
predict hemolysis in a single pass through the PRAL:
( ) ( ) 026.01.14.991062.3 785.0416.27 =×=∆ −
HbPfHb
(8.5)
Over a 6 hour period, blood flowing at 0.75 L/min would make 180 passes through the
device yielding 7.4=∆
HbPfHb per pass. If the total hemoglobin concentration was
assumed to be 12000 mg/dL, the model predicts that complete red cell destruction
should have occurred before the end of the 6 hour test. The over prediction by the
model may be attributed to the application of the model to an average shear stress in
the gap. The model was developed for predicting blood damage along a known fluid
pathline. We attempted to use the average shear stress and exposure time of a fluid

- 124 -
particle in the outer gap. This simplification may not be valid. Future work using this
model should employ CFD to calculate the shear stress along the pathline of a fluid
particle in the outer gap to more accurately predict blood damage.
8.4 INTRODUCTION – INNER GAP
In Chapter 6, we also evaluated the hemolysis of the PRAL with and without the
stationary center diffuser to test the effect of the shear stress in the inner gap. The PfHb
increase was the same with or without the core so we concluded that the shear in the
inner gap was not the main source of hemolysis in the PRAL. This chapter describes
measurements of power dissipation in the inner gap. From these power measurements,
we calculated the shear stress in the inner gap using a model found in the literature.
The region between the stationary inner core and the rotating bundle is similar to the
classic case of a stationary inner cylinder surrounded by a rotating outer cylinder [80].
The radial pressure gradient generated by rotation is balanced by centrifugal forces
creating a more stable flow than the case of a rotating inner cylinder surrounded by a
stationary outer cylinder. However, above a critical Reynolds number, shown in Figure
8.10, the flow becomes turbulent. In the PRAL, the Reynolds number at 1500 RPM is
above the threshold for turbulent flow. We analyzed the shear stress in this gap using
an empirical relationship from the literature.
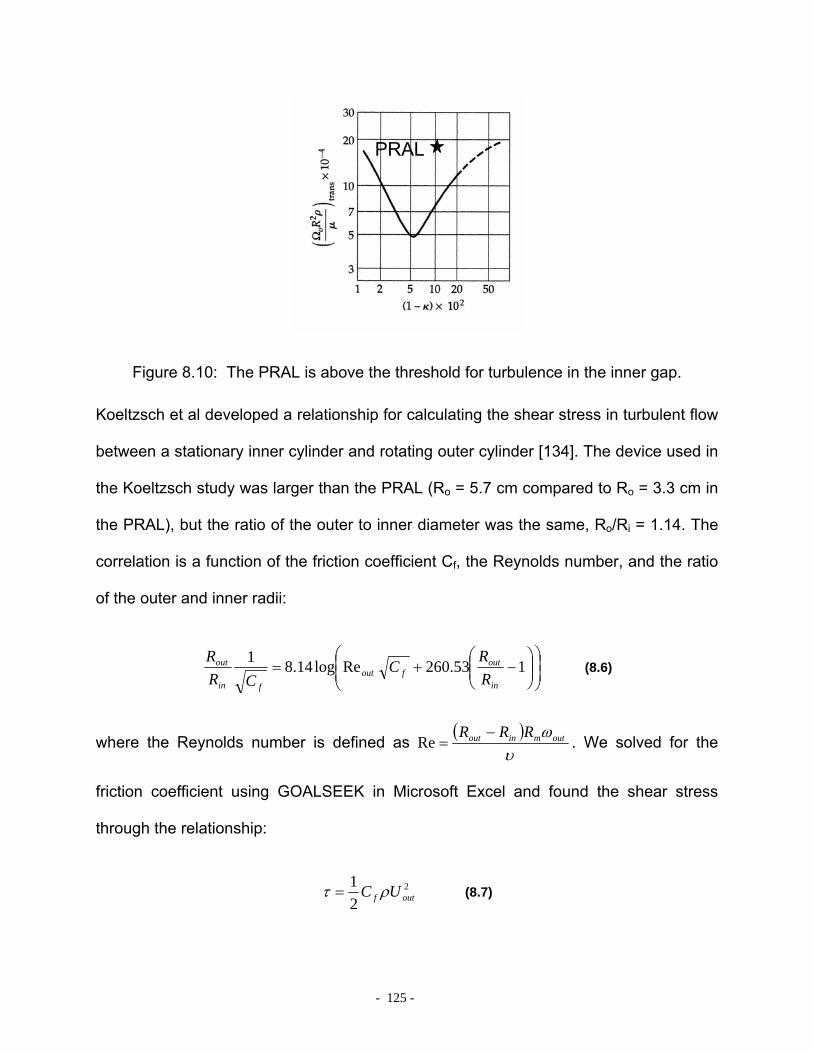
- 125 -
PRAL
Figure 8.10: The PRAL is above the threshold for turbulence in the inner gap.
Koeltzsch et al developed a relationship for calculating the shear stress in turbulent flow
between a stationary inner cylinder and rotating outer cylinder [134]. The device used in
the Koeltzsch study was larger than the PRAL (Ro = 5.7 cm compared to Ro = 3.3 cm in
the PRAL), but the ratio of the outer to inner diameter was the same, Ro/Ri = 1.14. The
correlation is a function of the friction coefficient Cf, the Reynolds number, and the ratio
of the outer and inner radii:
⎟⎟⎠
⎞⎜⎜⎝
⎛⎟⎟⎠
⎞⎜⎜⎝
⎛−+= 153.260Relog14.81
in
outfout
fin
out
RR
CCR
R (8.6)
where the Reynolds number is defined as ( )
υωoutminout RRR −
=Re . We solved for the
friction coefficient using GOALSEEK in Microsoft Excel and found the shear stress
through the relationship:
2
21
outf UC ρτ = (8.7)
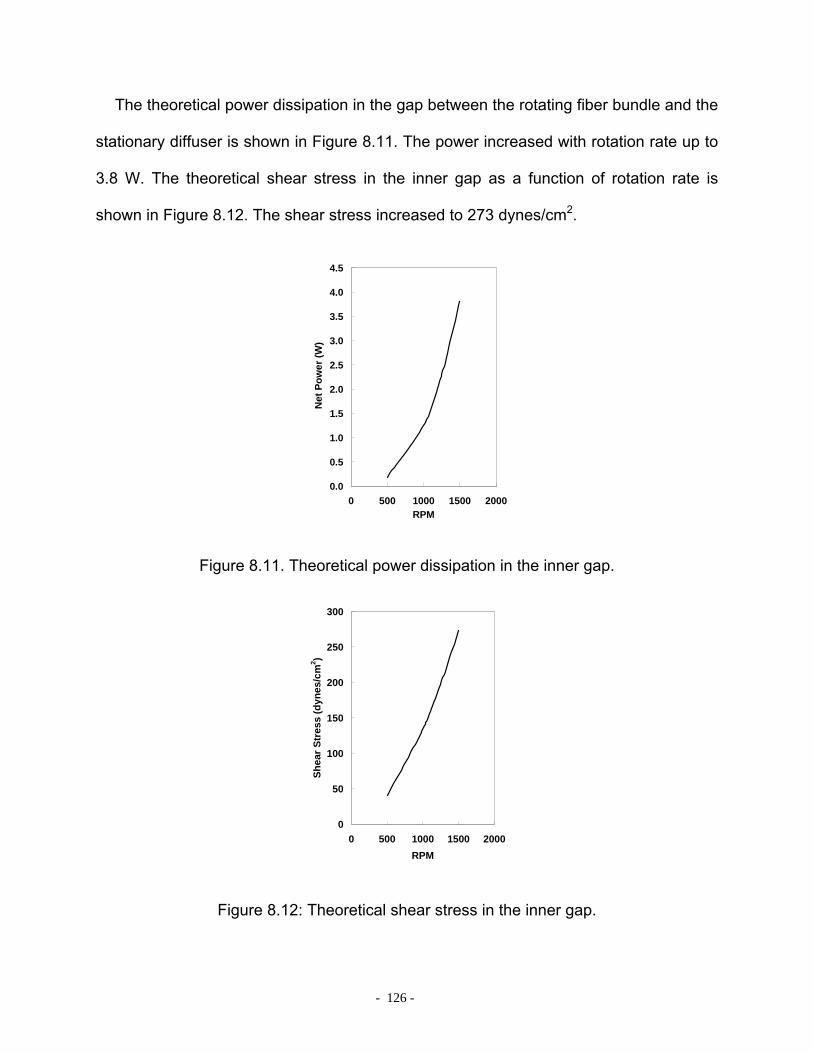
- 126 -
The theoretical power dissipation in the gap between the rotating fiber bundle and the
stationary diffuser is shown in Figure 8.11. The power increased with rotation rate up to
3.8 W. The theoretical shear stress in the inner gap as a function of rotation rate is
shown in Figure 8.12. The shear stress increased to 273 dynes/cm2.
0.0
0.5
1.0
1.5
2.0
2.5
3.0
3.5
4.0
4.5
0 500 1000 1500 2000RPM
Net
Pow
er (W
)
Figure 8.11. Theoretical power dissipation in the inner gap.
0
50
100
150
200
250
300
0 500 1000 1500 2000RPM
Shea
r Str
ess
(dyn
es/c
m2 )
Figure 8.12: Theoretical shear stress in the inner gap.
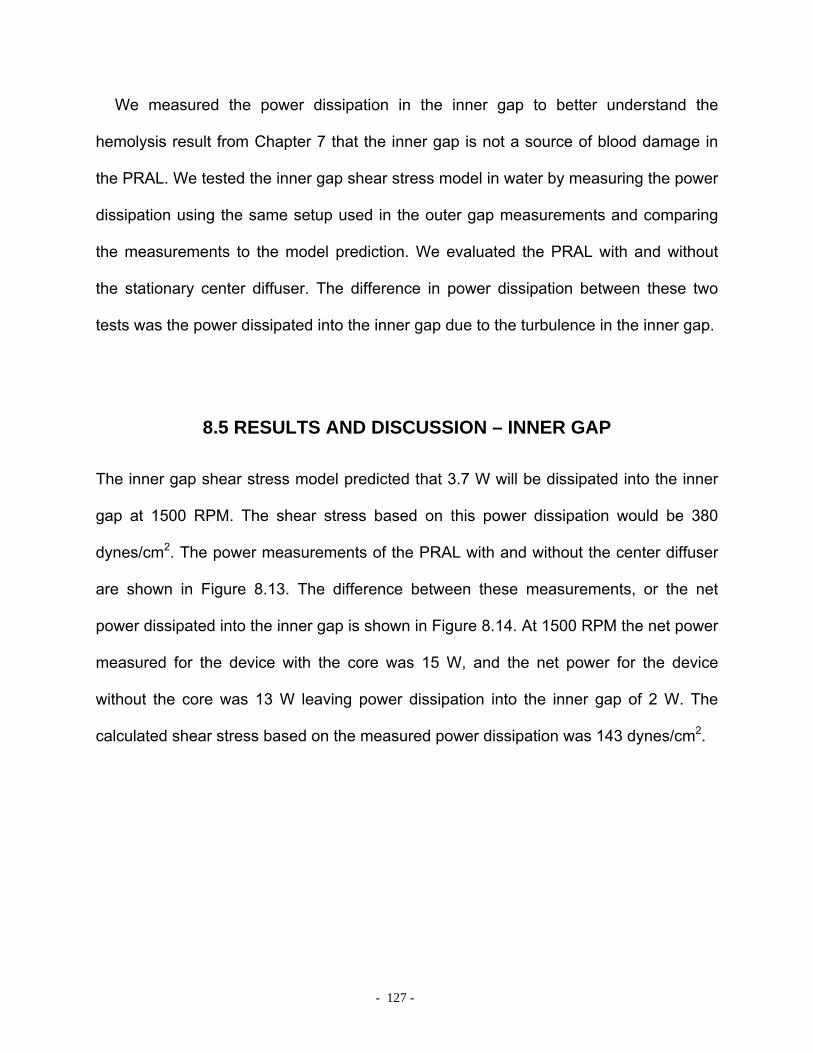
- 127 -
We measured the power dissipation in the inner gap to better understand the
hemolysis result from Chapter 7 that the inner gap is not a source of blood damage in
the PRAL. We tested the inner gap shear stress model in water by measuring the power
dissipation using the same setup used in the outer gap measurements and comparing
the measurements to the model prediction. We evaluated the PRAL with and without
the stationary center diffuser. The difference in power dissipation between these two
tests was the power dissipated into the inner gap due to the turbulence in the inner gap.
8.5 RESULTS AND DISCUSSION – INNER GAP
The inner gap shear stress model predicted that 3.7 W will be dissipated into the inner
gap at 1500 RPM. The shear stress based on this power dissipation would be 380
dynes/cm2. The power measurements of the PRAL with and without the center diffuser
are shown in Figure 8.13. The difference between these measurements, or the net
power dissipated into the inner gap is shown in Figure 8.14. At 1500 RPM the net power
measured for the device with the core was 15 W, and the net power for the device
without the core was 13 W leaving power dissipation into the inner gap of 2 W. The
calculated shear stress based on the measured power dissipation was 143 dynes/cm2.
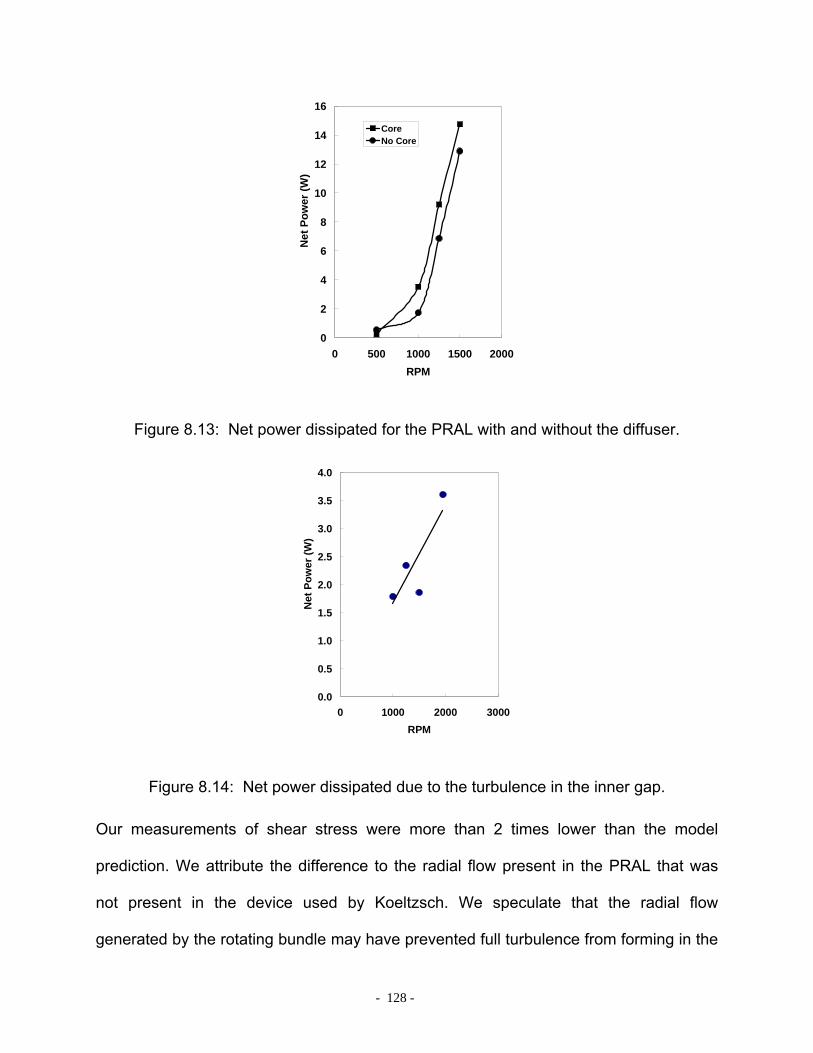
- 128 -
0
2
4
6
8
10
12
14
16
0 500 1000 1500 2000RPM
Net
Pow
er (W
)
CoreNo Core
Figure 8.13: Net power dissipated for the PRAL with and without the diffuser.
0.0
0.5
1.0
1.5
2.0
2.5
3.0
3.5
4.0
0 1000 2000 3000RPM
Net
Pow
er (W
)
Figure 8.14: Net power dissipated due to the turbulence in the inner gap.
Our measurements of shear stress were more than 2 times lower than the model
prediction. We attribute the difference to the radial flow present in the PRAL that was
not present in the device used by Koeltzsch. We speculate that the radial flow
generated by the rotating bundle may have prevented full turbulence from forming in the

- 129 -
inner gap resulting in lower shear stress. The shear stress of 143 dynes/cm2 may still
contribute to hemolysis in the PRAL, but this shear is still substantially lower than that in
the outer gap and therefore is not the main source of hemolysis in the PRAL.
8.6 SUMMARY
In the hemolysis tests in Chapter 7, a smooth rotating cylinder produced less blood
damage than the rotating fiber bundle. We hypothesized that the roughness of the fiber
bundle was producing higher shear stress than the smooth cylinder. We evaluated this
hypothesis by measuring the power dissipation into the fluid for both the smooth
cylinder and the rotating fiber bundle and compared the results to theoretical
predictions. We also measured the power dissipation for the fiber bundle with a larger
gap between the rotating bundle and stationary housing. Based on the power
measurements, we calculated the shear stress in the gap.
Our power measurements were consistent with the hypothesis that the roughness of
the fiber bundle causes increased shear stress in the outer gap. The power dissipation
of the fiber bundle at 1500 RPM was higher than the solid core by a factor of 3 (15 W
versus 4.9 W). We believe the roughness of the fiber bundle to be the main cause of
hemolysis in the PRAL.
- 130 -
8 MODELING OF CO2 REMOVAL
9.0 MODELING CO2 REMOVAL IN A BLOOD OXYGENATOR
9.1 INTRODUCTION
Blood oxygenators are routinely used in coronary artery bypass (CABG) surgery to
maintain physiologic O2 and CO2 levels in the blood. Additionally, blood oxygenators
have been used to reduce ventilator settings by temporarily assisting the native lungs
allowing the lungs time to heal. A blood oxygenator is comprised of thousands of
microporous hollow fiber membranes manifolded into a bundle structure. Sweep gas,
usually pure oxygen or air, flows through the lumens of the fibers while blood flows on
the outside of the fibers. O2 diffuses out of the fiber and into the blood while CO2
diffuses out of the blood into the fiber. The gas exchange efficiency of the device is
dictated by the concentration gradient of O2 and CO2 between the blood and the sweep
gas and by the size of the boundary layer that forms on the blood side of the fibers [135-
137].
One approach to designing an efficient blood oxygenator is through trial and error by
building and testing prototypes. The trial and error process can be expensive, labor-
intensive, and may take many years before producing a more efficient oxygenator. More
recently, computational fluid dynamics (CFD) models have been developed in an
attempt to reduce the number of iterations between experiments and final prototypes.
The fiber bundle is modeled as a porous medium since modeling the individual fibers in
- 131 -
a bundle is computationally impractical [138-140]. Using CFD, Gage et al was able to
predict pressure drop versus flowrate through the fiber bundle by determining the fiber
bundle permeability a priori [139]. Others have used CFD to find regions of flow stasis
within the oxygenator and predict localized areas of thrombus deposition [140-142]. The
use of CFD to optimize an oxygenator requires expensive software packages and
computer hardware, and requires a priori knowledge of the performance of the
oxygenator to accurately predict gas exchange.
Mockros and Leonard [136] developed a semi-empirical model to predict oxygen
exchange rates in blood based on gas exchange results obtained in water. The model
assumed one-dimensional flow through the fiber bundle and utilized a mass transfer
correlation based on a heat transfer analogy found in the literature [143]. The correlation
contained two empirical constants that were determined experimentally in water. The
correlation was used to predict gas exchange in blood by incorporating an ‘effective
diffusivity’ to account for the binding of oxygen to hemoglobin not present in water. The
advantage of the model was that the oxygenator could be designed using water as the
test fluid without the complexity and expense of using blood. The model has been
validated at various flowrates, inlet oxygen saturations, and blood temperatures [81, 82].
The purpose of this study was to develop a mathematical model to predict carbon
dioxide removal rates in hollow fiber membrane oxygenators analogous to the Mockros
model for oxygen exchange. Carbon dioxide is present as bicarbonate in the plasma
and red blood cells (90%), bound to hemoglobin (5%), and dissolved (5%) [144].
Dissolved CO2 can rapidly be converted to bicarbonate (HCO3) and vice versa in the
presence of the enzyme carbonic anhydrase in the red cells. The rapid rate of reaction
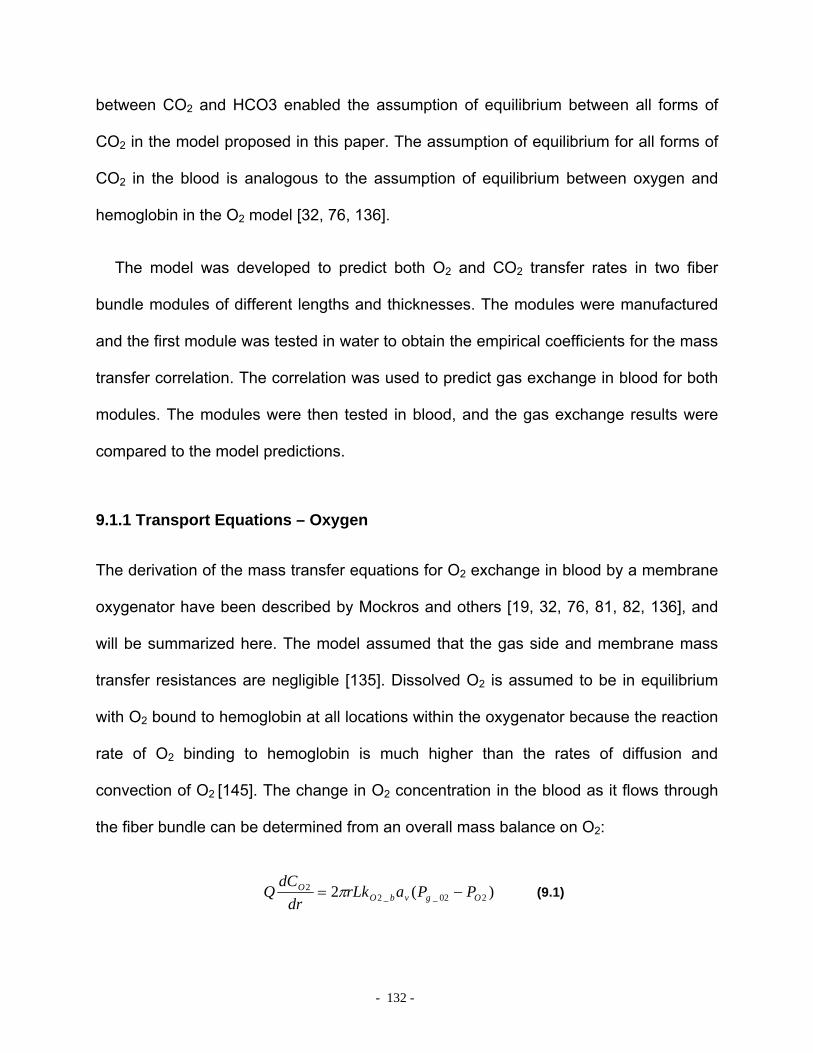
- 132 -
between CO2 and HCO3 enabled the assumption of equilibrium between all forms of
CO2 in the model proposed in this paper. The assumption of equilibrium for all forms of
CO2 in the blood is analogous to the assumption of equilibrium between oxygen and
hemoglobin in the O2 model [32, 76, 136].
The model was developed to predict both O2 and CO2 transfer rates in two fiber
bundle modules of different lengths and thicknesses. The modules were manufactured
and the first module was tested in water to obtain the empirical coefficients for the mass
transfer correlation. The correlation was used to predict gas exchange in blood for both
modules. The modules were then tested in blood, and the gas exchange results were
compared to the model predictions.
9.1.1 Transport Equations – Oxygen
The derivation of the mass transfer equations for O2 exchange in blood by a membrane
oxygenator have been described by Mockros and others [19, 32, 76, 81, 82, 136], and
will be summarized here. The model assumed that the gas side and membrane mass
transfer resistances are negligible [135]. Dissolved O2 is assumed to be in equilibrium
with O2 bound to hemoglobin at all locations within the oxygenator because the reaction
rate of O2 binding to hemoglobin is much higher than the rates of diffusion and
convection of O2 [145]. The change in O2 concentration in the blood as it flows through
the fiber bundle can be determined from an overall mass balance on O2:
)(2 202__22
OgvbOO PParLk
drdC
Q −= π (9.1)

- 133 -
In this equation, Q is the flowrate of blood through the fiber bundle, CO2 is the
concentration of O2 in the blood (dissolved O2 and bound to hemoglobin), r is the radial
coordinate, L is the bundle thickness, av is the surface area per volume of the fiber
bundle, kO2 is the mass transfer coefficient for oxygen, (Pg_O2-PO2) is the difference in
partial pressure between the gas within the lumens of the fibers and the blood. The gas
partial pressure in the fiber, Pg_O2, is assumed to be constant along the length of the
fibers. The left hand side of Equation 1 represents the convection of dissolved gas into
and out of the bundle, and the right hand side represents the amount of O2 transported
into the blood by the fibers. In the overall mass balance, molecular diffusion of O2 is
small relative to convection of O2 and is therefore neglected as a means of entering and
exiting the bundle.
The concentration of O2 is expressed as a combination of the dissolved component
and the O2 bound to hemoglobin: 2222 OTOOO SCPC += α where αO2 is the solubility of
oxygen in blood, CT is the maximum capacity of bound O2 in blood assuming 100%
hemoglobin saturation (SO2) [76]. This model can be used to predict gas exchange in
water by setting CT to zero since only dissolved O2 is present and using the solubility of
O2 in water, αO2_w. The differential equation governing O2 transfer in blood becomes:
)()1(
222_
22
2
_22OOg
OO
TO
vbOO PPCQ
rLakdr
dP−
+=
λα
α
π (9.2)
where 2
22
O
OO dP
dS=λ is the slope of the oxyhemoglobin dissociation curve. The mass
transfer coefficient (kO2) is determined from an analogous heat transfer correlation for
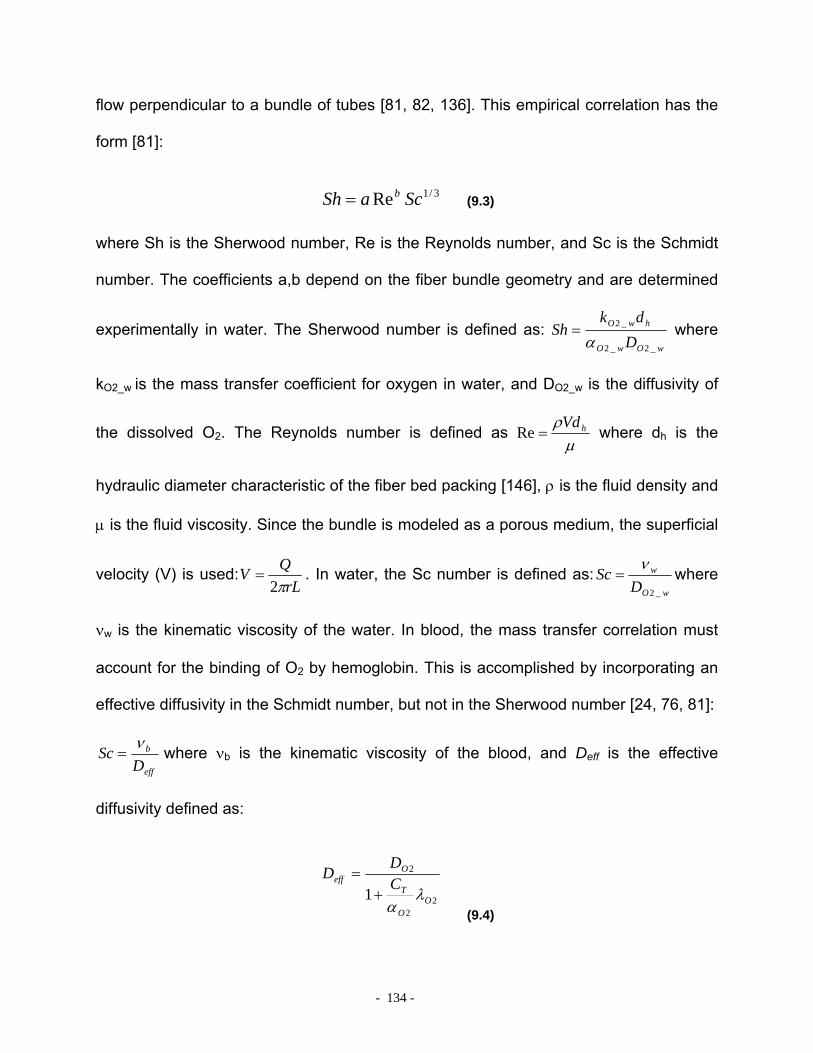
- 134 -
flow perpendicular to a bundle of tubes [81, 82, 136]. This empirical correlation has the
form [81]:
3/1Re ScaSh b= (9.3)
where Sh is the Sherwood number, Re is the Reynolds number, and Sc is the Schmidt
number. The coefficients a,b depend on the fiber bundle geometry and are determined
experimentally in water. The Sherwood number is defined as: wOwO
hwO
Ddk
Sh_2_2
_2
α= where
kO2_w is the mass transfer coefficient for oxygen in water, and DO2_w is the diffusivity of
the dissolved O2. The Reynolds number is defined as µ
ρ hVd=Re where dh is the
hydraulic diameter characteristic of the fiber bed packing [146], ρ is the fluid density and
µ is the fluid viscosity. Since the bundle is modeled as a porous medium, the superficial
velocity (V) is used:rL
QVπ2
= . In water, the Sc number is defined as:wO
w
DSc
_2
ν= where
νw is the kinematic viscosity of the water. In blood, the mass transfer correlation must
account for the binding of O2 by hemoglobin. This is accomplished by incorporating an
effective diffusivity in the Schmidt number, but not in the Sherwood number [24, 76, 81]:
eff
b
DSc
ν= where νb is the kinematic viscosity of the blood, and Deff is the effective
diffusivity defined as:
22
2
1 OO
T
Oeff C
DD
λα
+=
(9.4)
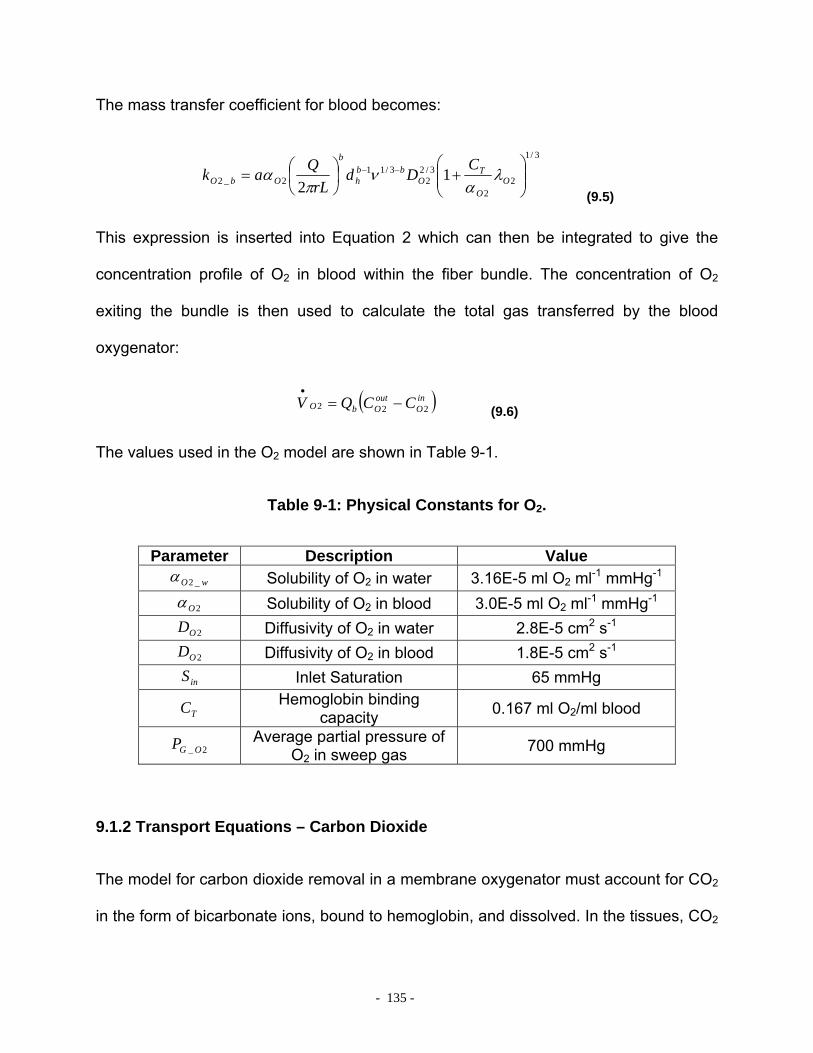
- 135 -
The mass transfer coefficient for blood becomes:
3/1
22
3/22
3/112_2 1
2 ⎟⎟⎠
⎞⎜⎜⎝
⎛+⎟
⎠⎞
⎜⎝⎛= −−
OO
TO
bbh
b
ObOCDd
rLQak λ
αν
πα
(9.5)
This expression is inserted into Equation 2 which can then be integrated to give the
concentration profile of O2 in blood within the fiber bundle. The concentration of O2
exiting the bundle is then used to calculate the total gas transferred by the blood
oxygenator:
( )inO
outObO CCQV 222 −=
•
(9.6)
The values used in the O2 model are shown in Table 9-1.
Table 9-1: Physical Constants for O2.
Parameter Description Value wO _2α Solubility of O2 in water 3.16E-5 ml O2 ml-1 mmHg-1
2Oα Solubility of O2 in blood 3.0E-5 ml O2 ml-1 mmHg-1
2OD Diffusivity of O2 in water 2.8E-5 cm2 s-1
2OD Diffusivity of O2 in blood 1.8E-5 cm2 s-1
inS Inlet Saturation 65 mmHg
TC Hemoglobin binding capacity 0.167 ml O2/ml blood
2_ OGP Average partial pressure of O2 in sweep gas 700 mmHg
9.1.2 Transport Equations – Carbon Dioxide
The model for carbon dioxide removal in a membrane oxygenator must account for CO2
in the form of bicarbonate ions, bound to hemoglobin, and dissolved. In the tissues, CO2

- 136 -
diffuses down its concentration gradient into the plasma then enters the red cell [144,
147]. In the red cell, CO2 is hydrated into carbonic acid in the presence of the enzyme
carbonic anhydrase (Reaction 1 below). Carbonic acid is then dissociated into hydrogen
ion and bicarbonate (Reaction 2):
−+ +⇔⇔+ 3
2
32
1
22 HCOHCOHOHCOAnhydraseCarbonic
HCO3 exits the red cell and enters the plasma in exchange for chloride ion when the
concentration of HCO3 builds up in the red cell. As blood flows through the oxygenator,
dissolved CO2 diffuses from the plasma across the fiber membrane and is removed by
the sweep gas. As CO2 is removed from the plasma by the oxygenator, bicarbonate
diffuses into the red cell where it is converted to CO2 through the reverse reactions
above. The CO2 diffuses back across the red cell membrane into the plasma where it is
removed by the oxygenator. The presence of carbonic anhydrase increases the rate of
conversion between CO2 and HCO3 so that equilibrium can be assumed between all
forms of CO2 in the blood (see discussion) [148, 149]. This analysis for CO2 removal in
the membrane lung assumes that carbonic anhydrase in the red blood cells is available
in sufficient quantity to catalyze the CO2/HCO3 reaction throughout the CO2 transport
process. In the overall mass balance for CO2, the concentration of total CO2 (ml CO2/ml
blood) can be expressed in terms of partial pressure through the relationship [31]:
tCOCO qPC 22 = which is an empirical fit of the CO2 dissociation curve. The constants q and
t are fit parameters with values of 0.128 and 0.369, respectively. The mass balance on
CO2 can be expressed by the following equation.
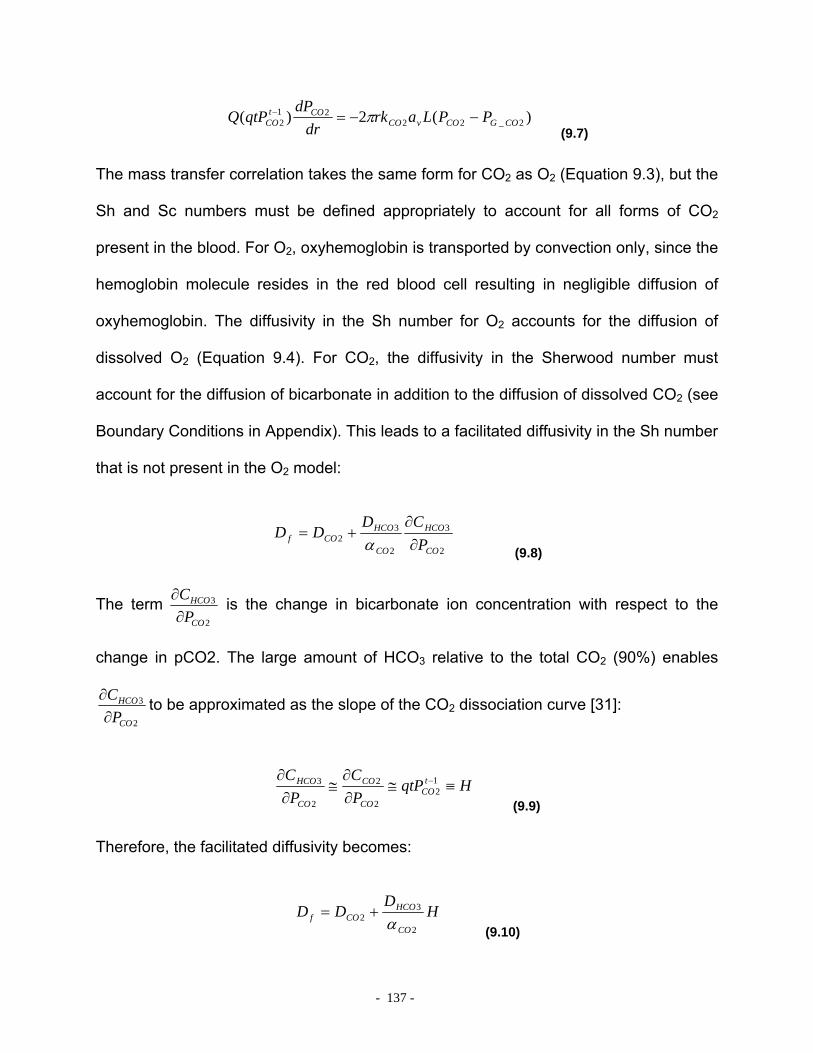
- 137 -
)(2)( 2_2221
2 COGCOvCOCOt
CO PPLarkdr
dPqtPQ −−=− π
(9.7)
The mass transfer correlation takes the same form for CO2 as O2 (Equation 9.3), but the
Sh and Sc numbers must be defined appropriately to account for all forms of CO2
present in the blood. For O2, oxyhemoglobin is transported by convection only, since the
hemoglobin molecule resides in the red blood cell resulting in negligible diffusion of
oxyhemoglobin. The diffusivity in the Sh number for O2 accounts for the diffusion of
dissolved O2 (Equation 9.4). For CO2, the diffusivity in the Sherwood number must
account for the diffusion of bicarbonate in addition to the diffusion of dissolved CO2 (see
Boundary Conditions in Appendix). This leads to a facilitated diffusivity in the Sh number
that is not present in the O2 model:
2
3
2
32
CO
HCO
CO
HCOCOf P
CDDD
∂∂
+=α (9.8)
The term 2
3
CO
HCO
PC∂
∂ is the change in bicarbonate ion concentration with respect to the
change in pCO2. The large amount of HCO3 relative to the total CO2 (90%) enables
2
3
CO
HCO
PC∂
∂ to be approximated as the slope of the CO2 dissociation curve [31]:
HqtPPC
PC t
COCO
CO
CO
HCO ≡≅∂∂
≅∂
∂ −12
2
2
2
3
(9.9)
Therefore, the facilitated diffusivity becomes:
HD
DDCO
HCOCOf
2
32 α
+= (9.10)

- 138 -
In this equation H is the slope of CO2 dissociation curve. In the Schmidt number, the
diffusivity must account for the convection of CO2 carried as bicarbonate and bound to
hemoglobin and therefore becomes an ‘effective diffusivity’ similar to that defined by
Vaslef for O2 [81]:
22
11 COCO
feff
DD
λα
+=
(9.11)
where 2
22
CO
bCO
CO PC
∂∂
=λ is the change in concentration of the chemically bound CO2 (as
bicarbonate and bound to hemoglobin). The change in bound CO2 can be approximated
with the slope of the CO2 dissociation curve (H) because of the large amount of CO2
present as bicarbonate and bound to hemoglobin (95%). Once the relationships for
facilitated diffusion and effective diffusivity are inserted into the mass transfer
correlation, the mass transfer coefficient in blood becomes for CO2:
3/1
2
)3/1()1(3/2
2
322_2
112 ⎟⎟
⎠
⎞⎜⎜⎝
⎛+⎟
⎠⎞
⎜⎝⎛
⎟⎟⎠
⎞⎜⎜⎝
⎛+= −− H
rLQdH
DDak
CO
bb
bh
CO
HCOCOCObCO α
υπα
α (9.12)
This expression can be inserted into Equation 9.7 which can then be integrated to give
the concentration profile of CO2 in blood within the fiber bundle. Once the concentration
profile is known, the total CO2 removal of the blood oxygenator can be determined:
( )outCO
inCObCO CCQV 222 −=
•
(9.13)
The parameters used in the CO2 model are shown in Table 9-2.

- 139 -
Table 9-2: Physical Constants for CO2.
Parameter Description Value wCO _2α Solubility of CO2 in water 7.5E-4 ml CO2 ml-1 mmHg-1
2COα Solubility of CO2 in blood 6.62E-4 ml CO2 ml-1 mmHg-1
wCOD _2 Diffusivity of CO2 in water 1.92E-5 cm2 s-1
2COD Diffusivity of CO2 in blood 7.39E-6 cm2 s-1
3HCOD Diffusivity of HCO3 in blood 4.62E-6 cm2 s-1
inP Inlet pCO2 45 mmHg
2_ COGP Average partial pressure of CO2 in sweep gas 4 mmHg
wν Kinematic viscosity of water 6.63E-3 cm2 s-1
bν Kinematic viscosity of blood 0.023 cm2 s-1
Q Blood Flowrate 0.5-2.75 L min-1
9.2 METHODS
An oxygenator module was fabricated to compare the model predictions to experimental
measurements of gas exchange. The coefficients (a,b) in the mass transfer correlation
were determined through gas exchange rates measured in water. The coefficients were
used to determine the mass transfer coefficient for O2 and CO2. The solution to
Equation 9.2 and Equation 9.77 was determined numerically using the built-in ordinary
differential equation solver in Matlab based on the Runga-Kutta method [150]. The inlet
partial pressure of O2 and CO2 were specified as 40 mmHg and 50 mmHg, respectively.
The concentration of O2 was determined by the program and input into Equation 9.6 to
calculate oxygen exchange. The concentration of CO2 exiting the bundle was also
determined by the program and input into Equation 9.13 to calculate CO2 removal. The
gas exchange was then measured in vitro using blood and compared to the model. A
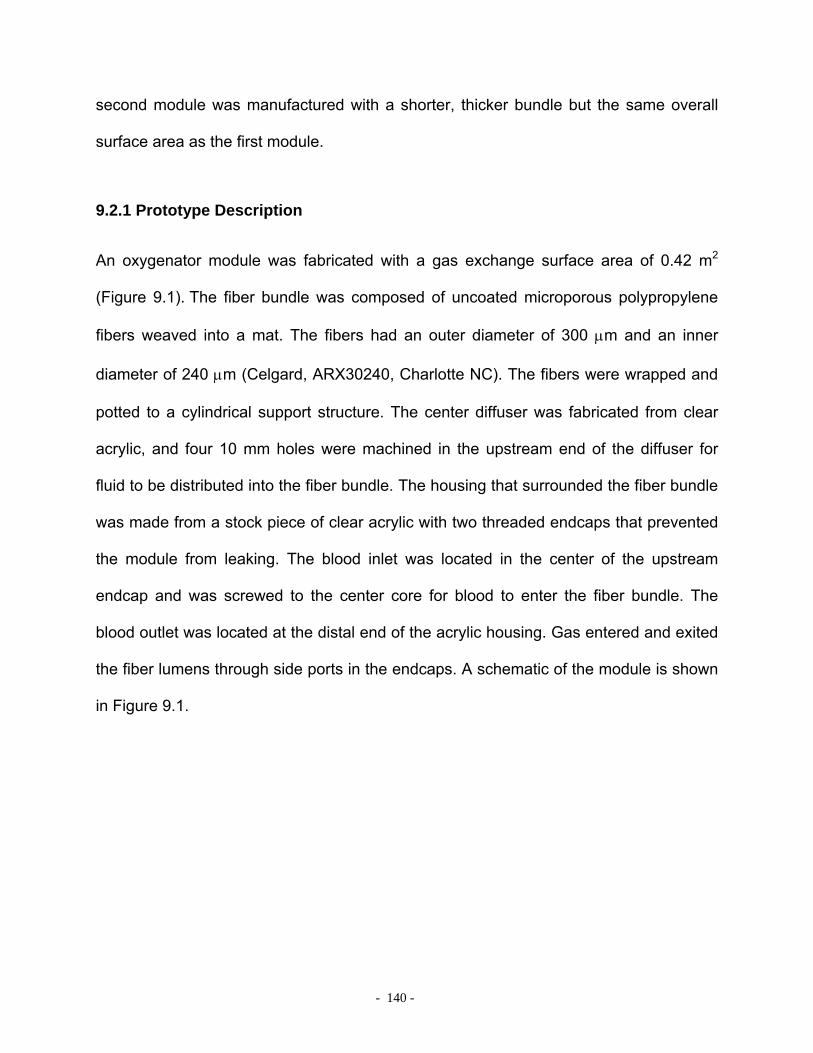
- 140 -
second module was manufactured with a shorter, thicker bundle but the same overall
surface area as the first module.
9.2.1 Prototype Description
An oxygenator module was fabricated with a gas exchange surface area of 0.42 m2
(Figure 9.1). The fiber bundle was composed of uncoated microporous polypropylene
fibers weaved into a mat. The fibers had an outer diameter of 300 µm and an inner
diameter of 240 µm (Celgard, ARX30240, Charlotte NC). The fibers were wrapped and
potted to a cylindrical support structure. The center diffuser was fabricated from clear
acrylic, and four 10 mm holes were machined in the upstream end of the diffuser for
fluid to be distributed into the fiber bundle. The housing that surrounded the fiber bundle
was made from a stock piece of clear acrylic with two threaded endcaps that prevented
the module from leaking. The blood inlet was located in the center of the upstream
endcap and was screwed to the center core for blood to enter the fiber bundle. The
blood outlet was located at the distal end of the acrylic housing. Gas entered and exited
the fiber lumens through side ports in the endcaps. A schematic of the module is shown
in Figure 9.1.
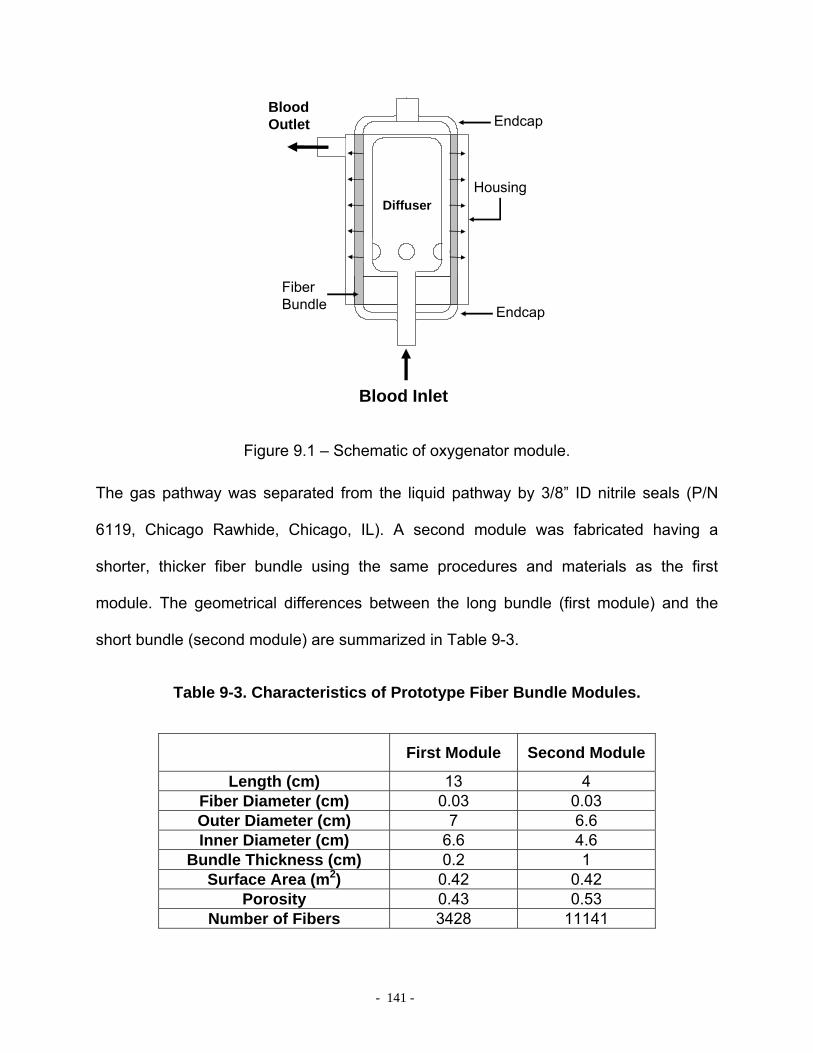
- 141 -
DiffuserHousing
Blood Outlet
Blood Inlet
Fiber Bundle
Endcap
Endcap
Figure 9.1 – Schematic of oxygenator module.
The gas pathway was separated from the liquid pathway by 3/8” ID nitrile seals (P/N
6119, Chicago Rawhide, Chicago, IL). A second module was fabricated having a
shorter, thicker fiber bundle using the same procedures and materials as the first
module. The geometrical differences between the long bundle (first module) and the
short bundle (second module) are summarized in Table 9-3.
Table 9-3. Characteristics of Prototype Fiber Bundle Modules.
First Module Second Module
Length (cm) 13 4 Fiber Diameter (cm) 0.03 0.03 Outer Diameter (cm) 7 6.6 Inner Diameter (cm) 6.6 4.6
Bundle Thickness (cm) 0.2 1 Surface Area (m2) 0.42 0.42
Porosity 0.43 0.53 Number of Fibers 3428 11141

- 142 -
9.2.2 In vitro gas exchange
A flow loop was constructed for testing in water or blood that consisted of a reservoir: a
12 L bucket for water, or a blood transfusion bag (Affinity Venous Reservoir Bag,
Medtronic MN for blood tests), a centrifugal pump (March Manufacturing, Glenview, IL
for water; Biomedicus BP-80X, Medtronic, Minneapolis, MN for blood), a commercial
oxygenator (Affinity, Medtronic, Minneapolis, MN), and the module prototype (Figure 9.2).
Reservoir
PumpDeoxygenator
Oxygenator Module
O2 inlet
Moisture Trap
FlowMeter
Vacuum Pump
CO2analyzer
Water/Blood Flow Path
Oxygen Flow Path
Figure 9.2 – Gas exchange characterization loop for water and blood.
Tubing connected the outflow port of the reservoir to the inlet of the centrifugal pump.
The pump was used in conjunction with a Hoffman clamp to set the flowrate. Sweep gas
through the commercial oxygenator was a N2/CO2 mix adjusted with a gas blender
(Cole-Parmer Instrument Company, Vernon Hills, IL) to set the inlet conditions in
accordance with the Association for the Advancement of Medical Devices (AAMI)
standards [75]: O2 inlet saturation 65 +/- 5% and inlet pCO2 of 45 +/- 5 mmHg. The test
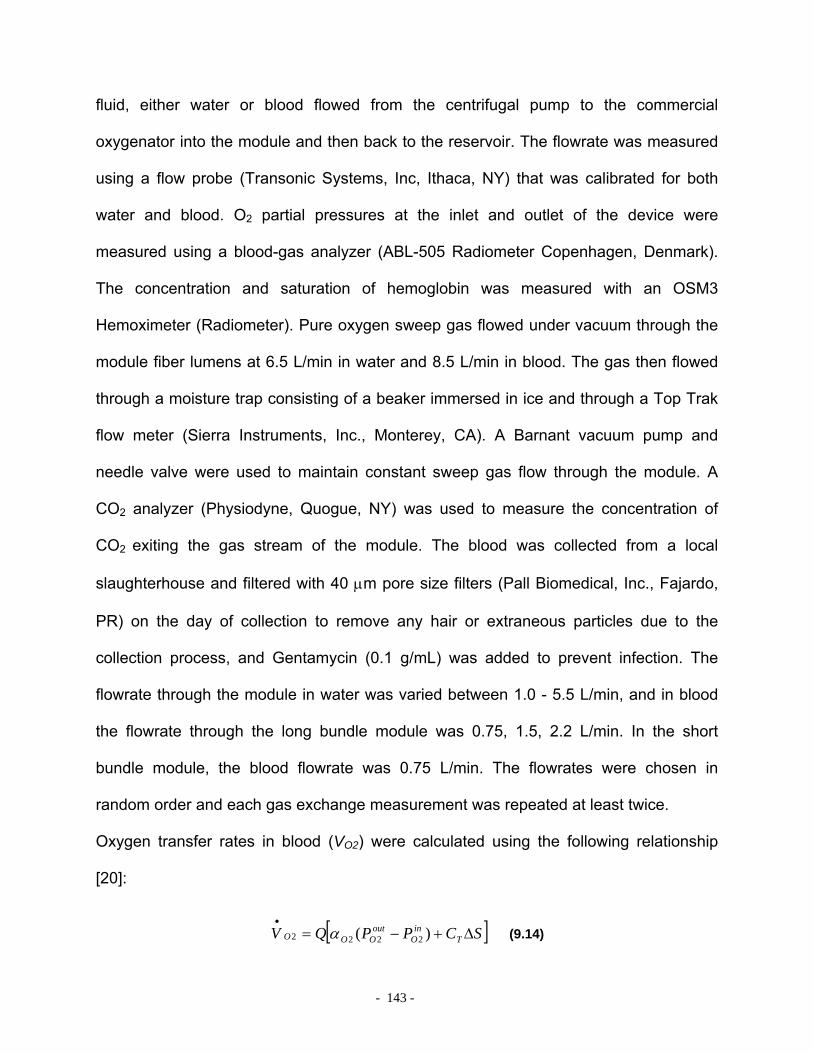
- 143 -
fluid, either water or blood flowed from the centrifugal pump to the commercial
oxygenator into the module and then back to the reservoir. The flowrate was measured
using a flow probe (Transonic Systems, Inc, Ithaca, NY) that was calibrated for both
water and blood. O2 partial pressures at the inlet and outlet of the device were
measured using a blood-gas analyzer (ABL-505 Radiometer Copenhagen, Denmark).
The concentration and saturation of hemoglobin was measured with an OSM3
Hemoximeter (Radiometer). Pure oxygen sweep gas flowed under vacuum through the
module fiber lumens at 6.5 L/min in water and 8.5 L/min in blood. The gas then flowed
through a moisture trap consisting of a beaker immersed in ice and through a Top Trak
flow meter (Sierra Instruments, Inc., Monterey, CA). A Barnant vacuum pump and
needle valve were used to maintain constant sweep gas flow through the module. A
CO2 analyzer (Physiodyne, Quogue, NY) was used to measure the concentration of
CO2 exiting the gas stream of the module. The blood was collected from a local
slaughterhouse and filtered with 40 µm pore size filters (Pall Biomedical, Inc., Fajardo,
PR) on the day of collection to remove any hair or extraneous particles due to the
collection process, and Gentamycin (0.1 g/mL) was added to prevent infection. The
flowrate through the module in water was varied between 1.0 - 5.5 L/min, and in blood
the flowrate through the long bundle module was 0.75, 1.5, 2.2 L/min. In the short
bundle module, the blood flowrate was 0.75 L/min. The flowrates were chosen in
random order and each gas exchange measurement was repeated at least twice.
Oxygen transfer rates in blood (VO2) were calculated using the following relationship
[20]:
[ ]SCPPQV Tin
Oout
OOO ∆+−=•
)( 2222 α (9.14)
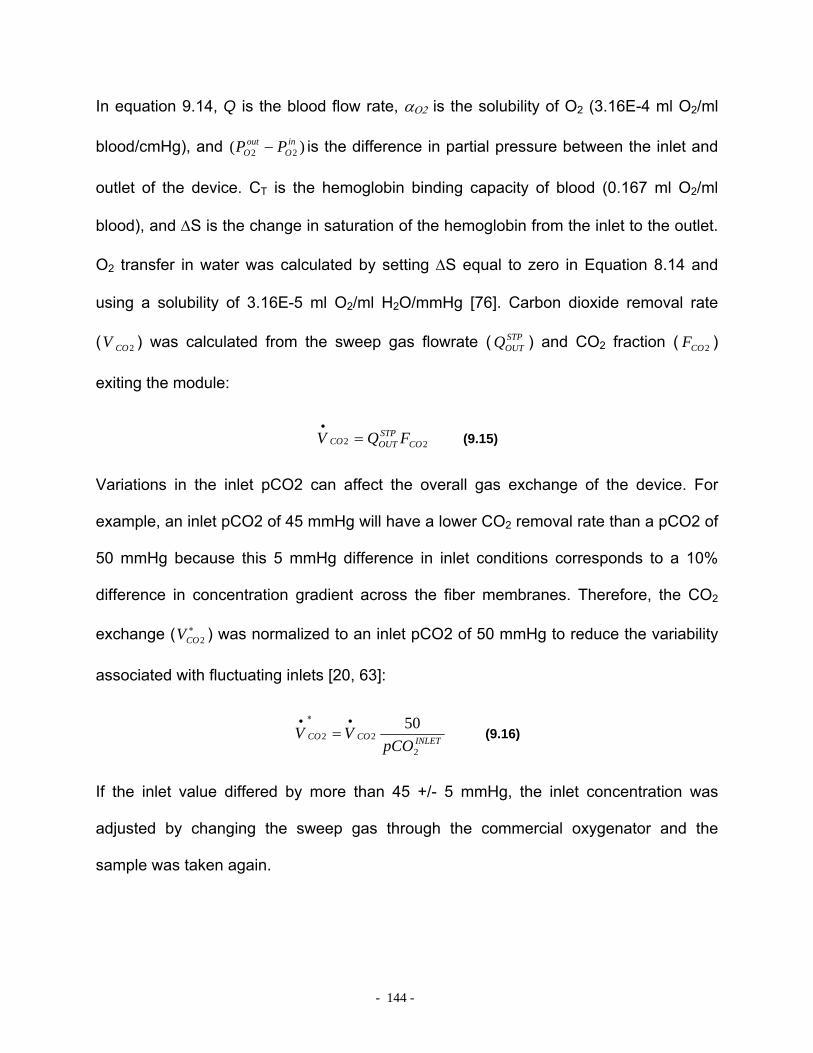
- 144 -
In equation 9.14, Q is the blood flow rate, αΟ2 is the solubility of O2 (3.16E-4 ml O2/ml
blood/cmHg), and )( 22in
Oout
O PP − is the difference in partial pressure between the inlet and
outlet of the device. CT is the hemoglobin binding capacity of blood (0.167 ml O2/ml
blood), and ∆S is the change in saturation of the hemoglobin from the inlet to the outlet.
O2 transfer in water was calculated by setting ∆S equal to zero in Equation 8.14 and
using a solubility of 3.16E-5 ml O2/ml H2O/mmHg [76]. Carbon dioxide removal rate
( 2COV ) was calculated from the sweep gas flowrate ( STPOUTQ ) and CO2 fraction ( 2COF )
exiting the module:
22 COSTPOUTCO FQV =
•
(9.15)
Variations in the inlet pCO2 can affect the overall gas exchange of the device. For
example, an inlet pCO2 of 45 mmHg will have a lower CO2 removal rate than a pCO2 of
50 mmHg because this 5 mmHg difference in inlet conditions corresponds to a 10%
difference in concentration gradient across the fiber membranes. Therefore, the CO2
exchange ( ∗2COV ) was normalized to an inlet pCO2 of 50 mmHg to reduce the variability
associated with fluctuating inlets [20, 63]:
INLETCOCOpCO
VV2
2250•∗•
= (9.16)
If the inlet value differed by more than 45 +/- 5 mmHg, the inlet concentration was
adjusted by changing the sweep gas through the commercial oxygenator and the
sample was taken again.

- 145 -
In water, the mass transfer coefficient was determined from the VCO2 and VO2 data:
2_
2_2
COLM
COwCO PA
Vk∆
=
•
2_
2_2
OLM
OwO PA
Vk∆
=
•
(9.17)
where A is the fiber bundle membrane area, ∆PLM is the log mean partial pressure
difference between the water flowing outside of the fibers and the gas flowing on the
inside of the fibers. The concentration of gas inside the fibers was assumed constant.
For CO2 Pg was assumed to be 4 mmHg, and for O2 Pg was assumed to be 700 mmHg.
The gas exchange data was used to develop the mass transfer correlation of the
form: 3/1Re ScaSh b= where Sh is the Sherwood number, Re is the Reynolds number,
and Sc is the Schmidt number. The Sherwood correlation was plotted on a log-log scale
and the model parameter values a,b were determined through a linear curve fit. The
values for a,b were then input into Equation 9.5 and Equation 9.12 to determine the
mass transfer coefficient for O2 and CO2 in blood, respectively. Once the mass transfer
coefficient was determined, the concentration profile within the fiber bundle was
calculated and used to predict gas exchange.
9.3 RESULTS
The gas exchange experiments in water were used to develop a mass transfer
correlation to predict both O2 and CO2 exchange in blood at various flowrates. The gas
exchange rates in water as a function of flowrate through the first module (long, thin
bundle) are shown in Figure 9.3.

- 146 -
0
20
40
60
80
100
120
140
0.0 2.0 4.0 6.0Flow Rate (LPM)
vCO
2/m2 (m
l/min
/m2 )
0
10
20
30
40
50
60
70
80
90
0.0 2.0 4.0 6.0Flow Rate (LPM)
vO2/m
2 (ml/m
in/m
2 )
Figure 9.3 – Gas exchange rates versus flowrate for the first module (long, thin bundle) in water. Left: CO2 removed. Right: O2 supplied.
The CO2 removal rates ranged from 51 +/- 0.2 ml/min/m2 at 1 L/min to 120 +/- 1.6
ml/min/m2 at 5.5 L/min. The O2 supplied to the water ranged from 32 +/- 0.4 ml/min/m2
at 1 L/min to 84 +/- 0.5 at 5.5 L/min. The dimensionless correlation developed from the
water gas exchange experiments is plotted in Figure 9.4. The O2 and CO2 data
collapsed onto a single curve, and a nonlinear regression was used to determine the
value of the constant a to be 0.54 and the constant b to be 0.42.
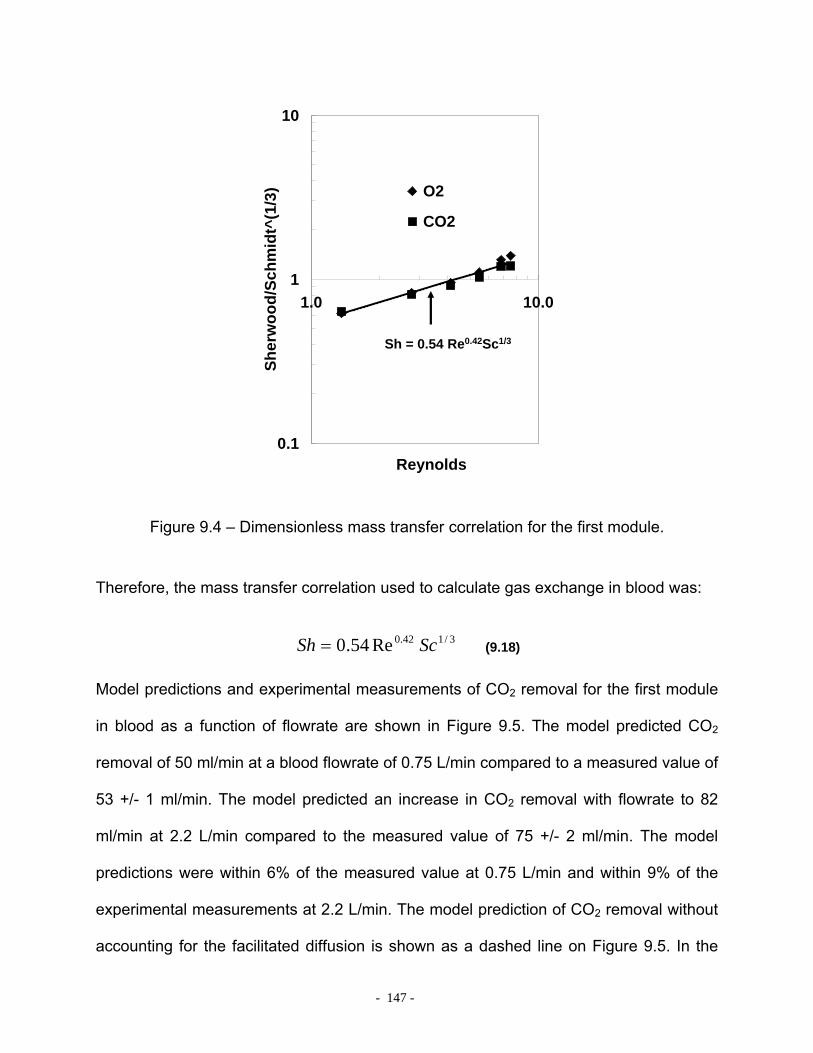
- 147 -
y = 0.54x0.42
0.1
1
10
1.0 10.0
Reynolds
Sher
woo
d/Sc
hmid
t^(1
/3) O2
CO2
R2 = 0.96Sh = 0.54 Re0.42Sc1/3
Figure 9.4 – Dimensionless mass transfer correlation for the first module.
Therefore, the mass transfer correlation used to calculate gas exchange in blood was:
3/142.0Re54.0 ScSh = (9.18)
Model predictions and experimental measurements of CO2 removal for the first module
in blood as a function of flowrate are shown in Figure 9.5. The model predicted CO2
removal of 50 ml/min at a blood flowrate of 0.75 L/min compared to a measured value of
53 +/- 1 ml/min. The model predicted an increase in CO2 removal with flowrate to 82
ml/min at 2.2 L/min compared to the measured value of 75 +/- 2 ml/min. The model
predictions were within 6% of the measured value at 0.75 L/min and within 9% of the
experimental measurements at 2.2 L/min. The model prediction of CO2 removal without
accounting for the facilitated diffusion is shown as a dashed line on Figure 9.5. In the
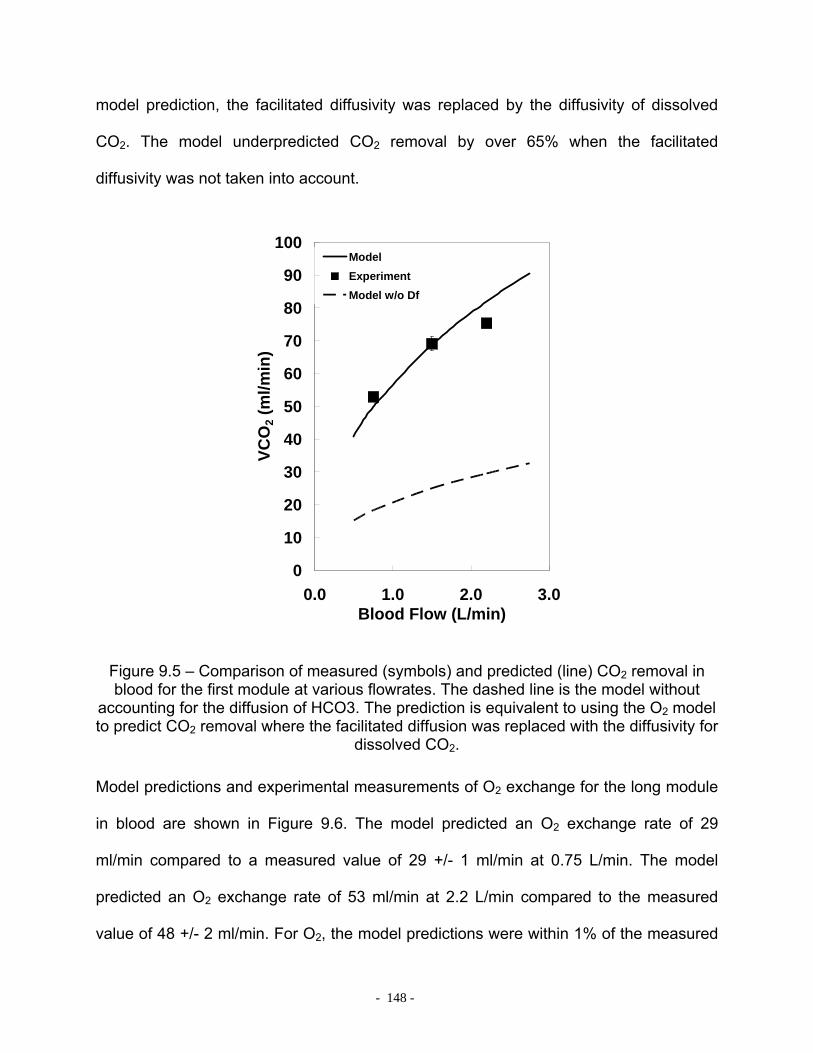
- 148 -
model prediction, the facilitated diffusivity was replaced by the diffusivity of dissolved
CO2. The model underpredicted CO2 removal by over 65% when the facilitated
diffusivity was not taken into account.
0
10
20
30
40
50
60
70
80
90
100
0.0 1.0 2.0 3.0Blood Flow (L/min)
VCO
2 (m
l/min
)ModelExperimentModel w/o Df
Figure 9.5 – Comparison of measured (symbols) and predicted (line) CO2 removal in blood for the first module at various flowrates. The dashed line is the model without
accounting for the diffusion of HCO3. The prediction is equivalent to using the O2 model to predict CO2 removal where the facilitated diffusion was replaced with the diffusivity for
dissolved CO2.
Model predictions and experimental measurements of O2 exchange for the long module
in blood are shown in Figure 9.6. The model predicted an O2 exchange rate of 29
ml/min compared to a measured value of 29 +/- 1 ml/min at 0.75 L/min. The model
predicted an O2 exchange rate of 53 ml/min at 2.2 L/min compared to the measured
value of 48 +/- 2 ml/min. For O2, the model predictions were within 1% of the measured
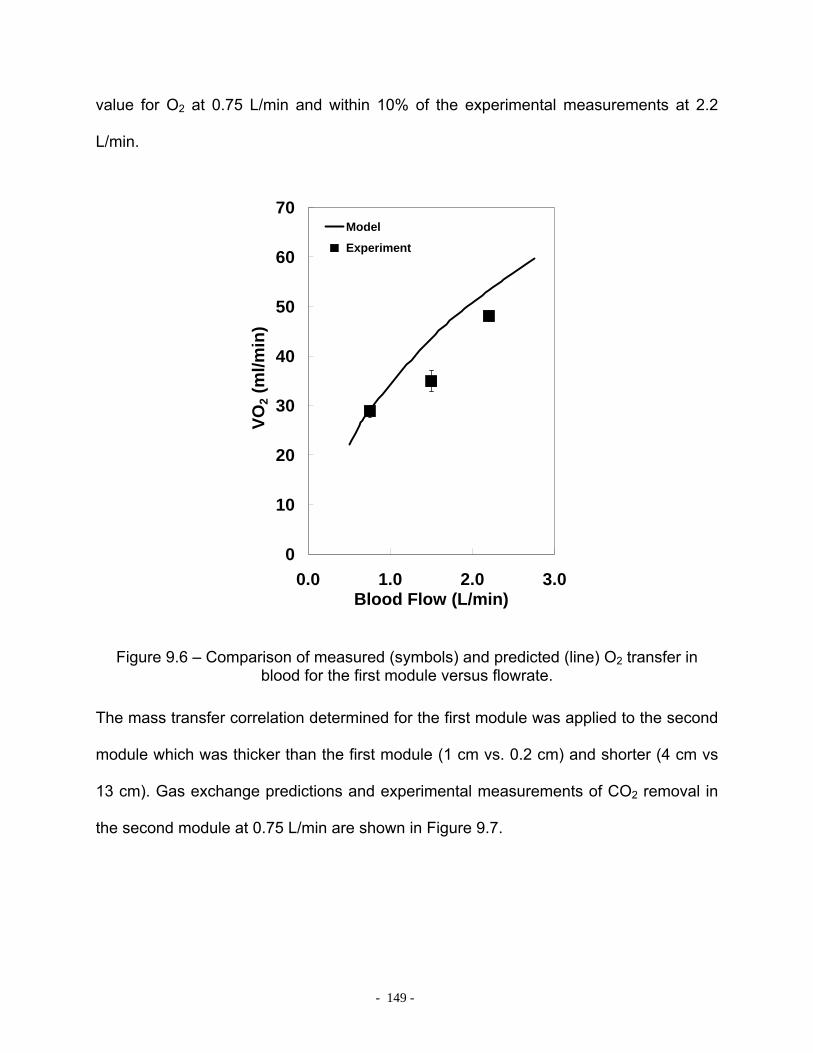
- 149 -
value for O2 at 0.75 L/min and within 10% of the experimental measurements at 2.2
L/min.
0
10
20
30
40
50
60
70
0.0 1.0 2.0 3.0Blood Flow (L/min)
VO2 (
ml/m
in)
Model
Experiment
Figure 9.6 – Comparison of measured (symbols) and predicted (line) O2 transfer in blood for the first module versus flowrate.
The mass transfer correlation determined for the first module was applied to the second
module which was thicker than the first module (1 cm vs. 0.2 cm) and shorter (4 cm vs
13 cm). Gas exchange predictions and experimental measurements of CO2 removal in
the second module at 0.75 L/min are shown in Figure 9.7.

- 150 -
0
10
20
30
40
50
60
70
80
90
O2 CO2
Gas
Exc
hang
e (m
l/min
)
ModelExperiment
Figure 9.7 – Comparison of measured (filled bars) and predicted (dashed bars) CO2 and O2 transfer in the second module (short, thick bundle).
The model predicted a CO2 removal of 80 ml/min compared to the measured value of
67 +/- 8 ml/min. For O2, the model predicted an O2 transfer rate of 36 ml/min compared
to the measured value of 43 +/- 1 ml/min.
9.4 DISCUSSION
A mathematical model has been developed to predict CO2 removal rates in blood from
removal rates measured in water. The approach to modeling CO2 removal rates was
analogous to one developed by Mockros for predicting O2 exchange rates. The
dimensionless mass transfer correlation was shown to collapse onto one universal
curve for both O2 and CO2 in water. The correlation was used to predict both O2 and
- 151 -
CO2 exchange in blood by incorporating an appropriate facilitated diffusivity for CO2 to
account for the diffusion of CO2 stored as bicarbonate.
A simple analytical approach to analyzing convection-diffusion in hollow fiber
membrane oxygenators does not presently exist, so mass transfer correlations are used
to predict gas exchange. In this work, appropriate definitions for the Sherwood and
Schmidt numbers were determined to account for the diffusion of CO2 in the blood
transported as HCO3. The facilitated diffusivity is present in the Sherwood number for
CO2 which arises from the boundary condition at the wall of the fiber (See Appendix –
Equation A.11). This is in contrast to the definition of the Sherwood number for O2 in
that the diffusivity only accounts for the diffusion of dissolved oxygen. The O2 that is
transported from the fibers into the blood binds to hemoglobin but has a negligible
diffusing capacity since hemoglobin is present inside the red blood cell. The importance
of incorporating the facilitated diffusivity for CO2 was shown by replacing the facilitated
diffusivity in the model with the diffusion coefficient for dissolved CO2 (dashed line,
Figure 9.5). In essence, the model then becomes the O2 model applied to directly to
CO2. Clearly, the effect of the facilitated diffusion of CO2 is important since the gas
exchange predictions are well below the experimental results.
The model assumed equilibrium between dissolved CO2 and HCO3 formed from the
hydration of CO2. This assumption was justified by comparing the half-time of the
hydration reaction to the diffusion time of CO2 through the plasma to the fiber
membrane wall. The presence of carbonic anhydrase in the red blood cell accelerates
the hydration reaction 13000 times faster than in the plasma where the enzyme is not
present [147, 151]. The half-time for equilibration of CO2 with bicarbonate in the red cell

- 152 -
is on the order of 0.045 s [151]. The half-time for the exchange of HCO3 out of the red
cell to reach electrochemical equilibrium is 0.1 s [151]. The characteristic time of
diffusion of dissolved CO2 to the fiber membrane wall can be estimated as 2
2
~CO
BL
Dt δ
where δBL is the thickness of the boundary layer adjacent to the fiber wall. This
thickness has been estimated to be approximately 10 µm [32] resulting in a
characteristic diffusion time of 0.4 s, an order of magnitude longer than the hydration of
CO2 and the same order of magnitude as diffusion of HCO3 across the membrane wall.
Although 0.1 s is not much less than 0.4 s, the assumption of equilibrium appears to be
valid in the application of CO2 removal by hollow fiber membranes. Sufficient time is
therefore available for HCO3 to move rapidly across the cell membrane and be
converted to CO2 before diffusing to the fiber membrane where it is removed by the
sweep gas. The assumption of equilibrium between CO2 and HCO3 simplifies the model
by allowing the diffusion of CO2 and HCO3 to be incorporated into a facilitated
diffusivity.
The value of the exponent on the Reynolds number in the mass transfer correlation
varies in the literature. For example, the exponent on the Reynolds number has been
reported in the range of 0.4 - 0.6 by several investigators [19, 76, 146]. These values
are consistent with the finding of 0.42 in this study. Other investigators have reported
exponent values in the range of 0.8 – 1.0 [81, 82, 136]. The discrepancy may be
attributed to equilibration between the concentration of gas in the fibers and the
dissolved gas in the water for the oxygenators used in the latter studies. If gas
exchange rates are high enough for given water flowrate, the partial pressure of gas in

- 153 -
the fiber will equilibrate with the partial pressure of gas in the water. This phenomenon
is known as ‘flow limited’ gas exchange. In the overall gas exchange equation for
water: )( inout PPQV −= α , Pout will not change for flowrates at or below the flow limit.
Therefore, gas exchange will be directly proportional to the flowrate of water. As a
result, the exponent on the Reynolds number will approach unity (b=1):
bb QkV ~Re~~•
. The likelihood that gas exchange will be flow limited increases with
fiber bundle surface area. The oxygenators used in the latter studies had large surface
areas of 2.0 m2 or greater. The value of 0.8-0.9 for the Reynolds number exponent may
indicate that these oxygenators were operating near their flow limit and explain the
discrepancy for the value of the Reynolds number exponent.
The CO2 model presented here provides a method to predict gas exchange in blood
oxygenators from gas exchange data obtained in water. We have shown that the mass
transfer correlation determined in water collapsed onto a universal curve for O2 and
CO2, and was also valid for two fiber bundle geometries of different lengths and
thicknesses.

- 154 -
10.0 CONCLUSIONS
The goal of this project was to develop a system for removing 100-120 ml/min of CO2 at
blood flowrates of 0.75 L/min or less for the treatment of acute respiratory failure
particularly acute exacerbations of COPD. We manufactured three Generations of
PRAL devices that incorporated rotation to enhance gas exchange by increasing the
relative velocity between the fibers and the fluid. The rotation also enabled the PRAL to
pump blood. The Generation III prototype achieved a CO2 removal rate of 101 ml/min in
blood at 0.75 L/min thus meeting the target. This research has lead to the following
conclusions:
• The resistance of the fiber bundle creates uniform radial flow regardless of
the diffuser design.
• Blood is entrained in the fiber bundle during rotation leading to low relative
angular velocity.
• Rotation of the PRAL fiber bundle creates Taylor vortices between the bundle
and stationary outer housing.
• The vortices cause enhanced mixing between the fluid in the outer gap and
the fluid in the fiber bundle resulting in increased gas exchange with rotation
for all layers of the fiber bundle.
• In vitro hemolysis in the PRAL was substantially higher than a commercially
available control oxygenator.
- 155 -
• The blood contacting seals were not the main source of hemolysis in the
PRAL.
• The roughness of the fiber bundle causes increased shear stress in the outer
gap resulting in high hemolysis levels compared to a smooth cylinder.
The PRAL device is currently being commercialized by Alung Technologies, Inc. and
has been redesigned and renamed the Hemolung. The Hemolung contains a rotating
core and a stationary fiber bundle. Preclinical data has been encouraging with
comparable gas exchange to the PRAL, and hemolysis levels are comparable to a
control oxygenator.

- 156 -
APPENDIX
The following is a derivation of the convection-diffusion equations for CO2 in a blood
continuum. The flowrate of dissolved CO2 and bound CO2 (bicarbonate and CO2 bound
to hemoglobin) due to convection through a differential element, dA can be expressed
as:
ndAVCndAVC bbCOb
dCO •+• 22 (A.1)
The flowrate of dissolved (free) CO2 and CO2 stored as HCO3 due to diffusion through
dA is:
ndACDndACD HCOHCOdCOCO •∇−•∇− 3322 (A.2)
CO2 bound to hemoglobin will have low diffusion capacity due to the large size of the
hemoglobin molecule. The total flowrate of CO2 through a differential volume element
dV as dV 0 is:
( ) 32
322
222 HCOHCOdCOCO
bCO
dCOb CDCDCCV ∇+∇=∇+∇• (A.3)
The dissolved component of CO2 will obey Henry’s law and can be expressed in terms
of partial pressure and solubility (α):
22 COdCO PC α= (A.4)
Using the chain rule and rearranging gives the transport equation for CO2 in blood:
PP
CDDP
PC
V HCOHCOCO
bCO
b ∇⎟⎠⎞
⎜⎝⎛
∂∂
+•∇=∇⎟⎟⎠
⎞⎜⎜⎝
⎛∂
∂+• 33
2211
αα (A.5)

- 157 -
The right hand side of Eqn A.5 is the diffusion of dissolved CO2 and HCO3 and the left
hand side is the convection of CO2 in all forms. The term in parenthesis on the right
hand side is a facilitated diffusion coefficient:
PCD
DD HCOHCOCOf ∂
∂+= 33
2 α (A.6)
The convective-diffusion equation for CO2 can be obtained by dividing the right hand
side of Eqn A.5 by P
C bCO
∂∂
+ 211α
assuming a constant value for P
CbCO
∂∂ 2 :
PDPV effb2∇=∇• (A.7)
The convective-diffusion equation leads to the definition of the effective diffusivity:
PC
PCD
DD b
CO
HCOHCOCO
eff
∂∂
+
∂∂
+=
2
332
11α
α (A.8)
Nondimensionalizing the governing equations provides insight as to why the effective
diffusivity is used in the Schmidt number and the facilitated diffusivity is used in the
Sherwood number. LettingcP
PP =∗ , ∇=∇∗hd ,
cVVV =∗ and substituting these definitions
into Eqn A.9 leads to the dimensionless transport equation:
∗∗∗∗∗ ∇=∇• PVd
DPV
ch
eff 2 (A.9)
The dimensionless group ch
eff
VdD
is the Peclet number. The solution to the convection-
diffusion equation requires solving for the velocity in the Navier-Stokes equations.
- 158 -
Dimensional analysis on the Navier-Stokes equations for fluid motion leads to the
definition for the Reynolds number, ν
hVd=Re . The coupling of the dimensionless
Navier-Stokes equations and dimensionless convection-diffusion equations leads to a
third dimensionless parameter, the Schmidt number:
effDPeSc ν
==Re
(A.10)
The solution to the convective diffusion equation requires a boundary condition at the
surface of the fibers. The flux across the fiber wall is due to the diffusion of dissolved
CO2 and bicarbonate ions. As the dissolved CO2 is removed by the fibers, the
bicarbonate is rapidly converted to CO2 through the action of the enzyme carbonic
anhydrase. At the fiber surface, the diffusional flux is:
)( 2_22 COGCOfCO PPkPDN −=∇−= α (A.11)
By introducing the dimensionless variables defined above with 2_2 COGCOc PPP −= , the
flux equation becomes:
)()( 2_22_2 COGCOCOGCOh
f PPkPPPdD
−=−∇− ∗∗α (A.12)
After rearranging, both sides become dimensionless and the left side of the equation is
the definition of the Sherwood number, which incorporates the facilitated diffusivity.
∗∗∇=≡ PD
kdSh
f
h
α (A.13)

- 159 -
BIBLIOGRAPHY
1. Data and statistics. 2004 [cited Feb. 2005]; Available from: http://www.lungusa.org/site/pp.asp?c=dvLUK9O0E&b=33347.
2. Halbert, R.J., et al., Interpreting COPD prevalence estimates: what is the true burden of disease? Chest, 2003. 123(5): p. 1684-92.
3. Mannino, D.M., et al., Chronic obstructive pulmonary disease surveillance--United States, 1971-2000. MMWR Surveill Summ, 2002. 51(6): p. 1-16.
4. Strategies in preserving lung health and preventing COPD and associated diseases. The National Lung Health Education Program (NLHEP). Chest, 1998. 113(2 Suppl): p. 123S-163S.
5. Petty, T.L., COPD in perspective. Chest, 2002. 121(5 Suppl): p. 116S-120S.
6. Warren, P.M., et al., Respiratory failure revisited: acute exacerbations of chronic bronchitis between 1961-68 and 1970-76. Lancet, 1980. 1(8166): p. 467-70.
7. Niederman, M.S., Introduction: mechanisms and management of COPD: we can do better--it's time for a re-evaluation. Chest, 1998. 113(4 Suppl): p. 233S-234S.
8. Davidson, A.C., The pulmonary physician in critical care. 11: critical care management of respiratory failure resulting from COPD. Thorax, 2002. 57(12): p. 1079-84.
9. Hirvela, E.R., Advances in the management of acute respiratory distress syndrome: protective ventilation. Arch Surg, 2000. 135(2): p. 126-35.
10. Plant, P.K. and M.W. Elliott, Chronic obstructive pulmonary disease * 9: management of ventilatory failure in COPD. Thorax, 2003. 58(6): p. 537-42.
11. Sethi, J.M. and M.D. Siegel, Mechanical ventilation in chronic obstructive lung disease. Clin Chest Med, 2000. 21(4): p. 799-818.
12. Soto, F.J. and B. Varkey, Evidence-based approach to acute exacerbations of COPD. Curr Opin Pulm Med, 2003. 9(2): p. 117-24.
- 160 -
13. Peigang, Y. and J.J. Marini, Ventilation of patients with asthma and chronic obstructive pulmonary disease. Curr Opin Crit Care, 2002. 8(1): p. 70-6.
14. Gammon, R.B., M.S. Shin, and S.E. Buchalter, Pulmonary barotrauma in mechanical ventilation. Patterns and risk factors. Chest, 1992. 102(2): p. 568-72.
15. Amato, M.B., et al., Effect of a protective-ventilation strategy on mortality in the acute respiratory distress syndrome. N Engl J Med, 1998. 338(6): p. 347-54.
16. Kollef, M.H., Non-invasive ventilation for chronic obstructive pulmonary disease. Lancet, 2000. 356(9234): p. 956-7.
17. Heyland, D.K., et al., The attributable morbidity and mortality of ventilator-associated pneumonia in the critically ill patient. The Canadian Critical Trials Group. Am J Respir Crit Care Med, 1999. 159(4 Pt 1): p. 1249-56.
18. Ibrahim, E.H., et al., The occurrence of ventilator-associated pneumonia in a community hospital: risk factors and clinical outcomes. Chest, 2001. 120(2): p. 555-61.
19. Federspiel, W.J., T.J. Hewitt, and B.G. Hattler, Experimental evaluation of a model for oxygen exchange in a pulsating intravascular artificial lung. Ann Biomed Eng, 2000. 28(2): p. 160-7.
20. Golob, J.F., et al., Acute in vivo testing of an intravascular respiratory support catheter. Asaio J, 2001. 47(5): p. 432-7.
21. Makarewicz, A.J., L.F. Mockros, and R.W. Anderson, A dynamic intravascular artificial lung. ASAIO Journal, 1994. 40(3): p. M747-750.
22. Makarewicz, A.J., L.F. Mockros, and C. Mavroudis, New design for a pumping artificial lung. ASAIO Journal, 1996. 42(5): p. M615-619.
23. Vaslef, S.N., L.F. Mockros, and R.W. Anderson, Development of an intravascular lung assist device. ASAIO Trans, 1989. 35(3): p. 660-4.
24. Boschetti, F., et al., Blood flow pulsatility effects upon oxygen transfer in artificial lungs. Asaio J, 2003. 49(6): p. 678-86.
25. Mortensen, J.D., An intravenacaval blood gas exchange (IVCBGE) device. A preliminary report. ASAIO Transactions, 1987. 33(3): p. 570-573.
- 161 -
26. Mortensen, J.D., Intravascular oxygenator: a new alternative method for augmenting blood gas transfer in patients with acute respiratory failure. Artificial Organs, 1992. 16(1): p. 75-82.
27. Charoenkul, V., F. Giron, and E.C. Peirce, 2nd, Respiratory support with a paracorporeal membrane oxygenator. J Surg Res, 1973. 14(5): p. 393-9.
28. Lick, S.D., et al., Paracorporeal artificial lung: perioperative management for survival study in sheep. J Invest Surg, 2003. 16(3): p. 177-84.
29. Zwischenberger, J.B., et al., The paracorporeal artificial lung improves 5-day outcomes from lethal smoke/burn-induced acute respiratory distress syndrome in sheep. Ann Thorac Surg, 2002. 74(4): p. 1011-6; discussion 1017-8.
30. Zwischenberger, J.B. and R.H. Bartlett, ECMO. 1995: Extracorporeal Life Support Organization. 28.
31. Loeppky, J.A., U.C. Luft, and E.R. Fletcher, Quantitative description of whole blood CO2 dissociation curve and Haldane effect. Respir Physiol, 1983. 51(2): p. 167-81.
32. Vaslef, S. and R. Anderson, The Artificial Lung. 1 ed. Gas Exchange in the Venous System: Support for the Failing Lung. 2002, Georgetown: Landes Bioscience.
33. Zwischenberger, J.B., et al., IVOX with gradual permissive hypercapnia: a new management technique for respiratory failure. J.Surg.Res., 1994. 57(1): p. 99-105.
34. Cattaneo, G., A. Strauss, and H. Reul, Compact intra- and extracorporeal oxygenator developments. Perfusion, 2004. 19(4): p. 251-5.
35. Cattaneo, G.F. and H. Reul, New fiber configuration for intravenous gas exchange. Int J Artif Organs, 2005. 28(3): p. 244-50.
36. Cattaneo, G.F., et al., Intravascular blood oxygenation using hollow fibers in a disk-shaped configuration: experimental evaluation of the relationship between porosity and performance. Asaio J, 2006. 52(2): p. 180-5.
37. Zwischenberger, J.B., et al., Intravascular membrane oxygenation and carbon dioxide removal with IVOX: can improved design and permissive hypercapnia
- 162 -
achieve adequate respiratory support during severe respiratory failure? Artif Organs, 1994. 18(11): p. 833-9.
38. Zwischenberger, J.B., W. Tao, and A. Bidani, Intravascular membrane oxygenator and carbon dioxide removal devices: a review of performance and improvements. Asaio J, 1999. 45(1): p. 41-6.
39. Gattinoni, L., et al., Hemodynamics and renal function during low frequency positive pressure ventilation with extracorporeal CO2 removal. A comparison with continuous positive pressure ventilation. Intensive Care Med, 1980. 6(3): p. 155-61.
40. Gattinoni, L., et al., Treatment of acute respiratory failure with low-frequency positive-pressure ventilation and extracorporeal removal of CO2. Lancet, 1980. 2(8189): p. 292-4.
41. Gattinoni, L., G. Iapichino, and T. Kolobow, Hemodynamic, mechanical and renal effects during "apneic oxygenation" with extracorporeal carbon dioxide removal, at different levels of intrapulmonary pressure in lambs. Int J Artif Organs, 1979. 2(5): p. 249-53.
42. Gattinoni, L., et al., Clinical application of low frequency positive pressure ventilation with extracorporeal CO2 removal (LFPPV-ECCO2R) in treatment of adult respiratory distress syndrome (ARDS). Int J Artif Organs, 1979. 2(6): p. 282-3.
43. Gattinoni, L., et al., Low-frequency positive pressure ventilation with extracorporeal carbon dioxide removal (LFPPV-ECCO2R): an experimental study. Anesth Analg, 1978. 57(4): p. 470-7.
44. Gattinoni, L., et al., Control of intermittent positive pressure breathing (IPPB) by extracorporeal removal of carbon dioxide. Br J Anaesth, 1978. 50(8): p. 753-8.
45. Kolobow, T., et al., Control of breathing using an extracorporeal membrane lung. Anesthesiology, 1977. 46(2): p. 138-41.
46. Kolobow, T., et al., A new approach to the prevention and treatment of acute pulmonary insufficiency. Int J Artif Organs, 1980. 3(2): p. 86-93.
47. Kolobow, T., et al., The prevention of hyaline membrane disease (HMD) in the preterm fetal lamb through the static inflation of the lungs: the conditioning of the fetal lungs. Trans Am Soc Artif Intern Organs, 1980. 26: p. 567-72.
- 163 -
48. Pesenti, A., et al., Low frequency positive pressure ventilation with extracorporeal CO2 removal (LEPPV-ECCO2R) in acute respiratory failure (ARF): technique. Trans Am Soc Artif Intern Organs, 1981. 27: p. 263-6.
49. Wang, D., et al., Toward ambulatory arteriovenous CO2 removal: initial studies and prototype development. Asaio J, 2003. 49(5): p. 564-7.
50. Zwischenberger, J.B., et al., Percutaneous extracorporeal arteriovenous CO2 removal for severe respiratory failure. The Annals of Thoracic Surgery, 1999. 68(1): p. 181-187.
51. Conrad, S.A., et al., Total extracorporeal arteriovenous carbon dioxide removal in acute respiratory failure: a phase I clinical study. Intensive Care Medicine, 2001. 27(8): p. 1340-51.
52. Jegger, D., et al., Ex vivo evaluation of a new extracorporeal lung assist device: NovaLung membrane oxygenator. Int J Artif Organs, 2005. 28(10): p. 985-99.
53. Zhou, X., et al., Seventy-two hour gas exchange performance and hemodynamic properties of NOVALUNG iLA as a gas exchanger for arteriovenous carbon dioxide removal. Perfusion, 2005. 20(6): p. 303-8.
54. Roberts, N., et al., Venovenous extracorporeal membrane oxygenation for respiratory failure in inotrope dependent neonates. Asaio J, 2003. 49(5): p. 568-71.
55. Zwischenberger, J.B., et al., Complications of neonatal extracorporeal membrane oxygenation. Collective experience from the Extracorporeal Life Support Organization. J Thorac Cardiovasc Surg, 1994. 107(3): p. 838-48; discussion 848-9.
56. Niimi, Y., et al., The effects of heparin coating of oxygenator fibers on platelet adhesion and protein adsorption. Anesth Analg, 1999. 89(3): p. 573-9.
57. Niimi, Y., et al., Platelet adhesion to heparin coated oxygenator fibers under in vitro static conditions: impact of temperature. Asaio J, 2001. 47(4): p. 361-4.
58. Niimi, Y., et al., Protein adsorption and platelet adhesion on the surface of an oxygenator membrane. Asaio J, 1997. 43(5): p. M706-10.
59. Takami, Y., et al., Evaluation of platelet adhesion and activation on materials for an implantable centrifugal blood pump. Artif Organs, 1998. 22(9): p. 753-8.
- 164 -
60. Federspiel, W.J., et al., Ex vivo testing of the intravenous membrane oxygenator. Asaio J, 2000. 46(3): p. 261-7.
61. Hattler, B.G., et al., Development of an intravenous membrane oxygenator: A new concept in mechanical support of the failing lung. The Journal of Heart and Lung Transplantation, 1994. 13: p. 1003-1008.
62. Hattler, B.G., et al., Development of an intravenous membrane oxygenator (IMO): Enhanced intravenous gas exchange through convective mixing of blood around hollow fiber membranes. Artificial Organs, 1994. 18(11): p. 806-812.
63. Svitek, R.G., B.J. Frankowski, and W.J. Federspiel, Evaluation of a pumping assist lung that uses a rotating fiber bundle. Asaio J, 2005. 51(6): p. 773-80.
64. Gaylor, J.D., et al., Gas transfer and thrombogenesis in an annular membrane oxygenator with active blood mixing. Trans Am Soc Artif Intern Organs, 1973. 19: p. 516-24.
65. Hill, J.D., et al., Technique for achieving high gas exchange rates in membrane oxygenation. Trans Am Soc Artif Intern Organs, 1974. 20A: p. 249-52.
66. Lewis, F.R., J.A. Tylke, and H.S. Winchell, A combined membrane pump-oxygenator: design and testing. Trans Am Soc Artif Intern Organs, 1974. 20A: p. 253-60.
67. Astolfi, D. and I. Christlieb, [Artificial heart-lung: method of its preparation and assembling. I. Disk oxygenator (Kay-Cross) machines]. Cir Ginecol Urol, 1965. 19(3): p. 218-24.
68. Dietmann, K., et al., [Construction principles and mechanism of action of a rotating disk oxygenator.]. Thoraxchirurgie, 1962. 9: p. 516-29.
69. Gille, J.P., et al., [Extracorporeal purification of carbon dioxide: efficiency of a disk oxygenator during experimental hypercapnia]. Pathol Biol (Paris), 1969. 17(7): p. 371-7.
70. Makarewicz, A.J., L.F. Mockros, and R.W. Anderson, A pumping artificial lung. Asaio J, 1994. 40(3): p. M518-21.
71. Maloney, J., Mass and Thermal Transfer Means for Use in Heart Lung Machines, dialyzers, and Other Applications. USPTO, 1999.

- 165 -
72. Wu, Z.J., et al., Progress toward an ambulatory pump-lung. J Thorac Cardiovasc Surg, 2005. 130(4): p. 973-8.
73. Baldwin, J.T., et al., The National Heart, Lung, and Blood Institute Pediatric Circulatory Support Program. Circulation, 2006. 113(1): p. 147-55.
74. Mueller, X.M., et al., A new concept of integrated cardiopulmonary bypass circuit. Eur J Cardiothorac Surg, 2002. 21(5): p. 840-6.
75. Cardiovascular implants and artificial organs - Blood-gas exchangers oxygenators, in AAMI standards and recommended practices: Biomedical equipment, Part 1: General safety and design; Equipment for therapy and surgery. 1996, American National Standards Institute, Inc. p. 633-648.
76. Hewitt, T.J., B.G. Hattler, and W.J. Federspiel, A mathematical model of gas exchange in an intravenous membrane oxygenator. Ann Biomed Eng, 1998. 26(1): p. 166-78.
77. Perry, R., Perry's Chemical Engineers' Handbook 7th Ed. 1997.
78. OriGen biomedical dual lumen catheters. 2002 [cited Feb. 2005]; Available from: http://www.origenbio.com/cath.html.
79. Young, D.F., B.R. Munson, and T.H. Okiishi, A Brief Introduction to Fluid Mechanics. 1st ed. 1997, New York: John Wiley & Sons Inc.
80. Bird, R.B., W.E. Stewart, and E.N. Lightfoot, Transport phenomena. 2nd ed. 2002, New York: J. Wiley. xii, 895.
81. Vaslef, S.N., et al., Use of a mathematical model to predict oxygen transfer rates in hollow fiber membrane oxygenators. Asaio J, 1994. 40(4): p. 990-6.
82. Vaslef, S.N., et al., Computer-assisted design of an implantable, intrathoracic artificial lung. Artif Organs, 1994. 18(11): p. 813-7.
83. Eash, H.J., et al., Evaluation of local gas exchange in a pulsating respiratory support catheter. Asaio J, 2005. 51(2): p. 152-7.
84. Budilarto, S.G., et al., Flow visualization study of a pulsating respiratory assist catheter. Asaio J, 2005. 51(6): p. 673-80.
85. Lueptow, R.M. and A. Hajiloo, Flow in a rotating membrane plasma separator. Asaio J, 1995. 41(2): p. 182-8.

- 166 -
86. Mizuguchi, K., et al., Does hematocrit affect in vitro hemolysis test results? Preliminary study with Baylor/NASA prototype axial flow pump. Artif Organs, 1994. 18(9): p. 650-6.
87. Naito, K., K. Mizuguchi, and Y. Nose, The need for standardizing the index of hemolysis. Artif Organs, 1994. 18(1): p. 7-10.
88. Araki, K., et al., Hemolysis and heat generation in six different types of centrifugal blood pumps. Artif Organs, 1995. 19(9): p. 928-32.
89. Araki, K., et al., Heat generation and hemolysis at the shaft seal in centrifugal blood pumps. Asaio J, 1995. 41(3): p. M284-7.
90. Anai, H., et al., An approach to reducing hemolysis in an axial-flow blood pump. Asaio J, 1995. 41(3): p. M771-4.
91. Wakisaka, Y., et al., A two stage axial flow pump. New approach to reduction of hemolysis. Asaio J, 1995. 41(3): p. M584-7.
92. Apel, J., et al., Assessment of hemolysis related quantities in a microaxial blood pump by computational fluid dynamics. Artif Organs, 2001. 25(5): p. 341-7.
93. Arora, D., M. Behr, and M. Pasquali, A tensor-based measure for estimating blood damage. Artif Organs, 2004. 28(11): p. 1002-15.
94. Arvand, A., M. Hormes, and H. Reul, A validated computational fluid dynamics model to estimate hemolysis in a rotary blood pump. Artif Organs, 2005. 29(7): p. 531-40.
95. Burgreen, G.W., et al., Computational fluid dynamics analysis of a maglev centrifugal left ventricular assist device. Artif Organs, 2004. 28(10): p. 874-80.
96. Li, H. and W.K. Chan, Inverse design and CFD investigation of blood pump impeller. Crit Rev Biomed Eng, 2000. 28(1-2): p. 75-80.
97. Mitoh, A., et al., Computational fluid dynamics analysis of an intra-cardiac axial flow pump. Artif Organs, 2003. 27(1): p. 34-40.
98. Miyazoe, Y., et al., Computational fluid dynamics analysis to establish the design process of a centrifugal blood pump: second report. Artif Organs, 1999. 23(8): p. 762-8.

- 167 -
99. Song, X., et al., Design and transient computational fluid dynamics study of a continuous axial flow ventricular assist device. Asaio J, 2004. 50(3): p. 215-24.
100. Song, X., et al., Studies of turbulence models in a computational fluid dynamics model of a blood pump. Artif Organs, 2003. 27(10): p. 935-7.
101. Song, X., H.G. Wood, and D. Olsen, Computational Fluid Dynamics (CFD) study of the 4th generation prototype of a continuous flow Ventricular Assist Device (VAD). J Biomech Eng, 2004. 126(2): p. 180-7.
102. Throckmorton, A.L., et al., Computational design and experimental performance testing of an axial-flow pediatric ventricular assist device. Asaio J, 2005. 51(5): p. 629-35.
103. Untaroiu, A., et al., Numerical and experimental analysis of an axial flow left ventricular assist device: the influence of the diffuser on overall pump performance. Artif Organs, 2005. 29(7): p. 581-91.
104. Untaroiu, A., et al., Computational design and experimental testing of a novel axial flow LVAD. Asaio J, 2005. 51(6): p. 702-10.
105. Watanabe, N., et al., Simulation of the BP-80 blood pump. Artif Organs, 2001. 25(9): p. 733-9.
106. Yamane, T., et al., Flow visualization in a centrifugal blood pump with an eccentric inlet port. Artif Organs, 2004. 28(6): p. 564-70.
107. Yano, T., et al., An estimation method of hemolysis within an axial flow blood pump by computational fluid dynamics analysis. Artif Organs, 2003. 27(10): p. 920-5.
108. Tsukiya, T., et al., Performance of a newly developed implantable centrifugal blood pump. Asaio J, 2001. 47(5): p. 559-62.
109. Sekine, K., et al., Development of a magnetic fluid shaft seal for an axial-flow blood pump. Artif Organs, 2003. 27(10): p. 892-6.
110. Lemos, P.A., et al., Usefulness of percutaneous left ventricular assistance to support high-risk percutaneous coronary interventions. Am J Cardiol, 2003. 91(4): p. 479-81.
111. Vranckx, P., et al., Clinical introduction of the Tandemheart, a percutaneous left ventricular assist device, for circulatory support during high-risk

- 168 -
percutaneous coronary intervention. Int J Cardiovasc Intervent, 2003. 5(1): p. 35-9.
112. Nakazawa, T., et al., Development and initial testing of a permanently implantable centrifugal pump. Artif Organs, 1997. 21(7): p. 597-601.
113. Nakazawa, T., et al., Hydraulic assessment of the floating impeller phenomena in a centrifugal pump. Artif Organs, 1997. 21(1): p. 78-82.
114. Aragon, J., et al., Percutaneous left ventricular assist device: "TandemHeart" for high-risk coronary intervention. Catheter Cardiovasc Interv, 2005. 65(3): p. 346-52.
115. Giombolini, C., et al., Percutaneous left ventricular assist device, TandemHeart, for high-risk percutaneous coronary revascularization. A single centre experience. Acute Card Care, 2006. 8(1): p. 35-40.
116. Pitsis, A.A., et al., Temporary assist device for postcardiotomy cardiac failure. Ann Thorac Surg, 2004. 77(4): p. 1431-3.
117. Maruyama, O., et al., Hemolysis caused by surface roughness under shear flow. J Artif Organs, 2005. 8(4): p. 228-36.
118. Takami, Y., et al., Effect of surface roughness on hemolysis in a pivot bearing supported Gyro centrifugal pump (C1E3). Artif Organs, 1996. 20(11): p. 1155-61.
119. Takami, Y., et al., Effect of surface roughness on hemolysis in a centrifugal blood pump. Asaio J, 1996. 42(5): p. M858-62.
120. Takami, Y., et al., Hemolytic effects of surface roughness of a pump housing in a centrifugal blood pump. Artif Organs, 1997. 21(5): p. 428-32.
121. Takami, Y., et al., Hemolytic effect of surface roughness of an impeller in a centrifugal blood pump. Artif Organs, 1997. 21(7): p. 686-90.
122. van den Berg, T.H., Smooth and rough boundaries in turbulent Taylor Couette flow. Physical Review E, 2003. 68: p. 1-5.
123. Van Dyke, M., An Album of Fluid Motion. 1982: The Parabolic Press. 176.

- 169 -
124. Lund, L.W., B.G. Hattler, and W.J. Federspiel, A comparative in vitro hemolysis study of a pulsating intravenous artificial lung. Asaio J, 2002. 48(6): p. 631-5.
125. Tamari, Y., et al., The effects of pressure and flow on hemolysis caused by Bio-Medicus centrifugal pumps and roller pumps. Guidelines for choosing a blood pump. J Thorac Cardiovasc Surg, 1993. 106(6): p. 997-1007.
126. Leverett, L.B., et al., Red blood cell damage by shear stress. Biophys J, 1972. 12(3): p. 257-73.
127. Sandza, J.G., Jr., et al., Subhemolytic trauma of erythrocytes: recognition and sequestration by the spleen as a function of shear. Trans Am Soc Artif Intern Organs, 1974. 20 B: p. 457-62.
128. Sutera, S.P., P.A. Croce, and M. Mehrjardi, Hemolysis and subhemolytic alterations of human RBC induced by turbulent shear flow. Trans Am Soc Artif Intern Organs, 1972. 18(0): p. 335-41, 347.
129. Sutera, S.P. and M.H. Mehrjardi, Deformation and fragmentation of human red blood cells in turbulent shear flow. Biophys J, 1975. 15(1): p. 1-10.
130. Paul, R., et al., Shear stress related blood damage in laminar couette flow. Artif Organs, 2003. 27(6): p. 517-29.
131. Wereley, S. and R.M. Lueptow, Velocity field for Taylor-Couette flow with an axial flow. Physics of Fluids, 1999. 11(12): p. 3637-3649.
132. Lathrop, D.P., J. Fineberg, and H.L. Swinney, Transition to Shear-Driven Turbulence in Couette-Taylor Flow. Physical Review A, 1992. 46(10): p. 6390-6405.
133. Smith, G.P. and A.A. Townsend, Turbulent Couette flow between concentric cylinders at large Taylor numbers. J. Fluid Mech., 1982. 123: p. 187-217.
134. Koeltzsch, K., et al., Drag reduction using surfactants in a rotating cylinder geometry. Experiments in Fluids, 2003. 34(4): p. 515-530.
135. Federspiel, W., et al., Temporary support of the lungs: The artificial lung, in The transplantation and replacement of thoracic organs, D.K.C. Cooper, L.W. Miller, and G.A. Patterson, Editors. 1996, Kluwer Academic Publishers: Boston. p. 717-728.

- 170 -
136. Mockros, L.F. and R. Leonard, Compact cross-flow tubular oxygenators. Trans Am Soc Artif Intern Organs, 1985. 31: p. 628-33.
137. Wickramasinghe, S.R., et al., Designing blood oxygenators. Ann N Y Acad Sci, 2003. 984: p. 502-14.
138. Dierickx, P.W., D. De Wachter, and P.R. Verdonck, Blood flow around hollow fibers. Int J Artif Organs, 2000. 23(9): p. 610-7.
139. Gage, K.L., et al., Predicting membrane oxygenator pressure drop using computational fluid dynamics. Artif Organs, 2002. 26(7): p. 600-7.
140. Gartner, M.J., et al., Modeling flow effects on thrombotic deposition in a membrane oxygenator. Artif Organs, 2000. 24(1): p. 29-36.
141. Funakubo, A., et al., Flow vectorial analysis in an artificial implantable lung. Asaio J, 2003. 49(4): p. 383-7.
142. Yasuda, T., et al., An investigation of blood flow behavior and hemolysis in artificial organs. Asaio J, 2000. 46(5): p. 527-31.
143. Kays, W.M. and M.E. Crawford, Convective heat and mass transfer. 3rd ed. McGraw-Hill series in mechanical engineering. 1993, New York: McGraw-Hill. xxxii, 601 p.
144. Guyton, A.C., Basic human physiology: normal function and mechanisms of disease. 2d ed. 1977, Philadelphia: Saunders. xi, 931 p.
145. Spaeth, E.E., Blood oxygenation in extracorporeal devices: theoretical considerations. CRC Crit Rev Bioeng, 1973. 1(4): p. 383-417.
146. Wickramasinghe, S.R., M.J. Semmens, and E.L. Cussler, Mass transfer in various hollow fiber geometries. Journal of Membrane Science, 1992. 69(3): p. 235.
147. Forster, R.E., Diffusion of gases in the lungs. Physiologist, 1966. 9(2): p. 110-22.
148. Forster, R.E., et al., Reaction of CO2 with human hemoglobin solution. J Biol Chem, 1968. 243(12): p. 3317-26.
149. Holland, R.A. and R.E. Forster, 2nd, Effect of temperature on rate of CO2 uptake by human red cell suspensions. Am J Physiol, 1975. 228(5): p. 1589-96.

- 171 -
150. MatLab, Version 6.2. The MathWorks, 2003.
151. Forster, R.E. and E.D. Crandall, Time course of exchanges between red cells and extracellular fluid during CO2 uptake. J Appl Physiol, 1975. 38(4): p. 710-8.