
Developing approaches for establishing a fisheries ... approaches for establishing a fisheries...
26
Developing approaches for establishing a fisheries baseline: case-study for Xe Bangfai basin (Lao PDR) Développement d’approches pour l’établissement d’une référence des pêches : le cas d’étude de la Xe Bangfai (Laos) T.A.M. Visser (1) , M. Ovenden (1) , N. Wongwai (1) (1) Nam Theun 2 Power Company, Environmental and Social Division, PO Box 5862, Vientiane, Lao PDR 188 group 13, T-Intakin A-Maetang, Chiang Mai 50150, Thailand [email protected] Abstract – The approach of Fish Catch Monitoring of the Nam Theun 2 hydro power project area is documented and describes the fish catch monitoring methodologies implemented for the period from 2006-2014 with special emphasis on changes in the methods and how data collection has evolved in the Xe Bangfai basin.The collected data aimed at documenting changes in the fisheries (e.g. habitat use, daily household catch, gear use and effort) before and after commencement of electricity generation. The methods used rely on social research methods, i.e. recall surveys and household catch logbooks that are provided and maintained by fishermen. The panel survey has demonstrated is appropriateness to monitor and document changes in the fisheries over time with a high level of confidence at relatively low cost. The households participating in the panel remained relatively stable throughout the survey period. The method tends to overestimate fish catches and under estimate the collection of other aquatic animals. The level of effort (fishing days) is consistent between different surveys. The monitoring results provide a good understanding of trends and changes in the fisheries. Key words – fisheries, monitoring, river, logbook, evaluation Résumé – L’approche du suivi des pêches au sein du projet hydro-électrique Nam Theun 2 (Laos) est documentée et décrit les méthodes de suivi des pêches mises en place pour la période de 2006-2014 en mettant l’accent sur le changement des méthodes et la façon dont la collecte des données a évolué dans le bassin de la Xe Bangfai. Les données récoltées visaient à documenter les changements observés au niveau des pêches (par exemple l’uti- lisation de l’habitat, prises quotidiennes des foyers, moyens et effort de pêche) avant et après le début de la production d’électricité. Les méthodes utilisées s’appuient sur des méthodes de recherche sociale, à savoir les enquêtes faisant appel à la mémoire et les registres quo- tidiens des prises des foyers qui sont fournis et entretenus par les pêcheurs. Cette enquête par panel a démontré sa pertinence pour suivre et documenter les changements observés au niveau de pêches au fil du temps, ceci avec un niveau de confiance élevé et à un coût rela- tivement faible. Les foyers participants à ce panel sont restés relativement stables sur la Hydroécol. Appl. © EDF, 2014 DOI: 10.1051/hydro/2014007 http://www.hydroecologie.org Article publié par EDP Sciences
-
Upload
duongthien -
Category
Documents
-
view
217 -
download
2
Transcript of Developing approaches for establishing a fisheries ... approaches for establishing a fisheries...
Hydroécol. Appl.© EDF, 2014DOI: 10.1051/hydro/2014007
http://www.hydroecologie.org
Developing approaches for establishing a fisheriesbaseline: case-study for Xe Bangfai basin (Lao PDR)
Développement d’approches pour l’établissement d’uneréférence des pêches : le cas d’étude de la Xe Bangfai (Laos)
T.A.M. Visser(1), M. Ovenden(1), N. Wongwai(1)
(1) Nam Theun 2 Power Company, Environmental and Social Division, PO Box 5862, Vientiane, Lao PDR188 group 13, T-Intakin A-Maetang, Chiang Mai 50150, [email protected]
Abstract – The approach of Fish Catch Monitoring of the Nam Theun 2 hydro power projectarea is documented and describes the fish catch monitoring methodologies implemented forthe period from 2006-2014 with special emphasis on changes in the methods and how datacollection has evolved in the Xe Bangfai basin.The collected data aimed at documentingchanges in the fisheries (e.g. habitat use, daily household catch, gear use and effort) beforeand after commencement of electricity generation. The methods used rely on socialresearch methods, i.e. recall surveys and household catch logbooks that are provided andmaintained by fishermen. The panel survey has demonstrated is appropriateness to monitorand document changes in the fisheries over time with a high level of confidence at relativelylow cost. The households participating in the panel remained relatively stable throughoutthe survey period. The method tends to overestimate fish catches and under estimate thecollection of other aquatic animals. The level of effort (fishing days) is consistent betweendifferent surveys. The monitoring results provide a good understanding of trends andchanges in the fisheries.
Key words – fisheries, monitoring, river, logbook, evaluation
Résumé – L’approche du suivi des pêches au sein du projet hydro-électrique Nam Theun 2(Laos) est documentée et décrit les méthodes de suivi des pêches mises en place pour lapériode de 2006-2014 en mettant l’accent sur le changement des méthodes et la façon dontla collecte des données a évolué dans le bassin de la Xe Bangfai. Les données récoltéesvisaient à documenter les changements observés au niveau des pêches (par exemple l’uti-lisation de l’habitat, prises quotidiennes des foyers, moyens et effort de pêche) avant et aprèsle début de la production d’électricité. Les méthodes utilisées s’appuient sur des méthodesde recherche sociale, à savoir les enquêtes faisant appel à la mémoire et les registres quo-tidiens des prises des foyers qui sont fournis et entretenus par les pêcheurs. Cette enquêtepar panel a démontré sa pertinence pour suivre et documenter les changements observésau niveau de pêches au fil du temps, ceci avec un niveau de confiance élevé et à un coût rela-tivement faible. Les foyers participants à ce panel sont restés relativement stables sur la
Article publié par EDP Sciences
2 T.A.M. Visser et al.
durée de l’enquête. Les méthodes ont tendance à surestimer les prises de poissons et àsous-estimer les prises des autres animaux aquatiques. Le niveau d’effort fourni (en joursde pêche) est cohérent entre les différentes enquêtes. Les résultats du suivi fournissent unebonne compréhension des tendances et changements des pêches.
Mots-clés – pêches, suivi, rivière, registre, évaluation
1 INTRODUCTION
Fisheries are a major activity formany people living in inland andcoastal areas and are considered to bethe major source of protein for ruralpopulations. Information on actual lev-els of consumption and catch arescant, but research data suggest thatfor example the inland capture fisher-ies in the Mekong basin may produceover 3 Million tons (Mt) per annum(Hortle & Bush, 2003). The officialcatch estimates, where available, donot even come close to this amountand may underestimate the actual fishproduction with a factor of 2 to 3 times.
Inland fisheries are not a homoge-nous collection of fisheries, as there aremany different levels of operation,down from collection by hand by familymembers to almost industrial sizedoperations (e.g. Dai fisheries in theTonle Sap, Cambodia). Although a fewlocalized commercial fisheries of mid-dle to large scale can be observed,most of the operations are small oneman/household sized operations (oftenfamily business or small enterprises)that are scattered in space and time,using a wide array of gears and habitatsfor catching a wide variety of species.
The fishing activities often have alarge subsistence component, withmany fishers active only for part of theyear. Even for commercial fishermen,fishing is often only one of the livelihood
activities. Since most fishing activitiestend to occur early in the morning, evena full-time (professional) fishermenmay be back home before 10 in themorning, with earnings from that day’scatch. This leaves enough time forother activities and indeed it is rare forfishing to be the only source of income.However, for most households, fishingis a subsistence activity and a source ofincidental income when more is caughtthan the household needs for con-sumption.
Reservoir, river and floodplain fish-eries are all characterised by fixed fish-ing grounds, seasonal differences incatches (Fig. 1) and species composi-tion, with both formal and informal land-ing sites and fish trade systems. Fish-eries have a close relationship withtheir environment and are therefore theprime focus of recent participatorymanagement approaches.
Due to the inherent dynamics ofinland waters, the heavy dependenceon floodplains in river fisheries, eitherdirectly (floodplain fisheries) or indi-rectly (much of the catches, i.e. biolog-ical production, in rivers and reservoirsis actually produced on the flood-plains), there may be huge fluctuationsin production from one year to another,that are largely unrelated to the fishingpressure. It has been widely acknowl-edged that floodplains are the enginethat drives riverine fisheries (floodpulse concept; Junk et al., 1989), and

Developing approaches for establishing a fisheries baseline: case-study for Xe Bangfai basin (Lao PDR) 3
this is well documented (Welcomme,1975; Hoggarth et al., 1999; de Graafet al., 2001). There is a strong correla-tion between the level, extent and dura-tion of flooding events and the fishcatches in that and subsequent years.Fisheries in rivers are floodplain driven,because this is where many of the juve-nile fish spend the early stages of theirlives and this is most productive interms of fisheries.
Complex relationships betweenhabitats, fish and flooding create a farmore complex and dynamic fisheriessystem in inland areas than in marinecoastal fisheries or lakes and reser-voirs. Participation, gear use andcatches fluctuate between seasons andyears, as well as in response to eco-nomic factors. As a consequence,inland fisheries are more difficult tomonitor than coastal fisheries and carehas to be taken not to simply transposemarine methodologies and concepts to
Fig. 1. Generalised catch graph for a Mekong tribut
Fig. 1. Graphique généralisé des prises pour un aff
inland fisheries. When reviewingmanuals and guidelines for the collec-tion of fishery statistics (Reyntjes, 1997;Stamatopoulos, 2002), these tend tofocus almost exclusively on sample sur-veys for catch and effort at landing sitesor on fishing surveys using experimen-tal fishing (Kolding, 1989). This relies ondirect measurement of fishery parame-ters (catch and effort) by data collectors.These are both valid approaches whenthe fisheries is mainly commercial innature, with central landing sites thatcan be sampled to provide representa-tive information on the fisheries or incases when the fisheries is largely uni-form in time. However for inland fisher-ies, especially riverine fisheries, mosttrade is informal with the fisheries typi-fied by a large subsistence componentand an important seasonality in thefisheries that causes large shifts ineffort and fishing locations. This makesit difficult to assess the fisheries and
ary with floodplain.
luent du Mékong avec sa plaine d’inondation.
4 T.A.M. Visser et al.
changes in operations with direct sam-pling methods that would only covercommercial operations, while experi-mental fishing may only reveal the catchpotential, not what truly is happening inthe fisheries.
The main focus for fisheries moni-toring for Nam Theun 2 Power Com-pany (NTPC) based on ConcessionAgreement (CA) requirements is toassess natural change and trends inthe fisheries, between seasons andyears and evaluate impact from NT2operations on the fisheries after Com-mercial Operations Date (COD) untilmid-2015.
This requires that all aspects of thefisheries need to be covered, bothcommercial and subsistence compo-nents. Using the standard approachesof either direct measurement or exper-imental fishing, chances are that sub-sistence fishing would be underrepre-sented, lessening the utility of the data.The choice then is between a numberof alternative approaches that focus onassessing fisheries parameters directly(catch/effort assessment) or indirectly(consumption studies). Because theCA specifies fisheries monitoring thatincludes a focus on key fishing param-eters and levels of impact on catchesand dependency after COD, consump-tion studies would not provide sufficientdetail. Although food consumptionstudies have been conducted this hasbeen done to monitor nutrition andhealth trends and the data is not suita-ble for catch assessment.
Establishing a fishery baselineneeds to cover a number of years inorder to capture the variation betweenyears and to establish any long-termtrends in the fisheries. Comparing the
multi-year baseline fishery indicatorswith the situation after the COD willallow assessing impact by NT2 opera-tions, but only after multiple years ofpost-COD monitoring.
Widely implemented alternatives todirect measurement of catch and effortmainly rely on interview and logbookbased methods, where households arethe source of information on the fisher-ies and catches. Various participatorydata collection systems exist and arewell documented (FAO, 1999; Visser,2003). Compared with direct measure-ment methods, these participatorymonitoring approaches allow capturinginformation on both subsistence andcommercial fishing operations, therebyincreasing the representativeness ofthe data collected. The main drawbackis that the data become less preciseand that it depends heavily on the will-ingness and ability of participants toaccurately recall the amounts caughteither for recording in a daily logbook,or when interviewed afterwards.
This paper attempts to show howcommunity science (social researchmethods) can be used as a valid tool forobtaining information on indicators andtrends in inland fisheries. For that, thestudy will focus on the fish catch moni-toring methodologies implemented forthe period from 2006-2014 with specialemphasis on changes in the methodsand how data collection has evolved. Nodata beyond 2009 will be shown as thecorrect interpretation of the data afterCOD requires the full data set to beavailable and this is expected to be cov-ered in a later article, however a fewexamples of data obtained from the sur-veys will be included for the baselineperiod prior to 2010.
Developing approaches for establishing a fisheries baseline: case-study for Xe Bangfai basin (Lao PDR) 5
2 FISH CATCH MONITORINGMETHODS
2.1 Study site
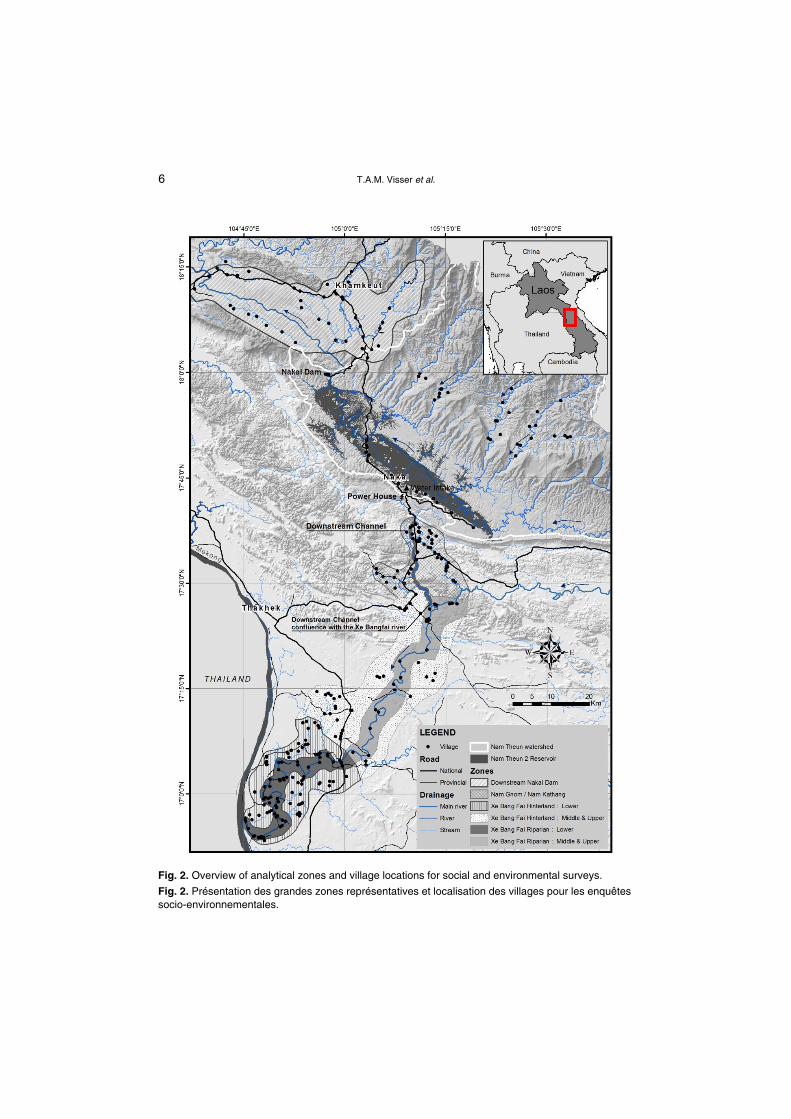
The Nam Theun 2 hydro-powerproject is situated in Khammouaneprovince, Lao PDR (Fig. 2). NTPC isthe company formed by the Lao Gov-ernment and the private shareholdersin the Nam Theun 2 HydroelectricProject to build and operate the Projectfor the first 25 years of its operation.The impoundment of the Nam Theun 2Reservoir, on the Nakai Plateau, willlead to the creation of a 489 km² reser-voir at its full supply level. The maincharacteristic of this project is to divertwater from the Nam Theun basin (fromNam Theun 2 Reservoir) to the XeBangfai basin southwards through theNT2 Downstream Channel that emp-ties into the Xe Bangfai River, aMekong tributary. All the main featuresof this project are detailed in Desclouxet al. (same issue). Among the differentdivisions of the NTPC, the Environmen-tal and Social Division (E&S) imple-ments comprehensive programs onresettlement and livelihood assist-ance, public health support and envi-ronmental and biodiversity monitoringand mitigation programs. The activi-ties implemented by E&S are based onthe requirements included in a CAbetween NTPC and the Lao Govern-ment. The CA specifically calls for afisheries monitoring program to estab-lish pre-project fishery resourcesbaseline of 5 years in portions of thedownstream area affected by the oper-ation of the NT2 project. The monitoringprogram is required to continue usingthe same fish monitoring instruments
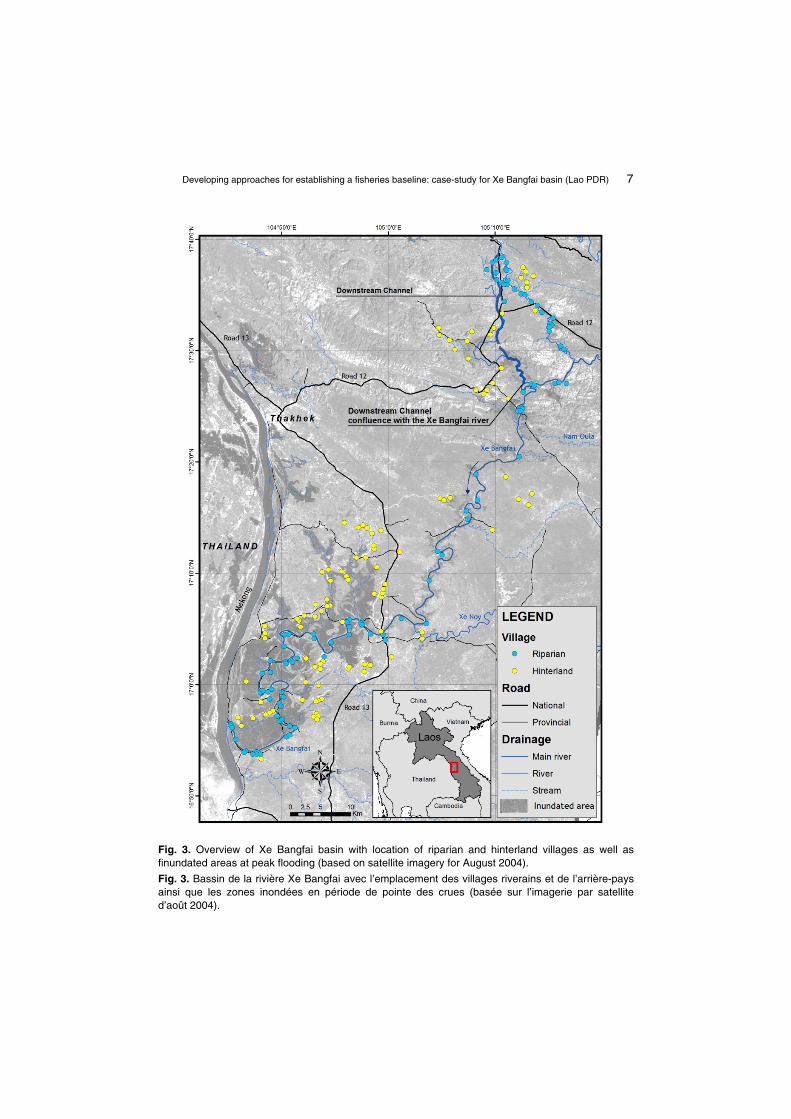
and sampling design, during 5 yearsafter COD (in April 2010), to assesschanges in the fisheries related to thetrans-basin release of water from theNam Theun basin into the Xe BangfaiRiver. Indeed, the lower reaches of theXe Bangfai basin are characterised byfloodplains, while the upper reachesfeature the Xe Bangfai River in a nar-row gorge with occasional floodplainareas around the mouths of tributaries.Natural mainstream flow is low duringthe dry season, with extensive floodingof the floodplains in the Lower portion ofthe Xe Bangfai during the rainy season(Fig. 3). After COD water released bythe project will increase dry season flowabove typical average dry season val-ues. Flow during the rainy season isexpected to be undistinguishable fromthat during pre-COD years.
Furthermore, the region is known tohost a large number of fish species.Kottelat (2001) identified more than481 species for the whole of Lao PDR,with estimates for the Xe Bangfai basinranging from 130 (Phonvixay, 2013) to157 including 38 migratory species (Zivet al., 2012).
The Fish Catch Monitoring surveys(FCM) cover three distinct areas(Fig. 2) which are (i) the Nakai water-shed area, (ii) the downstream of theNakai Dam (Khamkeut District); and(iii) the area downstream of PowerHouse in the Xe Bangfai watershed.The current article focuses on thedownstream area of the Xe BangfaiRiver (Xe Bangfai). As Figure 2 shows,this area is divided in 5 distinct areas.The Nam Gnom/ Nam Kathang area isomitted for this article. The fisherieshere are monitored, but this was mainlydone to assess impact by construction
6 T.A.M. Visser et al.
Fig. 2. Overview of analytical zones and village locations for social and environmental surveys.
Fig. 2. Présentation des grandes zones représentatives et localisation des villages pour les enquêtessocio-environnementales.
Developing approaches for establishing a fisheries baseline: case-study for Xe Bangfai basin (Lao PDR) 7
Fig. 3. Overview of Xe Bangfai basin with location of riparian and hinterland villages as well asfinundated areas at peak flooding (based on satellite imagery for August 2004).
Fig. 3. Bassin de la rivière Xe Bangfai avec l’emplacement des villages riverains et de l’arrière-paysainsi que les zones inondées en période de pointe des crues (basée sur l’imagerie par satellited’août 2004).
8 T.A.M. Visser et al.
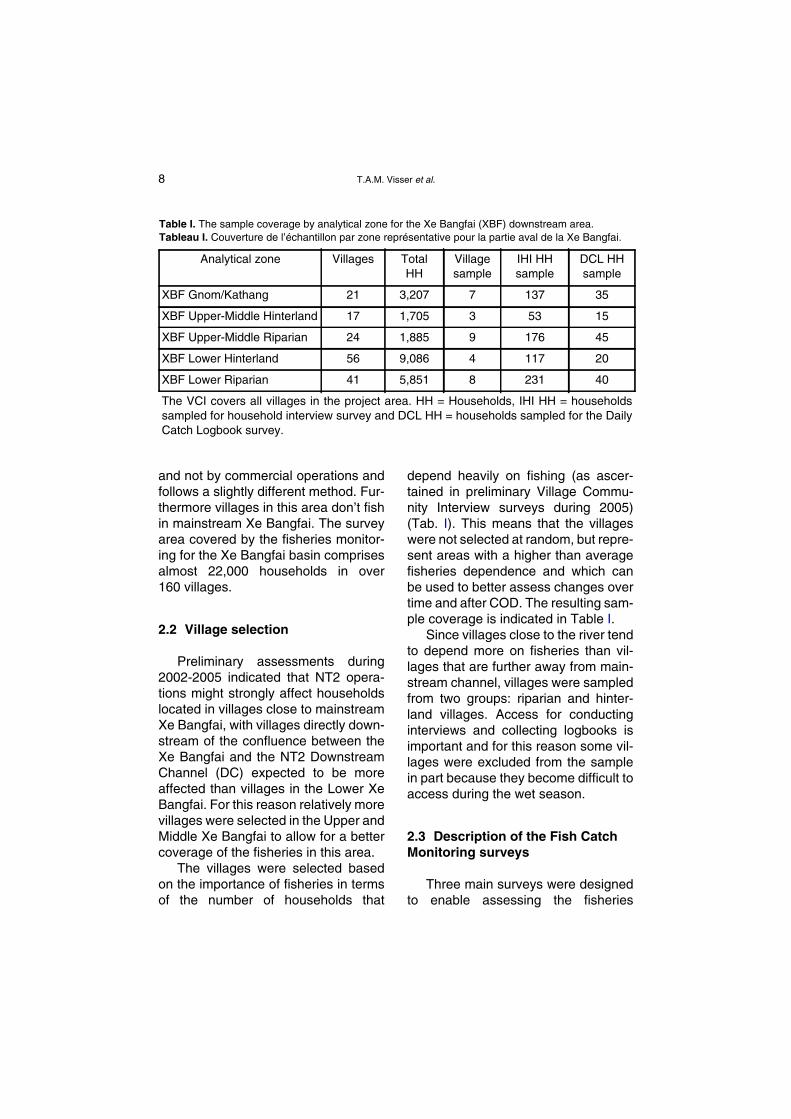
and not by commercial operations andfollows a slightly different method. Fur-thermore villages in this area don’t fishin mainstream Xe Bangfai. The surveyarea covered by the fisheries monitor-ing for the Xe Bangfai basin comprisesalmost 22,000 households in over160 villages.
2.2 Village selection
Preliminary assessments during2002-2005 indicated that NT2 opera-tions might strongly affect householdslocated in villages close to mainstreamXe Bangfai, with villages directly down-stream of the confluence between theXe Bangfai and the NT2 DownstreamChannel (DC) expected to be moreaffected than villages in the Lower XeBangfai. For this reason relatively morevillages were selected in the Upper andMiddle Xe Bangfai to allow for a bettercoverage of the fisheries in this area.
The villages were selected basedon the importance of fisheries in termsof the number of households that
Table I. The sample coverage by analytical zone foTableau I. Couverture de l’échantillon par zone rep
Analytical zone Villages
XBF Gnom/Kathang 21
XBF Upper-Middle Hinterland 17
XBF Upper-Middle Riparian 24
XBF Lower Hinterland 56
XBF Lower Riparian 41
The VCI covers all villages in the project aresampled for household interview survey andCatch Logbook survey.
depend heavily on fishing (as ascer-tained in preliminary Village Commu-nity Interview surveys during 2005)(Tab. I). This means that the villageswere not selected at random, but repre-sent areas with a higher than averagefisheries dependence and which canbe used to better assess changes overtime and after COD. The resulting sam-ple coverage is indicated in Table I.
Since villages close to the river tendto depend more on fisheries than vil-lages that are further away from main-stream channel, villages were sampledfrom two groups: riparian and hinter-land villages. Access for conductinginterviews and collecting logbooks isimportant and for this reason some vil-lages were excluded from the samplein part because they become difficult toaccess during the wet season.
2.3 Description of the Fish CatchMonitoring surveys
Three main surveys were designedto enable assessing the fisheries
r the Xe Bangfai (XBF) downstream area.résentative pour la partie aval de la Xe Bangfai.
TotalHH
Villagesample
IHI HHsample
DCL HHsample
3,207 7 137 35
1,705 3 53 15
1,885 9 176 45
9,086 4 117 20
5,851 8 231 40
a. HH = Households, IHI HH = householdsDCL HH = households sampled for the Daily
Developing approaches for establishing a fisheries baseline: case-study for Xe Bangfai basin (Lao PDR) 9
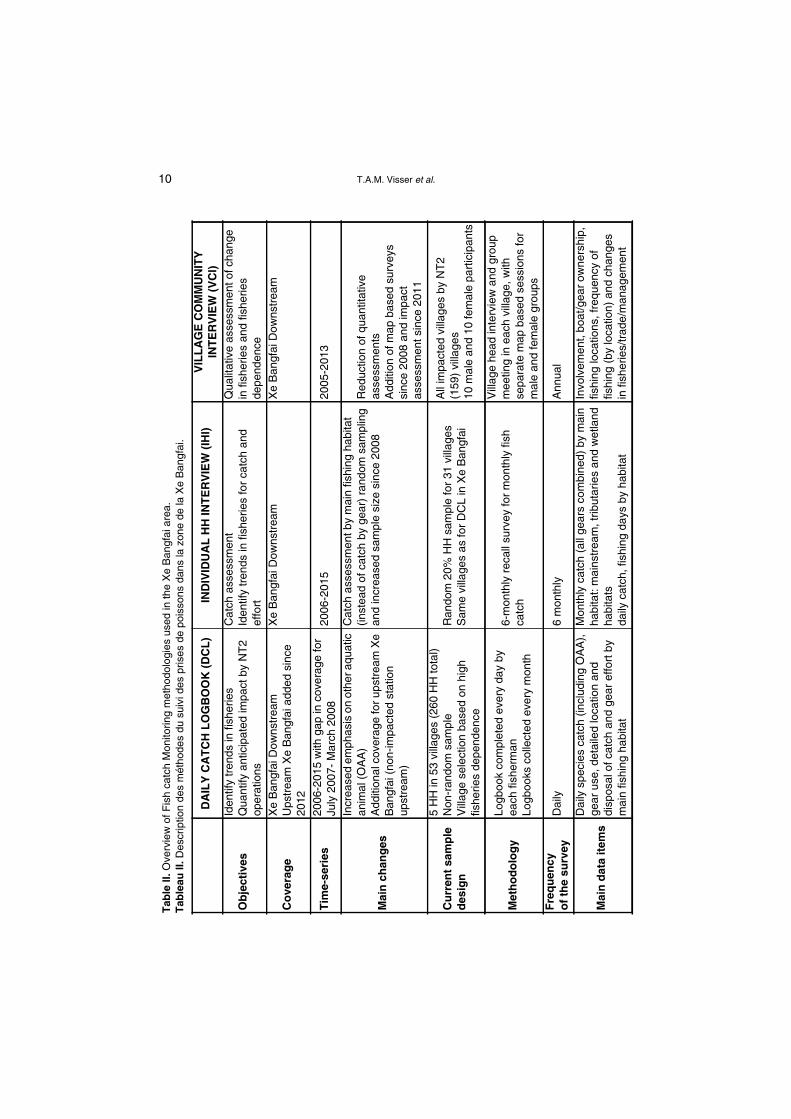
including catch estimates at threelevels for verification and calibration(Tab. II):(i) Village Community Interview (VCI)
including fishing location mappingand impact assessment for all (230)villages in the project area;
(ii) Individual Household Interview (IHI)using 6-monthly recall survey obtai-ning monthly catch assessment fora random sample of 720 house-holds in 51 villages; and
(iii)Daily Catch Logbook (DCL) formonitoring of daily householdcatches by 5 pre-selected monito-ring households (HH) in 51 villages.
These three levels of informationgathering were based on a similarapproach implemented by the MekongRiver Committee (MRC) Assessmentof Mekong Fisheries Component(Sjorslev, 2000; Suntornratana, 2002;Phan et al., 2003) that was adjusted tothe requirements of the NTPC surveys.
All data collection is through papersurvey forms and interviews. Exceptfor the Daily Logbook survey (DLC), forwhich fishermen must complete a log-book form on their own for each fishingday, the other surveys are using thesurvey form for data recording anduse question and answer sessionsfor obtaining the information fromrespondents. Data collection started inearly 2006 and will continue until theend of April 2015. The monitoring alsoincludes the Other Aquatic Animals(OAA) which are water insects, snails,shells, crabs, shrimp and frogs (but notwater birds or mammals/turtles).
The priority for the NT2 FCM pro-gram is on establishing trends in thefish catch, fishing effort and habitat use
in order to create a fisheries baselineand subsequently assess the level ofimpact from NT2 operations. Thereforeit is important to use the same method-ologies during the entire duration of thesurvey period, so data collected iscomparable. This will allow for compar-isons to be made before and after CODto assess the impact on fisheries with-out needing a high level of accuracy ofindividual data points. However despitethe best efforts and planning, someadjustments and modifications in themethodology were inevitable.
An overview of the main methodol-ogies used is included in Table II, witha more detailed description of all mainsurvey tools used and changes imple-mented below.
2.3.1 Gillnet catch survey
A gillnet survey was implementedfrom 2001 to 2003 and used a catchlogbook to monitor the catch per unit ofeffort for 21 fishermen fishing in main-stream Xe Bangfai from seven riparianvillages. The survey collected data forone fishing day per week, for a limitednumber of gillnet types. It was discon-tinued because the results of the studydid not provide estimates for the catchand project managers felt that the CAcalled for a more robust and compre-hensive monitoring system.
2.3.2 Village Community Interview
All villages in the project areawhich may potentially be impacted byNT2 Project are covered by a VillageCommunity Interview, or VCI. Data is
10 T.A.M. Visser et al.
Tab
leII.
Ove
rvie
wof
Fis
hca
tch
Mon
itorin
gm
etho
dolo
gies
used
inth
eX
eB
angf
aiar
ea.
Tab
leau
II.D
escr
iptio
nde
sm
étho
des
dusu
ivid
espr
ises
depo
isso
nsda
nsla
zone
dela
Xe
Ban
gfai
.
DA
ILY
CA
TC
HL
OG
BO
OK
(DC
L)
IND
IVID
UA
LH
HIN
TE
RV
IEW
(IH
I)V
ILL
AG
EC
OM
MU
NIT
YIN
TE
RV
IEW
(VC
I)
Ob
ject
ives
Iden
tify
tren
dsin
fishe
ries
Qua
ntify
antic
ipat
edim
pact
byN
T2
oper
atio
ns
Cat
chas
sess
men
tId
entif
ytr
ends
infis
herie
sfo
rca
tch
and
effo
rt
Qua
litat
ive
asse
ssm
ento
fcha
nge
infis
herie
san
dfis
herie
sde
pend
ence
Co
vera
ge
Xe
Ban
gfai
Dow
nstr
eam
Ups
trea
mX
eB
angf
aiad
ded
sinc
e20
12
Xe
Ban
gfai
Dow
nstr
eam
Xe
Ban
gfai
Dow
nstr
eam
Tim
e-se
ries
2006
-201
5w
ithga
pin
cove
rage
for
July
2007
-M
arch
2008
2006
-201
520
05-2
013
Mai
nch
ang
es
Incr
ease
dem
phas
ison
othe
raqu
atic
anim
al(O
AA
)A
dditi
onal
cove
rage
for
upst
ream
Xe
Ban
gfai
(non
-impa
cted
stat
ion
upst
ream
)
Cat
chas
sess
men
tby
mai
nfis
hing
habi
tat
(inst
ead
ofca
tch
byge
ar)
rand
omsa
mpl
ing
and
incr
ease
dsa
mpl
esi
zesi
nce
2008
Red
uctio
nof
quan
titat
ive
asse
ssm
ents
Add
ition
ofm
apba
sed
surv
eys
sinc
e20
08an
dim
pact
asse
ssm
ents
ince
2011
Cu
rren
tsa
mp
led
esig
n
5H
Hin
53vi
llage
s(2
60H
Hto
tal)
Non
-ran
dom
sam
ple
Vill
age
sele
ctio
nba
sed
onhi
ghfis
herie
sde
pend
ence
Ran
dom
20%
HH
sam
ple
for
31vi
llage
sS
ame
villa
ges
asfo
rD
CL
inX
eB
angf
ai
All
impa
cted
villa
ges
byN
T2
(159
)vi
llage
s10
mal
ean
d10
fem
ale
part
icip
ants
Met
ho
do
log
yLo
gboo
kco
mpl
eted
ever
yda
yby
each
fishe
rman
Logb
ooks
colle
cted
ever
ym
onth
6-m
onth
lyre
call
surv
eyfo
rm
onth
lyfis
hca
tch
Vill
age
head
inte
rvie
wan
dgr
oup
mee
ting
inea
chvi
llage
,with
sepa
rate
map
base
dse
ssio
nsfo
rm
ale
and
fem
ale
grou
psF
req
uen
cyo
fth
esu
rvey
Dai
ly6
mon
thly
Ann
ual
Mai
nd
ata
item
s
Dai
lysp
ecie
sca
tch
(incl
udin
gO
AA
),ge
arus
e,de
taile
dlo
catio
nan
ddi
spos
alof
catc
han
dge
aref
fort
bym
ain
fishi
ngha
bita
t
Mon
thly
catc
h(a
llge
ars
com
bine
d)by
mai
nha
bita
t:m
ains
trea
m,t
ribut
arie
san
dw
etla
ndha
bita
tsda
ilyca
tch,
fishi
ngda
ysby
habi
tat
Invo
lvem
ent,
boat
/gea
row
ners
hip,
fishi
nglo
catio
ns,f
requ
ency
offis
hing
(by
loca
tion)
and
chan
ges
infis
herie
s/tr
ade/
man
agem
ent
Developing approaches for establishing a fisheries baseline: case-study for Xe Bangfai basin (Lao PDR) 11
obtained using fishery focused ques-tions in (large) annual village groupmeetings where for the first 3 annualsurveys the target was to have at least20% of the households in the villagepresent. Because of high attendance,but without active participation of mostof the community members present,this was later changed to have around10 male and 10 female participants fora more balanced gender representa-tion and to ensure that attendees werein fact participating in the discussions.This survey is generally conducted atthe beginning of each year covering thefisheries in the previous year, but latersurveys have been done throughoutthe year as the VCI is not time critical.
The meeting was implemented intwo parts (i) an initial survey with villageleaders to identify general manage-ment and fisheries parameters and(ii) a second survey where communitymembers were invited for a villagemeeting to answer and discuss a list ofquestions concerning the fisheries.
The VCI does not have a fixedstructure or coverage, this means thatthe topics discussed and the focus forthe information gathered changes witheach survey. Earlier VCI’s were heavilyfocussed on collection of quantitativedata (catch assessment, gear owner-ship, species catch and householddependency), with later VCI’s shiftingto a more qualitative approach.
Recognising that the exact estimateson certain aspects of the fisheries werenot compatible with the more detailedassessments obtained from the Individ-ual Household Interview survey (IHI)and Daily Catch Logbook survey (DCL)surveys, the focus for the VCI shiftedmore towards assessment of change in
fisheries. For the VCI survey for 2008(conducted in 2009), a more participa-tory method using village mapping wasimplemented to obtain the location ofcommunity ponds, large scale gearsand conservation areas. Instead of ask-ing for the location, participants to theVCI survey were asked to draw villageresource maps. A similar survey wasinitiated for the 2011 VCI (conducted in2012), with the addition of specific ques-tions for impact/change in catches andhabitat importance and a more detailedimplementation of catch assessment allconnected to the community mapping
2.3.3 Individual Household Interviews
A sample of fishermen each repre-senting their household is interviewedindividually using a detailed question-naire to assess fishery activities in dif-ferent habitats for their household,twice a year with a recall period of6 months. This survey is conducted inthe same villages selected for cover-age by the DCL survey. Each villageinitially was covered by interviewing afixed number of 20 households,including the households involved inthe DCL survey. Households wereselected from 3 categories in the ratio6-10-4 from experienced, intermediaryand inexperienced fishing households(obtained from early Village Commu-nity Interview survey). The householdsare interviewed for January-June andJuly-December periods with total catchestimates (not separated by species)by month for all gears combined (withinitially a separate estimate for gillnets)focusing on mainstream habitats withcatches for all other habitats groupedtogether.
12 T.A.M. Visser et al.
A random sample was introduced atthe beginning of 2008, with some addi-tional improvements to the surveyform, to reflect the emphasis on catchby habitat and increase attention forcollection of other aquatic animals.
The new sample size is approxi-mately equal to 20% of the number ofhouseholds in the villages coveredand thus varies depending on thenumber of fishing households in eachvillage to improve representativenessfor the fishing activities and catches.The interview technique has notchanged (except for more emphasison fishery related activities by otherhousehold members). The coveragehas improved and due to the randomsampling a better estimate for thecatch and active fishing households(equivalent to effort) is achieved1. Thesample size has also increased from620 households before 2008 to 720from 2008 onwards for the Xe Bangfaibasin. The IHI survey is implemented inthe downstream area of the Xe Bangfaiand in the Nam Kathang/Gnom areasurrounding the Downstream Channel.
2.3.4 Daily Catch Logbook
The most detailed methodologyused is the DCL survey. A sample of5 fishing households per village isselected to fill out a daily catch monitor-ing form to collect detailed quantitativecatch data for all household membersin 51 villages. Although households
(1) The pre-2008 can be considered apseudo-random sample as the informa-tion on the dependency of the householdon fisheries from the VCI is tentative atbest, therefore the impact of implement-ing a true random sample are likely to besmall.
were selected according to a fixed ratiobetween experienced, intermediateand inexperienced fishing households,in practice the selection shows a biastowards fishing households that fishregularly during the entire year withreading/writing skills. Selection wasfacilitated by the village headman.Training is provided to the fishinghouseholds to ensure proper docu-mentation of fish catch. Record keep-ing forms and weighing scales are alsoprovided to each of the householdmonitors to ensure the quality of data.The form covers:(i) fish catch by gear, catch by species,
effort (gear units) and detailedfishing location;
(ii) fish catch disposal for householdconsumption, sale and processing;and
(iii)aquatic animals and plants collec-tion and disposal.
In view of the importance of accu-racy and the independence requiredfor this survey, a considerable effort ismade to train fishermen in all aspectsof data collection and recording at theonset of the survey and whenever newreplacement households are selected.This remains a high priority throughoutthe survey with monthly feedback ondata submitted and annual refresherworkshops to discuss issues foundwith the data submitted as well asresults of the survey.
Logbooks come as bound monthlylogbooks with a page for each calendarday, to cover all fishing activities byall household members. Forms arechecked by field staff before being sub-mitted for data entry, issues found arediscussed with the household catch
Developing approaches for establishing a fisheries baseline: case-study for Xe Bangfai basin (Lao PDR) 13
monitor and data adjusted when neces-sary. Most mistakes are with weightsthat are inconsistently recorded, namesfor fishing habitats and issues with spe-cies names.
Species names are recorded asLao common names on the form and inmost cases the species lists used bythe households for the DCL is obtainedfrom species lists compiled during theVCI survey. The common name islinked to a scientific name by showinga fish species photo flipchart, the linkbetween Lao common name and sci-entific species name has been verifiedfor a selection of villages without find-ing any discrepancies with the existinglinkages.
2.3.5 Socio Economic Profile
In order to assess the fisheriesdependency of all households partici-pating in the DCL, a survey was doneto cover the relative importance of fish-ing as a livelihood as well as for foodconsumption. The survey was alsoused to record household composition,land resources and assets, boat andgear ownership and relative skill in fish-ing. The survey is done only once foreach household, replacement house-holds are surveyed whenever theyenter the DCL survey.
2.3.6 Verification survey
The verification survey wasdesigned to compare the catch by arepresentative group of householdswith that reported by the householdsinvolved in the DCL, to see if the DCLdata is representative for all house-holds for total catch and fishing days.
The survey was implemented in 9 ran-dom selected villages also covered bythe DCL survey, in which a total of143 households were interviewed ontheir total catches in the previous5 days. This survey was repeated dur-ing 7 separate 5 days periods fromearly November 2011 to early March2012 taking a 10% random sample ofhouseholds.
2.3.7 Field observation reports
Multi-day field trips are organisedby the data collection team to coverselected villages in the upper, middleand Lower Xe Bangfai. In each villagefishermen and traders are approachedto talk about fishing, levels of catches,trends over time, fish prices and anyfisheries related issues encountered.This survey is implemented every3 months and serves as a supplemen-tal source of information on trends inthe fisheries that can be used to inter-pret the findings of the analysis.
2.4 Data collection
Several changes have been madein how the data is collected and proc-essed to improve both quality and time-liness of the data, leading to a morerobust and reliable system.
2.4.1 Staffing
During the early stages of the mon-itoring program, District staff were usedpart-time to implement the surveyssupervised by a NTPC field co-ordina-tor. In view of the workload, the statusof these staff was changed to NTPC
14 T.A.M. Visser et al.
staff to allow them to work full-time ondata collection and also to facilitatework outside of their designated dis-trict. The field team consists of 6 full-time data collectors and one field co-ordinator, supported by an externalconsultant for survey design, analysisand report writing.
2.4.2 Data verification
All data is verified on the forms bydata collectors right after a surveyinterview is conducted, with any issuesaddressed on-site while the respond-ents are still available. A second verifi-cation is conducted by the field co-ordi-nator on a sample of forms before theyare submitted for data entry. Thisfocuses on ensuring data provided isinternally consistent (using safeguardsbuilt into the survey forms), completeand legible, as well as to flag anyinconsistencies or outliers in the datafor clarification.
2.4.3 Database
All data is entered into a databasewhen internal data checks are per-formed to ensure that no mistakes aremade, using a standard Quality Assur-ance and Quality Control (QA/QC) pro-tocol for partial double data entry. Thisensures that data is entered with theleast amount of mistakes while keepingtrack of progress of data entry on a con-tinuous basis. Any remaining issues inthe data forms are flagged and sentback to the field team for clarification.The databases themselves have beenadjusted to make analysis easier, e.g.adding unified codes for habitats andspecies as well as consistently code
Lao language responses into Lao andEnglish categories.
3 RESULTS
The results of the FCM program canbe separated into two categories whichare (i) outcomes from the changes thathave been implemented in the method-ology and (ii) data obtained from thesurveys.
3.1 Overall results
The improvements in the data col-lection has resulted in far less errors inboth data recording and data entry,while the data is available for analysisearlier after data collection. During thefirst few years of data collection, datafrom the DCL survey was not availa-ble until 5-6 months after recording bythe households (fully checked andentered) from all participating house-holds, this delay was reduced to lessthan 3 weeks for the data for theXe Bangfai basin. Forms are submittedmore timely, complete and with consid-erable less errors, while correctionsare made far more quickly.
Additional data available from boththe Socio Economic Profile (SEP) andthe field observation surveys haveprovided valuable insights in trends inthe fisheries and make it easier to gen-eralize the findings from the main sur-veys. The introduction of the mappingcomponent for the VCI has beeninstrumental in obtaining more mean-ingful information on trends in the fish-eries for villages not covered by the IHIand DCL surveys.
Developing approaches for establishing a fisheries baseline: case-study for Xe Bangfai basin (Lao PDR) 15
Improvements to the structure ofthe database and additions of codesand translations of certain aspects ofthe data make it easier to analyse thedata, with some tools added for calcu-lating a number of routine indicators forthe fisheries.
Despite the emphasis on relativechanges in the main fishery parame-ters, it is interesting to see how well thedata from the DCL survey representsthe households in the survey area, as agood match would allow the trendsfrom the DCL sample to be generalisedto all households.
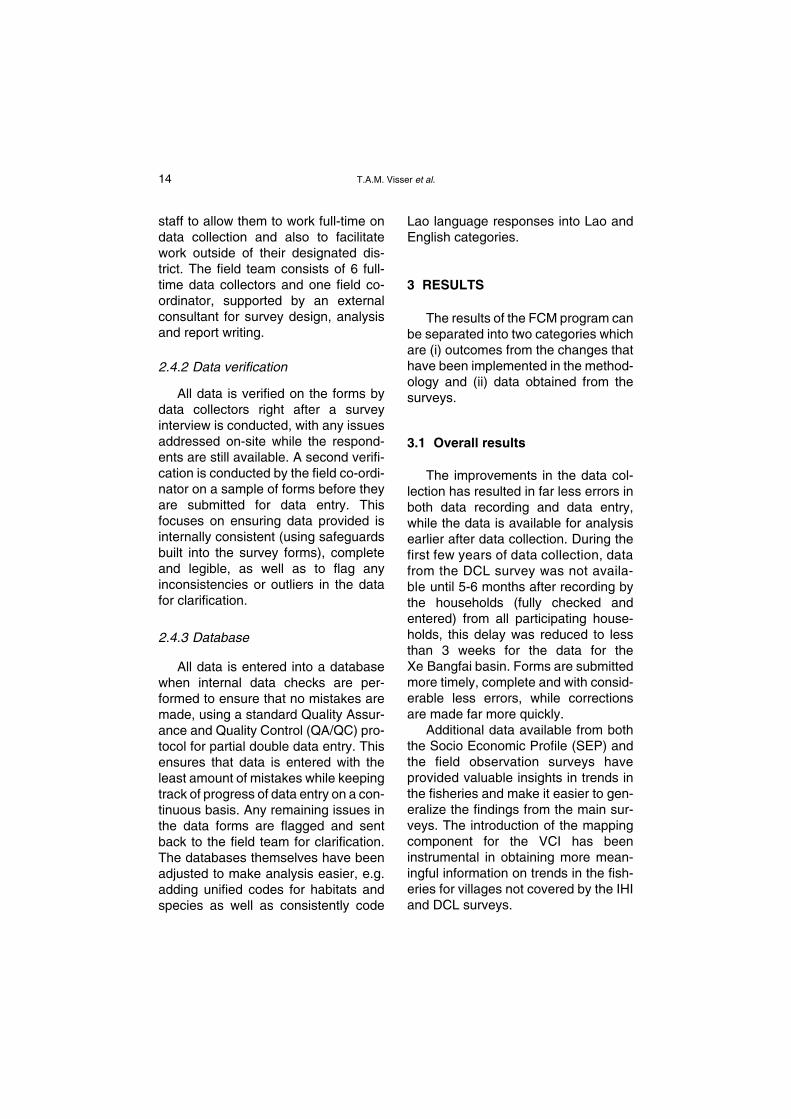
The results of Figure 4 compare theaverage 5-day catch for all householdssampled for the DCL and verificationsurvey. They indicate that on averagethe DCL over estimates the totalamount fish reported. Furthermore, it ismore severe during the dry seasonwhen the DCL over estimates thereported catch by a factor of 2, whileduring the late flood season it underestimates the real household catches
Fig. 4. Reported average 5-day household fish catcsurveys.
Fig. 4. Moyenne de 5 jours de prises de poisson pa
slightly. As indicated by the error barsthat represent the 95% confidenceinterval of the mean, the difference issignificant for the late dry season, butnot for the late wet season and earlydry season. The number of fishingdays is estimated accurately by theDCL survey.
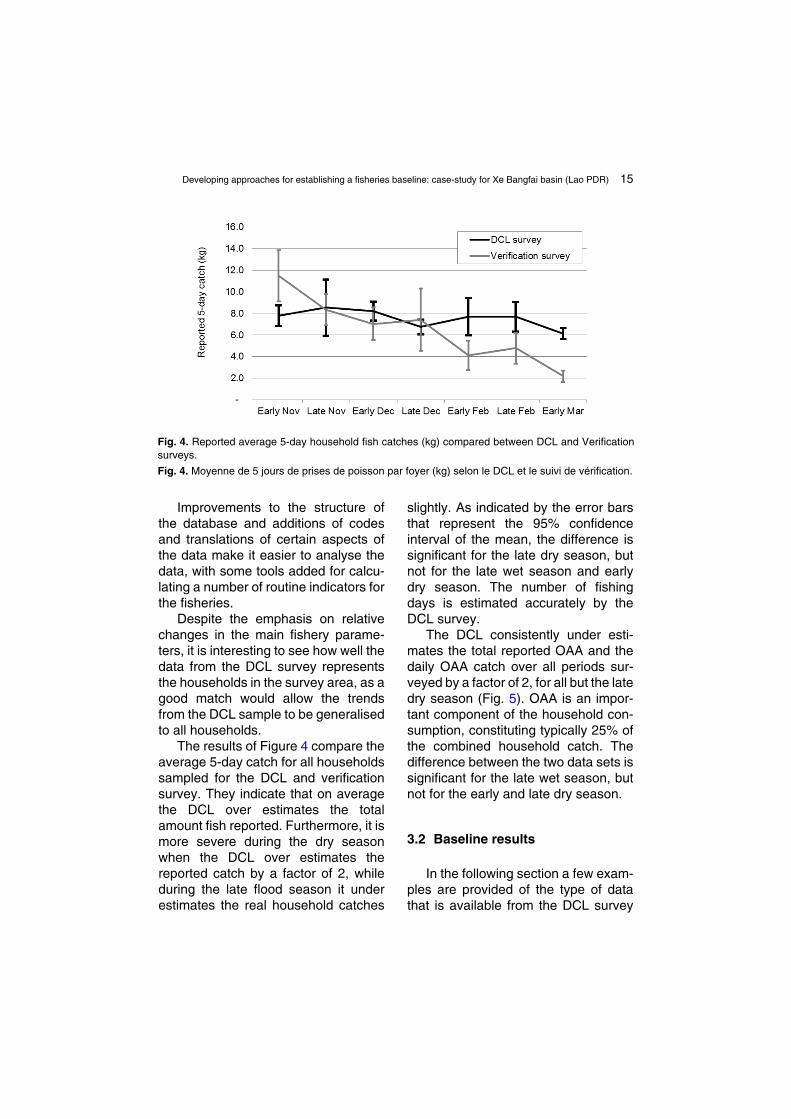
The DCL consistently under esti-mates the total reported OAA and thedaily OAA catch over all periods sur-veyed by a factor of 2, for all but the latedry season (Fig. 5). OAA is an impor-tant component of the household con-sumption, constituting typically 25% ofthe combined household catch. Thedifference between the two data sets issignificant for the late wet season, butnot for the early and late dry season.
3.2 Baseline results
In the following section a few exam-ples are provided of the type of datathat is available from the DCL survey
hes (kg) compared between DCL and Verification
r foyer (kg) selon le DCL et le suivi de vérification.
16 T.A.M. Visser et al.
with a brief analysis of the main fisher-ies parameters for the period 2006-2009, period before the COD. Note thata decision was made in 2007 to pausethe DCL for 9 months for evaluation ofthe data collected, while other fisheriessurveys, IHI and VCI continued.
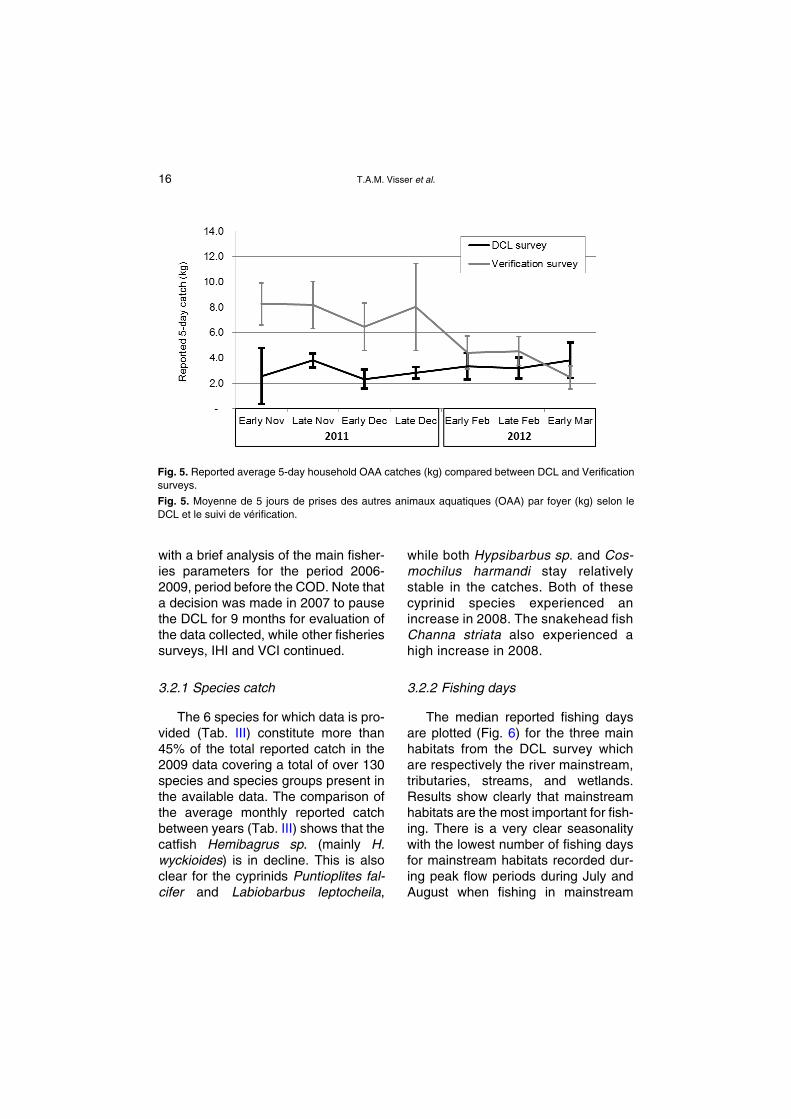
3.2.1 Species catch
The 6 species for which data is pro-vided (Tab. III) constitute more than45% of the total reported catch in the2009 data covering a total of over 130species and species groups present inthe available data. The comparison ofthe average monthly reported catchbetween years (Tab. III) shows that thecatfish Hemibagrus sp. (mainly H.wyckioides) is in decline. This is alsoclear for the cyprinids Puntioplites fal-cifer and Labiobarbus leptocheila,
Fig. 5. Reported average 5-day household OAA catsurveys.
Fig. 5. Moyenne de 5 jours de prises des autres aDCL et le suivi de vérification.
while both Hypsibarbus sp. and Cos-mochilus harmandi stay relativelystable in the catches. Both of thesecyprinid species experienced anincrease in 2008. The snakehead fishChanna striata also experienced ahigh increase in 2008.
3.2.2 Fishing days
The median reported fishing daysare plotted (Fig. 6) for the three mainhabitats from the DCL survey whichare respectively the river mainstream,tributaries, streams, and wetlands.Results show clearly that mainstreamhabitats are the most important for fish-ing. There is a very clear seasonalitywith the lowest number of fishing daysfor mainstream habitats recorded dur-ing peak flow periods during July andAugust when fishing in mainstream
ches (kg) compared between DCL and Verification
nimaux aquatiques (OAA) par foyer (kg) selon le
Developing approaches for establishing a fisheries baseline: case-study for Xe Bangfai basin (Lao PDR) 17
habitats is limited. During the wet sea-son tributaries and wetlands experi-enced a peak in the effort and can tem-porary become more important forfishing than mainstream habitats. Thefishing effort for tributaries and wet-lands tends to be very similar over theyears and between years.
3.2.3 Daily household catch
If the median reported daily house-hold catch is plotted (Fig. 7), it shows
Table III. Comparison of the total reported monthly2008 and 2009. Result details are provided for the 6Tableau III. Comparaison de la prise mensuelle totaet 2009. Les résultats pour les 6 espèces principale
Main species 2006 2008 2009
Hemibagrus sp. 606.1 396.3 314.8
Hypsibarbus sp. 417.4 530.9 465.1
Cosmochilusharmandi
356.1 410.4 342.6
Puntioplites falcifer 389.7 361.5 279.1
Labiobarbusleptocheilus
332.5 252.3 177.8
Channa striata 298.8 538.2 384.9
Contribution tototal catch of top6 species
44% 43% 45%
Average monthlytotal reported catch
5462 5830 4361
2007 is omitted because only data for thinformation obtained from MRC (2003).
that the three habitats are fairly similarin terms of daily catch that can beobtained. During 2006-2007, the dailyhousehold catch in wetlands is signifi-cantly lower than the other two habitatsand for the 2008-2009 period, the dailycatch for tributaries sees a clearincrease for the wet season while themainstream and wetland catches arevery similar in level and seasonality.
A comparison of the medianreported daily household catches forthe period April–December for 3 years
catch for period April-December (kg) from 2006,main species catch.le signalée d’avril à décembre (kg) de 2006, 2008s sont détaillés.
Ecological information
Longitudinal and lateral migratory,mainstream and tributaries, depending onspecies omnivorous and/or carnivorous;large bodied species > 50 cm
Longitudinal and lateral migratory,mainstream and tributaries, omnivorous;up to 50 cm
Lateral migratory, main rivers andfloodplains, omnivorous; around 10 cm
Longitudinal and lateral migratory,mainstream as well as standing waterincluding floodplains, omnivorous; 35 cm
Probably Dangila kuhli or D. lineata. Lateralmigratory, mainstream and tributaries,omnivorous; around 20 cm
Lateral migration to floodplains, standingwater or slow flowing streams, carnivorous;Large up to 90 cm
e first 6 months is available; ecological

18 T.A.M. Visser et al.
(2006, 2008, and 2009) (Tab. IV), con-firms the trend from Figure 7, with themainstream catches experiencing adecline between 2006 and 2009, whilethe daily catches in wetlands see anincrease for the same period. In view ofthe high level of variation, there is noapparent long-term trend at this level ofaggregation.
Fig. 6. Median reported monthly fishing days by ma
Fig. 6. Médiane mensuelle des jours pêchés signal
Fig. 7. Median reported daily household catch by ha
Fig. 7. Médiane quotidienne des prises par foyer et
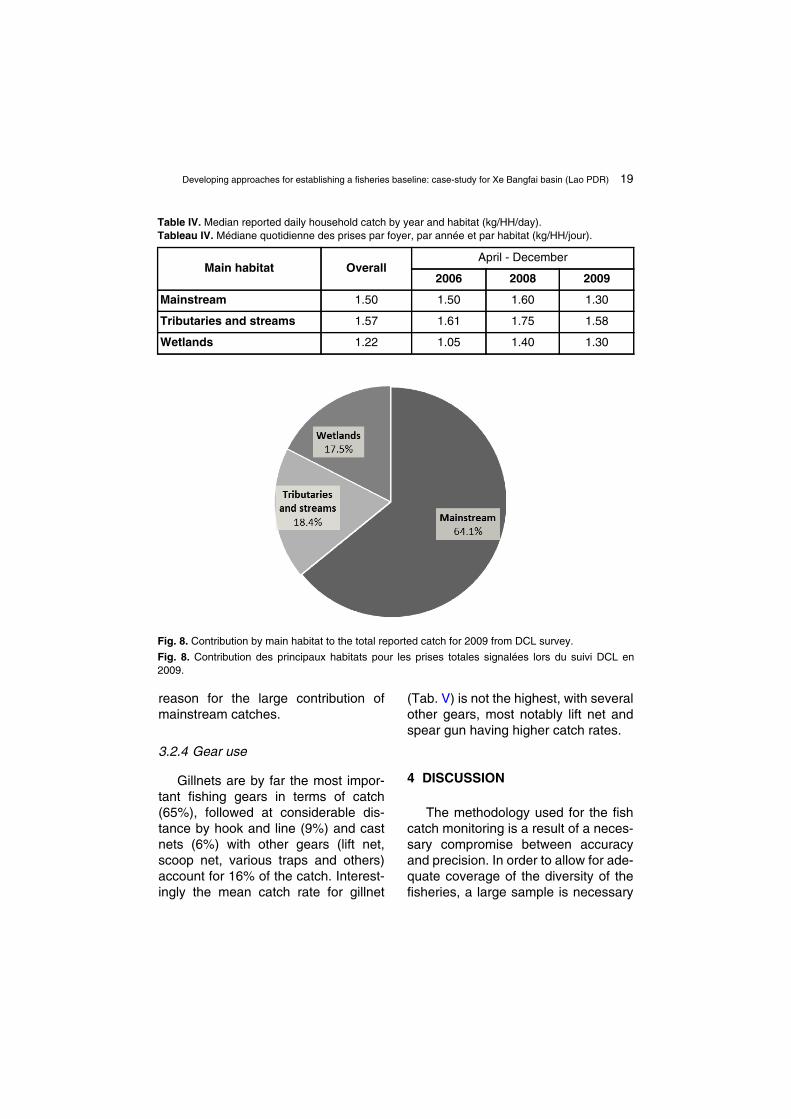
Despite the relative increase in thedaily catch for tributaries during 2008-2009, compared with other habitats,mainstream habitats contributed closeto 65% of the total catches during 2009(Fig. 8) with the other two habitats con-tributing around 18% each to the totalreported catch. The large fishing effortfor mainstream habitats is the main
in habitat from DCL survey.
és par principaux habitats, suivi DCL.
bitat (kg/HH/day) from DCL survey.
par habitat (kg/HH/jour), suivi DCL.
Developing approaches for establishing a fisheries baseline: case-study for Xe Bangfai basin (Lao PDR) 19
reason for the large contribution ofmainstream catches.
3.2.4 Gear use
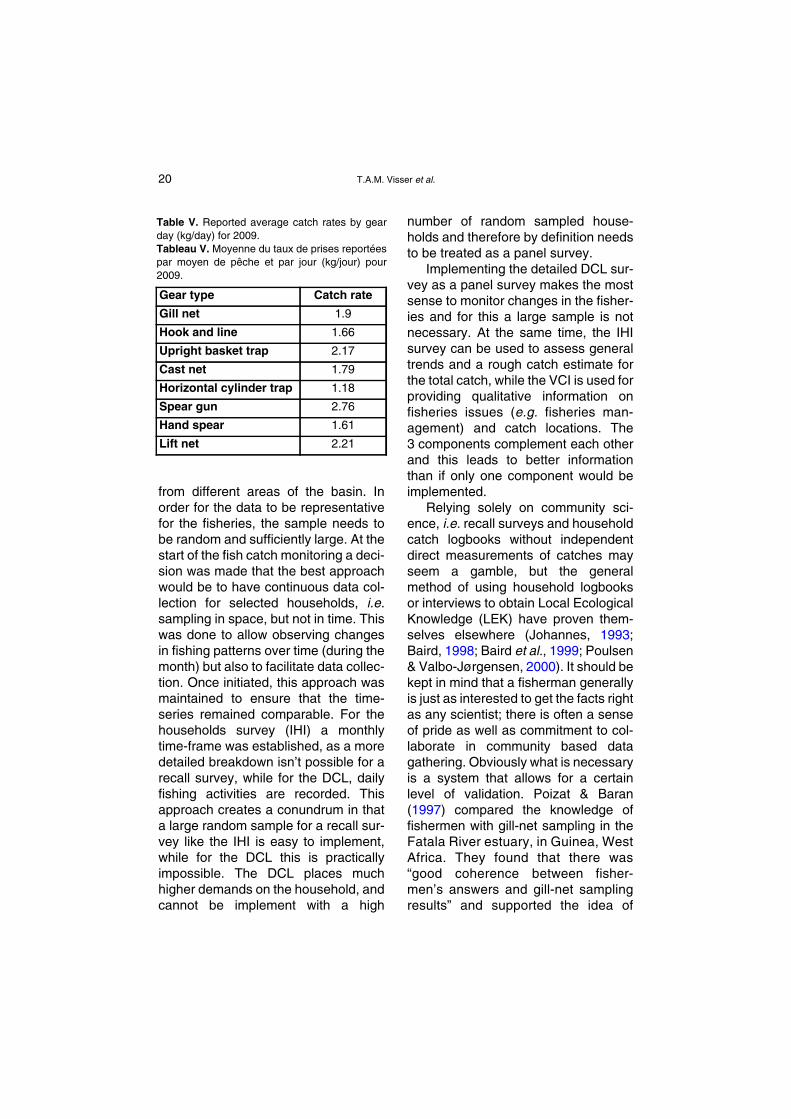
Gillnets are by far the most impor-tant fishing gears in terms of catch(65%), followed at considerable dis-tance by hook and line (9%) and castnets (6%) with other gears (lift net,scoop net, various traps and others)account for 16% of the catch. Interest-ingly the mean catch rate for gillnet
Table IV. Median reported daily household catch byTableau IV. Médiane quotidienne des prises par foy
Main habitat Overall
Mainstream 1.50
Tributaries and streams 1.57
Wetlands 1.22
Fig. 8. Contribution by main habitat to the total repo
Fig. 8. Contribution des principaux habitats pour2009.
(Tab. V) is not the highest, with severalother gears, most notably lift net andspear gun having higher catch rates.
4 DISCUSSION
The methodology used for the fishcatch monitoring is a result of a neces-sary compromise between accuracyand precision. In order to allow for ade-quate coverage of the diversity of thefisheries, a large sample is necessary
year and habitat (kg/HH/day).er, par année et par habitat (kg/HH/jour).
April - December
2006 2008 2009
1.50 1.60 1.30
1.61 1.75 1.58
1.05 1.40 1.30
rted catch for 2009 from DCL survey.
les prises totales signalées lors du suivi DCL en
20 T.A.M. Visser et al.
from different areas of the basin. Inorder for the data to be representativefor the fisheries, the sample needs tobe random and sufficiently large. At thestart of the fish catch monitoring a deci-sion was made that the best approachwould be to have continuous data col-lection for selected households, i.e.sampling in space, but not in time. Thiswas done to allow observing changesin fishing patterns over time (during themonth) but also to facilitate data collec-tion. Once initiated, this approach wasmaintained to ensure that the time-series remained comparable. For thehouseholds survey (IHI) a monthlytime-frame was established, as a moredetailed breakdown isn’t possible for arecall survey, while for the DCL, dailyfishing activities are recorded. Thisapproach creates a conundrum in thata large random sample for a recall sur-vey like the IHI is easy to implement,while for the DCL this is practicallyimpossible. The DCL places muchhigher demands on the household, andcannot be implement with a high
Table V. Reported average catch rates by gearday (kg/day) for 2009.Tableau V. Moyenne du taux de prises reportéespar moyen de pêche et par jour (kg/jour) pour2009.
Gear type Catch rate
Gill net 1.9
Hook and line 1.66
Upright basket trap 2.17
Cast net 1.79
Horizontal cylinder trap 1.18
Spear gun 2.76
Hand spear 1.61
Lift net 2.21
number of random sampled house-holds and therefore by definition needsto be treated as a panel survey.
Implementing the detailed DCL sur-vey as a panel survey makes the mostsense to monitor changes in the fisher-ies and for this a large sample is notnecessary. At the same time, the IHIsurvey can be used to assess generaltrends and a rough catch estimate forthe total catch, while the VCI is used forproviding qualitative information onfisheries issues (e.g. fisheries man-agement) and catch locations. The3 components complement each otherand this leads to better informationthan if only one component would beimplemented.
Relying solely on community sci-ence, i.e. recall surveys and householdcatch logbooks without independentdirect measurements of catches mayseem a gamble, but the generalmethod of using household logbooksor interviews to obtain Local EcologicalKnowledge (LEK) have proven them-selves elsewhere (Johannes, 1993;Baird, 1998; Baird et al., 1999; Poulsen& Valbo-Jørgensen, 2000). It should bekept in mind that a fisherman generallyis just as interested to get the facts rightas any scientist; there is often a senseof pride as well as commitment to col-laborate in community based datagathering. Obviously what is necessaryis a system that allows for a certainlevel of validation. Poizat & Baran(1997) compared the knowledge offishermen with gill-net sampling in theFatala River estuary, in Guinea, WestAfrica. They found that there was“good coherence between fisher-men’s answers and gill-net samplingresults” and supported the idea of
Developing approaches for establishing a fisheries baseline: case-study for Xe Bangfai basin (Lao PDR) 21
using fishermen’s knowledge as asource of ecological information andeven for providing catch information.Visser (2004) also found a good corre-lation between the timing of knownmigration patterns with observedpeaks in catches as recorded in catchlogbooks, with for some species a90% match. In addition the logbookdata in that study was found to be con-sistent between participating fisher-men, indicating that they were cor-rectly reporting the species catches.
4.1 Sampling design
The inclusion of villages for the IHIand DCL surveys that are moredependent on fisheries has implica-tions for the representativeness of thedata. Nevertheless, any trends foundfor these villages with a higher thanaverage dependence on fisheries arealso valid for other villages. The mainconsideration of the survey and sampledesign was to allow monitoring of long-term trends and eventually the level ofimpact from NT2 operations in key fish-ing areas, not the accurate estimationof the fishing parameters for all villages.
Over the course of the surveyperiod no changes were made to thevillage coverage or basic methodology(survey forms or data collection meth-odology) for the DCL and IHI surveysas not to interrupt the time-series. How-ever, as indicated in this paper, somechanges were made to ensure dataquality. Most changes were related toQuality Assurance and Quality Control(QA/QC) both for data collecting anddata entry while streamlining theprocess of validating data collected,
reducing the time between data collec-tion and analysis, as well as databaserelated improvements, e.g. translationof Lao language entries and coding ofresponses into categories for easieranalysis.
A major issue with the implementa-tion of logbook surveys (or any type ofpanel survey) is the high attrition rate ofparticipants. Any change in the compo-sition of the households participating inthe survey carries the risk that the datais affected. More than 65% of thehouseholds that were selected at thestart of the DCL survey in 2006 are stillinvolved at the beginning of 2014. Mostof the changes in original selectedhouseholds occurred in the first year ofimplementation and again directly afterthe resumption of the survey in 2008.This indicates the period when samplehouseholds realised the workloadinvolved and subsequently that the sur-vey would last beyond a single year.
Instead of accepting a reduction ofthe sample size, households arereplaced with a compatible household(in terms of overall catch, effort anddependency on fisheries as a liveli-hood). This is focused on minimisingchanges in the composition of the over-all sample, with the option to only con-sider the original households for analy-sis, but generally relying on medianvalues for fishery parameters forgroups of households from the samearea.
The overall attrition rate is very lowfor a survey that is implemented for8 years, with on average less than6 households having to be replacedeach year. This is a major accomplish-ment and key in establishing a consist-ent time-series.
22 T.A.M. Visser et al.
4.2 Accuracy and precision of datacollected
Working with fishing households asthe main source of information meansthat extra precautions have to be takento ensure that the resulting data is asaccurate as possible. Data collectedthrough household interviews or fishcatch logbooks is rarely exact. Further-more, asking for too much detail mayactually lead to less accurate informa-tion as household monitors may feelobliged to fill in all the required informa-tion and in the process make data up.
As most statistical texts on surveydesign point out (Fowler, 2009), surveydesign tends to aim for optimisation ofboth precision and accuracy. Howeverachieving a high precision and accu-racy is expensive. The DCL survey isdesigned to obtain data in a consistentway. It is more important that the preci-sion of data collected in 2006 is thesame as that for 2013, than to introduceimprovements to achieve a higheraccuracy. This means that the method-ology has focussed on consistency;without changes to the actual methodssince the start of the implementation. Italso means that it isn’t a priority toassess to what extent the data col-lected represents the ‘real’ catch oreffort, i.e. how accurate the data col-lected represents the true values. Thedata isn’t used to estimate the overallcatch, but rather to assess changes inthe fisheries. This means that the mainchallenge is to keep the attrition rate ofhouseholds from the sample as low aspossible and the precision constant.The data is treated as a panel surveywhere long-term changes in fishing pat-terns are compared between groups of
fishing households from the two fixedfishing zones in the Xe Bangfai: Lowerand Upper-Middle Xe Bangfai, with adistinction made between householdsfrom riparian and hinterland villages foreach zone.
What is most important is that theresults of the survey are replicable,even though they may not be accurate.Using interviews or logbooks alreadyforgoes a high level of accuracy andthis is further exacerbated by introduc-ing additional bias in using a non-ran-dom household sample. Implementinga complex survey instrument like theDCL makes this is unavoidable.Households need to be willing to partic-ipate to ensure the highest level of co-operation. Data reported by house-holds generally is taken at face valueand there is in principle no non-eligibledata, except for the first 3 months ofdata from 2006. These data were neverincluded in the analysis, as data fromthis start-up phase contained manymistakes and irregularities. Beyondthis start-up phase households areexpected to be consistent in what andhow they report their catches over thetime-series. Because households wereselected based on their willingness andcapacity to collect data, chances thatthey report catches truthfully areincreased. Some irregularities in thereported catch and effort haveoccurred and are discussed with theparticipating households. If inconsist-encies cannot be explained or if thehousehold is no longer willing to partic-ipate, the household is replaced.
Collecting fish or other aquatic ani-mals (OAA) for household consump-tion is often not considered to be fish-ing by the head of the household and
Developing approaches for establishing a fisheries baseline: case-study for Xe Bangfai basin (Lao PDR) 23
was frequently left out of the reporteddata during 2006-2007, until data col-lectors convinced households that col-lection of fish and OAA by other house-hold members needs to be reportedtoo. It is necessary to stay vigilantabout this aspect of the data collectionwhenever households are replaced forthe logbook survey, or when for the IHIsurvey the households are resampledat the beginning of each year. Becauseof these factors the available data forthe first year of the survey (2006) has ahigher variation and probably a loweraccuracy than that collected later onwith regards to OAA.
The results from the verification sur-vey indicate that the householdsinvolved in the DCL seem to be betterin keeping their fish catches stablebetween seasons than the averagerandomly selected household. TheDCL data can be used as indicator forchange in the fishery, but the differencebetween the average catches andthose reported by the DCL householdsmeans that any calculated changes infishery patterns cannot simply beextrapolated to the larger fisher popu-lation. If anything, annual changes infish catches may actually be higher forhouseholds in general as they cannot(or choose not to) keep catches at con-sistent levels throughout the year.
The available data from the verifica-tion survey suggest that there is a sea-sonal influence and that overall thelevel of under estimation by the DCLdata of the actual catches is highestduring the wet season and turns into anover estimation during the dry season.Even though the findings of the verifi-cation survey emphasise that the DCLdata cannot be used to estimate the
actual total catch for all households inthe Xe Bangfai basin, it still provides avalid basis to assess annual and sea-sonal trends in the fishery for house-holds with a more than averagedependence on fisheries.
4.3 Baseline results (2006-2009)
The data presented in this paperclearly shows the seasonality of thefisheries and large differences in thetotal reported catch. Mainstream habi-tats are more important during the dryseason, while floodplains and tributar-ies are of importance during the wetseason. Daily catches are highest intributaries and streams, while main-stream habitats provide more than 2/3of the total catch. Although this seemsa contradiction, this is mainly becausetributaries and streams are targetedmainly at the end of the wet seasonwhen fish migrate back from the flood-plains to the main river channel. Assuch, the Xe Bangfai is a typical flood-plain driven fisheries, with considera-ble inputs from the Mekong in the earlywet season with a peak in the catchesat the onset of the wet season andagain at the onset of the dry season.
Gillnet is preferred by most fishinghouseholds because it is non-selectivepassive gear, i.e. it can be set and left,while most other gears with a highcatch rate either are active gears, i.e.they need to be wielded for fishing(spears, lift net hook and line) or havea very distinct location and time theycan be used (Upright basket trap).Therefore for the largely part-time fish-ing employed in the Xe Bangfai, gillnetsare the most efficient gear for mostfishing households.
24 T.A.M. Visser et al.
Since all data is obtained from com-mercial fisheries it is difficult to reachany definite conclusions on catch levelsand trends, as fishermen tend to opti-mise their catches by ‘chasing the fish’.Taking into consideration annual fluctu-ations in the catch because of differ-ences in flooding patterns, reflected inthe total reported catch, the data pointsat differential decline for some species,possibly connected to increasing fish-ing effort or changes in the aquaticecosystem.
The absence of any clear trend inthe available baseline data time-seriespresented in this paper for 2006-2009emphasises the influence of a strongflooding year (2005) on fish catches insubsequent years as the main driverfor year-on-year changes.
NTPC considered the availability ofa fisheries baseline of immense impor-tance and considerable efforts weremade to ensure baseline surveys wereimplemented for the project areas inthe 5 years running up to the start ofcommercial operations. Although abaseline with a longer time serieswould be desirable, organizational andpractical constraints make it difficult forbaseline monitoring to start before aproject is officially approved and beforefinancial close. Hopefully the experi-ences described in this article may leadto more hydro power projects prioritiz-ing collection of baseline data.
5 CONCLUSION
The experience in implementing aFish Catch Monitoring system for the
Xe Bangfai basin may be summarisedin a number of recommendations withgeneral applications:• a dedicated field team is essential to
safeguard the quality and consis-tency of the FCM implementation;
• limited scope rapid appraisal surveysbased on community mapping offishery resources provide an excel-lent entry point for establishing themain markers for an FCM system;
• establishing a fisheries baseline forhydro-power projects is an essentialpart of impact assessment with aduration of at least 5 years, wherepossible, supplemented with controlareas not influenced by project ope-rations to increase utility of the dataset;
• quantitative FCM surveys shouldalways be implemented alongsidemore informal local knowledge sur-veys that can provide backgroundinformation on fisheries and per-ceived trends;
• recall surveys with a long recallperiod only have a limited utility, theywork best when the recall period isshort, otherwise they tend to reflectperception of change;
• villages and households should beselected randomly whenever pos-sible to allow the results of the FCMto be representative for the fisheriesas a whole, if key fisheries need tobe monitored, this can be donethrough a logbook based panel sur-vey; and
• household logbook systems canprovide a cost-effective and va-luable tool for assessing trends andchanges in the fisheries.
Developing approaches for establishing a fisheries baseline: case-study for Xe Bangfai basin (Lao PDR) 25
ACKNOWLEDGEMENT
This research has been conductedat Nam Theun 2 Power Company inLao PDR whose shareholders areÉlectricité de France, Lao HoldingState Enterprise and Electricity Gener-ating Public Company Limited of Thai-land. We would like to thank NTPCmanagement, E&S Director RuediLuthi for supporting the preparation ofthis paper and especially Jean-PierreKatz and Jean Copreaux whose sup-port during their tenure encouraged usto develop our thoughts on how best toshare lessons learned, the Down-stream Program Team, led by FrancoisDemoulin and Richard Peary and last,but certainly not the least, all house-holds that have been part of the fisher-ies surveys.
REFERENCES
Baird I.G., 1998. Preliminary Fishery StockAssessment Results from Ban HangKhone, Khong District, Champasak Pro-vince, Southern Lao PDR. Technicalreport on environmental protection andcommunity development in the Siphan-done Wetland of Champassak province.Funded by the European Union andimplemented by CESVI, 112 p.
Baird I.G., Inthaphaisy V., KisouvannalathP., Vongsenesouk B. & Phylavanh B.,1999. The Setting Up and Initial Resultsof a Villager-Based System for Monito-ring Fish Conservation Zones in theMekong River, Khong District, Cham-passak Province, Southern Lao PDR.Technical report on environmental pro-tection and community development inthe Siphandone Wetland of Champas-sak Province. Funded by the EuropeanUnion and implemented by CESVI, 41 p.
Descloux S., Guédant P., Phommachanh D.& Luthi R., 2014. Main features of theNam Theun 2 hydroelectric project (LaoPDR) and the associated environmentalmonitoring programme. Hydroécol.Appl. (same issue).
FAO, 1999. Guidelines for the routine collec-tion of capture fishery data. Prepared atthe FAO/DANIDA Expert Consultation,Bangkok, Thailand, 18-30 May 1998.FAOFisheriesTechnicalPaper.No.382,Rome, FAO, 1999, 113 p.
Fowler F.J., 2009. Survey ResearchMethods. Sage Publications. Appliedsocial research methods series, 201 p.
de Graaf G.J., Born B., Uddin K. & Marttin F.,2001. Floods, Fish and Fishermen.Eight years experiences with floodplain fisheries, fish migration, fisheriesmodelling and fish bio-diversity in theCompartmentalisation Pilot Project,Bangladesh. Technical report for theCompartmentalisation Pilot Project,Bangladesh, 127 p.
Hoggarth D.D., Cowan V.J., Halls A.S.,Aeron-Thomas M., McGregor J.A,Garaway C.A., Payne A.I. & WelcommeR.L., 1999. Management guidelines forAsian floodplain river fisheries. Part.Summary of DFID research. FAO Fishe-ries Technical Paper No. 384/2, Rome,FAO, 1999, 117 p.
Hortle K.G. & Bush S.R., 2003. Consump-tion in the Lower Mekong Basin as aMeasure of Fish Yield. In: NewApproaches for the Improvement ofInland Capture Fishery Statistics in theMekong Basin. FAO RAP Publication2003/01, 76-82.
Johannes R.E., 1993. Integrating traditionalecological knowledge and managementwith environmental impact assessment.In: Inglis J.T. (Ed.). Traditional Ecologi-cal Knowledge: Concepts and Cases,33-41.
26 T.A.M. Visser et al.
Junk W.J., Bayley P.B. & Sparks R.E., 1989.The flood pulse concept in river-flood-plain systems. In: Dodge D.P. (Ed.). Pro-ceedings of the International LargeRiver Symposium. Can. Spec. Publ.Fish. Aquat. Sci. 106 : 110-127.
Kolding J., 1989. The fish resources of LakeTurkana and their environment. Thesisforthe Cand. Scient degree in FisheriesBiology and Final Report of KEN 043Trial Fishery 1986-1987, University ofBergen, 262 p.
Kottelat M., 2001. Fishes of Laos. WHTPublications (Pte) Ltd, Colombo, SriLanka, 198 p.
MRC, 2003. Mekong Fish Database version2003. CD-ROM. Mekong River Com-mission, Phnom Penh, Cambodia.
Phan T.L., Pham M.P., Visser T.A.M., Sjors-lev J.G. & Hortle K.G., 2003. Inlandfisheries activities and fish consumptionin TraVinh Province, Viet Nam. MRCConference Series 4 : 127-139.
Phonvixay S., 2013. An introduction to theFisheries of Lao PDR. Mekong Develop-ment Series No. 6, Mekong River Com-mission, Phnom Penh, Cambodia, 62 p.
Poizat G. & Baran E., 1997. Fishermen’sknowledge as background information intropical fish biology: a quantitative com-parison with fish sampling results, Envi-ron. Biol. Fish. 50 : 435-449.
Poulsen A.F. & Valbo-Jørgensen J., 2000.Fish migrations and spawning habits inthe Mekong Mainstream – a surveyusing local knowledge. AMFC TechnicalReport. Mekong River Commission.
Reyntjes D., 1997. Handbook for FisheriesOfficers. Lake Fisheries DevelopmentProject Phase II, working paper No. 24,92 p.
Sjorslev J.G., 2000. Fisheries survey, Luan-gPrabang Province Lao PDR. LARReCResearch Report No. 1 NAFRI andMRC Fisheries Component, Vientiane,Lao PDR, 45 p.
Stamatopoulos C., 2002. Sample-BasedFishery Surveys - A Technical Hand-book. FAO Fisheries Technical Paper:No. 425, FAO Rome, 76 p.
Suntornratana U., 2002. Fisheries Surveyof the Lower Songkhram River Basin.Draft Report. AMCF Component,Mekong River Commission FisheriesProgramme and Department of Fishe-ries, Thailand, 42 p.
Visser T.A.M., 2003. Collecting Fishery Sta-tistics for Inland and Coastal Fisheries.SEAFDEC report, 180 p.
Visser T.A.M., 2004. Analysis of MigrationMonitoring Logbook Survey. Quality as-sessment, comparison with Local Eco-logical Knowledge Surveys and obtainingoptimal sampling frequency for routinecatch assessment. AMFC Technical Re-port. Mekong River Commission, 62 p.
Welcomme R.L., 1975. The fisheries eco-logy of African floodplains. CIFA Tech.Pap. (3), 51 p.
Ziv G., Baran E., Nam S., Rodríguez-IturbeI. & Levin S.A., 2012. Trading-off fishbiodiversity, food security, and hydro-power in the Mekong River Basin. Pro-ceedings of the National Academy ofSciences 109, No. 15 : 5609-5614.


![South China Sea: Establishing a Regional System of Fisheries Refugia in the South China Sea and Gulf of Thailand (Nakamura) [IWC4 Presentation]](https://static.fdocuments.in/doc/165x107/55ab44b91a28abdc0e8b482a/south-china-sea-establishing-a-regional-system-of-fisheries-refugia-in-the-south-china-sea-and-gulf-of-thailand-nakamura-iwc4-presentation.jpg)