REVISED FINAL REPORT Analysis of Fisheries …1.pdfabundance patterns and distributions of the ......
86
1 REVISED FINAL REPORT Analysis of Fisheries-Independent Data for Evaluation of Species Distribution Responses to the Caernarvon Freshwater Diversion Shaye E. Sable Dynamic Solutions, LLC 450 Laurel Street, Suite 1060, Baton Rouge, Louisiana 70801 Chuck Villarrubia Louisiana Applied Coastal Engineering and Science Division Office of Coastal Protection and Restoration 450 Laurel Street, Suite 120, Baton Rouge, Louisiana 70801
Transcript of REVISED FINAL REPORT Analysis of Fisheries …1.pdfabundance patterns and distributions of the ......
1
REVISED FINAL REPORT
Analysis of Fisheries-Independent Data for Evaluation of Species Distribution Responses to the Caernarvon Freshwater Diversion
Shaye E. Sable
Dynamic Solutions, LLC
450 Laurel Street, Suite 1060, Baton Rouge, Louisiana 70801
Chuck Villarrubia
Louisiana Applied Coastal Engineering and Science Division
Office of Coastal Protection and Restoration
450 Laurel Street, Suite 120, Baton Rouge, Louisiana 70801

2
EXECUTIVE SUMMARY
This report evaluates the abundance data of five important commercial and recreational fishery species collected by the Louisiana Department of Wildlife and Fisheries (LDWF) biological monitoring program from 1988-2010 to determine if there have been any changes in the abundance patterns and distributions of the species in Breton Sound. The objective of the report is to evaluate the species patterns over the monitoring period before construction of the Caernarvon Freshwater Diversion was completed and since the diversion has been in operation. The abundance and distribution of catch for brown shrimp, white shrimp, blue crab, eastern oysters, spotted seatrout and red drum were evaluated in the 6’ and 16’ otter trawls, 50’ seines, experimental gillnets, and meter square samples for the estuary. The annual mean catch per unit effort (CPUE) for the species caught by the different gear types in the estuary was plotted to evaluate the system-wide trends. The mean monthly values of species catch for the system, and at the individual sampling stations, were calculated and plotted over time to identify changes in species abundance patterns and distribution over years and among the pre- and post-operational periods, and long-term post-operational periods (pre- and post-Katrina) for the Caernarvon Diversion. The mean monthly species CPUEs were also plotted against the monthly salinity measurements at the stations to evaluate the relationships between species catch distribution and salinity. The relationships between the monthly catch and salinity values at the stations were further examined using simple correlative statistics to support the graphical results. Plots and simple statistics were also used to examine if the monthly salinity at the stations over time was related to the operational flow from Caernarvon or the Mississippi River stage. The analysis showed that there were no strong, consistent salinity effects due to the Caernarvon Diversion operation on the abundance patterns or distributions of the five fishery species in Breton Sound. During the time Caernarvon was constructed and operating, some species appeared to increase (e.g., white shrimp in the trawls), or decrease then increase (e.g., brown shrimp in trawls), or increase then decrease (e.g., eastern oysters, blue crab in trawls) in the system, while some species distributed with salinity in certain years or over time (e.g., spotted seatrout in gillnets). However, the patterns for the species were not commensurate with the diversion operation periods, and the species distributions were rarely related to salinity at the stations. Expanding the analysis of the LDWF monitoring data for the five fishery species beyond the immediate post-construction period allowed for comparison and re-evaluation of the species results demonstrated in the original post-construction monitoring report (USACOE 1998). Although it is difficult to elucidate effects from the diversion using the LDWF data since it is variable and measures a variety of effects, identifying the abundance patterns and distribution changes in the system is important for establishing the existing conditions and baseline dynamics for the fishery species. As modifications to Caernarvon operation are implemented, and other restoration efforts are planned for Breton Sound, the existing dynamics of the estuary will change over time. Results from the analysis can be used for comparison with similar data collected on the fishery species under future conditions to evaluate the additive effects of the coastal restoration efforts on the species in Breton Sound.

3
INTRODUCTION
The Caernarvon Freshwater Diversion structure was authorized by the U.S. Congress under the Flood Control Act of 1965 and the Water Resources Development Act of 1974, 1986, and 1996. The diversion is located on the east bank at Mississippi River mile 82 in Plaquemines Parish. Caernarvon was constructed between 1988 and 1991, and opened to limited operations in August of 1991. It was designed to re-introduce up to 8,000 cubic feet per second (cfs) of freshwater, sediments, and nutrients into the marshes and shallow bays of Breton Sound. The defined project objectives are to enhance emergent marsh vegetative growth, reduce marsh loss, and increase productivity of significant commercial and recreational fisheries and wildlife (LDNR 2006). The main impetus for the freshwater diversion was to enhance oyster production in the sound and mitigate losses due to predation and disease that result from increased salinities (Gagliano et al. 1995, Pollard 1973). The purpose of the diversion operation was to enlarge the oyster productive zone by increasing the distance between the 5 and 15 ppt isohalines in the estaury by pushing them seaward (LDNR 2006, USACE 1984).
This report evaluates the abundance data of six important commercial and recreational fishery species collected by the Louisiana Department of Wildlife and Fisheries (LDWF) biological monitoring program from 1988-2010 to determine if there have been any changes in the abundance patterns and distributions of the species in Breton Sound. The objective of the report is to evaluate the species patterns over the monitoring period before construction of the Caernarvon Freshwater Diversion was completed and since the diversion has been in operation.
The abundance and distribution of catch for brown shrimp, white shrimp, blue crab, eastern oysters, spotted seatrout and red drum were evaluated in the 6’ and 16’ otter trawls, 50’ seines, experimental gillnets, and meter square samples collected by LDWF biologists in Breton Sound. The post-larval, juvenile and adult life stages of these fishery species differentially depend upon the food production and habitat function provided by estuarine systems such as Breton Sound. In 2009, Louisiana had total landings of 51,500 metric tons (mt) of brown and white shrimp, 6700 mt of oysters, and 23,200 mt of blue crab (http://www.st.nmfs.noaa.gov/st1/). The shrimp, oyster, and blue crab fisheries accounted for approximately 45%, 58%, and 33% of the total U.S. landings, and approximately 35% , 52% and 24% of the total landings values ($USD). In 2009, over 10 million pounds each of spotted seatrout and red drum were harvested through Louisiana’s recreational fishery, accounting for approximately 63% and 76% of the total U.S. reported catch (http://www.st.nmfs.noaa.gov/st1/).
The analysis for this report was largely based on the fishery sections from the 1998 Caernarvon Freshwater Diversion Biological Monitoring Postconstruction Report (USACOE 1998). The report evaluated species distributional changes between the pre- and post- construction periods for the Caernarvon Freshwater Diversion. For this report, mean monthly values of species catch for the entire basin, and at the individual sampling stations, were calculated and plotted over time to identify changes in species abundance patterns and
4
distribution over years and among the defined operational periods for Caernarvon (pre-operation: 1988-1991; post-operation: 1992-1994; long-term post-operation before Hurricane Katrina: 1995-2005; long-term post-operation after Katrina: 2006-2010). In addition to the plots of monthly species abundances and distributions, the annual mean catch per unit effort (CPUE) for the species in Breton Sound was plotted to evaluate the system-wide patterns. The average monthly species CPUEs were also plotted against the monthly salinity recordings at the stations, across years and within years, to evaluate the relationships between species catch distribution and salinity. The relationships between the monthly catch and salinity values at the stations were further examined using simple correlative statistics to support the identification of potential changes in species distribution due to salinity. Plots and simple correlative statistics were also used to examine if the monthly salinity at the stations over time was related to the monthly operational flow from Caernarvon and/or the Mississippi River stage.
Only the associated salinity data collected with the LDWF species samples were used in this analysis because salinity is thought to be the main environmental variable affected by the diversion flow, and largely responsible for determining species distributions within the basin. Other studies that analyzed the relationships between species abundances and biomasses and the associated environmental data collected by LDWF (e.g., Haas et al. 2001, de Mutsert 2010, Alford 2010) showed that salinity significantly affected some of the species abundance and biomass patterns in the estuaries. The other environmental variables collected with the samples showed too little variation across the estuary (e.g., turbidity), or were driven more by seasonal differences (i.e., temperature) than what could conclusively be related to discharge from the freshwater diversions (Alford 2010).
Mississippi River stage was the only variable besides the Caernarvon discharge evaluated for affecting salinity at the sampling stations. The river stage data were also included in the USACOE 1998 report on Caernarvon, and the stage data were easily accessible for incorporation into this report. The potential significance of the Mississippi River in affecting the isohaline structures of Barataria Basin and Breton Sound has been previously recognized by scientists (LDNR 2005, LDNR 2006, USACOE 1998). There are likely other variables (e.g., precipitation, tides, overbank flooding, other freshwater sources, frontal passages and strong winds) that affect the salinity structure and the resultant species distributions in Breton Sound. These variables were not examined for this report due to data limitations and unavailability.
The results from this report can be used for describing the abundance patterns and distributions of the five fishery species based on the existing conditions in Breton Sound and the first twenty years of operation for Caernarvon. Expanding upon the distributional analysis from the 1998 USACOE report allowed re-evaluation of the species results that were based on the pre- and post-construction periods for Caernarvon. As modifications to Caernarvon operation are implemented in the future, and other efforts are planned for coastal restoration in Breton Sound, the existing dynamics of the estuary will most likely change. Results from the analysis can be
5
used for comparison with similar data collected on fishery species under future conditions to evaluate the additive effects of the coastal restoration efforts on the species within the estuary.
METHODS
Caernarvon Freshwater Diversion operation and Mississippi River stage
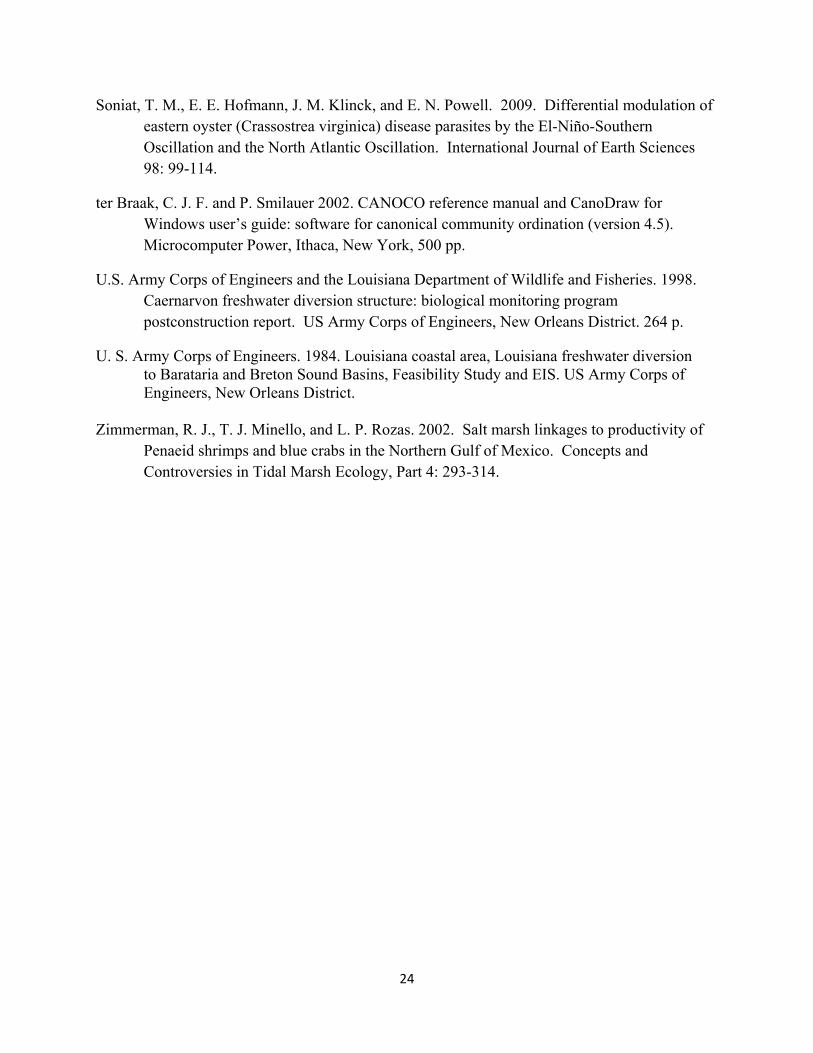
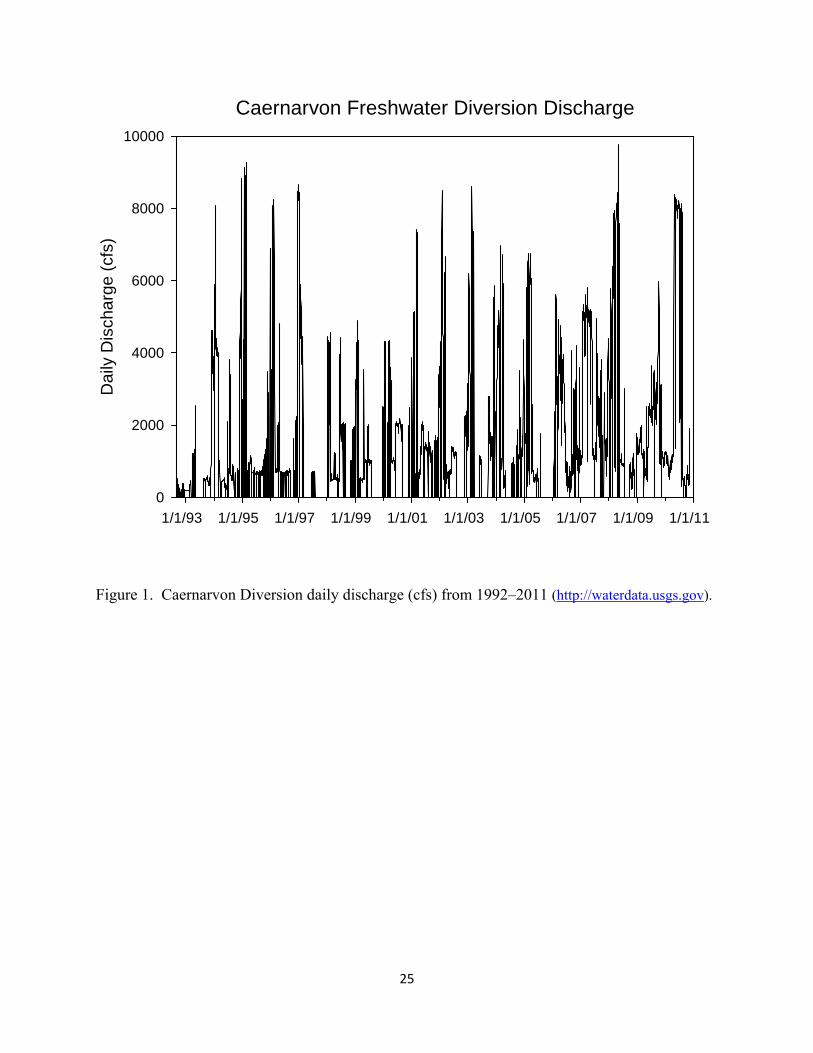
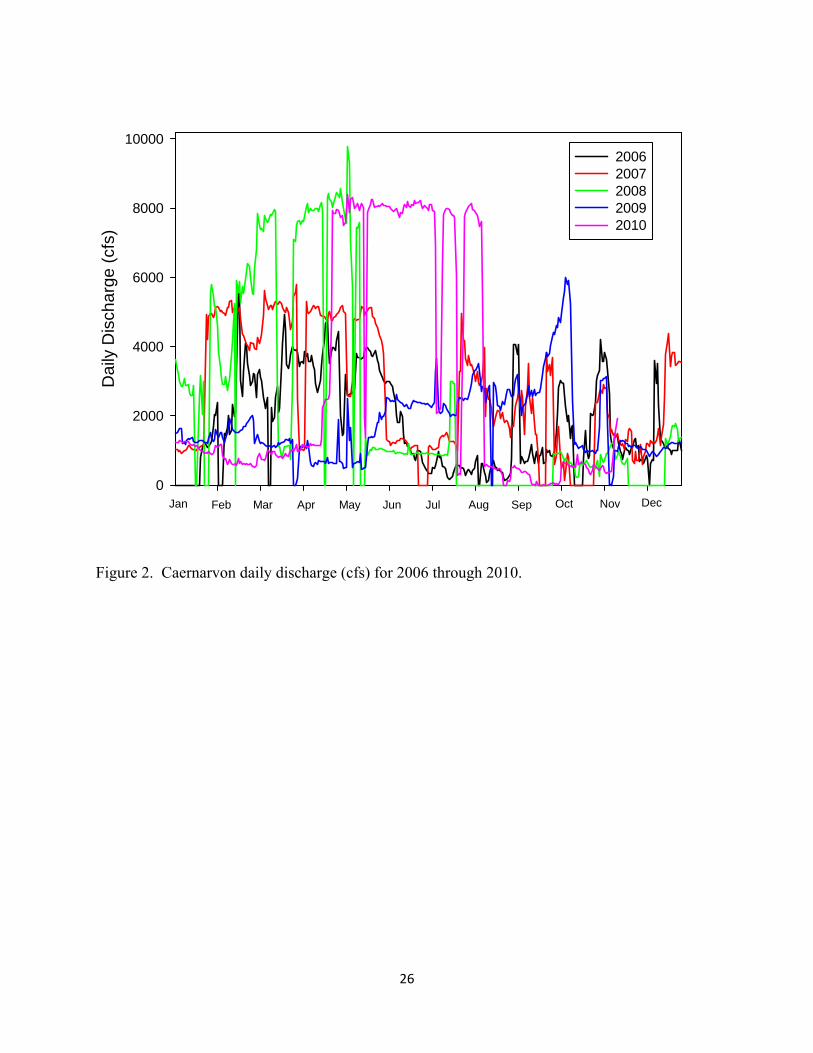
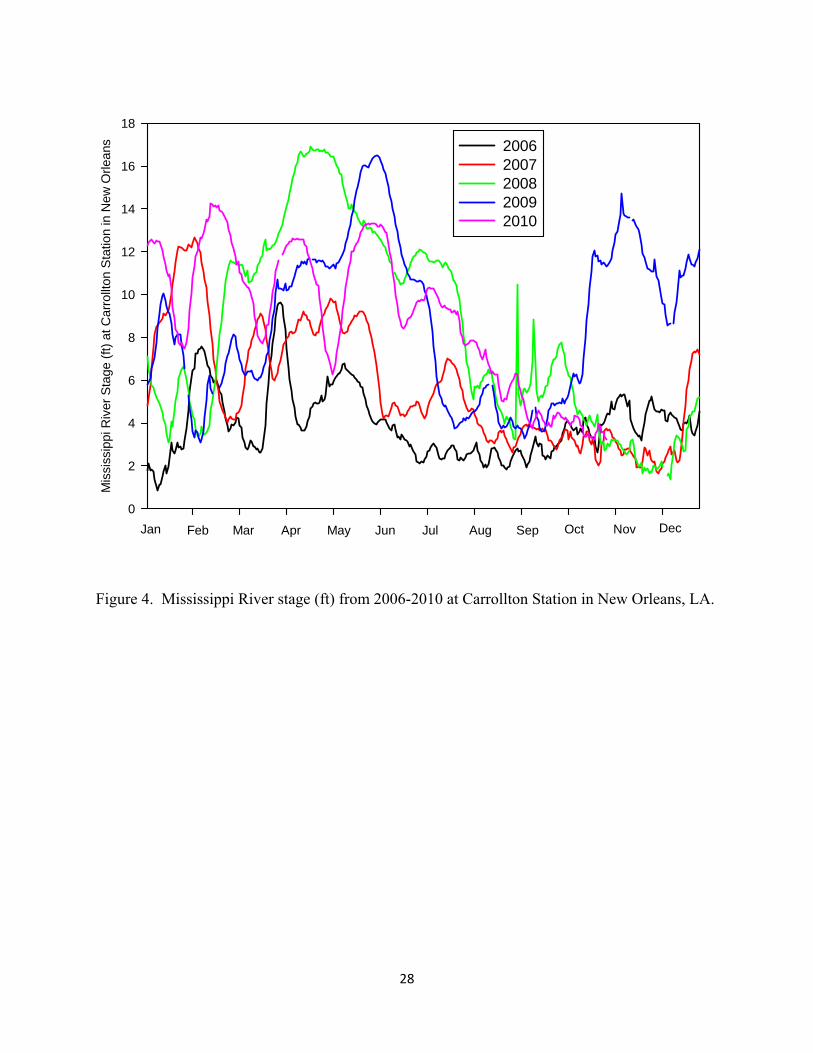
Caernarvon discharge was plotted from 1992 through January 2011 (Figure 1), and for 2006 through 2010 in order to more clearly depict the operational flow over the most recent years (Figure 2). Mississippi River stage was plotted from 1988 through 2011 (Figure 3), and again for 2006 through 2010 to more clearly depict the river stage in recent years (Figure 4). The time series plots for the most recent years contain a drought year (2006) and two wet years (2008 and 2009), and 2010 when the diversion was operated at nearly continuous high discharge from April through August in response to the BP Deepwater Horizon oil spill.
For this report, structure operation for Caernarvon was defined by four operational periods. The pre-operation period was from 1988 through July, 1991. The post-operation period was from August 1991 through 1994. For simplicity, the pre-operation period in this report is hereafter defined as 1988-1991, and the post-operation period as 1992-1994. The long-term post-operation period was from 1995-2010, and was further divided between 1995-2005 and 2006-2010. The division in the long-term period was not because of a change in diversion operation, but rather to account for the large-scale damage and restructuring of the estuarine marshes due to Hurricane Katrina passing directly over the area on August 29, 2005. A storm surge estimated between 15-25 feet went through Breton Sound, directly destroying an estimated 41 square miles of marsh, and overturning or denuding existing marsh areas and re-depositing the marsh fragments into previously open-water ponds and channels (LDNR 2006).
The Caernarvon discharge and Mississippi River stage were averaged by month for each year to evaluate the potential effects from each freshwater delivery system on the mean monthly salinities recorded at the LDWF sampling stations in the estuary over the years.
Salinity
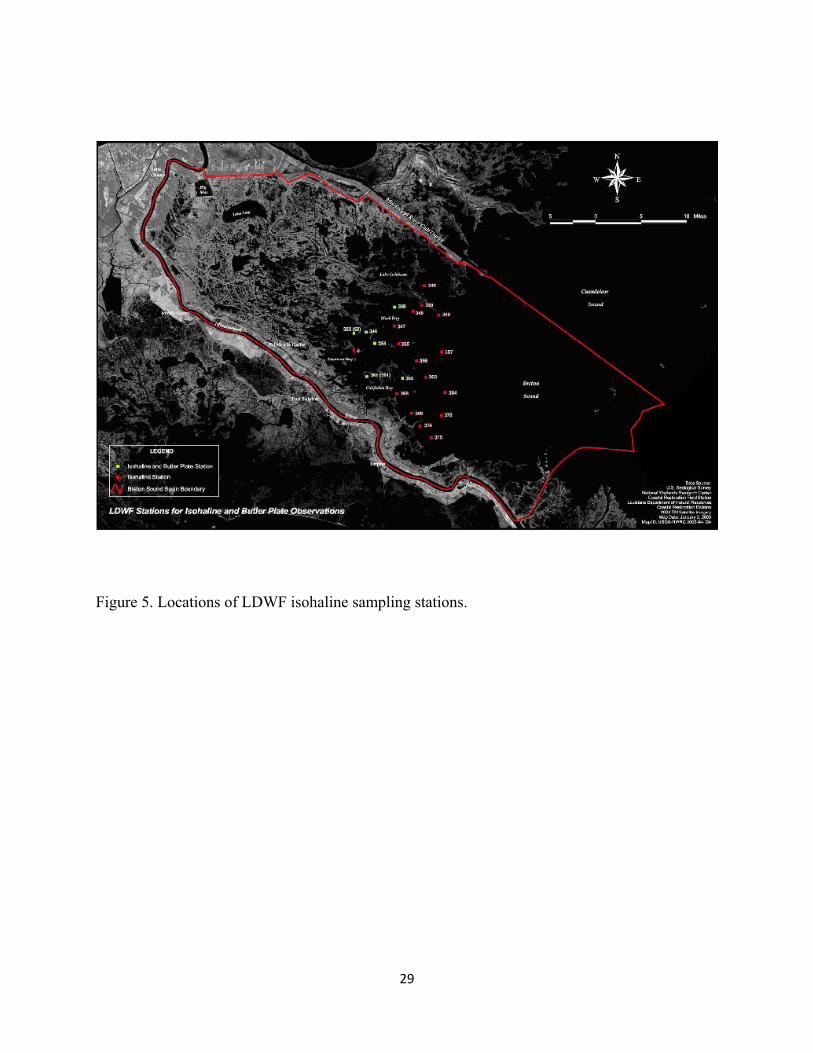
Salinity measurements were collected with all LDWF fisheries-independent monitoring samples, with exception of the meter square samples used to estimate oyster production on the public oyster grounds. No salinity measurements were taken with the meter square samples. Salinity measurements were taken by LDWF at the isohaline stations (Figure 5) located throughout the public oyster grounds. The salinity measurements taken in conjunction with the LDWF monitoring samples were used for this report. Salinity measurements taken by the isohaline stations were used with the oyster meter square samples. The salinity optimums for

6
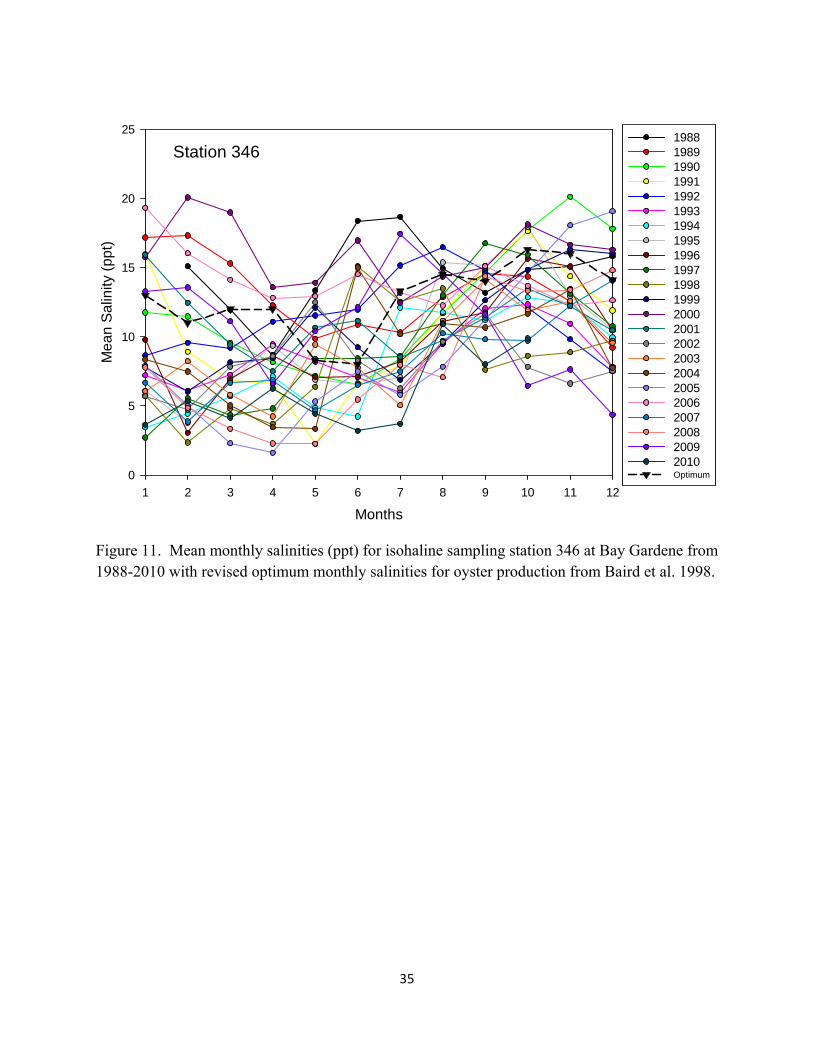
oyster production (Chatry et al. 1983) that were revised in the USACOE 1998 report were plotted with the monthly salinities for isohaline station 346 at Bay Gardene (see Figure 5) to demonstrate the variation around the salinity optimums by month and year at the oyster grounds.
The associated salinity data from each sampling station were averaged by months for each year in order to evaluate the relationship with species catch at the stations within years for the entire estuary, and over time for each station. The monthly salinity values for each station were also evaluated for relationships with the mean monthly Caernarvon discharge and the Mississippi River stage.
Fisheries-independent sampling of key fishery species
The meter square samples were used to assess the abundance and distribution of eastern oysters in Breton Sound. The meter square samples were collected at 27 stations once per year, in June or July, by LDWF biologists on the public oyster grounds (Figure 6). The biologists remove and count all live and dead seed and sack oysters within two to three randomly-placed replicate meter square samples for each of the 27 stations. LDWF uses the meter square samples to estimate the total annual number of seed and sack oysters on the public reefs. For this report, annual oyster production was estimated for the public grounds by summing the number of seed and sack oysters counted in all meter square samples across the stations (LDNR 2006).
50’ bag seine samples (Figure 7) were used to assess the distribution of abundance of small juvenile brown and white shrimp, and blue crab in the marsh. The seines are pulled from a distance of approximately 100 feet parallel and toward the shoreline. The seine samples are collected monthly from January through August, and twice monthly from September through December, at six stations in Breton Sound (LDWF 2002). The seine samples also capture small fishes and crustaceans that live in the marsh, and incidentally catch young-of-year (YOY) red drum and other YOY predatory species that use the shallow marshes as nursery grounds for feeding and protection. The abundance of red drum YOY caught within the seine samples was to be assessed for this report, but only 328 total fish were collected in the seines from 1988-2010 so distributional analysis was not performed.
Otter trawls were used in Breton Sound (Figure 8) to assess the distribution and abundance of brown and white shrimp, and blue crab. The 6’ and 16’ otter trawls were used for brown and white shrimp. The 16’ otter trawls were used for blue crab. The otter trawls are towed for 10 minutes in a weaving or circular pattern. The 6’ otter trawls sample the bottoms of shallow bayous and bays. The samples are taken weekly at eleven stations from March through October by LDWF. The trawls are primarily used to set the inshore shrimp seasons by monitoring brown shrimp abundance and size during the spring months, and then monitoring the relative proportion of young white shrimp caught in the summer to close brown shrimp season in order to protect the young whites until the fall season opens. The 16’ otter trawls sample the
7
bottom in the deeper waters of the outer marsh. The samples are taken at four stations weekly from March through October, and bi-weekly from November through February. Shrimp catch in the trawls is used to estimate relative abundance of adult brown and white shrimp in the estuary, and to help set the inshore shrimp seasons from March through October. Larger juvenile blue crabs are captured incidentally but at relatively high numbers in the 16’ trawls.
Gillnets were used throughout Breton Sound (Figure 7) to assess the distribution of adult spotted seatrout abundance. A gillnet is deployed parallel to a shoreline or reef, or in a crescent shape, and then the boat circles the net three times and in a tightening pattern to force the fish to strike the net. The gillnet samples are collected monthly from October through March, and twice monthly from April through September, at six stations in the estuary. Gillnet sampling is generally used to estimate the relative abundance of large juvenile and adult fishes (seatrout ≥ 200 mm in gillnets) in the estuary. Adult red drum were caught at too low numbers in gillnets (1,602 total fish) from 1988-2010 to perform a distributional analysis for the species.
Analysis of species abundance patterns and distribution
The results for species abundance patterns and distribution collected from each gear type are described using a series of four plots. (1) The annual CPUE for Breton Sound was plotted over years in order to demonstrate the trend in abundance over time for the system. These annual plots are also useful as references for comparison with other studies and reports on Breton Sound and similar estuarine systems along Louisiana. (2) Mean monthly CPUE for Breton Sound was plotted over years to demonstrate the seasonal catch distribution for the species, and identify possible changes in the seasonal distribution from year to year. (3) Mean species catch at each station during the pre-operation (1988-1991), the post-operation (1992-1994), and the long-term post-operation monitoring periods before (1995-2005) and after (2006-2010) Hurricane Katrina for the Caernarvon Diversion was plotted to identify differences in the species catch at the stations among the operational periods. We looked for consistent increases or reductions in catch between the pre-operation and the post-operation periods. (4) Mean monthly species CPUE in those months of peak abundance (May for brown shrimp, October for white shrimp, February and June for blue crab, July for spotted seatrout) was plotted against the mean monthly salinity for each station from 1988-2010. The monthly plots of species CPUE vs. salinity were used to demonstrate the differences between the annual catch at the stations, and support the differences identified within the station plots of species catch for the Caernarvon operational periods (3). The monthly plots also were used to demonstrate the differences in species catch among the stations, and to show the extent of the relationship between species catch and salinity at the individual stations in years and over time.
To support the conclusions drawn from the graphical demonstrations of the monthly CPUE vs. salinity, the extent of the relationships were further examined using simple statistical

8
tests (ANOVA and regression in SAS v 9.2). Plots and simple correlative methods were also used to examine the relationship between monthly species CPUE and salinity across the stations within a given year, and the relationship between the monthly salinity at the individual stations and the operational flow from Caernarvon and/or the Mississippi River stage over time. For all cases in which the relationships between the monthly averaged values were significant (P < 0.05), the result was stated. Example plots of the monthly CPUE and salinity across the stations within given years, and of the monthly salinity at a given station vs. Caernarvon discharge over time, are presented for demonstration using the brown shrimp CPUE at the 6’ trawl stations.
RESULTS
Eastern Oyster Production
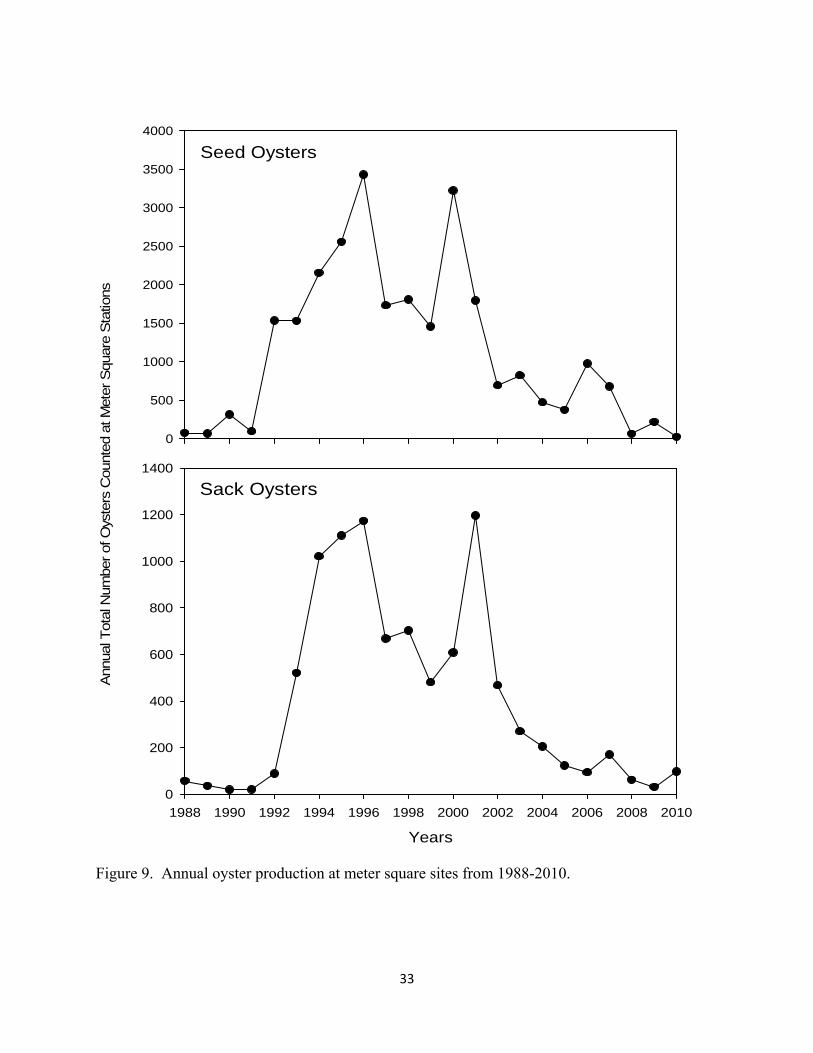
The annual seed oyster production at the meter square stations increased greatly from the pre-operation years to show high production during the post-construction period through about 2002, and then decreased to low annual production in 2008-2010 (Figure 9). The overall pattern in the annual sack oyster production at the meter square stations was very similar to that demonstrated for the seed oysters, showing a large peak in production from about 1993-2002 and a gradual decrease through 2010 (Figure 9).
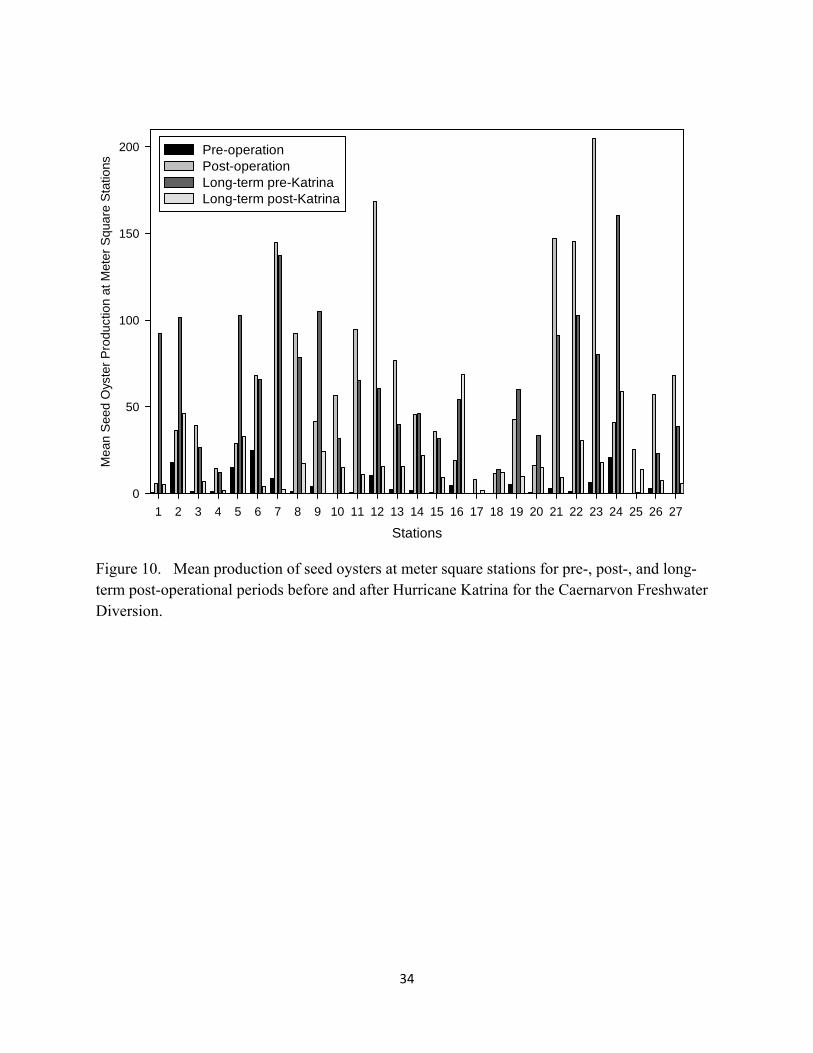
The pattern in seed oyster counts at the 27 meter square stations among the operational periods for Caernarvon were generally consistent with each other (Figure 10), and with the pattern observed for the annual production over time (Figure 9). Mean oyster counts were usually highest during the post-operation and long-term post-operation period before Katrina at nearly all of the stations (Figure 10). Oyster counts were similarly low across stations for the pre-operation and post-operation period following Hurricane Katrina.
The collective annual means for the salinities at the Bay Gardene isohaline station (Figure 11) were approximately 12.5 ppt for the pre-operation period, 9.4 ppt for the post-operation period, 9.8 ppt for the long-term pre-Katrina period, and 9.4 ppt for the long-term post-Katrina period. The years 1990, 2000, and 2006 had the highest monthly salinities (approximate minimum of 10 ppt, approximate maximum of 20 ppt). 2010 showed the lowest monthly salinities with a mean, minimum and maximum monthly salinity equal to 5.9, 3.2, and 10.9 ppt. Most years had a minimum monthly salinity between 3-4 ppt, and a maximum salinity between 16-17 ppt. Thus, the years of low oyster production were not necessarily commensurate with those previous and same years that had monthly salinities largely different than the defined optimums for oyster production.
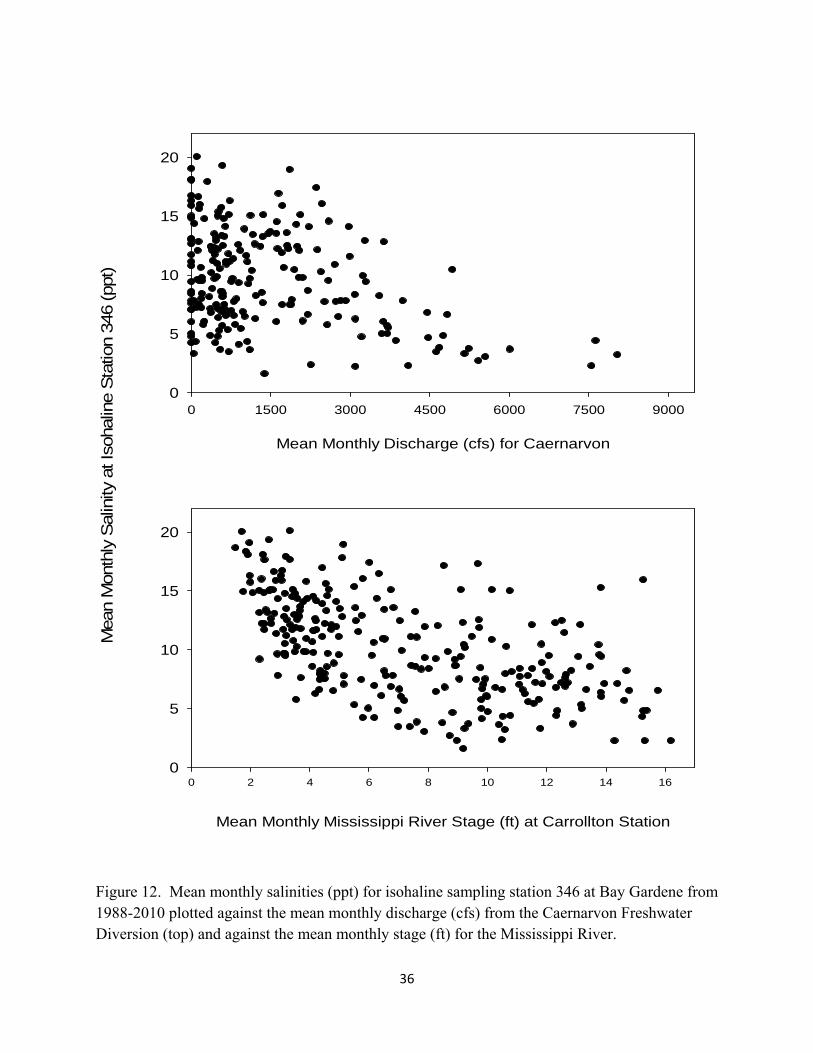
The mean monthly salinities at the Bay Gardene isohaline station were negatively related (P < 0.0001) to the mean monthly discharge from Caernarvon (R2 = 0.13) and the Mississippi
9
River stage (R2 = 0.33) values (Figure 12). The scatter plots indicated a relatively high degree of confounding effects on the monthly averaged salinities for the Bay Gardene station.
Brown Shrimp
Seines
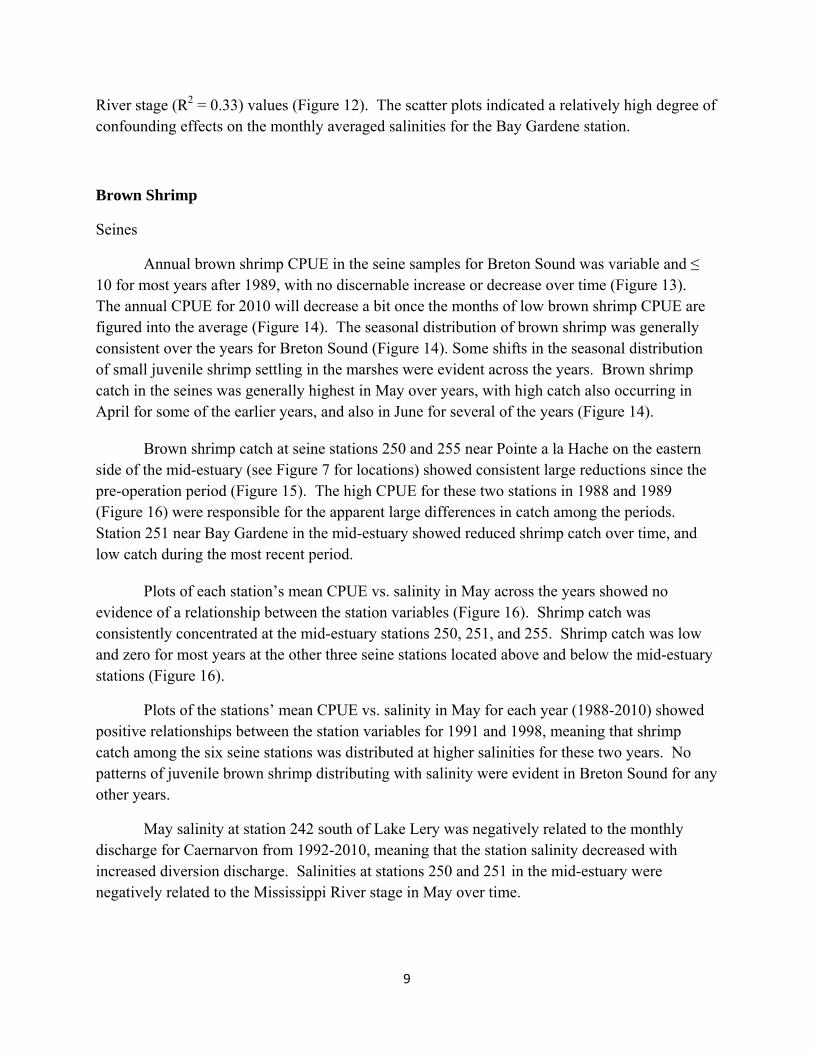
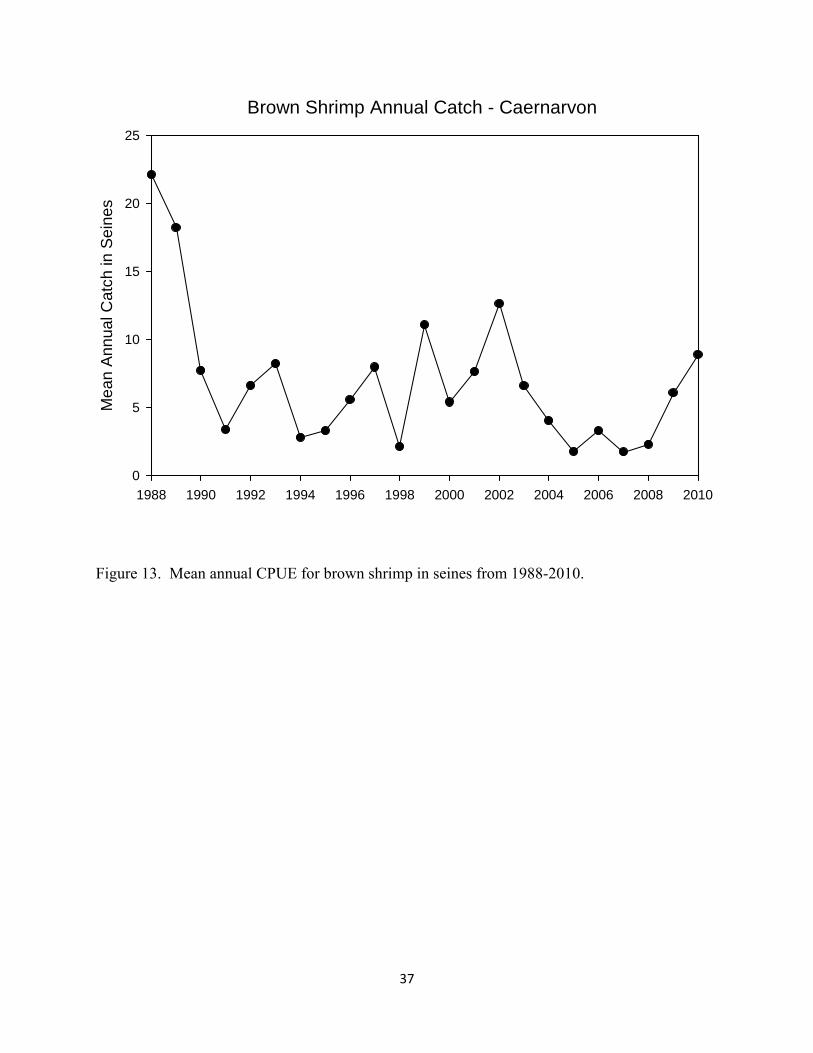
Annual brown shrimp CPUE in the seine samples for Breton Sound was variable and ≤ 10 for most years after 1989, with no discernable increase or decrease over time (Figure 13). The annual CPUE for 2010 will decrease a bit once the months of low brown shrimp CPUE are figured into the average (Figure 14). The seasonal distribution of brown shrimp was generally consistent over the years for Breton Sound (Figure 14). Some shifts in the seasonal distribution of small juvenile shrimp settling in the marshes were evident across the years. Brown shrimp catch in the seines was generally highest in May over years, with high catch also occurring in April for some of the earlier years, and also in June for several of the years (Figure 14).
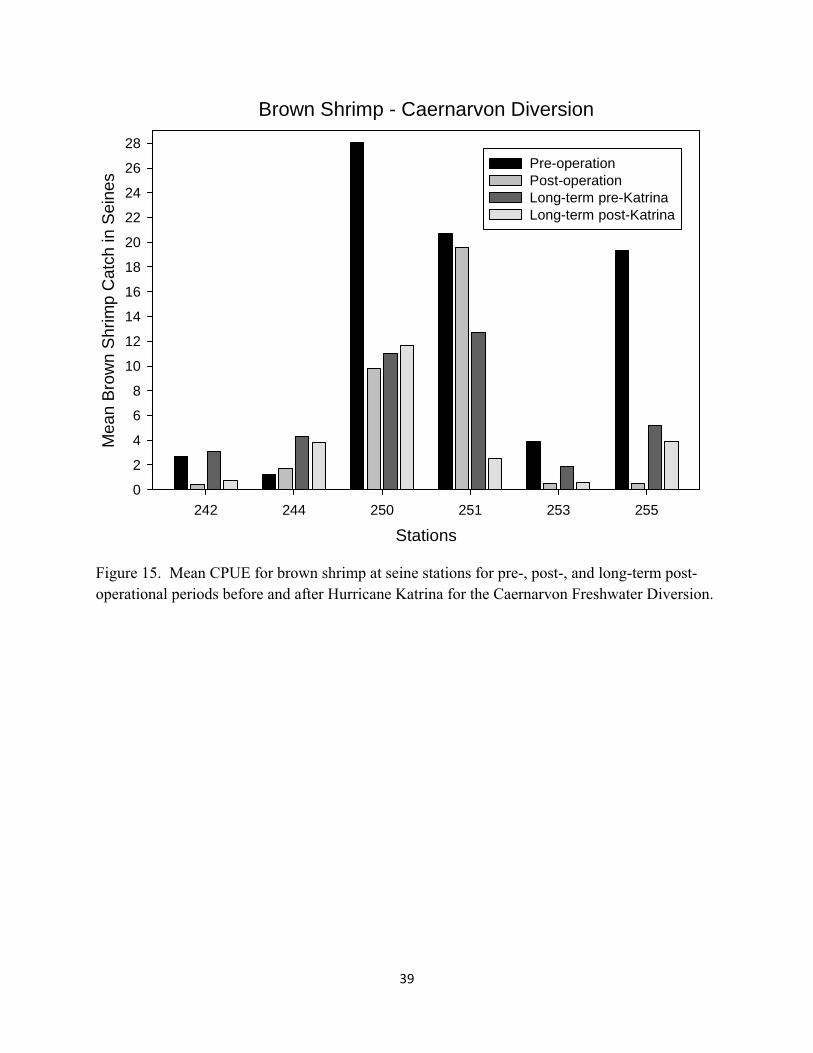
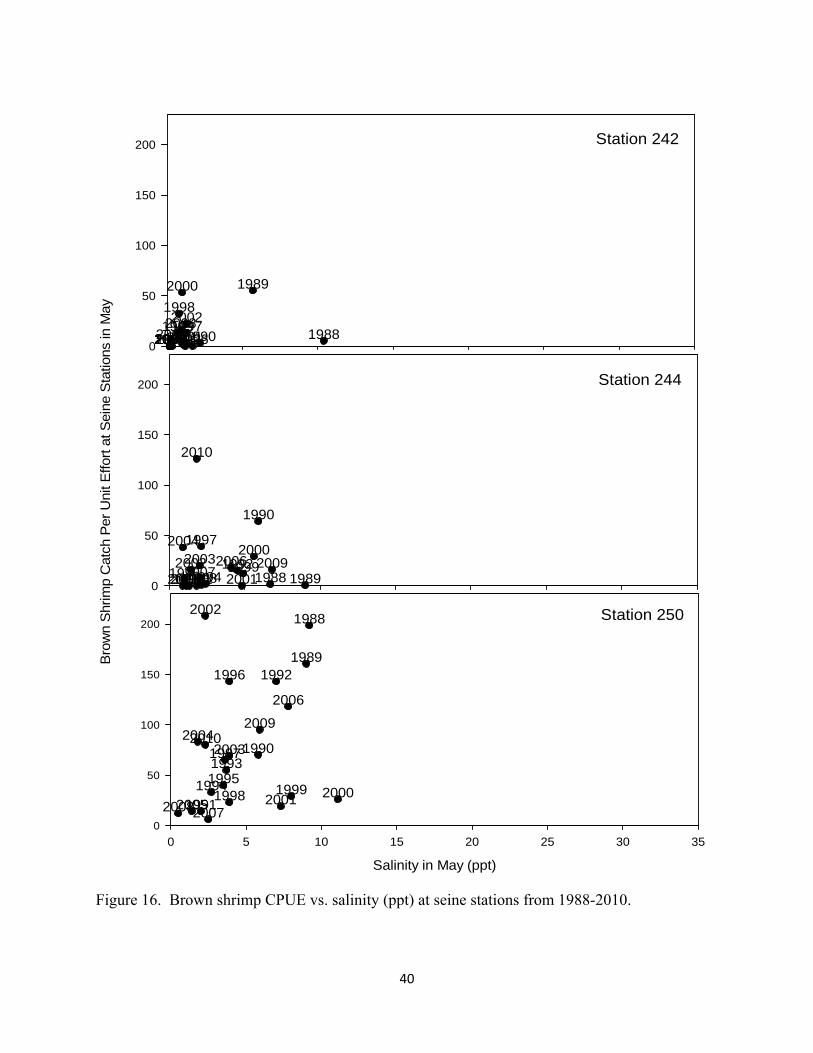
Brown shrimp catch at seine stations 250 and 255 near Pointe a la Hache on the eastern side of the mid-estuary (see Figure 7 for locations) showed consistent large reductions since the pre-operation period (Figure 15). The high CPUE for these two stations in 1988 and 1989 (Figure 16) were responsible for the apparent large differences in catch among the periods. Station 251 near Bay Gardene in the mid-estuary showed reduced shrimp catch over time, and low catch during the most recent period.
Plots of each station’s mean CPUE vs. salinity in May across the years showed no evidence of a relationship between the station variables (Figure 16). Shrimp catch was consistently concentrated at the mid-estuary stations 250, 251, and 255. Shrimp catch was low and zero for most years at the other three seine stations located above and below the mid-estuary stations (Figure 16).
Plots of the stations’ mean CPUE vs. salinity in May for each year (1988-2010) showed positive relationships between the station variables for 1991 and 1998, meaning that shrimp catch among the six seine stations was distributed at higher salinities for these two years. No patterns of juvenile brown shrimp distributing with salinity were evident in Breton Sound for any other years.
May salinity at station 242 south of Lake Lery was negatively related to the monthly discharge for Caernarvon from 1992-2010, meaning that the station salinity decreased with increased diversion discharge. Salinities at stations 250 and 251 in the mid-estuary were negatively related to the Mississippi River stage in May over time.
10
6’ Trawls
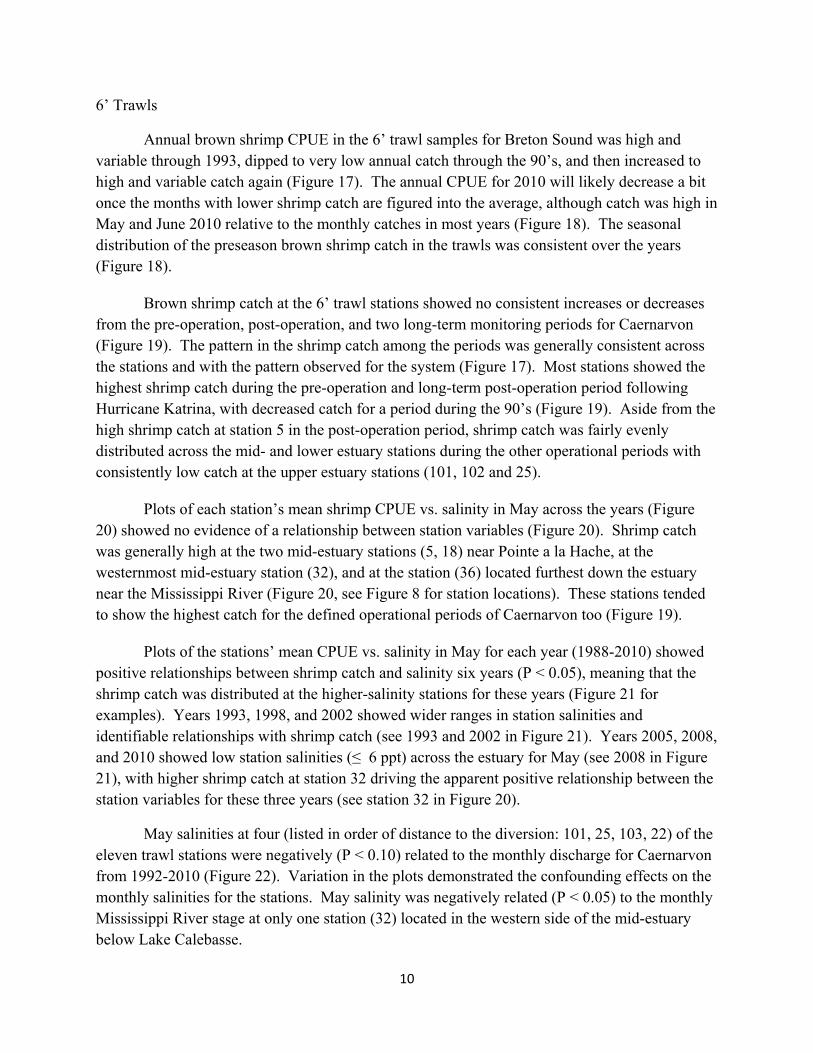
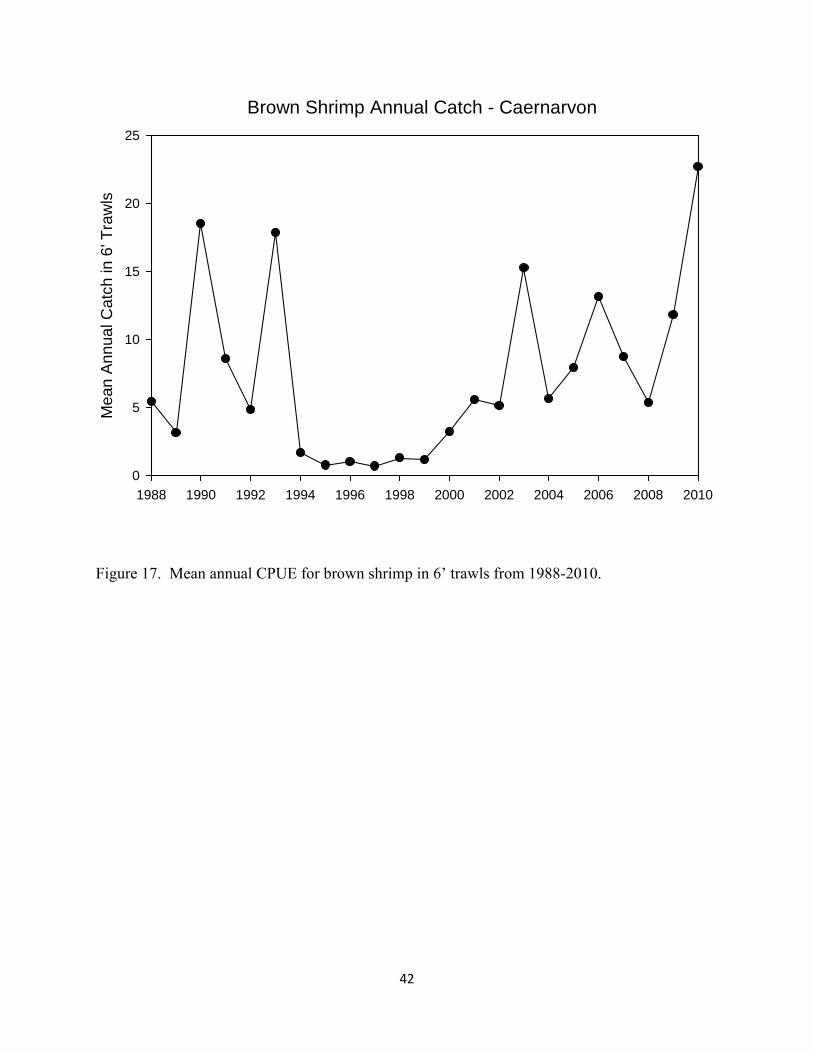
Annual brown shrimp CPUE in the 6’ trawl samples for Breton Sound was high and variable through 1993, dipped to very low annual catch through the 90’s, and then increased to high and variable catch again (Figure 17). The annual CPUE for 2010 will likely decrease a bit once the months with lower shrimp catch are figured into the average, although catch was high in May and June 2010 relative to the monthly catches in most years (Figure 18). The seasonal distribution of the preseason brown shrimp catch in the trawls was consistent over the years (Figure 18).
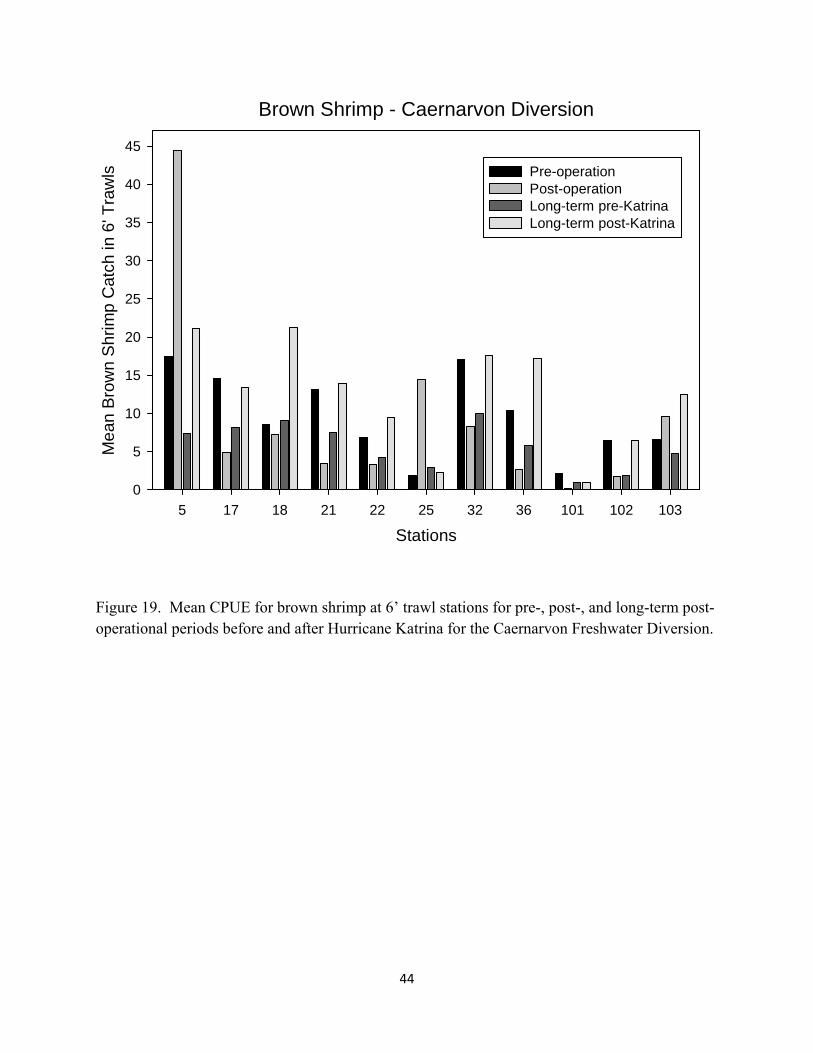
Brown shrimp catch at the 6’ trawl stations showed no consistent increases or decreases from the pre-operation, post-operation, and two long-term monitoring periods for Caernarvon (Figure 19). The pattern in the shrimp catch among the periods was generally consistent across the stations and with the pattern observed for the system (Figure 17). Most stations showed the highest shrimp catch during the pre-operation and long-term post-operation period following Hurricane Katrina, with decreased catch for a period during the 90’s (Figure 19). Aside from the high shrimp catch at station 5 in the post-operation period, shrimp catch was fairly evenly distributed across the mid- and lower estuary stations during the other operational periods with consistently low catch at the upper estuary stations (101, 102 and 25).
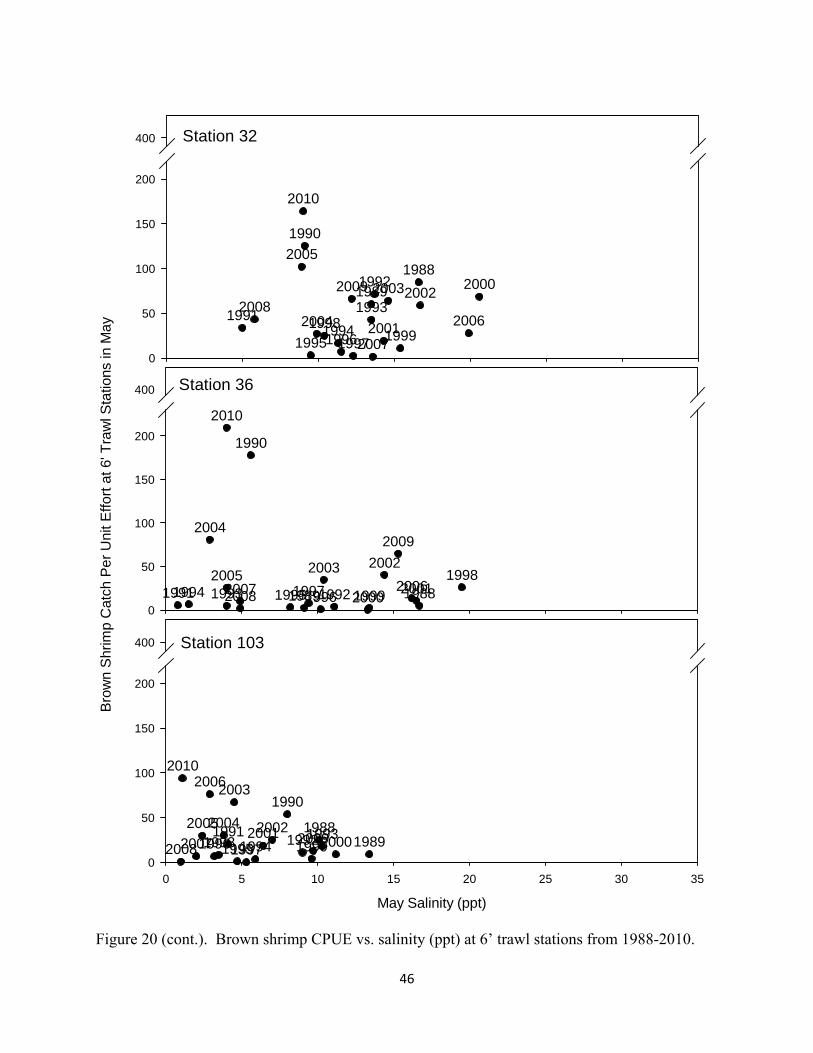
Plots of each station’s mean shrimp CPUE vs. salinity in May across the years (Figure 20) showed no evidence of a relationship between station variables (Figure 20). Shrimp catch was generally high at the two mid-estuary stations (5, 18) near Pointe a la Hache, at the westernmost mid-estuary station (32), and at the station (36) located furthest down the estuary near the Mississippi River (Figure 20, see Figure 8 for station locations). These stations tended to show the highest catch for the defined operational periods of Caernarvon too (Figure 19).
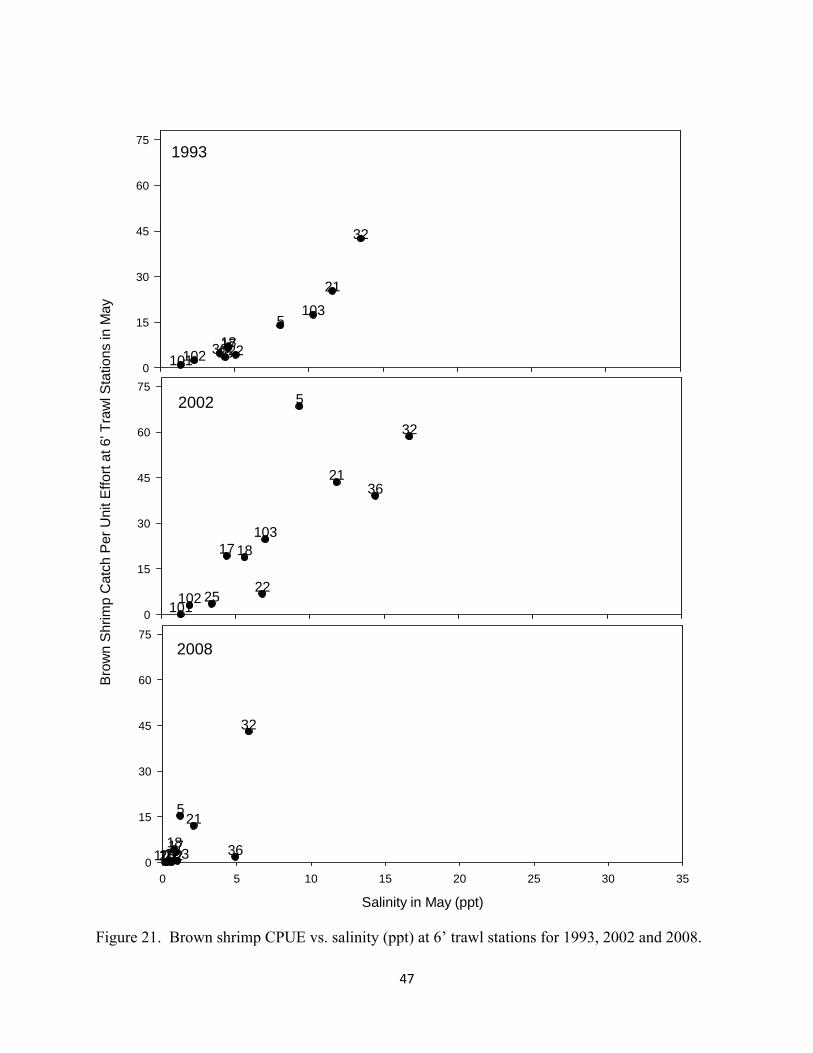
Plots of the stations’ mean CPUE vs. salinity in May for each year (1988-2010) showed positive relationships between shrimp catch and salinity six years (P < 0.05), meaning that the shrimp catch was distributed at the higher-salinity stations for these years (Figure 21 for examples). Years 1993, 1998, and 2002 showed wider ranges in station salinities and identifiable relationships with shrimp catch (see 1993 and 2002 in Figure 21). Years 2005, 2008, and 2010 showed low station salinities (≤ 6 ppt) across the estuary for May (see 2008 in Figure 21), with higher shrimp catch at station 32 driving the apparent positive relationship between the station variables for these three years (see station 32 in Figure 20).
May salinities at four (listed in order of distance to the diversion: 101, 25, 103, 22) of the eleven trawl stations were negatively (P < 0.10) related to the monthly discharge for Caernarvon from 1992-2010 (Figure 22). Variation in the plots demonstrated the confounding effects on the monthly salinities for the stations. May salinity was negatively related (P < 0.05) to the monthly Mississippi River stage at only one station (32) located in the western side of the mid-estuary below Lake Calebasse.
11
16’ Trawls
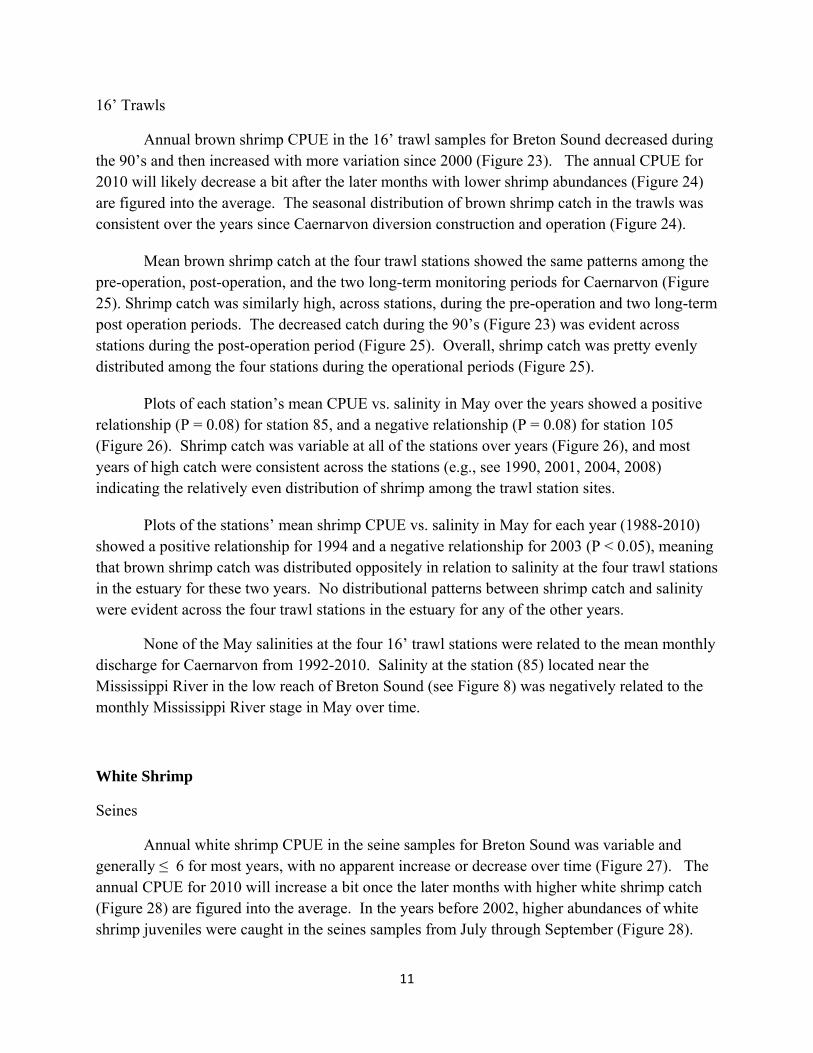
Annual brown shrimp CPUE in the 16’ trawl samples for Breton Sound decreased during the 90’s and then increased with more variation since 2000 (Figure 23). The annual CPUE for 2010 will likely decrease a bit after the later months with lower shrimp abundances (Figure 24) are figured into the average. The seasonal distribution of brown shrimp catch in the trawls was consistent over the years since Caernarvon diversion construction and operation (Figure 24).
Mean brown shrimp catch at the four trawl stations showed the same patterns among the pre-operation, post-operation, and the two long-term monitoring periods for Caernarvon (Figure 25). Shrimp catch was similarly high, across stations, during the pre-operation and two long-term post operation periods. The decreased catch during the 90’s (Figure 23) was evident across stations during the post-operation period (Figure 25). Overall, shrimp catch was pretty evenly distributed among the four stations during the operational periods (Figure 25).
Plots of each station’s mean CPUE vs. salinity in May over the years showed a positive relationship (P = 0.08) for station 85, and a negative relationship (P = 0.08) for station 105 (Figure 26). Shrimp catch was variable at all of the stations over years (Figure 26), and most years of high catch were consistent across the stations (e.g., see 1990, 2001, 2004, 2008) indicating the relatively even distribution of shrimp among the trawl station sites.
Plots of the stations’ mean shrimp CPUE vs. salinity in May for each year (1988-2010) showed a positive relationship for 1994 and a negative relationship for 2003 (P < 0.05), meaning that brown shrimp catch was distributed oppositely in relation to salinity at the four trawl stations in the estuary for these two years. No distributional patterns between shrimp catch and salinity were evident across the four trawl stations in the estuary for any of the other years.
None of the May salinities at the four 16’ trawl stations were related to the mean monthly discharge for Caernarvon from 1992-2010. Salinity at the station (85) located near the Mississippi River in the low reach of Breton Sound (see Figure 8) was negatively related to the monthly Mississippi River stage in May over time.
White Shrimp
Seines
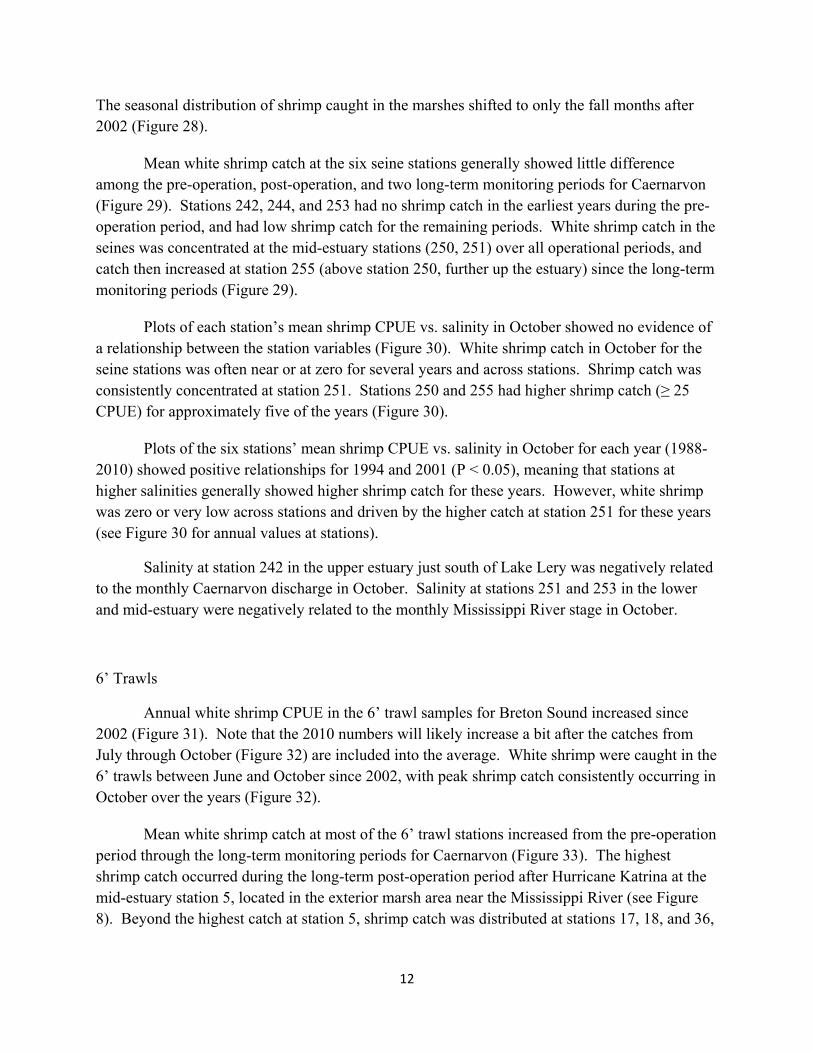
Annual white shrimp CPUE in the seine samples for Breton Sound was variable and generally ≤ 6 for most years, with no apparent increase or decrease over time (Figure 27). The annual CPUE for 2010 will increase a bit once the later months with higher white shrimp catch (Figure 28) are figured into the average. In the years before 2002, higher abundances of white shrimp juveniles were caught in the seines samples from July through September (Figure 28).
12
The seasonal distribution of shrimp caught in the marshes shifted to only the fall months after 2002 (Figure 28).
Mean white shrimp catch at the six seine stations generally showed little difference among the pre-operation, post-operation, and two long-term monitoring periods for Caernarvon (Figure 29). Stations 242, 244, and 253 had no shrimp catch in the earliest years during the pre-operation period, and had low shrimp catch for the remaining periods. White shrimp catch in the seines was concentrated at the mid-estuary stations (250, 251) over all operational periods, and catch then increased at station 255 (above station 250, further up the estuary) since the long-term monitoring periods (Figure 29).
Plots of each station’s mean shrimp CPUE vs. salinity in October showed no evidence of a relationship between the station variables (Figure 30). White shrimp catch in October for the seine stations was often near or at zero for several years and across stations. Shrimp catch was consistently concentrated at station 251. Stations 250 and 255 had higher shrimp catch (≥ 25 CPUE) for approximately five of the years (Figure 30).
Plots of the six stations’ mean shrimp CPUE vs. salinity in October for each year (1988-2010) showed positive relationships for 1994 and 2001 (P < 0.05), meaning that stations at higher salinities generally showed higher shrimp catch for these years. However, white shrimp was zero or very low across stations and driven by the higher catch at station 251 for these years (see Figure 30 for annual values at stations).
Salinity at station 242 in the upper estuary just south of Lake Lery was negatively related to the monthly Caernarvon discharge in October. Salinity at stations 251 and 253 in the lower and mid-estuary were negatively related to the monthly Mississippi River stage in October.
6’ Trawls
Annual white shrimp CPUE in the 6’ trawl samples for Breton Sound increased since 2002 (Figure 31). Note that the 2010 numbers will likely increase a bit after the catches from July through October (Figure 32) are included into the average. White shrimp were caught in the 6’ trawls between June and October since 2002, with peak shrimp catch consistently occurring in October over the years (Figure 32).
Mean white shrimp catch at most of the 6’ trawl stations increased from the pre-operation period through the long-term monitoring periods for Caernarvon (Figure 33). The highest shrimp catch occurred during the long-term post-operation period after Hurricane Katrina at the mid-estuary station 5, located in the exterior marsh area near the Mississippi River (see Figure 8). Beyond the highest catch at station 5, shrimp catch was distributed at stations 17, 18, and 36,
13
all nearest station 5 and located along a transect near the river, and at stations 21 and 32, located on the opposite side of the mid-estuary near Lake Calebasse.
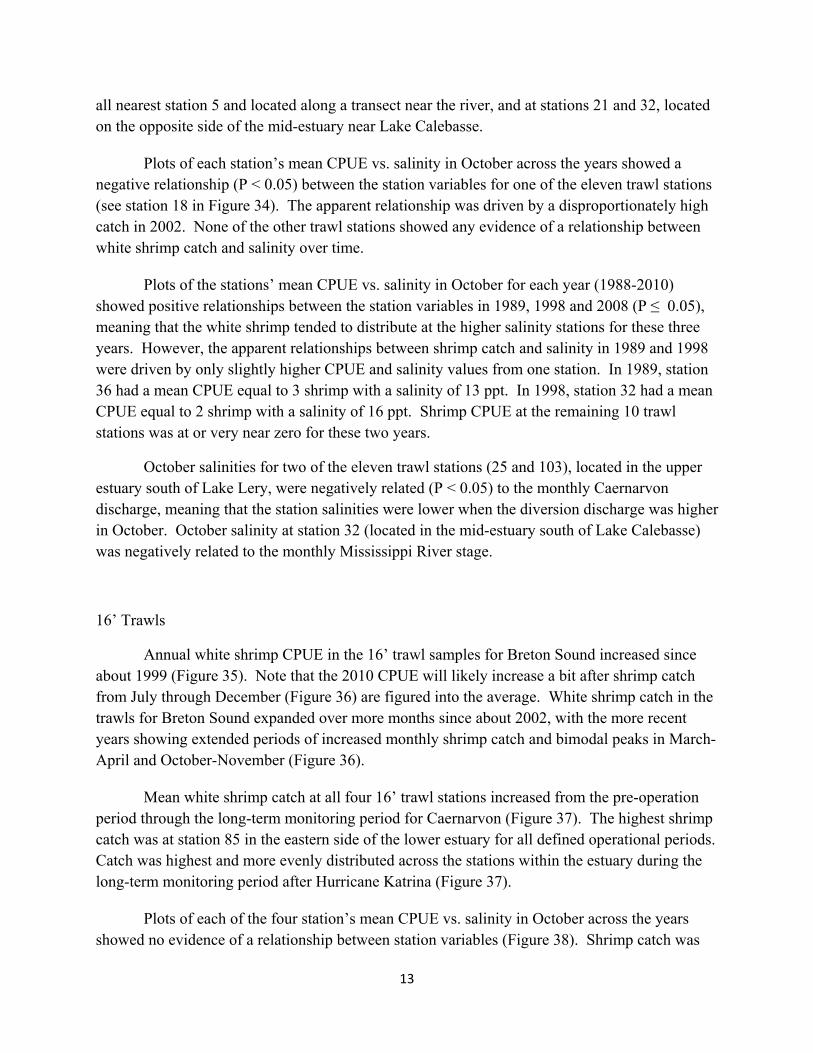
Plots of each station’s mean CPUE vs. salinity in October across the years showed a negative relationship (P < 0.05) between the station variables for one of the eleven trawl stations (see station 18 in Figure 34). The apparent relationship was driven by a disproportionately high catch in 2002. None of the other trawl stations showed any evidence of a relationship between white shrimp catch and salinity over time.
Plots of the stations’ mean CPUE vs. salinity in October for each year (1988-2010) showed positive relationships between the station variables in 1989, 1998 and 2008 (P ≤ 0.05), meaning that the white shrimp tended to distribute at the higher salinity stations for these three years. However, the apparent relationships between shrimp catch and salinity in 1989 and 1998 were driven by only slightly higher CPUE and salinity values from one station. In 1989, station 36 had a mean CPUE equal to 3 shrimp with a salinity of 13 ppt. In 1998, station 32 had a mean CPUE equal to 2 shrimp with a salinity of 16 ppt. Shrimp CPUE at the remaining 10 trawl stations was at or very near zero for these two years.
October salinities for two of the eleven trawl stations (25 and 103), located in the upper estuary south of Lake Lery, were negatively related (P < 0.05) to the monthly Caernarvon discharge, meaning that the station salinities were lower when the diversion discharge was higher in October. October salinity at station 32 (located in the mid-estuary south of Lake Calebasse) was negatively related to the monthly Mississippi River stage.
16’ Trawls
Annual white shrimp CPUE in the 16’ trawl samples for Breton Sound increased since about 1999 (Figure 35). Note that the 2010 CPUE will likely increase a bit after shrimp catch from July through December (Figure 36) are figured into the average. White shrimp catch in the trawls for Breton Sound expanded over more months since about 2002, with the more recent years showing extended periods of increased monthly shrimp catch and bimodal peaks in March-April and October-November (Figure 36).
Mean white shrimp catch at all four 16’ trawl stations increased from the pre-operation period through the long-term monitoring period for Caernarvon (Figure 37). The highest shrimp catch was at station 85 in the eastern side of the lower estuary for all defined operational periods. Catch was highest and more evenly distributed across the stations within the estuary during the long-term monitoring period after Hurricane Katrina (Figure 37).
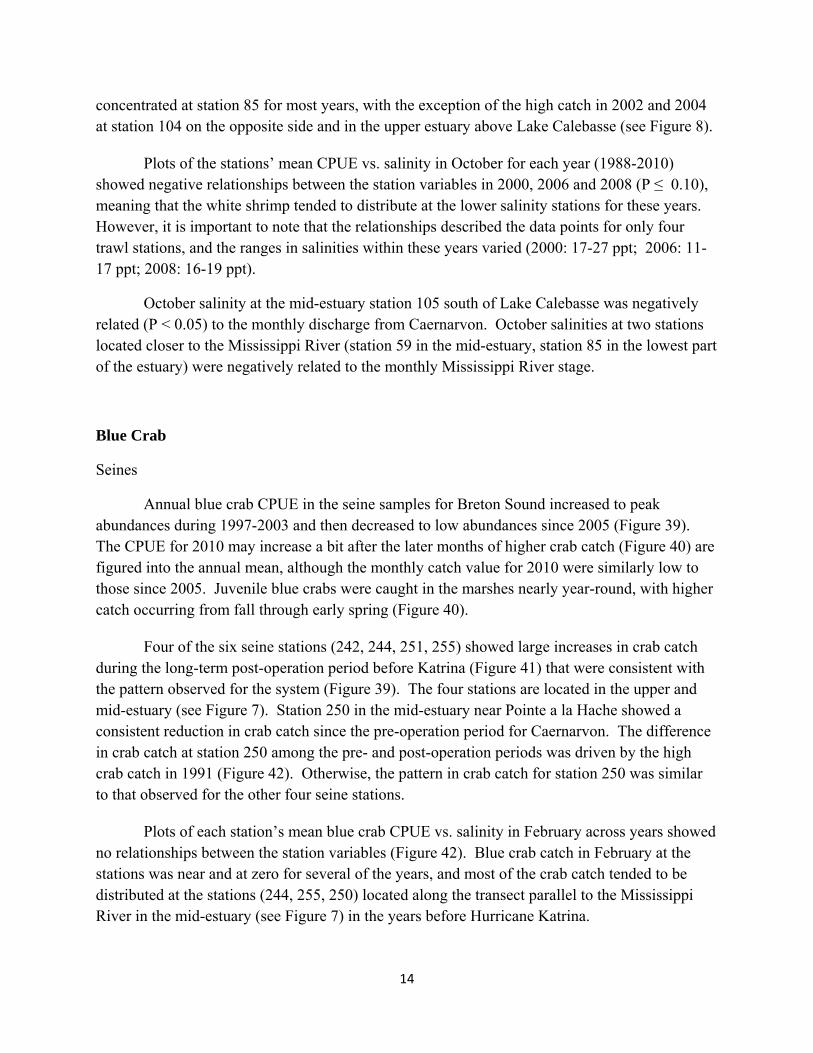
Plots of each of the four station’s mean CPUE vs. salinity in October across the years showed no evidence of a relationship between station variables (Figure 38). Shrimp catch was
14
concentrated at station 85 for most years, with the exception of the high catch in 2002 and 2004 at station 104 on the opposite side and in the upper estuary above Lake Calebasse (see Figure 8).
Plots of the stations’ mean CPUE vs. salinity in October for each year (1988-2010) showed negative relationships between the station variables in 2000, 2006 and 2008 (P ≤ 0.10), meaning that the white shrimp tended to distribute at the lower salinity stations for these years. However, it is important to note that the relationships described the data points for only four trawl stations, and the ranges in salinities within these years varied (2000: 17-27 ppt; 2006: 11-17 ppt; 2008: 16-19 ppt).
October salinity at the mid-estuary station 105 south of Lake Calebasse was negatively related (P < 0.05) to the monthly discharge from Caernarvon. October salinities at two stations located closer to the Mississippi River (station 59 in the mid-estuary, station 85 in the lowest part of the estuary) were negatively related to the monthly Mississippi River stage.
Blue Crab
Seines
Annual blue crab CPUE in the seine samples for Breton Sound increased to peak abundances during 1997-2003 and then decreased to low abundances since 2005 (Figure 39). The CPUE for 2010 may increase a bit after the later months of higher crab catch (Figure 40) are figured into the annual mean, although the monthly catch value for 2010 were similarly low to those since 2005. Juvenile blue crabs were caught in the marshes nearly year-round, with higher catch occurring from fall through early spring (Figure 40).
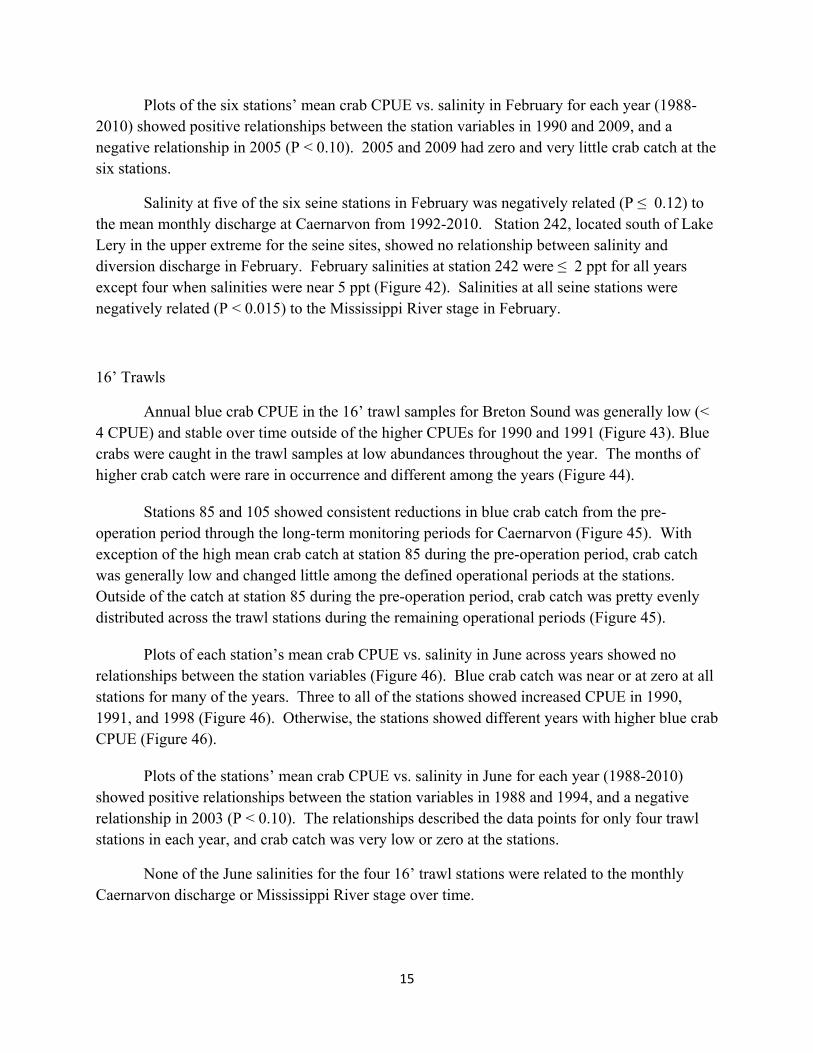
Four of the six seine stations (242, 244, 251, 255) showed large increases in crab catch during the long-term post-operation period before Katrina (Figure 41) that were consistent with the pattern observed for the system (Figure 39). The four stations are located in the upper and mid-estuary (see Figure 7). Station 250 in the mid-estuary near Pointe a la Hache showed a consistent reduction in crab catch since the pre-operation period for Caernarvon. The difference in crab catch at station 250 among the pre- and post-operation periods was driven by the high crab catch in 1991 (Figure 42). Otherwise, the pattern in crab catch for station 250 was similar to that observed for the other four seine stations.
Plots of each station’s mean blue crab CPUE vs. salinity in February across years showed no relationships between the station variables (Figure 42). Blue crab catch in February at the stations was near and at zero for several of the years, and most of the crab catch tended to be distributed at the stations (244, 255, 250) located along the transect parallel to the Mississippi River in the mid-estuary (see Figure 7) in the years before Hurricane Katrina.
15
Plots of the six stations’ mean crab CPUE vs. salinity in February for each year (1988-2010) showed positive relationships between the station variables in 1990 and 2009, and a negative relationship in 2005 (P < 0.10). 2005 and 2009 had zero and very little crab catch at the six stations.
Salinity at five of the six seine stations in February was negatively related (P ≤ 0.12) to the mean monthly discharge at Caernarvon from 1992-2010. Station 242, located south of Lake Lery in the upper extreme for the seine sites, showed no relationship between salinity and diversion discharge in February. February salinities at station 242 were ≤ 2 ppt for all years except four when salinities were near 5 ppt (Figure 42). Salinities at all seine stations were negatively related (P < 0.015) to the Mississippi River stage in February.
16’ Trawls
Annual blue crab CPUE in the 16’ trawl samples for Breton Sound was generally low (< 4 CPUE) and stable over time outside of the higher CPUEs for 1990 and 1991 (Figure 43). Blue crabs were caught in the trawl samples at low abundances throughout the year. The months of higher crab catch were rare in occurrence and different among the years (Figure 44).
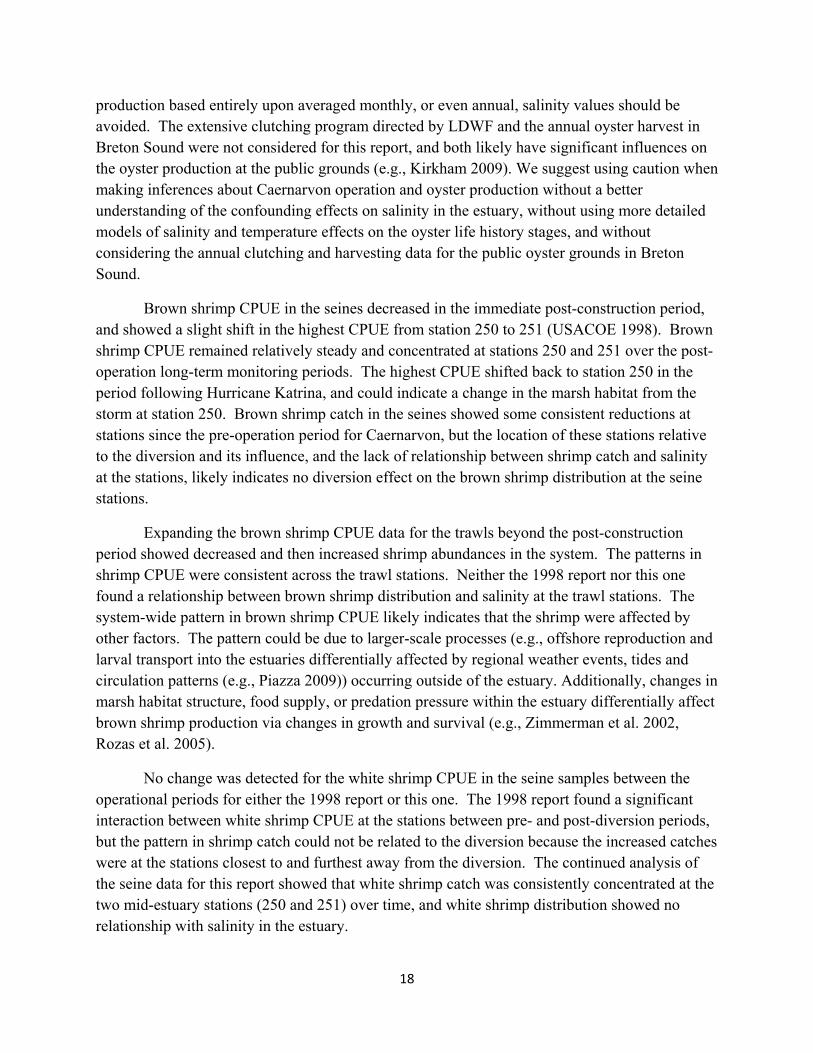
Stations 85 and 105 showed consistent reductions in blue crab catch from the pre-operation period through the long-term monitoring periods for Caernarvon (Figure 45). With exception of the high mean crab catch at station 85 during the pre-operation period, crab catch was generally low and changed little among the defined operational periods at the stations. Outside of the catch at station 85 during the pre-operation period, crab catch was pretty evenly distributed across the trawl stations during the remaining operational periods (Figure 45).
Plots of each station’s mean crab CPUE vs. salinity in June across years showed no relationships between the station variables (Figure 46). Blue crab catch was near or at zero at all stations for many of the years. Three to all of the stations showed increased CPUE in 1990, 1991, and 1998 (Figure 46). Otherwise, the stations showed different years with higher blue crab CPUE (Figure 46).
Plots of the stations’ mean crab CPUE vs. salinity in June for each year (1988-2010) showed positive relationships between the station variables in 1988 and 1994, and a negative relationship in 2003 (P < 0.10). The relationships described the data points for only four trawl stations in each year, and crab catch was very low or zero at the stations.
None of the June salinities for the four 16’ trawl stations were related to the monthly Caernarvon discharge or Mississippi River stage over time.

16
Spotted Seatrout
Gillnets
Annual spotted seatrout CPUE in the gillnet samples for Breton Sound was generally low over time (≤ 3 CPUE for most years) with no apparent increase or decrease in abundance since Caernarvon was constructed and began operation (Figure 47). The annual CPUE for 2010 will likely increase a bit once the later months with continued seatrout catch (Figure 48) are figured into the average. Seatrout were caught in the gillnet samples at relatively low numbers nearly year-round for all years (Figure 48).
Only one (station 206) of the six gillnet stations showed a consistent change in seatrout catch from the pre-operation period to the post-operation periods (Figure 49). Seatrout catch was concentrated at the four stations in the mid- and lower estuary (206, 209, 212, 213) during the post-operation monitoring periods for Caervarvon, and catch was similarly low at the interior stations in the upper estuary (202 and 203) over time (see Figure 7).
Plots of each station’s mean seatrout CPUE vs. salinity in July across years showed one (202) of the six stations had a positive relationship between the variables (Figure 50). Station 202 is located furthest up in the estuary below Lake Lery, and usually had salinities ≤ 2 ppt. Adult seatrout were caught at the station in 1988 and 1989 when July salinities were ≥ 10 ppt. Seatrout catch in the gillnets was very low or zero for most years at all stations except station 213, located furthest down the estuary. Stations 206 and 212, located above and in Black Bay in the mid-estuary, had four and five years of higher (≥ 4 CPUE) seatrout catch (Figure 50).
Plots of the stations’ mean spotted seatrout CPUE vs. salinity in July for each year showed positive relationships with the station salinities (P < 0.05) for most of the years (14 out of 23 years), meaning that the seatrout were distributed at the higher-salinity stations for these years.
Station 212 located in the mid-estuary at Black Bay was the only gillnet station to show a negative relationship (P = 0.005) between its July salinity recordings and the mean monthly discharge from Caernarvon for 1992-2010. None of the salinities in July at the six gillnet stations were related to the monthly Mississippi River stage.
Red Drum
Seines
A total of 328 red drum were caught in the Breton Sound seine samples from 1988-2010. Low to no drum catch over time in the system (Figure 51) precluded a meaningful distributional analysis of the juvenile red drum abundance in the seine stations for Breton Sound.

17
SUMMARY OF RESULTS
The results of the species abundance and distributional analysis are summarized in Table 1.
DISCUSSION
There were no strong, consistent salinity effects due to the Caernarvon Diversion operation on the abundance patterns or distributions of the five fishery species in Breton Sound based on our analysis of the LDWF fisheries-independent monitoring data. The analysis showed that during the time Caernarvon was constructed and operating, some species appeared to increase (e.g., white shrimp in the trawls), or decrease then increase (e.g., brown shrimp in trawls), or increase then decrease (e.g., eastern oysters, blue crab in trawls) in the system, while some species distributed at sampling stations based on salinity in certain years or over time (e.g., spotted seatrout in gillnets). However, the patterns for the species were not commensurate with the diversion operation periods, and the salinity changes at the sampling stations were rarely were related to the species catch.
Expanding the analysis of the LDWF monitoring data for the five fishery species beyond the immediate post-construction period allowed for comparison and re-evaluation of the species results demonstrated in the original report (USACOE 1998). The expanded analysis of the monitoring data for the long-term post-operation periods showed different abundance and distribution patterns for some of the species compared to what the original distributional analysis demonstrated for the species in relation to Caernarvon.
Seed oyster production was reported to increase greatly during the post-construction period and shift towards the eastward-located stations on the public oyster grounds (USACOE 1998). Seed oyster production remained very high and more concentrated at the eastward stations for another seven years beyond 1994, but then decreased sharply and remained low across the public grounds since 2002. Monthly salinity at the Bay Gardene isohaline station was negatively related to Caernarvon discharge and Mississippi River stage over time, but the plots indicated a high degree of confounding effects on the salinities, and there was little detectable difference between the monthly salinity regimes at the station among the three post-operational periods.
Because the timing of the peak production of oysters in Breton Sound was not necessarily coincident with the Caernarvon operation, nor was it sufficiently described by the monthly salinities over years, a more extensive analysis of the oyster production in the system is recommended. The interaction between salinity and temperature on the vital rates of oyster life stages is complex (La Peyre et al. 2009, Soniat et al. 2009), and inferences about oyster
18
production based entirely upon averaged monthly, or even annual, salinity values should be avoided. The extensive clutching program directed by LDWF and the annual oyster harvest in Breton Sound were not considered for this report, and both likely have significant influences on the oyster production at the public grounds (e.g., Kirkham 2009). We suggest using caution when making inferences about Caernarvon operation and oyster production without a better understanding of the confounding effects on salinity in the estuary, without using more detailed models of salinity and temperature effects on the oyster life history stages, and without considering the annual clutching and harvesting data for the public oyster grounds in Breton Sound.
Brown shrimp CPUE in the seines decreased in the immediate post-construction period, and showed a slight shift in the highest CPUE from station 250 to 251 (USACOE 1998). Brown shrimp CPUE remained relatively steady and concentrated at stations 250 and 251 over the post-operation long-term monitoring periods. The highest CPUE shifted back to station 250 in the period following Hurricane Katrina, and could indicate a change in the marsh habitat from the storm at station 250. Brown shrimp catch in the seines showed some consistent reductions at stations since the pre-operation period for Caernarvon, but the location of these stations relative to the diversion and its influence, and the lack of relationship between shrimp catch and salinity at the stations, likely indicates no diversion effect on the brown shrimp distribution at the seine stations.
Expanding the brown shrimp CPUE data for the trawls beyond the post-construction period showed decreased and then increased shrimp abundances in the system. The patterns in shrimp CPUE were consistent across the trawl stations. Neither the 1998 report nor this one found a relationship between brown shrimp distribution and salinity at the trawl stations. The system-wide pattern in brown shrimp CPUE likely indicates that the shrimp were affected by other factors. The pattern could be due to larger-scale processes (e.g., offshore reproduction and larval transport into the estuaries differentially affected by regional weather events, tides and circulation patterns (e.g., Piazza 2009)) occurring outside of the estuary. Additionally, changes in marsh habitat structure, food supply, or predation pressure within the estuary differentially affect brown shrimp production via changes in growth and survival (e.g., Zimmerman et al. 2002, Rozas et al. 2005).
No change was detected for the white shrimp CPUE in the seine samples between the operational periods for either the 1998 report or this one. The 1998 report found a significant interaction between white shrimp CPUE at the stations between pre- and post-diversion periods, but the pattern in shrimp catch could not be related to the diversion because the increased catches were at the stations closest to and furthest away from the diversion. The continued analysis of the seine data for this report showed that white shrimp catch was consistently concentrated at the two mid-estuary stations (250 and 251) over time, and white shrimp distribution showed no relationship with salinity in the estuary.
19
The increased catch of white shrimp in the trawl samples around 2000 surpassed the increase noted between the pre- and post-operation periods from the 1998 report. The shrimp catch consistently increased over the operational periods across the trawl stations. There was little evidence of a relationship between white shrimp CPUE and salinity at the trawl stations over time or within years. The system-wide pattern in the white shrimp CPUE, and the lack of a relationship between the shrimp CPUE and salinity in the estuary, likely indicate that other factors inside and outside of Breton Sound were affecting the white shrimp abundances.
Expanding the blue crab CPUE data for the seines beyond the post-construction period indicated a larger system-wide pattern that was not commensurate with diversion operation. The pattern for blue crab may be better described by habitat changes at the seine sites due to Hurricane Katrina and/or larger-scale processes affecting blue crab post-larval supply and settlement in the system. The 1998 report stated that crab catch increased at the most interior stations and decreased at the most seaward station. Blue crab catch remained concentrated at the more interior seine stations in the mid-estuary over time, but a large difference between the catch for the long-term periods pre- and post-Katrina at the stations could indicate changes in the marsh habitat that affected the crab catch. There was no relationship between blue crab distribution and salinity at the seine stations found for either report.
Similar to the 1998 report, the extended analysis of blue crab CPUE in the 16’ trawl samples showed no changes in crab distribution over time or in relation to salinity. Aside from 1990 and 1991, blue crab CPUE in the trawl samples was low and relatively steady over time in Breton Sound.
The reported reduction in seatrout CPUE in the gillnet samples between the pre- and post-operation periods (USACOE 1998) disappeared with the expanded data analysis from this report. Highest seatrout catch was always at the most exterior stations located within the higher salinity areas of the mid- and lower estuary. The reported reduction in catch at the upper estuary sites for the immediate post-operation period was consistent over the long-term post-operation periods, but seatrout catch was always low at these interior sites, and salinities at the gillnet stations were not related to the monthly Caernarvon discharge or river stage over time.
Red drum catch was reported for gillnets and seines in the 1998 report. It was noted that catch was sporadic and low at the stations during the pre- and post-operation periods. Red drum catch remained sporadic and low in the seines (328 total fish) and gillnets (1,602 total fish) over time, precluding a meaningful distributional analysis of the species in the estuary. Previous multivariate analyses on community composition and species biomasses using BACI-type designs to evaluate the effects of the Caernarvon and Davis Pond diversions pre- and post-operation have found differences for red drum in the LDWF seine samples (Alford 2010, de Mutsert 2010).

20
The monthly discharge from Caernarvon was shown to differentially affect the monthly salinities at some of the LDWF monitoring stations. Monthly salinities at the Bay Gardene isohaline station showed some relation to the Caernarvon discharge and to the Mississippi River stage over time. However, the monthly plots indicated a high degree of confounding effects on the salinities, meaning other factors (e.g., tides, frontal passages, precipitation, overbank flooding) are masking and/or exaggerating the influence of the diversion discharge in the estuary. Seine station 242 south of Lake Lery often showed relationships between its monthly salinity and discharge from Caernarvon, and salinities for nearly all of the seine stations in February showed some relationship with the monthly Caernarvon discharge and Mississippi River stage. Some of the 6’ trawl stations in the upper and mid-estuary showed differential salinity effects from Caernarvon discharge. It is difficult to determine the extent to which Caernarvon discharge affects salinities at the LDWF stations based on the discrete measurements taken at weekly to monthly intervals with the monitoring samples. Still, it is likely possible that changes in the LDWF station salinities in the upper and mid-estuary will be detected if operational flow from Caernarvon is increased and sustained over periods of time.
Monthly salinity at some of the monitoring stations located in the low and mid-estuary was often related to the monthly Mississippi River stage. The Mississippi River stage data were incorporated into this report because they were easily accessible, and they were incorporated into the previous distributional analysis for Caernarvon (USACOE 1998). We are careful not to draw any inferences on how the river stage affects salinities in the estuary since the mechanisms remain unclear at this point. River discharge from the Mississippi and differential transport of the freshwater into the system by currents and tides are being examined through modeling and tracer studies (C. Li, pers. Comm.). The apparent relationships between salinity and river stage could be more of an effect of seasonal weather patterns and climate (i.e., high river stage coincident with periods of increased rainfall). Other freshwater delivery channels and overbank flooding from the Mississippi River could cause differential changes in salinity at the stations based on their proximity to the freshwater sources.
There are other effects due to the diversion operation aside from salinity that could potentially change species abundance patterns and distributions in the receiving basin. Some earlier studies have suggested that species abundance patterns in the marshes are likely more affected by nutrients delivered from the diverted water that affect food supply and increase SAV habitat (Rozas et al. 2005; Day et al. 2009), or by the changes in marsh flooding and species habitat use due to increased water levels (e.g., Piazza and La Peyre 2007, Piazza 2009). These diversion effects are more likely to be measured for the marsh nekton species in the areas most influenced by the diversion (e.g., outflow channels and ponding areas near the diversion) rather than from the LDWF monitoring samples.
The correlative methods (ANOVA and linear regression techniques in SAS 9.2) used to support the inferences drawn from the graphical results which demonstrated the changes in species CPUE in relation to salinity were by no means an extensive statistical analysis of the
21
data. It is important to note that the length of data used (i.e., minimum of 4 and a maximum of 11 sampling stations within years) to evaluate the relationships between the monthly species catch and salinity in the estuary was short. The range in monthly species CPUE (often between 0-1) and salinity at the stations was often very small. The models used in this report are not complete since they do not consider all of the possible factors when evaluating the species abundance and distribution changes in Breton Sound, and were only meant to examine the possibility of the diversion flow affecting salinity to describe any possible changes in the distribution of species in the estuary.
Employing other statistical methods to the LDWF monitoring data could possibly detect meaningful changes in species abundance patterns and distributions over time and in relation to the environmental conditions in Breton Sound, although we remind readers to use caution when looking for causal relationships and effects in variable monitoring data that has not been designed to specifically test for these effects and relationships. Other parametric and non-parametric statistical methods have been used for evaluating changes in species abundance patterns and distributions using the LDWF long-term monitoring data. Haas et al. (2001) compared three univariate statistical methods (multiple linear regression, Bayesian model averaging, and additive nonlinear relationships using generalized additive models) for examining the relationships between annual abundances of juvenile brown shrimp and environmental variables collected within the LDWF trawl samples over the combined coastal study areas (including Breton Sound and Barataria Basin) from 1970-1997. Multivariate analyses can also be used to test for and demonstrate differences (e.g., MANOVA, biplots) or relationships (e.g., CCA, PCA) between the variables of several species (community composition, species abundance/biomass, distribution) and the associated environmental variables. Canonical correspondence analysis (using CANOCO software (ter Braak and Smilauer 2002) and PRIMER software (Anderson et al. 2008)) has been used to examine the associations between the environmental variables and the abundance patterns of the nekton community in the long-term LDWF data for Lake Pontchartrain and the Lake Borgne region (O’ Connell et al. 2004, Sable et al. 2010), and for the areas around the Davis Pond and Caernarvon Freshwater Diversions (Alford 2010, de Mutsert 2010). With any data analysis, careful consideration of the results and what they mean is important so that the conclusions drawn from the analysis are not misleading or based on spurious correlations or effects.
Analyzing the existing LDWF monitoring data for abundance patterns and distribution changes for species in the system is important for establishing the existing conditions and baseline dynamics for the species. The results can help inform and validate predictive models, and can be used for comparison with future data collections. The current LDWF monitoring data is variable and measures a variety of effects on the species, so elucidating the effects of the Caernarvon Diversion on fishery species in the estuary is difficult. However, as alternatives for modifying Caernarvon operation are being evaluated, and more restoration efforts are planned in the future for Breton Sound, it is likely that the estuary will change over time. Thus, it is
22
important to have continued data collection through the monitoring program so that identification of changes in species abundance patterns and distribution is possible as they occur over time in Breton Sound.
LDWF has recently made modifications to their fisheries-independent monitoring program for the coastal study areas (LDWF 2010) to help support future evaluation of changes in species abundance and/or distribution in Breton Sound. The improved monitoring program is based on a stratified random sampling design. LDWF biologists will stratify each of the basins by low (≤ 5 ppt), medium (6-15 ppt), and high (> 15 ppt) salinity based on in situ measurements recorded at fixed stations, and then will randomly sample a fixed number of stations within each of the strata during each sampling period to ascertain a sufficient sample size is acquired for statistical analyses and inferences about the fishery species. LDWF has added additional sites for each of the gear types to increase the number and spatial extent of the monitoring stations within each basin. Thus, the pool of sampling stations within each salinity strata of the basin has been increased for more statistical power and better representation of the area.
REFERENCES
Alford, J. B. 2010. Changes in fish community structure in Barataria Basin following freshwater diversion of the Mississippi River. Presentation at the Annual Meeting of the Louisiana Chapter of the American Fisheries Society, Baton Rouge, Louisiana. January 2010.
Anderson, M. J., R. N. Gorley, and K. R. Clarke. 2008. PERMANOVA+ for PRIMER: Guide to Software and Statistical Methods. PRIMER-E, Plymouth, UK.
Chatry, M., R. J. Dugas, and K. A. Easley. 1983. Optimum salinity regime for oyster production on Louisiana’s state seed grounds. Contributions to Marine Sciences 26: 81-94.
Day, J. W., J. E. Cable, J. H. Cowan Jr., R. DeLaune, K. de Mutsert, et al. 2009. The impacts of pulsed reintroduction of river water on a Mississippi Delta coastal basin. Journal of Coastal Research 54: 225-243.
de Mutsert, K. 2010. The effects of a freshwater diversion on nekton species biomass distribution, food web pathways, and community structure in a Louisiana estuary. Louisiana State University, Baton Rouge, Louisiana. Doctoral dissertation. 187 p.
Gagliano, S.M., K.M. Wicker. G.J. Castille III, C.E. Fike. 1995. History of freshwater diversions for environmental enhancement in the Breton Sound Basin, Louisiana. Coastal Environments, Inc. Baton Rouge, LA.
23
Haas, H. L., E. C. Lamon III, K. A. Rose, and R. F. Shaw. 2001. Environmental and biological factors associated with the stage-specific abundance of brown shrimp (Penaeus aztecus) in Louisiana: applying a new combination of statistical techniques to long-term monitoring data. Canadian Journal of Fisheries and Aquatic Sciences 58: 2258-2270.
Kirkham, C. 2009. New cap on oyster boats won’t keep Texans out of Louisiana waters. The Times-Picayune. January 3, 2009.
La Peyre, M. K., B. Gossman, and J. F. La Peyre. 2009. Defining optimal freshwater flow for oyster production: effects of freshet rate and magnitude of change and duration on Eastern oysters and Perkinsus marinus infection. Estuaries and Coasts 32: 522-534.
Louisiana Department of Natural Resources. 2006. Caernarvon Freshwater Diversion Project: Annual Report 2005. July 2006.
Louisiana Department of Wildlife and Fisheries. 2002. Marine fisheries division field procedures manual. Version No. 02-1. Louisiana Department of Wildlife and Fisheries, Office of Fisheries, Marine Fisheries Division, Baton Rouge, LA.
Louisiana Department of Wildlife and Fisheries. 2010. Inshore fisheries monitoring plan. Louisiana Department of Wildlife and Fisheries, Office of Fisheries, Fisheries Management Division, Baton Rouge, LA.
O’ Connell, M. T., R. C. Cashner, and C. S. Schieble. 2004. Fish assemblage stability over fifty years in the Lake Pontchartrain estuary: comparisons among habitats using canonical correspondence analysis. Estuaries and Coasts 27: 807-817.
Piazza, B. P. 2009. The role of climate variability and riverine pulsing in the community dynamics of estuarine nekton in Breton Sound, Louisiana. Louisiana State University, Baton Rouge, Louisiana. Doctoral dissertation. 157 p.
Piazza, B. P., and M. La Peyre. 2007. Restoration of the annual flood pulse in Breton Sound, Louisiana, USA: Habitat change and nekton community response. Aquatic Biology 1: 109-119.
Pollard, J.F. 1973. Experiments to re-establish historical seed grounds and control the southern oyster drill. Louisiana Wildlife and Fisheries Commission Technical Bulletin. No 6. 82 p.
Rozas, L. P., T. J. Minello, I. Munuera-Fernandez, B. Fry, and B. Wissel. 2005. Macrofaunal distributions and habitat change following winter-spring releases of freshwater in the Breton Sound Estuary, Louisiana (USA). Estuarine, Coastal and Shelf Science 65: 319-336.
SAS Institute Inc., SAS 9.2. 2002-2008: Cary, NC, USA.
24
Soniat, T. M., E. E. Hofmann, J. M. Klinck, and E. N. Powell. 2009. Differential modulation of eastern oyster (Crassostrea virginica) disease parasites by the El-Niño-Southern Oscillation and the North Atlantic Oscillation. International Journal of Earth Sciences 98: 99-114.
ter Braak, C. J. F. and P. Smilauer 2002. CANOCO reference manual and CanoDraw for Windows user’s guide: software for canonical community ordination (version 4.5). Microcomputer Power, Ithaca, New York, 500 pp.
U.S. Army Corps of Engineers and the Louisiana Department of Wildlife and Fisheries. 1998. Caernarvon freshwater diversion structure: biological monitoring program postconstruction report. US Army Corps of Engineers, New Orleans District. 264 p.
U. S. Army Corps of Engineers. 1984. Louisiana coastal area, Louisiana freshwater diversion to Barataria and Breton Sound Basins, Feasibility Study and EIS. US Army Corps of Engineers, New Orleans District.
Zimmerman, R. J., T. J. Minello, and L. P. Rozas. 2002. Salt marsh linkages to productivity of Penaeid shrimps and blue crabs in the Northern Gulf of Mexico. Concepts and Controversies in Tidal Marsh Ecology, Part 4: 293-314.
25
Figure 1. Caernarvon Diversion daily discharge (cfs) from 1992–2011 (http://waterdata.usgs.gov).
Caernarvon Freshwater Diversion Discharge
1/1/93 1/1/95 1/1/97 1/1/99 1/1/01 1/1/03 1/1/05 1/1/07 1/1/09 1/1/11
Dai
ly D
isch
arge
(cfs
)
0
2000
4000
6000
8000
10000
26
Figure 2. Caernarvon daily discharge (cfs) for 2006 through 2010.
Dai
ly D
isch
arge
(cfs
)
0
2000
4000
6000
8000
1000020062007200820092010
Jan Feb Mar Apr May Jun Jul Aug Oct NovSep Dec
27
Figure 3. Mississippi River stage (ft) at Carrollton Station in New Orleans.
Mis
siss
ippi
Riv
er S
tage
(ft)
at C
arro
llton
Sta
tion
in N
ew O
rlean
s
0
2
4
6
8
10
12
14
16
18
1988 20081990 2004 20061992 20022000199819961994 2010
28
Figure 4. Mississippi River stage (ft) from 2006-2010 at Carrollton Station in New Orleans, LA.
Mis
siss
ippi
Riv
er S
tage
(ft)
at C
arro
llton
Sta
tion
in N
ew O
rlean
s
0
2
4
6
8
10
12
14
16
18
20062007200820092010
Jan Feb Mar Apr May Jun Jul Aug Oct NovSep Dec
29
Figure 5. Locations of LDWF isohaline sampling stations.

30
Figure 6. Locations of LDWF meter square oyster sampling stations.

31
Figure 7. Locations of LDWF gillnet and seine sampling stations.

32
Figure 8. Locations of LDWF trawl sampling stations.
33
Figure 9. Annual oyster production at meter square sites from 1988-2010.
Seed Oysters
Ann
ual T
otal
Num
ber o
f Oys
ters
Cou
nted
at M
eter
Squ
are
Sta
tions
0
500
1000
1500
2000
2500
3000
3500
4000
Sack Oysters
Years
1988 1990 1992 1994 1996 1998 2000 2002 2004 2006 2008 20100
200
400
600
800
1000
1200
1400
34
Figure 10. Mean production of seed oysters at meter square stations for pre-, post-, and long-term post-operational periods before and after Hurricane Katrina for the Caernarvon Freshwater Diversion.
Stations1 2 3 4 5 6 7 8 9 10 11 12 13 14 15 16 17 18 19 20 21 22 23 24 25 26 27
Mea
n S
eed
Oys
ter P
rodu
ctio
n at
Met
er S
quar
e St
atio
ns
0
50
100
150
200 Pre-operationPost-operationLong-term pre-KatrinaLong-term post-Katrina
35
Figure 11. Mean monthly salinities (ppt) for isohaline sampling station 346 at Bay Gardene from 1988-2010 with revised optimum monthly salinities for oyster production from Baird et al. 1998.
Station 346
Months1 2 3 4 5 6 7 8 9 10 11 12
Mea
n S
alin
ity (p
pt)
0
5
10
15
20
25 19881989199019911992199319941995199619971998199920002001200220032004200520062007200820092010Optimum
36
Figure 12. Mean monthly salinities (ppt) for isohaline sampling station 346 at Bay Gardene from 1988-2010 plotted against the mean monthly discharge (cfs) from the Caernarvon Freshwater Diversion (top) and against the mean monthly stage (ft) for the Mississippi River.
Mean Monthly Discharge (cfs) for Caernarvon
0 1500 3000 4500 6000 7500 9000
Mea
n M
onth
ly S
alin
ity a
t Iso
halin
e S
tatio
n 34
6 (p
pt)
0
5
10
15
20
Mean Monthly Mississippi River Stage (ft) at Carrollton Station
0 2 4 6 8 10 12 14 160
5
10
15
20
37
Figure 13. Mean annual CPUE for brown shrimp in seines from 1988-2010.
Brown Shrimp Annual Catch - Caernarvon
1988 1990 1992 1994 1996 1998 2000 2002 2004 2006 2008 2010
Mea
n A
nnua
l Cat
ch in
Sei
nes
0
5
10
15
20
25

38
Figure 14. Brown shrimp CPUE by month and year for seine samples in Breton Sound.
1988
1990
1992
1994
1996
1998
2000
2002
2004
2006
2008
2010
year
12
34
56
78
910
1112
month
0
28
57
85
Mean_CPUE
Brown Shrimp: Seine Catches by Year and Month in Breton Sound
39
Figure 15. Mean CPUE for brown shrimp at seine stations for pre-, post-, and long-term post-operational periods before and after Hurricane Katrina for the Caernarvon Freshwater Diversion.
Brown Shrimp - Caernarvon Diversion
Stations242 244 250 251 253 255
Mea
n B
row
n S
hrim
p C
atch
in S
eine
s
0
2
4
6
8
10
12
14
16
18
20
22
24
26
28Pre-operationPost-operationLong-term pre-KatrinaLong-term post-Katrina
40
Figure 16. Brown shrimp CPUE vs. salinity (ppt) at seine stations from 1988-2010.
Station 242
Bro
wn
Shr
imp
Cat
ch P
er U
nit E
ffort
at S
eine
Sta
tions
in M
ay
0
50
100
150
200
1988
1989
1990199119931994199519961997
19981999
2000
20012002
200320042005200620072008
2009
Station 244
0
50
100
150
200
1988 1989
1990
19911992
199419951996
1997
19981999
2000
200120022003
2004
20052006
200720082009
2010
Station 250
Salinity in May (ppt)
0 5 10 15 20 25 30 350
50
100
150
200 1988
1989
1990
1991
1992
199319941995
1996
1997
1998 1999 20002001
2002
20032004
2005
2006
20072008
20092010

41
Figure 16 (cont.). Brown shrimp CPUE vs. salinity (ppt) at seine stations from 1988-2010.
Station 251
Bro
wn
Shr
imp
Cat
ch P
er U
nit E
ffort
at S
eine
Sta
tions
in M
ay
0
50
100
150
200
1989
1990
1991
1992
1993
1994
1995
1996
1997
1998
19992000
2001
2002
2003
20042005 2006
200720082009 2010
1989
Station 253
0
50
100
150
200
198919901991 1992199319941995 1996199719981999
200020012002
200320042005 200620072008 20092010
Station 255
Salinity in May (ppt)
0 5 10 15 20 25 30 350
50
100
150
200
1988
1989
19901991 1992199419951996
1997
1998199920002001
2002
2003
20042005
2006
200720082009
2010
42
Figure 17. Mean annual CPUE for brown shrimp in 6’ trawls from 1988-2010.
Brown Shrimp Annual Catch - Caernarvon
1988 1990 1992 1994 1996 1998 2000 2002 2004 2006 2008 2010
Mea
n An
nual
Cat
ch in
6' T
raw
ls
0
5
10
15
20
25

43
Figure 18. Brown shrimp CPUE by month and year for 6’ trawl samples in Breton Sound.
44
Figure 19. Mean CPUE for brown shrimp at 6’ trawl stations for pre-, post-, and long-term post-operational periods before and after Hurricane Katrina for the Caernarvon Freshwater Diversion.
Brown Shrimp - Caernarvon Diversion
Stations5 17 18 21 22 25 32 36 101 102 103
Mea
n Br
own
Shr
imp
Cat
ch in
6' T
raw
ls
0
5
10
15
20
25
30
35
40
45
Pre-operationPost-operationLong-term pre-KatrinaLong-term post-Katrina

45
Figure 20. Brown shrimp CPUE vs. salinity (ppt) at 6’ trawl stations from 1988-2010.
Station 5
Bro
wn
Shrim
p C
atch
Per
Uni
t Effo
rt at
6' T
raw
l Sta
tions
in M
ay
0
50
100
150
200
400
19881989
1990
1991
1992
19931994
1995199619971998 1999 2000
2001
20022003
20042005 2006
200720082009
2010
Station 18
0
50
100
150
200
400
19881989
19901991 1992
199319941995199619971998 19992000
20012002
2003
20042005
20062007
2008
20092010
Station 25
May Salinity (ppt)0 5 10 15 20 25 30 35
0
50
100
150
200
400
1988 198919901991 19921993199419951996199719981999
20002001
2002
2003
20042005200620072008 20092010
46
Figure 20 (cont.). Brown shrimp CPUE vs. salinity (ppt) at 6’ trawl stations from 1988-2010.
Station 32
Brow
n Sh
rimp
Cat
ch P
er U
nit E
ffort
at 6
' Tra
wl S
tatio
ns in
May
0
50
100
150
200
400
19881989
1990
1991
1992
19931994
1995199619971998
1999
2000
2001
20022003
2004
2005
20062007
20082009
2010
Station 36
0
50
100
150
200
400
19881989
1990
1991 199219931994 1995199619971998
19992000 2001
20022003
2004
2005200620072008
2009
2010
Station 103
May Salinity (ppt)
0 5 10 15 20 25 30 350
50
100
150
200
400
19881989
1990
1991 1992199319941995199619971998 1999200020012002
2003
20042005
2006
200720082009
2010
47
Figure 21. Brown shrimp CPUE vs. salinity (ppt) at 6’ trawl stations for 1993, 2002 and 2008.
1993
Bro
wn
Shr
imp
Cat
ch P
er U
nit E
ffort
at 6
' Tra
wl S
tatio
ns in
May
0
15
30
45
60
75
51718
21
2225
32
36101102
103
2002
0
15
30
45
60
755
17 18
21
2225
32
36
101102
103
2008
Salinity in May (ppt)
0 5 10 15 20 25 30 350
15
30
45
60
75
5
1718
21
2225
32
36101102103
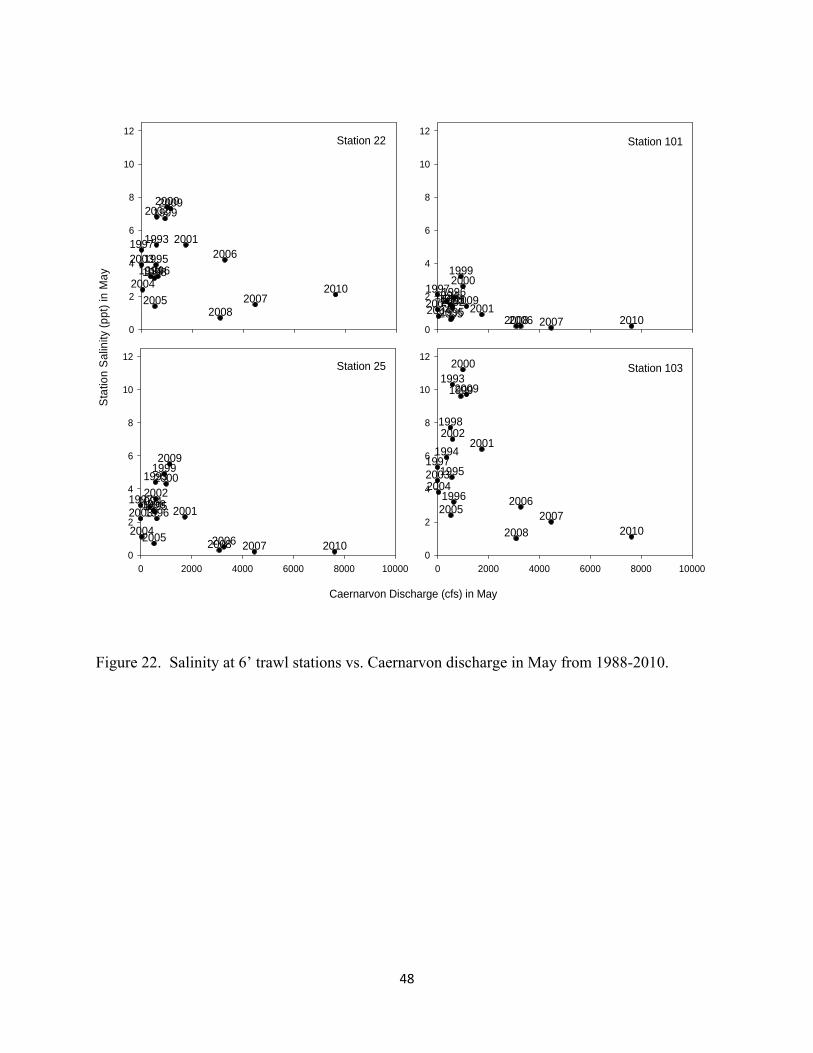
48
Figure 22. Salinity at 6’ trawl stations vs. Caernarvon discharge in May from 1988-2010.
Station 22
Sta
tion
Sal
inity
(ppt
) in
May
0
2
4
6
8
10
12
1993
199419951996
1997
1998
19992000
2001
2002
2003
20042005
2006
20072008
2009
2010
Station 25
Caernarvon Discharge (cfs) in May
0 2000 4000 6000 8000 100000
2
4
6
8
10
12
1993
19941995199619971998
19992000
20012002
200320042005 2006 20072008
2009
2010
Station 101
0
2
4
6
8
10
12
199319941995
199619971998
19992000
20012002200320042005 2006 20072008
2009
2010
Station 103
0 2000 4000 6000 8000 100000
2
4
6
8
10
12
1993
1994
1995
1996
1997
1998
1999
2000
20012002
20032004
20052006
20072008
2009
2010

49
Figure 23. Mean annual CPUE for brown shrimp in 16’ trawls from 1988-2010.
Brown Shrimp Annual Catch - Caernarvon
1988 1990 1992 1994 1996 1998 2000 2002 2004 2006 2008 2010
Mea
n An
nual
Cat
ch in
16'
Tra
wls
0
5
10
15
20
25
30

50
Figure 24. Brown shrimp CPUE by month and year for 16’ trawl samples in Breton Sound.
1988
1990
1992
1994
1996
1998
2000
2002
2004
2006
2008
2010
year
12
34
56
78
910
1112
month
0
57
113
170
Mean_CPUE
Brown Shrimp: 16' Trawl Mean Catches by Year and Month in Breton Sound
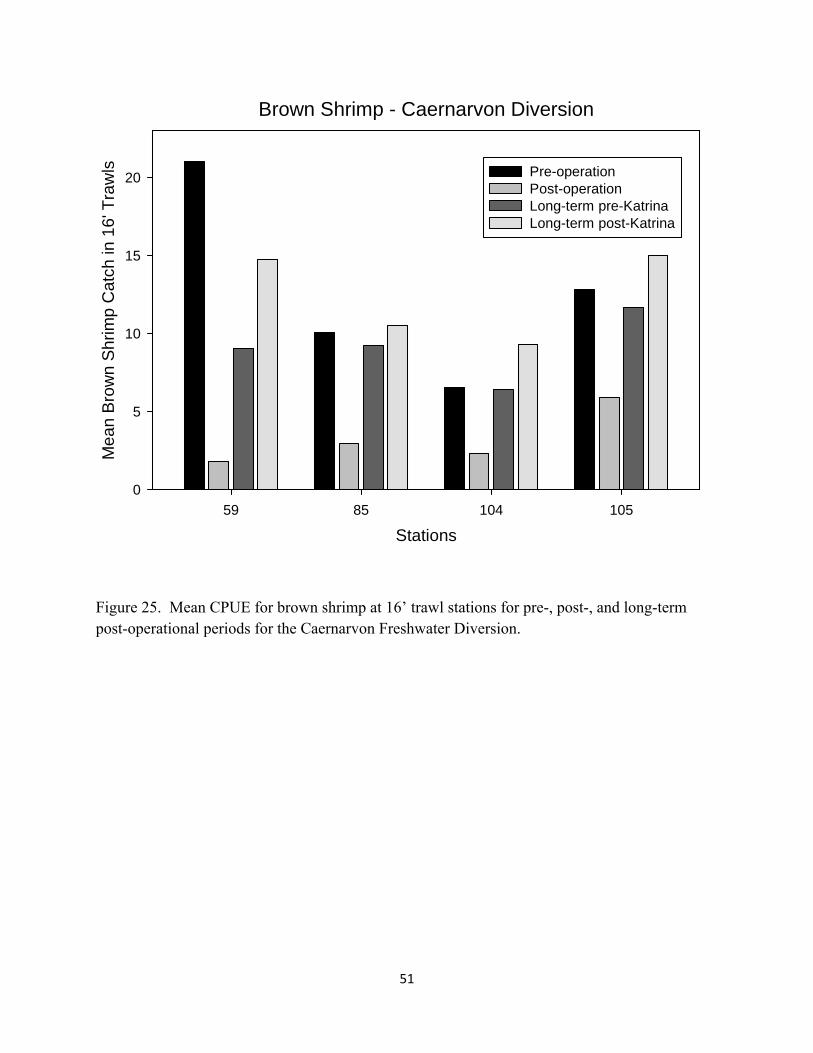
51
Figure 25. Mean CPUE for brown shrimp at 16’ trawl stations for pre-, post-, and long-term post-operational periods for the Caernarvon Freshwater Diversion.
Brown Shrimp - Caernarvon Diversion
Stations59 85 104 105
Mea
n B
row
n S
hrim
p C
atch
in 1
6' T
raw
ls
0
5
10
15
20 Pre-operationPost-operationLong-term pre-KatrinaLong-term post-Katrina
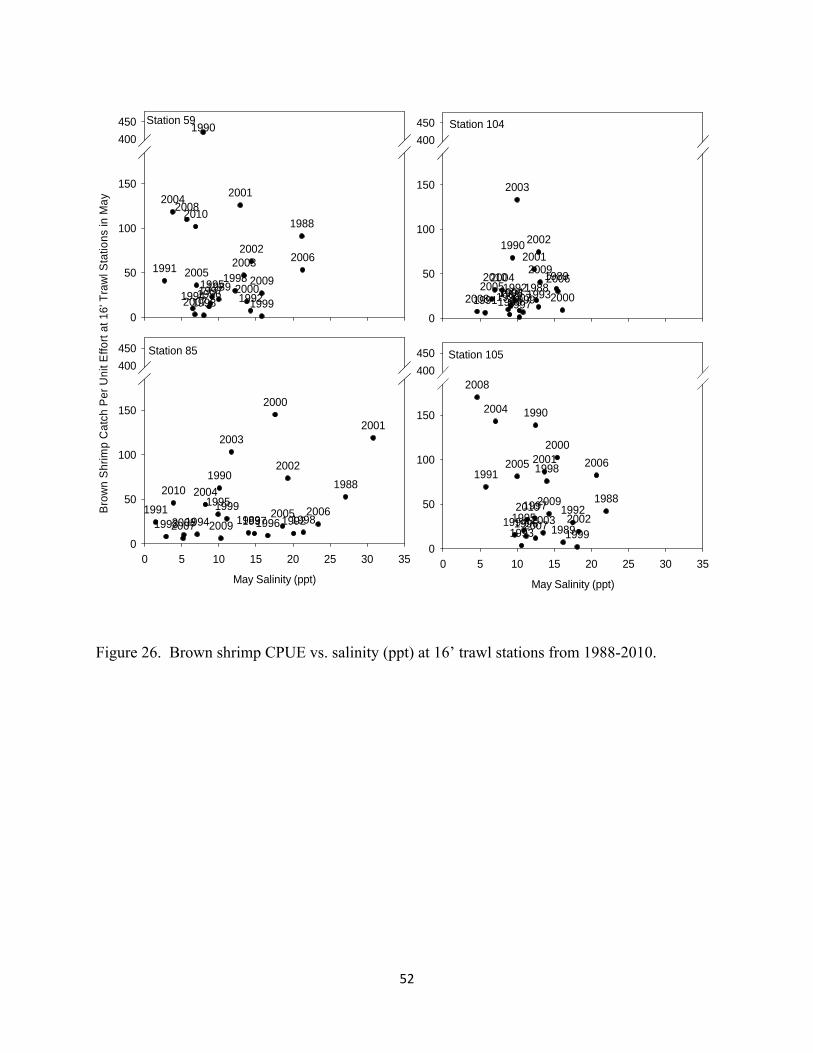
52
Figure 26. Brown shrimp CPUE vs. salinity (ppt) at 16’ trawl stations from 1988-2010.
Station 59Br
own
Shr
imp
Cat
ch P
er U
nit E
ffort
at 1
6' T
raw
l Sta
tions
in M
ay
0
50
100
150
400450
1988
1989
1990
1991
199219931994199519961997
1998
19992000
2001
20022003
2004
20052006
2007
2008
2009
2010
Station 85
May Salinity (ppt)
0 5 10 15 20 25 30 350
50
100
150
400450
1988
1989
1990
199119921993 1994
1995
19961997 19981999
2000
2001
2002
2003
2004
2005 200620072008 2009
2010
Station 104
0
50
100
150
400450
19881989
1990
19911992199319941995
1996199719981999 2000
20012002
2003
20042005
2006
20072008
20092010
Station 105
May Salinity (ppt)
0 5 10 15 20 25 30 350
50
100
150
400450
1988
1989
1990
1991
1992
1993199419951996
1997
1998
1999
20002001
20022003
2004
2005 2006
2007
2008
20092010

53
Figure 27. Mean annual CPUE for white shrimp in seines from 1988-2010.
White Shrimp Annual Catch - Caernarvon
1988 1990 1992 1994 1996 1998 2000 2002 2004 2006 2008 2010
Mea
n A
nnua
l Cat
ch in
Sei
nes
0
2
4
6
8
10

54
Figure 28. White shrimp CPUE by month and year for seine samples in Breton Sound.
1988
1990
1992
1994
1996
1998
2000
2002
2004
2006
2008
2010
year
12
34
56
78
910
1112
month
0
12
23
35
Mean_CPUE
White Shrimp: Seine Catches by Year and Month in Breton Sound

55
Figure 29. Mean CPUE for white shrimp at seine stations for pre-, post-, and long-term post-operational periods before and after Hurricane Katrina for the Caernarvon Freshwater Diversion.
White Shrimp - Caernarvon Diversion
Stations242 244 250 251 253 255
Mea
n W
hite
Shr
imp
Cat
ch in
Sei
nes
0
2
4
6
8
10
12
14 Pre-operationPost-operationLong-term pre-KatrinaLong-term post-Katrina
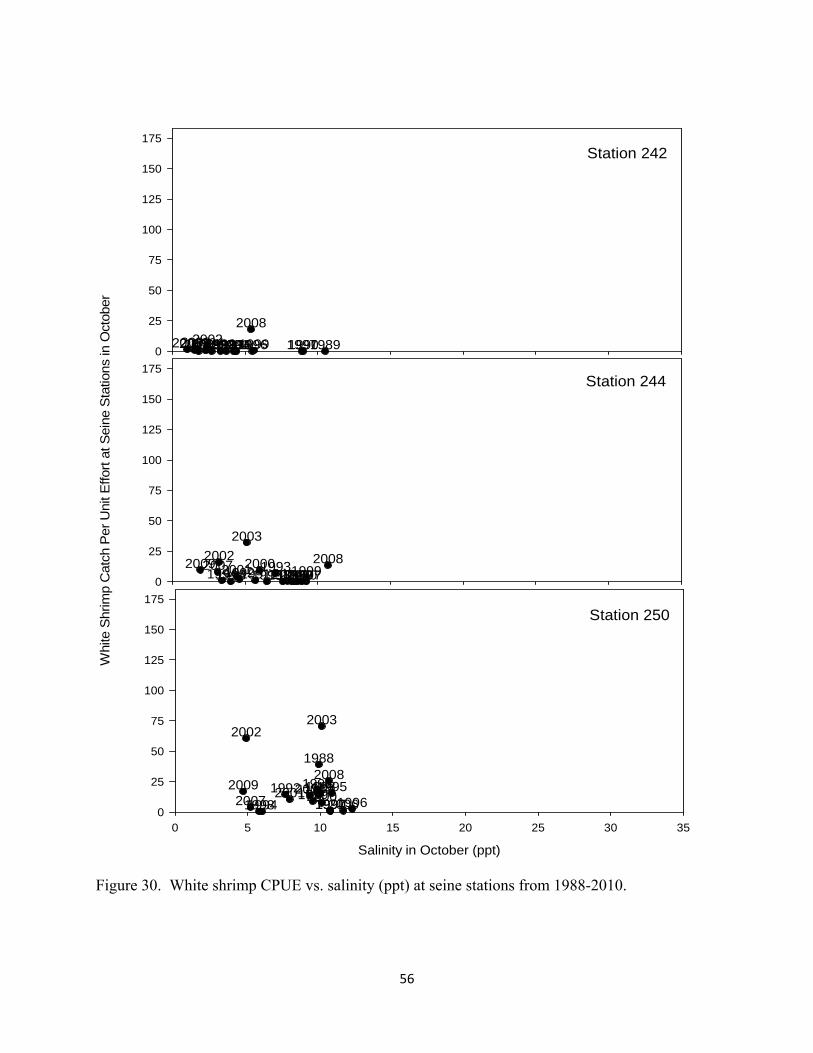
56
Figure 30. White shrimp CPUE vs. salinity (ppt) at seine stations from 1988-2010.
Station 242
Whi
te S
hrim
p C
atch
Per
Uni
t Effo
rt at
Sei
ne S
tatio
ns in
Oct
ober
0
25
50
75
100
125
150
175
1989199019911992199319941995 1996 19971998 19992000200120022003 2004200620072008
2009
Station 244
X Data
0
25
50
75
100
125
150
175
19881989199019911992 19931994 1995199619971998 1999200020012002
2003
200420062007 20082009
Station 250
Salinity in October (ppt)
0 5 10 15 20 25 30 350
25
50
75
100
125
150
175
1988
19891990
19911992 19931994
1995199619971998
199920002001
20022003
200420062007
20082009
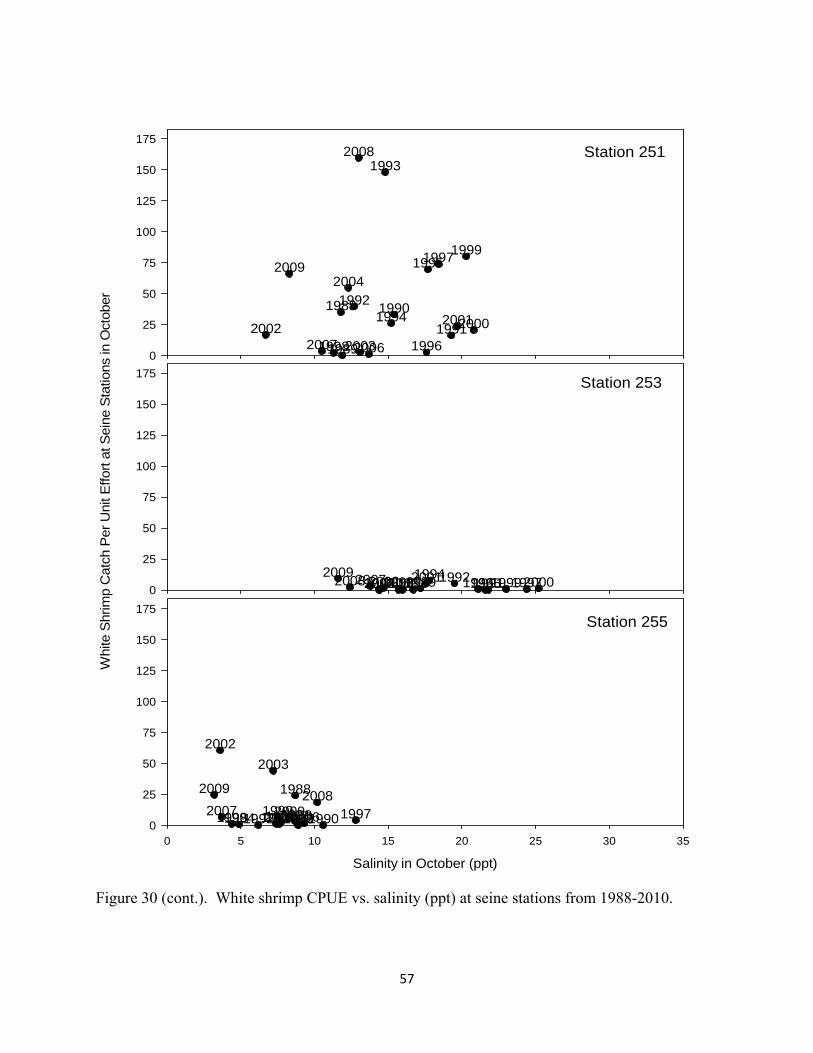
57
Figure 30 (cont.). White shrimp CPUE vs. salinity (ppt) at seine stations from 1988-2010.
Station 251
Whi
te S
hrim
p C
atch
Per
Uni
t Effo
rt at
Sei
ne S
tatio
ns in
Oct
ober
0
25
50
75
100
125
150
175
1988
1989
19901991
1992
1993
1994
1995
1996
1997
1998
1999
2000200120022003
2004
20062007
2008
2009
Station 253
0
25
50
75
100
125
150
175
19891990 1991199219931994
19951996 19971998 1999200020012002200320042006200720082009
Station 255
Salinity in October (ppt)
0 5 10 15 20 25 30 350
25
50
75
100
125
150
175
1988
1989199019911992 19931994 19951996 19971998 199920002001
20022003
20042006200720082009
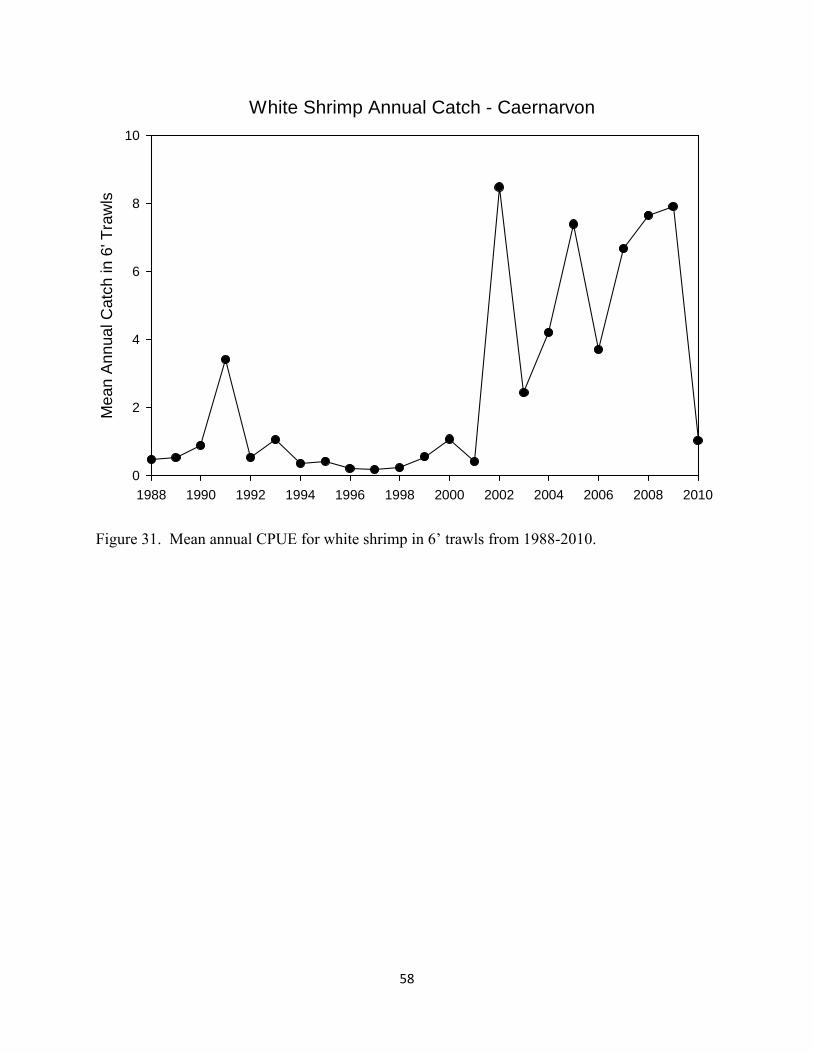
58
Figure 31. Mean annual CPUE for white shrimp in 6’ trawls from 1988-2010.
White Shrimp Annual Catch - Caernarvon
1988 1990 1992 1994 1996 1998 2000 2002 2004 2006 2008 2010
Mea
n An
nual
Cat
ch in
6' T
raw
ls
0
2
4
6
8
10
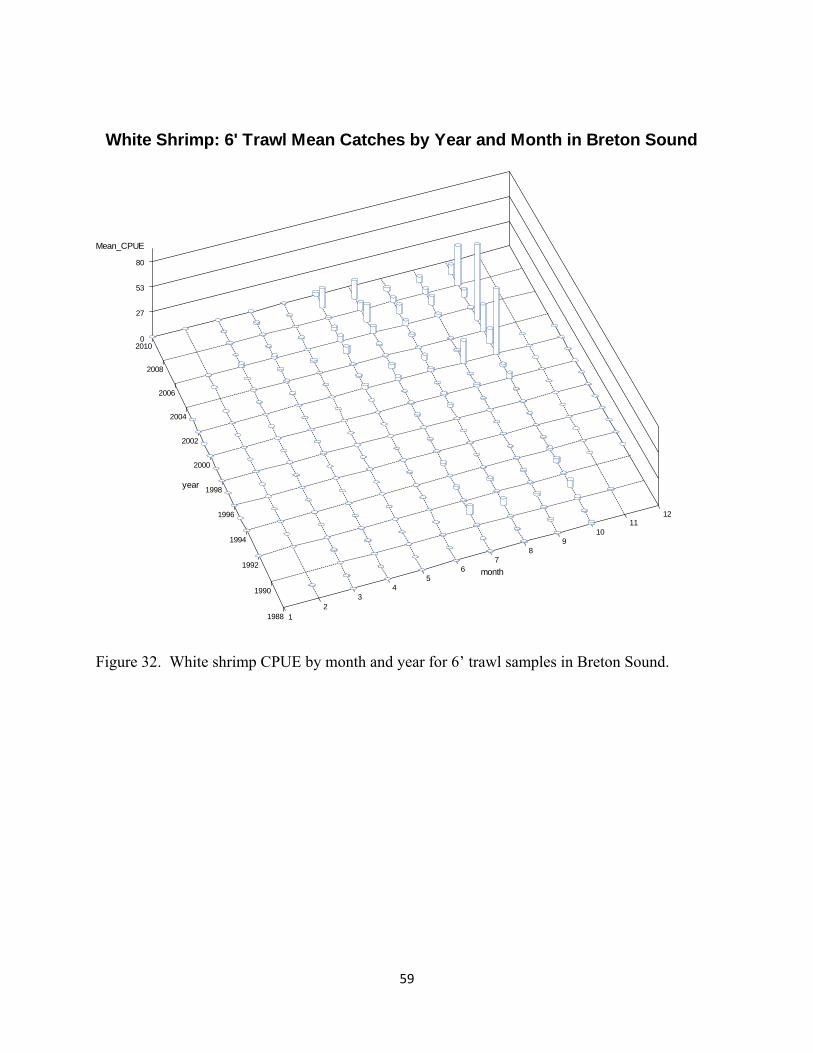
59
Figure 32. White shrimp CPUE by month and year for 6’ trawl samples in Breton Sound.
1988
1990
1992
1994
1996
1998
2000
2002
2004
2006
2008
2010
year
12
34
56
78
910
1112
month
0
27
53
80
Mean_CPUE
White Shrimp: 6' Trawl Mean Catches by Year and Month in Breton Sound
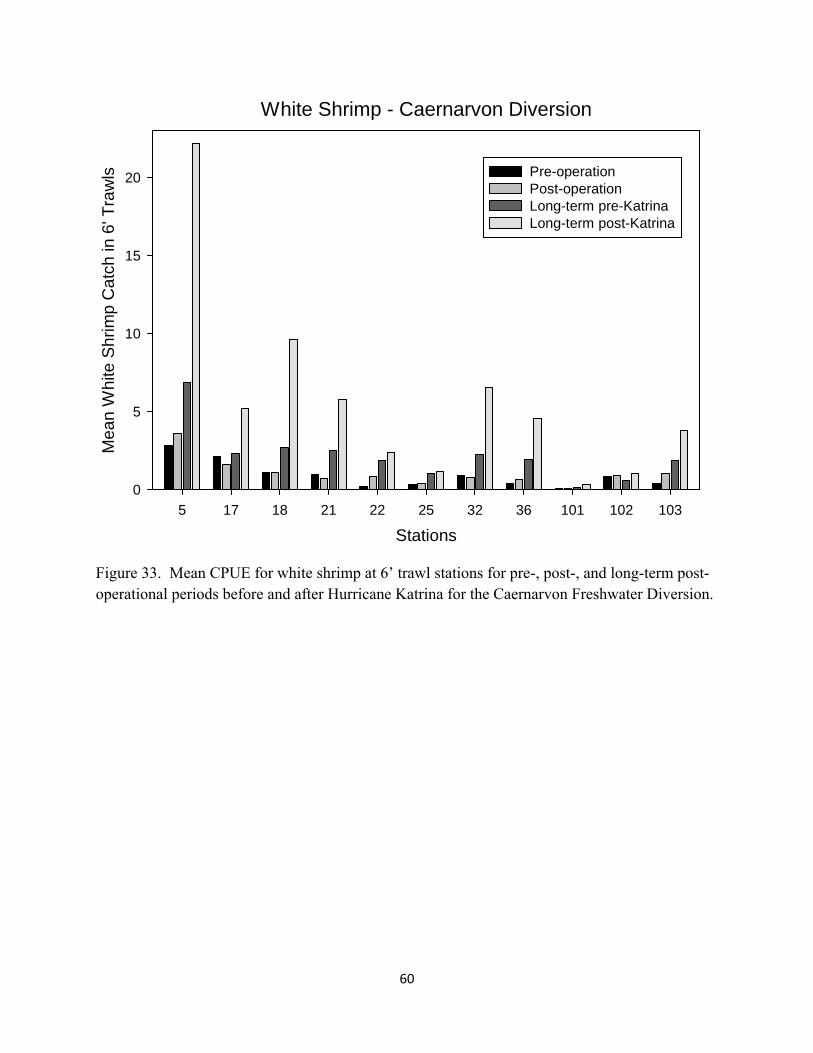
60
Figure 33. Mean CPUE for white shrimp at 6’ trawl stations for pre-, post-, and long-term post-operational periods before and after Hurricane Katrina for the Caernarvon Freshwater Diversion.
White Shrimp - Caernarvon Diversion
Stations5 17 18 21 22 25 32 36 101 102 103
Mea
n W
hite
Shr
imp
Cat
ch in
6' T
raw
ls
0
5
10
15
20 Pre-operationPost-operationLong-term pre-KatrinaLong-term post-Katrina
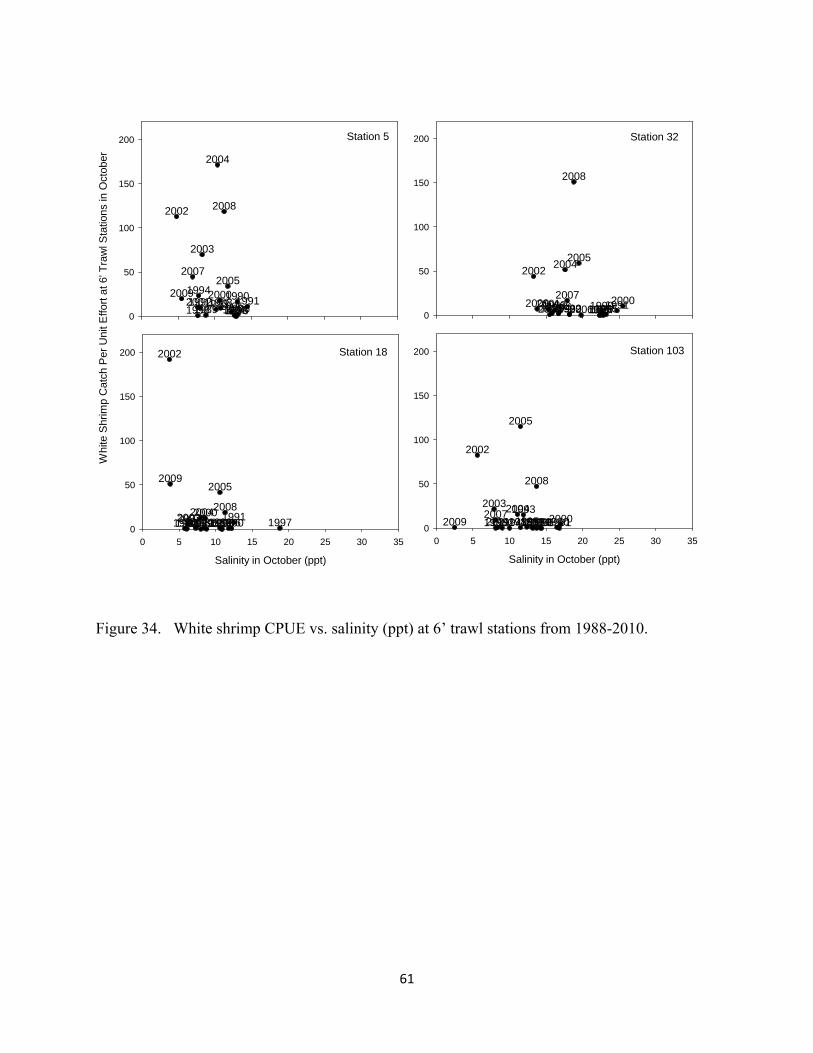
61
Figure 34. White shrimp CPUE vs. salinity (ppt) at 6’ trawl stations from 1988-2010.
Station 5
Whi
te S
hrim
p C
atch
Per
Uni
t Effo
rt at
6' T
raw
l Sta
tions
in O
ctob
er
0
50
100
150
200
198819891990199119921993
19941995199619971998 1999
20002001
2002
2003
2004
2005
2006
2007
2008
2009
Station 18
Salinity in October (ppt)
0 5 10 15 20 25 30 350
50
100
150
200
19881989 19901991199219931994 19951996 19971998 19992000
2001
2002
20032004
2005
200620072008
2009
Station 32
0
50
100
150
200
19881989 19901991199219931994 1995199619971998 199920002001
2002
2003
20042005
20062007
2008
2009
Station 103
Salinity in October (ppt)
0 5 10 15 20 25 30 350
50
100
150
200
198819891990199119921993
19941995199619971998 199920002001
2002
20032004
2005
20062007
2008
2009

62
Figure 35. Mean annual CPUE for white shrimp in 16’ trawls from 1988-2010.
White Shrimp Annual Catch - Caernarvon
1988 1990 1992 1994 1996 1998 2000 2002 2004 2006 2008 2010
Mea
n An
nual
Cat
ch in
16'
Tra
wls
0
2
4
6
8
10
12
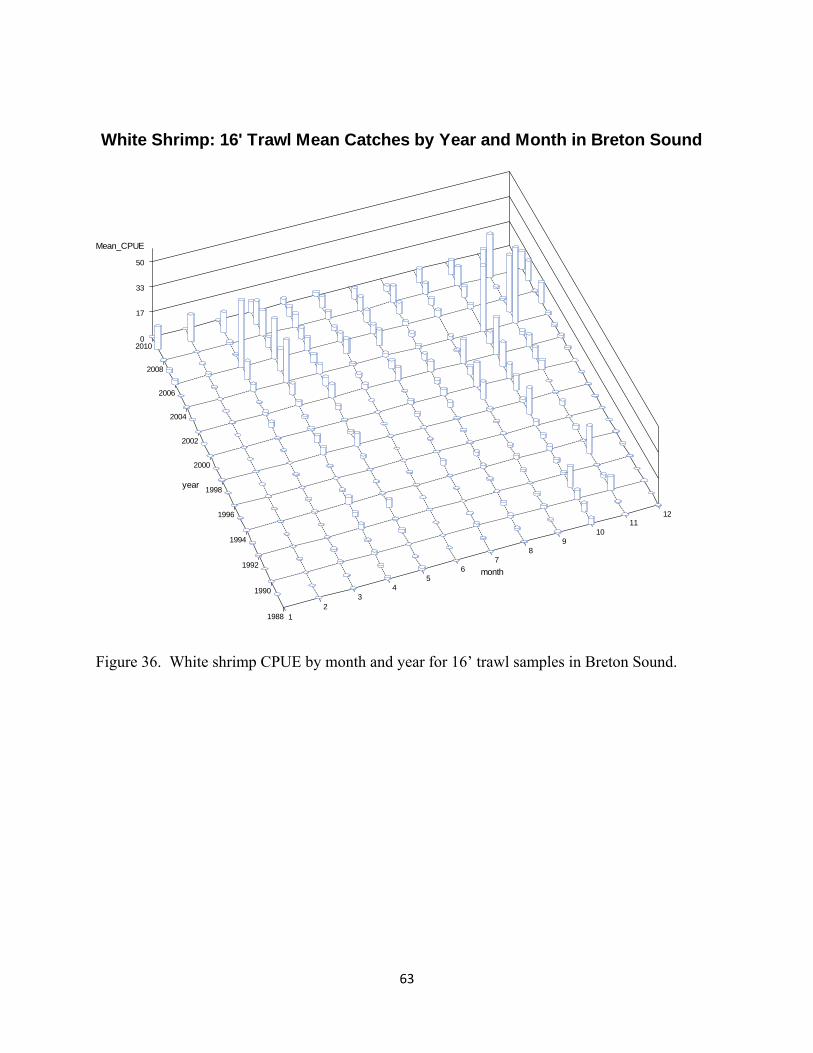
63
Figure 36. White shrimp CPUE by month and year for 16’ trawl samples in Breton Sound.
1988
1990
1992
1994
1996
1998
2000
2002
2004
2006
2008
2010
year
12
34
56
78
910
1112
month
0
17
33
50
Mean_CPUE
White Shrimp: 16' Trawl Mean Catches by Year and Month in Breton Sound

64
Figure 37. Mean CPUE for white shrimp at 16’ trawl stations for pre-, post-, and long-term post-operational periods for the Caernarvon Freshwater Diversion.
White Shrimp - Caernarvon Diversion
Stations59 85 104 105
Mea
n W
hite
Shr
imp
Cat
ch in
16'
Tra
wls
0
2
4
6
8
10
12Pre-operationPost-operationLong-term pre-KatrinaLong-term post-Katrina
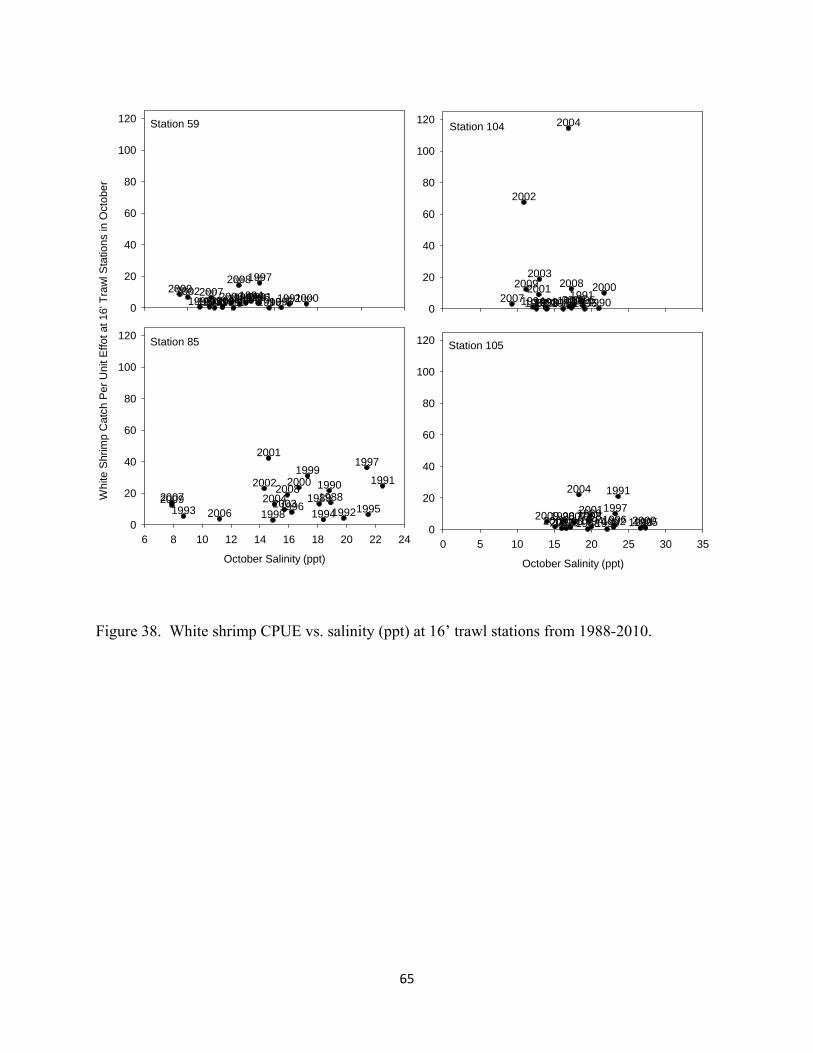
65
Figure 38. White shrimp CPUE vs. salinity (ppt) at 16’ trawl stations from 1988-2010.
Station 59
Whi
te S
hrim
p C
atch
Per
Uni
t Effo
t at 1
6' T
raw
l Sta
tions
in O
ctob
er
0
20
40
60
80
100
120
198819891990199119921993 1994 19951996
1997
1998 1999 2000200120022003200420062007
20082009
198819891990
1991199219931994
19951996
1997
1998 199920002001
2002
200320042006
2007
2008
2009
Station 85
October Salinity (ppt)
6 8 10 12 14 16 18 20 22 240
20
40
60
80
100
120
198819891990 1991
19921993 1994 19951996
1997
1998
19992000
2001
2002
200320042006
20072008
2009
Station 104
0
20
40
60
80
100
120
19881989 19901991
199219931994 1995199619971998199920002001
2002
2003
2004
2006200720082009
Station 105
October Salinity (ppt)
0 5 10 15 20 25 30 350
20
40
60
80
100
120
19881989
1990
1991
199219931994 199519961997
1998 1999 20002001
20022003
2004
2006200720082009
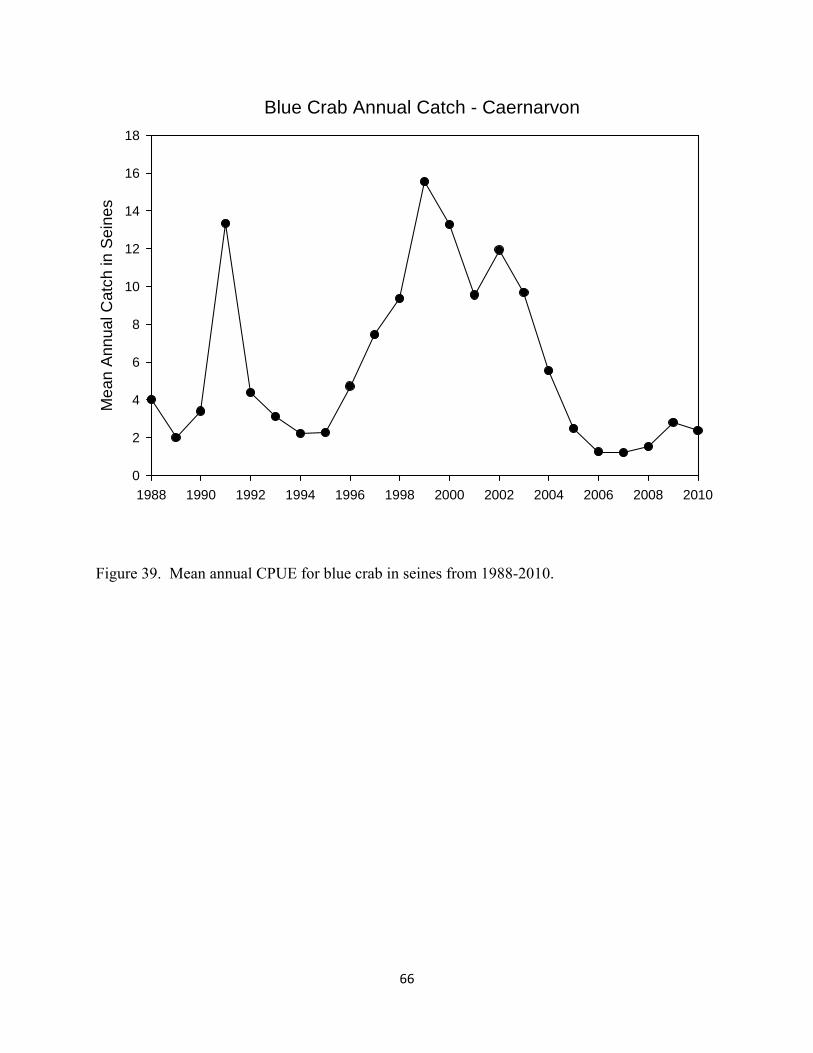
66
Figure 39. Mean annual CPUE for blue crab in seines from 1988-2010.
Blue Crab Annual Catch - Caernarvon
1988 1990 1992 1994 1996 1998 2000 2002 2004 2006 2008 2010
Mea
n A
nnua
l Cat
ch in
Sei
nes
0
2
4
6
8
10
12
14
16
18

67
Figure 40. Blue crab CPUE by month and year for seine samples in Breton Sound.
1988
1990
1992
1994
1996
1998
2000
2002
2004
2006
2008
2010
year
12
34
56
78
910
1112
month
0
15
30
45
Mean_CPUE
Blue Crab: Seine Catches by Year and Month in Breton Sound
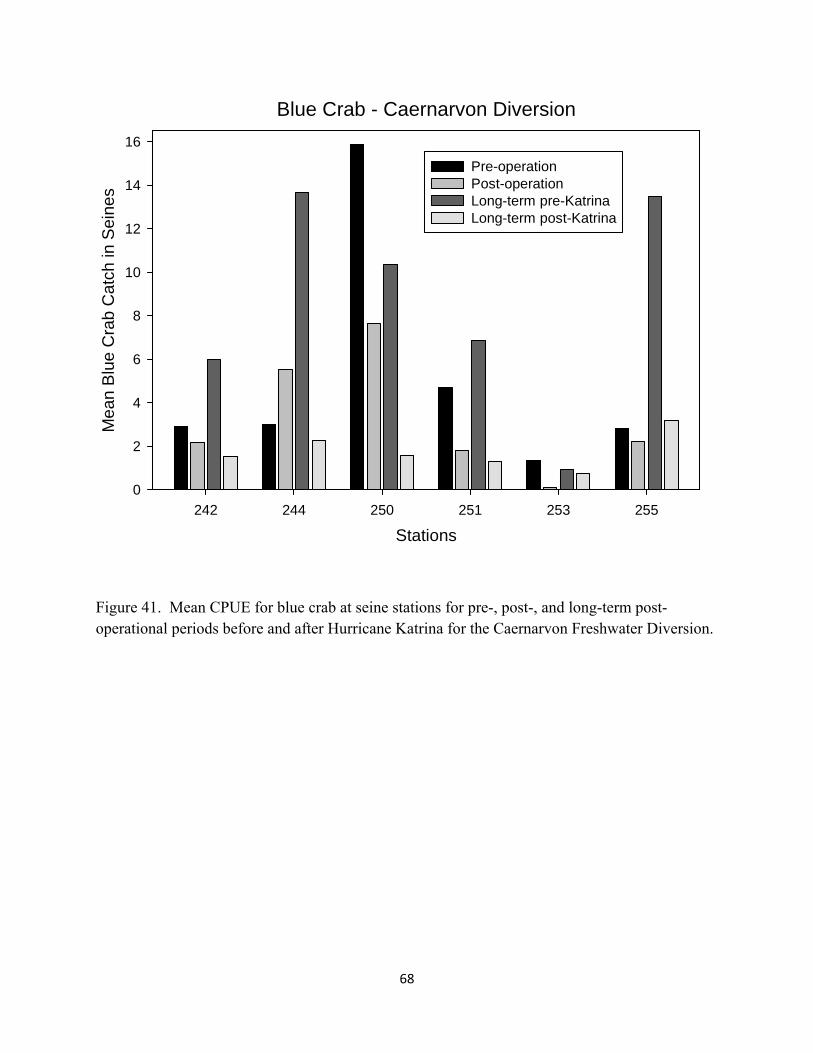
68
Figure 41. Mean CPUE for blue crab at seine stations for pre-, post-, and long-term post-operational periods before and after Hurricane Katrina for the Caernarvon Freshwater Diversion.
Blue Crab - Caernarvon Diversion
Stations242 244 250 251 253 255
Mea
n B
lue
Cra
b C
atch
in S
eine
s
0
2
4
6
8
10
12
14
16
Pre-operationPost-operationLong-term pre-KatrinaLong-term post-Katrina
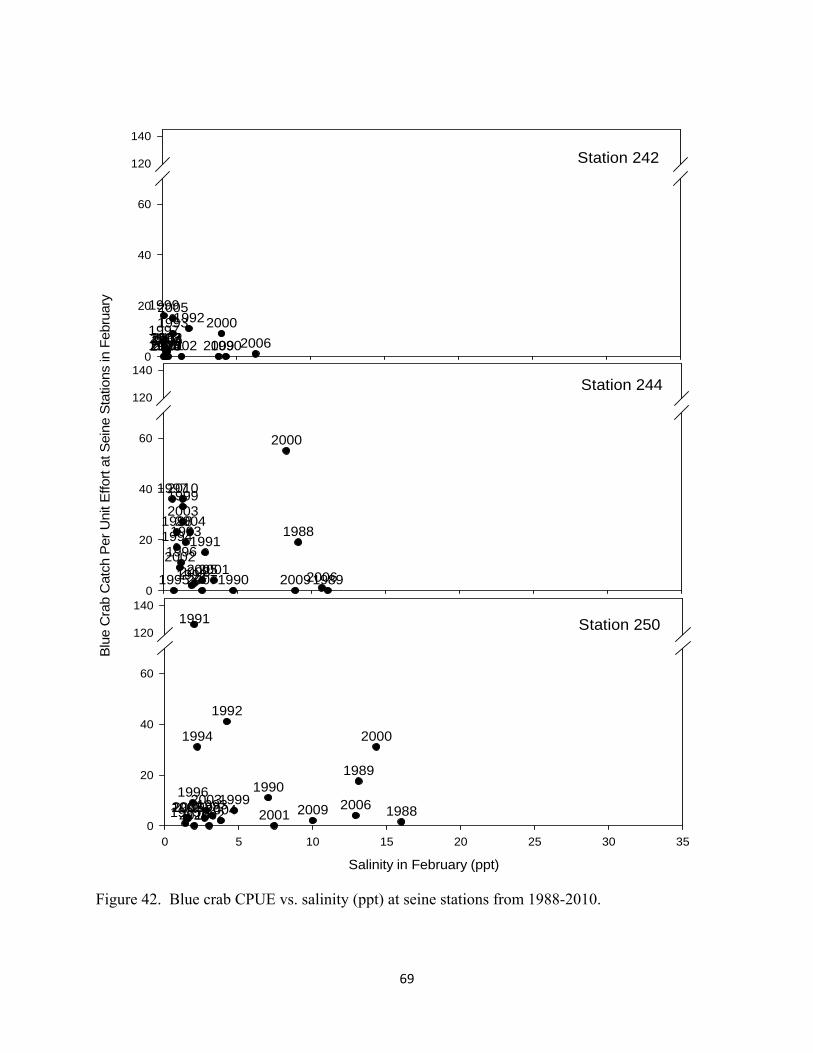
69
Figure 42. Blue crab CPUE vs. salinity (ppt) at seine stations from 1988-2010.
Station 242
Blu
e C
rab
Cat
ch P
er U
nit E
ffort
at S
eine
Sta
tions
in F
ebru
ary
0
20
40
60
120
140
1990
19921993
19941995199619971998
19992000
2001200220032004
2005
200620072008 20092010
Station 244
0
20
40
60
120
140
1988
19891990
1991
1992
19931994
1995
1996
1997
1998
1999
2000
20012002
20032004
2005 200620072008 2009
2010
Station 250
Salinity in February (ppt)
0 5 10 15 20 25 30 350
20
40
60
120
140
1988
19891990
1991
1992
1993
1994
19951996
199719981999
2000
200120022003
20042005 20062008 20092010
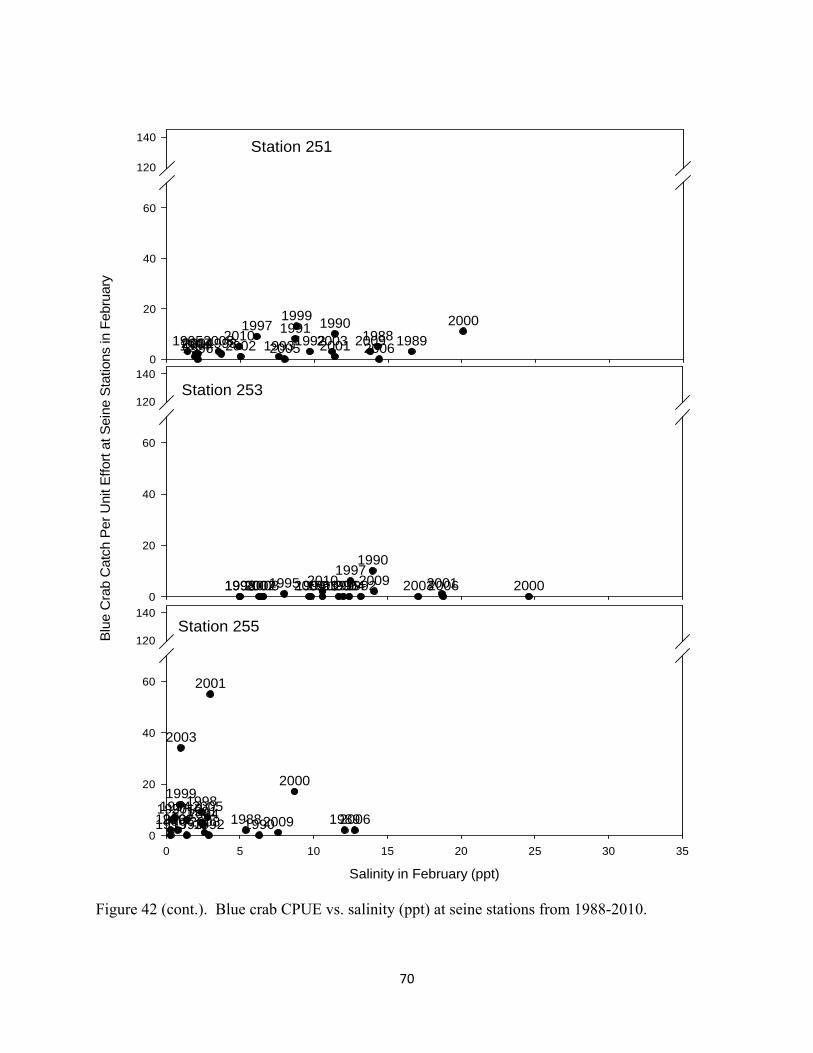
70
Figure 42 (cont.). Blue crab CPUE vs. salinity (ppt) at seine stations from 1988-2010.
Station 251
Blu
e C
rab
Cat
ch P
er U
nit E
ffort
at S
eine
Sta
tions
in F
ebru
ary
0
20
40
60
120
140
1988 198919901991
199219931994199519961997
1998
1999 2000
20012002 20032004 2005 200620072008 20092010
Station 253
0
20
40
60
120
140
1990
1991 19921993 19941995 19961997
1998 1999 200020012002 200320042005 200620072008 20092010
Station 255
Salinity in February (ppt)
0 5 10 15 20 25 30 350
20
40
60
120
140
1988 19891990199119921993
199419951996199719981999
2000
2001
2002
2003
2004200520062008 2009
2010

71
Figure 43. Mean annual CPUE for blue crab in 16’ trawls from 1988-2010.
Blue Crab Annual Catch - Caernarvon
1988 1990 1992 1994 1996 1998 2000 2002 2004 2006 2008 2010
Mea
n A
nnua
l Cat
ch in
16'
Tra
wls
0
2
4
6
8
10
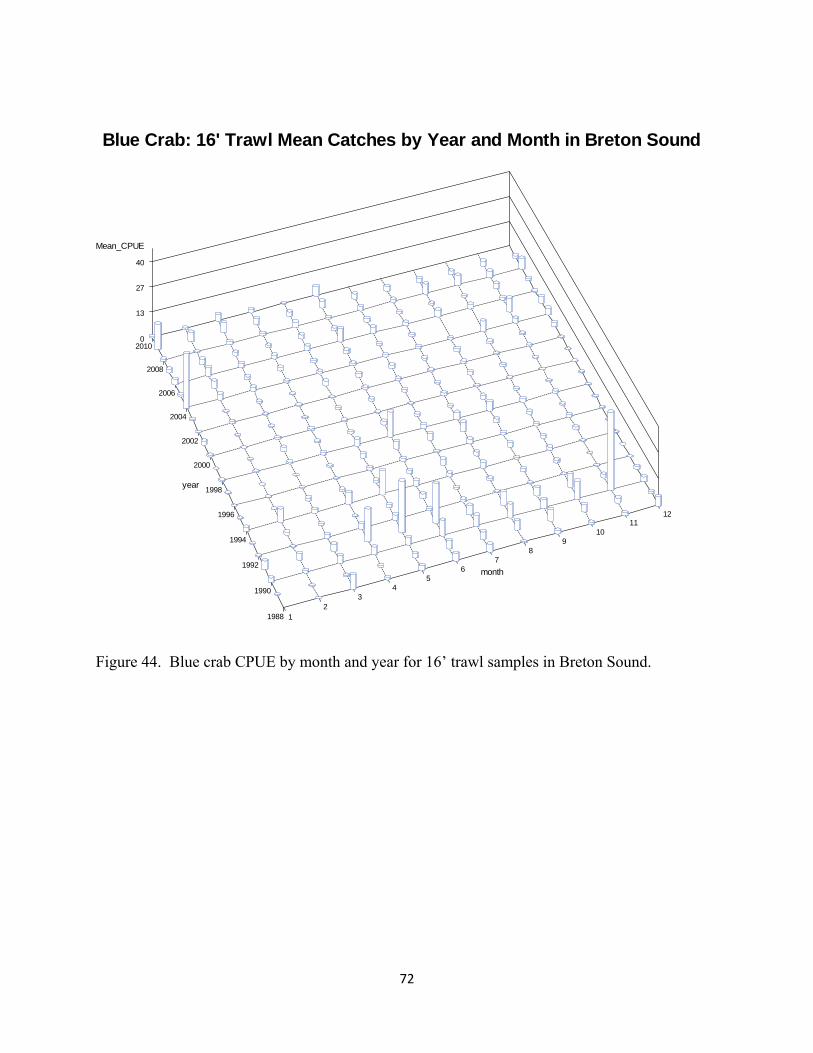
72
Figure 44. Blue crab CPUE by month and year for 16’ trawl samples in Breton Sound.
1988
1990
1992
1994
1996
1998
2000
2002
2004
2006
2008
2010
year
12
34
56
78
910
1112
month
0
13
27
40
Mean_CPUE
Blue Crab: 16' Trawl Mean Catches by Year and Month in Breton Sound

73
Figure 45. Mean CPUE for blue crab at 16’ trawl stations for pre-, post-, and long-term post-operational periods before and after Hurricane Katrina for the Caernarvon Freshwater Diversion.
Blue Crab - Caernarvon Diversion
Stations59 85 104 105
Mea
n B
lue
Cra
b C
atch
in 1
6' T
raw
ls
0
2
4
6
8
10
12
Pre-operationPost-operationLong-term pre-KatrinaLong-term post-Katrina
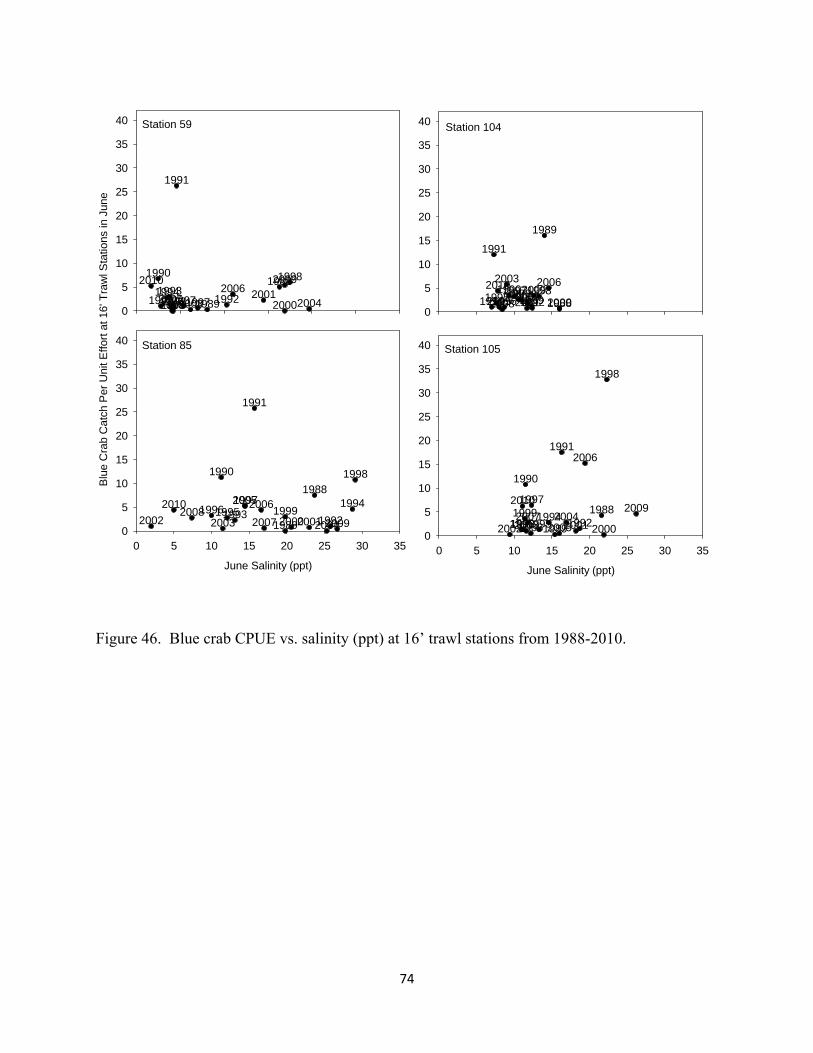
74
Figure 46. Blue crab CPUE vs. salinity (ppt) at 16’ trawl stations from 1988-2010.
Station 59
Blu
e C
rab
Cat
ch P
er U
nit E
ffort
at 1
6' T
raw
l Sta
tions
in J
une
0
5
10
15
20
25
30
35
40
1988
1989
1990
1991
199219931994
19951996 1997
1998
1999 2000200120022003 20042005
200620072008
20092010
Station 85
June Salinity (ppt)
0 5 10 15 20 25 30 350
5
10
15
20
25
30
35
40
1988
1989
1990
1991
199219931994
199519961997
1998
1999200020012002 2003 2004
200520062007
20082009
2010
Station 104
0
5
10
15
20
25
30
35
40
1988
1989
1990
1991
19921993
19941995199619971998
1999 2000200120022003
20042005
20062007200820092010
Station 105
June Salinity (ppt)
0 5 10 15 20 25 30 350
5
10
15
20
25
30
35
40
1988
1989
1990
1991
19921993 199419951996
1997
1998
19992000200120022003
20042005
2006
20072008
20092010

75
Figure 47. Mean annual CPUE for spotted seatrout in gillnets from 1988-2010.
Spotted Seatrout Annual Catch - Caernarvon
1988 1990 1992 1994 1996 1998 2000 2002 2004 2006 2008 2010
Mea
n A
nnua
l Cat
ch in
Gilln
ets
0
1
2
3
4
5

76
Figure 48. Spotted seatrout CPUE by month and year for gillnet samples in Breton Sound.
1988
1990
1992
1994
1996
1998
2000
2002
2004
2006
2008
2010
year
12
34
56
78
910
1112
month
0
3
7
10
Mean_CPUE
Spotted Seatrout: Gillnet Catches by Year and Month in Breton Sound
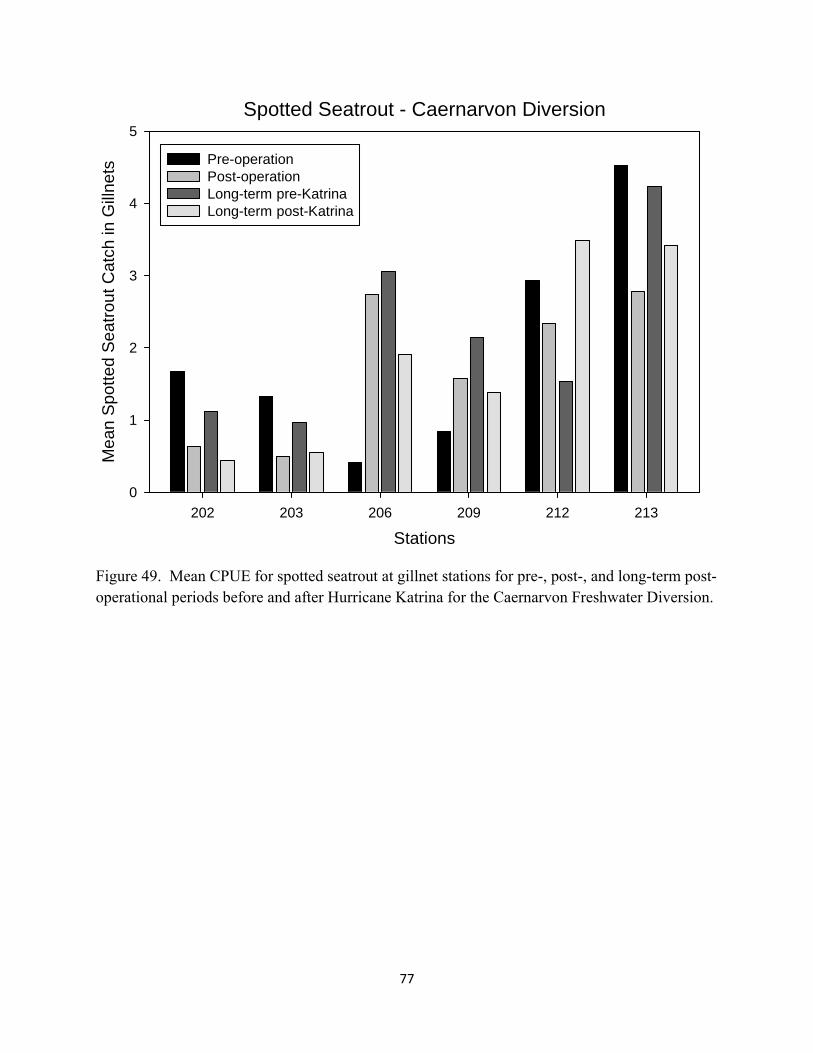
77
Figure 49. Mean CPUE for spotted seatrout at gillnet stations for pre-, post-, and long-term post-operational periods before and after Hurricane Katrina for the Caernarvon Freshwater Diversion.
Spotted Seatrout - Caernarvon Diversion
Stations202 203 206 209 212 213
Mea
n S
potte
d S
eatro
ut C
atch
in G
illne
ts
0
1
2
3
4
5
Pre-operationPost-operationLong-term pre-KatrinaLong-term post-Katrina
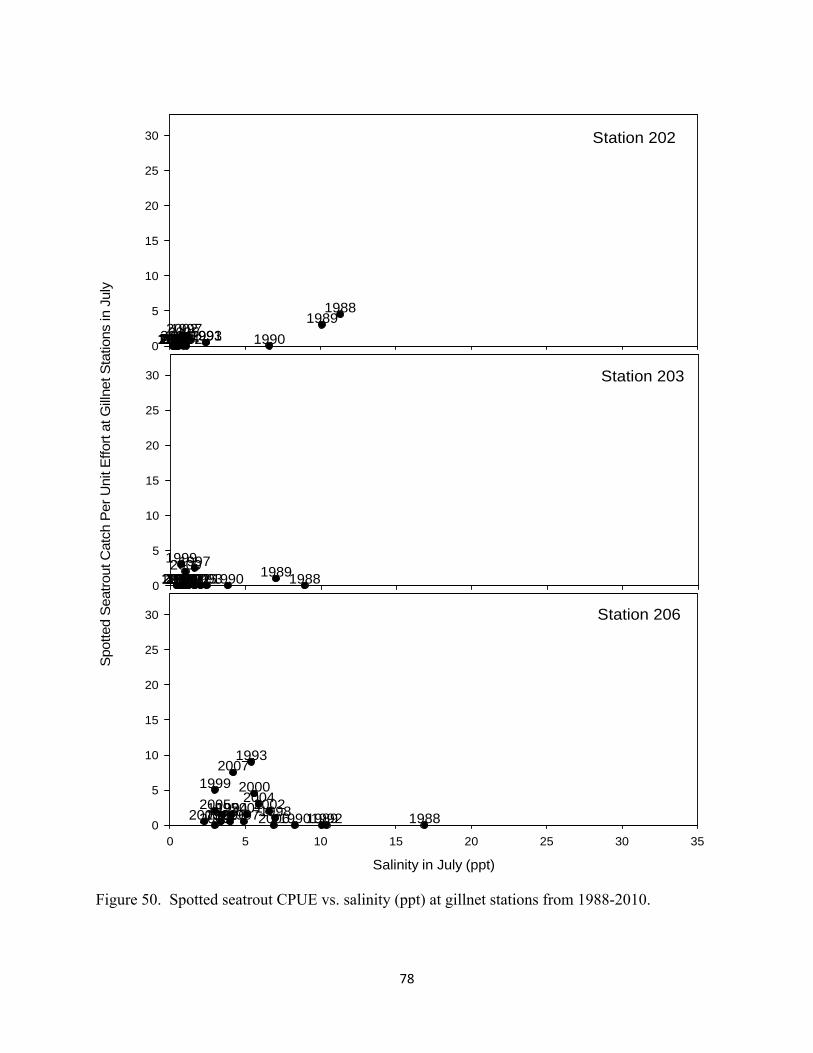
78
Figure 50. Spotted seatrout CPUE vs. salinity (ppt) at gillnet stations from 1988-2010.
Station 202
Spo
tted
Sea
trout
Cat
ch P
er U
nit E
ffort
at G
illne
t Sta
tions
in J
uly
0
5
10
15
20
25
30
19881989
19901991199219931994199519961997
19981999200020012002
200320042005200620072009
Station 203
0
5
10
15
20
25
30
1988198919901991199219931994199519961997
19981999200020012002200320042005200620072009
Station 206
Salinity in July (ppt)
0 5 10 15 20 25 30 350
5
10
15
20
25
30
1988198919901991 1992
1993
19941995199619971998
1999 200020012002
200320042005
2006
2007
2009
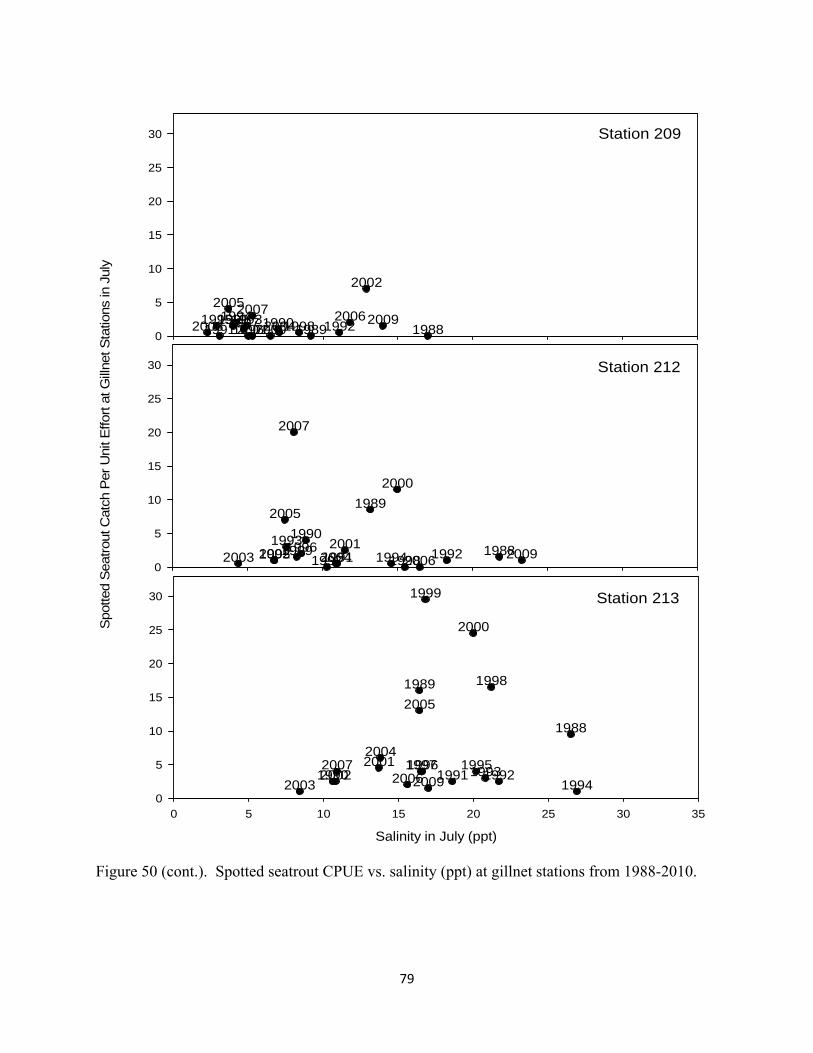
79
Figure 50 (cont.). Spotted seatrout CPUE vs. salinity (ppt) at gillnet stations from 1988-2010.
Station 209
Spo
tted
Sea
trout
Cat
ch P
er U
nit E
ffort
at G
illnet
Sta
tions
in J
uly
0
5
10
15
20
25
30
1988198919901991 199219931994199519961997 19981999
20002001
2002
2003 2004
200520062007
2009
Station 212
0
5
10
15
20
25
30
1988
1989
1990
1991 19921993
1994199519961997 1998
1999
2000
200120022003 2004
2005
2006
2007
2009
Station 213
Salinity in July (ppt)
0 5 10 15 20 25 30 350
5
10
15
20
25
30
1988
1989
1990 1991 199219931994
199519961997
1998
1999
2000
20012002
2003
2004
2005
20062007
2009
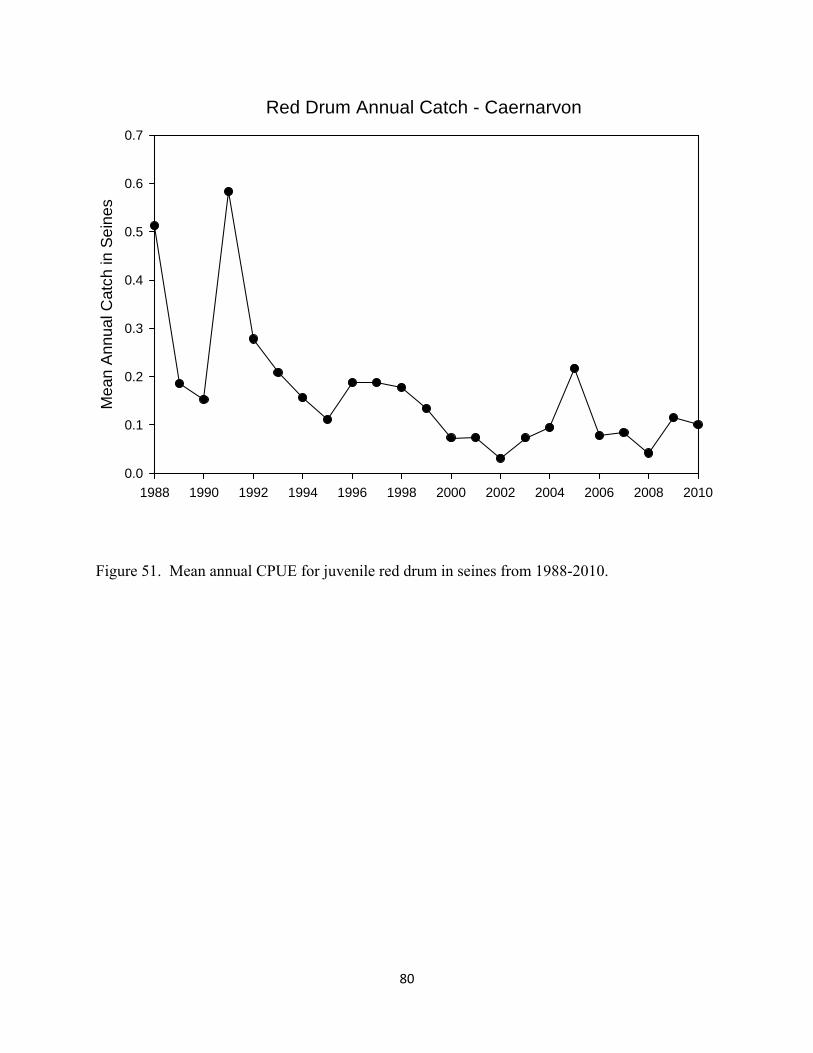
80
Figure 51. Mean annual CPUE for juvenile red drum in seines from 1988-2010.
Red Drum Annual Catch - Caernarvon
1988 1990 1992 1994 1996 1998 2000 2002 2004 2006 2008 2010
Mea
n A
nnua
l Cat
ch in
Sei
nes
0.0
0.1
0.2
0.3
0.4
0.5
0.6
0.7

81
Table 1. Results summary of the distributional analysis for five fishery species collected by the LDWF fisheries-independent monitoring program in Breton Sound from 1988-2010.
Does CFD discharge affect species abundance distribution at stations within basin in relation to salinity?
Does MS River stage affect species abundance distribution at stations within basin in relation to salinity?
Is there a trend in annual species abundance over time for Breton Sound?
Are there differences in the seasonal distributions of the species over time?
% of total sampling stations that showed changes in species abundance among operational periods
% of total sampling stations which showed changes in species abundance in relation to salinity
% of years (1988‐2010) which showed distribution of species abundance in relation to salinity
Supporting notes and/or caveats for species/gear type combinations
Brown Shrimp Seines No
Salinity at station 242 was negatively related to CFD discharge in May; no relationship between shrimp catch and salinity at stations
No Salinity at stations 250, 251 was negatively related to river stage in May; no relationship between shrimp catch and salinity at stations
No Brown shrimp catch in seines was lower since 1988‐1989, annual CPUE variable and generally < 10 (Figure 13)
No Seasonal distribution of brown shrimp catch generally consistent over years (Figure 14)
50% (3/6) Stations 250, 255 showed consistent large reductions between pre‐ and post‐operational periods (Figure 15) Station 251 showed reduced catch over time (Figure 15)
0% (0/6) Stations 250 and 251 and 255 tended to show highest shrimp catch over time (Figure 16) Other three stations and 255 had several years with very low or 0 catch (Figure 16)
9% (2/23) 1991 and 1998 showed positive relationships between shrimp catch and salinity for the six stations within the basin, i.e. shrimp catch was higher at the higher‐salinity stations within the basin
6’ trawls No ‐ Not conclusively Salinity at 36% (4/11) of the stations was negatively related to discharge in
No Salinity at station 32 was negatively related to river stage in May; no relationship between shrimp catch and salinity
Yes Brown shrimp catch in 6’ trawls was variable over time with an apparent reduction followed by an
No Seasonal distribution of brown shrimp catch generally consistent over years (Figure 18)
0% (0/11) Stations showed no consistent changes between operational periods (Figure 19)
0% (0/11) Figure 20
26% (6/23) Six years showed positive relationships between shrimp abundance
The pattern of reduced and then increased brown shrimp catch in the trawls across the stations in Breton Sound could indicate larger‐scale,

82
May (Figure 22); no relationship between shrimp catch and salinity at the stations Two years (2008, 2010) which showed a positive relationship between shrimp catch and salinity at stations within the basin had higher discharge and low salinity throughout basin
at stations apparent increase in catch (Figure 17) Higher 2010 annual CPUE partially due to incomplete data set
May CPUE for brown shrimp was high relative to the May catch in other years
Like the annual CPUE, the pattern of decreased catch and then increased catch in shrimp was generally consistent across stations
and salinity at stations within the basin (Figure 21) 2005, 2008, 2010 showed salinities ≤ 6 ppt at all stations in basin (except station 32 at 9 ppt in 2010)
regional effects on the shrimp population
16’ trawls No No relationship between salinity at stations and CFD discharge in May
Limited evidence that river stage might affect shrimp catch for one station Salinity at station 85 was negatively related to river stage in May; shrimp catch was positively related to salinity at station 85
Yes Brown shrimp catch in 16’ trawls was variable over time with an apparent reduction followed by an increase in catch (Figure 23) Higher 2010 annual CPUE partially due to incomplete data set
No Seasonal distribution of brown shrimp catch consistent over years (Figure 24) May and June CPUE for brown shrimp was high relative to the May catch in other years
0% (0/4) Stations showed no consistent changes between operational periods (Figure 25) Like the annual CPUE, the pattern of decreased catch and then increased catch in shrimp was generally
50% (2/4) Station 85 showed positive relationship between catch and salinity; station 105 showed negative relationship (Figure 26)
9% (2/23) 1994 showed a positive relationship between shrimp catch and salinity at four trawl stations within the basin; 2003 showed a negative relationship
The pattern of reduced and then increased brown shrimp catch in the trawls across the stations in Breton Sound could indicate larger‐scale, regional effects on the shrimp population
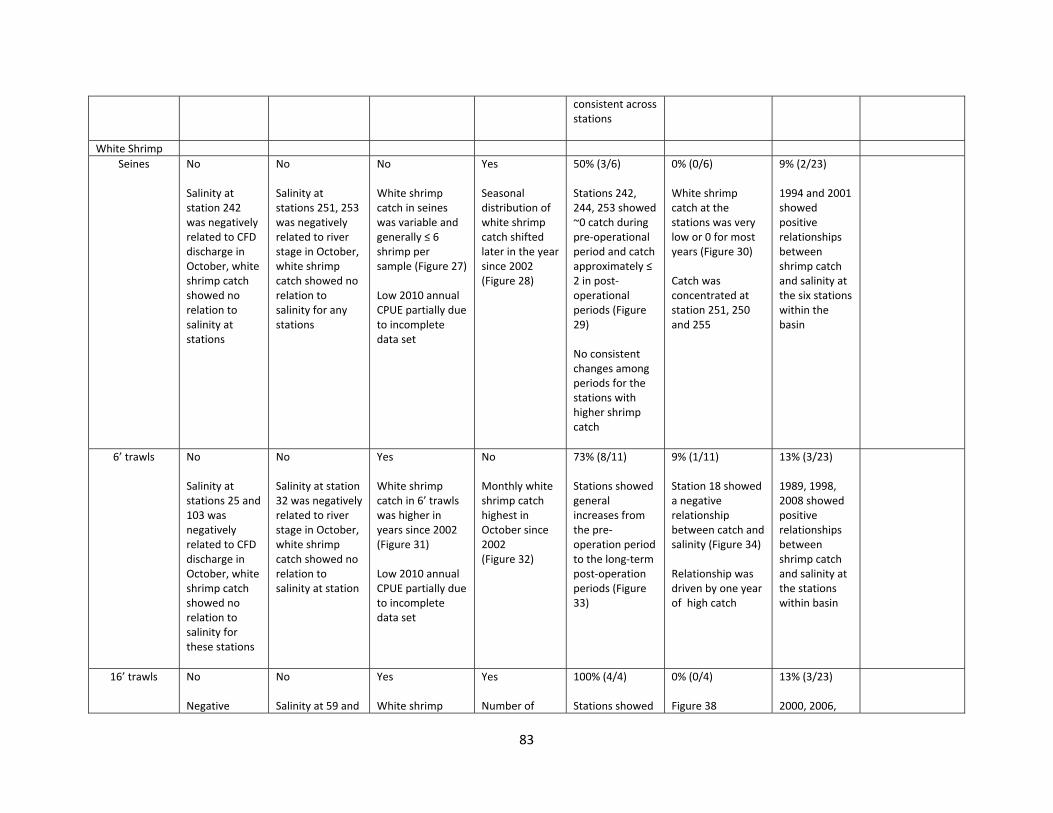
83
consistent across stations
White Shrimp Seines
No Salinity at station 242 was negatively related to CFD discharge in October, white shrimp catch showed no relation to salinity at stations
No Salinity at stations 251, 253 was negatively related to river stage in October, white shrimp catch showed no relation to salinity for any stations
No White shrimp catch in seines was variable and generally ≤ 6 shrimp per sample (Figure 27) Low 2010 annual CPUE partially due to incomplete data set
Yes Seasonal distribution of white shrimp catch shifted later in the year since 2002 (Figure 28)
50% (3/6) Stations 242, 244, 253 showed ~0 catch during pre‐operational period and catch approximately ≤ 2 in post‐operational periods (Figure 29) No consistent changes among periods for the stations with higher shrimp catch
0% (0/6) White shrimp catch at the stations was very low or 0 for most years (Figure 30) Catch was concentrated at station 251, 250 and 255
9% (2/23) 1994 and 2001 showed positive relationships between shrimp catch and salinity at the six stations within the basin
6’ trawls No Salinity at stations 25 and 103 was negatively related to CFD discharge in October, white shrimp catch showed no relation to salinity for these stations
No Salinity at station 32 was negatively related to river stage in October, white shrimp catch showed no relation to salinity at station
Yes White shrimp catch in 6’ trawls was higher in years since 2002 (Figure 31) Low 2010 annual CPUE partially due to incomplete data set
No Monthly white shrimp catch highest in October since 2002 (Figure 32)
73% (8/11) Stations showed general increases from the pre‐operation period to the long‐term post‐operation periods (Figure 33)
9% (1/11) Station 18 showed a negative relationship between catch and salinity (Figure 34) Relationship was driven by one year of high catch
13% (3/23) 1989, 1998, 2008 showed positive relationships between shrimp catch and salinity at the stations within basin
16’ trawls No Negative
No Salinity at 59 and
Yes White shrimp
Yes Number of
100% (4/4) Stations showed
0% (0/4) Figure 38
13% (3/23) 2000, 2006,
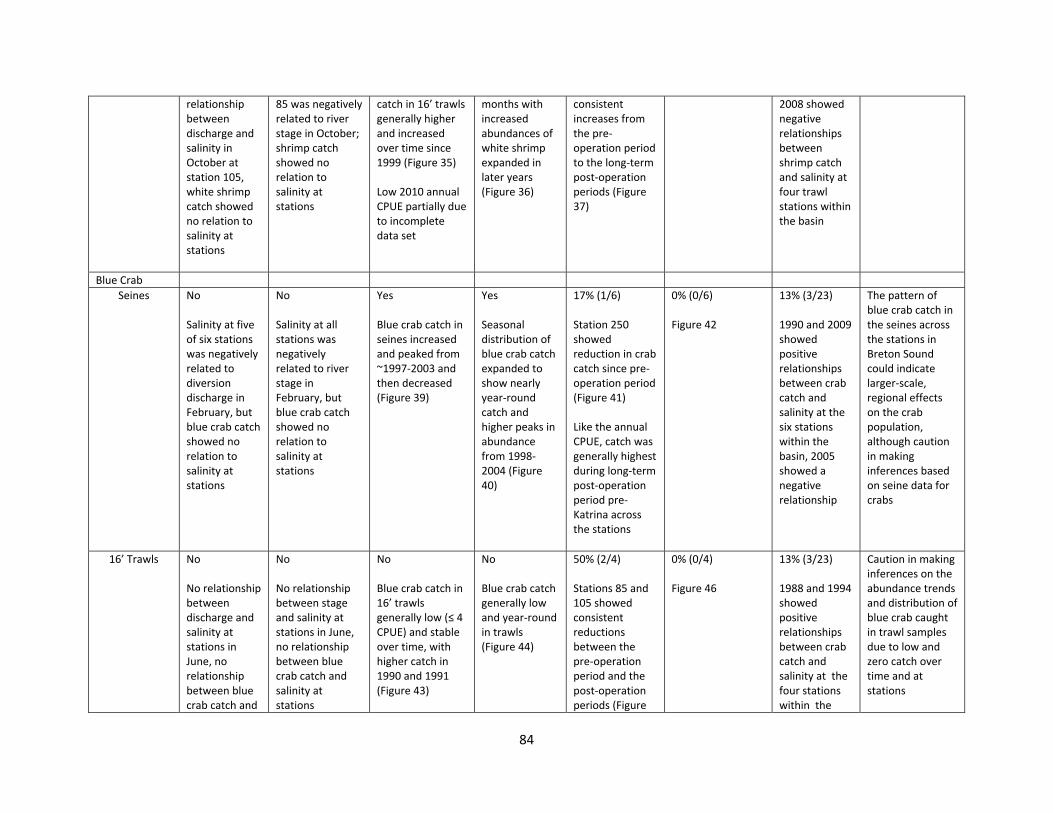
84
relationship between discharge and salinity in October at station 105, white shrimp catch showed no relation to salinity at stations
85 was negatively related to river stage in October; shrimp catch showed no relation to salinity at stations
catch in 16’ trawls generally higher and increased over time since 1999 (Figure 35) Low 2010 annual CPUE partially due to incomplete data set
months with increased abundances of white shrimp expanded in later years (Figure 36)
consistent increases from the pre‐operation period to the long‐term post‐operation periods (Figure 37)
2008 showed negative relationships between shrimp catch and salinity at four trawl stations within the basin
Blue Crab Seines No
Salinity at five of six stations was negatively related to diversion discharge in February, but blue crab catch showed no relation to salinity at stations
No Salinity at all stations was negatively related to river stage in February, but blue crab catch showed no relation to salinity at stations
Yes Blue crab catch in seines increased and peaked from ~1997‐2003 and then decreased (Figure 39)
Yes Seasonal distribution of blue crab catch expanded to show nearly year‐round catch and higher peaks in abundance from 1998‐2004 (Figure 40)
17% (1/6) Station 250 showed reduction in crab catch since pre‐operation period (Figure 41) Like the annual CPUE, catch was generally highest during long‐term post‐operation period pre‐Katrina across the stations
0% (0/6) Figure 42
13% (3/23) 1990 and 2009 showed positive relationships between crab catch and salinity at the six stations within the basin, 2005 showed a negative relationship
The pattern of blue crab catch in the seines across the stations in Breton Sound could indicate larger‐scale, regional effects on the crab population, although caution in making inferences based on seine data for crabs
16’ Trawls No No relationship between discharge and salinity at stations in June, no relationship between blue crab catch and
No No relationship between stage and salinity at stations in June, no relationship between blue crab catch and salinity at stations
No Blue crab catch in 16’ trawls generally low (≤ 4 CPUE) and stable over time, with higher catch in 1990 and 1991 (Figure 43)
No Blue crab catch generally low and year‐round in trawls (Figure 44)
50% (2/4) Stations 85 and 105 showed consistent reductions between the pre‐operation period and the post‐operation periods (Figure
0% (0/4) Figure 46
13% (3/23) 1988 and 1994 showed positive relationships between crab catch and salinity at the four stations within the
Caution in making inferences on the abundance trends and distribution of blue crab caught in trawl samples due to low and zero catch over time and at stations

85
salinity at stations
45) basin, 2003 showed a negative relationship
Spotted seatrout
Gillnets No Negative relationship between salinity at stations 212 and CFD discharge in July, no relationship between seatrout catch and salinity for station
No No relationship between river stage and salinity at stations in July
No Seatrout catch in gillnets was generally low (≤ 3 CPUE) and relatively stable over time (Figure 47)
No Seatrout caught nearly year‐round at low numbers (Figure 48)
17% (1/6) Only station 206 showed consistent increase from pre‐operation to post‐operation periods (Figure 49)
17% (1/6) Station 202 showed positive relationship between seatrout catch and salinity (Figure 50) Catch at stations was low (≤ 5 CPUE) to zero in most years Most catch occurred at stations 212 and 213 in the mid‐ and lower estuary
61% (14/23) Seatrout catch was positively related to salinity at stations within basin for most years, meaning trout catch was higher at the higher‐salinity stations within the basin
Red Drum Seines NA NA No
Juvenile red drum catch in seines was low (≤ 0.6 CPUE) (Figure 51)
NA
NA NA NA Analysis of red drum not applicable because species not sufficiently sampled within seines
Eastern Oyster Meter square TBD
Salinity at Bay Gardene
TBD Salinity at Bay Gardene station
Yes Large increase in seed and sack
NA Meter square samples taken
0% (0/27) Stations showed no consistent
NA
NA
Caution in making inferences with limited data – clutching, harvest

86
station was negatively related to monthly CFD discharge over time (Figure 12)
was negatively related to monthly river stage over time (Figure 12)
oyster production from ~1992‐2002 with low oyster production in early and later years (Figure 9)
once per year changes between operational periods (Figure 10) Like the annual CPUE, the pattern of increased seed production evident from ~1992‐2002 was generally consistent across stations (Figure 10)
not included in analysis Plots of salinity at Bay Gardene station against CFD discharge and river stage showed evidence of confounding effects on station salinity (e.g., tidal influence, precipitation)


![[Chapter 5. Multivariate Probability Distributions]people.math.umass.edu/~daeyoung/Stat515/Chapter5.pdf · [Chapter 5. Multivariate Probability Distributions] ... ity distributions](https://static.fdocuments.in/doc/165x107/5b32d34e7f8b9a2c328dc4ef/chapter-5-multivariate-probability-distributions-daeyoungstat515chapter5pdf.jpg)