PDF (1197 KB) - Ecological Society of America
57
CONCEPTS & SYNTHESIS EMPHASIZING NEW IDEAS TO STIMULATE RESEARCH IN ECOLOGY Ecological Monographs, 81(3), 2011, pp. 349–405 Ó 2011 by the Ecological Society of America Regulation of animal size by eNPP, Bergmann’s rule, and related phenomena MICHAEL A. HUSTON 1,3 AND STEVE WOLVERTON 2 1 Department of Biology, Texas State University, San Marcos, Texas 78666 USA 2 University of North Texas, Department of Geography, Denton, Texas 76203-5017 USA Abstract. Bergmann’s rule, which proposes a heat-balance explanation for the observed latitudinal gradient of increasing animal body size with increasing latitude, has dominated the study of geographic patterns in animal size since it was first proposed in 1847. Several critical reviews have determined that as many as half of the species examined do not fit the predictions of Bergmann’s rule. We have proposed an alternative hypothesis for geographic variation in body size based on food availability, as regulated by the net primary production (NPP) of plants, specifically NPP during the growing season, or eNPP (ecologically and evolutionarily relevant NPP). Our hypothesis, ‘‘the eNPP rule,’’ is independent of latitude and predicts both spatial and temporal variation in body size, as well as in total population biomass, population growth rates, individual health, and life history traits of animals, including humans, wherever eNPP varies across appropriate scales of space or time. In the context of a revised interpretation of the global patterns of NPP and eNPP, we predict contrasting latitudinal correlations with body size in three distinct latitudinal zones. The eNPP rule explains body- size patterns that are consistent with Bergmann’s rule, as well as two distinct types of contradictions of Bergmann’s rule: the lack of latitudinal patterns within the tropics, and the decline in body size above approximately 608 latitude. Both types of contradictions of Bergmann’s rule are consistent with the eNPP rule, as are a wide range of other phenomena. Key words: Bergmann’s rule; body size; fish; latitude; mammals; NPP; productivity. We are told in our first course in biology that all animals are dependent on plants for food, either directly or indirectly, and that plants in turn obtain their food from the soil and process it in the presence of sunshine, air, and water. This elementary law of nature is so simple and obvious that its import to problems of wildlife conservation has been frequently overlooked. ... What I am about to say may be interpreted by some as a highly controversial issue . ... —A. H. Denney (1944) INTRODUCTION Variation in body size among animals is of great interest in macroecology, biogeography, and conserva- tion (Margalef 1955, McNab 1971, Peters 1983, Calder 1984, Brown and Nicoletto 1991, Crooks 2002, Meiri and Thomas 2007, Olden et al. 2007, Greve et al. 2008) and is often linked to other global patterns, such as the latitudinal gradient of species richness (Blackburn and Gaston 1994, 1996, 1998, Johnson 1998a) as well as patterns of extinction (Johnson 1998b, Purvis et al. 2000, Cardillo 2003, Cardillo et al. 2005, Olden et al. 2007) and evolution (Cooper and Purvis 2010). Spatial variation in animal body size has been a major topic since at least 1847, when Bergmann published his iconic paper linking large body size to cold conditions (Bergmann 1847). With the recent development of global data sets, Bergmann’s paper has spawned a small industry in body-size analyses, but there are many interpretations of this pattern and there is relatively little consensus (Rosenzweig 1968a, McNab 1983, Geist 1987a, b, Cousins 1989, Ashton et al. 2000, Meiri and Dayan 2003, Meiri et al. 2004, Rodrı´guez et al. 2006, Meiri and Thomas 2007, Watt et al. 2010, Meiri 2011). Numerous correlates of body-size variation have been investigated, including latitude, latitudinal range, geo- graphical range size, temperature, temperature range, annual precipitation, precipitation range, net primary Manuscript received 6 August 2010; revised 1 March 2011; accepted 2 March 2011. Corresponding Editor: A. M. Ellison. 3 E-mail: [email protected] 349
Transcript of PDF (1197 KB) - Ecological Society of America
CONCEPTS & SYNTHESISEMPHASIZING NEW IDEAS TO STIMULATE RESEARCH IN ECOLOGY
Ecological Monographs, 81(3), 2011, pp. 349–405� 2011 by the Ecological Society of America
Regulation of animal size by eNPP, Bergmann’s rule,and related phenomena
MICHAEL A. HUSTON1,3
AND STEVE WOLVERTON2
1Department of Biology, Texas State University, San Marcos, Texas 78666 USA2University of North Texas, Department of Geography, Denton, Texas 76203-5017 USA
Abstract. Bergmann’s rule, which proposes a heat-balance explanation for the observedlatitudinal gradient of increasing animal body size with increasing latitude, has dominated thestudy of geographic patterns in animal size since it was first proposed in 1847. Several criticalreviews have determined that as many as half of the species examined do not fit the predictionsof Bergmann’s rule. We have proposed an alternative hypothesis for geographic variation inbody size based on food availability, as regulated by the net primary production (NPP) ofplants, specifically NPP during the growing season, or eNPP (ecologically and evolutionarilyrelevant NPP). Our hypothesis, ‘‘the eNPP rule,’’ is independent of latitude and predicts bothspatial and temporal variation in body size, as well as in total population biomass, populationgrowth rates, individual health, and life history traits of animals, including humans, wherevereNPP varies across appropriate scales of space or time. In the context of a revisedinterpretation of the global patterns of NPP and eNPP, we predict contrasting latitudinalcorrelations with body size in three distinct latitudinal zones. The eNPP rule explains body-size patterns that are consistent with Bergmann’s rule, as well as two distinct types ofcontradictions of Bergmann’s rule: the lack of latitudinal patterns within the tropics, and thedecline in body size above approximately 608 latitude. Both types of contradictions ofBergmann’s rule are consistent with the eNPP rule, as are a wide range of other phenomena.
Key words: Bergmann’s rule; body size; fish; latitude; mammals; NPP; productivity.
We are told in our first course in biology that
all animals are dependent on plants for food, either
directly or indirectly, and that plants in turn obtain
their food from the soil and process it in the presence
of sunshine, air, and water. This elementary law of
nature is so simple and obvious that its import to
problems of wildlife conservation has been frequently
overlooked. . . . What I am about to say may be
interpreted by some as a highly controversial issue . . . .
—A. H. Denney (1944)
INTRODUCTION
Variation in body size among animals is of great
interest in macroecology, biogeography, and conserva-
tion (Margalef 1955, McNab 1971, Peters 1983, Calder
1984, Brown and Nicoletto 1991, Crooks 2002, Meiri
and Thomas 2007, Olden et al. 2007, Greve et al. 2008)
and is often linked to other global patterns, such as the
latitudinal gradient of species richness (Blackburn and
Gaston 1994, 1996, 1998, Johnson 1998a) as well as
patterns of extinction (Johnson 1998b, Purvis et al. 2000,
Cardillo 2003, Cardillo et al. 2005, Olden et al. 2007)
and evolution (Cooper and Purvis 2010). Spatial
variation in animal body size has been a major topic
since at least 1847, when Bergmann published his iconic
paper linking large body size to cold conditions
(Bergmann 1847). With the recent development of
global data sets, Bergmann’s paper has spawned a small
industry in body-size analyses, but there are many
interpretations of this pattern and there is relatively little
consensus (Rosenzweig 1968a, McNab 1983, Geist
1987a, b, Cousins 1989, Ashton et al. 2000, Meiri and
Dayan 2003, Meiri et al. 2004, Rodrıguez et al. 2006,
Meiri and Thomas 2007, Watt et al. 2010, Meiri 2011).
Numerous correlates of body-size variation have been
investigated, including latitude, latitudinal range, geo-
graphical range size, temperature, temperature range,
annual precipitation, precipitation range, net primary
Manuscript received 6 August 2010; revised 1 March 2011;accepted 2 March 2011. Corresponding Editor: A. M. Ellison.
3 E-mail: [email protected]
349

production (NPP), food supply, and species richness, the
last of which potentially involves a sampling effect that
may skew data (Meiri and Thomas 2007).
Meiri (2011) points out that Bergmann’s rule is
actually an empirical generalization that describes a
common intraspecific pattern in endotherms. An empir-
ical generalization ‘‘is a statement concerning known
phenomena that is treated as a law that holds in all times
and places. The statement is not really known to be a
law; instead this stature is assigned to empirical
generalizations based on repeated, non-contradictory
observations’’ (Wolverton and Lyman 2000:237; em-
phasis in original). Bergmann (1847) hypothesized that
heat conservation was the explanatory mechanism
underlying his rule. We note, however, that process
and pattern are often conflated in the literature, and that
a single type of pattern may have multiple causal
processes operating at different times and places. What
is needed to overcome this problematic empirical
generalization is an explanatory rule that ascribes an
ecologically sound mechanism for patterns in animal
growth, body size, and biomass that is independent of
latitude and geographic scale.
The literature on Bergmann’s rule has been described
as ‘‘chaotic’’ (McNab 2010). In spite of intense interest
in this subject, there is argument about whether size
variation should be analyzed at the intra- or interspecific
level, or even at higher taxonomic levels (e.g., Lindsey
1966). There is even disagreement over the taxonomic
level at which Bergmann intended his rule to apply (cf.
James 1970, Blackburn et al. 1999, Meiri and Thomas
2007, Meiri 2011). At the intraspecific level, where much
of the recent work has been done, the focus has been on
determining which taxa show the expected latitudinal
pattern. Most groups of homeotherms show the pattern
predicted by Bergmann (Ashton et al. 2000, Meiri and
Dayan 2003). However, many groups of poikilotherms,
which are not subject to the heat-conservation mecha-
nisms underlying Bergmann’s rule, also show the same
pattern of increasing body size with latitude (Ray 1960,
Lindsey 1966, Atkinson 1994, Ashton 2002, Ashton and
Feldman 2003).
At the interspecific, ‘‘community,’’ or assemblage
level, most studies find the expected positive correlation
between mean body size and latitude for birds (Black-
burn and Gaston 1996) and mammals (Blackburn and
Hawkins 2004, Rodrıguez et al. 2006, Cooper and Purvis
2010) consistent with Bergmann’s rule. However, Meiri
and Thomas (2007) point out that part of the pattern
may be an artifact of there being fewer small-bodied
species where species richness is low, as at high latitudes.
This is a valid concern, and points toward fundamental
problems with this approach. One critical flaw has been
that there is no scaling by species abundance for
determining the community mean. Any species that is
present in a region, no matter how rare, is included in
‘‘average body size’’ of the assemblage in that region.
Thus, the body size of a rare large animal contributes as
much as that of a common smaller animal. This problem
persists regardless of whether a species is analyzed on
the basis of the centroid of its range or its presence in
each grid cell or region encompassed by its range (e.g.,
Blackburn et al. 1999, Blackburn and Hawkins 2004).
The approach is unsound as currently applied and is
unlikely to lead to a functional or mechanistic under-
standing of factors that influence either average body
size in an assemblage or the distribution of body sizes
(sensu Cooper and Purvis 2010, McNab 2010).
A more appropriate way to calculate mean commu-
nity body mass would be to scale body size by the total
mass of all individuals of each species present in an area
(converted to a proportion of the total mass of all
species). Unfortunately, such data are very scarce and
logistically challenging to collect, so there are few
publications that provide a functionally relevant mean
assemblage biomass. Alternatively, because outlier
species (usually with large body size) skew community
means, a simple compromise is to compare communities
using median size, which is less sensitive to problems of
skewness (McGrew and Monroe 2000, Weiss 2002,
Cooper and Purvis 2010). The issue of functionally
relevant proportional representation is most problemat-
ic in mammals, which have a huge range in body size. In
contrast, the relatively small body-size range of birds
should reduce the bias introduced by variation in species
richness and seems to produce interpretable results (e.g.,
Blackburn and Gaston 1996). Natural selection and the
vicissitudes of evolutionary history have led to many
situations such as the co-occurrence of large elephants
and small rodents in the same habitat. Neither the mean
of these species summed, nor the range of body mass
they represent, are likely to teach us much about the
effects of environmental conditions on animal body size.
Given the problems associated with the current
emphasis on the ‘‘community approach’’ to evaluating
Bergmann’s rule, we focus primarily on intraspecific size
variation, which eliminates several alternative (and
therefore confounding) mechanisms that may operate
at the interspecific or community level. The excluded
mechanisms are (1) selection for alternative life history
strategies and body sizes in the same environment; (2)
consequences of random ancestral colonization and
diversification of large-bodied or small-bodied species;
(3) selective advantage of traits linked to, but function-
ally unrelated to, body size; and (4) higher migration
ability of large-bodied species for recolonizing deglaci-
ated areas (more likely to be important for mammals
than for birds). Each of these mechanisms could
potentially operate on the large variation in size found
between species, but is unlikely to be relevant to the
much smaller size range found between populations of
the same species (Blackburn and Hawkins 2004). So,
what are the potential mechanisms that are relevant at
the intraspecific level?
Scientists have long realized that Bergmann’s rule is
not really about latitude, but rather about something
MICHAEL A. HUSTON AND STEVE WOLVERTON350 Ecological MonographsVol. 81, No. 3
CONCEPTS&SYNTHESIS
correlated with latitude. While Bergmann’s original
focus was clearly on the implications of relative body
surface area for the conservation of heat in cold
climates, investigators over the past century have
realized that there are a number of factors other than
temperature that could be the ultimate cause of
whatever correlations exist between body size and
latitude. Numerous hypotheses have been proposed.
We believe that there is some, as yet unrecognized (or, at
a minimum, underappreciated) fundamental cause of the
latitudinal variation in body size described by Berg-
mann’s rule. This cause should be mechanistically
independent of latitude and its direct correlates such as
temperature or insolation, though it must obviously be
correlated with latitude in situations where the Berg-
mann pattern is found. This cause could potentially be
related to a wide range of other ecological phenomena in
addition to Bergmann’s rule. For example, animal body
size, which for many taxonomic groups is highest in the
high temperate latitudes, is obviously and inversely
correlated with the general latitudinal gradient of species
diversity, which for most taxonomic groups is lowest in
the high latitudes. Interesting evidence related to the
mechanistic independence of the body-size pattern from
latitude was reported by Blackburn and Gaston (1996)
who found that body size was more strongly correlated
(negatively) with species richness in neotropical birds
than it was with latitude (positively) (see also Cooper
and Purvis 2010).
Much of the debate on Bergmann’s rule centers on
mechanisms that have little to do with phenotypic
plasticity in body-size variation at the intraspecific level,
including heat conservation (Bergmann 1847, Rodrıguez
et al. 2006), heat dissipation (James 1970), and
starvation resistance (Lindsey 1966, Rosenzweig 1966,
Calder 1984, Lindstedt and Boyce 1985, Kooijman
1986). In our opinion, the fact that these mechanisms,
rather than a simple explanation such as food quantity
and quality, have been the focus of efforts to explain
body size is the consequence of a fundamental misun-
derstanding of the latitudinal distribution of terrestrial
NPP and thus of the pattern of food availability for
virtually all animals (see Huston 1994, Geist 1998, 1999,
Huston and Wolverton 2009, Wolverton et al. 2009a). In
a recent paper, we reevaluated evidence for the global
distribution of net primary production and proposed a
new concept, ecologically and evolutionarily relevant
NPP (eNPP, Huston and Wolverton 2009); eNPP,
defined as net primary production during the growing
season, is highest in the temperate regions/latitudes of
the world.
The significance of the eNPP concept is that it
specifically addresses the NPP that is available to meet
the energetic and nutritional demands of animals (and
plants) during that time when they are reproducing and
growing. This period, generalized as the ‘‘growing
season,’’ is when ecological processes, such as competi-
tion and predation, and evolutionary processes, such as
reproduction and gene flow, occur with their greatest
intensity. In the many regions of the world where there is
also a non-growing, dormant, or ‘‘starvation’’ season,
the survival of organisms depends on the amount of
resources that they have acquired during the growing
season. eNPP, then, refers to the rate of production of
energy-rich plant compounds that also contain chemical
elements and complex organic molecules that animals
are unable to produce by themselves, specifically during
the time when they are critical to growth and
reproduction. In contrast to this concept, NPP is
conventionally expressed as an annual rate, which sums
fluctuations in plant growth rates over the entire year,
during which they may vary from very high to zero,
particularly in climates that have high seasonality due to
fluctuations in either temperature or precipitation.
In the humid tropics, where seasonality is low, the
total annual NPP is apparently about the same as that in
most temperate forests (Huston 1994, Huston and
Wolverton 2009). However, because this tropical NPP
is spread over the entire year, it actually represents
chronically low productivity during the times of
reproduction and growth (i.e., eNPP), which may or
may not vary in length or timing, depending on the
species and on rainfall seasonality. In contrast, in the
temperate zone, and the seasonal tropics, the short-term
rate of plant growth (i.e., eNPP) is very high during part
of the year and low or zero the rest of the year. In these
seasonal environments, the reproduction and growth of
plants and animals is concentrated into the time period
when the rate of plant growth is highest. During the
unfavorable season, most plants and some animals
become dormant (e.g., hibernate or aestivate), while
some animals migrate to other areas, and others remain
and survive on whatever food they can find, generally
losing mass until the arrival of the growing season.
The principles of trophic dynamics and energetics
extend the consequences of eNPP from the primary
producer level to the higher trophic levels of herbivores
and carnivores, with the inevitable approximate 90
percent loss of energy with each trophic transfer
(consumption event). Thus, it is appropriate to consider
secondary productivity (animal growth rate) in the same
seasonal framework as eNPP. The short-term animal
growth rate (interpreted at either the individual or
population level), is designated here as eNSP (ecologi-
cally and evolutionarily relevant net secondary produc-
tion), which varies seasonally from high positive values
during the growing season, to negative values for most
species during the non-growing (winter or dry) season.
In addition to the temporal fluctuations in short-term
productivity (i.e., eNPP and eNSP) due to seasonality,
there are also spatial variations in eNPP due to
differences in the availability of water and/or nutrients,
either in the soil, or dissolved in the waters of oceans,
lakes, and rivers. Globally, temperature and water-
dependent biogeochemical processes operate to cause
soil weathering and leaching processes to operate most
August 2011 351eNPP AND BODY SIZE
CONCEPTS&SYNTHESIS
rapidly in the tropics, leading to nutrient loss and
infertile soils. In the temperate zone, where these
processes occur more slowly, and periodic glaciation
refreshes mineral resources, soil fertility tends to be
higher. Thus in the temperate latitudes soils are rich and
the climate allows rapid plant growth during the
growing season.
In contrast, in the tropics, while solar energy input is
high and water is abundant, soils are often infertile
(Uehara and Gillman 1981, Richter and Babbar 1991),
which limits eNPP and thus the quantity as well as the
quality of plant material as food (Albrecht 1941, 1955,
1957, Trowell 1949, Meggers 1971, McKey et al. 1978,
Gartlan et al. 1980). In the arctic region, although soils
may be rich, the growing season is extremely short. Thus
the tropics are nutrient limited, the arctic is limited by
growing season duration, and the temperate region
reflects the beneficial intersection of soils that have been
reworked by glaciation and deglaciation and climate
that permits seasonally high NPP with high nutrient and
protein content. As a result, the bread baskets of the
world, contrary to what might be expected from the
conventional belief that NPP is highest in the tropics,
occur at the temperate latitudes within specific regions of
climatically driven soil development (Albrecht 1957,
Huston 1993, 1994, 2005). That eNPP is highest in the
temperate latitudes is reflected in several relevant data
sets that have been overlooked in part because forests in
these regions have been highly modified or eradicated
over the past few centuries or millennia, while, at least
until recently, most tropical rain forests were mature or
old growth (Huston and Wolverton 2009). Indeed, it has
recently been recognized that ecosystems at temperate
latitudes are important (often unrecognized) global
carbon sinks (Enting and Mansbridge 1991, Ciais et al.
1995, Enting 2000, Myneni et al. 2001).
Our current understanding of the mean latitudinal
distribution of eNPP is summarized in Fig. 1. These data
from ground-based measurements of forest above-
ground annual NPP, converted to eNPP by dividing
by the length of the growing season (Huston and
Wolverton 2009: Fig. 10E; based on Olson et al.
2001a, b), represent the best current empirical estimate
of the global distribution of forest aboveground NPP
(there are insufficient data to generalize for other
vegetation types). The average monthly eNPP (thick
solid line) is nearly twice as high in the temperate zone as
in the tropics, while the maximum values of eNPP (thin
solid line) increase to approximately five times higher
around 508 north latitude before declining toward the
poles.
We believe that the historical misunderstanding of the
global distribution of NPP and eNPP as being highest in
the tropics has hampered the development of a coherent
ecological understanding of spatial variation in animal
body size. Specifically, we will demonstrate that the
distribution of eNPP explains not only cases in which
body size in animals conforms to Bergmann’s rule but
also many cases in which body-size patterns contradict
Bergmann’s rule, as well as numerous body-size clines
that are not related to latitude. When the global
distribution of eNPP is understood correctly, most of
the ‘‘evidence’’ for Bergmann’s rule disappears. We
conclude that the distribution of temperature has little
to do with animal body size (Geist 1987a; see also Ho et
al. 2010 for insects), other than temperature’s direct and
indirect effects on the distribution of plant productivity.
Instead, intraspecific body-size variation, as well as
maximum body size within clades, is regulated primarily
by the geographic distribution of the food for animals
provided by plant growth (eNPP). In short, the largest
individuals within species and the highest population-
and community-level animal biomass should occur in
the same regions as the bread baskets of the world,
where soils are the most fertile and where plants are
abundant, productive, and nutritious.
In a recent paper addressing Bergmann’s rule in
mammals, McNab (2010) postulates that the availability
of resources, i.e., food, drives variability in mammalian
body size. He terms this relationship the ‘‘resource rule’’
and discusses how it accounts for most of the
mechanisms suggested to explain Bergmann’s rule and
its exceptions. We presented a very similar hypothesis in
our NPP paper (Huston and Wolverton 2009), but there
are subtle and important differences between McNab’s
‘‘resource rule’’ and the explanations we propose for
variability in animal body size. Our argument is that the
global distribution of net primary productivity during
the growing season (eNPP) is the fundamental pattern of
energy and nutrient availability that explains spatial
patterns of secondary production, intra-clade body size,
and the growth and reproduction of all animals, not
only mammals. Because eNPP is the mechanism driving
food availability, which in turn influences the growth
rates and body sizes of primary consumers (i.e., net
secondary production, or eNSP) and thus the produc-
tion of higher trophic levels as well, the general rule
should be termed the ‘‘eNPP rule’’ or ‘‘Geist’s rule,’’ with
recognition of the seminal contributions of Valerius
Geist who first introduced this fundamental concept in
the context of cervid body size (Geist 1987a, 1998).
The eNPP rule addresses spatial (and also temporal)
variation in animal body size and is based on the effect
of food availability on growth (see Plate 1). It can be
stated as: in species or groups of closely related species
with geographic distributions that span a range of
environmental conditions, the largest individuals and
the highest ontogenetic growth rates, and/or the highest
population densities and highest population growth
rates, will occur in the portions of their range where
food availability (eNPP) is highest.
We emphasize ‘‘ontogenetic growth rates’’ because
animal body size is not a simple property, and the mass
of a single individual can vary dramatically over time,
particularly in animals that accumulate or metabolize
various tissue types. By ‘‘ontogenetic growth,’’ we mean
MICHAEL A. HUSTON AND STEVE WOLVERTON352 Ecological MonographsVol. 81, No. 3
CONCEPTS&SYNTHESIS

the increase in size of an animal’s structural framework,
such as the skeleton of vertebrates or the exoskeleton of
many invertebrates. In animals with indeterminate
growth, the period of ontogenetic growth may be the
entire lifespan of the individual. However, in animals
with determinate growth, which includes endothermic
vertebrates and most insects, the period of ontogenetic
growth may range from weeks or months to decades.
Once the individual reaches physiological maturity, its
skeletal dimensions are fixed, and any further change in
mass can result only from increases or decreases in the
amount of various tissues supported by the skeleton.
Consequently, measurements of body mass, which may
increase or decrease by 50% or more in a single
individual due to the gain or loss of fat and muscle,
can be highly variable over time and represent responses
to current environmental conditions, specifically the
short-term abundance of food. In animals with deter-
minate growth the size of the mature skeleton remains
fixed, and represents the effect of environmental
conditions during the period of ontogenetic growth,
which is generally a relatively short period of time
during which the increase in size is very rapid. Care must
be taken when interpreting and comparing body sizes,
particularly in distinguishing skeletal dimensions from
live mass. Use of either can be informative, but they
respond to environmental conditions at different tem-
poral scales and stages of life.
Just as high food availability produced by high eNPP
can lead to high ontogenetic growth rates and large body
size for individual organisms, it can also allow high
population growth rates (e.g., fecundity and survival)
and high population densities. However, because high
population densities can reduce the food available to
individual animals, there may be some tradeoffs between
population size and body size, as suggested by the
‘‘energetic-equivalence rule’’ (Damuth 1981, 1987, 1991,
Allen et al. 2002) and documented by numerous studies
of population density and growth rates (discussed in
Effects of Latitude and Food Availability on Intraspecific
Variation in Body Size). The energetic basis of the eNPP
rule means that population biomass density should be
highest where eNPP is highest. Other environmental or
behavioral conditions that affect life history strategies
may alter the relative contributions of body size vs.
population density to total biomass density.
We emphasize that the eNPP rule does not mention
latitude because eNPP varies along many different types
of environmental gradients and is not mechanistically
linked with latitude per se. In large-scale geographic
cases in which the rule applies across latitude or other
axes, it is because spatial differences in maximum rates
of food availability during the growing season drive
variations in ontogenetic growth rates, body size, and
biomass across space.
Of the reported body-size patterns associated with
latitude, some are positively correlated with latitude,
FIG. 1. The global average latitudinal patterns of growing season length (hatched line) and ecologically and evolutionarilyrelevant NPP (eNPP) that are the basis of latitudinal predictions of the ‘‘eNPP rule.’’ The solid thick line is mean eNPP, and thesolid thin line is maximum eNPP, per 108 latitudinal band, based on 362 forest sites from a large, well-documented compilation ofmeasurements of forest aboveground NPP (ecosystem model–data intercomparison [EMDI] Classes A and B) collected over thepast 50 years (based on Huston and Wolverton [2009: Fig. 11D, F], using data from Olson et al. [2001a, b]). Animal body size ispredicted to be positively correlated with eNPP, particularly the maximum values (thin solid line), which correspond to the locallymost productive habitats that are preferred by most animals. B*0 is the latitudinal range over which we predict no correlation ofbody size with latitude. Bþ is the range over which we predict a positive correlation of body size with latitude, consistent withBergmann’s rule, and B� is the range over which we predict that body size will be negatively correlated with latitude, contradictingBergmann’s rule. While these eNPP values are based on the best NPP compilation of actual measurements available, they are fromforests only, and the geographical coverage is extremely uneven. High-latitude herbaceous and shrub NPP (above tree line) isprobably underestimated, and the actual patterns in different parts of the world will vary from the global averages summarizedhere. Negative latitudes are south of the equator.
August 2011 353eNPP AND BODY SIZE
CONCEPTS&SYNTHESIS

consistent with Bergmann’s rule (Fig. 1, latitudinal
range Bþ), others are negatively correlated with latitude
and thus the opposite of Bergmann’s rule (Fig. 1,
latitudinal range B�), and others, particularly across the
tropics, show little or no relationship to latitude, and are
thus also inconsistent with Bergmann’s rule (Fig. 1,
latitudinal range B*0). Nearly all of these latitudinal
body-size distributions track the latitudinal distribution
of eNPP and thus are consistent with the eNPP rule,
regardless of whether or not they are consistent with
Bergmann’s rule. Some of the examples we review in the
following sections of this paper are limited in spatial
scale and simply discuss difference in food availability as
a product of difference in population density or habitat
across small areas or short time periods. These smaller-
scale cases illustrate the proximate mechanism underly-
ing the eNPP rule: food availability. We believe that the
eNPP rule is a relatively simple explanation for many
geographic patterns that has been generally overlooked
because of a fundamental misunderstanding of the
global distribution of NPP and eNPP (Huston and
Wolverton 2009).
Geist’s model of animal body size in relation to latitude
The basic ideas behind our hypothesis were indepen-
dently explained by Valerius Geist, a wildlife biologist
who focused his research on studying the evolutionary
biology and ecology of cervids and other ungulates
(Geist 1987a, b, 1998, 1999, see also Albrecht 1944,
Denney 1944, Crawford 1950). His graphical model
(Fig. 2) elegantly demonstrates what we consider to be
the latitudinal distribution of eNPP on its y-axis. Geist
(1978, 1998) explicitly links phenotypic plasticity in
ecomorphology (e.g., body size) to habitat variability,
mainly in terms of food availability during the period of
reproduction and growth. But Geist (1978) states that
such variability may also be epigenomic, such that
individuals comprising the same genome can express
ecomorphology in very different ways in different
habitats (see Bogin and Rios [2003] for an example in
Homo sapiens). He identifies epigenetic and phenotypic
plasticity as particularly important in driving variability
in body size and other expressions of phenotypes in
cervids between populations (or between closely related
subspecies and species). That Geist (1978) highlighted
epigenetic responses as critical to understanding vari-
ability in ecomorphology has generally been overlooked,
and only recently have wildlife biologists, evolutionary
biologists, and anthropologists begun to recognize that
population genetics is not the explanation for all (or
perhaps not even most) intraspecific variability in
ungulate body and horn or antler size (Bossdorf et al.
2008, Pfennig et al. 2010) or body size in other animals,
including humans.
We believe Geist’s model has received so little
attention in studies that examine geographic patterns
of body size primarily because the distribution of
terrestrial NPP has been thought to be the opposite of
the seasonal pulses that Geist proposed, since NPP has
been considered to be highest in the tropics (Westlake
1963, Leith and Whittaker 1975, Ajtay et al. 1979, Olson
et al. 1983, Field et al. 1998, Saugier et al. 2001).
Numerous wildlife studies highlight that body-size
patterns related to eNPP occur at multiple spatial scales
and with a variety of latitudinal, longitudinal, and
elevational orientations (e.g., Crawford 1946, 1950,
Murphy and Porath 1969, Jacobson 1984, Maehr et al.
2001, Wolverton et al. 2009a).
In the following sections, we review multiple studies of
body size in Northern Hemisphere large cervids and
carnivores, other mammals (including Homo sapiens),
birds, insects, and marine fish in order to evaluate the
role of phenotypic plasticity in ontogenetic growth rate
as the primary mechanism causing the relationship of
animal body size to food quantity and quality, eNPP,
and latitude. In some cases, the studies are small in geo-
spatial scale and are thus relatively ‘‘controlled’’ in terms
FIG. 2. Geist’s model of seasonal and latitudinal variationin food availability. (A) Seasonal cycle of food surplus and fooddeficit that corresponds to periods of the year when animalsgain or lose mass. (B) Latitudinal differences in the durationand magnitude of the seasonal pulse of food availability(analogous to eNPP; from Geist [1998: Fig. 1.8]). T1 and T2
are the beginning and end of the seasonal resource pulse in thetemperate zone; t1 and t2 are the same for the tropics. The figureis reprinted with the permission of Stackpole Books.
MICHAEL A. HUSTON AND STEVE WOLVERTON354 Ecological MonographsVol. 81, No. 3
CONCEPTS&SYNTHESIS

of determining the distribution of food resources and
body size. In other cases, we review studies that examinelatitudinal gradients in body size to determine whether
or not patterns in size reflect the average latitudinaldistribution of eNPP as we understand it (Fig. 1). We
expect that there will be numerous examples of studiesthat contradict our general predictions about thelatitudinal distribution of body size because eNPP is
not always positively correlated with latitude (e.g., theAfrican Sahel and other desert margins) and latitudinal
productivity gradients differ somewhat between theEarth’s major regions (i.e., New World, Europe/Africa,
and Asia). We also acknowledge that other factors cancause geographic variability in body size, particularly at
the interspecific level, such as phylogenetic history,behavioral ecology, longitudinal variability in climate,
soils, and habitat properties, species range size, contin-gencies of reproduction, and competition, among others.
Our purpose here is not to be exhaustive, but tohighlight multiple cases in which variation in food
availability driven by eNPP relates closely to animalbody size, as well as to address apparent exceptions to
the eNPP rule.We begin our review by examining intraspecific body-
size patterns in northern palearctic and nearctic mam-mals for several reasons. First, large mammals havelarge geographic ranges and thus can be examined under
a variety of habitat conditions. Second, terrestrialspecies have relatively small migration ranges, thus it
is easier to study intraspecific body-size effects in specifichabitats than in species that migrate long distances (e.g.,
migratory birds). Third, our primary focus is on whetheror not the terrestrial distribution of eNPP explains the
spatial distribution of intraspecific body size, soterrestrial mammals with large geographic ranges are
ideal species to study. We extend our review tointerspecific body-size variation in later sections.
EFFECTS OF LATITUDE AND FOOD AVAILABILITY
ON INTRASPECIFIC VARIATION IN BODY SIZE
Geographic variation in body size of cervids
In North America, body size in cervids varies alongthe latitudinal gradient. Members of this family are
smallest in the tropics, largest in the temperate latitudes,and decrease in size north of 608 N latitude (Fig. 3),
which matches the currently available information onthe mean latitudinal distribution of forest eNPP (Fig. 1;
Huston and Wolverton 2009: Fig. 11E). Geist (1987a, b,1998) attributes this size variability in Cervidae directly
to the greater seasonal resource pulse evident in Fig. 2 attemperate latitudes. That is, the largest species of North
American cervid, Moose (Alces alces), has a geographicrange that spans roughly 50–608 N latitude (though this
range is expanding southward today in some areas[Franzmann 2000]). Just as revealing, however, are theintraspecific distributions of body size within the two
species that cover the greatest latitudinal ranges, caribou(Rangifer tarandus) and white-tailed deer (Odocoileus
virginianus). There is much to be gained not only from
closely inspecting Geist’s analysis of cervid size by
latitude, which highlights that white-tailed deer and
caribou body size are greatest at 50–608 N latitude,
where they overlap with moose, but from understanding
the mechanisms that produce phenotypically plastic
effects on body size at smaller spatial scales. Below we
present evidence showing that where food availability
per animal during the growing season is high, ontoge-
netic growth rate and body size (usually measured as
body mass) are also high. There are two primary factors
that influence food availability per animal: competition
for food (e.g., population density) and habitat produc-
tivity (eNPP; Wolverton et al. 2009a). Intraspecific
variation in body size simply reflects variation in food
availability per animal.
Moose
Moose (Alces alces) are generalist browsers that
occupy large resource patches for long periods (Geist
1998). Good habitat includes a fire-disturbance regime
that provides early successional regrowth of nutritious
browse peaking in quality at roughly 30-year intervals
(Franzmann 2000). Moose feed on trees and shrubs in
the winter and herbaceous plants during the summer
(Coady 1982), when aquatic habitats provide browse
high in mineral nutrients (Jordan 1987, Shipley et al.
1998). Coady (1982:911) summarizes the seasonal cycle
in the following way, ‘‘the energy derived from food
during winter is less than that required for survival, and
stored fat and protein are catabolized, resulting in
weight loss. During the summer more energy is
produced from food than is required, and the excess
energy is stored as body tissue and results in weight
FIG. 3. The distribution of body size in North AmericanCervidae, which peaks at 50–608 N latitude, conforming to theeNPP rule and Geist’s rule (from Geist [1998: Fig. 1.9]). Thefigure is reprinted with the permission of Stackpole Books.
August 2011 355eNPP AND BODY SIZE
CONCEPTS&SYNTHESIS

gain.’’ Clearly, the largest moose should occur where
summer-food quality and quantity allow the greatest
mass gain in relation to the mass loss during the winter.
Sand et al. (1995) published a comprehensive study of
latitudinal variability in moose in Sweden. They
demonstrate that ‘‘moose living at northern latitudes
[roughly 668 N] grow to a 15–20% larger adult body
mass, and have a growth period on average 2 years
longer than moose living at southern latitudes’’ (roughly
588 N; Sand et al. 1995:439). Their results also indicate
that body size is negatively correlated with population
density across the study populations (from 568 to 688 N).
Although Sand et al. (1995) state that their low-latitude
populations occur in relatively high productivity habi-
tats, they suggest that the larger seasonal amplitude of
body mass variation associated with high seasonal food
quality and quantity in summers at high latitude may
explain why moose from northern populations are larger
(sensu Suttie and Webster 1995 for caribou/reindeer).
Interestingly, Sand et al. (1995) demonstrate that moose
in northern populations are not larger in terms of
skeletal indicators of size but only in terms of body mass
(see Simard et al. 2008 for a similar effect in white-tailed
deer). This aligns with their separate conclusion that
growth after the juvenile stage accounts for much of the
variability and difference in body size between popula-
tions. They conclude that ‘‘nutritional quality may
therefore in some latitudinal interval impose a major
effect on body growth and adult body size among
populations of ungulates, outweighing the effects of land
productivity and thus the quantity of forage available’’
(Sand et al. 1995:440).
Ferguson et al. (2000) more explicitly link ontogenetic
growth rate and body size in moose to the effects of
population density on food availability. Ferguson et al.
(2000, Ferguson 2002) compare North American pop-
ulations of moose from coastal (Newfoundland) and
inland (Ontario) settings. In general, inland populations
were lower in density, due to higher rates of predation
and harvest, and had more rapid growth rates and larger
body size. Ferguson (2002:309) concludes that ‘‘moose
in coastal environments live at higher densities relative
to available forest cover, have later age at maturity,
slower [ontogenetic] growth rates, and lower reproduc-
tion.’’ Paramount to this explanation is the role of food
availability per animal in determining adult body size,
the proximate mechanism underlying the eNPP rule.
Caribou/reindeer
Caribou (Rangifer tarandus) dwell in the taiga and
tundra biomes of the northern latitudes in large social
herds that are migratory in open northern habitats and
less migratory in relatively closed habitats to the south.
In terms of diet caribou ‘‘have catholic tastes . . . areopportunistic [leading] relative availability [to be] a
prime factor in [plant] utilization’’ (Bergerud 2000:663),
but they also complement their diet at times with high
protein animal matter, such as fish carrion and remains
of small rodents (Geist 1998). Summer and winter
ranges differ and caribou follow a common cervid
pattern of summer nutrition for growth and winter
nutrition for maintenance (Soppela and Neiminen 2001,
Parker et al. 2005). Summer nutrition is typically those
components of eNPP that have high protein : carbon
ratios, while winter nutrition is derived from the durable
components of eNPP that can survive freezing temper-
atures, which generally have a low protein : carbon ratio.
Caribou/reindeer reach their largest size near the
southern portion of their range and their size decreases
northward. This matches the latitudinal distribution of
eNPP in our data analysis (Huston and Wolverton 2009)
and body-size model (Fig. 1, zone B�). At the northern
end of their range, caribou and other high-latitude
cervids experience a very short seasonal pulse of reduced
eNPP (see also Suttie and Webster 1995). In compar-
ison, the seasonal pulse at slightly lower latitudes is
longer and higher. Klein et al. (1987) attribute a
decrease in caribou leg length (and by correlation
stature) with latitude to just these energetic constraints.
Though longer legs increase efficiency of locomotion,
investment in larger body size requires relatively high
growth and maintenance costs and possibly also a
decrease in foraging efficiency for low-lying browse.
Similar density-dependent body-size effects occur
among reindeer/caribou as among moose (Reimers et
al. 1983, Skogland 1990, Tveraa et al. 2007). Skogland
(1986) demonstrates that reindeer populations in Nor-
way are food limited (sensu Sinclair 1977) at high
population densities at which their body size decreases
(see also Tveraa et al. 2007). In the absence of predation
(large predators such as Canis lupus have been
exterminated in much of Norway), reindeer overbrowse
their winter food supply, which consists in large part of
lichens (Nellemann 1996, van der Wal et al. 2001). When
densities of reindeer increase dramatically, lichens are
overbrowsed and body size during ontogeny and at
maturity decreases significantly because wintertime food
availability is compromised (Skogland 1983, 1990, van
der Wal et al. 2001). Late spring through early fall
foraging plays a critical role for body size in reindeer
from three populations in Norway (Reimers et al. 1983),
whereas nutrition during winter affects maintenance and
survival, but not size (Skogland 1990, Parker et al.
2005).
In general, the populations with the highest density,
and, as a result, overbrowsed range, produced smaller
individuals in all sex/age classes (in terms of body mass
and skeletal size measurements). Reimers et al. (1983),
noted that the area with the earliest gestation and
longest summer foraging season had a shortened
lactation period, produced the highest post-winter body
mass recovery in adult females (see also Skogland 1983,
Tveraa et al. 2007), as well as the highest growth rate in
calves. Adult males and females from that population
were consistently larger (in terms of average body mass
and skeletal size measurements) than those from the
MICHAEL A. HUSTON AND STEVE WOLVERTON356 Ecological MonographsVol. 81, No. 3
CONCEPTS&SYNTHESIS

other study areas, confirming the importance of high
eNPP for herbivore body size.
White-tailed deer
White-tailed deer (Odocoileus virginianus) are r
selected and paedomorphic compared to other cervids
in North America; that is, they reproduce more rapidly
and attain a comparatively small adult body size
relatively early in life (Geist 1998). Hesselton and
Hesselton (1982:883) characterize this species as ‘‘one
of the most adaptable species in the world. . . liv[ing]
from the near arctic to the tropics. . . eat[ing] a
tremendous variety of foods [through an] uncanny
ability to select the most nutritious foods when it has
an opportunity to be selective’’ (see also Swift 1948,
Demarais et al. 2000). White-tailed deer, however, are
‘‘by no means ‘super ruminants’—they cannot use some
woody browse species as well as cattle [or other Old
World ungulates] can’’ (Verme and Ullrey 1984:111).
For example, in areas of North America today where
free-ranging introduced fallow deer (Dama dama) and
sika deer (Cervus nippon) share habitat with white-tailed
deer, the exotic species more efficiently digest native
forage than do white-tailed deer (Demarais et al. 2003).
Despite poor digestive efficiency, the white-tailed deer
thrives by food switching in poor-quality habitat
(Tremblay et al. 2005) and through dramatic diminution
in body size in unproductive or crowded environments
(Kie et al. 1983, Wolverton et al. 2007, 2009a, Simard et
al. 2008). Such phenotypic plasticity in body size and the
white-tailed deer’s highly generalized diet allow its non-
migratory, low-dispersal, highly philopatric, mainte-
nance phenotype (Geist 1998, Purdue et al. 2000, Comer
et al. 2005). This strategy is advantageous where
environmental conditions fluctuate over time, which
has allowed Odocoileus to thrive in many parts of the
New World today.
Within a single region, white-tailed deer in areas with
high population densities have relatively small body size
compared to areas with low densities. This has been
documented in fenced population studies (e.g., McCul-
lough 1979, Kie et al. 1983, McCullough 1984), for
island subpopulations (e.g., Simard et al. 2008), and in
unfenced populations (Teer et al. 1965, Teer 1984,
Lesage et al. 2001). Numerous studies document the
impacts that white-tailed deer at high densities have on
habitat quality, food availability, and plant diversity
(McShea et al. 1997, Waller and Alverson 1997, Rooney
and Waller 2003; see summary in Cote et al. 2004).
At high densities, negative feedbacks develop in which
deer populations overbrowse forage (e.g., Leopold 1947,
1950, Rooney 2001, Stewart et al. 2006 for North
American elk), switch food to secondary and tertiary
browse (Tremblay et al. 2005), shift reproductive
strategies (Simard et al. 2008), and decrease body size,
while at times remaining at very high population
densities despite a reduction in food availability (Kie
et al. 1983, Tremblay et al. 2005, Simard et al. 2008; see
Ferguson et al. 2000 and Ferguson 2002 for moose). For
example, Kie et al. (1983) subdivided a white-tailed deer
population into two groups, those within and those
outside of a predator-free 391-ha enclosure from 1973 to
1976 at Welder Wildlife Refuge in south Texas, USA.
Deer from both groups were compared during the
period July 1975 to May 1976 to assess the effects of
population density. Without the population-limiting
effects of predation, average eviscerted carcass masses
were significantly lower within the higher-density
enclosure population (28.8 kg at 72.5 deer/km2)
compared to those outside (34.4 kg at 44.5 deer/km2),
while there was no difference in age/sex structure for
adults and fawns. Significant differences were also found
between the two groups in terms of several measures
related to health of individuals, with kidney and marrow
fat indices and a host of blood parameters being
impacted in the more crowded group in the enclosure
(Kie at al. 1983: Table 1). Thus, high population density
resulted in a substantial decrease in ontogenetic growth
rate, body size, and health, apparently as a result of
lower food quantity and/or quality per animal. Similar
effects in humans are discussed in Non-latitudinal
Variation in Body Size: Intraspecific Patterns.
A classic study on the effects of harvest on white-
tailed deer population ecology was conducted at the
University of Michigan’s George Reserve, in Livingston
County, Michigan, USA (McCullough 1979, 1982a, b,
1984, 1997). After years of unmanaged population
growth on the 464-ha fenced area, overbrowsing
occurred and hunting was initiated in 1933. By 1966,
biologists at the University of Michigan began to
manipulate population density on the reserve. From
1966 to 1980 population size fluctuated between 10 and
212 bucks. McCullough (1982a, 1984) reported that
periods with low population densities produced bucks
with higher body mass and larger antlers (Table 1). Kie’s
and McCullough’s studies are some of the many
examples that link body size in white-tailed deer to the
proximate mechanism of food availability.
TABLE 1. Characteristics of white-tailed deer bucks on the George Reserve, Michigan (McCullough 1984).
Time period Number of deer Average mass (kg) Deer density (no./ha) Buck biomass (density 3 mass)
1941–1942 126 66.4 0.27 18.031958–1971 67 71.3 0.14 10.301971–1975 10 75.9 0.02 1.641980–1981 130 77.6 0.28 21.74
August 2011 357eNPP AND BODY SIZE
CONCEPTS&SYNTHESIS
Despite these close relationships between population
density, food available per animal, ontogenetic growth
rate, and ultimately body size in white-tailed deer at
local scales, the relationship between these variables has
been rarely studied at larger spatial scales, for example
by latitude (but see Geist 1987a, 1998, Crete 1999). It is
clear that white-tailed deer body size increases with
latitude (Fig. 3), but it is not clear if total deer
population biomass increases. If the northward increase
in body size is associated with a decrease in local
population densities, then the increase in body size is not
necessarily explained by increased eNPP. Only if both
total deer biomass and deer body size increased, could
the pattern be attributed to better habitat (higher eNPP)
to the north.
Contrary to our prediction, Crete (1999) estimated
that white-tailed deer population biomass increases with
decreasing latitude south of gray wolf (Canis lupus)
range, and he relates the pattern to an increase in
productivity toward the south. However, he estimated
productivity using actual evapotranspiration (AET), an
approach we believe produces inaccurate results (Hus-
ton and Wolverton 2009). While deer population density
may be high in some portions of southern North
America, Crete’s estimates of white-tailed deer biomass
in areas of Texas differ considerably from what we have
encountered in our own work and in the published
wildlife literature. Further, the high-biomass areas he
identifies in his study, such as Minnesota, Pennsylvania,
Michigan, Ohio, New York, eastern Canada, and
Indiana are parts of the north temperate forest and
Midwestern agricultural region. This is where our
analysis indicates high eNPP and where we expect the
highest mammal biomass and body sizes (Huston and
Wolverton 2009). Consistent with our interpretation,
Teer et al. (1965, Teer 1984) suggest that the Edwards
Plateau ecoregion in central Texas has one of the highest
deer population densities in North America (a situation
that has not changed much since their papers were
published), and they argue that this contributes to
stunting of body size in already low-quality habitat,
which leads to low total population biomass.
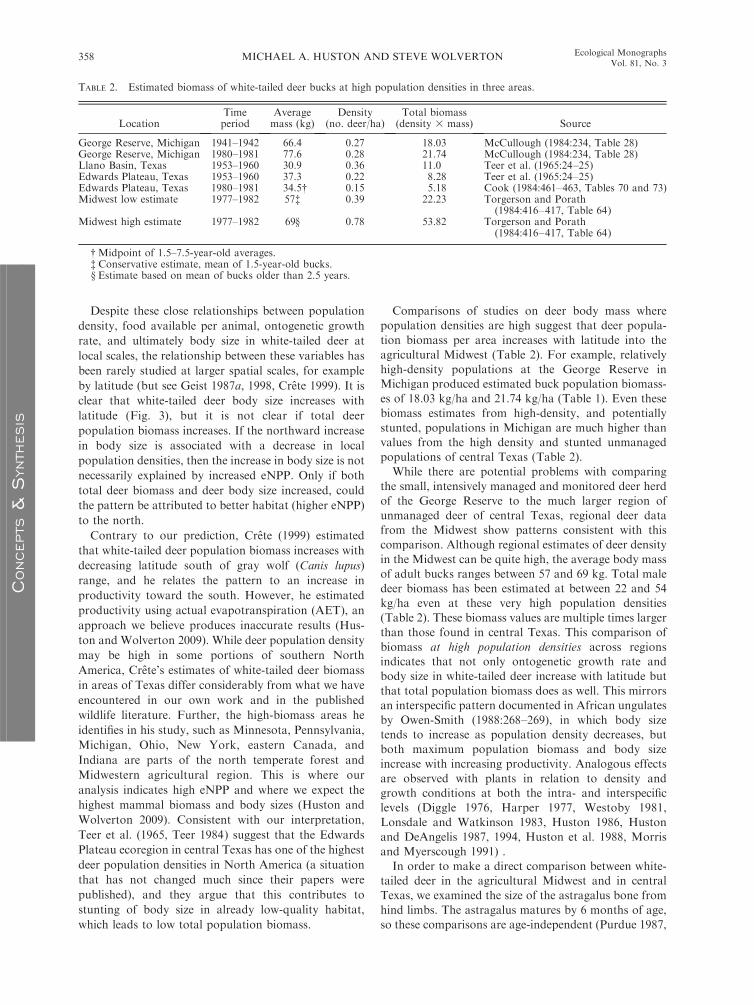
Comparisons of studies on deer body mass where
population densities are high suggest that deer popula-
tion biomass per area increases with latitude into the
agricultural Midwest (Table 2). For example, relatively
high-density populations at the George Reserve inMichigan produced estimated buck population biomass-
es of 18.03 kg/ha and 21.74 kg/ha (Table 1). Even these
biomass estimates from high-density, and potentially
stunted, populations in Michigan are much higher thanvalues from the high density and stunted unmanaged
populations of central Texas (Table 2).
While there are potential problems with comparing
the small, intensively managed and monitored deer herd
of the George Reserve to the much larger region of
unmanaged deer of central Texas, regional deer datafrom the Midwest show patterns consistent with this
comparison. Although regional estimates of deer density
in the Midwest can be quite high, the average body mass
of adult bucks ranges between 57 and 69 kg. Total maledeer biomass has been estimated at between 22 and 54
kg/ha even at these very high population densities
(Table 2). These biomass values are multiple times larger
than those found in central Texas. This comparison of
biomass at high population densities across regionsindicates that not only ontogenetic growth rate and
body size in white-tailed deer increase with latitude but
that total population biomass does as well. This mirrors
an interspecific pattern documented in African ungulates
by Owen-Smith (1988:268–269), in which body sizetends to increase as population density decreases, but
both maximum population biomass and body size
increase with increasing productivity. Analogous effects
are observed with plants in relation to density andgrowth conditions at both the intra- and interspecific
levels (Diggle 1976, Harper 1977, Westoby 1981,
Lonsdale and Watkinson 1983, Huston 1986, Huston
and DeAngelis 1987, 1994, Huston et al. 1988, Morris
and Myerscough 1991) .
In order to make a direct comparison between white-tailed deer in the agricultural Midwest and in central
Texas, we examined the size of the astragalus bone from
hind limbs. The astragalus matures by 6 months of age,
so these comparisons are age-independent (Purdue 1987,
TABLE 2. Estimated biomass of white-tailed deer bucks at high population densities in three areas.
LocationTimeperiod
Averagemass (kg)
Density(no. deer/ha)
Total biomass(density 3 mass) Source
George Reserve, Michigan 1941–1942 66.4 0.27 18.03 McCullough (1984:234, Table 28)George Reserve, Michigan 1980–1981 77.6 0.28 21.74 McCullough (1984:234, Table 28)Llano Basin, Texas 1953–1960 30.9 0.36 11.0 Teer et al. (1965:24–25)Edwards Plateau, Texas 1953–1960 37.3 0.22 8.28 Teer et al. (1965:24–25)Edwards Plateau, Texas 1980–1981 34.5� 0.15 5.18 Cook (1984:461–463, Tables 70 and 73)Midwest low estimate 1977–1982 57� 0.39 22.23 Torgerson and Porath
(1984:416–417, Table 64)Midwest high estimate 1977–1982 69§ 0.78 53.82 Torgerson and Porath
(1984:416–417, Table 64)
� Midpoint of 1.5–7.5-year-old averages.� Conservative estimate, mean of 1.5-year-old bucks.§ Estimate based on mean of bucks older than 2.5 years.
MICHAEL A. HUSTON AND STEVE WOLVERTON358 Ecological MonographsVol. 81, No. 3
CONCEPTS&SYNTHESIS
Wolverton 2008). We analyzed samples from central
Missouri and from a population in western Travis
County in the Edwards Plateau region of Texas, from
both modern and late Holocene populations. Central
Missouri white-tailed deer are significantly larger and
barely overlap in size distribution with central Texas
deer, both currently and during the late Holocene
(Wolverton et al. 2009a: Fig. 4B). If Torgerson and
Porath’s (1984) assessment that deer can reach very high
population densities in the Midwest is correct (see also
Nixon et al. 1991, Hansen et al. 1997), our data support
the conclusion that total deer biomass is substantially
higher in the Midwest than in central Texas, and has
been so for thousands of years. The same patterns holds
for subtropical southeast Texas where body size and
astragalus size are small and estimated total biomass is
low compared to northern regions (Table 2; Cook 1984,
Wolverton et al. 2009a).
Other cervids
Many of the body-size patterns and relationships for
white-tailed deer, caribou, and moose hold for other
cervids at similarly large scales (Langvatn and Albon
1986, Mysterud et al. 2001a, b, c, 2002). For example,
Mysterud et al. (2001a) demonstrate that body size of
elk (Cervus elaphus) in southern Norway is largest at
relatively low population density, and that altitudinal
diversity in habitat also produces large elk. They
conclude that altitudinal range affects body size because
elk can track the altitudinal progression of the pulse of
high eNPP and thus take advantage of emerging (highly
nutritious) forage for a longer period of time (see
Reimers et al. 1983, Weladji et al. 2002 for similar
examples with caribou).
Langvatn and Albon (1986) link plant phenology and
forage quality to the latitudinal increase in elk body size
in similar fashion. They surmise that, at high latitudes,
the nutritive content of digestible plant materials
increases because lower light availability, lower water
supply, and lower temperature conditions decrease
lignification (production of wood tissue). In addition,
the soluble carbohydrate and protein fractions of plants
have been found to increase in these conditions because
the proportion of plant matter that comprises cell walls
decreases (Langvatn and Albon 1986:291). Similar body
and antler size effects as those documented by Langvatn
and Albon (1986) have been observed by Schmidt et al.
(2001) in red deer on the Isle of Rum in northern
Scotland, as well as in roe deer (Hewison et al. 2002,
Kjellander et al. 2006, Toigo et al. 2006), white-tailed
deer (McCullough 1984), and sika deer (Yokoyama et
al. 2000).
These studies of cervid body size suggest that
ontogenetic growth rates track both the local and global
distribution of eNPP and available food per individual,
just as we propose. In areas with more fertile soils, i.e.,
many temperate and high-latitude areas, both growing
season NPP (eNPP) and forage quality ought to be high
compared to the lower latitudes. At a minimum, this
high eNPP should accelerate the ontogenetic growth rate
and increase adult body size, as has been observed for
deer, caribou, and moose. In general, total population
biomass should increase with eNPP due to either an
increase in body size at constant density or an increase in
density at a constant body size, or an increase in both, as
have been observed for white-tailed deer.
Geographic variation in body size of mammalian
carnivores and other homeotherms
The apparent effect of eNPP on cervid body size is
paralleled by the distribution of body size in multiple
species of carnivores, some of which are predators of
cervids. If prey species reach their largest body size and
highest biomass at temperate latitudes, it makes sense
that large carnivore species with broad latitudinal ranges
should exhibit a similar body-size distribution to
maintain efficiency of prey capture. The distributions
of body size in several large carnivores are also
consistent with the expectation that food availability
per animal (as eNSP) is highest in the temperate
latitudes. In some cases, such as bears, other aspects of
behavioral ecology (e.g., hibernation) may also influence
the latitudinal distribution of growth rate and body size.
Predator body size generally increases with the body
size of their prey (McNab 1971, Gittleman 1985, Owen-
Smith and Mills 2008, Troost et al. 2008). In addition,
the inverse relationship between carnivore population
density and carnivore body size at the intraspecific level
is well known (e.g., Cavallini 1995, Carbone and
Gittleman 2002, Zedrosser et al. 2006). Several studies
have shown that body size in carnivores is influenced by
food availability. However, it has rarely been suggested
that predators follow Bergmann’s rule because the
availability of prey increases with latitude.
The latitudinal distribution of body size for the gray
wolf (Canis lupus) mirrors that of cervids in North
America, peaking at 50–608 N latitude where cervids are
the largest (Geist 1987a) and eNPP the highest, then
declining at higher latitudes (Fig. 4H; McNab 1971).
The size of the red fox (Vulpes vulpes) also increases with
latitude (Meiri et al. 2004). Although Cavallini (1995)
suggests that regional variability in size of the red fox in
Italy may relate to differences in population density, he
states that size differences at larger spatial scales are
likely to be associated with genetic differences between
populations. However, he does not present any genetic
data and thus we cannot reject the hypothesis that
latitudinal differences in red fox body size are simply
related to differences in eNPP. We agree with Cavallini
(1995:426) that ‘‘more data need to be collected,’’
specifically genetic data and information on food
availability and ontogenetic growth rate in the red fox.
Gortazar et al. (2000) provide such data from Spain
where they studied male and female red fox body size in
contiguous (no barriers between) low- and high-quality
habitat. In both areas, male and female foxes were
August 2011 359eNPP AND BODY SIZE
CONCEPTS&SYNTHESIS
MICHAEL A. HUSTON AND STEVE WOLVERTON360 Ecological MonographsVol. 81, No. 3
CONCEPTS&SYNTHESIS

significantly larger in high-quality habitat, and Gortazar
et al. (2000) discuss food availability and prey size along
with behavioral ecology and character displacement as
possible causes.
Two species of large, widely distributed felids in the
New World exhibit latitudinal size distributions outside
the tropics that follow Bergmann’s rule, the puma
(Puma concolor; Newman 1953, Kurten 1973, Iriarte et
al. 1990, Gay and Best 1996) and the jaguar (Panthera
onca; Iriarte et al. 1990:189) (Fig. 4C and D). However,
neither species shows any trend in body size across the
tropics (23.58 S to 23.58 N, Fig. 4C and D, see Fig. 1,
zone B*0). Gay and Best (1996) found that puma size
correlates with temperature (negatively) and latitude
(positively), but most strongly with latitude, particularly
outside the tropics (e.g., Fig. 1, latitudinal zone Bþ).Iriarte et al. (1990) observe that the positive relationship
between puma body size and latitude corresponds
positively to prey body size and negatively to niche
breadth. In North America, puma are large vertebrate
prey specialists, and they achieve body lengths at the
high-latitude ends of their range equivalent to the largest
jaguars, which reach their maximum lengths outside the
tropics. The puma’s body size declines and their food
niche broadens to include a higher proportion of
medium and small prey at tropical latitudes where
eNPP and eNSP are lower, and consequently deer are
smaller and large vertebrates are relatively rare.
McNab (1971) noted that the puma is smallest in body
size where its range overlaps with the jaguar, and
proposed competitive character displacement as the
explanation. However, this area of overlap is also where
eNPP is lower, the jaguar is smaller (Fig. 4D), and prey
such as deer are much smaller than farther north (Fig.
4E), beyond the jaguar’s range. This raises an important
point concerning the relationship of carnivore body size
to food availability. Character displacement in predator
body size and food niche occurs in many carnivores
when the range of one predator overlaps with that of
another, typically larger, competitor (Rosenzweig 1966).
Such niche differentiation occurs in pumas and jaguars
(Taber et al. 1997, Scognamillo et al. 2003), and
character release of body size in puma and in ocelots
associated with shifting to larger prey has been observed
in areas where jaguars have been extirpated (Moreno et
al. 2006). However, Iriarte et al. (1990) conclude that
puma body-size variability at larger spatial scales simply
relates to prey availability and vulnerability, or what we
are calling the distribution of eNSP.
A recent analysis of Bergmann’s rule in Carnivora was
based on a new compilation of skull measurements from
museums around the world for 44 species (of which 4
had separate data from Old and New World popula-
tions; thus we treat their total as 48 species) and found
support for the existence of Bergmann’s pattern in only
22 of the species (Meiri et al. 2004). In their analysis,
either males, females, or both from 24 carnivore species
had no significant increase in cranial length with
latitude. They conclude their ‘‘finding that less than
50% of carnivore species adhere to Bergmann’s rule
suggests its validity in the Mammalia might be
questioned’’ (Meiri et al. 2004:585). We agree, but for
reasons that were not addressed by Meiri et al. (2004).
Meiri et al. assumed that latitudinal gradients of body
size were linear and did not change with latitude, and
consequently reported only the sizes of the ranges over
which their samples were collected, rather than the
actual locations of the ranges. Because the eNPP rule is
based on the global distribution of eNPP, which has a
complex, nonlinear latitudinal pattern (Figs. 1 and 4A),
it is impossible in most cases to determine whether their
results that apparently contradict Bergmann’s rule are
actually consistent with the eNPP rule. In some cases,
where a species’ known range is limited to a linear
portion of the latitudinal eNPP gradient (i.e., between
23.58 S and 23.58 N, or from 23.58 to approximately 508
across either the southern or northern temperate zones,
or above about 608) a linear analysis is informative.
Across the tropics, the eNPP rule predicts no change in
body size, contradicting Bergmann’s rule, while from
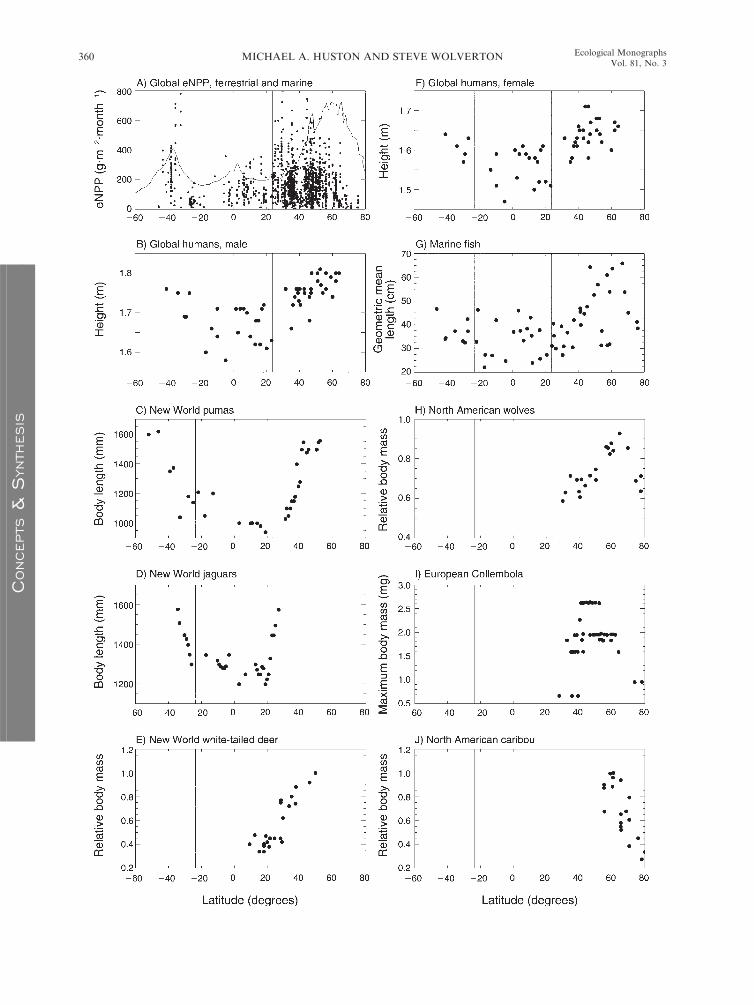
FIG. 4. Latitudinal distributions of eNPP and animal body size. (A) Distribution of ecologically and evolutionarily relevant
aboveground NPP (eANPP) for terrestrial vegetation types (e.g., forest, grassland, desert, tundra) from the Global PrimaryProduction Data Initiative (GPPDI; Olson et al. 2001a, b) showing 1562 of the total 2525 values in the combined Class A and Bdata sets, excluding managed systems and wetlands. The pattern is similar to our summary based on forests only from a differentdata set (Fig. 1). The thin line is the global latitudinal average of marine eNPP, calculated as the maximum of the three-monthmean for either December–February (austral summer) or June–August (boreal summer). Marine units are g C�m�2�month�1,multiplied by 15 for visualization. Terrestrial units are in dry biomass. Note that the spatial distribution of the terrestrial data is notuniform and does not represent all regions of the globe, nor does it represent an adequate sample to identify regional or localpatterns. (B) Height of human males based on average values by country (data sources in Supplement 2). (C) Body and tail lengthof pumas (Puma concolor) across the New World (based on Iriarte et al. [1990: Fig. 3]). Data are from McNab (1971), Schaller andVasconselos (1978), Anderson (1983), Currier (1983), Rabinowitz and Nottingham (1986), and Mondolfi and Hoogesteijn (1986).(D) Body and tail length of jaguars (Panthera onca) across the New World tropics and subtropics (data from same sources as forpanel C). (E) Relative body size in white-tailed deer (Odocoileus virginianus) (based on Geist [1998: Fig. 1.9]). (F) Height of humanfemales based on average values per country (data and sources in Supplement 2). (G) Geometric mean length of marine fish speciesrecorded in coastal regions designated as Large Marine Ecosystems (LMEs; based on Fisher et al. [2010: Table 1]). (H) Relativebody mass of gray wolves (Canis lupus) in North America (based on Geist [1987a: Fig. 3]). (I) Maximum body sizes of springtail(Hexapoda: Collembola) assemblages comprising 2102 species across 52 European countries and islands (based on Ulrich and Fiera[2010: Fig. 3B]). (J) Relative body sizes of North American caribou (Rangifer tarandus) (based on Geist [1998: Fig. 1.9]).
August 2011 361eNPP AND BODY SIZE
CONCEPTS&SYNTHESIS
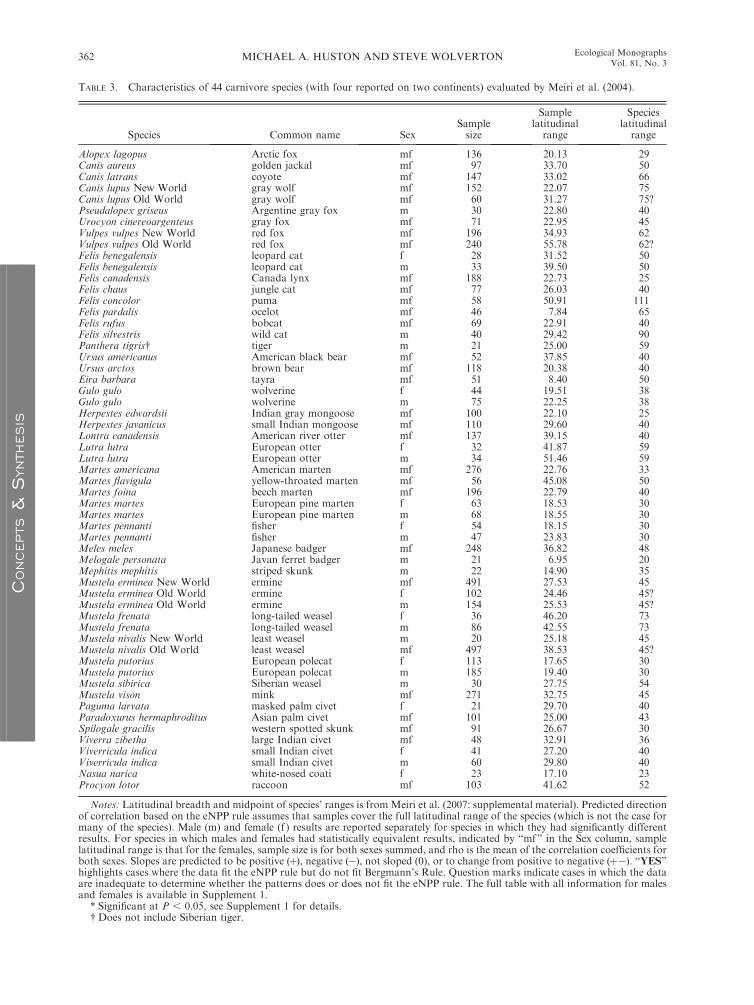
TABLE 3. Characteristics of 44 carnivore species (with four reported on two continents) evaluated by Meiri et al. (2004).
Species Common name SexSamplesize
Samplelatitudinal
range
Specieslatitudinal
range
Alopex lagopus Arctic fox mf 136 20.13 29Canis aureus golden jackal mf 97 33.70 50Canis latrans coyote mf 147 33.02 66Canis lupus New World gray wolf mf 152 22.07 75Canis lupus Old World gray wolf mf 60 31.27 75?Pseudalopex griseus Argentine gray fox m 30 22.80 40Urocyon cinereoargenteus gray fox mf 71 22.95 45Vulpes vulpes New World red fox mf 196 34.93 62Vulpes vulpes Old World red fox mf 240 55.78 62?Felis benegalensis leopard cat f 28 31.52 50Felis benegalensis leopard cat m 33 39.50 50Felis canadensis Canada lynx mf 188 22.73 25Felis chaus jungle cat mf 77 26.03 40Felis concolor puma mf 58 50.91 111Felis pardalis ocelot mf 46 7.84 65Felis rufus bobcat mf 69 22.91 40Felis silvestris wild cat m 40 29.42 90Panthera tigris� tiger m 21 25.00 59Ursus americanus American black bear mf 52 37.85 40Ursus arctos brown bear mf 118 20.38 40Eira barbara tayra mf 51 8.40 50Gulo gulo wolverine f 44 19.51 38Gulo gulo wolverine m 75 22.25 38Herpestes edwardsii Indian gray mongoose mf 100 22.10 25Herpestes javanicus small Indian mongoose mf 110 29.60 40Lontra canadensis American river otter mf 137 39.15 40Lutra lutra European otter f 32 41.87 59Lutra lutra European otter m 34 51.46 59Martes americana American marten mf 276 22.76 33Martes flavigula yellow-throated marten mf 56 45.08 50Martes foina beech marten mf 196 22.79 40Martes martes European pine marten f 63 18.53 30Martes martes European pine marten m 68 18.55 30Martes pennanti fisher f 54 18.15 30Martes pennanti fisher m 47 23.83 30Meles meles Japanese badger mf 248 36.82 48Melogale personata Javan ferret badger m 21 6.95 20Mephitis mephitis striped skunk m 22 14.90 35Mustela erminea New World ermine mf 491 27.53 45Mustela erminea Old World ermine f 102 24.46 45?Mustela erminea Old World ermine m 154 25.53 45?Mustela frenata long-tailed weasel f 36 46.20 73Mustela frenata long-tailed weasel m 86 42.55 73Mustela nivalis New World least weasel m 20 25.18 45Mustela nivalis Old World least weasel mf 497 38.53 45?Mustela putorius European polecat f 113 17.65 30Mustela putorius European polecat m 185 19.40 30Mustela sibirica Siberian weasel m 30 27.75 54Mustela vison mink mf 271 32.75 45Paguma larvata masked palm civet f 21 29.70 40Paradoxurus hermaphroditus Asian palm civet mf 101 25.00 43Spilogale gracilis western spotted skunk mf 91 26.67 30Viverra zibetha large Indian civet mf 48 32.91 36Viverricula indica small Indian civet f 41 27.20 40Viverricula indica small Indian civet m 60 29.80 40Nasua narica white-nosed coati f 23 17.10 23Procyon lotor raccoon mf 103 41.62 52
Notes: Latitudinal breadth and midpoint of species’ ranges is fromMeiri et al. (2007: supplemental material). Predicted directionof correlation based on the eNPP rule assumes that samples cover the full latitudinal range of the species (which is not the case formany of the species). Male (m) and female (f ) results are reported separately for species in which they had significantly differentresults. For species in which males and females had statistically equivalent results, indicated by ‘‘mf ’’ in the Sex column, samplelatitudinal range is that for the females, sample size is for both sexes summed, and rho is the mean of the correlation coefficients forboth sexes. Slopes are predicted to be positive (þ), negative (�), not sloped (0), or to change from positive to negative (þ�). ‘‘YES’’highlights cases where the data fit the eNPP rule but do not fit Bergmann’s Rule. Question marks indicate cases in which the dataare inadequate to determine whether the patterns does or does not fit the eNPP rule. The full table with all information for malesand females is available in Supplement 1.
* Significant at P , 0.05, see Supplement 1 for details.� Does not include Siberian tiger.
MICHAEL A. HUSTON AND STEVE WOLVERTON362 Ecological MonographsVol. 81, No. 3
CONCEPTS&SYNTHESIS

23.58 to approximately 508 or 608 across the temperate
zones, both Bergmann’s and the eNPP rule make the
same prediction of an increase in body size. Above 608,
Bergmann’s rule predicts a linear increase in body size,
while the eNPP rule predicts a linear decrease. However,
ranges that span either 23.58 or 50–608 are predicted to
have a nonlinear pattern of body size in relation to
latitude. These nonlinear patterns cannot be resolved
using the information published by Meiri et al. (2004),
because the actual latitudes from which the samples were
collected were not reported and in many cases the
latitudinal range of the samples is less than half of the
species’ latitudinal range. Only in cases where the
species’ known ranges are limited to the linear sections
of the latitudinal eNPP distribution that contradict the
Bergmann prediction of a linear increase with latitude,
can we evaluate whether the Meiri et al. results conform
to the eNPP rule while contradicting Bergmann’s rule.
These data are summarized in Table 3.
Of the species that Meiri et al. identified as not
following Bergmann’s rule, the arctic fox (Alopex
lagopus) occurs only at high latitudes, where the eNPP
rule predicts a decline in body size (Fig. 1, zone B�), butthe data showed no change with latitude. The range of
the gray wolf extends through subtropical montane and
temperate latitudes into high latitudes, and in North
America this species also exhibits a decrease in size north
of 608N where eNPP and the size of its ungulate prey
decline (Fig. 4H and J; Geist 1987a). However, Meiri et
al. report no change with latitude in North American
wolves but a strong positive response in European
wolves. In both cases, the latitudinal range of the
samples is less than half the latitudinal range of the
species, which spans the breakpoint (approximately 508
N) where we expect the relationship of body size (and
eNPP) with latitude to reverse. However, the actual
latitudinal position of this reversal may depend on the
influence of maritime climate and continentality on
temperature and growing season in parts of northern
Europe (also an important consideration for large
cervids in this region). Without knowing the actual
geographic locations of the samples, it is impossible to
determine whether they are consistent with the eNPP
rule. Nine of the nonconforming species are mustelids,
viverrids, procyonids, and felids that occur at low
latitudes (tropics and subtropics) only, where eNPP is
typically low and changes little with latitude (Fig. 1,
zone B*0). Two non-conforming species are temperate
zone ursids that hibernate, and two additional species
are partially or fully non-terrestrial (otters). Meiri et al.
(2004:585) concede that omission of the Siberian tiger,
which is the largest, northernmost of the subspecies
(Panthera tigris altaica), may have influenced the
latitudinal size distribution of tigers in their analysis.
Meiri et al. (2004) conclude that the relationship
between latitude and size for the bobcat (Lynx rufus) is
not significant, but they cite other studies of the bobcat,
which have larger sample sizes, that indicate Bergmann’s
rule holds for this species (Sikes and Kennedy 1992,
Wigginton and Dobson 1999). The remaining seven
non-conforming species are several temperate latitude
mustelids and the raccoon (Procyon lotor). However,
other studies based on biometry of skull size or body
mass suggest that Bergmann’s rule does hold for the
raccoon (Kennedy and Lindsay 1984 [skull size],
TABLE 3. Extended.
Speciesrange
midpoint rho
eNPPpredictedslope
FitsBergmann’s
rule
FitseNPPrule
66 �0.02 � no no20 0.39* þ yes yes38 0.58* þ yes yes48 0.08 þ � no ?48? 0.91* þ � yes ?�34 0.21 þ no no28 0.51* þ yes yes41 0.65* þ yes yes41? 0.61* þ yes yes25 �0.25 þ no no25 0.70* þ yes yes58 0.41* þ yes yes30 0.60* þ yes yes5 0.62* þ yes yes3 �0.16 0 no YES40 0.17 þ no no10 0.37* þ yes yes21 0.26 þ no no45 0.01 þ no no50 0.09 þ no no�5 �0.18 0 no YES64 0.28 þ � no ?64 0.32* þ � yes ?23 �0.17 0 no YES15 �0.58* 0 no no45 0.01 þ no no36 0.51* þ yes yes36 0.13 þ no no52 0.56* þ yes yes25 0.56* þ yes yes48 0.29* þ yes yes55 �0.04 þ � no ?55 0.26* þ � yes ?45 0.53* þ yes yes45 0.03 þ no no44 0.62* þ yes yes20 �0.33 0 no YES43 0.47* þ yes yes58 0.44* þ � yes ?58? 0.14 þ � no ?58? �0.22* þ � no ?19 0.57* þ yes yes19 �0.03 þ no no53 �0.70* þ � no ?53? �0.30* þ � no no50 �0.19* þ no no50 0.06 þ no no33 �0.35 þ no no48 0.57* þ yes yes15 �0.63* þ no no12 0.12 0 no YES35 0.00 þ no no18 0.07 0 no YES15 0.42* þ yes yes15 0.16 þ no no19 �0.15 0 no YES34 0.05 þ no no
August 2011 363eNPP AND BODY SIZE
CONCEPTS&SYNTHESIS

Mugaas and Seidensticker 1993 [body mass]). While we
agree with Meiri et al. (2004) regarding problems with
Bergmann’s rule, we think it important to note that
many exceptions to Bergmann’s rule in Carnivora tend
to have biogeographic ranges that conform to the
distribution of body size predicted by the eNPP rule
(Fig. 1). Based on an examination of the reported
latitudinal ranges of these mammals (Meiri et al. 2004),
we conclude that while only 24 of 48 species conform to
Bergmann’s rule, body-size patterns of at least 31, and
potentially as many as 41 of the 48 are consistent with
the predictions of the eNPP rule (Table 3). Note that
there will be many situations where the actual distribu-
tion of eNPP differs from the global average patterns we
present in Fig. 1, due to the effects of local soil
properties, maritime climate, continentality or other
factors. In these cases, use of latitude without actual
measurements of eNPP will not be informative. A more
detailed analysis of the Meiri et al. (2004) data, as well
as collection of body size and eNPP data across the full
latitudinal ranges of all the species would be very
interesting. Unfortunately, sufficient data on intraspe-
cific variation in animal body size have not yet been
collected or compiled to allow a definitive test of either
Bergmann’s or the eNPP rule.
One of the problems in comparing body size is the
various types of measurements that have been collected,
including different measurements of mass and a variety
of skeletal dimensions. As discussed previously, compo-
nents of size vary over different temporal scales, which
raise problems of interpretation. The data for bears are
particularly problematic and have led to opposing
conclusions. Body size has been reported to decrease
with latitude among American black bears (Ursus
americanus; Kennedy et al. 2002) and European brown
bears (U. arctos; Kojola and Laitala 2001). However,
Kojola and Laitala’s (2001) study examined brown bear
size from 608 to 688 N latitude, where a negative
relationship with latitude is predicted by the eNPP rule
(assuming no effects of maritime climate or other local
factors that would cause departure from the global
average). Other authors (e.g., Rausch 1963, Meiri et al.
2004) report that size of brown bears increases with
latitude, conforming to Bergmann’s rule. Those who
observe a decrease in size with latitude (B� pattern),
regardless of latitudinal position of the range covered,
attribute it to reduction in foraging time and growing
season caused by an increase in hibernation periods at
higher latitudes. However, determination of whether or
not body size in ursids follows Bergmann’s rule (or the
eNPP rule) requires additional research. One problem is
that the distribution of bear body size described by
Kennedy et al. (2002), Rausch (1963), and Meiri et al.
(2004) relied on biometric analysis of the skull and
upper teeth. Head size, and especially tooth size, in
ursids display relatively weak, nonsignificant (a ¼ 0.05)
relationships with body mass compared to other
carnivores (Van Valkenburgh 1990:192–194), so intra-
specific variability in body size may not be accurately
reflected by head and tooth size. For example, Harlow
(1962) found that, despite larger skull size in Florida
black bears compared to Virginia black bears, body
mass did not differ. In addition, Meiri et al. (2004) argue
that Kojala and Laitala’s (2001) study of differences in
body mass in European brown bears encompassed too
small a latitudinal range to determine whether or not
Bergmann’s rule holds. However, Meiri et al. conclude
that brown bear size increases with latitude based on a
smaller sample size that covers a larger latitudinal range.
Black bears are omnivorous, as are humans. We
postulate that the eNPP rule applies to all higher trophic
levels and thus do not consider omnivory a confounding
factor. If anything, an omnivorous diet reflects an
adaptation tailored to extract calories and nutrients
from the environment as efficiently as possible for a
particular place and time by taking advantage of both
eNPP and eNSP. Body size, growth rate, and biomass of
bears, humans, and all other animals are related directly
to food availability, and show a variety of patterns that
appear to conform to the eNPP rule or other constraints
on food availability.
Bears (and a variety of other animals) have the
adaptation of hibernating during periods of low food
availability or otherwise unfavorable conditions. Hiber-
nation in bears is the ultimate adaptation to the
combination of high eNPP and a long season of scarcity.
Hibernation, which reaches its longest duration at
northern latitudes, is only a successful strategy if
individual bears are able to accumulate enough fat
reserves during the summer period of high eNPP to
make it through the winter with no additional food.
Mass loss during hibernation is primarily lipid mass, not
lean body mass (Hellgren et al. 1993, Harlow et al.
2002). Accumulation of fat body mass during the
growing season determines when bears can enter
hibernation (Klenner and Kroeker 1990, Schooley et
al. 1994), and whether or not females will reproduce
(Elowe and Dodge 1989, Samson and Huot 1995,
Harlow et al. 2002), as well as litter size (Samson and
Huot 1995). Although among cervids at high temperate
latitudes, the resource pulse provides a concentrated
period of rapid growth and mass gain, while winter is a
period of gradual mass loss despite continued foraging,
among bears the eNPP pulse provides the opportunity
to accumulate enough fat reserves to survive mass loss
during the complete fasting of hibernation. Similarly,
seasonal mass loss has also been observed in humans in
environments where a period of food scarcity precedes
the agricultural harvest (Gamboa and Garcia 2007).
That the duration of hibernation shortens and
disappears southward in bears suggests not only that
hibernation is not as necessary as it is farther north, but
also that it may not be advantageous, or even possible,
where accumulation of sufficient fat reserves is prevent-
ed by the typically lower eNPP at lower latitudes (Pelton
1982, 2000, Lariviere 2001). The fact that undernour-
MICHAEL A. HUSTON AND STEVE WOLVERTON364 Ecological MonographsVol. 81, No. 3
CONCEPTS&SYNTHESIS

ished bears, both young and old, delay hibernation and/
or cannot hibernate at high latitudes indicates that
growing-season fat accumulation is paramount in ursid
behavioral and functional ecology. Contrary to the
common conception that hibernation in bears is simply
an adaptation to long winters, it may be that non-
hibernation among individuals of hibernating species
represents a more recent (poorly fitted) adaptation to
low eNPP at low latitudes.
In the context of intraspecific body-size variation, the
most widely distributed vertebrate species is Homo
sapiens, which occupies all continents except Antarctica.
The general conformity of human body size to
Bergmann’s rule has long been recognized (Fig. 4B
and F; Coon et al. 1950, Schreider 1950, Newman 1953,
Roberts 1953, 1978, Bindon and Baker 1997, Ruff 1994,
2002). However, there is also substantial geographical
variation that is independent of latitude. As in other
animals, we are confident that much of the spatial
population-level variation in Homo sapiens body size
can be explained by variation in eNPP caused by
differences in soil fertility and water availability.
However, a comprehensive evaluation of this hypothesis
would require a detailed study that is beyond the scope
of this paper (but see Newman 1953).
Intraspecific body-size variation in numerous species
of herbivorous, carnivorous, and omnivorous mammals
shows latitudinal patterns that are consistent with the
predictions of the eNPP rule, as well as with Bergmann’s
rule over restricted latitudinal ranges. However, the
eNPP rule is not restricted to latitudinal patterns,
because the factors that regulate NPP and eNPP have
significant variation that is independent of latitude.
NON-LATITUDINAL VARIATION IN BODY SIZE:
INTRASPECIFIC PATTERNS
While the geometry of the Earth’s energy balance
results in more rapid soil weathering and loss of fertility
in the tropics, as well as other areas where precipitation
exceeds evapotranspiration, geological processes such as
volcanism, orogeny, sediment deposition, and glaciation
produce significant variation in soil fertility that is
independent of latitude and rainfall. The eNPP rule is
not limited to latitudinal variation and predicts that
differences in body size and related properties will occur
wherever there are significant differences in food
produced from eNPP, which is determined primarily
by soil fertility, water availability, and temperature.
In the early 1940s, a major wildlife study (Pitman-
Robertson Program) in Missouri focused on the effects
of soil fertility on game animal body size and harvest
number. During 1941 and 1942, the masses of 8180
raccoons (21% of the total harvest) were recorded at the
county level. County-level averages for male raccoons
ranged from 11.98 to 18.54 pounds (5.39–8.34 kg; a 55%increase in average mass) and for females from 8.58 to
17.64 pounds (3.86–7.94 kg; a 106% increase). Data
from 89 counties were grouped into eight soil fertility
classes for ANOVA and linear regressions (Fig. 5A).
Both raccoon body size and harvest correlate strongly
(positively) with soil fertility and presumably produc-
tivity in Missouri (Nagel 1943, Crawford 1950; V. L.
Sharpe, unpublished analysis). The decline in the harvest
of raccoons (Fig. 5B) and other furbearers in the regions
with highest soil fertility was probably due to reduced
habitat availability in the intensively cultivated areas of
the state (Crawford 1950). This type of regional spatial
variation in eNPP as affected by soils and climate across
the range of raccoons may increase variance and obscure
latitudinal patterns, as observed by Meiri et al. (2004),
although in Missouri, the best soils (and largest
raccoons) are in the northern part of the state, and the
poorest soils (and smallest raccoons) in the southern
part (B. Crawford, personal communication). A similar
pattern of body size in relation to soil fertility across
Missouri was found for cottontail rabbits in a study of
175 864 live-trapped individuals from 14 locations
across the state. Average body size ranged from 2.1 to
2.8 pounds (0.95–1.26 kg; a 33% increase), with mass
positively correlated with soil fertility (Crawford 1950).
In addition to the pattern in raccoons, harvest numbers,
which are presumably correlated with population size,
were positively or unimodally related to soil fertility in
striped skunks, spotted skunks, muskrats, mink, and red
foxes, and inversely related to soil fertility in opossums
and gray foxes (Nagel 1943), which may have been
affected by competition and predation by the red fox.
Dalke et al. (1946) believed that soil fertility affected the
distribution and population density of wild turkeys in
Missouri. Boyce (1978) reported spatial patterns of body
size in muskrats across North America, with small body
size associated with low productivity, and large body
size found in areas with ‘‘high seasonality,’’ which we
now recognize to be associated with high eNPP over
muskrat range.
Similar spatial patterns of body size in relation to soils
have been found in white-tailed deer across Missouri
(Murphy and Porath 1969) and elsewhere (Murphy and
Coates 1966, Jacobson 1984, Strickland and Demarais
2000, 2006, 2008). Strickland and Demarais (2000, 2006,
2008) studied differences in growth rate, antler size, and
body mass in five soil regions in Mississippi. In regions
with comparatively high soil fertility, males and females
grew for longer periods (up to 4.5 years) and to larger
body size (Strickland and Demarais 2000). Males
exhibited larger antler size in the fertile regions. In the
least fertile regions, body mass in both sexes and antler
size were smaller and growth occurred for only 3.5 years.
Regional effects on body size were significantly different
for all male age classes (Fig. 6) as well as female age
classes (not shown).
Jones et al. (2008), building on Strickland and
Demarais’ (2000, 2006) spatial analysis of white-tailed
deer in Mississippi, studied crude protein (CP) content
in eight forage species in areas that had not been recently
fertilized across the same regions. In general, Jones et al.
August 2011 365eNPP AND BODY SIZE
CONCEPTS&SYNTHESIS

found that areas with larger deer in Strickland and
Demarais’ study corresponded with areas with high CP
forage. In an earlier study, Jacobson (1984) linked deer
body mass to a variety of soil-quality parameters in
Mississippi, demonstrating significantly larger size in
bucks and does from areas with relatively high-
phosphorous-content soils (Fig. 5D). Together, the
Mississippi white-tailed deer studies indicate that body
mass increases with greater soil fertility. These results
confirm those of earlier studies that linked body size in
white-tailed deer and other species to nutrition, vegeta-
tion management for nutritious species, and soil fertility
(e.g., Crawford 1950, Gill 1956, Thorsland 1966, Brown
and Lee 1969, Murphy and Porath 1969, Jacobson 1984,
Soper et al. 1993).
In black bears and brown bears, food availability also
appears to drive intraspecific variability in body size at
smaller spatial scales unrelated to latitude (Rausch 1963,
Hilderbrand et al. 1999a, b, Maehr et al. 2001). Meiri et
al. (2007) clearly establish that grizzly bears (U. arctos)
are largest in body size in areas near streams with
reliable salmon runs and decrease in size with distance
from those sources (see Hilderbrand et al. 1999a, b).
Along similar lines, Maehr et al. (2001) found that at the
same latitude in two populations of black bears, those in
the more productive region attained larger body size.
Access to suburban and urban garbage leads to an
increase in body size and a decrease in foraging radius at
relatively high population densities in American black
bears (Beckmann and Berger 2003, Weaver 2004). Thus,
body size in bears at local spatial scales is directly related
to food availability, the proximate mechanism underly-
ing the eNPP rule.
Several studies in Australia have found gradients in
the population density of small marsupial species related
to soil fertility, with the highest densities on the most
fertile soils. In most cases, there was little or no
difference in body size within a species across the
FIG. 5. Animal body size, population density, and health in relation to soil fertility. (A) Raccoon body size (weight in pounds; 1pound¼0.45 kg) based on 5567 male raccoons harvested in 1941 and 1942 in 95 counties across Missouri (Crawford 1950) stratifiedby seven soil fertility classes. Circles indicate relative number of individuals in each 1-pound size class (from V. L. Sharpe,unpublished analysis; see Supplement 4). Thick line indicates mean mass. (B) Total number of raccoons harvested in each of 95Missouri counties ranked by soil fertility, showing only counties with 20 or more raccoons harvested (from Noren 1943). (C)Percentage of World War II Army draft registrants rejected for health reasons in four regions of Missouri, with regional soilaverages based on the same soil classification as in panels A and B (from Albrecht 1957). (D) Deer size (dressed body mass) inrelation to soil phosphorus for 1.5-year-old male deer harvested from 23 areas in Mississippi (based on Jacobson [1984: Table 4]).
MICHAEL A. HUSTON AND STEVE WOLVERTON366 Ecological MonographsVol. 81, No. 3
CONCEPTS&SYNTHESIS
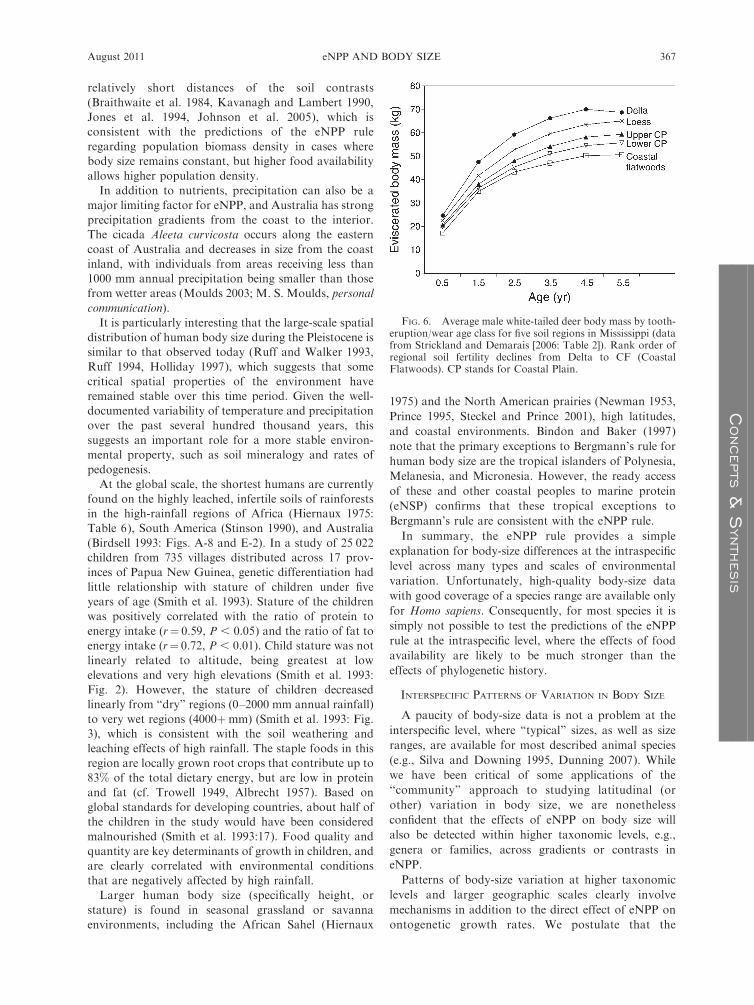
relatively short distances of the soil contrasts
(Braithwaite et al. 1984, Kavanagh and Lambert 1990,
Jones et al. 1994, Johnson et al. 2005), which is
consistent with the predictions of the eNPP rule
regarding population biomass density in cases where
body size remains constant, but higher food availability
allows higher population density.
In addition to nutrients, precipitation can also be a
major limiting factor for eNPP, and Australia has strong
precipitation gradients from the coast to the interior.
The cicada Aleeta curvicosta occurs along the eastern
coast of Australia and decreases in size from the coast
inland, with individuals from areas receiving less than
1000 mm annual precipitation being smaller than those
from wetter areas (Moulds 2003; M. S. Moulds, personal
communication).
It is particularly interesting that the large-scale spatial
distribution of human body size during the Pleistocene is
similar to that observed today (Ruff and Walker 1993,
Ruff 1994, Holliday 1997), which suggests that some
critical spatial properties of the environment have
remained stable over this time period. Given the well-
documented variability of temperature and precipitation
over the past several hundred thousand years, this
suggests an important role for a more stable environ-
mental property, such as soil mineralogy and rates of
pedogenesis.
At the global scale, the shortest humans are currently
found on the highly leached, infertile soils of rainforests
in the high-rainfall regions of Africa (Hiernaux 1975:
Table 6), South America (Stinson 1990), and Australia
(Birdsell 1993: Figs. A-8 and E-2). In a study of 25 022
children from 735 villages distributed across 17 prov-
inces of Papua New Guinea, genetic differentiation had
little relationship with stature of children under five
years of age (Smith et al. 1993). Stature of the children
was positively correlated with the ratio of protein to
energy intake (r¼ 0.59, P , 0.05) and the ratio of fat to
energy intake (r¼ 0.72, P , 0.01). Child stature was not
linearly related to altitude, being greatest at low
elevations and very high elevations (Smith et al. 1993:
Fig. 2). However, the stature of children decreased
linearly from ‘‘dry’’ regions (0–2000 mm annual rainfall)
to very wet regions (4000þmm) (Smith et al. 1993: Fig.
3), which is consistent with the soil weathering and
leaching effects of high rainfall. The staple foods in this
region are locally grown root crops that contribute up to
83% of the total dietary energy, but are low in protein
and fat (cf. Trowell 1949, Albrecht 1957). Based on
global standards for developing countries, about half of
the children in the study would have been considered
malnourished (Smith et al. 1993:17). Food quality and
quantity are key determinants of growth in children, and
are clearly correlated with environmental conditions
that are negatively affected by high rainfall.
Larger human body size (specifically height, or
stature) is found in seasonal grassland or savanna
environments, including the African Sahel (Hiernaux
1975) and the North American prairies (Newman 1953,
Prince 1995, Steckel and Prince 2001), high latitudes,
and coastal environments. Bindon and Baker (1997)
note that the primary exceptions to Bergmann’s rule for
human body size are the tropical islanders of Polynesia,
Melanesia, and Micronesia. However, the ready access
of these and other coastal peoples to marine protein
(eNSP) confirms that these tropical exceptions to
Bergmann’s rule are consistent with the eNPP rule.
In summary, the eNPP rule provides a simple
explanation for body-size differences at the intraspecific
level across many types and scales of environmental
variation. Unfortunately, high-quality body-size data
with good coverage of a species range are available only
for Homo sapiens. Consequently, for most species it is
simply not possible to test the predictions of the eNPP
rule at the intraspecific level, where the effects of food
availability are likely to be much stronger than the
effects of phylogenetic history.
INTERSPECIFIC PATTERNS OF VARIATION IN BODY SIZE
A paucity of body-size data is not a problem at the
interspecific level, where ‘‘typical’’ sizes, as well as size
ranges, are available for most described animal species
(e.g., Silva and Downing 1995, Dunning 2007). While
we have been critical of some applications of the
‘‘community’’ approach to studying latitudinal (or
other) variation in body size, we are nonetheless
confident that the effects of eNPP on body size will
also be detected within higher taxonomic levels, e.g.,
genera or families, across gradients or contrasts in
eNPP.
Patterns of body-size variation at higher taxonomic
levels and larger geographic scales clearly involve
mechanisms in addition to the direct effect of eNPP on
ontogenetic growth rates. We postulate that the
FIG. 6. Average male white-tailed deer body mass by tooth-eruption/wear age class for five soil regions in Mississippi (datafrom Strickland and Demarais [2006: Table 2]). Rank order ofregional soil fertility declines from Delta to CF (CoastalFlatwoods). CP stands for Coastal Plain.
August 2011 367eNPP AND BODY SIZE
CONCEPTS&SYNTHESIS
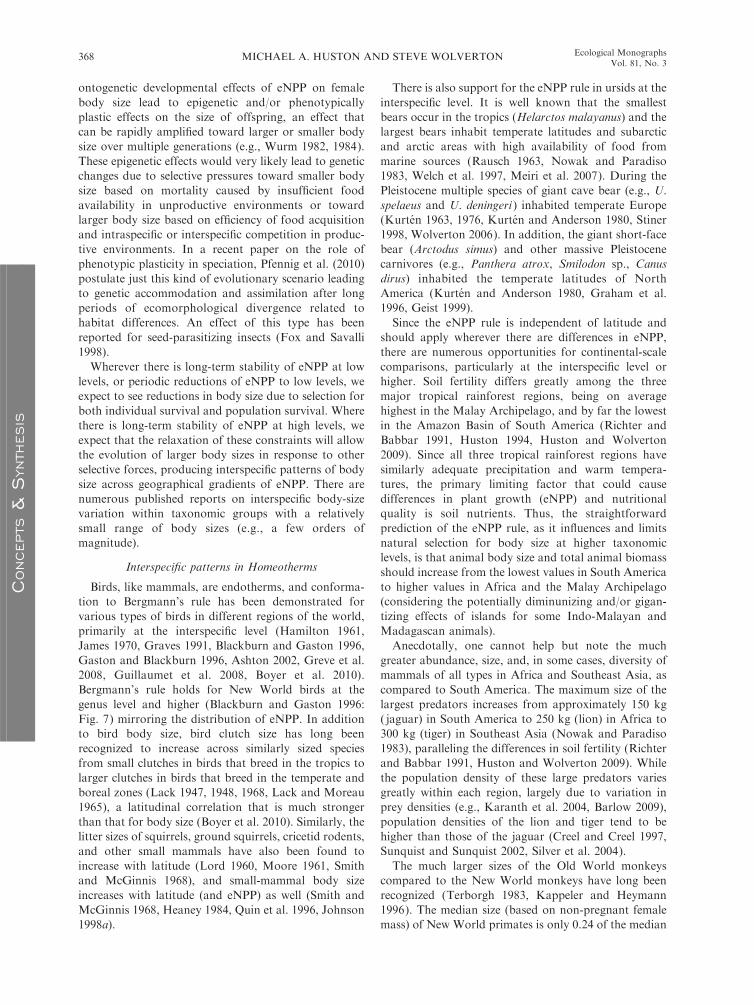
ontogenetic developmental effects of eNPP on female
body size lead to epigenetic and/or phenotypically
plastic effects on the size of offspring, an effect that
can be rapidly amplified toward larger or smaller body
size over multiple generations (e.g., Wurm 1982, 1984).
These epigenetic effects would very likely lead to genetic
changes due to selective pressures toward smaller body
size based on mortality caused by insufficient food
availability in unproductive environments or toward
larger body size based on efficiency of food acquisition
and intraspecific or interspecific competition in produc-
tive environments. In a recent paper on the role of
phenotypic plasticity in speciation, Pfennig et al. (2010)
postulate just this kind of evolutionary scenario leading
to genetic accommodation and assimilation after long
periods of ecomorphological divergence related to
habitat differences. An effect of this type has been
reported for seed-parasitizing insects (Fox and Savalli
1998).
Wherever there is long-term stability of eNPP at low
levels, or periodic reductions of eNPP to low levels, we
expect to see reductions in body size due to selection for
both individual survival and population survival. Where
there is long-term stability of eNPP at high levels, we
expect that the relaxation of these constraints will allow
the evolution of larger body sizes in response to other
selective forces, producing interspecific patterns of body
size across geographical gradients of eNPP. There are
numerous published reports on interspecific body-size
variation within taxonomic groups with a relatively
small range of body sizes (e.g., a few orders of
magnitude).
Interspecific patterns in Homeotherms
Birds, like mammals, are endotherms, and conforma-
tion to Bergmann’s rule has been demonstrated for
various types of birds in different regions of the world,
primarily at the interspecific level (Hamilton 1961,
James 1970, Graves 1991, Blackburn and Gaston 1996,
Gaston and Blackburn 1996, Ashton 2002, Greve et al.
2008, Guillaumet et al. 2008, Boyer et al. 2010).
Bergmann’s rule holds for New World birds at the
genus level and higher (Blackburn and Gaston 1996:
Fig. 7) mirroring the distribution of eNPP. In addition
to bird body size, bird clutch size has long been
recognized to increase across similarly sized species
from small clutches in birds that breed in the tropics to
larger clutches in birds that breed in the temperate and
boreal zones (Lack 1947, 1948, 1968, Lack and Moreau
1965), a latitudinal correlation that is much stronger
than that for body size (Boyer et al. 2010). Similarly, the
litter sizes of squirrels, ground squirrels, cricetid rodents,
and other small mammals have also been found to
increase with latitude (Lord 1960, Moore 1961, Smith
and McGinnis 1968), and small-mammal body size
increases with latitude (and eNPP) as well (Smith and
McGinnis 1968, Heaney 1984, Quin et al. 1996, Johnson
1998a).
There is also support for the eNPP rule in ursids at the
interspecific level. It is well known that the smallest
bears occur in the tropics (Helarctos malayanus) and the
largest bears inhabit temperate latitudes and subarctic
and arctic areas with high availability of food from
marine sources (Rausch 1963, Nowak and Paradiso
1983, Welch et al. 1997, Meiri et al. 2007). During the
Pleistocene multiple species of giant cave bear (e.g., U.
spelaeus and U. deningeri ) inhabited temperate Europe
(Kurten 1963, 1976, Kurten and Anderson 1980, Stiner
1998, Wolverton 2006). In addition, the giant short-face
bear (Arctodus simus) and other massive Pleistocene
carnivores (e.g., Panthera atrox, Smilodon sp., Canus
dirus) inhabited the temperate latitudes of North
America (Kurten and Anderson 1980, Graham et al.
1996, Geist 1999).
Since the eNPP rule is independent of latitude and
should apply wherever there are differences in eNPP,
there are numerous opportunities for continental-scale
comparisons, particularly at the interspecific level or
higher. Soil fertility differs greatly among the three
major tropical rainforest regions, being on average
highest in the Malay Archipelago, and by far the lowest
in the Amazon Basin of South America (Richter and
Babbar 1991, Huston 1994, Huston and Wolverton
2009). Since all three tropical rainforest regions have
similarly adequate precipitation and warm tempera-
tures, the primary limiting factor that could cause
differences in plant growth (eNPP) and nutritional
quality is soil nutrients. Thus, the straightforward
prediction of the eNPP rule, as it influences and limits
natural selection for body size at higher taxonomic
levels, is that animal body size and total animal biomass
should increase from the lowest values in South America
to higher values in Africa and the Malay Archipelago
(considering the potentially diminunizing and/or gigan-
tizing effects of islands for some Indo-Malayan and
Madagascan animals).
Anecdotally, one cannot help but note the much
greater abundance, size, and, in some cases, diversity of
mammals of all types in Africa and Southeast Asia, as
compared to South America. The maximum size of the
largest predators increases from approximately 150 kg
( jaguar) in South America to 250 kg (lion) in Africa to
300 kg (tiger) in Southeast Asia (Nowak and Paradiso
1983), paralleling the differences in soil fertility (Richter
and Babbar 1991, Huston and Wolverton 2009). While
the population density of these large predators varies
greatly within each region, largely due to variation in
prey densities (e.g., Karanth et al. 2004, Barlow 2009),
population densities of the lion and tiger tend to be
higher than those of the jaguar (Creel and Creel 1997,
Sunquist and Sunquist 2002, Silver et al. 2004).
The much larger sizes of the Old World monkeys
compared to the New World monkeys have long been
recognized (Terborgh 1983, Kappeler and Heymann
1996). The median size (based on non-pregnant female
mass) of New World primates is only 0.24 of the median
MICHAEL A. HUSTON AND STEVE WOLVERTON368 Ecological MonographsVol. 81, No. 3
CONCEPTS&SYNTHESIS
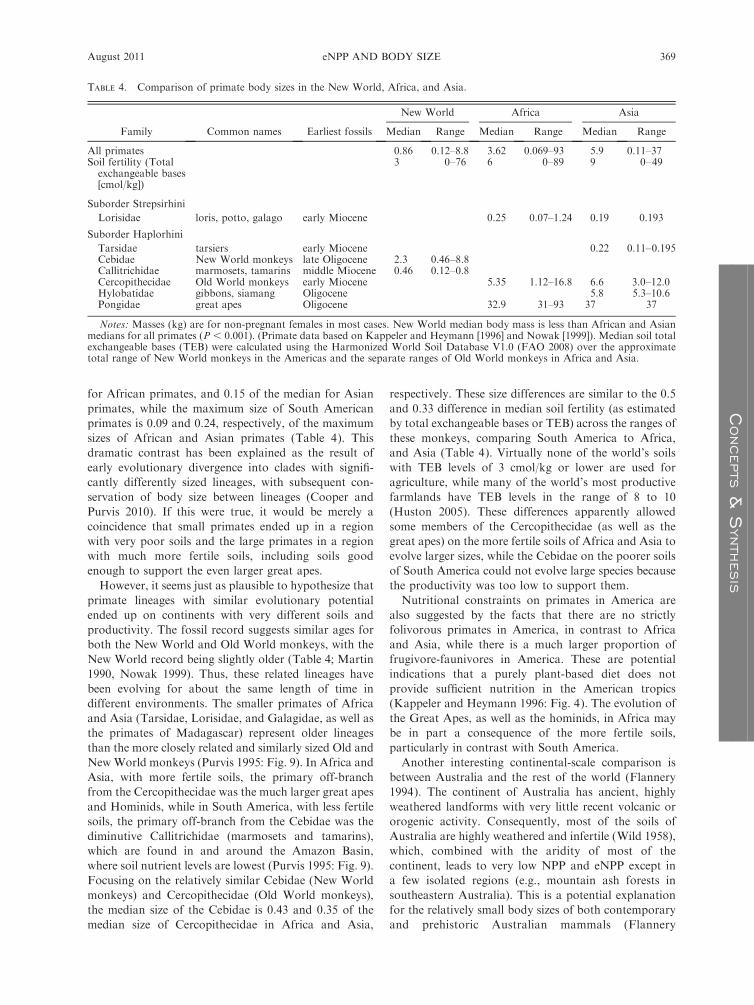
for African primates, and 0.15 of the median for Asian
primates, while the maximum size of South American
primates is 0.09 and 0.24, respectively, of the maximum
sizes of African and Asian primates (Table 4). This
dramatic contrast has been explained as the result of
early evolutionary divergence into clades with signifi-
cantly differently sized lineages, with subsequent con-
servation of body size between lineages (Cooper and
Purvis 2010). If this were true, it would be merely a
coincidence that small primates ended up in a region
with very poor soils and the large primates in a region
with much more fertile soils, including soils good
enough to support the even larger great apes.
However, it seems just as plausible to hypothesize that
primate lineages with similar evolutionary potential
ended up on continents with very different soils and
productivity. The fossil record suggests similar ages for
both the New World and Old World monkeys, with the
New World record being slightly older (Table 4; Martin
1990, Nowak 1999). Thus, these related lineages have
been evolving for about the same length of time in
different environments. The smaller primates of Africa
and Asia (Tarsidae, Lorisidae, and Galagidae, as well as
the primates of Madagascar) represent older lineages
than the more closely related and similarly sized Old and
NewWorld monkeys (Purvis 1995: Fig. 9). In Africa and
Asia, with more fertile soils, the primary off-branch
from the Cercopithecidae was the much larger great apes
and Hominids, while in South America, with less fertile
soils, the primary off-branch from the Cebidae was the
diminutive Callitrichidae (marmosets and tamarins),
which are found in and around the Amazon Basin,
where soil nutrient levels are lowest (Purvis 1995: Fig. 9).
Focusing on the relatively similar Cebidae (New World
monkeys) and Cercopithecidae (Old World monkeys),
the median size of the Cebidae is 0.43 and 0.35 of the
median size of Cercopithecidae in Africa and Asia,
respectively. These size differences are similar to the 0.5
and 0.33 difference in median soil fertility (as estimated
by total exchangeable bases or TEB) across the ranges of
these monkeys, comparing South America to Africa,
and Asia (Table 4). Virtually none of the world’s soils
with TEB levels of 3 cmol/kg or lower are used for
agriculture, while many of the world’s most productive
farmlands have TEB levels in the range of 8 to 10
(Huston 2005). These differences apparently allowed
some members of the Cercopithecidae (as well as the
great apes) on the more fertile soils of Africa and Asia to
evolve larger sizes, while the Cebidae on the poorer soils
of South America could not evolve large species because
the productivity was too low to support them.
Nutritional constraints on primates in America are
also suggested by the facts that there are no strictly
folivorous primates in America, in contrast to Africa
and Asia, while there is a much larger proportion of
frugivore-faunivores in America. These are potential
indications that a purely plant-based diet does not
provide sufficient nutrition in the American tropics
(Kappeler and Heymann 1996: Fig. 4). The evolution of
the Great Apes, as well as the hominids, in Africa may
be in part a consequence of the more fertile soils,
particularly in contrast with South America.
Another interesting continental-scale comparison is
between Australia and the rest of the world (Flannery
1994). The continent of Australia has ancient, highly
weathered landforms with very little recent volcanic or
orogenic activity. Consequently, most of the soils of
Australia are highly weathered and infertile (Wild 1958),
which, combined with the aridity of most of the
continent, leads to very low NPP and eNPP except in
a few isolated regions (e.g., mountain ash forests in
southeastern Australia). This is a potential explanation
for the relatively small body sizes of both contemporary
and prehistoric Australian mammals (Flannery
TABLE 4. Comparison of primate body sizes in the New World, Africa, and Asia.
Family Common names Earliest fossils
New World Africa Asia
Median Range Median Range Median Range
All primates 0.86 0.12–8.8 3.62 0.069–93 5.9 0.11–37Soil fertility (Totalexchangeable bases[cmol/kg])
3 0–76 6 0–89 9 0–49
Suborder Strepsirhini
Lorisidae loris, potto, galago early Miocene 0.25 0.07–1.24 0.19 0.193
Suborder Haplorhini
Tarsidae tarsiers early Miocene 0.22 0.11–0.195Cebidae New World monkeys late Oligocene 2.3 0.46–8.8Callitrichidae marmosets, tamarins middle Miocene 0.46 0.12–0.8Cercopithecidae Old World monkeys early Miocene 5.35 1.12–16.8 6.6 3.0–12.0Hylobatidae gibbons, siamang Oligocene 5.8 5.3–10.6Pongidae great apes Oligocene 32.9 31–93 37 37
Notes: Masses (kg) are for non-pregnant females in most cases. New World median body mass is less than African and Asianmedians for all primates (P , 0.001). (Primate data based on Kappeler and Heymann [1996] and Nowak [1999]). Median soil totalexchangeable bases (TEB) were calculated using the Harmonized World Soil Database V1.0 (FAO 2008) over the approximatetotal range of New World monkeys in the Americas and the separate ranges of Old World monkeys in Africa and Asia.
August 2011 369eNPP AND BODY SIZE
CONCEPTS&SYNTHESIS

1994:108–129) and many other vertebrates (e.g., the
‘‘little penguin’’), compared to species with similar
functional roles on other continents.
The continent of Australia provides many types of
productivity gradients. Of particular interest are the
longitudinal gradients associated with declining precip-
itation from the coast toward the interior, most
dramatically along the east coast and the southwest
coast. Intraspecific variation in body size has not been
compiled for most species, but there are a few examples
of what is likely to be a very common phenomenon at
both the intra- and interspecific levels. At the interspe-
cific level for Australian marsupials, Cooper and Purvis
(2010: Fig. 2A) report a gradient of declining median ln-
transformed body mass from the coast inland, which is
most pronounced along the east and southwest coasts.
Along the east coast, the latitudinal gradient is also a
productivity gradient, from the wet tropics in the north
to the high temperate wet forests of Tasmania in the
south, as noted by Yom-Tov and Nix (1986), who found
that intraspecific body-size variation within five species
(echidna, Tachyglossus aculeatus; brush-tailed possum,
Trichosurus vulpecula; eastern gray kangaroo, Macropus
giganteus; western gray Kangaroo, M. fuliginosus; red
kangaroo, M. rufus) conformed to Bergmann’s rule.
Body size in four of the five species, excepting the red
kangaroo, was also correlated with indices of biomass
productivity, which the authors note are difficult to
separate from the correlated trend in ambient temper-
ature. Yom-Tov and Geffen (2006) reported similar
precipitation-related size gradients in 11 species of
mammals in Israel that they interpreted as responses
to productivity.
Within Africa, there is great variation in soil fertility,
the amount and seasonality of precipitation, and thus of
eNPP. Owen-Smith (1988) reports that body size of
large herbivore species, both ruminants and non-
ruminants, is positively correlated with total population
biomass (measured as kg/km2; Fig. 7B). Total herbivore
biomass is, in turn, positively correlated with mean
annual rainfall (Fig. 7A) and presumably eNPP across a
set of national parks. Total herbivore biomass reaches
its maximum around 900 mm of rainfall and apparently
declines at higher levels of precipitation, where increased
leaching causes loss of cations (e.g., Kþ, Caþ, NH4þ) and
reduces soil fertility (Albrecht 1957, Meggers 1971,
Huston 1980, 1994, Uehara and Gillman 1981). The
parks with the highest biomass of large herbivores are
located on volcanic soils in or near the Rift Valley
(Virunga, Zaire; Manyara, Tanzania; Rwenzori, Ugan-
da; Murchison Falls South, Uganda).
Interspecific patterns in poikilotherms
Bergmann (1847) may have intended his rule to apply
only to homeotherms (Margalef 1955, Meiri 2011), but
there have nevertheless been numerous publications
addressing latitudinal body-size variation in poikilo-
therms, at both the intraspecific and interspecific levels
(see Ashton and Feldman 2003). Similar to the
proportion of mammals that conform to Bergmann’s
rule, about 75% of terrestrial vertebrate and invertebrate
poikilotherms match the predictions of Bergmann’s rule,
based on both experimental work within species (Ray
1960) and literature reviews at the interspecific level
(Ray 1960, Lindsey 1966).
However, Bergmann’s heat-balance mechanism obvi-
ously does not apply to poikilotherms, which raises the
critical question of why so many seem to follow
Bergmann’s rule. A number of alternative mechanisms
have been proposed to explain geographical body-size
variation in poikilotherms (reviewed in Entling et al.
2010), including some based on the relationship between
body size, metabolic rate, and temperature that predict
larger body size in terrestrial poikilotherms under
warmer temperatures (Makarieva et al. 2005). Support-
ing evidence for this mechanism includes the observation
that in 24 of 25 families of insects, spiders, and other
invertebrates plus frogs, snakes, and lizards found from
the temperate zones through the tropics, the largest
species were found in the tropics (Makarieva et al.
2005). Similarly, a survey of the average size of spiders
in local assemblages across Europe found that body size
declined with latitude between 358 and 658 N, with the
largest average size in warm, dry conditions (Entling et
al. 2010).
The size–temperature–metabolic-rate mechanism
(Makarieva et al. 2005) is postulated to act as a size
constraint on natural selection that varies with temper-
ature, but does not preclude the operation of the eNPP
rule at the intraspecific level as well. Most reported data
on body-size gradients in poikilotherms are at the
interspecific or community level, rather than the
intraspecific level where we have focused on the short-
term effects of food availability and eNPP on body size.
While we argue that food availability as regulated by
eNPP can lead to natural selection for larger or smaller
body size and specific life history strategies, this is clearly
not the only influence on the evolution of body size or
life history attributes. Interestingly, the predictions of
the size–temperature–metabolic-rate model proposed by
Makarieva et al. are the opposite of Bergmann’s rule
and the eNPP rule for terrestrial poikilotherms, but the
same as those of Bergmann’s rule and the eNPP rule for
aquatic or marine poikilotherms, based on the lower
oxygen concentration of water as compared to air, as
well as the sensitivity of oxygen concentration to water
temperature. The implications for marine fish are
discussed in Abundance, biomass, size, and diversity in
the oceans.
The sensitivity of insect body size to food availability,
the fundamental mechanism underlying the eNPP rule,
is illustrated by several groups of parasitic wasps that lay
their eggs in the larvae or pupae of their hosts. Female
parasites prefer to lay their eggs in larger larvae or
pupae, and preferentially lay female eggs in the largest
hosts, which produce larger female offspring that can in
MICHAEL A. HUSTON AND STEVE WOLVERTON370 Ecological MonographsVol. 81, No. 3
CONCEPTS&SYNTHESIS

turn lay more eggs and handle larger hosts for their own
oviposition (Chewyreuv 1913, Brunson 1937, Clausen
1939, Charnov et al. 1981) illustrating an epigenetic
positive feedback that we believe is quite common.
Blanckenhorn (1998) reported a strong effect of larval
food supply on adult size in dung flies that was largely
independent of development time. Stockhoff (1993)
reported reduced pupal mass and extended development
time for gypsy moth larvae fed a diet that was either very
high (4.75%) or very low (1.25%) in nitrogen content,
compared to a diet of 3.0% nitrogen content. However,
Twombly and Tisch (2000) found strong growth
compensation and little size variation in copepods fed
diets that varied in quantity and quality (see however
Berg 1936). Overall, we expect strong effects of food
quantity and quality (e.g., protein or nitrogen content)
on the ontongenetic growth rates of larvae, duration of
instars, and adult body sizes of insects and other
invertebrates.
Understanding of multiple factors, and region-specific
data on eNPP, temperature, and precipitation, will be
necessary to explain contrasting interspecific patterns
such as the latitudinal increase in mean butterfly size
(male wing length) in North America (25–758 N), the
FIG. 7. (A) Effect of precipitation on herbivore biomass in national parks in Africa. The shaded portion of each bar representsthe contribution of megaherbivores (elephants, rhinoceros, giraffes) to the total large herbivore biomass in a specific park. (B)Relationship of body size to maximum population biomass for a range of herbivore species in Africa (from Owen-Smith [1988:Figs. 14.2, 14.3]; reprinted with the permission of Cambridge University Press). Abbreviations are for large mammals from Africanparks; a full description of the species represented can be found in Appendix I of Owen-Smith (1988: Table I.1).
August 2011 371eNPP AND BODY SIZE
CONCEPTS&SYNTHESIS
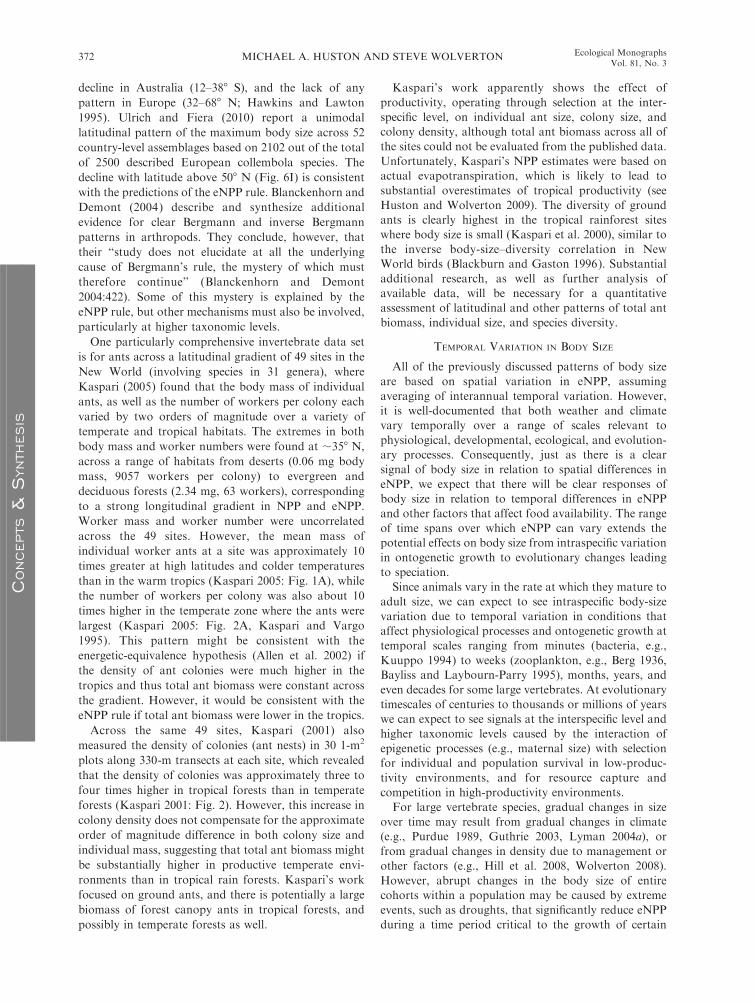
decline in Australia (12–388 S), and the lack of any
pattern in Europe (32–688 N; Hawkins and Lawton
1995). Ulrich and Fiera (2010) report a unimodal
latitudinal pattern of the maximum body size across 52
country-level assemblages based on 2102 out of the total
of 2500 described European collembola species. The
decline with latitude above 508 N (Fig. 6I) is consistent
with the predictions of the eNPP rule. Blanckenhorn and
Demont (2004) describe and synthesize additional
evidence for clear Bergmann and inverse Bergmann
patterns in arthropods. They conclude, however, that
their ‘‘study does not elucidate at all the underlying
cause of Bergmann’s rule, the mystery of which must
therefore continue’’ (Blanckenhorn and Demont
2004:422). Some of this mystery is explained by the
eNPP rule, but other mechanisms must also be involved,
particularly at higher taxonomic levels.
One particularly comprehensive invertebrate data set
is for ants across a latitudinal gradient of 49 sites in the
New World (involving species in 31 genera), where
Kaspari (2005) found that the body mass of individual
ants, as well as the number of workers per colony each
varied by two orders of magnitude over a variety of
temperate and tropical habitats. The extremes in both
body mass and worker numbers were found at ;358 N,
across a range of habitats from deserts (0.06 mg body
mass, 9057 workers per colony) to evergreen and
deciduous forests (2.34 mg, 63 workers), corresponding
to a strong longitudinal gradient in NPP and eNPP.
Worker mass and worker number were uncorrelated
across the 49 sites. However, the mean mass of
individual worker ants at a site was approximately 10
times greater at high latitudes and colder temperatures
than in the warm tropics (Kaspari 2005: Fig. 1A), while
the number of workers per colony was also about 10
times higher in the temperate zone where the ants were
largest (Kaspari 2005: Fig. 2A, Kaspari and Vargo
1995). This pattern might be consistent with the
energetic-equivalence hypothesis (Allen et al. 2002) if
the density of ant colonies were much higher in the
tropics and thus total ant biomass were constant across
the gradient. However, it would be consistent with the
eNPP rule if total ant biomass were lower in the tropics.
Across the same 49 sites, Kaspari (2001) also
measured the density of colonies (ant nests) in 30 1-m2
plots along 330-m transects at each site, which revealed
that the density of colonies was approximately three to
four times higher in tropical forests than in temperate
forests (Kaspari 2001: Fig. 2). However, this increase in
colony density does not compensate for the approximate
order of magnitude difference in both colony size and
individual mass, suggesting that total ant biomass might
be substantially higher in productive temperate envi-
ronments than in tropical rain forests. Kaspari’s work
focused on ground ants, and there is potentially a large
biomass of forest canopy ants in tropical forests, and
possibly in temperate forests as well.
Kaspari’s work apparently shows the effect of
productivity, operating through selection at the inter-
specific level, on individual ant size, colony size, and
colony density, although total ant biomass across all of
the sites could not be evaluated from the published data.
Unfortunately, Kaspari’s NPP estimates were based on
actual evapotranspiration, which is likely to lead to
substantial overestimates of tropical productivity (see
Huston and Wolverton 2009). The diversity of ground
ants is clearly highest in the tropical rainforest sites
where body size is small (Kaspari et al. 2000), similar to
the inverse body-size–diversity correlation in New
World birds (Blackburn and Gaston 1996). Substantial
additional research, as well as further analysis of
available data, will be necessary for a quantitative
assessment of latitudinal and other patterns of total ant
biomass, individual size, and species diversity.
TEMPORAL VARIATION IN BODY SIZE
All of the previously discussed patterns of body size
are based on spatial variation in eNPP, assuming
averaging of interannual temporal variation. However,
it is well-documented that both weather and climate
vary temporally over a range of scales relevant to
physiological, developmental, ecological, and evolution-
ary processes. Consequently, just as there is a clear
signal of body size in relation to spatial differences in
eNPP, we expect that there will be clear responses of
body size in relation to temporal differences in eNPP
and other factors that affect food availability. The range
of time spans over which eNPP can vary extends the
potential effects on body size from intraspecific variation
in ontogenetic growth to evolutionary changes leading
to speciation.
Since animals vary in the rate at which they mature to
adult size, we can expect to see intraspecific body-size
variation due to temporal variation in conditions that
affect physiological processes and ontogenetic growth at
temporal scales ranging from minutes (bacteria, e.g.,
Kuuppo 1994) to weeks (zooplankton, e.g., Berg 1936,
Bayliss and Laybourn-Parry 1995), months, years, and
even decades for some large vertebrates. At evolutionary
timescales of centuries to thousands or millions of years
we can expect to see signals at the interspecific level and
higher taxonomic levels caused by the interaction of
epigenetic processes (e.g., maternal size) with selection
for individual and population survival in low-produc-
tivity environments, and for resource capture and
competition in high-productivity environments.
For large vertebrate species, gradual changes in size
over time may result from gradual changes in climate
(e.g., Purdue 1989, Guthrie 2003, Lyman 2004a), or
from gradual changes in density due to management or
other factors (e.g., Hill et al. 2008, Wolverton 2008).
However, abrupt changes in the body size of entire
cohorts within a population may be caused by extreme
events, such as droughts, that significantly reduce eNPP
during a time period critical to the growth of certain
MICHAEL A. HUSTON AND STEVE WOLVERTON372 Ecological MonographsVol. 81, No. 3
CONCEPTS&SYNTHESIS

(generally the youngest) members of the population.
Longer droughts, or other events that reduce eNPP, may
cause a reduction in the body size of an entire
generation, which can have potential longer-term
consequences through the effect on maternal size.
Larger-scale climate cycles can cause substantial changes
in eNPP and food available at millennial scales or longer
(Purdue 1989, Lyman 2004a).
While we expect that intrapopulation size variation
driven by short- and intermediate-term temporal vari-
ability in eNPP and food availability occurs in all
relatively long-lived animals, the most detailed docu-
mentation of such effects is for Homo sapiens. The
Dutch Famine of 1944–1945 was caused by World War
II and lasted eight months with a reduction of caloric
intake of 60% (van Noord and Arias-Careaga 1995).
Data from a breast cancer study involving 18 000
women born between 1911 and 1945 showed that the
cohort with the highest famine exposure (N¼ 1901) had
a significant (P , 0.0001) reduction in height as well as
in arm span and leg length compared to the non-exposed
population. Critical ages for height reduction due to the
famine were 0–9 and 12–16 years, with no effect detected
in girls who were 16 or older, or who were around 10–
11, when the growth spurt typically occurs (van Noord
and Arias-Careaga 1995). China’s Great Famine of
1959–1961 was due to administrative rather than
environmental factors and is estimated to have killed
between 16 and 31 million people (Meng and Qian
2009). Based on county-level data from the 1990
population census and the 1989 China Health and
Nutritional Survey, the famine is estimated to have
reduced the number in the 1959–1961 cohort by 36% in
relation to the number in the 1952–1954 cohort. For the
individuals in the 90th height percentile, most of whom
are assumed to have survived the famine, in utero
exposure is estimated to have reduced adult height by
2.8 cm and mass by 1.42 kg, while early childhood
exposure reduced adult height by 2.7 cm and mass by
3.03 kg (Meng and Qian 2009). Dietary and health
differences are the apparent explanation for the average
10.21 cm height difference and different body propor-
tions (legs average 7.02 cm longer) between Mayan
children 6–12 years of age growing up in the United
States and those of the same age growing up in
Guatemala (Bogin and Rios 2003).
At a somewhat longer timescale, analysis of height
measurements made in 1906–1907 of 223 male Oglala
(Teton) Sioux on the Pine Ridge Reservation revealed
significant differences of as much as 4 cm in average
height between decadal birth cohorts from 1830 to 1880
with an overall trend of increasing height over the time
period (Prince 1995). While the actual cause of these
differences in height cannot be unequivocally deter-
mined, they may be related to a combination of western
droughts during the 1800s (Piechota et al. 2004) and
stresses associated with Indian wars and persecution by
the U.S. government.
Over the past millennium, average height in northern
Europe declined from nearly modern levels during the
Middle Ages (800–1300 AD), which included the 500
year ‘‘Medieval Warm Period,’’ to a low in the 1600s and
the ‘‘Little Ice Age’’ (Parker and Smith 1997) before
recovering during the 1800s. In addition to the climatic
deterioration during the 17th century, political and
religious turmoil, as well as new diseases associated with
global colonization, may have contributed to a reduc-
tion in the food supply and overall health (Steckel 2001).
Beginning in the 19th century, body size began to
increase and continued to do so through most of the
20th century, presumably because of better nutrition
and health care (Wurm 1982, 1984, Gustaffson et al.
2007). From 1880 to 1980 mean height in Europe
increased about 1 cm/decade (Eveleth and Tanner 1990).
Over the Paleolithic period (40–10 kya [kya stands for
thousands of years ago]), human body size in Europe
declined from the early Upper Paleolithic (EUP, 40–20
kya) to the late Upper Paleolithic (LUP, 19–10 kya),
associated with the warming following the Last Glacial
Maximum (Holt and Formicola 2008; Table 5).
Although the Paleolithic was affected by extreme and
rapid climatic fluctuations (van Andel et al. 2003), it is
not obvious why body size should decline with an
apparent improvement in mean climate. Increased
population densities and overexploitation of natural
resources have been identified as one potential explana-
tion for the observed decline in prey body size (Stiner et
al. 1999), although variation in eNPP remains an
alternative hypothesis. The reduced stature of Europe-
ans in the late Upper Paleolithic contrasts with the
substantially taller LUP people of the fertile Nile Valley,
and the much shorter people of Southeast Asia (Table
TABLE 5. Temporal and spatial differences in human stature during the Upper Paleolithic.
Sex
Height (cm)
Early Upper Paleolithic Late Upper Paleolithic
Europe� Europe� Southeast Asia Nile Valley Mediterranean
Male 174.1 6 1.5 (10) 165.3 6 3.7) (15) 153.1 6 5.6 (3) 170.2 6 1.2 (15) 168.4 6 1.3 (12)Female 161.8 6 3.2 (5) 154.5 6 3.4 (7) 147.8 6 2.17 (7) 162.4 6 0.7 (16) 161.7 6 2.4 (4)
Notes: Values are means with standard errors. Sample sizes are shown in parentheses. Based on Holt and Formicola 2008. Dataare from Shackelford (2007) and Holt and Formicola (2008) unless otherwise noted.
� Data from Holt (2003).
August 2011 373eNPP AND BODY SIZE
CONCEPTS&SYNTHESIS

5). There is as yet no definitive explanation for the small
size of Southeast Asians of this period (Shackelford
2007), although the same pattern (at least for the
Japanese) persisted through the mid-19th century
(Steckel and Floud 1997: Table 11.2), perhaps due in
part to high population densities that could have
reduced per individual food availability.
Over evolutionary time scales, there should be
numerous examples of body-size responses to changes
in productivity found in the fossil record for all types of
organisms. One well-documented example is the dimi-
nution of a number of mammal species in what is now
northwestern Wyoming, about 55 million years ago
during a brief warm dry period. This event, known as
the Paleocene-Eocene temperature maximum (PETM),
lasted about 86 000 years, during which species in
several genera, including Hyracotherium, Copecion, and
Ectocion were rapidly replaced by species (or diminu-
tized ecotypes) that were about 50% of the mass of those
in the preceding and/or following time periods (Ginger-
ich 2003, 2008). Whether the diminutized individuals
should be considered separate species (as they usually
are) or whether they simply represent phenotypic
plasticity within a single species remains to be deter-
mined. Interestingly, there was a sharp jump in the
number of mammal species in this fauna over the brief
period of the PETM (Vrba 1985, Webb and Opdike
1995). While there are no data on NPP during this time
period, it seems likely that the warmer, drier conditions
were associated with a water-limited decline in NPP and
eNPP.
Over the past 15 000 years, there has been a significant
diminution in size of numerous species of mammals in
North America (Hooijer 1950, Guthrie 1984, Lyman
2004a, b, Lyman and O’Brien 2005), as well as the
extinction of many of the largest species (Grayson 2007,
Wolverton et al. 2009b). In many of these cases, declines
in both size and abundance are associated with a shift to
warmer, drier conditions during the Altithermal (Purdue
1989, Grayson 1998, 2000, Lyman 2004a, Lyman and
Wolverton 2002), which is consistent with changes
expected with decreasing eNPP.
An example of rapid response to very recent climate
change provides a temporal analogy of the spatial
increase in body size as latitude declines from 808 to 608
N. Ogzul et al. (2010) conducted a long-term (1976–
2008) study of a marmot (Marmota flaviventris) popu-
lation in a subalpine valley (2950 m above sea level) in
the Colorado Rockies. Over the duration of the study,
the growing season increased in length, with marmots
emerging from their six to seven month hibernation
earlier each year, with corresponding decreases in
birthing and weaning dates. With the increased time
for feeding, the mean 1 August mass of 2-year-old or
older females increased by 11% (to 3433 g) between the
first and second halves of the study. Beginning in 2000,
there was a sudden increase in population growth rate
from 0.56 marmots per year to 14.2 marmots per year
(Ogzul et al. 2010). This increase in both body size and
population density of marmots with increased length of
the eNPP pulse matches the predictions of the eNPP
rule, and shows the same effect on body size as observed
with caribou, wolves, and marine fish as growing-season
length increases with decreasing latitude from 808 N to
approximately 608 N (Fig. 1, zone B�). Interestingly, asize increase has also been reported for the arboreal
mustelid predator, the Marten (Martes americana) in
Alaska, as climate has warmed over the past fifty years
(Yom-Tov et al. 2008).
Temporal variation in animal body size is evident over
a broad range of time scales, and it seems likely that a
substantial amount of the variability in body size (age
and sex corrected) within populations of long-lived
species may be due to variation in food availability
caused by climatic fluctuations or other factors that
affect eNPP during critical periods of ontogenetic
growth and maturation. We also hypothesize that
differences in the maximum body size observed within
higher taxonomic levels (e.g., genera, families, and
orders of fish, reptiles, birds, and mammals) across
geological time scales in different regions of the Earth
are at least partially due to variation in eNPP as a result
of varying rates of geological processes such as
volcanism, orogeny, erosion, deposition, and sea level
fluctuations, interacting with regional scale climate. The
generally warm, wet climate (e.g., McElwain et al. 1999)
and high tectonic activity of the Mesozoic Era contrib-
uted to high productivity that may help explain the large
body sizes of some dinosaurs and other reptiles during
much of that period. Over the geological history of life
on Earth, as plate tectonics have opened and closed
seaways and oceans, with varying nutrient inputs from
terrestrial sediments (e.g., Blakey and Ranney 2009), we
hypothesize that the ratio of terrestrial nutrient input to
ocean volume has produced huge spatial and temporal
variation in marine NPP and thus in the body size and
abundance of marine organisms, analogous to the
spatial and temporal variation of NPP on land.
BEYOND BODY SIZE
If food quantity and quality, as proposed in the eNPP
Rule, are the primary explanation for geographical
patterns of animal size, it should have implications for
other organismal and ecological properties that are not
addressed by Bergmann’s rule or by most of the body-
size literature (see however, Kaspari 2001, as well as the
vast anthropological and human health literature). The
two most significant ecological properties that are
dependent on food and energy availability are the
abundance of a species (regardless of body size) and
the total biomass per unit area of a species, which is
obviously the product of population density and
individual biomass. Additional individual and popula-
tion-level properties that are dependent on food and
energy availability include health, strength, reproductive
rates, and other traits associated with evolutionary
MICHAEL A. HUSTON AND STEVE WOLVERTON374 Ecological MonographsVol. 81, No. 3
CONCEPTS&SYNTHESIS

fitness. The eNPP rule makes the simple prediction that
body size and/or abundance, as well as total species
biomass, individual health, and fecundity should all be
positively correlated with eNPP because they are all
derived from eNPP. Since all of these traits are directly
related to the growth rates and survival of populations,
we can expect that eNPP will also have an effect on
species diversity through both speciation and extinction
rates (e.g., Huston 1994; M. A. Huston, unpublished
manuscript).
Abundance, biomass, size, and diversity on land
The idea that organismal abundance is a direct
function of available energy is not new (Lindeman
1942, Damuth 1981, 1987, 1991) and is a central idea
behind energy–diversity theory and ‘‘more individuals’’
explanations for species diversity (Wright 1983, Currie
1991, Currie and Fritz 1993, Wright et al. 1993), as well
as the metabolic theory of ecology (MTE; Brown et al.
2004). These theories propose that the key driver of
species diversity is animal density or population size,
which at high levels reduces the probability of stochastic
extinction and should lead to the highest diversity where
average population densities are highest (Wright 1983,
Currie 1991, Allen et al. 2002). According to the
‘‘energetic-equivalence rule,’’ the total energy flux of a
population within a specific area is invariant with regard
to body size (Damuth 1987, Enquist and Niklas 2001,
Allen et al. 2002). Because individual metabolic demand
increases (logarithmically) with body size (Benedict
1938), the energetic-equivalence rule predicts that body
size should be inversely correlated with population
density, assuming that the amount of energy available,
that is, eNPP, is constant across the areas being
compared.
Proponents of metabolic theory and the energetic-
equivalence rule predict that species population densities
and, consequently, species diversity should be highest in
the tropics because of the high temperatures (assumed to
correspond to high available energy) combined with
(incorrectly) presumed high productivity (Allen et al.
2002, Brown et al. 2004). However, this prediction is the
opposite of the eNPP rule, which predicts that animal
body sizes and/or population densities should be low in
the tropics because of low eNPP (Huston and Wolver-
ton 2009), and that likewise, total population biomass
should also be lower in the tropics, or anywhere eNPP is
low. These low-eNPP and low-population density
conditions are where other ecological (Huston 1979,
1994) and evolutionary (Huston 1994:304–318; M. A.
Huston, unpublished manuscript) hypotheses predict that
species diversity should be highest.
The challenge in testing these alternative hypotheses is
the lack of adequate data on spatial variation in animal
population densities, and thus on total population
biomass. This deficiency is paralleled by the lack of
spatial information on intraspecific variation in body
size across virtually all taxa (except for humans and a
few other mammals). The most extensive data on body-
size variation are at the interspecific level, with spatial
variation in species composition being the driver of
differences in mean community body size (an approach
we criticized in the introduction). While these are
relatively weak data for evaluating the mechanisms
underlying the predictions of the MTE and the eNPP
rule, they do offer the possibility of evaluating some of
the correlations among body size, total population
biomass, population density, and species richness.
Johnson (1998a) found that population densities of
Australian mammals (comparing 69 species) were lower
in the tropics, where both geographical range sizes and
body sizes were also smaller. For 13 species with ranges
that included the tropical and temperate zones, he found
that population densities tended to be greater in the
temperate portion of their range, and that for some of
the species body size also increased in the temperate
portion. On average, based on body size and population
density, he estimated that the ‘‘tropical populations used
about one order of magnitude less energy than did
temperate populations of the same species’’ (Johnson
1998a:692). Similar patterns of increasing population
density, as well as increasing body size, with increasing
latitude have been found across multiple species of
Australian honeyeaters (Aves: Meliphagidae; Symonds
et al. 2006, Symonds and Johnson 2006) as well as
among other species of birds and mammals (Currie and
Fritz 1993, Gaston and Blackburn 1996).
Across multiple species of African ungulates in a
variety of major national parks, the maximum local
population biomass per unit area increases as the mean
body size of the species increases (Fig. 7B; Owen-Smith
1988). This is not consistent with the ‘‘energetic-
equivalence’’ hypothesis, which predicts an adjustment
between body size and density to maintain an equilib-
rium energy flow, and by association, biomass. Howev-
er, this is consistent with the prediction of the eNPP rule.
At the spatial scale over which ungulate size varies by
more than two orders of magnitude there is no
significant variation in either temperature or latitude,
but there is variation in savanna productivity (Owen-
Smith 1988, 2002).
Consistent with the well-known body-size differences
between New and Old World primates discussed
previously, there is evidence that total primate biomass
is higher (by a factor of 4 or more) in Old World primate
communities than in NewWorld communities on poorer
soils (Terborgh 1983, cited in Huston 1994). At smaller
spatial scales, it is apparent that total herbivore biomass
in Africa is positively correlated with annual precipita-
tion, which is an indicator of eNPP (Fig. 7A). At the
intraspecfic level, raccoon body size in Missouri is
correlated with soil fertility, as is raccoon population
density (where there is sufficient habitat unimpacted by
agriculture; Fig. 5A and B).
In addition to the previously discussed information on
latitudinal patterns of ant body size, colony size, and
August 2011 375eNPP AND BODY SIZE
CONCEPTS&SYNTHESIS

colony density from Kaspari’s work (Kaspari and Vargo
1995, Kaspari 2005), Hails (1982) documented that the
biomass of flying insects is an order of magnitude higher
in the temperate zone (Scotland) than in the tropics
(Malaysia) (Huston and Wolverton 2009: Fig. 14). This
latitudinal difference in insect biomass helps explain
marked differences in foraging efficiency and insect
capture rates in insectivorous passerine birds between
the temperate zone (France) and the tropics (French
Guiana; Thiollay 1988). Supplemental food for breeding
temperate zone warblers increased the number of second
broods, decreased the time females spent foraging, and
increased the time they spent near the nest (Nagy and
Holmes 2005), illustrating the critical importance of
food availability even in areas with high eNPP. Such
differences in food availability for insectivores mirror
the latitudinal patterns in avian body and clutch size.
Nearly all of the data on body size, reproductive rates,
population density, and total population biomass are
consistent with our conclusion that eNPP in tropical
rain forests is much lower than in the temperate zone.
The apparently lower population densities of tropical
organisms imply that the ‘‘more individuals’’ explana-
tion for high tropical diversity, as proposed in the
context of the metabolic theory of ecology (Brown et al.
2004) and the ‘‘energetics-equivalence rule’’ is invalid.
High tropical diversity is apparently maintained in spite
of the lower population densities and lower population
growth rates in the tropics. This suggests that a new set
of theories are needed to explain evolution, speciation,
and high diversity in the tropics (see Huston 1979, 1980,
1985, 1994:304–318).
Abundance, biomass, size, and diversity in the oceans
While the available measurements of terrestrial NPP
are extremely limited in spatial coverage and eNPP must
be ‘‘back-calculated’’ by dividing annual measurements
of NPP by the estimated length of the growing season at
each location (Huston and Wolverton 2009), the marine
NPP data are incomparably better. Annual marine NPP
is calculated by summing multiple short-term estimates
of eNPP based on complete global satellite coverage
every two days by the SeaWIFs or MODIS sensors (e.g.,
Behrenfeld and Falkowski 1997, Behrenfeld et al. 2001).
Estimates of marine eNPP are based on colorimetric
determination of the amount of algal chlorophyll in the
upper portion of the water column, converted to eNPP
using algorithms such as the vertically generalized
production model (VGPM; Behrenfeld and Falkowski
1997, Behrenfeld et al. 2001) or subsequent modifica-
tions (e.g., Behrenfeld et al. 2005, 2006). Daily estimates
of eNPP (g C�m2�d�1) can be averaged to provide
monthly estimates of eNPP comparable to those
calculated for terrestrial ecosystems (Figs. 4A, 8A,
10A; Huston and Wolverton 2009: Fig. 11E, F).
At the global scale, one of the largest and longest-term
data sets on animal biomass is the harvest data from
marine fisheries. These data, compiled by the United
Nations Environment Program (Sherman and Hempel
2009), extend back to 1950 for many regions of the
world, and are used extensively for fisheries management
and conservation planning. The catch data, plus a large
amount of ancillary data, such as NPP estimates and sea
surface temperatures, have recently been compiled for a
set of 64 regions called large marine ecosystems (LMEs),
which account for 80–90% of the world’s fisheries
harvest (Fig. 9; Sherman et al. 2009a, b). The LMEs are
primarily continental shelf areas, and large bays such as
the Gulf of Mexico and the Bay of Bengal, and do not
include the open ocean. Major nongovernmental proj-
ects, such as FishBase and the Sea Around Us Project
(see projects online),4,5 have compiled species lists, size
records, and other catch parameters for all of the LMEs,
which have been used to generate community-level
estimates of average fish size, based on the maximum
reported size for each species (Fisher et al. 2010; also see
Supplement 3).
Mean fish body size (at the interspecific level, based
on maximum sizes of the species found in each LME) is
nonlinearly related to latitude (Fisher et al. 2010; Fig.
8B), as predicted in part by Bergmann’s rule and
completely by the eNPP rule, including an apparent
decline in mean body size and marine eNPP above 608
N, similar to the pattern found in terrestrial ungulates at
the inter- and intraspecific levels (Fig. 3), as well as in
numerous other species (Fig. 4). Sea surface tempera-
tures (SSTs) obviously decrease with latitude (Fisher et
al. 2010: Fig. 11), while fisheries catches increase with
latitude, particularly in the Northern Hemisphere,
following the pattern of average marine eNPP (Fig.
8A). Although there is strong seasonality in sunlight,
water temperature, and eNPP in the higher latitudes
(Behrenfeld et al. 2001, Huston and Wolverton 2009),
the lower temperatures of sea water at these latitudes do
not seem to have any negative effect on eNPP during the
growing season (Figs. 8A and 10A), nor on total annual
marine NPP, both of which are highest at high latitudes.
Low temperatures may actually have a positive effect
on eNPP and eNSP through lowering respiration rates
in plants and ectothermic animals. The high fisheries
catches and large body sizes at these latitudes are
consistent with this interpretation, assuming that
fisheries catch is representative of secondary productiv-
ity and correlated with primary productivity. It is
significant that the high eNPP and high fisheries catches
are primarily near the continental margins, where
terrestrial nutrient inputs are high, but solar radiation
and water temperatures are basically the same as in the
open ocean. Sea surface temperature seems to have
relatively little direct effect on eNPP when solar
radiation and nutrients are adequate (Trujillo and
Thurman 2005:385–401).
4 www.fishbase.org5 www.seaaroundus.org
MICHAEL A. HUSTON AND STEVE WOLVERTON376 Ecological MonographsVol. 81, No. 3
CONCEPTS&SYNTHESIS

Just as most of the world’s forests have been severely
impacted by human activities that complicate theinterpretation of global patterns of forest productivityand structure (Huston and Wolverton 2009), the long
history of marine exploitation has altered the structure
of marine ecosystems. While the eNPP rule predicts
that fisheries catches and fish body size (at both theintra- and interspecific levels) should be positivelycorrelated with primary and secondary productivity,
fisheries harvests can alter this relationship. It is now
FIG. 8. Latitudinal and other patterns of data on fisheries catch, fish length, and fish species richness for 56 large marineecosystems (LMEs). Eight Arctic and Antarctic LMEs are excluded because of insufficient catch records. The thin line in panels Aand B is the global average ocean eNPP based on Behrenfeld et al. (2001: Fig. 3), as also shown in Fig. 4A. LME data are fromFishBase and The Sea Around Us Project (see footnotes 4 and 5). See Fig. 9 and Supplement 3 for locations, names, and data forindividual LMEs. Maximum catch is for the period 1950–2006. See discussion in Abundance, biomass, size, and diversity in theoceans.
August 2011 377eNPP AND BODY SIZE
CONCEPTS&SYNTHESIS

well known that most fisheries rapidly eliminate the
largest individuals, regardless of species, and also tend
to greatly reduce the populations at the highest trophic
levels, which are typically large species. This phenom-
enon, called ‘‘fishing down the food web’’ (Pauly et al.
1998, 2002) is consistent with the expected greater
sensitivity of higher trophic levels to mortality because
of the trophic inefficiency of energy transfer (Huston
1994: Fig. 5.13). As a consequence of these processes,
the currently observed body sizes and catch levels in
any region may not reflect the potential body sizes and
population biomasses that could be supported by local
eNPP in the absence of current or historical overfish-
ing. This will produce more scatter and lower values in
the data than would otherwise be expected.
The smaller catches in most tropical LMEs (Fig. 8A),
combined with the smaller sizes (based on species’
maximum lengths) in the tropical assemblages (Fig. 8B)
lead to the inescapable conclusion that fish body size is
positively correlated with total fish biomass and marine
eNPP, consistent with the eNPP rule, but contradicting
the energetic equivalence hypothesis and the MTE. The
causal connection between eNPP and body size is traced
in Fig. 8C and D. The pattern of maximum catch
(standardized for area as Mg/km2 of the variably sized
LMEs) in relation to eNPP in Fig. 8C is a classical
‘‘triangular distribution’’ that is often observed when
factors in addition to the independent variable (i.e.,
eNPP) affect the dependent variable (i.e., fisheries catch;
Cade et al. 1999, Cade and Guo 2000, Huston 2002,
Cade and Noon 2003). This suggests a strong positive
and probably linear effect of eNPP on fish biomass,
which is reduced below the ‘‘pure’’ eNPP effect
(indicated by the diagonal line, which represents the
upper limit, e.g., 95th quantile of the distribution) as a
result of other, unquantified variables such as overfish-
ing. A similar pattern appears in the relationship
between mean catch and mean fish body length (Fig.
8D), with reduced lengths below the diagonal of the
linear relationship caused, at least in part, by overfish-
ing.
While eNPP is predicted to have direct positive effects
on body size and/or population density, and total
population and community biomass, as seen in both
direct analyses (Fig. 8C, D) and the indirect relation-
ships with latitude (Fig. 8A, B), eNPP is also hypoth-
esized to have effects on species richness. The metabolic
theory of ecology and the ‘‘more individuals’’ hypoth-
esis, as well as most other prominent diversity hypoth-
eses (e.g., Dobzhansky 1950, Fischer 1960, Federov
1966, Connell and Orias 1964, Pianka 1966, Palmer
1994, Moritz et al. 2000, Willig et al. 2003, Currie et al.
2004, Evans and Gaston 2005, Evans et al. 2005,
Mittelbach et al. 2007) predict that diversity will be
highest where productivity is highest, as a result of both
ecological and evolutionary processes. In contrast, the
dynamic equilibrium hypothesis (Huston 1979, 1994)
predicts that diversity will be highest where productivity
is low, as a result of reduced individual and population
sizes and reduced intensity of competition. In addition
to these hypothesized effects of eNPP on ecological
processes such as competition (Huston 1979, 1980, 1985,
1994, 1999b, Huston and DeAngelis 1994) that decrease
diversity under high-productivity conditions, the ‘‘pro-
ductivity regulation of gene flow’’ (PRGF) hypothesis
predicts that reduced gene flow and increased genetic
isolation will lead to the highest rates of speciation
where productivity is low (Huston 1994:309–312; M. A.
Huston, unpublished manuscript).
The pattern of marine fish species richness among the
LMEs clearly shows that species richness is highest in
the tropics, where eNPP, fisheries catch, and fish size are
lowest (Fig. 8E, F), contradicting the metabolic theory
of ecology, and most other theories of species diversity.
Fig. 8E is based on species lists for the LMEs, which
differ in area by more than an order of magnitude.
Because sample size, or the total number of individuals,
is often correlated with species richness in samples, LME
species richness has been ‘‘standardized’’ by dividing
total richness by the log10 of the mass of fish harvested
from each LME (as the maximum catch from 1950–
2006; Fig. 8F). The patterns of both standardized and
unstandardized species richness with latitude are similar,
but not identical (Fig. 8E, F). Independent of latitude,
there are strong negative correlations between these
measures of species richness and two independent
indicators of secondary productivity, maximum fisheries
catch per km2 (Fig. 8G) and mean fish length (Fig. 8H).
Examination of the negative correlation between fish
species richness and log10 maximum catch demonstrates
that the actual pattern is unimodal, with a rapid increase
in species richness with increasing catch to a maximum
at very low catch levels, followed by a linear decline with
increasing catch. This is similar to the pattern observed
in many plant communities, as well as theoretical
models, in which there is a steep increase to maximum
diversity at very low levels of productivity, or indicators
of productivity such as soil nutrients (Huston 1979,
1980, Huston and DeAngelis 1994).
While there is some scatter in the data, it is clear that
these negative correlations of species richness with
indicators of population size and productivity contradict
the predictions of ‘‘energy–diversity’’ hypotheses such as
the metabolic theory of ecology (MTE) and the ‘‘more
individuals’’ hypothesis, as well as virtually all other
diversity hypotheses (see review in Palmer 1994), but are
consistent with hypotheses that predict highest species
richness at low productivity, caused by the effects of
nutrient limitation and other factors on both ecological
and evolutionary processes (Huston 1979, 1994; M. A.
Huston, unpublished manuscript). The negative correla-
tion between fish length and fish species richness is
analogous to the negative correlation of bird body mass
with bird species richness in the neotropics (Blackburn
and Gaston 1996), as well as the negative correlation
between ant body size and ant species diversity across
MICHAEL A. HUSTON AND STEVE WOLVERTON378 Ecological MonographsVol. 81, No. 3
CONCEPTS&SYNTHESIS

latitude in the New World (Kaspari et al. 2000, Kaspari
2005). Species diversity is highest where body sizes are
small, and body sizes are small where eNPP is low.
The latitudinal asymmetry of marine eNPP, fish catch,
fish length, and fish species richness (Fig. 8A, B, E, F)
provides potentially useful information about the
underlying causes of these patterns. There are no
significant differences in sea surface temperatures
between the northern and southern hemispheres (Belkin
2009, Fisher et al. 2010: Fig. 11), so temperature cannot
explain the asymmetry in eNPP, fish size, fisheries catch,
and species richness. However, there is great asymmetry
in the amount of land. The northern hemisphere has
twice as much land area as the southern hemisphere,
with land to water ratios of 0.65 and 0.24, respectively.
Because most of the nutrients in the oceans are derived
FIG. 9. Map of SeaWIFs 1997–2007 mean annual chlorophyll values for ocean waters, with FAO (2008) harmonized soil mapof the world data for total exchangeable bases (TEB, meq/g) in soils, showing outlines of the 64 LMEs, which include 80–90% ofthe global fisheries catch and are primarily coastal (LME names and data listed in Supplement 3).
August 2011 379eNPP AND BODY SIZE
CONCEPTS&SYNTHESIS

FIG. 10. Latitudinal and other patterns of marine eNPP, fisheries catch, fish length, and fish species richness for 56 LMEsseparated into three groups: the Atlantic Ocean (solid circles, solid lines), Pacific Ocean (open squares, dashed lines), and the IndianOcean (solid triangles, dotted lines). Data in panel A are latitudinally averaged eNPP based on seasonal (austral and borealsummer) three-month daily average values from eight years (July 2002–June 2010) of MODIS images converted to NPP using theVGPM algorithm, provided by the Ocean Productivity Project, Oregon State University (R. O’Malley, personal communication).LME data from FishBase and The Sea Around Us Project (see footnotes 4 and 5). See Fig. 9 and Supplement 3 for locations,names, and data for individual LMEs. Maximum catch is for the period 1950–2006; mean catch is for the period 2000–2004. Seediscussion in Abundance, biomass, size, and diversity in the oceans.
MICHAEL A. HUSTON AND STEVE WOLVERTON380 Ecological MonographsVol. 81, No. 3
CONCEPTS&SYNTHESIS

from sediments and dissolved solids that have been
eroded from the land and transported to the ocean byrivers, this suggests that southern hemisphere oceans
should have an average nutrient concentration roughly37% that of the northern hemisphere oceans. Such a
nutrient differential could be a major driver of the
observed differences in ocean eNPP, fisheries catches,and fish length, as well as of fish species richness,
between the northern and southern hemispheres.In the context of the patterns of primary and
secondary marine productivity discussed above, marinefish diversity in the LMEs is highest in the tropics and
the southern hemisphere where productivity is lower,and declines toward higher latitudes, particularly in the
northern hemisphere, where marine (as well as terrestri-al) eNPP is highest (Figs. 4A, 8E, F).
Fisher et al. (2010: Fig. 3A) also noted a stronglongitudinal gradient of fish length, in addition to the
latitudinal pattern, and observed that there was a strongnegative correlation between fish length and species
richness in the northeast Atlantic, but no relationship inthe northwest Pacific (Fisher et al. 2010: Fig. 7).
Latitude and longitude are crude and indirect correlatesof many different environmental properties, and a more
detailed examination of the geographical patterns of fish
biomass, size, and diversity provides further insights intothe regulation of marine primary and secondary
productivity, as well as of fish diversity.Inspection of the spatial patterns of marine chloro-
phyll and eNPP suggests a simple, but fundamental,explanation for both the latitudinal and longitudinal
variation in eNPP, fish body size, and fisheries catch, aswell as fish diversity across the Earth’s oceans. It is
evident that the largest areas of high chlorophyllconcentrations and high eNPP are found in the north
Atlantic, and to a lesser extent in the south Atlantic,with smaller areas in the Pacific and Indian oceans (Figs.
9, 10A, B). Fish body sizes (interspecific mean ofmaximum lengths, Fig. 10E), as well as mean and
maximum catch (Mg/km2) also tend to be higher in theAtlantic than in the Indian and Pacific Oceans (Fig.
10C, D). Maximum species richness is shifted toward thesouthern hemisphere in both the Pacific and Indian
Oceans, but not the Atlantic (Fig. 10F).One conspicuous physical difference between the
Atlantic and the Indo-Pacific oceans is that the relatively
young Atlantic has less than half the surface area of theIndian and Pacific Oceans combined (Table 6). More
significant than the difference in surface area are the
differences in the land areas contributing runoff to these
oceans. The smaller Atlantic receives runoff from 47% ofthe Earth’s total land area, while the drainage areas for
the Pacific and Indian Oceans are each only 13% of thetotal land area. The differences based on ocean volume
in relation to runoff volume are even greater (Table 6).
The average nutrient concentrations in the AtlanticOcean, based on the ratio of runoff volume to ocean
volume, are potentially 6.8 times higher than in thePacific and 3 times higher than in the Indian Ocean.
The physical geography of the Earth’s oceans, both interms of latitudinal gradients and differences between
the major oceans, apparently creates a pattern ofnutrient loading that is consistent with the observed
patterns of ocean eNPP (Figs. 9, 10A, B), fisheriescatches (Fig. 10C, D), and average fish length (Fig.
10E). Some of the scatter in the data for ocean eNPPwithin the large marine ecosystems (Fig. 10B) is likely
due to the fact that many of the LMEs are centered onthe outflows of the Earth’s largest rivers, which create
local nutrient enrichment on the continental shelves neartheir mouths (see Fig. 9), creating variability that is
independent of latitude and differs from the averageeNPP across the entire ocean (Fig. 10A). Multiple major
rivers empty into all three of the large oceans. The
Atlantic receives the outflow of four out of the world’ssix largest rivers (based on flow volume), the Amazon,
Congo, Orinoco, and Parana/La Plata, all of which flowinto the open ocean and create small hotspots of high
eNPP (Fig. 9). Of the other two rivers in the top six, theGanges carries nutrients eroded from the Himalayas and
flows into the Indian Ocean, creating extremely higheNPP in the Bay of Bengal (Fig. 10A, B), while the
Yangtze drains the eastern side of the Tibetan andYunnan Plateaus and flows into the Pacific, supporting
the high eNPP and extremely high fisheries catches in thelarge continental shelf embayments of the East China
Sea, and, supplemented by the Yellow River, the YellowSea (Fig. 10B, C, D). The nutrient-poor central gyres of
the northern and southern Pacific are much larger thanthe central gyres of the Atlantic (Fig. 9).
The primary driver of ocean NPP and eNPP is theconcentration of nutrients derived from terrestrial
runoff. However, as on land, the temporal variation in
production that defines eNPP is driven by the season-ality of solar radiation and, to a lesser degree than on
land, temperature. The apparent shift of the peak ofmaximum marine eNPP to higher latitudes than the
maximum terrestrial eNPP (Fig. 4A) may be due to the
TABLE 6. Properties of the three major oceans related to input of nutrients from terrestrial runoff.
OceanSurface area
(km2)Watershed area
(km2)Percentage ofglobal land OA :WA
Ocean volume(km3)
Runoff volume(km3)
Percentage ofglobal runoff OV :RV
Atlantic 106 400 000 70 001 800 47 1.52 354 700 000 19 270 47 18 407Pacific 155 557 000 19 362 200 13 8.03 671 077 274 5330 13 125 906Indian 73 556 000 19 362 200 13 3.80 292 131 000 5330 13 54 809
Note: Values are based on information in Gotthold and Gotthold (1988), Gleick (2000), and Pidwirny (2006).
August 2011 381eNPP AND BODY SIZE
CONCEPTS&SYNTHESIS

much higher heat capacity of water, but nonetheless
demonstrates the need for a major new research
program on terrestrial eNPP to confirm or reject the
difference between these two fundamental global pat-
terns.
The response of productivity across multiple trophic
levels, from algal eNPP to the production of the
secondary, tertiary, and higher trophic levels of the fish
assemblage, forms a consistent set of patterns (Fig. 10A–
D) that are all related to fish body size (Fig. 10E), most
strongly at the higher trophic levels reflected by fisheries
catch and mean body size (compare Fig. 10C and D to
Fig. 10E). These connections closely match the predic-
tions of the eNPP rule for both body size and total
biomass, and demonstrate that the gradients of primary
and secondary productivity, animal body size, total
animal biomass, and species richness are essentially the
same in the oceans as on land. This is contrary to the
widely accepted belief that the productivity gradient on
land is the opposite of the marine gradient, which would
imply that the effects of productivity on both body size
and species diversity are completely reversed between
the two major environments on Earth (see discussion in
Huston and Wolverton 2009).
Nonetheless, the fact that the latitudinal pattern of
productivity in the LMEs is relatively weak for eNPP
(Figs. 8A and 10B) and does not match the global mean
patterns of marine eNPP (Figs. 8A and 10A), while the
match to the global mean eNPP is much greater for fish
size and catch (compare Fig. 8A to 8B and C) raises
some questions. There are many potential anomalies and
technical problems in both the marine eNPP estimates
and the marine catch data from the LMEs, which are
affected in unquantified ways by both fisheries effort and
the effects of past harvest and overharvests. Also, the
values of eNPP within the LMEs may not represent the
actual eNPP that influences the fish captured in the
LMEs, since the LMEs cover only 25% of the total
ocean area, are primarily coastal, and have higher
nutrient inputs and higher eNPP than most of the ocean
area. While the globally averaged latitudinal gradients
of growing season marine eNPP are quite strong,
particularly in the northern hemisphere (Figs. 8A,
10A; Behrenfeld et al. 2001), it seems likely that there
may be other physical and biological factors in addition
to NPP involved in determining the strong patterns of
secondary production and fish body size.
Fish are poikilotherms, and their body temperatures
closely match the temperature of the water in which they
live. The MTE (Allen et al. 2002, Brown et al. 2004)
predicts that higher temperatures and smaller body sizes
lead to higher metabolic rates, shorter generation times,
and that ‘‘the natural logarithm of mass-corrected
population density should be a linear function of 1000/
Tenv [where Tenv is the temperature of the environment
in degrees Kelvin]’’ (Allen et al. 2002:1546; Gillooly et al.
2001, Charnov and Gillooly 2004). This is consistent
with the long-recognized negative relationship between
body size and metabolic rate (Hemmingsen 1960), but
not necessarily with the generalization from physiolog-
ical research that the enzyme systems of species
acclimate to temperature, resulting in little difference
in base metabolic rates between species found across a
broad range of temperatures (Prosser 1973: Fig. 5-14).
Consistent with the MTE, experimental results show
that fish acquire food more rapidly, digest it more
efficiently, and grow faster at higher temperatures than
at lower temperatures (e.g., Windell et al. 1978, Brett
1979, Boehlert and Yoklavich 1983, Cuenco et al. 1985,
Buckel et al. 1995).
However, the observed patterns of fish growth, size,
and total biomass in the oceans are the opposite of these
theories and experiments. The marine data suggest that
fish size and total biomass are highest where the water is
cold, but not the coldest, since fish catch (Figs. 8A and
10C, D) and fish body size (Figs. 8B and 10E) decline
between 608 and 808 N, just as terrestrial eNPP (Figs. 1
and 4A) and caribou and wolf body size (Fig. 4J, H)
decline above 608 N. Among the LMEs, the negative
correlation of sea surface temperature with both fish
length and fisheries catch is stronger than the positive
correlations of length and catch with eNPP (maximum
monthly NPP, Table 7). Inclusion of maximum monthly
eNPP only slightly improved the R2 for regression on
body size from 0.30 for SST alone to 0.34 with both
variables. The explanatory power of eNPP and SST for
fisheries catch was substantially lower than for body size
(Table 7). The differences between the regressions for
the 2000–2004 mean catch vs. the 1950–2008 maximum
catch may in part be due to the effects of overfishing,
which substantially reduced the catch in some LMEs
toward the end of the record (Sherman et al. 2009a, b),
when the 2000–2004 means were calculated.
The surprising result that fish size and biomass are
highest at low rather than high temperatures (and more
strongly correlated with temperature than with estimat-
ed NPP) may in part be explained by an ontogenetic
shift in optimum temperature as fish increase in size.
Numerous studies report a strong shift in the temper-
ature for optimal growth as fish increase in size, with the
optimal temperature declining as fish become larger
(Boehlert and Yoklavich 1983, Fonds et al. 1992,
Imsland et al. 1996, 2005). Most of these studies looked
at fish over a relatively small size range, but if the
optimal temperature continues to decrease with increas-
ing size, this may help explain the dramatic positive
latitudinal and negative temperature correlations with
fish body size. Boehlert and Yoklavich (1983) observed
that ‘‘Under starvation conditions, mass loss increased
with increasing temperature.’’ This is consistent with
data analysis indicating that natural fish mortality
increases with temperature and decreases with increasing
body size (Pauly 1980, Charnov and Gillooly 2004), and
provides a potentially important explanation for why
fish in unproductive tropical waters remain relatively
small and fish of all sizes, particularly large fish, can
MICHAEL A. HUSTON AND STEVE WOLVERTON382 Ecological MonographsVol. 81, No. 3
CONCEPTS&SYNTHESIS
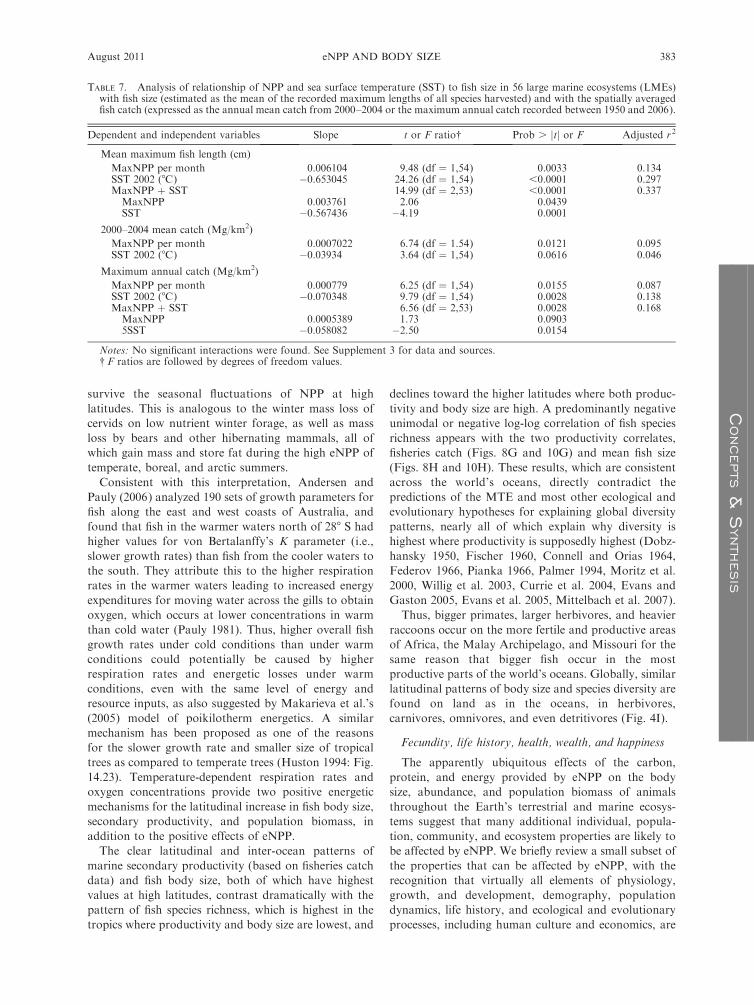
survive the seasonal fluctuations of NPP at high
latitudes. This is analogous to the winter mass loss of
cervids on low nutrient winter forage, as well as mass
loss by bears and other hibernating mammals, all of
which gain mass and store fat during the high eNPP of
temperate, boreal, and arctic summers.
Consistent with this interpretation, Andersen and
Pauly (2006) analyzed 190 sets of growth parameters for
fish along the east and west coasts of Australia, and
found that fish in the warmer waters north of 288 S had
higher values for von Bertalanffy’s K parameter (i.e.,
slower growth rates) than fish from the cooler waters to
the south. They attribute this to the higher respiration
rates in the warmer waters leading to increased energy
expenditures for moving water across the gills to obtain
oxygen, which occurs at lower concentrations in warm
than cold water (Pauly 1981). Thus, higher overall fish
growth rates under cold conditions than under warm
conditions could potentially be caused by higher
respiration rates and energetic losses under warm
conditions, even with the same level of energy and
resource inputs, as also suggested by Makarieva et al.’s
(2005) model of poikilotherm energetics. A similar
mechanism has been proposed as one of the reasons
for the slower growth rate and smaller size of tropical
trees as compared to temperate trees (Huston 1994: Fig.
14.23). Temperature-dependent respiration rates and
oxygen concentrations provide two positive energetic
mechanisms for the latitudinal increase in fish body size,
secondary productivity, and population biomass, in
addition to the positive effects of eNPP.
The clear latitudinal and inter-ocean patterns of
marine secondary productivity (based on fisheries catch
data) and fish body size, both of which have highest
values at high latitudes, contrast dramatically with the
pattern of fish species richness, which is highest in the
tropics where productivity and body size are lowest, and
declines toward the higher latitudes where both produc-
tivity and body size are high. A predominantly negative
unimodal or negative log-log correlation of fish species
richness appears with the two productivity correlates,
fisheries catch (Figs. 8G and 10G) and mean fish size
(Figs. 8H and 10H). These results, which are consistent
across the world’s oceans, directly contradict the
predictions of the MTE and most other ecological and
evolutionary hypotheses for explaining global diversity
patterns, nearly all of which explain why diversity is
highest where productivity is supposedly highest (Dobz-
hansky 1950, Fischer 1960, Connell and Orias 1964,
Federov 1966, Pianka 1966, Palmer 1994, Moritz et al.
2000, Willig et al. 2003, Currie et al. 2004, Evans and
Gaston 2005, Evans et al. 2005, Mittelbach et al. 2007).
Thus, bigger primates, larger herbivores, and heavier
raccoons occur on the more fertile and productive areas
of Africa, the Malay Archipelago, and Missouri for the
same reason that bigger fish occur in the most
productive parts of the world’s oceans. Globally, similar
latitudinal patterns of body size and species diversity are
found on land as in the oceans, in herbivores,
carnivores, omnivores, and even detritivores (Fig. 4I).
Fecundity, life history, health, wealth, and happiness
The apparently ubiquitous effects of the carbon,
protein, and energy provided by eNPP on the body
size, abundance, and population biomass of animals
throughout the Earth’s terrestrial and marine ecosys-
tems suggest that many additional individual, popula-
tion, community, and ecosystem properties are likely to
be affected by eNPP. We briefly review a small subset of
the properties that can be affected by eNPP, with the
recognition that virtually all elements of physiology,
growth, and development, demography, population
dynamics, life history, and ecological and evolutionary
processes, including human culture and economics, are
TABLE 7. Analysis of relationship of NPP and sea surface temperature (SST) to fish size in 56 large marine ecosystems (LMEs)with fish size (estimated as the mean of the recorded maximum lengths of all species harvested) and with the spatially averagedfish catch (expressed as the annual mean catch from 2000–2004 or the maximum annual catch recorded between 1950 and 2006).
Dependent and independent variables Slope t or F ratio� Prob . jtj or F Adjusted r2
Mean maximum fish length (cm)
MaxNPP per month 0.006104 9.48 (df ¼ 1,54) 0.0033 0.134SST 2002 (8C) �0.653045 24.26 (df ¼ 1,54) ,0.0001 0.297MaxNPP þ SST 14.99 (df ¼ 2,53) ,0.0001 0.337MaxNPP 0.003761 2.06 0.0439SST �0.567436 �4.19 0.0001
2000–2004 mean catch (Mg/km2)
MaxNPP per month 0.0007022 6.74 (df ¼ 1.54) 0.0121 0.095SST 2002 (8C) �0.03934 3.64 (df ¼ 1,54) 0.0616 0.046
Maximum annual catch (Mg/km2)
MaxNPP per month 0.000779 6.25 (df ¼ 1,54) 0.0155 0.087SST 2002 (8C) �0.070348 9.79 (df ¼ 1,54) 0.0028 0.138MaxNPP þ SST 6.56 (df ¼ 2,53) 0.0028 0.168MaxNPP 0.0005389 1.73 0.09035SST �0.058082 �2.50 0.0154
Notes: No significant interactions were found. See Supplement 3 for data and sources.� F ratios are followed by degrees of freedom values.
August 2011 383eNPP AND BODY SIZE
CONCEPTS&SYNTHESIS

influenced by the availability of energy and resources
when organisms are reproducing and growing, as
summarized in Fig. 11. We intentionally follow the
implications of these relationships to what some might
consider extreme conclusions in order to stimulate
discussion about the full implications of the ideas we
have proposed.
It is obvious that, in live-bearing organisms, larger
females can produce either larger single offspring, or a
greater number of offspring of a given size than can
females that are smaller. This inevitable allometry has
important implications for ecology and evolution. In
most situations, larger offspring have a higher proba-
bility of surviving to reproductive size than do smaller
offspring. However, in some situations with extremely
high mortality and/or extreme scarcity of suitable
habitats, producing larger numbers of smaller offspring
is the best strategy for assuring continuation of the
species or genotype.
This simple dichotomy underlies what is perhaps the
most powerful and robust generalization in ecology and
evolution, the ‘‘inverse r–K continuum.’’ Named for the
two fundamental parameters of the logistic growth
equation, as well as the Lotka-Volterra competition
equations, the inverse r–K concept summarizes a wide
range of unavoidable energetic and physiological
constraints that limit the adaptations and performance
of all organisms, plants and animals, and cause these
two properties (size vs. number of offspring), among
many others, to be inversely related across most
FIG. 11. Examples of predictions of the eNPP rule across a range of organizational levels in animal and human ecology. Thetwo ovals with arrows indicate the positive feedback between female size and offspring size that can produce rapid epigeneticchanges leading to body size and reproductive differences that can persist across generations. Similar predictions apply to plants,which are not addressed in this review.
MICHAEL A. HUSTON AND STEVE WOLVERTON384 Ecological MonographsVol. 81, No. 3
CONCEPTS&SYNTHESIS

organisms. The parameter r is the per capita maximum
rate of population increase (or intrinsic growth rate),
which in its simplest formulation represents the sum of
the maximum potential birth rates minus that compo-
nent of death rates that is independent of population
density, but it can be generalized to include all traits that
contribute to a higher growth rate, such as high
fecundity, small offspring size, rapid sexual maturation,
etc. The parameter K represents the maximum number
of individuals (or total biomass of individuals) that can
be supported in a specific environment, but can be
generalized to include all traits related to large size in
individuals or populations, such as fewer, larger
offspring, greater longevity, strength, and disease
resistance, the ability to take up or capture resources
efficiently, greater competitive ability, etc.
These constraints are summarized by the simple
observation that with a given amount of tissue, a female
organism can either produce a few large offspring or
many smaller offspring, but it is physically impossible to
produce many large offspring, which would generally be
the ideal reproductive strategy. Thus, all organisms are
faced by constraints that force compromises or tradeoffs
over the course of evolution that limit them to
developing adaptations that are well suited for a specific
set of environmental conditions, but that are completely
unsuited to many other sets of environmental conditions
(Southwood 1977, 1988).
Instantaneous resource availability, or eNPP, inter-
acts directly with natural selection as it operates within
the constraints of the r–K continuum. With higher
eNPP, organisms can potentially produce larger off-
spring or more, smaller offspring, while with low eNPP,
offspring are inevitably smaller and/or fewer. Biologists
have noted the incidental adaptation that results from
this situation when low productivity represents a chronic
condition. If food availability is chronically low, then
small individuals will have an advantage over larger
individuals because they require less food, and thus are
more likely to avoid starvation and survive (Blancken-
horn 1998, Bateson 2001, Bateson et al. 2004, Kuzawa
2007, Wells 2010). Over multiple generations, the effect
of maternal size on offspring size produces a positive
feedback cycle (e.g., DeAngelis et al. 1986) in which
epigenetic mechanisms (including ontogenetic growth
and female–offspring allometry) produce an adaptive
change in body size in response to environmental
conditions (eNPP). Over time, natural selection may
reinforce these epigenetic changes and create genetic
constraints on body size. Nonetheless, the effects of
eNPP on body size through epigenetic effects seems to
be extremely powerful and to represent one of the most
important examples of adaptive morphological plasticity
that operates, at least initially, outside the realm of
genetics and natural selection. This effect could signif-
icantly alter our understanding of many aspects of life
history theory, such as allocation of maternal effort to
male vs. female offspring (Trivers and Willard 1973,
Charnov 1982). The epigenetic effects of body-size
allometry may go far beyond the female ‘‘quality’’
argument developed by Leimar (1996).
In addition to the smaller size and potentially smaller
number of offspring produced by small females and/or
females under conditions of low eNPP (e.g., Williams
and Caskey 1965, Jacobson et al. 1977), there are many
physiological and health-related responses associated
with reduced food availability and small size. These are
extensively documented in the large literature on human
health, as well as in experimental animal studies (e.g.,
Wurm 1982). Reproductive function in both males
(Albrecht 1943, 1944, Cicognani et al. 2002) and females
(Smith and Albrecht 1941, Cheatum and Severinghaus
1950, Albrecht 1952, Ibanez et al. 2000, 2002, 2003) is
reduced in individuals that are ‘‘small for gestational
age,’’ which may be caused by the small size of the
mother or inadequate nutrition during pregnancy
(Kuzawa 2007). A study of 307 223 children born to
194 835 women in 42 developing countries found a
negative correlation between maternal height and child
mortality (Monden and Smits 2009). In general,
reproductive success in humans is correlated with body
size, particularly in underdeveloped rural settings
(Lasker and Thomas 1976, Mueller 1979, Kirchengast
2000, Prasad and Al-Taher 2002, Pollet and Nettle
2008).
The size of living humans, as well as the skeletons of
deceased humans, have long been recognized as indica-
tors of the health and history of an individual (Wells
1964, Tanner 1986, Frisancho 2007) and leg length
seems to be the most sensitive and diagnostic element of
growth response (Wadsworth et al. 2002, Bogin and
Rios 2003). While small size caused by food shortage
during some phase of development is often seen as a
negative or detrimental response, small size may actually
increase survival if the food shortage is chronic or
worsens (Lasker 1969, Kuzawa 2007, Schell and
Magnus 2007). However, both acute and chronic food
shortage during development may have health effects
beyond mortality and growth retardation. Exposure to
famine during early gestation can have a number of
long-term negative consequences, including glucose
intolerance, obesity, and coronary heart disease (CHD;
Barker 1990, Barker 1998, Godfrey and Barker 2000,
Roseboom et al. 2006). Reduced height, due to various
combinations of food shortage and other stresses during
post-natal development, is associated with a variety of
negative health consequences, particularly CHD, al-
though there is also a suite of diseases that are more
common in taller people (Batty et al. 2009).
Physiological stress, due to inadequate nutrition or
other problems during childhood, reduces the deposition
of enamel on teeth, producing a characteristic thinning
called linear enamel hypoplasia (LEH). This dental
record of severe stress reveals both temporal patterns
and spatial variation in the nutrition and health of
Ancestral Puebloan populations during an 800-year
August 2011 385eNPP AND BODY SIZE
CONCEPTS&SYNTHESIS

period on the Colorado Plateau (Malville 1997) and
intergenerational differences in body size and LEH in
current populations (Floyd 2007).
Small body size and nutrition-related health deficien-
cies also exhibit strong spatial patterns due to chronic
low quantity and/or quality of available food, which are
often related to soil fertility and eNPP (Smith and
Albrecht 1941, Albrecht 1942, 1943, 1947a, b, 1955).
This can be seen in the distribution of body size and
bone strength of cottontail rabbits in relation to
variation in soil fertility across the state of Missouri
(Table 8), and perhaps also in the negative relationship
between soil fertility and the percentage of draftees
rejected by the Army across Missouri (Albrecht 1957;
Fig. 5C). Nutrient deficiencies, and increased rates of
disease and mortality are found on nutrient-poor soils in
the Amazon basin (Gurven et al. 2007, Castro et al.
2009), as well as across much of New Guinea (Smith et
al. 1993) and presumably other regions with nutrient
deficient soils that affect eNPP and thus the quantity
and quality of food (Sheets 1946, Trowell 1949, Albrecht
1957, Meggers 1971). A rapidly developing literature on
the epigenetic effects of parental nutrition and health on
the growth, health, and reproductive potential of
children and even grandchildren (Pembrey et al. 2006,
Heijmans et al. 2008, Whitelaw and Whitelaw 2008,
Carone et al. 2010), emphasizes how quickly food
quality and quantity, as well as other environmental
conditions, can alter the body size and physiology of
human populations, a mechanism that presumably
operates in other animals as well.
Soil nutrients and water availability vary across a
huge range of spatial scales, from a few meters or less to
the entire globe. Consequently, eNPP and the food
available to animals and people also varies across this
range of scales, with the ability of organisms to integrate
over spatial variation in eNPP depending primarily on
their size, and for humans, on the availability of
transportation and storage technology and the energy
to use it. The global patterns of agricultural productivity
and also of average per capita income ([gross domestic
product, GDP]/population) have a strong positive
correlation with soil nutrient content, following the
general latitudinal gradient of soil fertility and eNPP
increasing from lowest values in the tropics to the
highest values in the north temperate and boreal regions
(Huston 1993, 1994, Huston and Wolverton 2009). This
implies that the global distribution of poverty is
negatively correlated with soil fertility and eNPP.
It is probably not a coincidence that per capita income
remains uniformly low within the tropics (23.58 S to
23.58 N, Huston 1993, 1994), the same range over which
the eNPP rule predicts no change in eNPP and body
size, and over which there is little change in the body size
of jaguars, pumas, and humans (Fig. 4B, C, D, F), and
little change in average body size of marine fish (Figs.
4G, 8B, 10E) and marine fisheries catch (Figs. 8A,
10C, D). These strong geographical patterns of soil
fertility, terrestrial and marine eNPP, and wealth are
almost certainly the mechanistic explanation for the
correlated patterns of body size (of humans and other
animals), as well as health, longevity, educational
attainment, and other physical and social attributes
associated with access to food and the resources to buy
food and other essentials for health. Currently, over
much of the world, particularly the developed countries
and large urban areas in all counties, survival depends
not on direct agricultural activity, but on having
sufficient money to buy food and other necessities.
Consequently, even in regions with fertile soils and
productive agriculture, the ability of individuals to
access the food and other resources they require is often
based on their social and economic status (Anderson
2010). Innumerable studies have documented that
height, mass, infant mortality, longevity, and many
other aspects of health and well-being are directly
correlated with socioeconomic status, with the poor
and lower-class populations suffering disproportionately
from all of the health and social problems associated
with inadequate nutrition (Himes and Mueller 1977,
Malina et al. 1983, Hamilton et al. 1984, Jones et al.
1985, Dufour et al. 1994, Gaur and Singh 1994, Steckel
1995, Cavelaars et al. 2000, Floud 2003, Khan and
Ahmed 2005, Crooks et al. 2007, Moffat and Galloway
2007, Batty et al. 2009, Rao and Apte 2009). Chronic
stresses associated with low socioeconomic status, only
some of which may be directly related to food
availability, can lead to both physical responses, such
as reduced body size (Widdowson 1951) and psycho-
logical problems (Brunner 1997).
There is a long history of studies that have linked
mental development and the heritability of IQ to
TABLE 8. Relationship of soil fertility to physical properties of femur bones of 450 cottontails (Silvilagus floridanus) collected from38 soil regions in Missouri (based on Crawford [1950]).
Soil fertilityEstimated body
mass (kg)Average femurmass (gm)
Average femurlength (cm)
Average femurbone wall
thickness (mm)
Average femurbreaking strength
(pounds)
High 1.13 (1.00) 4.17 (1.00) 8.03 (1.00) 0.82 (1.00) 44.50 (1.00)Medium 1.09 (0.96) 3.84 (0.92) 7.87 (0.98) 0.74 (0.90) 36.70 (0.82)Low 1.03 (0.91) 3.40 (0.82) 7.32 (0.91) 0.68 (0.83) 27.30 (0.61)
Notes: Values in parentheses are proportions of maximum value. One pound¼ 0.45 kg. Soil fertility was determined by calcium,nitrogen, phosphorus, and potassium contents and crop yields. Body mass was estimated from Crawford (1950: Table 3).
MICHAEL A. HUSTON AND STEVE WOLVERTON386 Ecological MonographsVol. 81, No. 3
CONCEPTS&SYNTHESIS

environmental conditions related to socioeconomic
status (Wiseman 1966, Scarr-Salapatek 1971, Scarr
1981, Bronfenbrenner and Ceci 1994, Turkheimer et al.
2003, Tucker-Drob et al. 2011). While most of this
research focuses on the components of the environment
related to mental stimulation, it is likely that other
aspects, such as nutrition and infectious diseases, also
influence differences between socioeconomic levels. A
key result of this work has been the demonstration of an
environment 3 phenotype interaction in which genetic
differences in IQ are expressed strongly in favorable
environments and weakly in unfavorable environments
(Bronfenbrenner and Ceci 1994, Turkheimer et al. 2003).
This type of interaction, assuming it applies to a broad
range of genetic traits in addition to intelligence, has
major implications for ecological and evolutionary
processes. If phenotypic expression of certain genetic
differences is weak under unfavorable conditions (e.g.,
stressed, nutrient deficient, etc.), then there is likely to be
reduced effectiveness of genotypes with superior perfor-
mance in a wide range of processes, such as competition
or survival. Consequently there would be weakened
selection for these genotypes under unfavorable condi-
tions, but strong selection for them under favorable
conditions. The implications of such environmental
effects on the strength of natural selection and the
dynamics of speciation have yet to be fully explored.
This brings us to the ill-defined emotion called
happiness, which does not play a role in either ecological
or evolutionary theory (although it does figure in
economics, and perhaps history and culture), but is
likely to be strongly related to short-term energy and
resource availability as quantified by eNPP. Individuals
suffering from malnutrition or chronic nutrition-related
disease are probably less likely to be ‘‘happy’’ and more
likely to be depressed, angry or irritable than healthy
individuals (e.g., Subramanian et al. 2005). On a shorter
term, hungry individuals are less likely to be relaxed and
more likely to be aggressive than well-fed individuals. To
the extent that various types of animals express these
emotions and behaviors, these generalizations should
apply to animals as well as people.
On the longer term, where population dynamics and
ecology transition into anthropology and economics,
human populations with abundant food (provided by
fertile soils and high eNPP and/or high wealth) may
spend less time procuring and processing food, and thus
have more time available for other activities (e.g.,
Hyams 1952, Meggers 1971, Sebastian 1991; but see
Lee 2003 for an interesting opposing argument about
hunter-gatherer dietary quality and leisure time). This
additional time may provide the opportunity for
specialization and perhaps artistic expression, eventually
leading to art that is not directly related to survival or
fitness, such as music, literature, visual arts, and theater,
which is a hallmark of civilization (Wenke 1980, Scarre
2009). It is not coincidental that all of the world’s early
civilizations developed in areas with fertile soils and
abundant water (Hyams 1952). We do not mean to
imply that ‘‘civilization’’ is a more advanced evolution-
ary adaptation, or even a more desirable human
condition than horticulture, pastoralism, or hunting
and gathering. However, in a global society that
increasingly relies on agriculture for its food, the
distribution of agricultural potential based on climate
and soil fertility likely explains many aspects of the
human condition, including the distribution of poverty,
which is certainly not a happy condition (Anderson
2010).
Human nutrition, height, health, longevity, and
fecundity are linked with a broad suite of socioeconomic
properties, including food and wages, that together
comprise the broad concepts ‘‘quality of life’’ and
‘‘standard of living’’ (Floud et al. 1990, Steckel 1995,
Komlos 1996, Steckel and Floud 1997, Leon and Walt
2000). All of these properties can be measured in
contemporary human societies, and many of them can
be tracked over the past 20 000 years or more of human
history through archaeology, based on skeletal size and
condition, the size, number, and quality of tools such as
pottery or glassware, as well as the sizes and number of
rooms and stories in houses. For example, the increase
in per capita resources leading up to the golden age of
Greece, is reflected in an increase in the median size of
houses from 51 m2 in 800–700 BC to 240 m2 in 400–300
BC (Morris 2005). Today, and presumably throughout
human history, it is in those regions, or groups of
people, where a consistent food supply, and adequate
energy and resources are available (including clean
water and the ability to sanitize sewage) that human
health is greatest, and people consider themselves most
‘‘happy’’ (Subramanian et al. 2005), although happiness
is certainly subjective and culturally relative (see
definitions in Brown 2008).
Not all of these contrasts will appear when comparing
hunter-gatherers to agriculturalists across the broad
continuum of human economics (Bates 2001); however,
modern societies must face the fact that the world is now
‘‘one big farm’’ (Anderson 2010:170). Given that
agriculture, and increasingly industrial agribusiness,
has become the norm in terms of human subsistence,
understanding the influence of the eNPP on agricultural
productivity and sustainability and its relationship to
poverty, health, and human happiness is increasingly
important. This will require the fusion of ecology, public
health medicine, anthropology, and economics.
The extension of the eNPP rule to the fields of health,
medicine, anthropology, and socioeconomics leads to
the prediction that across local, regional, and global
spatial scales, as well as temporal and socioeconomic
scales, attributes such as fecundity, health, cultural
development, educational attainment, wealth, and hap-
piness should be positively correlated with eNPP, either
directly, or indirectly through the various mechanisms
and media by which eNPP is redistributed.
August 2011 387eNPP AND BODY SIZE
CONCEPTS&SYNTHESIS

Our linkage of eNPP with human biology and culture
might be characterized by some as environmental
determinism. Even if our hypothesized mechanisms
prove to be incorrect, the existence of these strong
correlations between eNPP and humanity must be
recognized and understood. In addition to implications
for economics and human health, we believe this exercise
will be philosophically valuable in the context of
ecological, anthropological, and environmental ethics.
Rozzi (1999) states that humans cannot hope to change
environmental ethics at the global scale without more
direct linkages to the environment. Regardless of how
one goes about valuing the environment (Rolston 1988),
the patterns we describe clearly tie human biological and
social well-being to eNPP, whether or not those patterns
are deterministically linked.
DISCUSSION
Variation in animal body size has long been a focus of
anthropologists and biologists (e.g., Bergmann 1847,
Newman 1953, Roberts 1953, Peters 1983, Brown et al.
1993), yet discussion of the causes of body-size variation
has involved virtually no mention of spatial variation in
the source of energy and matter from which animal
bodies are made, the net primary production of plants
(see however, Rosenzweig 1968a, Geist 1978). Likewise,
although the factors that regulate plant growth have
been known by both subsistence and industrial agricul-
turalists for a long time, variation in factors such as soil
fertility have never been part of the ecological discussion
about animal body size. Never, that is, except for a brief
period in Missouri during the 1940s, when wildlife
biologists working together with soil scientists during
the first years of federally funded wildlife research
(under the Pitman-Robertson Act; Sousa 1982) used
patterns of soil fertility to interpret a state-wide wildlife
population structure and distribution survey involving
multiple wildlife species. The peer-reviewed papers from
this project were apparently so far ahead of their time or
so distant from the shining towers of academia that they
have been almost completely ignored. Wildlife relation-
ships to soil types (Denney 1944) has been cited three
times in 66 years, and Soil fertility and wildlife: cause and
effect (Albrecht 1944) has been cited four times in the
same 66 years. Some specific relationships between soils
and wildlife (Crawford 1950) has been cited eight times
in 60 years. Soil fertility and biotic geography (Albrecht
1957) has been cited twice in 53 years. So the idea that
soil fertility through plant productivity has a strong
influence on animal body size, and many other aspects
of plant, animal, and human ecology, may come as a
surprise to many ecologists today (cf. Jacobson 1984,
Strickland and Demarais 2000, Jones et al. 2008), but it
was common knowledge among the biologists and soil
scientists working with the Missouri Conservation
Commission 70 years ago.
It seems obvious that large body size has an energetic
cost, and energy is supplied by food. The effect of food
quality and quantity on animal growth, body size, and
health has been verified time and again experimentally
and at small spatial scales, particularly in animal
husbandry (Henry 1898, Smith 1905, Woll 1915, Henry
and Morrison 1923, Smith and Albrecht 1941, Albrecht
1943, May and Loosli 1962, National Research Council
1976, Ensminger and Olentine 1978). Why has this
mechanism been virtually ignored as a potential cause of
large-scale ecological patterns in animal body size in
spite of the fact that food is well known to affect
ontogenetic growth rates in mammals as demonstrated
both in feeding studies and at small spatial scales under
natural and experimental conditions? There are proba-
bly several reasons for this omission. First, the
distribution of body size in animals across geographic
space is usually discussed specifically in relation to
Bergmann’s rule (e.g., Peters 1983). Wherever Berg-
mann’s rule holds, there has been little incentive to
suggest that any other mechanism, such as the geo-
graphic distribution of food, affects body size, particu-
larly given the traditional belief that terrestrial net
primary production is highest in the tropics, where body
sizes are small.
Second, studies of Bergmann’s rule have encompassed
a broad range of taxonomic scales from intraspecific to
higher taxonomic levels and multi-taxon community
aggregates. There has been little or no consideration of
what taxonomic or geographical scales are most
appropriate for examining the effects of specific
mechanisms to explain variations in body size (sensu
McNab 2010), such as those often found in wildlife
biology studies (Kie et al. 1983, Reimers et al. 1983,
Toigo et al. 2006, Simard et al. 2008). We believe that
the effect of the spatial distribution of food on the
geographic distribution of body size has been ignored
precisely because, under the conventional interpretation
of the latitudinal pattern of NPP, food appears to have
nothing to do with any latitudinal patterns of body size.
Third, arguments tend to focus on whether or not
Bergmann’s rule applies to a species or a group of
species, and cause is inferred post hoc as an empirical
generalization (Meiri 2011). That is, there have been
fewer attempts to develop ecological theory that
independently explains the geographic distribution of
body size than there have been attempts to evaluate
whether Bergmann’s rule applies in a specific situation
by analyzing the correlations among variables related to
body size and variables related to latitude (see summary
by McNab 2010).
Fourth, the idea that variability in body size can result
from phenotypic plasticity within a species has received
much less attention than the evolution of genotypic
differences in body size (Wright and Lundelius 1963,
Brown et al. 1993, Cavallini 1995, see Bossdorf et al.
2008, Cooper and Purvis 2010). The possibility that
variability in body size within a species and/or between
related species may be due to epigenomic causes is only
MICHAEL A. HUSTON AND STEVE WOLVERTON388 Ecological MonographsVol. 81, No. 3
CONCEPTS&SYNTHESIS

beginning to receive attention in ecological and evolu-
tionary studies of animal body size (but see Geist 1978).
For example, Cooper and Purvis (2010) used a global
database of mammal body size in conjunction with a
recent ‘‘supertree’’ for mammalian phylogeny to evalu-
ate both body size and the rate of body-size evolution in
mammals in relation to environmental and ecological
variables across global ecoregions. Their ecoregion-scale
assessment of median body size reveals clear geograph-
ical patterns, including strong latitudinal gradients in the
New World, and clear longitudinal gradients in Aus-
tralia (Cooper and Purvis 2010: Fig. 2B), both of which
match the predictions of the eNPP rule. Their estimates
of the ‘‘relative rate of evolution’’ show latitudinal
patterns and eNPP-related patterns, particularly in the
New World (Cooper and Purvis 2010: Fig. 2A), and
have their strongest correlations (negative) with factors
that are negatively correlated with latitude (temperature
and number of species), thus following the general
predictions of both Bergmann’s rule and the eNPP rule.
However, their conclusions about the evolution of
body size in primates (discussed previously) illustrate the
potential pitfalls of ignoring the role of eNPP in such
studies. Cooper and Purvis’s analysis suggests ‘‘that
relatively early in their evolution the clades split into
significantly differently sized lineages (i.e., the large Old
World monkeys, the small New World species, and the
even smaller strepsirrhines, e.g., lemurs and galagos),
but that body size was conserved in these lineages’’
(Cooper and Purvis 2010:735). A purely phylogenetic
interpretation of these continental-scale differences in
the size of primates is challenged by the fact that soil
fertility, and consequently eNPP, is much lower within
the range of New World monkeys than in the ranges of
the much larger Old World monkeys and apes in Africa
and the Malay Archipelago, large parts of which have
active volcanoes and/or soils that are periodically
replenished by volcanic ash (e.g., Wallace 1869).
Geographical variation in eNPP potentially explains a
significant proportion of body-size variation in numer-
ous clades that has been previously attributed solely to
phylogenetic history.
An understanding of the global distribution of eNPP
helps explain the selective forces underlying two of the
most remarkable adaptations in animal behavior, long-
distance migration and hibernation. Both of these
behaviors can be seen as adaptations for maximizing
growth and reproduction by selecting regions with the
highest food availability during the period of reproduc-
tion and growth (i.e., eNPP), while avoiding the negative
consequences of the fact that most regions with very
high eNPP have a long period of the year in which short-
term NPP is very low or zero. The longest-distance
migrants are the seabirds and cetaceans that move
between the high eNPP of the north temperate summer
and the high eNPP of the south temperate summer,
avoiding the low productivity of both winters and
tropical waters.
There are clearly cost–benefit issues for both migra-
tion and hibernation. The costs in energy loss and
potential mortality during either long-distance migra-
tion or hibernation must be less than the benefit gained
by utilizing the highest eNPP available during the
growing season. Clearly, the benefits must be very high
to outweigh the great distances that many birds migrate,
or the long period of hibernation of some mammals. For
tropical-temperate migrants, the benefits of reproducing
in the temperate or boreal zone must substantially
outweigh the sum of the cost of migration plus the
benefit of reproducing in the tropics. While it is difficult
to attribute body size in migratory animals to a specific
environment, small body size in many tropical-temper-
ate migrants may actually be an adaptation for surviving
low eNPP on their winter range in the rainforest.
Based on our evaluation of global patterns of soil
fertility and forest productivity, the greatest productivity
contrast for long-distance migrants is that between the
neotropics and temperate North America, the contrast
between the African tropics and temperate Europe are
less, and the productivity contrast been the SE Asian
tropics and eastern Asia is the smallest of all. This would
lead to the prediction that fewer species would gain
significant benefit from tropical-temperate migration in
southeast Asia than in the New World, while Africa
would be intermediate. These predictions should be easy
to test.
IMPLICATIONS FOR FUTURE RESEARCH
The strong effect of mineral nutrients and eNPP on
the spatial and temporal variability in a wide range of
individual and population-level processes and proper-
ties, community and ecosystem dynamics, as well as on
the higher level phenomena of human culture and
socioeconomics, suggests that a new paradigm (sensu
Kuhn 1962), or ‘‘templet’’ (sensu Southwood 1977,
1988) is needed for virtually all of ecological and
evolutionary research and theory, extending into the
fields of economics, environmental justice, and anthro-
pology. This framework should be based on the
resources and processes that provide the energy and
nutrients upon which all life depends. Such a framework
could potentially form the underpinnings for much of
ecological and evolutionary theory, if it is able to
summarize the physical template over which all life, both
terrestrial and marine, is distributed, and thus where all
theory must be testable and tested.
This framework might also help reduce the over-
emphasis on equilibrium explanations for ecological and
evolutionary phenomena, as well as the over-emphasis
on phylogenetic history as the primary explanation for
all variation in organismal traits and adaptations (e.g.,
Gould and Lewontin 1979). Ecological and evolutionary
processes operate in a world with high temporal and
spatial variability. In general, we would expect temporal
variability to increase variance in the highly determin-
istic and often convergent adaptations of organisms to
August 2011 389eNPP AND BODY SIZE
CONCEPTS&SYNTHESIS
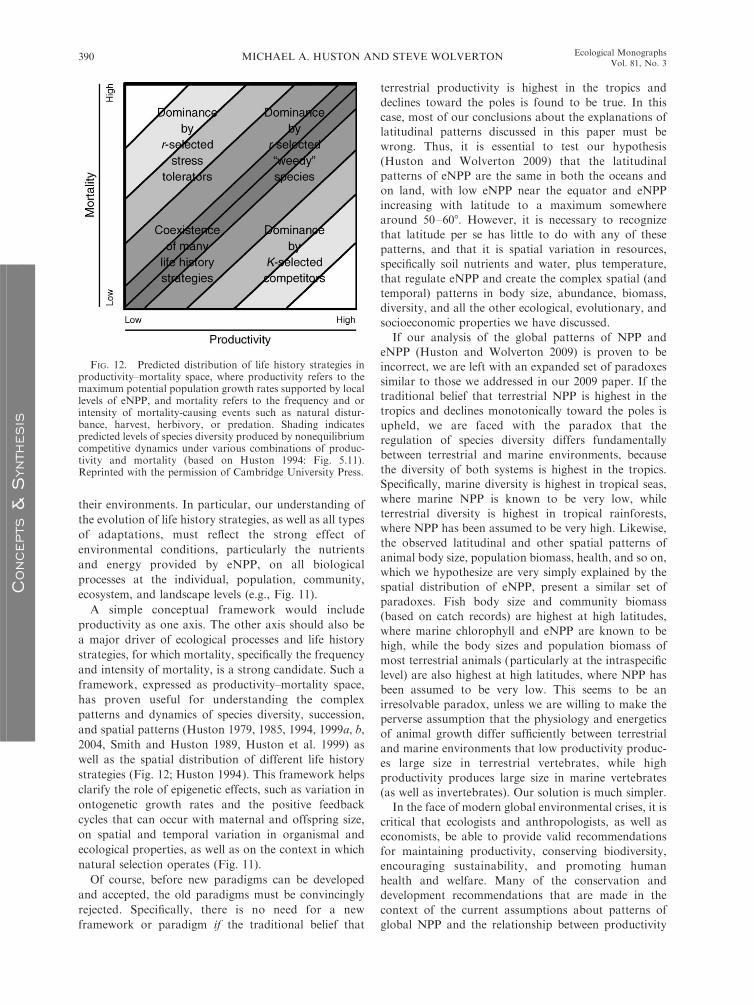
their environments. In particular, our understanding of
the evolution of life history strategies, as well as all types
of adaptations, must reflect the strong effect of
environmental conditions, particularly the nutrients
and energy provided by eNPP, on all biological
processes at the individual, population, community,
ecosystem, and landscape levels (e.g., Fig. 11).
A simple conceptual framework would include
productivity as one axis. The other axis should also be
a major driver of ecological processes and life history
strategies, for which mortality, specifically the frequency
and intensity of mortality, is a strong candidate. Such a
framework, expressed as productivity–mortality space,
has proven useful for understanding the complex
patterns and dynamics of species diversity, succession,
and spatial patterns (Huston 1979, 1985, 1994, 1999a, b,
2004, Smith and Huston 1989, Huston et al. 1999) as
well as the spatial distribution of different life history
strategies (Fig. 12; Huston 1994). This framework helps
clarify the role of epigenetic effects, such as variation in
ontogenetic growth rates and the positive feedback
cycles that can occur with maternal and offspring size,
on spatial and temporal variation in organismal and
ecological properties, as well as on the context in which
natural selection operates (Fig. 11).
Of course, before new paradigms can be developed
and accepted, the old paradigms must be convincingly
rejected. Specifically, there is no need for a new
framework or paradigm if the traditional belief that
terrestrial productivity is highest in the tropics and
declines toward the poles is found to be true. In this
case, most of our conclusions about the explanations of
latitudinal patterns discussed in this paper must be
wrong. Thus, it is essential to test our hypothesis
(Huston and Wolverton 2009) that the latitudinal
patterns of eNPP are the same in both the oceans and
on land, with low eNPP near the equator and eNPP
increasing with latitude to a maximum somewhere
around 50–608. However, it is necessary to recognize
that latitude per se has little to do with any of these
patterns, and that it is spatial variation in resources,
specifically soil nutrients and water, plus temperature,
that regulate eNPP and create the complex spatial (and
temporal) patterns in body size, abundance, biomass,
diversity, and all the other ecological, evolutionary, and
socioeconomic properties we have discussed.
If our analysis of the global patterns of NPP and
eNPP (Huston and Wolverton 2009) is proven to be
incorrect, we are left with an expanded set of paradoxes
similar to those we addressed in our 2009 paper. If the
traditional belief that terrestrial NPP is highest in the
tropics and declines monotonically toward the poles is
upheld, we are faced with the paradox that the
regulation of species diversity differs fundamentally
between terrestrial and marine environments, because
the diversity of both systems is highest in the tropics.
Specifically, marine diversity is highest in tropical seas,
where marine NPP is known to be very low, while
terrestrial diversity is highest in tropical rainforests,
where NPP has been assumed to be very high. Likewise,
the observed latitudinal and other spatial patterns of
animal body size, population biomass, health, and so on,
which we hypothesize are very simply explained by the
spatial distribution of eNPP, present a similar set of
paradoxes. Fish body size and community biomass
(based on catch records) are highest at high latitudes,
where marine chlorophyll and eNPP are known to be
high, while the body sizes and population biomass of
most terrestrial animals (particularly at the intraspecific
level) are also highest at high latitudes, where NPP has
been assumed to be very low. This seems to be an
irresolvable paradox, unless we are willing to make the
perverse assumption that the physiology and energetics
of animal growth differ sufficiently between terrestrial
and marine environments that low productivity produc-
es large size in terrestrial vertebrates, while high
productivity produces large size in marine vertebrates
(as well as invertebrates). Our solution is much simpler.
In the face of modern global environmental crises, it is
critical that ecologists and anthropologists, as well as
economists, be able to provide valid recommendations
for maintaining productivity, conserving biodiversity,
encouraging sustainability, and promoting human
health and welfare. Many of the conservation and
development recommendations that are made in the
context of the current assumptions about patterns of
global NPP and the relationship between productivity
FIG. 12. Predicted distribution of life history strategies inproductivity–mortality space, where productivity refers to themaximum potential population growth rates supported by locallevels of eNPP, and mortality refers to the frequency and orintensity of mortality-causing events such as natural distur-bance, harvest, herbivory, or predation. Shading indicatespredicted levels of species diversity produced by nonequilibriumcompetitive dynamics under various combinations of produc-tivity and mortality (based on Huston 1994: Fig. 5.11).Reprinted with the permission of Cambridge University Press.
MICHAEL A. HUSTON AND STEVE WOLVERTON390 Ecological MonographsVol. 81, No. 3
CONCEPTS&SYNTHESIS
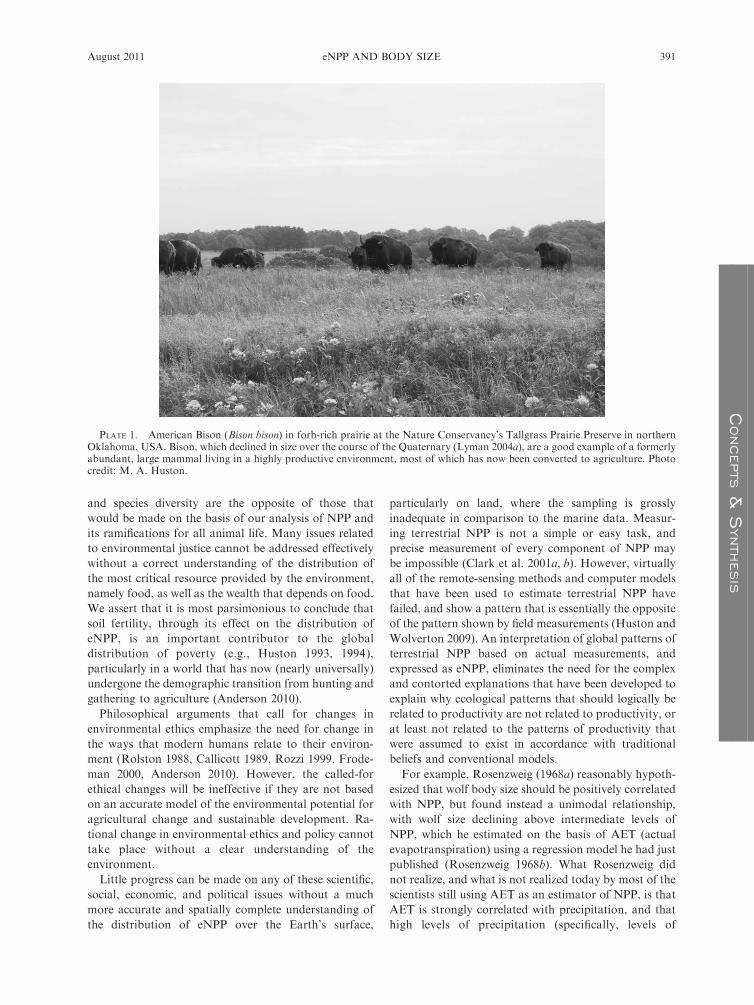
and species diversity are the opposite of those that
would be made on the basis of our analysis of NPP and
its ramifications for all animal life. Many issues related
to environmental justice cannot be addressed effectively
without a correct understanding of the distribution of
the most critical resource provided by the environment,
namely food, as well as the wealth that depends on food.
We assert that it is most parsimonious to conclude that
soil fertility, through its effect on the distribution of
eNPP, is an important contributor to the global
distribution of poverty (e.g., Huston 1993, 1994),
particularly in a world that has now (nearly universally)
undergone the demographic transition from hunting and
gathering to agriculture (Anderson 2010).
Philosophical arguments that call for changes in
environmental ethics emphasize the need for change in
the ways that modern humans relate to their environ-
ment (Rolston 1988, Callicott 1989, Rozzi 1999, Frode-
man 2000, Anderson 2010). However, the called-for
ethical changes will be ineffective if they are not based
on an accurate model of the environmental potential for
agricultural change and sustainable development. Ra-
tional change in environmental ethics and policy cannot
take place without a clear understanding of the
environment.
Little progress can be made on any of these scientific,
social, economic, and political issues without a much
more accurate and spatially complete understanding of
the distribution of eNPP over the Earth’s surface,
particularly on land, where the sampling is grossly
inadequate in comparison to the marine data. Measur-
ing terrestrial NPP is not a simple or easy task, and
precise measurement of every component of NPP may
be impossible (Clark et al. 2001a, b). However, virtually
all of the remote-sensing methods and computer models
that have been used to estimate terrestrial NPP have
failed, and show a pattern that is essentially the opposite
of the pattern shown by field measurements (Huston and
Wolverton 2009). An interpretation of global patterns of
terrestrial NPP based on actual measurements, and
expressed as eNPP, eliminates the need for the complex
and contorted explanations that have been developed to
explain why ecological patterns that should logically be
related to productivity are not related to productivity, or
at least not related to the patterns of productivity that
were assumed to exist in accordance with traditional
beliefs and conventional models.
For example, Rosenzweig (1968a) reasonably hypoth-
esized that wolf body size should be positively correlated
with NPP, but found instead a unimodal relationship,
with wolf size declining above intermediate levels of
NPP, which he estimated on the basis of AET (actual
evapotranspiration) using a regression model he had just
published (Rosenzweig 1968b). What Rosenzweig did
not realize, and what is not realized today by most of the
scientists still using AET as an estimator of NPP, is that
AET is strongly correlated with precipitation, and that
high levels of precipitation (specifically, levels of
PLATE 1. American Bison (Bison bison) in forb-rich prairie at the Nature Conservancy’s Tallgrass Prairie Preserve in northernOklahoma, USA. Bison, which declined in size over the course of the Quaternary (Lyman 2004a), are a good example of a formerlyabundant, large mammal living in a highly productive environment, most of which has now been converted to agriculture. Photocredit: M. A. Huston.
August 2011 391eNPP AND BODY SIZE
CONCEPTS&SYNTHESIS
precipitation that exceed the rate of potential evapo-
transpiration [Albrecht 1957]), lead to loss of soil
nutrients due to accelerated weathering and leaching
(see also Huston 1980, 1994, Uehara and Gillman 1981).
Thus, Rosenzweig’s complex explanation of why wolf
body size declined at high levels of productivity was
unnecessary because wolf body size actually does
increase with productivity (Fig. 6H) when it is measured
appropriately. Similarly tortuous arguments would be
necessary to explain why the humans who live in tropical
rain forests, supposedly the most productive terrestrial
environments on the planet, are among the smallest
people on Earth, regardless of which continent they
occupy. Likewise, complex arguments involving finely
tuned mortality rates have been developed to explain
why bird clutch sizes decrease from high latitudes to
lowest numbers in the tropical rain forests, which have
been assumed to be much more productive than high-
latitude forests (Ricklefs 1970). Such arguments are
probably unnecessary, since bird clutch size is positively
correlated with eNPP. This is a perfect opportunity to
reformulate our ideas about the evolution of body size,
reproductive characteristics, and life histories (e.g., Case
1978).
The geographic distribution of animal growth rates,
body size, and other components of secondary produc-
tivity—at all scales and based on previously collected or
new data—should receive as much attention and
support from funding agencies as do studies of primary
productivity. Geographic studies of animal biomass
should not take a back seat to studies of the global
distribution of NPP for several reasons. First, animal
body size and population densities are relatively simple
to measure, and secondary productivity and animal
biomass directly reflect primary productivity, which is
more complex and difficult to measure over large spatial
scales. The implications of such research extend from
animal biology and wildlife management to human
health, social justice, and economic development (Steck-
el 1983, 2000, Huston 1993, 1994, 2005, Leon and Walt
2000).
Too little research on the mechanisms underlying
body-size variability and Bergmann’s rule has been
published in the ecological literature, where the focus
has tended to be on macrogeographic studies of
correlates to body size (see however, Geist 1987a, b,
Simard et al. 2008). One must turn to the wildlife
management literature to encounter mechanistic studies
of mammal body size (e.g., Kie et al. 1983, Strickland
and Demarais 2006) and to the experimental nutrition
literature across the full range of taxa (Smith 1905,
Church 1991, Widdowson andMathers 1992, Pond et al.
1995). There is a need for ecological studies of body size
at multiple spatial scales, in fact, at any spatial scale over
which food availability varies (sensu Meiri et al. 2007).
The null hypothesis in studies that focus on the
mechanisms underlying variability in animal body size
should be that availability of food per individual is the
primary cause of differences in individual and popula-
tion growth rates, adult body size, and animal biomass
because that hypothesis is parsimonious. It will obviously
be found that other mechanisms influence growth rates
and size distributions, such as character displacement
and release, behavioral ecology, evolutionary biology,
and so on. However, these should be accepted as
alternative hypotheses only if their effect remains after
the response due to variation in food availability has
been statistically removed.
Our eNPP rule should be treated as an ecological
hypothesis, with innumerable opportunities for indepen-
dent tests. Detailed harvest records exist for numerous
game species at a variety of spatial scales that can be
used to test the eNPP rule (some of which we discussed
earlier in this paper, e.g., Crawford 1950, Gill 1956,
Strickland and Demarais 2000, Jones et al. 2008). In
order to use such records, however, ecologists and
wildlife biologists must overcome the biased notion that
many such data sets are hopelessly flawed because
animals have passed through the selective filter of
managed (or unmanaged) sport harvest. There are no
perfect data sets (Hutchins 1995:1326), and harvest data
sets can be used selectively. For example, the 1.5-year-
old buck age–sex cohort is often the most common
cohort in white-tailed deer harvest data. Using this
categorization removes age and sex hunting biases from
assessment of variability in size across space. Upon
considering white-tailed deer age, one immediately
confronts the criticism that age determination on the
basis of tooth wear is flawed (Ryel et al. 1961, Van
Deelan 2000, Gee et al. 2002), particularly for older
animals. However this can be overcome by assessing
younger age cohorts (Gee et al. 2002), the aging of which
relies on tooth eruption and wear (or lack thereof ).
Hunters certainly select bucks to harvest based on size,
but we doubt that hunters are able to age deer through
the rifle scope. Considering the cost of replacing harvest
data with new data collected in a more controlled
manner; there is no excuse for ‘‘paralysis of analysis’’
unless researchers are willing to call for cessation of tax-
funded harvest data collection across the board. For the
most part these massive data sets remain unused; it is
time to dust them off (e.g., Crawford 1950), and the
study of the spatial distribution of animal body size and
biomass is a perfect motivation to do so.
While more work needs to be done to test the eNPP
rule, it is important to recognize that, if validated, it
potentially provides a new approach to estimating
relative variation in eNPP (and thus annual NPP),
which could potentially be calibrated to absolute values.
Plant biologists have long recognized the value of using
plants as indicators of environmental conditions that
affect plant growth, a concept known as the ‘‘phytom-
eter,’’ or among foresters as the ‘‘site index.’’ Chemical
extraction and measurement of soil nutrients is an
attempt to approximate the amounts of nutrients
available to plants, but the growth of actual plants is
MICHAEL A. HUSTON AND STEVE WOLVERTON392 Ecological MonographsVol. 81, No. 3
CONCEPTS&SYNTHESIS

the ultimate indicator of soil nutrient availability.
Genetically identical plants can be used as phytometers
to evaluate the capability of different soil types to
support the growth of particular species. Likewise,
plants of potentially different genotypes can be planted
together in ‘‘common gardens’’ in different environ-
ments to separate genetic and environmental effects on
plant growth, as well as gene–environment interactions.
Just as soil chemical analysis provides an approxi-
mate, but imperfect, indicator of the nutrients available
to support plant growth, physical measurements of NPP
provide a spatially and temporally limited estimate of
actual NPP that is often difficult to extrapolate to the
spatial and temporal scales relevant to many ecological,
evolutionary, and ecosystem processes. Measurement of
nutrition-based animal properties, including intraspecif-
ic body-size variation, population density, and popula-
tion biomass, can allow animals to be used as
‘‘zoometers’’ to estimate spatial and temporal variation
in eNPP, which is the ultimate source of animal
nutrition. If animal properties and eNPP are as strongly
correlated as the eNPP rule proposes, we may be able to
use measurements of animal properties and of eNPP in a
complementary manner to greatly improve our under-
standing of the spatial and temporal variation in both.
CONCLUSION
We believe that the mechanism of heat conservation
proposed by Bergmann has little or nothing to do with
observed latitudinal variation in body size. We expect
that intraspecific body-size variation (as well as intra-
specific differences in total biomass) of most species will
conform to the eNPP rule, and any consistency with the
predictions of Bergmann’s rule is coincidental. Over
latitudinal ranges that extend from the edge of the
tropics through the temperate zone, the eNPP rule
predicts an increase in body size that coincidentally
matches the prediction of Bergmann’s rule. However,
for species that inhabit either low or high latitudes
without geographic range extension into the temperate
latitudes, we expect conformation to the eNPP rule that
will either be the opposite of the Bergmann predictions
(608–908 latitude) or show no apparent pattern (23.58 N–
23.58 S latitude).
We have proposed a very simple explanation for
spatial and temporal variation in animal body size and a
wide range of related phenomena in ecology, evolution-
ary biology, human health, and socioeconomics that
should apply across all environmental gradients where
eNPP varies significantly, whether they are related to
latitude or not (Fig. 11). Our hypothesis is based on
fundamental principles of ecological energetics and
nutrition, which affect a wide range of ecological
processes from the individual to the ecosystem level, as
well as evolutionary processes (Huston 1994:309–312;
M. A. Huston, unpublished manuscript). Our focus here
has been primarily at the individual and population
levels, but the same variation in eNPP across any
environmental scales or dimensions is expected to have a
strong influence on community-level properties such as
species diversity (Huston 1979, 1994), as well as
ecosystem dynamics (Huston and Smith 1987, Huston
et al. 1988, Garten et al. 1994, Huston 1994). Better
measurements of spatial variation in animal body size, in
conjunction with better measurement of NPP and eNPP,
animal biomass, and secondary production (eNSP) in
the areas where body-size data are collected, are
required to provide a definitive test of the eNPP rule
and related hypotheses.
The eNPP rule opens a new universe of opportunities
for theoretical, experimental, and observational advanc-
es in our understanding of the energetic and structural
patterns of life on our planet. We are optimistic that a
relatively small number of ecological and evolutionary
processes, combined with a new understanding of the
spatial distribution of fundamental resources related to
net primary productivity, will provide a simple, cohesive
explanation for the major patterns of life on Earth.
Assuming that we are correct about the global
distribution of NPP and eNPP, there is still much to
be learned about ecological, evolutionary, social, and
economic phenomena ranging from mechanisms driving
animal biomass to global planning for the alleviation of
poverty and disease.
ACKNOWLEDGMENTS
We thank three anonymous reviewers and Ian Abbott fortheir helpful comments and questions that allowed us tosubstantially clarify our presentation. We also thank BillCrawford and Valerius Geist for their pioneering work andinsights into animal body size, and for their encouragement andsupport of our efforts. We are especially grateful to theresearchers at Oregon State’s Ocean Productivity Project fortheir support of our use of ocean NPP data. Mike Behrenfeldgenerously allowed us to use data from his 2001 paper, andRobert O’Malley provided support well beyond the call of dutyin creating and summarizing latitudinally averaged seasonalNPP values for the world’s three major oceans. M. A. Hustonwas supported by NSF OPUS Grant 0918927 and a Develop-mental Leave Grant from Texas State University.
LITERATURE CITED
Ajtay, G. L., P. Ketner, and P. Duvigneaud. 1979. Terrestrialprimary productivity and phytomass. Pages 129–182 in B.Bolin, E. T. Deggens, S. Kempe, and P. Ketner, editors. Theglobal carbon cycle, SCOPE 13. John Wiley and Sons, NewYork, New York, USA.
Albrecht, W. A. 1941. Biological assays of soil fertility.Proceedings of the Soil Science Society of America 6:252–258.
Albrecht, W. A. 1942. Sound horses are bred on fertile soils.Percheron News July 1942:15–22.
Albrecht, W. A. 1943. Soil and livestock. Land 2:298–305.Albrecht, W. A. 1944. Soil fertility and wildlife: cause and
effect. Transactions of the North American Wildlife Confer-ence 9:19–28.
Albrecht, W. A. 1947a. Climate, soil, and health. II. Managinghealth via the soil. Oral Surgery, Oral Medicine, and OralPathology 1:206–214.
Albrecht, W. A. 1947b. Our teeth and our soils. Annals ofDentistry 6:316–323.
Albrecht, W. A. 1952. The cow ahead of the plow. GuernseyBreeders’ Journal 84:1173–1177.
August 2011 393eNPP AND BODY SIZE
CONCEPTS&SYNTHESIS

Albrecht, W. A. 1955. Why your cattle break through the fence.Western Livestock Journal 33:35–38.
Albrecht, W. A. 1957. Soil fertility and biotic geography.Geographical Review 47:86–105.
Allen, A. P., J. H. Brown, and J. F. Gillooly. 2002. Globalbiodiversity, biochemical kinetics, and the energetic-equiva-lence rule. Science 297:1545–1548.
Andersen, C, and D. Pauly. 2006. A comparison of growthparameters of Australian marine fishes north and south of288 South. Pages 65–68 in M. L. D. Palomares, K. I.Stergiou, and D. Pauly, editors. Fishes in databases andecosystems. Fisheries Centre Research Reports 14(4). Fish-eries Centre, University of British Columbia, Vancouver,British Columbia, Canada.
Anderson, E. N. 2010. The pursuit of ecotopia: lessons fromindigenous and traditional Societies for the human ecology ofour modern world. Praeger, Santa Barbara, California, USA.
Ashton, K. G. 2002. Patterns of within-species body sizevariation of birds: strong evidence for Bergmann’s rule.Global Ecology and Biogeography 11:505–523.
Ashton, K. G., and C. R. Feldman. 2003. Bergmann’s rule innonavian reptiles: turtles follow it, lizards and snakes reverseit. Evolution 57:1151–1163.
Ashton, K. G., M. C. Tracy, and A. de Queiroz. 2000. IsBergmann’s rule valid for mammals? American Naturalist156:390–415.
Atkinson, D. 1994. Temperature and organism size: a biologicallaw for ectotherms? Advances in Ecological Research 25:1–58.
Barker, D. J. P. 1990. The fetal and infant origins of adultdisease: the womb may be more important than the home.British Medical Journal 301:1111.
Barker, D. J. P. 1998. Mothers, babies and health in later life.Harcourt Brace and Company, Edinburgh, Scotland, UK.
Barlow, A. C. D. 2009. Sundarbans tigers: adaptation,population status and conflict management. Dissertation.University of Minnesota, Minneapolis, Minnesota, USA.
Bates, D. G. 2001. Human adaptive strategies: ecology, culture,and politics. Second Edition. Allyn and Bacon, Boston,Massachusetts, USA.
Bateson, P. 2001. Fetal experience and good adult design.International Journal of Epidemiology 30:928–934.
Bateson, P., et al. 2004. Developmental plasticity and humanhealth. Nature 430:419–421.
Batty, G. D., M. J. Shipoley, D. Gunnell, R. Huxley, M.Kivimaki, M. Woodwawrd, C. M. Ying Lee, and G. D.Smith. 2009. Height, wealth, and health: an overview withnew data from three longitudinal studies. Economics andHuman Biology 7:137–152.
Bayliss, P. R., and J. Laybourn-Parry. 1995. Seasonalabundance and size variation in Antarctic populations ofthe cladoceran Daphniopsis studeri. Antarctic Science 7:393–394.
Beckmann, J. P., and J. Berger. 2003. Rapid ecological andbehavioral changes in carnivores: the responses of blackbears (Ursus americanus) to altered food. Journal of Zoology261:207–212.
Behrenfeld, M. J., E. Boss, D. A. Siegel, and D. M. Shea. 2005.Carbon-based ocean productivity and phytoplankton phys-iology from space. Global Biogeochemical Cycles19:GB1006.
Behrenfeld, M. J., and P. G. Falkowski. 1997. Photosyntheticrates derived from satellite-based chlorophyll concentration.Limnology and Oceanography 42:1–20.
Behrenfeld, M. J., J. T. Randerson, C. R. McClain, G. C.Feldman, S. O. Los, C. J. Tucker, P. G. Falkowski, C. B.Field, R. Frouin, W. E. Esaias, D. D. Kobler, and N. H.Pollack. 2001. Biospheric primary production during anENSO transition. Science 291:2594–2597.
Behrenfeld, M. J., K. Worthington, R. M. Sherrell, F. P.Chavez, P. Strutton, M. McPhaden, and D. M. Shea. 2006.
Controls on tropical Pacific Ocean productivity revealedthrough nutrient stress diagnostics. Nature 442:1025–1028.
Belkin, I. M. 2009. Rapid warming of large marine ecosystems.Progress in Oceanography 81:207–213.
Benedict, F. G. 1938. Vital energetics. Carnegie Institute ofWashington Publication 503:1–215.
Berg, K. 1936. Reproduction and depression in the Cladocera,illustrated by the weight of the animals. Archiv fur Hydro-biologie 30:438–462.
Bergerud, A. T. 2000. Caribou. Pages 658–693 in S. Demarais,and P. R. Krausman, editors. Ecology and management oflarge mammals in North America. Prentice Hall, UpperSaddle River, New Jersey, USA.
Bergmann, C. 1847. Uber die Verhaltnisse der Warmeokonomieder Thiere zu ihrer Grosse. Gottinger Studien 3:595–708.
Bindon, J. R., and P. T. Baker. 1997. Bergmann’s rule and thethrifty genotype. American Journal of Physical Anthropol-ogy 104:201–210.
Birdsell, J. B. 1993. Microevolutionary patterns in aboriginalAustralia. Oxford University Press, Oxford, UK.
Blackburn, T. M., and K. J. Gaston. 1994. The distribution ofbody sizes of the world’s bird species. Oikos 70:127–130.
Blackburn, T. M., and K. J. Gaston. 1996. Spatial patterns inthe body sizes of bird species in the New World. Oikos77:436–446.
Blackburn, T. M., and K. J. Gaston. 1998. Some methodolog-ical issues in macroecology. American Naturalist 151:68–83.
Blackburn, T. M., K. J. Gaston, and N. Loder. 1999.Geographic gradients in body size: a clarification ofBergmann’s rule. Diversity and Distributions 5:165–174.
Blackburn, T. M., and B. A. Hawkins. 2004. Bergmann’s ruleand the mammal fauna of northern North America.Ecography 27:715–724.
Blakey, R., and W. Ranney. 2009. Ancient landscapes of theColorado Plateau. Grand Canyon Association, GrandCanyon, Arizona, USA.
Blanckenhorn, W. U. 1998. Adaptive phenotypic plasticity ingrowth, development, and body size in the yellow dung fly.Evolution 52:1394–1407.
Blanckenhorn, W. U., and M. Demont. 2004. Bergmann andconverse Bergmann latitudinal clines in arthropods: two endsof a continuum? Integrative and Comparative Biology44:413–424.
Boehlert, G. W., and M. M. Yoklavich. 1983. Effects oftemperature, ration, and fish size on growth of juvenile blackrockfish, Sebastes melanops. Environmental Biology ofFishes 8:17–28.
Bogin, B., and L. Rios. 2003. Rapid morphological change inliving humans: implications for modern human origins.Comparative Biochemistry and Physiology Part A: Molecu-lar and Integrative Physiology 136:71–84.
Bossdorf, O., C. L. Richards, and M. Pigliucci. 2008.Epigenetics for ecologists. Ecology Letters 11:106–115.
Boyce, M. S. 1978. Climatic variability and body size variationin the muskrats (Ondatra zibethicus) of North America.Oecologia 36:1–19.
Boyer, A. G., J.-L. E. Cartron, and J. H. Brown. 2010.Interspecific pairwise relationships among body size, clutchsize and latitude: deconstructing a macroecological trianglein birds. Journal of Biogeography 37:47–56.
Braithwaite, L. W., J. Turner, and J. Kelly. 1984. Studies on thearboreal marsupial fauna of eucalypt forests being harvestedfor wood-pulp at Eden, N. S. W. III. Relationships betweenfaunal densities, eucalypt occurrence and foliage nutrients,and soil parent materials. Australian Wildlife Research11:41–48.
Brett, J. R. 1979. Environmental factors and fish growth. Pages599–675 in W. S. Hoar, D. J. Randall, and J. R. Brett,editors. Fish physiology. Volume VIII. Bioenergetics andgrowth. Academic Press, New York, New York, USA.
MICHAEL A. HUSTON AND STEVE WOLVERTON394 Ecological MonographsVol. 81, No. 3
CONCEPTS&SYNTHESIS

Bronfenbrenner, U., and S. J. Ceci. 1994. Nature–nurturereconceptualized in developmental perspective: a bioecolog-ical model. Psychological Review 101:568–586.
Brown, J. H., J. F. Gillooly, A. P. Allen, V. M. Savage, andG. B. West. 2004. Toward a metabolic theory of ecology.Ecology 85:1771–1789.
Brown, J. H., and A. K. Lee. 1969. Bergmann’s rule andclimatic adaptation in woodrats (Neotoma). Evolution23:329–338.
Brown, J. H., P. A. Marquet, and M. L. Taber. 1993. Evolutionof body size: consequences of an energetics definition offitness. American Naturalist 142:573–584.
Brown, J. H., and P. F. Nicoletto. 1991. Spatial scaling ofspecies composition: body masses of North American landmammals. American Naturalist 138:1478–1512.
Brown, M. F. 2008. Cultural relativism 2.0. Current Anthro-pology 49:363–383.
Brunner, E. 1997. Stress and the biology of inequality. BritishMedical Journal 314:1472–1476.
Brunson, M. H. 1937. The influence of the instars of host larvaeon the sex of the progeny of Tiphia popilliavora Roh. Science86:197.
Buckel, J. A., N. D. Steinberg, and D. O. Conover. 1995.Effects of temperature, salinity, and fish size on growth andconsumption of juvenile bluefish. Journal of Fish Biology47:696–706.
Cade, B. S., and Q. Guo. 2000. Estimating effects of constraintson plant performance with regression quantiles. Oikos91:245–54.
Cade, B. S., and B. R. Noon. 2003. A gentle introduction toquantile regression for ecologists. Frontiers in Ecology andthe Environment 1:412–420.
Cade, B. S., J. W. Terrel, and R. L. Schroeder. 1999. Estimatingeffects of limiting factors with regression quantiles. Ecology80:311–23.
Calder, W. A., III. 1984. Size, function, and life history.Harvard University Press, Cambridge, Massachusetts, USA.
Callicott, J. B. 1989. In defense of the land ethic: essays inenvironmental philosophy. State University of New YorkPress, Albany, New York, USA.
Carbone, C., and J. L. Gittleman. 2002. A common rule for thescaling of carnivore density. Science 295:2273–2276.
Cardillo, M. 2003. Biological determinants of extinction risk:why are smaller species less vulnerable? Animal Conservation6:63–69.
Cardillo, M., G. M. Mace, K. E. Jones, J. Bielby, O. R. P.Bininda-Emonds, W. Sechrest, C. D. L. Orme, and A. Purvis.2005. Multiples causes of high extinction risk in largemammal species. Science 309:1239–1241.
Carone, B. R., et al. 2010. Paternally induced transgenerationalenvironmental reprogramming of metabolic gene expressionin mammals. Cell 143:1084–1096.
Case, T. J. 1978. On the evolution and adaptive significance ofpostnatal growth rates in the terrestrial vertebrates. QuarterlyReview of Biology 53:243–282.
Castro, T. G., L. G. Baraldi, P. T. Muniz, and M. A. Cardoso.2009. Dietary practices and nutritional status of 0–24-month-old children from Brazilian Amazonia. Public HealthNutrition 12:2335–2342.
Cavallini, P. 1995. Variation in the body size of the red fox.Annales Zoologici Fennici 32:421–427.
Cavelaars, A. E., et al. 2000. Persistent variations in averageheight between countries and between socio-economicgroups: an overview of 10 European countries. Annals ofHuman Biology 27:407–421.
Charnov, E. L. 1982. The theory of sex allocation. PrincetonUniversity Press, Princeton, New Jersey, USA.
Charnov, E. L., and J. F. Gillooly. 2004. Size and temperaturein the evolution of fish life histories. Integrative andComparative Biology 44:494–497.
Charnov, E. L., R. L. Los-den Hartogh, W. T. Jones, and J. vanden Assem. 1981. Sex ratio evolution in a variableenvironment. Nature 289:27–33.
Cheatum, E. L., and C. W. Severinghaus. 1950. Variations infertility of white-tailed deer related to range conditions.North American Wildlife Conference 15:170–190.
Chewyreuv, I. 1913. Le role des femmelles dans la determina-tion du sexe et leur descendance dans le groupe desIchneumonides. Comptes Rendus des Seances et Memoiresde la Societe de Biologie 74:695–699.
Church, D. C. 1991. Livestock feeds and feeding. Prentice Hall,Englewood Cliffs, New Jersey, USA.
Ciais, P., P. P. Tans, J. W. C. White, M. Trolier, R. J. Francey,J. A. Berry, D. R. Randall, P. J. Sellers, J. G. Collatz, andD. S. Schimel. 1995. Partitioning of ocean and land uptake ofCO2 as inferred by d13C measurements from the NOAAClimate Monitoring and Diagnostics Laboratory global airsampling network. Journal of Geophysical Research100:5051–5070.
Cicognani, A., R. Alessandroni, A. Pasini, P. Pirazzoli, A.Cassio, E. Barbieri, and E. Cacciari. 2002. Low birth weightfor gestational age and subsequent male gonadal function.Journal of Pediatrics 141:376–379.
Clark, D. A., S. Brown, D. W. Kicklighter, J. Q. Chambers,J. R. Tomlinson, and J. Ni. 2001a. Measuring net primaryproduction in forests: concepts and field methods. EcologicalApplications 11:356–370.
Clark, D. A., S. Brown, D. W. Kicklighter, J. Q. Chambers,J. R. Tomlinson, J. Ni, and E. A. Holland. 2001b. NPP intropical forests: an evaluation and synthesis of existing fielddata. Ecological Applications 11:371–384.
Clausen, C. P. 1939. The effect of host size upon the sex ratio ofhymenopterous parasites and its relation to methods ofrearing and colonization. Journal of the New York Entomo-logical Society 47:1–9.
Coady, J. W. 1982. Moose (Alces alces). Pages 902–922 in J. A.Chapman, and G. A. Feldhamer, editors. Wild animals ofNorth America: biology, management, economics. JohnsHopkins University Press, Baltimore, Maryland, USA.
Comer, C. E., J. C. Kilgo, G. J. D’Angelo, T. C. Glenn, andK. V. Miller. 2005. Fine-scale genetic structure and socialorganization in female white-tailed deer. Journal of WildlifeManagement 69:332–344.
Connell, J. H., and E. Orias. 1964. The ecological regulation ofspecies diversity. American Naturalist 98:399–414.
Cook, R. L. 1984. Texas. Pages 457–474 in L. K. Halls, editor.White-tailed deer ecology and management. StackpoleBooks, Harrisburg, Pennsylvania, USA.
Coon, C. S., S. M. Garn, and J. B. Birdsell. 1950. Races: a studyof the problems of race formation in man. Springfield,Illinois, USA.
Cooper, N., and A. Purvis. 2010. Body size evolution inmammals: complexity in tempo and mode. AmericanNaturalist 175:727–738.
Cote, S., T. P. Rooney, C. Tremblay, C. Dussault, and D. M.Waller. 2004. Ecological impacts of deer overabundance.Annual Review of Ecology, Evolution, and Systematics35:113–147.
Cousins, S. H. 1989. Species richness and energy theory. Nature340:350–351.
Crawford, B. T. 1946. Wildlife sampling by soil types. NorthAmerican Wildlife Conference 11:357–364.
Crawford, B. T. 1950. Some specific relationships between soilsand wildlife. Journal of Wildlife Management 14:115–123.
Creel, S., and N. M. Creel. 1997. Lion density and populationstructure in the Selous Game Reserve: evaluation of huntingquotas and offtake. African Journal of Ecology 35:83–93.
Crete, M. 1999. The distribution of deer biomass in NorthAmerica supports the hypothesis of exploitation ecosystems.Ecology Letters 2:223–227.
August 2011 395eNPP AND BODY SIZE
CONCEPTS&SYNTHESIS

Crooks, D. L., L. Cliggett, and S. M. Cole. 2007. Child growthas a measure or livelihood security: the case of the GwembeTonga. American Journal of Human Biology 19:669–675.
Crooks, K. R. 2002. Relative sensitivities of mammaliancarnivores to habitat fragmentation. Conservation Biology16:488–502.
Cuenco, M. L., R. R. Stickney, and W. E. Grant. 1985. Fishbioenergetics and growth in aquaculture ponds: II. Effects ofinteractions among size, temperature, dissolved oxygen,unionized ammonia and food on growth of individual fish.Ecological Modeling 27:191–206.
Currie, D. J. 1991. Energy and large-scale patterns of animaland plant species richness. American Naturalist 137:27–49.
Currie, D. J., and J. Fritz. 1993. Global patterns of animalabundance and species energy use. Oikos 67:56–68.
Currie, D. J., G. G. Mittelbach, H. V. Cornell, R. Field, J.-F.Guegan, B. A. Hawkins D. M. Kaufman, J. T. Kerr, T.Oberdorff, E. O’Brien, and J. R. G. Turner. 2004. Predictionsand tests of climate-based hypotheses of broad-scale varia-tion in taxonomic richness. Ecology Letters 7:1121–1134.
Currier, M. J. P. 1983. Felis concolor. Mammal Species 200:1–7.Dalke, P. D., A. S. Leopold, and D. L. Spencer. 1946. The
ecology and management of the wild turkey in Missouri.Missouri Conservation Commission Technical Bulletin No.1. Jefferson City, Missouri, USA.
Damuth, J. 1981. Population density and body size inmammals. Nature 290:699–700.
Damuth, J. 1987. Interspecific allometry of population densityin mammals and other animals: the independence of bodymass and population energy use. Biological Journal of theLinnean Society 31:193–246.
Damuth, J. 1991. Of size and abundance. Nature 351:268–269.DeAngelis, D. L., W. M. Post, and C. Travis. 1986. Positive
feedback in natural systems. Springer-Verlag, Heidelberg,Germany.
Demarais, S., J. J. Jackley, B. K. Strickland, and L. W. Varner.2003. In vitro digestibility of forages by coexisting deerspecies in Texas. Texas Journal of Science 55:175–182.
Demarais, S., K. V. Miller, and H. A. Jacobson. 2000. White-tailed deer. Pages 601–628 in S. Demarais, and P. R.Krausman, editors. Ecology and management of largemammals in North America. Prentice Hall, Upper SaddleRiver, New Jersey, USA.
Denney, A. H. 1944. Wildlife relationships to soil types.Transactions of the North American Wildlife Conference9:316–323.
Diggle, P. J. 1976. A spatial-stochastic model of inter-plantcompetition. Journal of Applied Probability 13:662–671.
Dobzhansky, T. 1950. Evolution in the tropics. AmericanScientist 38:209–221.
Dufour, D. L., L. K. Staten, J. C. Reina, and G. B. Spurr. 1994.Anthropometry and secular changes in stature of urbanColumbian women of differing socioeconomic status. Amer-ican Journal of Human Biology 6:749–760.
Dunning, J. B. 2007. CRC handbook of avian body masses,Second Edition. CRC Press, Boca Raton, Florida, USA.
Elowe, K. D., and W. E. Dodge. 1989. Factors affecting blackbear reproductive success and cub survival. Journal ofWildlife Management 53:962–968.
Enquist, B. J., and K. J. Niklas. 2001. Invariant scalingrelations across tree-dominated communities. Nature410:655–660.
Ensminger, M. E., and C. G. Olentine. 1978. Feeds andnutrition complete. Ensminger Publishing Company, Clovis,California, USA.
Enting, I. G. 2000. Constraints on the atmospheric carbonbudget from spatial distributions of CO2. Pages 115–124 inT. M. L. Wigley, and D. S. Schimel, editors. The carboncycle. Cambridge University Press, Cambridge, UK.
Enting, I. G., and J. V. Mansbridge. 1991. Latitudinaldistribution of sources and sinks of CO2: results of aninversion study. Tellus 43B:156–170.
Entling, W., M. H. Schmidt-Entling, S. Bacher, R. Brandl, andW. Nentwig. 2010. Body size–climate relationships ofEuropean spiders. Journal of Biogeography 37:477–485.
Evans, K. L., and K. J. Gaston. 2005. Can the evolutionary-rates hypothesis explain species–energy relationships? Func-tional Ecology 19:899–915.
Evans, K. L., P. H. Warren, and K. J. Gaston. 2005. Species–energy relationships at the macroecological scale: a review ofmechanisms. Biological Review 80:1–25.
Eveleth, P. B., and J. M. Tanner. 1990. Worldwide variation inhuman growth. Cambridge University Press, Cambridge,UK.
FAO [Food and Agriculture Organization of the UnitedNations]. 2008. Harmonized world soil database v1.0.FAO/IIASA/ISRIC/JRC-EU/Academia Sinica. FAO Landand Water Digital Media Series #34. FAO, Rome, Italy.hhttp://www.iiasa.ac.at/Research/LUC/External-World-soil-database/HTML/index.htmli
Federov, A. A. 1966. The structure of the tropical rain forestand speciation in the humid tropics. Journal of Ecology 54:1–11.
Ferguson, S. H. 2002. The effects of productivity andseasonality on life history: comparing age at maturity amongmoose (Alces alces) populations. Global Ecology andBiogeography 11:303–312.
Ferguson, S. H., A. R. Bisset, and F. Messier. 2000. Theinfluences of density on growth and reproduction in mooseAlces alces. Wildlife Biology 6:31–39.
Field, C. B., M. J. Behrenfeld, J. T. Randerson, and P.Falkowski. 1998. Primary production of the biosphere:integrating terrestrial and oceanic components. Science281:237–240.
Fischer, A. G. 1960. Latitudinal variations in organic diversity.Evolution 14:64–81.
Fisher, J. A. D., K. T. Frank, and W. C. Leggett. 2010. Globalvariation in marine fish body size and its role in biodiversity–ecosystem functioning. Marine Ecology Progress Series405:1–13.
Flannery, T. 1994. The future eaters. Reed Press, PortMelbourne, Australia.
Floud, R., K. Wachter, and A. Gregory. 1990. Height, health,and history: nutritional status in the United Kingdom, 1750–1980. Cambridge University Press, Cambridge, UK.
Floud, R. 2003. The dimensions of inequality: height andweight variation in Britain 1700–2000. Pages 13–26 in V.Berridge, and S. Blume, editors. Poor health and socialinequality before and after the Black Report. Frank CassPublishers, London, UK.
Floyd, B. 2007. Focused life history data and linear enamelhypoplasia to help explain intergenerational variation inrelative leg length within Taiwanese families. AmericanJournal of Human Biology 19:358–375.
Fonds, M., R. Cronie, A. D. Vethaak, and P. Ven Der Puyl.1992. Metabolism, food consumption, and growth of plaice(Pleuronectes platessa) and flounder (Platichthys flesus) inrelation to fish size and temperature. Netherlands Journal ofSea Research 29:127–143.
Fox, C. W., and U. M. Savalli. 1998. Inheritance ofenvironmental variation in body size: superparasitism ofseeds affects progeny and grandprogeny body size via a non-genetic maternal effect. Evolution 52:172–182.
Franzmann, A. W. 2000. Moose. Pages 578–600 in S.Demarais, and P. R. Krausman, editors. Ecology andmanagement of large mammals in North America. PrenticeHall, Upper Saddle River, New Jersey, USA.
Frisancho, A. R. 2007. Relative leg length as a biologicalmarker to trace the developmental history of individuals andpopulations: growth delay and increased body fat. AmericanJournal of Human Biology 19:703–710.
Frodeman, R., editor. 2000. Earth matters: the earth sciences,philosophy, and the claims of community. Prentice Hall,Upper Saddle River, New Jersey, USA.
MICHAEL A. HUSTON AND STEVE WOLVERTON396 Ecological MonographsVol. 81, No. 3
CONCEPTS&SYNTHESIS

Gamboa, J. A. A., and F. D. Gurri Garcıa. 2007. Impact ofseasonal scarcity on energy balance and body composition inpeasant adolescents from Calakmul, Campeche, Mexico.American Journal of Human Biology 19:751–762.
Garten, C. T., M. A. Huston, and C. Thoms. 1994.Topographic variation of soil nitrogen dynamics at WalkerBranch Watershed, Tennessee. Forest Science 40:497–513.
Gartlan, J. S., D. B. McKey, P. G. Waterman, C. N. Mbi, andT. T. Struhsaker. 1980. A comparative study of thephytochemistry of two African rainforests. BiochemicalSystematics and Ecology 8:401–422.
Gaston, K. J., and T. M. Blackburn. 1996. Global scalemacroecology: interactions between population size, geo-graphic range size and body size in Anseriformes. Journal ofAnimal Ecology 65:701–714.
Gaur, R., and N. Y. Singh. 1994. Nutritional status amongrural meitei children of Manipur, India. American Journal ofHuman Biology 6:731–740.
Gay, S. W., and T. L. Best. 1996. Relationships between abioticvariables and geographic variation in skulls of pumas (Pumaconcolor: Mammalia, Felidae) in North and South America.Zoological Journal of the Linnaean Society 117:259–282.
Gee, K. L., J. H. Holman, M. K. Causey, A. N. Rossi, and J. B.Armstrong. 2002. Aging white-tailed deer by tooth replace-ment and wear: a critical evaluation of a time-honoredtechnique. Wildlife Society Bulletin 30:387–393.
Geist, V. 1978. Life strategies, human evolution, environmentaldesign. Springer-Verlag, New York, New York, USA.
Geist, V. 1987a. Bergmann’s rule is invalid. Canadian Journalof Zoology 65:1035–1038.
Geist, V. 1987b. On speciation in Ice Age mammals, withspecial reference to cervids and caprids. Canadian Journal ofZoology 65:1067–1084.
Geist, V. 1998. Deer of the world: their evolution, behavior, andecology. Stackpole Books, Mechanicsburg, Pennsylvania,USA.
Geist, V. 1999. Periglacial ecology, large mammals, and theirsignificance to human biology. Pages 78–94 in R. Bonnich-sen, and K. L. Turnmire, editors. Ice age peoples of NorthAmerica: environments, origins, and adaptations of the firstAmericans. Oregon State University Press, Corvallis, Ore-gon, USA.
Gill, J. 1956. Regional differences in size and productivity ofdeer in West Virginia. Journal of Wildlife Management20:286–292.
Gillooly, J. F., J. H. Brown, G. B. West, V. M. Savage, andE. L. Charnov. 2001. Effects of size and temperature onmetabolic rate. Science 293:2248–2251.
Gingerich, P. D. 2003. Mammalian responses to climate changeat the Paleocene–Eocene boundary: Polecat Bench record inthe northern Bighorn Basin, Wyoming. Geological Society ofAmerica Special Paper 369. Geological Society of America,Boulder, Colorado, USA.
Gingerich, P. D. 2008. Environment and evolution through thePaleocene–Eocene thermal maximum. Trends in Ecology andEvolution 21:246–253.
Gittleman, J. L. 1985. Carnivore body size: ecological andtaxonomic correlates. Oecologia 67:540–554.
Gleick, P. 2000. The world’s water. Island Press, Washington,D.C., USA.
Godfrey, K. M., and D. J. P. Barker. 2000. Fetal nutrition andadult disease. American Journal of Clinical Nutrition71:1344S–1352S.
Gortazar, C., A. Travaini, and M. Delibes. 2000. Habitat-related microgeographic body size variation in two Medi-terrannean populations of red fox (Vulpes vulpes). Journal ofZoology, London 250:335–338.
Gotthold, D. W., and J. J. Gotthold. 1988. Indian Ocean:bibliography. Clio Press, Oxford, UK.
Gould, S. J., and R. C. Lewontin. 1979. The spandrels of SanMarco and the Panglossian paradigm: a critique of the
adaptationist paradigm. Proceedings of the Royal Society B205:581–598.
Graham, R. W., et al. 1996. Spatial responses of mammals tolate Quaternary environmental fluctuations. Science272:1601–1606.
Graves, G. R. 1991. Bergmann’s rule near the equator:latitudinal clines in body size of an Andean passerine bird.Proceedings of the National Academy of Sciences USA88:2322–2325.
Grayson, D. K. 1998. Moisture history and small mammalcommunity richness during the latest Pleistocene andHolocene, northern Bonneville Basin, Utah. QuaternaryResearch 49:330–334.
Grayson, D. K. 2000. Mammalian responses to MiddleHolocene climatic change in the Great Basin of the westernUnited States. Journal of Biogeography 27:181–192.
Grayson, D. K. 2007. Deciphering North American Pleistoceneextinctions. Journal of Anthropological Research 63:185–212.
Greve, M., K. J. Gaston, B. J. van Rensburg, and S. L. Chown.2008. Environmental factors, regional body size distributionsand spatial variation in body size of local avian assemblages.Global Ecology and Biogeography 17:514–523.
Guillaumet, A., J.-B. Ferdy, E. Desmarais, B. Godelle, andP.-A. Crochet. 2008. Testing Bergmann’s rule in the presenceof confounding factors: a case study with three species ofGalerida Larks in Morocco. Journal of Biogeography35:579–591.
Gurven, M., H. Kaplan, and A. Z. Supa. 2007. Mortalityexperience of Tsimane Amerindians of Bolivia: regionalvariation and temporal trends. American Journal of HumanBiology 19:376–398.
Gustaffson, A., L. Werdelin, B. S. Tullberg, and P. Lindenfors.2007. Stature and sexual dimorphism in Sweden, from the10th to the end of the 20th century. American Journal ofHuman Biology 19:861–870.
Guthrie, R. D. 1984. Alaskan megabucks, megabulls, andmegagrams: the issue of Pleistocene gigantism. Pages 482–510in H. H. Genoways, and M. R. Dawson, editors. Contribu-tions in Quaternary vertebrate paleontology: a volume inmemorial to John E. Guilday. Special Publication No. 8.Carnegie Museum of Natural History, Pittsburgh, Pennsyl-vania, USA.
Guthrie, R. D. 2003. Rapid body size decline in AlaskanPleistocene horses before extinction. Nature 426:169–171.
Hails, C. J. 1982. A comparison of tropical and temperate aerialinsect abundance. Biotropica 14:310–313.
Hamilton, S., B. Popkin, and D. Spicer. 1984. Women andnutrition in third world countries. Praeger, New York, NewYork, USA.
Hamilton, T. H. 1961. The adaptive significances of intraspe-cific trends in wing length and body size among bird species.Evolution 15:180–195.
Hansen, L. P., C. M. Nixon, and J. Berringer. 1997. Role ofrefuges in the dynamics of outlying deer populations: twoexamples from the agricultural Midwest. Pages 327–345 inW. J. McShea, H. B. Underwood, and J. H. Rappole, editors.The science of overabundance: deer ecology and populationmanagement. Smithsonian Books, Washington, D.C., USA.
Harlow, H. J., T. Lohuis, R. G. Grogan, and T. D. I. Beck.2002. Body mass and lipid changes by hibernating reproduc-tive and nonreproductive black bears (Ursus americanus).Journal of Mammalogy 83:1020–1025.
Harlow, R. F. 1962. Osteometric data for the Florida blackbear. Quarterly Journal of the Florida Academy of Sciences24:258–274.
Harper, J. L. 1977. Population biology of plants. AcademicPress, New York, New York, USA.
Hawkins, B. A., and J. H. Lawton. 1995. Latitudinal gradientsin butterfly body sizes: is there a general pattern? Oecologia102:31–36.
August 2011 397eNPP AND BODY SIZE
CONCEPTS&SYNTHESIS
Heaney, L. R. 1984. Climatic influences on life-history tacticsand behavior of North American tree squirrels. Pages 43–78in J. O. Murie, and J. R. Michener, editors. The biology ofground-dwelling squirrels. University of Nebraska Press,Lincoln, Nebraska, USA.
Heijmans, B. T., E. W. Tobi, A. D. Stein, H. Putter, G. J.Blauw, E. S. Susser, P. E. Slagboom, and L. H. Lumey. 2008.Persistent epigenetic differences associated with prenatalexposure to famine in humans. Proceedings of the NationalAcademy of Sciences USA 105:17046–17049.
Hellgren, E. C., L. L. Rogers, and U. S. Seal. 1993. Serumchemistry and hematology of black bears: physiologicalindices of habitat quality or seasonal patterns? Journal ofMammalogy 74:304–315.
Hemmingsen, A. M. 1960. Metabolism in relation to body size.Report of the Steno Memorial Hospital Nordisk Insulin Lab9:1–110.
Henry, W. A. 1898. Feeds and feeding: a handbook for thestudent and stockman. First edition published by the author,Madison, Wisconsin, USA.
Henry, W. A., and F. B. Morrison. 1923. Feeds and feeding: ahandbook for the student and stockman. 23rd edition.Henry-Morrison Company, Madison, Wisconsin, USA.
Hesselton, W. T., and R. A. M. Hesselton. 1982. White-taileddeer (Odocoileus virginianus). Pages 878–901 in J. A. Chap-man, and G. A. Feldhamer, editors. Wild animals of NorthAmerica: biology, management, economics. Johns HopkinsUniversity Press, Baltimore, Maryland, USA.
Hewison, A. J. M., J. M. Gaillard, J. M. Angibault, G. VanLaere, and J. P. Vincent. 2002. The influence of density onpost-weaning growth in roe deer Capreolus capreolus fawns.Journal of Zoology 257:303–309.
Hiernaux, J. 1975. The people of Africa. Charles Schribner’sSons, New York, New York, USA.
Hilderbrand, G. V., S. G. Jenkins, C. C. Schwartz, T. A.Hanley, and C. T. Robbins. 1999a. Effect of seasonaldifferences in dietary meat intake on changes in body massand composition in wild and captive brown bears. CanadianJournal of Zoology 77:1623–1630.
Hilderbrand, G. V., C. C. Schwartz, C. T. Robbins, M. E.Jacoby, T. A. Hanley, S. M. Arthur, and C. Servheen. 1999b.The importance of meat, particularly salmon, to body size,population productivity, and conservation of North Amer-ican brown bears. Canadian Journal of Zoology 77:132–138.
Hill, M. E., M. G. Hill, and C. C. Widga. 2008. LateQuaternary bison diminution on the Great Plains of NorthAmerica: evaluating the role of human hunting versus climatechange. Quaternary Science Reviews 27:1752–1771.
Himes, J. H., and W. H. Mueller. 1977. Age associated staturalloss and socioeconomic status. Journal of the AmericanGeriatrical Society 25:171–174.
Ho, C.-K., S. C. Pennings, and T. H. Carefoot. 2010. Is dietquality an overlooked mechanism for Bergmann’s rule?American Naturalist 175:269–276.
Holliday, T. W. 1997. Body proportions in Late PleistoceneEurope and modern human origins. Journal of HumanEvolution 32:423–447.
Holt, B. M. 2003. Mobility in Upper Paleolithic and MesolithicEurope: evidence from the lower limb. American Journal ofPhysical Anthropology 122:200–215.
Holt, B. M., and V. Formicola. 2008. Hunters of the Ice Age:the biology of Upper Paleolithic people. Yearbook ofPhysical Anthropology 51:70–99.
Hooijer, D. A. 1950. The study of subspecific advance in thequaternary. Evolution 4:360–361.
Huston, M. A. 1979. A general hypothesis of species diversity.American Naturalist 113:81–101.
Huston, M. A. 1980. Soil nutrients and tree species richness inCosta Rican forests. Journal of Biogeography 7:147–157.
Huston, M. A. 1985. Patterns of species diversity on coral reefs.Annual Review of Ecology and Systematics 16:149–177.
Huston, M. A. 1986. Size bimodality in plant populations: analternative hypothesis. Ecology 67:265–269.
Huston, M. A. 1993. Biological diversity, soils, and economics.Science 262:1676–1680.
Huston, M. A. 1994. Biological diversity: the coexistence ofspecies on changing landscapes. Cambridge University Press,Cambridge, UK.
Huston, M. A. 1999a. Local processes and regional patterns:appropriate scales for understanding variation in thediversity of plants and animals. Oikos 86:393–401.
Huston, M. A. 1999b. Forest productivity and diversity: usingecological theory and landscape models to guide sustainableforest management. Pages 329–341 in C. Aguirre-Bravo, andC. R. Franco, editors. North American science symposium:toward a unified framework for inventorying and monitoringforest ecosystem resources. USDA Forest Service Proceed-ings RMRS-P-12. USDA Forest Service, Washington, D.C.,USA.
Huston, M. A. 2002. Introductory essay: critical issues forimproving predictions. Pages 7–21 in J. M. Scott, et al.,editors. Predicting species occurrences: issues of scale andaccuracy. Island Press, Washington, D.C., USA.
Huston, M. A. 2004. Management strategies for plantinvasions: manipulating productivity, disturbance, and com-petition. Diversity and Distributions 10:167–178.
Huston, M. A. 2005. The three phases of land-use change:implications for biodiversity. Ecological Applications15:1864–1878.
Huston, M. A., and D. L. DeAngelis. 1987. Size bimodality inmonospecific populations: a review of potential mechanisms.American Naturalist 129:678–707.
Huston, M. A., and D. L. DeAngelis. 1994. Competition andcoexistence: the effects of resource transport and supplyrates. American Naturalist 144:954–977.
Huston, M. A., D. L. DeAngelis, and W. M. Post. 1988. Newcomputer models unify ecological theory. BioScience 38:682–692.
Huston, M. A., G. McVicker, and J. Nielsen. 1999. Afunctional approach to ecosystem management: implicationsfor species diversity. Pages 45–85 in R. C. Szaro, N. C.Johnson, W. T. Sexton, and A. J. Malk, editors. Ecologicalstewardship: a common reference for ecosystem manage-ment. Volume II. Elsevier Science, Oxford, UK.
Huston, M. A., and T. M. Smith. 1987. Plant succession: lifehistory and competition. American Naturalist 130:168–198.
Huston, M. A., and S. Wolverton. 2009. The global distributionof net primary production: resolving the paradox. EcologicalMonographs 79:343–377.
Hutchins, M. 1995. Olympic mountain goat controversycontinues. Conservation Biology 9:1324–1326.
Hyams, E. S. 1952. Soil and civilization. Thames and Hudson,London, UK.
Ibanez, L., N. Potau, and F. de Zegher. 2000. Ovarianhyporesponsiveness to follicle stimulating hormone inadolescent girls born small for gestational age. Journal ofClinical Endocrinology and Metabolism 85:2624–2626.
Ibanez, L., N. Potau, G. Enriquez, M. V. Marcos, and F. deZegher. 2003. Hypergonado-trophinaemia with reduceduterine and ovarian size in women born small for gestationalage. Human Reproduction 18:1565–1569.
Ibanez, L., N. Potau, A. Ferrer, F. Rodriguez-Hierro, M. V.Marcos, and F. de Zegher. 2002. Reduced ovulation rate inadolescent girls born small for gestational age. Journal ofClinical Endocrinology and Metabolism 87:3391–3393.
Imsland, A. K., A. Foss, A. Folkvord, S. O. Stefansson, andT. M. Jonassen. 2005. The interrelation between temperatureregimes and fish size in juvenile Atlantic cod (Gadus morhua):effects on growth and feed conversion efficiency. FishPhysiology and Biochemistry 31:347–361.
Imsland, A. K., L. M. Sunde, A. Folkvord, and S. O.Stefansson. 1996. The interaction of temperature and fish
MICHAEL A. HUSTON AND STEVE WOLVERTON398 Ecological MonographsVol. 81, No. 3
CONCEPTS&SYNTHESIS

size on growth of juvenile turbot. Journal of Fish Biology49:926–940.
Iriarte, J. A., W. L. Franklin, W. E. Johnson, and K. H.Redford. 1990. Biogeographic variation of food habits andbody size of the American puma. Oecologia 85:185–190.
Jacobson, H. A. 1984. Relationships between deer and soilnutrients in Mississippi. Proceedings of the Annual of theSoutheastern Association of Fish and Wildlife Agencies 38:1–12.
Jacobson, H. A., D. C. Guynn, L. F. Castle, and E. J. Hackett.1977. Relationships between soil characteristics and bodyweights, antler measurements, and reproduction of white-tailed deer in Mississippi. Pages 47–55 in Proceedings of theJoint Northeast-Southeast Deer Study Group. VirginiaCommonwealth Game and Inland Fish Commission, Rich-mond, Virginia, USA.
James, F. C. 1970. Geographic size variation in birds and itsrelationship to climate. Ecology 51:365–390.
Johnson, C. N. 1998a. Rarity in the tropics: latitudinalgradients in distribution and abundance in Australianmammals. Journal of Animal Ecology 67:689–698.
Johnson, C. N. 1998b. Species extinction and the relationshipbetween distribution and abundance. Nature 394:272–274.
Johnson, C. N., K. Vernes, and A. Payne. 2005. Demography inrelation to population density in two herbivorous marsupials:testing for source–sink dynamics versus independent regula-tion of population size. Oecologia 143:70–76.
Jones, B. A., R. A. How, and D. J. Kitchener. 1994. A fieldstudy of Pseudocheirus occidentalis (Marsupialia:Petauridae). I. Distribution and habitat. Wildlife Research21:175–187.
Jones, D. Y., M. C. Nesheim, and J.-P. Habicht. 1985.Influences in child growth associated with poverty in the1970s: an examination of the HANES I and HANES II,cross-sectional U.S. surveys. American Journal of ClinicalNutrition 42:714–724.
Jones, P. D., S. Demarais, B. K. Strickland, and S. L. Edwards.2008. Soil region effects on white-tailed deer forage proteincontent. Southeastern Naturalist 7:595–606.
Jordan, P. A. 1987. Aquatic foraging and the sodium ecology ofmoose: a review. Swedish Wildlife Research Supplement1:119–137.
Kappeler, P. M., and E. W. Heymann. 1996. Nonconvergencein the evolution of primate life history and socio-ecology.Biological Journal of the Linnean Society 59:297–326.
Karanth, K. U., J. D. Nichols, N. S. Kumar, W. A. Link, andJ. E. Hines. 2004. Tigers and their prey: predicting carnivoredensities from prey abundance. Proceedings of the NationalAcademy of Sciences USA 101:4854–4757.
Kaspari, M. 2001. Taxonomic level, trophic biology and theregulation of local abundance. Global Ecology and Bioge-ography 10:229–244.
Kaspari, M. 2005. Global energy gradients and size in colonialorganisms: worker mass and worker number in ant colonies.Proceedings of the National Academy of Sciences USA102:5079–5083.
Kaspari, M., S. O’Donnell, and J. R. Kercher. 2000. Energy,density, and constraints to species richness: ant assemblagesalong a productivity gradient. American Naturalist 155:280–293.
Kaspari, M., and E. Vargo. 1995. Colony size as a bufferagainst seasonality: Bergmann’s rule in social insects.American Naturalist 145:610–623.
Kavanagh, R. P., and M. J. Lambert. 1990. Food selection bythe greater glider, Petauroides volans: is foliar nitrogen adeterminant of habitat quality? Australian Wildlife Research17:285–300.
Kennedy, M. L., P. K. Kennedy, M. A. Bogan, and J. L. Waits.2002. Geographic variation in the black bear (Ursusamericanus) in the eastern United States and Canada.Southwestern Naturalist 47:257–266.
Kennedy, M. L., and S. L. Lindsay. 1984. Morphologicvariation in the raccoon, Procyon lotor, and its relationshipto genic and environmental variation. Journal of Mammal-ogy 65:195–205.
Khan, M. R., and F. Ahmed. 2005. Physical status, nutrientintake and dietary pattern of adolescent female factoryworkers in urban Bangladesh. Asia Pacific Journal of ClinicalNutrition 14:19–26.
Kie, J. G., M. White, and D. L. Drawe. 1983. Conditionparameters of white-tailed deer in Texas. Journal of WildlifeManagement 47:583–594.
Kirchengast, S. 2000. Differential reproductive success andbody size in !Kung San people from northern Namibia.Collegium Anthropologicum 24:121–132.
Kjellander, P., J. M. Gaillard, and A. J. M. Hewison. 2006.Density-dependent responses of fawn cohort body mass intwo contrasting roe deer populations. Oecologia 146:521–530.
Klein, D. R., M. Meldgaard, and S. G. Fancy. 1987. Factorsdetermining leg length in Rangifer tarandus. Journal ofMammalogy 68:642–655.
Klenner, W., and D. W. Kroeker. 1990. Denning behavior ofblack bears, Ursus americanus, in western Manitoba.Canadian Field Naturalist 104:540–544.
Kojola, I., and H. Laitala. 2001. Body size variation of brownbear in Finland. Annales Zoologici Fennici 38:173–178.
Komlos, J. 1996. The biological standard of living in Europeand America, 1700–1900. University of Chicago Press,Chicago, Illinois, USA.
Kooijman, S. A. L. M. 1986. Energy budgets can explain bodysize relations. Journal of Theoretical Biology 121:269–282.
Kuhn, T. S. 1962. The structure of scientific revolutions.University of Chicago Press, Chicago, Illinois, USA.
Kurten, B. 1963. Fossil bears from Texas. The Pearce-SellardsSeries, Texas Memorial Museum 1:1–15.
Kurten, B. 1973. Geographic variation in size in the puma (Felisconcolor). Commentationes Biologicae 63:3–8.
Kurten, B. 1976. The cave bear story. Columbia UniversityPress, New York, New York, USA.
Kurten, B., and E. Anderson. 1980. Pleistocene mammals ofNorth America. Columbia University Press, New York, NewYork, USA.
Kuuppo, P. 1994. Annual variation in the abundance and sizeof heterotrophic nanoflagellates on the SW coast of Finland,the Baltic Sea. Journal of Plankton Research 16:1525–1542.
Kuzawa, C. W. 2007. Developmental origins of life history:growth, productivity, and reproduction. American Journal ofHuman Biology 19:654–661.
Lack, D. 1947. The significance of clutch size, Part I. Ibis89:302–352.
Lack, D. 1948. The significance of clutch size, Part II. Ibis90:24–45.
Lack, D. 1968. Ecological adaptations for breeding in birds.Methuen, London, UK.
Lack, D., and R. E. Moreau. 1965. Clutch size in tropical birdsof forest and savanna. Oiseau 35:76–89.
Langvatn, R., and S. D. Albon. 1986. Geographic clines inbody weight of Norwegian red deer: a novel explanation ofBergmann’s Rule. Holarctic Ecology 9:285–293.
Lariviere, S. 2001. Ursus americanus. Mammalian Species647:1–11.
Lasker, G. W. 1969. Human biological adaptability. Science166:1480–1486.
Lasker, G. W., and R. Thomas. 1976. Relationship betweenreproductive fitness and anthropometric dimensions in aMexican population. Human Biology 48:775–791.
Lee, R. B. 2003. The Dobe Ju/’hoansi. Third edition. Wads-worth/Thomson Learning, Toronto, Ontario, Canada.
Leimar, O. 1996. Life-history analysis of the Trivers andWillard sex-ratio problem. Behavioral Ecology 7:316–325.
Leith, H., and R. H. Whittaker. 1975. Primary productivity ofthe biosphere. Springer-Verlag, New York, New York, USA.
August 2011 399eNPP AND BODY SIZE
CONCEPTS&SYNTHESIS

Leon, D., and G. Walt, editors. 2000. Poverty, inequality, andhealth. Oxford University Press, Oxford, UK.
Leopold, A. S. 1947. A survey of over-populated deer ranges inthe United States. Journal of Wildlife Management 11:162–177.
Leopold, A. S. 1950. Deer in relation to succession. NorthAmerican Wildlife Conference 15:571–580.
Lesage, L., M. Crete, J. Huot, and J. P. Ouellet. 2001. Evidencefor a trade-off between growth and body reserves in northernwhite-tailed deer. Oecologia 126:30–41.
Lindeman, R. L. 1942. The trophic-dynamic aspects of ecology.Ecology 23:399–417.
Lindsey, C. C. 1966. Body sizes of poikilotherm vertebrates atdifferent latitudes. Evolution 20:456–465.
Lindstedt, S. L., and M. S. Boyce. 1985. Seasonality, fastingendurance, and body size in mammals. American Naturalist125:873–878.
Lonsdale, W. M., and A. R. Watkinson. 1983. Plant geometryand self-thinning. Journal of Ecology 71:285–297.
Lord, R. D. 1960. Litter size and latitude in North Americanmammals. American Midland Naturalist 64:488–499.
Lyman, R. L. 2004a. Late-Quaternary diminution and abun-dance of prehistoric bison (Bison sp.) in eastern Washingtonstate, U.S.A. Quaternary Research 62:76–85.
Lyman, R. L. 2004b. Prehistoric biogeography, abundance, andphenotypic plasticity of elk (Cervus elaphus) in Washingtonstate. Pages 136–163 in R. L. Lyman, and K. P. Cannon,editors. Zooarchaeology and conservation biology. Univer-sity of Utah Press, Salt Lake City, Utah, USA.
Lyman, R. L., and M. J. O’Brien. 2005. Within-taxonmorphological diversity in late-Quaternary Neotoma as apaleoenvironmental indicator, Bonneville Basin, Northwest-ern, Utah, USA. Quaternary Research 63:274–282.
Lyman, R. L., and S. Wolverton. 2002. The late prehistoric–early historic game sink in the northwestern United States.Conservation Biology 16:73–85.
Maehr, D. S., E. C. Hellgren, R. L. Bingham, and D. L. Doan-Crider. 2001. Body mass of American black bears fromFlorida and Mexico. Southwestern Naturalist 46:129–133.
Makarieva, A. M., V. G. Gorshkov, and B.-L. Li. 2005.Temperature-associated upper limits to body size in terres-trial poikilotherms. Oikos 111:425–436.
Malina, R. M., B. B. Little, M. P. Stern, S. P. Gaskill, and H. P.Hazuda. 1983. Ethnic and social class differences in selectedanthropometric characteristics of Mexican American andAnglo adults: the San Antionio Heart Study. Human Biology55:867–883.
Malville, N. J. 1997. Enamel hypoplasia in Ancestral Puebloanpopulations from Southwestern Colorado: I. Permanentdentition. American Journal of Physical Anthropology102:351–367.
Margalef, R. 1955. Temperatura, dimensiones, y evolucion.Publicaciones del Instituto de Biologia Aplicada 19:13–94.
Martin, R. D. 1990. Primate origins and evolution. Chapmanand Hall, London, UK.
May, L. A., and J. K. Loosli. 1962. Animal nutrition. McGraw-Hill, New York, New York, USA.
McCullough, D. R. 1979. The George Deer Reserve deer herd:population ecology of a K-selected species. University ofMichigan Press, Ann Arbor, Michigan, USA.
McCullough, D. R. 1982a. Antler characteristics of the GeorgeReserve white-tailed deer. Journal of Wildlife Management46:821–826.
McCullough, D. R. 1982b. Population growth rate of theGeorge Reserve deer herd. Journal of Wildlife Management46:1079–1083.
McCullough, D. R. 1984. Lessons from the George Reserve,Michigan. Pages 211–242 in L. K. Halls, editor. White-taileddeer ecology and management. Stackpole Books, Harrisburg,Pennsylvania, USA.
McCullough, D. R. 1997. Irruptive behavior in ungulates.Pages 69–98 in W. J. McShea, H. B. Underwood, and J. H.
Rappole, editors. The science of overabundance: deerecology and population management. Smithsonian Books,Washington, D.C., USA.
McElwain, J. C., D. J. Beerling, and F. I. Woodward. 1999.Fossil plants and global warming at the Triassic-Jurassicboundary. Science 285:1386–1390.
McGrew, J. C., Jr., and C. B. Monroe. 2000. An introduction tostatistical problem solving in geography. Second edition.McGraw Hill, Boston, Massachusetts, USA.
McKey, D. B., P. G. Waterman, C. N. Mbi, J. S. Gartlan, andT. T. Struhsaker. 1978. Phenolic content of vegetation in twoAfrican rain-forests: ecological implications. Science 202:61–64.
McNab, B. K. 1971. On the ecological significance ofBergmann’s rule. Ecology 52:845–854.
McNab, B. K. 1983. Energetics, body size, and the limits toendothermy. Journal of Zoology London 199:1–29.
McNab, B. K. 2010. Geographic and temporal correlations ofmammalian size reconsidered: a resource rule. Oecologia164:13–23.
McShea, W. J., H. B. Underwood, and J. H. Rappole, editors.1997. The science of overabundance: deer ecology andpopulation management. Smithsonian Books, Washington,D.C., USA.
Meggers, B. J. 1971. Amazonia: man and culture in acounterfeit paradise. Aldine-Atherton, Chicago, Illinois,USA.
Meiri, S. 2011. Bergmann’s rule—what’s in a name? GlobalEcology and Biogeography 20:203–207.
Meiri, S., and T. Dayan. 2003. On the validity of Bergmann’srule. Journal of Biogeography 30:331–351.
Meiri, S., T. Dayan, and D. Simberloff. 2004. Carnivores,biases and Bergmann’s rule. Biological Journal of theLinnean Society 81:579–588.
Meiri, S., and G. H. Thomas. 2007. The geography of bodysize—challenges of the interspecific approach. Global Ecol-ogy and Biogeography 16:689–693.
Meiri, S., Y. Yom-Tov, and E. Geffen. 2007. What determinesconformity to Bergmann’s rule? Global Ecology andBiogeography 16:788–794.
Meng, X., and N. Qian. 2009. The long term consequences offamine on survivors: evidence from a unique naturalexperiment using China’s Great Famine. Working Paper14917. Natural Bureau of Economic Research, Cambridge,Massachusetts, USA.
Mittelbach, G., et al. 2007. Evolution and the latitudinaldiversity gradient: speciation, extinction, and biogeography.Ecology Letters 10:315–331.
Moffat, T., and T. Galloway. 2007. Adverse environments:investigating local variation in child growth. AmericanJournal of Human Biology 19:676–683.
Monden, C. W. S., and J. Smits. 2009. Maternal height andchild mortality in 42 developing countries. American Journalof Human Biology 21:305–311.
Mondolfi, E., and R. Hoogesteijn. 1986. Notes on the biologyand status of the jaguar in Venezuela. Pages 125–146 in S. D.Miller, and D. D. Everett, editors. Cats of the world :biology, conservation, and management. National WildlifeFederation, Washington, D.C., USA.
Moore, J. C. 1961. Geographic variation in some reproductivecharacteristics of diurnal squirrels. Bulletin of the AmericanMuseum of Natural History 122:1–32.
Moreno, R. S., R. W. Kays, and R. Samudio, Jr. 2006.Competitive release in diets of ocelot (Leopardus pardalis)and puma (Puma concolor) after jaguar (Panthera onca)decline. Journal of Mammalogy 87:808–816.
Moritz, C., J. L. Patton, C. J. Schneider, and T. B. Smith. 2000.Diversification of rainforest faunas: an integrated molecularapproach. Annual Review of Ecology and Systematics31:533–563.
MICHAEL A. HUSTON AND STEVE WOLVERTON400 Ecological MonographsVol. 81, No. 3
CONCEPTS&SYNTHESIS

Morris, E. C., and P. J. Myerscough. 1991. Self-thinning andcompetition intensity over a gradient of nutrient availability.Journal of Ecology 79:903–923.
Morris, I. 2005. Archaeology, standards of living, and Greekeconomic history. Pages 91–126 in J. G. Manning, and I.Morris, editors. The ancient economy: evidence and models.Stanford University Press, Stanford, California, USA.
Moulds, M. S. 2003. An appraisal of the Cicadas of the genusAbricta Stal and allied genera (Hemiptera: Auchenorrhyn-cha: Cicadidae). Records of the Australian Museum 55:245–304.
Mueller, W. H. 1979. Fertility and physique in a malnourishedpopulation. Human Biology 51:153–166.
Mugaas, J. N., and J. Seidensticker. 1993. Geographic variationof lean body mass and a model of its effects on the capacityof the raccoon to fatten and fast. Bulletin of the FloridaMuseum of Natural History Biological Sciences 36:85–107.
Murphy, D. A., and J. A. Coates. 1966. Effects of dietaryprotein on deer. North American Wildlife and NaturalResources Conference 31:129–139.
Murphy, D. A., and W. R. Porath. 1969. Forest soils and gamenutrition. Proceedings of the Southeastern Association ofGame and Fish Commissioners 23:18–25.
Myneni, R. B., J. Dong, C. J. Tucker, R. K. Kaufmann, P. E.Kauppi, J. Liski, L. Zhou, V. Alexeyev, and M. K. Hughes.2001. A large carbon sink in the woody biomass of northernforests. Proceedings of the National Academy of ScienceUSA 98:147840–114789.
Mysterud, A., R. Langvatn, N. G. Yoccoz, and N. C. Stenseth.2001a. Plant phenology, migration and geographical varia-tion in body weight of a large herbivore: the effect of avariable topography. Journal of Animal Ecology 70:915–923.
Mysterud, A., R. Langvatn, N. G. Yoccoz, and N. C. Stenseth.2002. Large-scale habitat variability, delayed density effectsand red deer populations in Norway. Journal of AnimalEcology 71:569–580.
Mysterud, A., F. J. Perez-Barberia, and I. J. Gordon. 2001b.The effect of season, sex and feeding style on home rangearea versus body mass scaling in temperate ruminants.Oecologia 127:30–39.
Mysterud, A., N. G. Yoccoz, N. C. Stenseth, and R. Langvatn.2001c. Effects of age, sex and density on body weight ofNorwegian red deer: evidence of density-dependent senes-cence. Proceedings of the Royal Society B 268:911–919.
Nagel, W. O. 1943. A study of the economic value, distribution,trends, and soil relationships of Missouri furbearers. Reportof the Missouri Federal Aid to Wildlife Research Project–Pitman-Robertson Program, Mo. 1-5R. Volume VIII.Missouri State Archives, Jefferson City, Missouri, USA.
Nagy, L. R., and R. T. Holmes. 2005. Food limits annualfecundity of a migratory songbird: an experimental study.Ecology 86:675–681.
National Research Council. 1976. Nutrient requirements ofbeef cattle. National Research Council. National Academy ofSciences, Washington, D.C., USA.
Nellemann, C. 1996. Terrain selection by reindeer in late winterin central Norway. Arctic 49:339–347.
Newman, M. T. 1953. The application of ecological rules to theracial anthropology of the aboriginal New World. AmericanAnthropologist 55:311–327.
Nixon, C. M., L. P. Hansen, P. A. Brewer, and J. E. Chelsvig.1991. Ecology of white-tailed deer in an intensively farmedregion of Illinois. Wildlife Monographs 118.
Noren, C. R. 1943. Progress report of investigation of raccoon.Missouri Federal Aid to Wildlife Research Project No. 1-5R.Volume VIII. Missouri State Archives, Jefferson City,Missouri, USA.
Nowak, R. M. 1999. Walker’s primates of the world. JohnsHopkins University Press, Baltimore, Maryland, USA.
Nowak, R. M., and J. L. Paradiso. 1983. Walker’s mammals ofthe world. Johns Hopkins University Press, Baltimore,Maryland, USA.
Ogzul, A., D. Z. Childs, M. K. Oli, K. B. Armitage, D. T.Blumstein, L. E. Olson, S. Tuljapurkar, and T. Coulson.2010. Coupled dynamics of body mass and populationgrowth in response to environmental change. Nature 466:482.
Olden, J. D., Z. S. Hogan, and M. J. Vander Zanden. 2007.Small fish, big fish, red fish, blue fish: size biased extinctionrisk of the world’s freshwater and marine fishes. GlobalEcology and Biogeography 16:694–701.
Olson, R. J., K. R. Johnson, D. L. Zheng, and J. M. O.Scurlock. 2001a. Global and regional ecosystem modeling:databases of model drivers and validation measurements.ORNL/TM-2001/196. Oak Ridge National Laboratory. OakRidge, Tennessee, USA.
Olson, R. J., J. M. O. Scurlock, S. D. Prince, D. L. Zhang, andK. R. Johnson, editors. 2001b. NPP multi-biome: globalprimary production data initiative products. Oak RidgeNational Laboratory Distributed Active Archive Center,Oak Ridge, Tennessee, USA. hhttp://www.daac.ornl.gov/i
Olson, J. S., J. S. Watts, and L. J. Allison. 1983. Carbon in livevegetation of major world ecosystems. Publication ORNL-5882. Oak Ridge National Laboratory, Oak Ridge, Tennes-see, USA. hhttp://cdiac.esd.ornl.gov/ftp/ndp017/i
Owen-Smith, N. 1988. Megaherbivores: the influence of verylarge body size on ecology. Cambridge University Press, NewYork, New York, USA.
Owen-Smith, N. 2002. Adaptive herbivore ecology: fromresources to populations in variable environments. Cam-bridge University Press, Cambridge, UK.
Owen-Smith, N., and M. G. L. Mills. 2008. Predator–prey sizerelationships in an African large-mammal food web. Journalof Animal Ecology 77:173–183.
Palmer, M. W. 1994. Variation in species richness: towards aunification of hypotheses. Folia Geobotica Phytotaxa, Praha29:511–530.
Parker, G., and L. M. Smith, editors. 1997. The general crisis ofthe seventeenth century. Routledge, New York, New York,USA.
Parker, K. L., P. S. Barboza, and T. R. Stephenson. 2005.Protein conservation in female caribou (Rangifer tarandus):effects of decreasing diet quality during winter. Journal ofMammalogy 86:610–622.
Pauly, D. 1980. On the interrelationships between naturalmortality, growth parameters, and mean environmentaltemperature in 175 fish stocks. Journal du Conseil Interna-tional Pour l’Exploration de la Mer 39:175–192.
Pauly, D. 1981. The relationships between gill surface area andgrowth performance in fish: a generalization of vonBertalanffy’s theory of growth. Berichte Deutschen Wissen-schaftlichen Kommission fur Meeresforschung 28:251–282.
Pauly, D., V. Christensen, J. Dalsgaard, R. Froese, and F. C.Torres, Jr. 1998. Fishing down marine food webs. Science279:860–863.
Pauly, D., V. Christensen, S. Guenette, T. J. Pitcher, U. R.Sumaila, C. J. Walters, R. Watson, and D. Zeller. 2002.Towards sustainability in world fisheries. Nature 418:689–695.
Pelton, M. R. 1982. Black bear (Ursus americanus). Pages 504–514 in J. A. Chapman, and G. A. Feldhamer, editors. Wildanimals of North America: biology, management, economics.Johns Hopkins University Press, Baltimore, Maryland, USA.
Pelton, M. R. 2000. Black bear. Pages 389–408 in S. Demarais,and P. R. Krausman, editors. Ecology and management oflarge mammals in North America. Prentice Hall, UpperSaddle River, New Jersey, USA.
Pembrey, M. E., et al. 2006. Sex-specific, male-line transgenera-tional responses in humans. European Journal of HumanGenetics 14:159–166.
Peters, R. H. 1983. The ecological implications of body size.Cambridge University Press, Cambridge, UK.
Pfennig, D. W., M. A. Wund, E. C. Snell-Rood, T.Cruickshank, C. D. Schlichting, and A. P. Moczek. 2010.
August 2011 401eNPP AND BODY SIZE
CONCEPTS&SYNTHESIS

Phenotypic plasticity’s impacts on diversification and speci-ation. Trends in Ecology and Evolution 25:459–467.
Pianka, E. R. 1966. Latitudinal gradients of species diversity: areview of concepts. American Naturalist 100:33–46.
Pidwirny, M. 2006. Introduction to the oceans. Chapter 8 inFundamentals of physical geography. Second edition. hhttp://www.physicalgeography.net/fundamentals/8o.htmli
Piechota, T., J. Timilsena, G. Tootle, and H. Hidalgo. 2004.The western U.S. drought: How bad is it? Eos 85:301–308.
Pollet, T. V., and D. Nettle. 2008. Taller women do better in astressed environment: height and reproductive success inrural Guatemalan women. American Journal of HumanBiology 20:264–269.
Pond, W. G., D. C. Church, and K. R. Pond. 1995. Basicanimal nutrition and feeding. Fourth edition. Wiley, NewYork, New York, USA.
Prasad, M., and H. Al-Taher. 2002. Maternal height and laboroutcome. Journal of Obstetrics and Gynecology 22:513–515.
Prince, J. M. 1995. Intersection of economics, history, andhuman biology: secular trends in stature in nineteenthcentury Sioux Indians. Human Biology 67:387–406.
Prosser, C. L. 1973. Oxygen: respiration and metabolism. Pages165–211 in C. L. Prosser, editor. Comparative animalphysiology. W.B. Saunders Company, Philadelphia, Penn-sylvania, USA.
Purdue, J. R. 1987. Estimation of body weight of white-taileddeer (Odocoileus virginianus) from central Illinois. Journal ofEthnobiology 7:1–12.
Purdue, J. R. 1989. Changes during the Holocene in the size ofwhite-tailed deer (Odocoileus virginianus) from centralIllinois. Quaternary Research 32:307–316.
Purdue, J. R., M. H. Smith, and J. C. Patton. 2000. Femalephilopatry and extreme spatial genetic heterogeneity in white-tailed deer. Journal of Mammalogy 81:179–185.
Purvis, A. 1995. A composite estimate of primate phylogeny.Philosophical Transactions of the Royal Society B 348:405–421.
Purvis, A., J. L. Gittleman, G. Cowlishaw, and G. M. Mace.2000. Predicting extinction risk in declining species. Proceed-ings of the Royal Society B 267:1947–1952.
Quin, D. G., A. P. Smith, and T. W. Norton. 1996. Eco-geographic variation in size and sexual dimorphism in SugarGliders and Squirrel Gliders (Marsupialia: Petauridae).Australian Journal of Zoology 44:19–45.
Rabinowitz, A. R., and B. G. Nottingham. 1986. Ecology andbehaviour of the jaguar (Panthera onca) in Belize, CentralAmerica. Journal of Zoology (London) 210:149–159.
Rao, S., and P. Apte. 2009. Social class-related gradient in theassociation of skeletal growth with blood pressure amongadolescent boys in India. Public Health Nutrition 12:2256–2262.
Rausch, R. L. 1963. Geographic variation in size in NorthAmerican Brown Bears, Ursus arctos L., as indicated bycondylobasal length. Canadian Journal of Zoology 41:33–45.
Ray, C. 1960. The application of Bergmann’s and Allen’s rulesto the poikilotherms. Journal of Morphology 106:85–108.
Reimers, E., D. R. Klein, and R. Sørumgard. 1983. Calvingtime, growth rate, and body size of Norwegian reindeer ondifferent ranges. Arctic and Alpine Research 15:107–118.
Richter, D. D., and L. I. Babbar. 1991. Soil diversity in thetropics. Advances in Ecological Research 21:316–389.
Ricklefs, R. E. 1970. Clutch size in birds: outcome of opposingpredator and prey adaptations. Science 168:599–600.
Roberts, D. F. 1953. Body weight, race and climate. AmericanJournal of Physical Anthropology 11:533–558.
Roberts, D. F. 1978. Climate and human variability. Secondedition. Cummings, Menlo Park, California, USA.
Rodrıguez, M. A., I. L. Lopez-Sanudo, and B. A. Hawkins.2006. The geographic distribution of mammal body size inEurope. Global Ecology and Biogeography 15:173–181.
Rolston, H., III. 1988. Environmental ethics: duties and valuesin the natural world. Temple University Press, Philadelphia,Pennsylvania, USA.
Rooney, T. P. 2001. Deer impacts on forest ecosystems: a NorthAmerican perspective. Forestry 74:201–208.
Rooney, T. P., and D. M. Waller. 2003. Direct and indirecteffects of deer in forest ecosystems. Forest Ecology andManagement 181:165–176.
Roseboom, T., S. de Rooij, and R. Painter. 2006. The Dutchfamine and its long-term consequences for adult health. EarlyHuman Development 82:485–491.
Rosenzweig, M. L. 1966. Community structure in sympatricCarnivora. Journal of Mammalogy 47:602–612.
Rosenzweig, M. L. 1968a. The strategy of body size inmammalian carnivores. American Midland Naturalist80:299–315.
Rosenzweig, M. L. 1968b. Net primary productivity ofterrestrial communities: prediction from climatological data.American Naturalist 102:67–74.
Rozzi, R. 1999. The reciprocal links between evolutionary-ecological sciences and environmental ethics. BioScience49:911–921.
Ruff, C. 2002. Variation in human body size and shape. AnnualReview of Anthropology 31:211–232.
Ruff, C. B. 1994. Morphological adaptation to climate inmodern and fossil hominids. Yearbook of Physical Anthro-pology 37:65–107.
Ruff, C. B., and A. Walker. 1993. Body size and body shape.Pages 234–265 in A. Walker, and R. Leakey, editors. TheNariokotome Homo erectus skeleton. Harvard UniversityPress, Cambridge, Massachusetts, USA.
Ryel, L. A., L. D. Fay, and R. C. Van Eiten. 1961. Validity ofage determination in Michigan deer. Michigan Academy ofScience, Arts and Letters 46:289–316.
Samson, C., and J. Huot. 1995. Reproductive biology of femaleblack bears in relation to body mass in early winter. Journalof Mammalogy 76:68–77.
Sand, H., G. Cederlund, and K. Danell. 1995. Geographicaland latitudinal variation in growth patterns and adult bodysize in Swedish moose (Alces alces). Oecologia 102:433–442.
Saugier, B., J. Roy, and H. A. Mooney. 2001. Estimations ofglobal terrestrial productivity: converging toward a singlenumber? Pages 543–557 in J. Roy, B. Saugier, and H. A.Mooney, editors. Terrestrial global productivity. AcademicPress, San Diego, California, USA.
Scarr, S. 1981. Race, social class, and individual differences inI.Q.: new studies of old issues. Erlbaum, Hillsdale, NewJersey, USA.
Scarr-Salapatek, S. 1971. Race, social class, and IQ. Science174:1285–1295.
Scarre, C., editor. 2009. The human past: world prehistory andthe development of human societies. Second edition. Thamesand Hudson, London, UK.
Schaller, G. B., and J. M. C. Vasconcelos. 1978. Jaguarpredation on capybara. Zeitschrift fur Saugetierk 43:296–301.
Schell, L. M., and P. D. Magnus. 2007. Is there an elephant inthe room? Addressing rival approaches to the interpretationof growth perturbation and small size. American Journal ofHuman Biology 19:606–614.
Schmidt, K. T., A. Stein, S. D. Albon, and F. E. Guiness. 2001.Antler length of yearling red deer is determined bypopulation density, weather and early life-history. Oecologia127:191–197.
Schooley, R. L., C. R. McLaughlin, G. J. Matula, and W. B.Krohn. 1994. Denning chronology of female black bears:effects of food, weather, and reproduction. Journal ofMammalogy 75:466–477.
Schreider, E. 1950. Geographical distribution of the body-weight/body-surface ratio. Nature 165:286.
Scognamillo, D., E. Maxit, M. Sunquist, and J. Polisar. 2003.Coexistence of jaguar (Panthera onca) and puma (Puma
MICHAEL A. HUSTON AND STEVE WOLVERTON402 Ecological MonographsVol. 81, No. 3
CONCEPTS&SYNTHESIS
concolor) in a mosaic landscape in the Venezuelan llanos.Journal of Zoology 259:269–279.
Sebastian, L. 1991. Sociopolitical complexity and the Chacosystem. Pages 109–143 in P. L. Crown, and W. J. Judge,editors. Chaco and Hohokam: prehistoric regional systems inthe American Southwest. School of American ResearchPress, Santa Fe, New Mexico, USA.
Shackelford, L. L. 2007. Regional variation in the postcranialrobusticity of Late Upper Paleolithic humans. AmericanJournal of Physical Anthropology 133:655–668.
Sheets, O. 1946. The relation of soil fertility to human nutrition.Mississippi State College, Agricultural Experiment StationBulletin No. 437. Mississippi State, Mississippi, USA.
Sherman, K., I. Belkin, K. D. Friedland, J. O’Reilly, and K.Hyde. 2009a. Accelerated warming and emergent trends infisheries biomass yields of the world’s large marine ecosys-tems. Pages 41–66 in K. Sherman, and G. Hempel, editors.The UNEP large marine ecosystem report: a perspective onchanging conditions in LMEs of the world’s regional seas.UNEP Regional Seas Report and Studies No. 182. UnitedNations Environment Programme, Nairobi, Kenya.
Sherman, K., I. Belkin, K. D. Friedland, J. O’Reilly, and K.Hyde. 2009b. Accelerated warming and emergent trends infisheries biomass yields of the world’s large marine ecosys-tems. Ambio 38:215–224.
Sherman, K., and G. Hempel, editors. 2009. The UNEP largemarine ecosystem report: a perspective on changing condi-tions in LMEs of the world’s regional seas. UNEP RegionalSeas Report and Studies No. 182. UNEP, Nairobi, Kenya.
Shipley, L. A., S. Blomquist, and K. Danell. 1998. Diet choicesby free-ranging moose in relation to plant distribution,chemistry and morphology in northern Sweden. CanadianJournal of Zoology 76:1–12.
Sikes, R. S., and M. L. Kennedy. 1992. Morphologic variationof the bobcat (Felis rufus) in the eastern United States and itsassociation with selected environmental variables. AmericanMidland Naturalist 128:313–324.
Silva, M., and J. A. Downing. 1995. CRC handbook ofmammalian body masses. CRC Press, Boca Raton, Florida,USA.
Silver, S. C., L. E. T. Ostro, L. K. Marsh, L. Maffei, A. J. Noss,M. J. Kelly, R. B. Wallace, H. Gomez, and G. Ayala. 2004.The use of camera traps for estimating jaguar Panthera oncaabundance and density using capture/recapture analysis.Oryx 38:148–154.
Simard, M. A., S. Cote, R. B. Weladji, and J. Huot. 2008.Feedback effects of chronic browsing on life-history traits ofa large herbivore. Journal of Animal Ecology 77:678–686.
Sinclair, A. R. E. 1977. The African buffalo: a study of resourcelimitation of populations. University of Chicago Press,Chicago, Illinois, USA.
Skogland, T. 1983. The effects of density dependent resourcelimitation on size of wild reindeer. Oecologia 60:156–168.
Skogland, T. 1986. Density dependent food limitation andmaximal production in wild reindeer herds. Journal ofWildlife Management 50:314–319.
Skogland, T. 1990. Density dependence in a fluctuating wildreindeer herd; maternal vs. offspring effects. Oecologia84:442–450.
Smith, G. E., and W. A. Albrecht. 1941. Biological assays ofsoil fertility. Proceedings of the Soil Science Society ofAmerica 6:252–258.
Smith, H. R. 1905. Profitable stock feeding; a book for thefarmer. Published by the author, Lincoln, Nebraska, USA.
Smith, M. H., and J. T. McGinnis. 1968. Relationships oflatitude, altitude, and body size to litter size and mean annualproduction of offspring in Peromyscus. Research in Popula-tion Ecology 10:115–126.
Smith, T., J. Earland, K. Bhatia, P. Heywood, and M.Singleton. 1993. Linear growth of children in Papua NewGuinea in relation to dietary, environmental, and geneticfactors. Ecology of Food and Nutrition 31:1–25.
Smith, T. M., and M. A. Huston. 1989. A theory of the spatialand temporal dynamics of plant communities. Vegetatio83:49–69.
Soper, R. B., R. L. Lochmiller, D. M. Leslie, and D. M. Engle.1993. Condition and diet quality of white-tailed deer inresponse to vegetation management in central Oklahoma.Proceedings of the Oklahoma Academy of Science 73:53–61.
Soppela, P., and M. Neiminen. 2001. The effect of wintertimeundernutrition on the fatty acid composition of leg bonemarrow fats in reindeer (Rangifer tarandus tarandus L.).Comparative Biochemistry and Physiology Part B 128:63–72.
Sousa, R. J. 1982. A national overview of wildlife managementinvestigations funded by the Pitman-Robertson (P-R) Pro-gram. Wildlife Society Bulletin 10:254–258.
Southwood, T. R. E. 1977. Habitat, the templet for ecologicalstrategies. Journal of Animal Ecology 46:337–365.
Southwood, T. R. E. 1988. Tactics, strategies and templets.Oikos 52:3–18.
Steckel, R. H. 1983. Height and per capita income. HistoricalMethods 6:1–7.
Steckel, R. H. 1995. Stature and the standard of living. Journalof Economic Literature 33:1903–1940.
Steckel, R. H. 2000. Industrialization and health in perspective.Pages 37–57 in D. Leon, and G. Walt, editors. Poverty,inequality, and health. Oxford University Press, Oxford, UK.
Steckel, R. H. 2001. Health and nutrition in the pre-industrialera: insights from a millennium of average heights inNorthern Europe. Working Paper 8542, National Bureauof Economic Research, Cambridge, Massachusetts, USA.hwww.nber.org/papers/w8542i
Steckel, R. H., and R. Floud, editors. 1997. Health and welfareduring industrialization. University of Chicago Press, Chica-go, Illinois, USA.
Steckel, R. H., and J. M. Prince. 2001. Tallest in the world:Native Americans of the Great Plains in the nineteenthcentury. American Economic Review 91:287–294.
Stewart, K. M., R. T. Bowyer, R. W. Ruess, B. L. Dick, andJ. G. Kie. 2006. Herbivore optimization by North Americanelk: consequences for theory and management. WildlifeMonographs 167.
Stiner, M. C. 1998. Mortality analysis of Pleistocene bears andits paleoanthropological relevance. Journal of HumanEvolution 34:303–326.
Stiner, M. C., N. D. Munro, T. A. Surovell, E. Tchernov, andO. Bar-Yosef. 1999. Paleolithic population growth pulsesevidenced by small animal exploitation. Science 283:190–194.
Stinson, S. 1990. Variation in body size and shape among SouthAmerican Indians. American Journal of Human Biology2:37–51.
Stockhoff, B. A. 1993. Diet heterogeneity: implications forgrowth of a generalist herbivore, the Gypsy Moth. Ecology74:1939–1949.
Strickland, B. K., and S. Demarais. 2000. Age and regionaldifferences in antlers and mass of white-tailed deer. Journalof Wildlife Management 64:903–911.
Strickland, B. K., and S. Demarais. 2006. Effectiveness of theState Soil Geographic Database (STATSGO) to predictwhite-tailed deer morphometrics in Mississippi. WildlifeSociety Bulletin 34:1264–1272.
Strickland, B. K., and S. Demarais. 2008. Influence oflandscape composition and structure on antler size ofwhite-tailed deer. Journal of Wildlife Management 72:1101–1108.
Subramanian, S. V., J. Kim, and I. Kawachi. 2005. Covariationin the socioeconomic determinants of self-rated health andhappiness: a multivariate multilevel analysis of individualsand communities in the USA. Journal of Epidemiology andCommunity Health 59:664–669.
Sunquist, M. E., and F. C. Sunquist. 2002. Wild cats of theworld. University of Chicago Press, Chicago, Illinois, USA.
August 2011 403eNPP AND BODY SIZE
CONCEPTS&SYNTHESIS
Suttie, J. M., and J. R. Webster. 1995. Extreme seasonal growthin arctic deer: comparisons and control mechanisms.American Zoologist 35:215–221.
Swift, R. W. 1948. Deer select most nutritive forage. Journal ofWildlife Management 12:109–110.
Symonds, M. R. E., L. Christidis, and C. N. Johnson. 2006.Latitudinal gradients in abundance, and the causes of rarityin the tropics: a test using Australian honeyeaters (Aves:Meliphagidae). Oecologia 149:406–417.
Symonds, M. R. E., and C. N. Johnson. 2006. Determinants oflocal abundance in a major radiation of Australian passer-ines. Journal of Biogeography 33:794–802.
Taber, A. B., A. J. Novaro, N. Neris, and F. H. Colman. 1997.The food habits of sympatric jaguar and puma in theParaguayan Chaco. Biotropica 29:204–213.
Tanner, J. M. 1986. Growth as a mirror of the condition ofsociety? Secular trends and class distinctions. Pages 3–34 inM. B. Dubue, and A. Demirjian, editors. Human growth: amultidisciplinary review. Taylor and Francis, London, UK.
Teer, J. G. 1984. Lessons from the Llano Basin, Texas. Pages261–290 in L. K. Halls, editor. White-tailed deer ecology andmanagement. Stackpole Books, Harrisburg, Pennsylvania,USA.
Teer, J. G., J. W. Thomas, and E. A. Walker. 1965. Ecologyand management of white-tailed deer in the Llano Basin ofTexas. Wildlife Monographs 15.
Terborgh, J. 1983. Five New World primates: a study incomparative ecology. Princeton University Press, Princeton,New Jersey, USA.
Thiollay, J.-M. 1988. Comparative foraging success of insec-tivorous birds in tropical and temperate forests: ecologicalimplications. Oikos 53:17–30.
Thorsland, O. A. 1966. Nutritional analyses of selected deerfoods in South Carolina. Proceedings of the SoutheasternAssociation of Game and Fish Commissioners 20:84–104.
Toigo, C., J. M. Gaillard, G. Van Laere, A. J. M. Hewison, andN. Morellet. 2006. How does environmental variationinfluence body mass, body size, and body condition? Roedeer as a case study. Ecography 29:301–308.
Torgerson, O, and W. R. Porath. 1984. Midwest oak/hickoryforest. Pages 427–440 in L. K. Halls, editor. White-tailed deerecology and management. Stockpole Books, Harrisburg,Pennsylvania, USA.
Tremblay, J., I. Thibault, C. Dussault, J. Huot, and S. Cote.2005. Long-term decline in white-tailed deer browse supply:can lichens and litterfall act as alternative food sources thatpreclude density-dependent feedbacks. Canadian Journal ofZoology 83:1087–1096.
Trivers, R. L., and D. E. Willard. 1973. Natural selection ofparental ability to vary the sex ratio of offspring. Science179:90–92.
Troost, T. A., B. W. Kooi, and U. Dieckmann. 2008. Jointevolution of predator body size and prey-size preference.Evolutionary Ecology 22:771–799.
Trowell, H. C. 1949. Malignant nutrition (Kwashiorkor).Transactions of the Royal Society of Tropical Medicineand Hygiene 42:417–442.
Trujillo, A. P., and H. V. Thurman. 2005. Essentials ofoceanography. Eighth edition. Pearson/Prentice Hall, Engle-wood Cliffs, New Jersey, USA.
Tucker-Drob, E. M., M. Rhemtulla, K. P. Harden, E.Turkheimer, and D. Fask. editors. 2011. Emergence of agene 3 socioeconomic status interaction on infant mentalability between 10 months and 2 years. Psychological Science22:125–133.
Turkheimer, E., A. Haley, M. Waldron, B. D’Onofrio, and I. I.Gottesman. 2003. Socioeconomic status modifies heritabilityof IQ in young children. Psychological Science 14:623–628.
Tveraa, T., P. Fauchald, N. G. Yoccoz, R. A. Ims, R. Aanes,and K. A. Høgda. 2007. What regulates and limits reindeerpopulations in Norway? Oikos 116:706–715.
Twombly, S., and N. Tisch. 2000. Body size regulation incopepods. Oecologia 122:318–336.
Uehara, G., and G. Gillman. 1981. The mineralogy, chemistry,and physics of tropical soils with variable charge clays.Westview Press, Boulder, Colorado, USA.
Ulrich, W., and C. Fiera. 2010. Environmental correlates ofbody size distributions of European springtails (Hexapoda:Collembola). Global Ecology and Biogeography 19:905–915.
van Andel, T. H., W. Davies, and B. Weniger. 2003. The humanpresence in Europe during the Last Glacial Period I:migrations and the changing climate. Pages 31–56 in T. H.van Andel, and W. Davies, editors. Neanderthals andmodern humans in the European landscape during the lastglaciation. McDonald Institute for Archaeological Research.Cambridge University Press, Cambridge, UK.
Van Deelan, T. R., K. M. Hollis, C. Anchor, and D. R. Etter.2000. Sex affects age determination and wear of molariformteeth in white-tailed deer. Journal of Wildlife Management64:1076–1083.
van der Wal, R., R. Brooker, E. Cooper, and R. Langvatn.2001. Differential effects of reindeer on high arctic lichens.Journal of Vegetation Science 12:705–710.
van Noord, P. A. H., and S. Arias-Careaga. 1995. The DutchFamine 1944–45: lasting effects on adult height. AmericanJournal of Epidemiology 141:S11–S44.
Van Valkenburgh, B. 1990. Skeletal and dental predictors ofbody mass in carnivores. Pages 181–205 in J. Damuth, andB. J. McFadden, editors. Body size in mammalian paleobi-ology: estimation and biological implications. CambridgeUniversity Press, New York, New York, USA.
Verme, L. J., and D. E. Ullrey. 1984. Physiology and nutrition.Pages 91–118 in L. K. Halls, editor. White-tailed deer ecologyand management. Stackpole Books, Harrisburg, Pennsylva-nia, USA.
Vrba, E. S. 1985. Environment and evolution: alternative causesof the temporal distribution of evolutionary events. SouthAfrican Journal of Science 81:229–236.
Wadsworth, M. E. J., R. J. Hardy, A. A. Paul, S. F. Marshall,and T. J. Cole. 2002. Leg and trunk length at 43 years inrelation to childhood health, diet and family circumstances;evidence from the 1946 national birth cohort. InternationalJournal of Epidemiology 31:383–390.
Wallace, A. R. 1869. The Malay Archipelago: the land of theOrang-Utan and the Bird of Paradise. A narrative of travel,with studies of man and nature. Harper and BrothersPublishers, New York, New York, USA.
Waller, D. M., and W. S. Alverson. 1997. The white-tailed deer:a keystone herbivore. Wildlife Society Bulletin 25:217–226.
Watt, C., S. Mitchell, and V. Salewski. 2010. Bergmann’s rule: aconcept cluster? Oikos 119:89–100.
Weaver, H. W. 2004. Biometric analysis and aversive condi-tioning of black bears in southern West Virginia. Thesis.West Virginia University, Morgantown, West Virginia, USA.
Webb, S. D., and N. D. Opdike. 1995. Global climate influenceson Cenozoic land mammal faunas. Pages 184–208 in S. M.Stanley, et al., editors, Effects of past global change on life.National Academies Press, Washington, D.C., USA.
Weiss, N. A. 2002. Introductory statistics. Addison Wesley,Boston, Massachusetts, USA.
Weladji, R. B., D. R. Klein, Ø. Holand, and A. Mysterud. 2002.Comparative response of Rangifer tarandus and othernorthern ungulates to climatic variability. Rangifer 22:29–46.
Welch, C. A., J. Keay, K. C. Kendall, and C. T. Robbins. 1997.Constraints on frugivory by bears. Ecology 78:1105–1119.
Wells, C. 1964. Bone, bodies, and disease. Thames and Hudson,London, UK.
Wells, J. C. K. 2010. Maternal capital and the metabolic ghetto:an evolutionary perspective on the transgenerational basis ofhealth inequalities. American Journal of Human Biology22:1–17.
Wenke, R. J. 1980. Patterns in prehistory: humankind’s firstthree million years. Oxford University Press, Oxford, UK.
MICHAEL A. HUSTON AND STEVE WOLVERTON404 Ecological MonographsVol. 81, No. 3
CONCEPTS&SYNTHESIS

Westlake, D. F. 1963. Comparisons of plant productivity.Biological Review 38:385–425.
Westoby, M. 1981. The place of the self-thinning rule inpopulation dynamics. American Naturalist 118:581–587.
Whitelaw, N. C., and E. Whitelaw. 2008. Transgenerationalepigenetic inheritance in health and disease. Current Opinionin Genetics and Development 18:273–279.
Widdowson, E. M. 1951. Mental contentment and physicalgrowth. Lancet June 16 1(6668):1316–1318.
Widdowson, E. M., and J. C. Mathers, editors. 1992. Thecontribution of nutrition to human and animal health.Cambridge University Press, New York, New York, USA.
Wigginton, J. D., and F. S. Dobson. 1999. Environmentalinfluences on geographic variation in body size of westernbobcats. Canadian Journal of Zoology 77:802–813.
Wild, A. 1958. The phosphate content of Australian soils.Australian Journal of Agricultural Research 9:193–204.
Williams, C. E., and A. L. Caskey. 1965. Soil fertility andcottontail fecundity in southeastern Missouri. AmericanMidland Naturalist 74:211–224.
Willig, M. R., D. M. Kaufman, and R. D. Stevens. 2003.Latitudinal gradients of biodiversity: pattern, process, scaleand synthesis. Annual Review of Ecology, Evolution, andSystematics 34:273–309.
Windell, J. T., J. W. Foltz, and J. A. Sarokan. 1978. Effect offish size, temperature, and amount fed on nutrient digestibil-ity of a pelleted diet by Rainbow Trout, Salmo gairdneri.Transactions of the American Fisheries Society 107:613–616.
Wiseman, S. 1966. Environmental and innate factors andeducational attainment. Pages 64–80 in J. Meade, and A.Parkers, editors. Genetic and environmental factors inhuman ability. Oliver and Boyd, London, UK.
Wolverton, S. 2006. Natural-trap ursid mortality and theKurten Response. Journal of Human Evolution 50:540–551.
Wolverton, S. 2008. Harvest pressure and environmentalcarrying capacity: an ordinal scale model of effects onungulate prey. American Antiquity 73:179–199.
Wolverton, S., M. A. Huston, J. H. Kennedy, K. Cagle, andJ. D. Cornelius. 2009a. Conformation to Bergmann’s rule inwhite-tailed deer can be explained by food availability.American Midland Naturalist 162:403–417.
Wolverton, S., J. H. Kennedy, and J. D. Cornelius. 2007. Apaleozoological perspective on white-tailed deer (Odocoileus
virginianus texana) population density and body size incentral Texas. Environmental Management 39:545–552.
Wolverton, S., and R. L. Lyman. 2000. Immanence andconfiguration in analogical reasoning. North AmericanArchaeologist 21:233–247.
Wolverton, S., R. L. Lyman, J. H. Kennedy, and T. W. LaPoint. 2009b. The terminal Pleistocene extinction in NorthAmerica, hypermorphic evolution, and the dynamic equilib-rium model. Journal of Ethnobiology 29:28–63.
Wright, D. H. 1983. Species–energy theory: an extension ofspecies–area theory. Oikos 41:496–506.
Wright, D. H., D. J. Currie, and B. A. Maurer. 1993. Energysupply and patterns of species richness on local and regionalscales. Pages 66–74 in R. E. Ricklefs, and D. Schluter,editors. Species diversity in ecological communities: historicaland geographical perspectives. University of Chicago Press,Chicago, Illinois, USA.
Wright, T., and E. Lundelius. 1963. Post-Pleistocene raccoonsfrom central Texas and their zoogeographic significance.Pearce-Sellards Series: Texas Memorial Museum 2:1–21.
Wurm, H. 1982. Uber die Schwankungen der durchschnitt-lichen Korperhohe im Verlauf der deutschen Geschichte unddie Einflusse des Eiweiaanteils der Kost. Homo 33:21–42.
Wurm, H. 1984. The fluctuation of average stature in the courseof German history and the influence of the protein content ofthe diet. Journal of Human Evolution 13:331–334.
Yokoyama, M., K. Kaji, and M. Suzuki. 2000. Food habits ofsika deer and nutritional value of sika deer diets in easternHokkaido, Japan. Ecological Research 15:345–355.
Yom-Tov, Y., and E. Geffen. 2006. Geographic variation inbody size: the effects of ambient temperature and precipita-tion. Oecologia 148:213–218.
Yom-Tov, Y., and H. Nix. 1986. Climatological correlates forbody size of five species of Australian mammals. BiologicalJournal of the Linnean Society 29:245–262.
Yom-Tov, Y., S. Yom-Tov, and G. Jarrell. 2008. Recentincrease in body size of the American marten Martesamericana in Alaska. Biological Journal of the LinneanSociety 93:701–707.
Zedrosser, A., B. Dahle, and J. E. Swenson. 2006. Populationdensity and food conditions determine adult female body sizein brown bears. Journal of Mammalogy 87:510–518.
SUPPLEMENT 1
Data on skull length for 44 species of carnivores and sources for the data used in Table 3 (Ecological Archives M081-014-S1).
SUPPLEMENT 2
Data and references for human height data used in Fig. 4B and F (Ecological Archives M081-014-S2).
SUPPLEMENT 3
Table of data and sources for information from large marine areas (LMEs) used in Figs. 8 and 10 and Table 7 (EcologicalArchives M081-014-S3).
SUPPLEMENT 4
Unpublished data analysis of Missouri Raccoon study by Virginia Lee Sharpe, approximately 1943 (PDF of original report)(Ecological Archives M081-014-S4).
SUPPLEMENT 5
Additional material for terrestrial eNPP: Fig. 1, global natural forest aboveground eNPP, and Fig. 4A, global natural vegetationaboveground eNPP (excluding managed vegetation and wetlands) (Ecological Archives M081-014-S5).
August 2011 405eNPP AND BODY SIZE
CONCEPTS&SYNTHESIS