PDAC 2015 - Toronto
49
novagold.com NYSE-MKT, TSX: NG | March 2015 The Institutional-Quality Gold Development Company Booth #2901
-
Upload
novagold -
Category
Investor Relations
-
view
732 -
download
0
Transcript of PDAC 2015 - Toronto
novagold.com
NYSE-MKT, TSX: NG | March 2015
The Institutional-Quality Gold Development Company
Booth #2901
Cautionary Statements
REGARDING FORWARD-LOOKING STATEMENTS
This presentation includes certain “forward-looking statements” within the meaning of applicable securities laws, including the United States Private Securities Litigation Reform Act of 1995. All
statements, other than statements of historical fact, included herein including, without limitation, statements relating to Donlin Gold’s future operating or financial performance, are forward-
looking statements. Forward-looking statements are frequently, but not always, identified by words such as “plans”, “expects”, “anticipates”, “believes”, “intends”, “estimates”, “potential”,
“possible” and similar expressions, or statements that events, conditions or results “will”, “may”, “could”, or “should” occur or be achieved. These forward-looking statements are set forth in the
slides pertaining to the implementation of the Donlin Gold second updated Feasibility Study and pertaining to the implementation of the Galore Creek Pre-Feasibility Study, the factors that may
influence future gold price performance, and the potential future value of gold, and may include statements regarding perceived merit of properties; exploration results and budgets; mineral
reserves and resource estimates; work programs; capital expenditures; timelines; strategic plans; completion of transactions; market price of precious or base metals; or other statements that
are not statements of fact. Forward-looking statements involve various risks and uncertainties. There can be no assurance that such statements will prove to be accurate, and actual results and
future events could differ materially from those anticipated in such statements. Important factors that could cause actual results to differ materially from our expectations include the
uncertainties involving the need for additional financing to explore and develop properties and availability of financing in the debt and capital markets; uncertainties involved in the interpretation
of drilling results and geological tests and the estimation of reserves and resources; the need for continued cooperation between NOVAGOLD and Barrick Gold in the exploration and
development of the Donlin Gold property; the need for continued cooperation between NOVAGOLD and Teck Resources Ltd. in the exploration and development of the Galore Creek property;
the need for cooperation of government agencies and native groups in the development and operation of properties; the need to obtain permits and governmental approvals; risks of
construction and mining projects such as accidents, equipment breakdowns, bad weather, non-compliance with environmental and permit requirements, unanticipated variation in geological
structures, ore grades or recovery rates; unexpected cost increases; fluctuations in metal prices and currency exchange rates; and other risks and uncertainties disclosed in reports and
documents filed by NOVAGOLD with applicable securities regulatory authorities from time to time. The forward-looking statements made herein reflect our beliefs, opinions and projections on
the date the statements are made. Except as required by law, we assume no obligation to update the forward-looking statements of beliefs, opinions, projections, or other factors, should they
change.
REGARDING SCIENTIFIC AND TECHNICAL INFORMATION
Unless otherwise indicated, all reserve and resource estimates included in this presentation have been prepared in accordance with Canadian National Instrument 43-101 Standards of
Disclosure for Mineral Projects (“NI 43-101”) and the Canadian Institute of Mining, Metallurgy and Petroleum Definition Standards for Mineral Resources and Mineral Reserves (“CIM Definition
Standards”). Canadian standards, including NI 43-101, differ significantly from the requirements of the United States Securities and Exchange Commission (“SEC”), and reserve and resource
information in this presentation may not be comparable to similar information disclosed by U.S. companies. In particular, and without limiting the generality of the foregoing, the term “resource”
does not equate to the term “‘reserves”. Under U.S. standards, mineralization may not be classified as a “reserve” unless the determination has been made that the mineralization could be
economically and legally produced or extracted at the time the reserve determination is made. At this time, both of Donlin Gold and Galore Creek projects are without known reserves, as
defined under SEC Industry Guide 7. The SEC’s disclosure standards normally do not permit the inclusion of information concerning “measured mineral resources”, “indicated mineral
resources” or “inferred mineral resources” or other descriptions of the amount of mineralization in mineral deposits that do not constitute “reserves” by U.S. standards in documents filed with the
SEC. U.S. investors should also understand that “inferred mineral resources” have a great amount of uncertainty as to their existence and great uncertainty as to their economic and legal
feasibility. It cannot be assumed that all or any part of an “inferred mineral resource” will ever be upgraded to a higher category. Under Canadian rules, estimated “inferred mineral resources”
may not form the basis of feasibility or pre-feasibility studies except in rare cases. Investors are cautioned not to assume that all or any part of an “inferred mineral resource” exists or is
economically or legally mineable. Disclosure of “contained ounces” in a resource is permitted disclosure under Canadian regulations; however, the SEC normally only permits issuers to report
mineralization that does not constitute “reserves” by SEC standards as in-place tonnage and grade without reference to unit measures. The requirements of NI 43-101 for identification of
“reserves” are also not the same as those of the SEC, and reserves reported in compliance with NI 43-101 may not qualify as “reserves” under SEC standards. Accordingly, information
concerning mineral deposits set forth herein may not be comparable to information made public by companies that report in accordance with United States standards.
All dollar amounts quoted in this report are in U.S. currency unless otherwise noted.
2
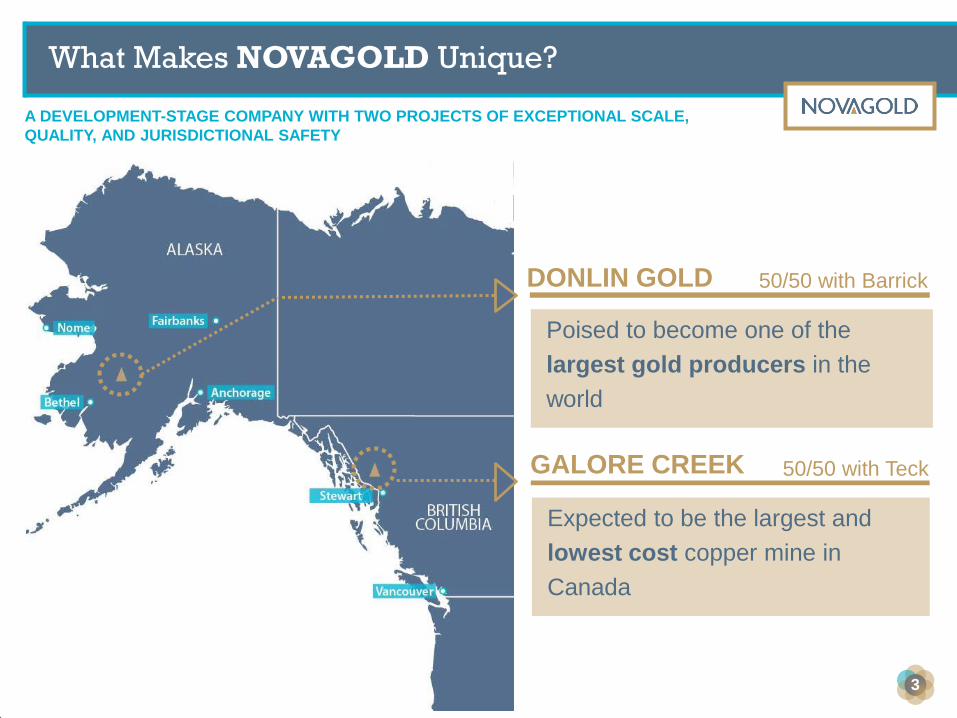
What Makes NOVAGOLD Unique?
Poised to become one of the
largest gold producers in the
world
DONLIN GOLD
GALORE CREEK
Expected to be the largest and
lowest cost copper mine in
Canada
50/50 with Barrick
50/50 with Teck
A DEVELOPMENT-STAGE COMPANY WITH TWO PROJECTS OF EXCEPTIONAL SCALE,
QUALITY, AND JURISDICTIONAL SAFETY
3
Notes:
1) Shown on 100% project basis, of which NOVAGOLD holds a 50% interest
2) Measured and indicated resources inclusive of proven and probable reserves.
See “Cautionary Note Concerning Reserve & Resource Estimates” and “Reserve & Resource
Base” with footnotes in the appendix.
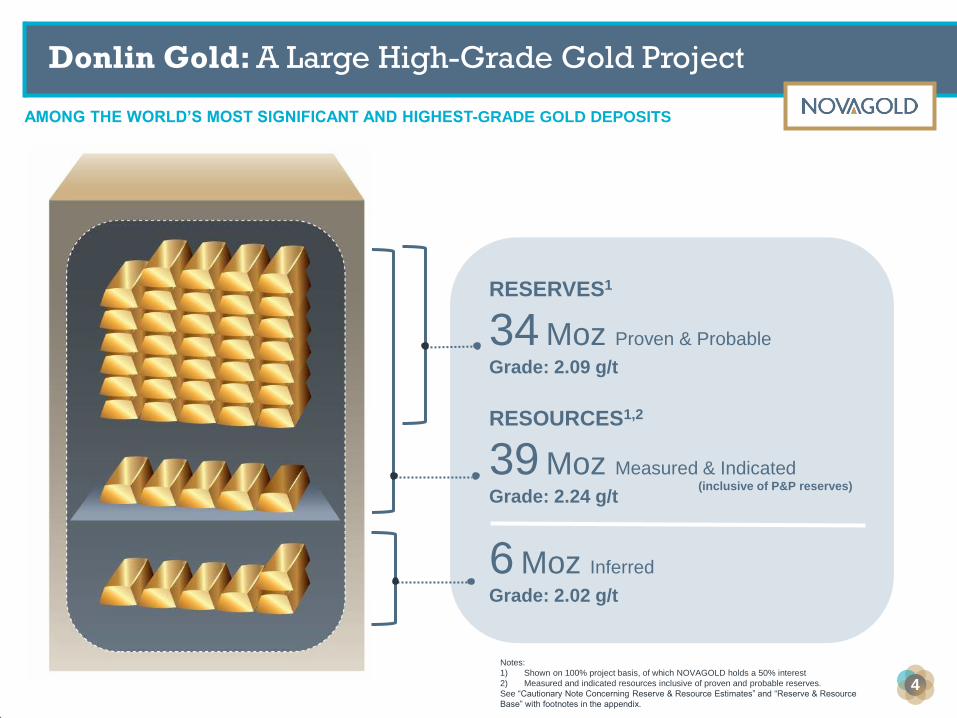
RESERVES1
34 Moz Proven & Probable
Grade: 2.09 g/t
RESOURCES1,2
39 Moz Measured & Indicated
Grade: 2.24 g/t
6 Moz Inferred
Grade: 2.02 g/t
(inclusive of P&P reserves)
AMONG THE WORLD’S MOST SIGNIFICANT AND HIGHEST-GRADE GOLD DEPOSITS
4
Donlin Gold: A Large High-Grade Gold Project
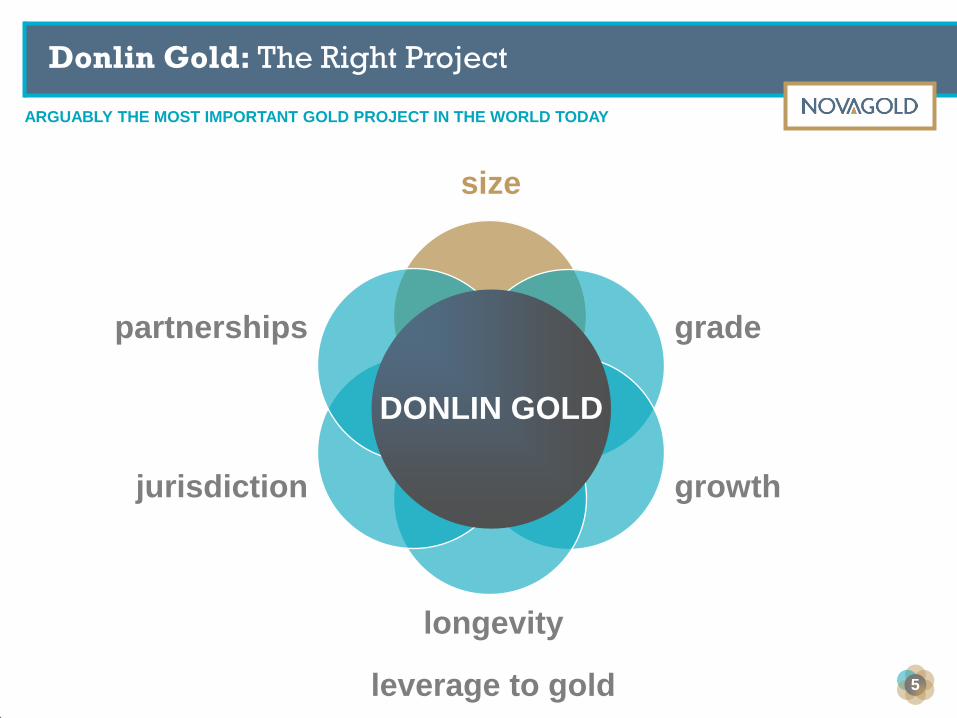
ARGUABLY THE MOST IMPORTANT GOLD PROJECT IN THE WORLD TODAY
partnerships grade
growth jurisdiction
size
DONLIN GOLD
longevity
leverage to gold 5
Donlin Gold: The Right Project
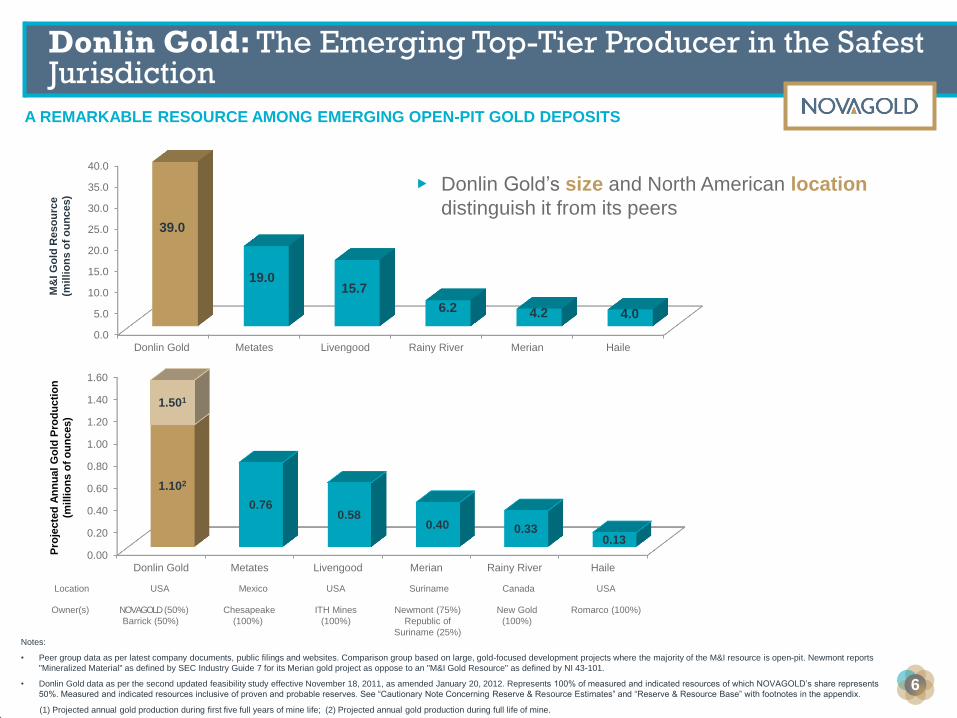
A REMARKABLE RESOURCE AMONG EMERGING OPEN-PIT GOLD DEPOSITS
Donlin Gold: The Emerging Top-Tier Producer in the Safest Jurisdiction
0.00
0.20
0.40
0.60
0.80
1.00
1.20
1.40
1.60
Donlin Gold Metates Livengood Merian Rainy River Haile
1.102
0.76 0.58
0.40 0.33 0.13
1.501
Location USA Mexico USA Suriname Canada USA
Owner(s) NOVAGOLD (50%)
Barrick (50%)
Chesapeake
(100%)
ITH Mines
(100%)
Newmont (75%)
Republic of
Suriname (25%)
New Gold
(100%)
Romarco (100%)
Pro
jecte
d A
nn
ua
l G
old
Pro
du
cti
on
(mil
lio
ns
of
ou
nc
es)
Notes:
• Peer group data as per latest company documents, public filings and websites. Comparison group based on large, gold-focused development projects where the majority of the M&I resource is open-pit. Newmont reports
"Mineralized Material" as defined by SEC Industry Guide 7 for its Merian gold project as oppose to an "M&I Gold Resource" as defined by NI 43-101.
• Donlin Gold data as per the second updated feasibility study effective November 18, 2011, as amended January 20, 2012. Represents 100% of measured and indicated resources of which NOVAGOLD’s share represents
50%. Measured and indicated resources inclusive of proven and probable reserves. See “Cautionary Note Concerning Reserve & Resource Estimates” and “Reserve & Resource Base” with footnotes in the appendix.
(1) Projected annual gold production during first five full years of mine life; (2) Projected annual gold production during full life of mine.
0.0
5.0
10.0
15.0
20.0
25.0
30.0
35.0
40.0
Donlin Gold Metates Livengood Rainy River Merian Haile
39.0
19.0 15.7
6.2 4.2 4.0
M&
I G
old
Reso
urc
e
(mil
lio
ns
of
ou
nc
es)
▶ Donlin Gold’s size and North American location
distinguish it from its peers
6
Notes:
Donlin Gold projected annual production represents 100% of which NOVAGOLD’s share is 50%. All other production estimates, with the exception of Grasberg, are based on published 2014 average gold annual production
guidance sourced from SNL Metals & Mining. Grasberg represents the published 2014 gold sales guidance. Excludes Newmont’s Nevada operations that consist of multiple mines. Analysis includes life of mine data for Donlin
Gold.
1) If put into production as contemplated by the second updated feasibility study effective November 18, 2011, as amended January 20, 2012.
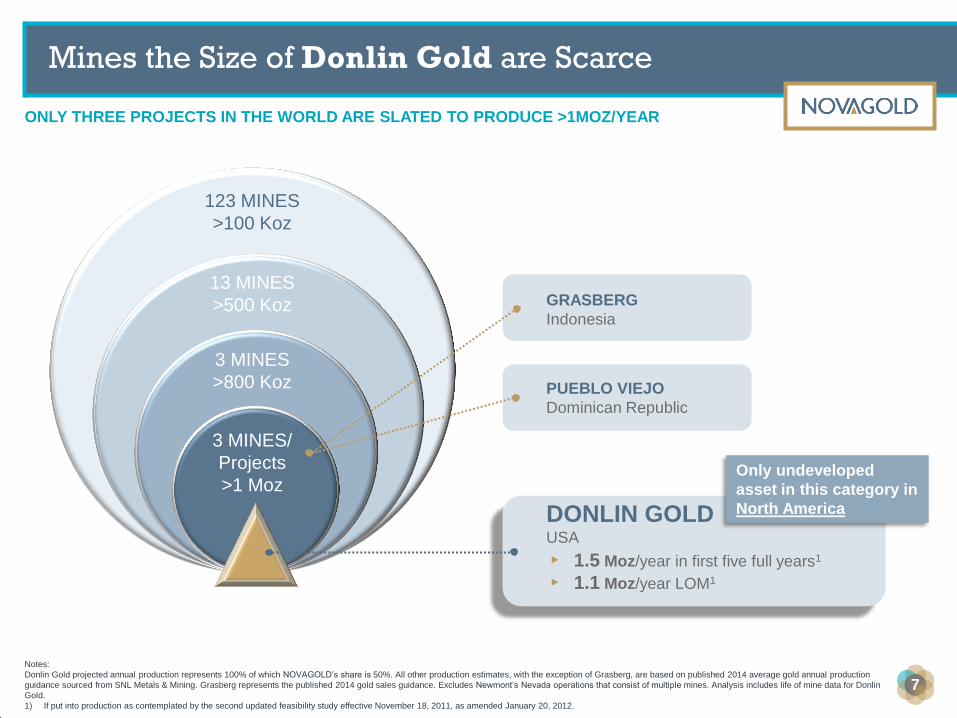
123 MINES
>100 Koz
13 MINES
>500 Koz
3 MINES
>800 Koz
3 MINES/
Projects
>1 Moz
GRASBERG
Indonesia
PUEBLO VIEJO
Dominican Republic
DONLIN GOLD USA
▸ 1.5 Moz/year in first five full years1
▸ 1.1 Moz/year LOM1
1
Only undeveloped
asset in this category in
North America
Mines the Size of Donlin Gold are Scarce
ONLY THREE PROJECTS IN THE WORLD ARE SLATED TO PRODUCE >1MOZ/YEAR
7
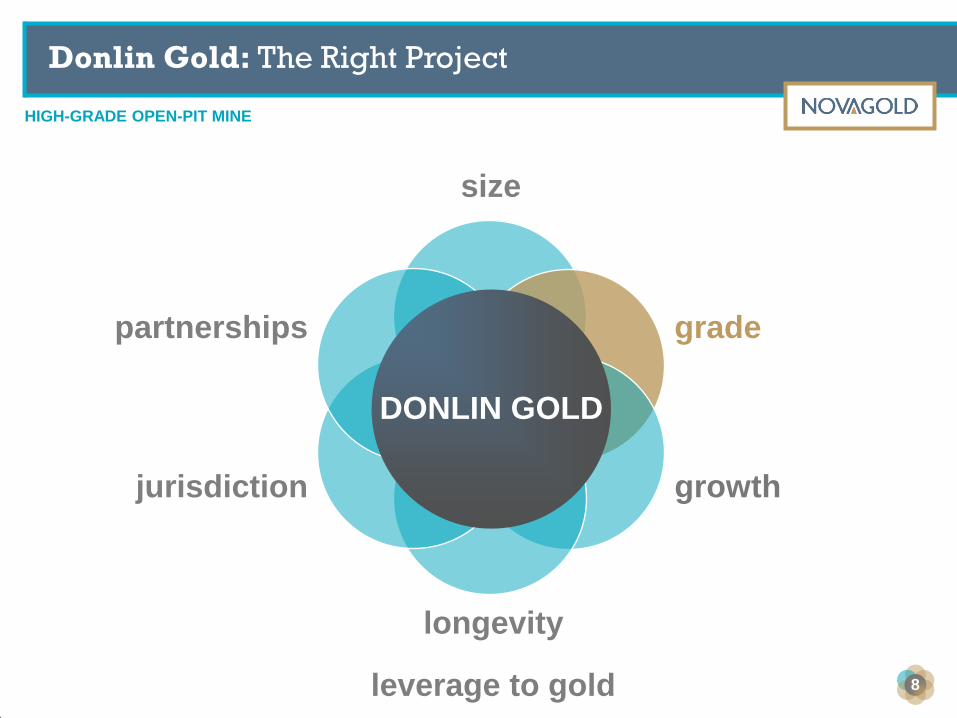
Donlin Gold: The Right Project
HIGH-GRADE OPEN-PIT MINE
partnerships grade
growth jurisdiction
size
DONLIN GOLD
longevity
leverage to gold 8
Notes:
See “Cautionary Note Concerning Reserve & Resource Estimates” and “Reserve & Resource Base” with footnotes in the appendix.
1) Average grade of all deposits globally over 1 Moz in size, sourced from “2013 Global Gold Mine and Deposit Rankings” – Natural Resource Holdings and Visual Capitalist.
2) Donlin Gold data as per the second updated feasibility study effective November 18, 2011, as amended January 20, 2012. Represents 100% of measured and indicated resources of which NOVAGOLD’s share is 50%.
Measured and indicated resources are inclusive of proven and probable reserves.
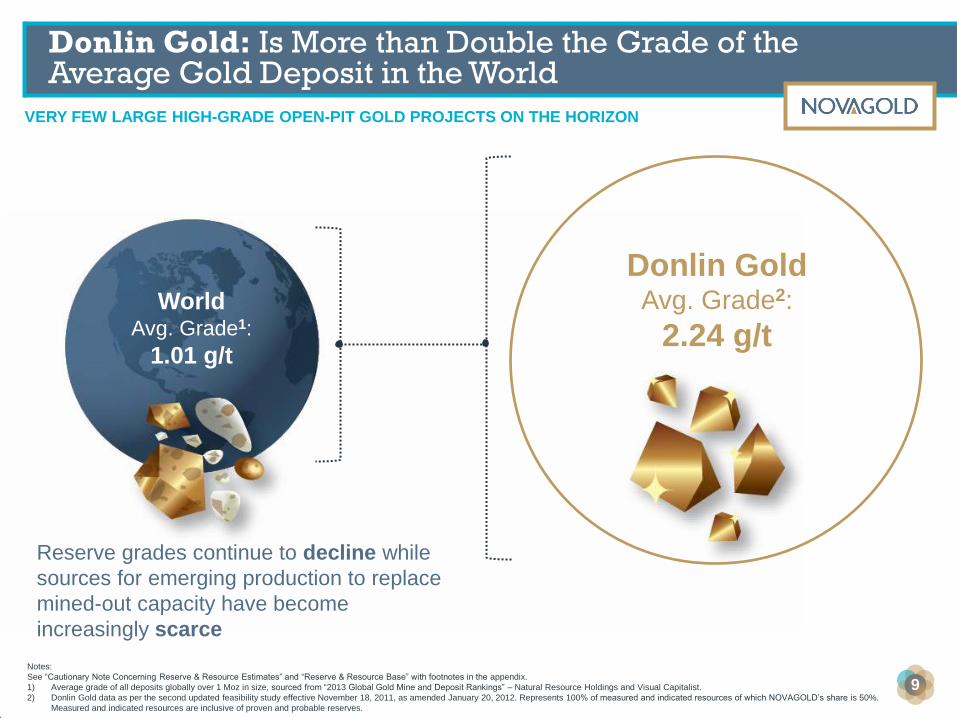
World Avg. Grade1:
1.01 g/t
Donlin Gold Avg. Grade2:
2.24 g/t
Reserve grades continue to decline while
sources for emerging production to replace
mined-out capacity have become
increasingly scarce
VERY FEW LARGE HIGH-GRADE OPEN-PIT GOLD PROJECTS ON THE HORIZON
Donlin Gold: Is More than Double the Grade of the Average Gold Deposit in the World
9
0.00
0.50
1.00
1.50
2.00
2.50
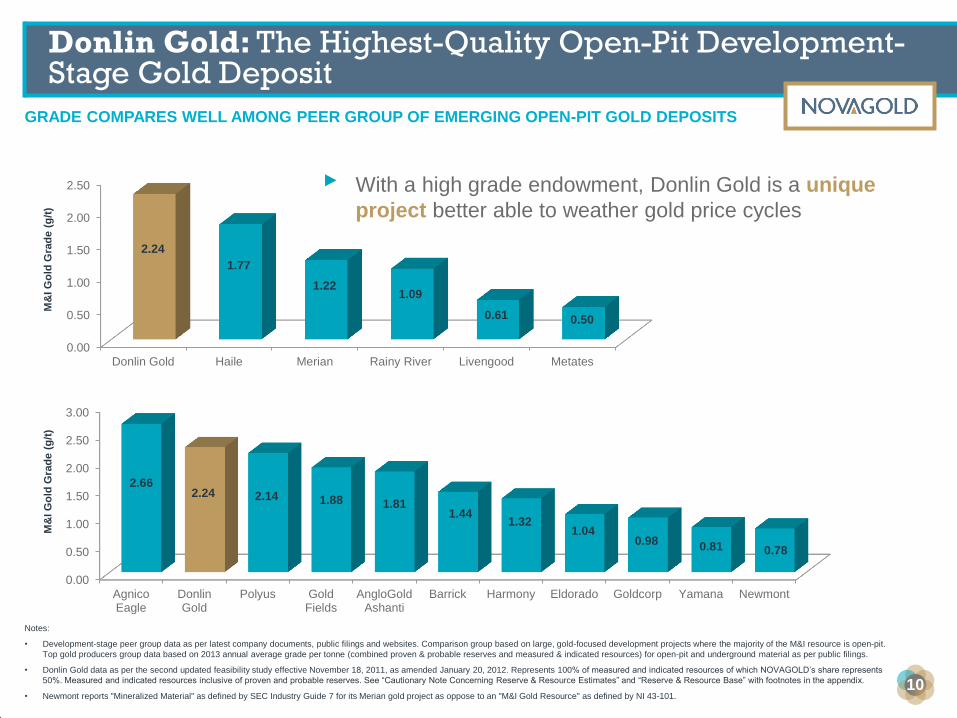
Donlin Gold Haile Merian Rainy River Livengood Metates
2.24
1.77
1.22 1.09
0.61 0.50
▸ With a high grade endowment, Donlin Gold is a unique
project better able to weather gold price cycles
M&
I G
old
Gra
de
(g
/t)
Notes:
• Development-stage peer group data as per latest company documents, public filings and websites. Comparison group based on large, gold-focused development projects where the majority of the M&I resource is open-pit.
Top gold producers group data based on 2013 annual average grade per tonne (combined proven & probable reserves and measured & indicated resources) for open-pit and underground material as per public filings.
• Donlin Gold data as per the second updated feasibility study effective November 18, 2011, as amended January 20, 2012. Represents 100% of measured and indicated resources of which NOVAGOLD’s share represents
50%. Measured and indicated resources inclusive of proven and probable reserves. See “Cautionary Note Concerning Reserve & Resource Estimates” and “Reserve & Resource Base” with footnotes in the appendix.
• Newmont reports "Mineralized Material" as defined by SEC Industry Guide 7 for its Merian gold project as oppose to an "M&I Gold Resource" as defined by NI 43-101.
0.00
0.50
1.00
1.50
2.00
2.50
3.00
AgnicoEagle
DonlinGold
Polyus GoldFields
AngloGoldAshanti
Barrick Harmony Eldorado Goldcorp Yamana Newmont
2.66 2.24 2.14 1.88 1.81
1.44 1.32
1.04 0.98 0.81 0.78
M&
I G
old
Gra
de
(g
/t)
GRADE COMPARES WELL AMONG PEER GROUP OF EMERGING OPEN-PIT GOLD DEPOSITS
Donlin Gold: The Highest-Quality Open-Pit Development-Stage Gold Deposit
10
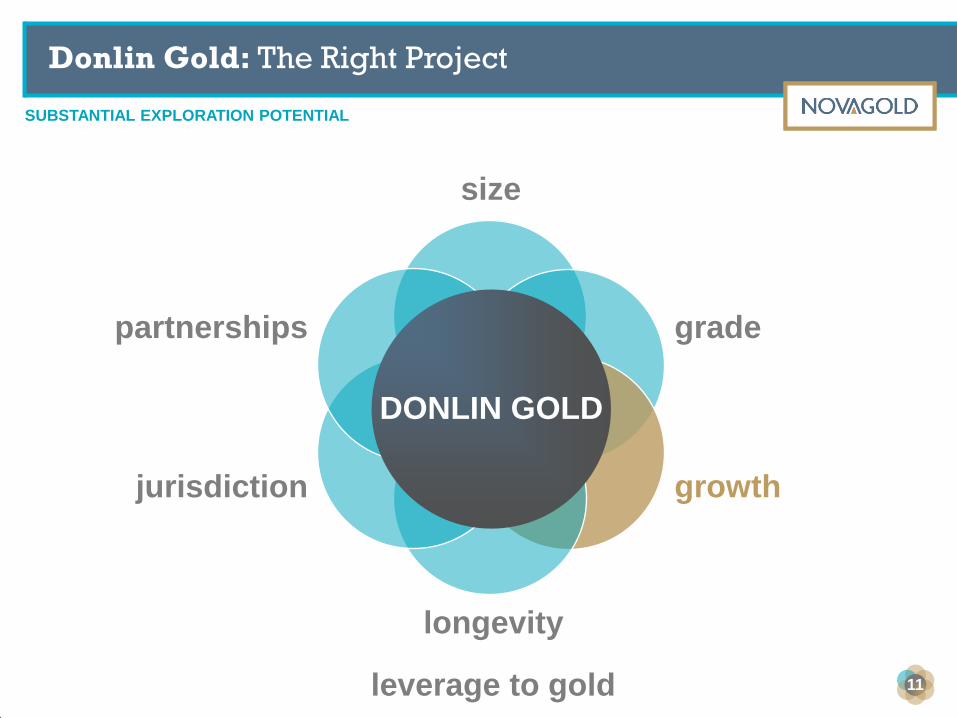
Donlin Gold: The Right Project
SUBSTANTIAL EXPLORATION POTENTIAL
partnerships grade
growth jurisdiction
longevity
leverage to gold
size
DONLIN GOLD
11

MULTIPLE DRILL PROSPECTS AND TARGETS EXIST ALONG 8KM TREND
Donlin Gold: Excellent Exploration Potential
12
The next big gold discovery?
▶ Potential to expand current open-pit
resources along strike and at depth
▶ Good prospects to discover meaningful
deposits outside current mine footprint
• Reserves and resources are
contained within just 3 km of an 8 km
long trend
▶ Inferred mineral resource: 6 Moz of gold
mainly inside the reserve pit
• Upside potential to project economics
▶ In-pit area covers 1,600 acres (~2%) of
the 80,000 acres comprising the entire
land package
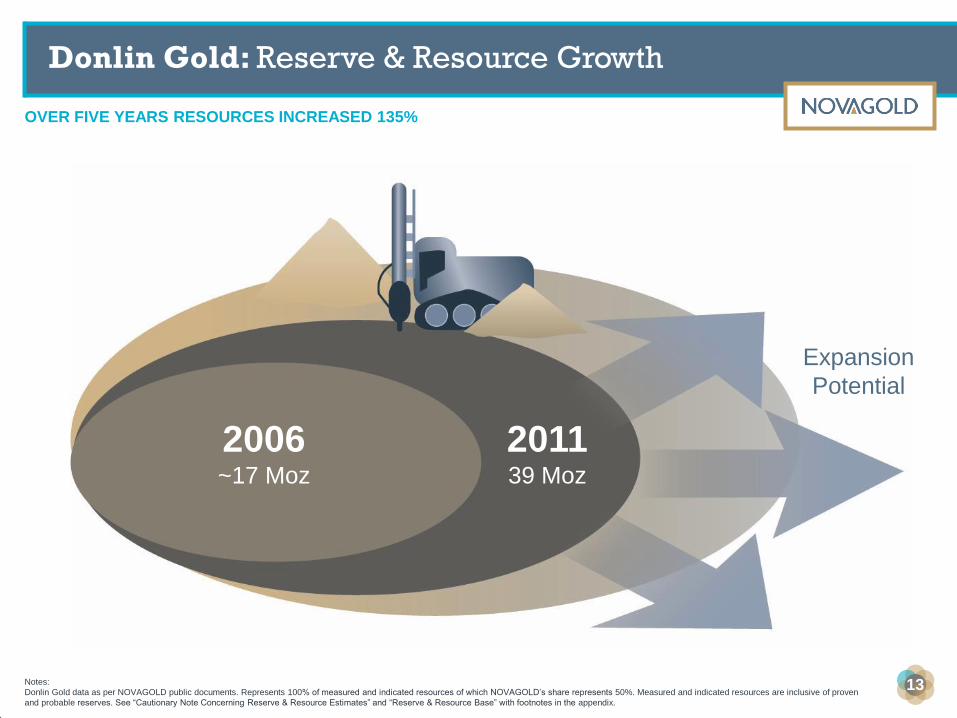
Donlin Gold: Reserve & Resource Growth
Notes:
Donlin Gold data as per NOVAGOLD public documents. Represents 100% of measured and indicated resources of which NOVAGOLD’s share represents 50%. Measured and indicated resources are inclusive of proven
and probable reserves. See “Cautionary Note Concerning Reserve & Resource Estimates” and “Reserve & Resource Base” with footnotes in the appendix.
2006 ~17 Moz
2011 39 Moz
Expansion
Potential
OVER FIVE YEARS RESOURCES INCREASED 135%
13
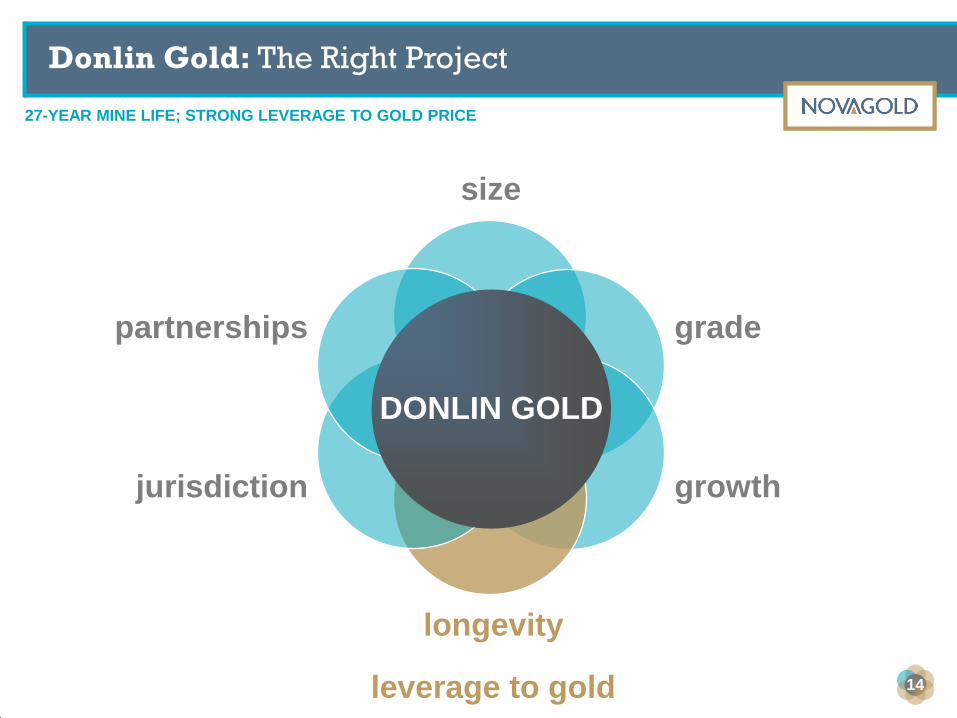
Donlin Gold: The Right Project
27-YEAR MINE LIFE; STRONG LEVERAGE TO GOLD PRICE
partnerships grade
growth jurisdiction
longevity
leverage to gold
size
DONLIN GOLD
14
0
5,000
10,000
15,000
20,000
25,000
30,000
1,200 1,300 1,500 1,700 2,000 2,500
6.2B
8.2B
11.6B
14.6B
19.2B
27.0B
NP
V (
US
$ i
n m
illi
on
s)
Gold Price (US$)
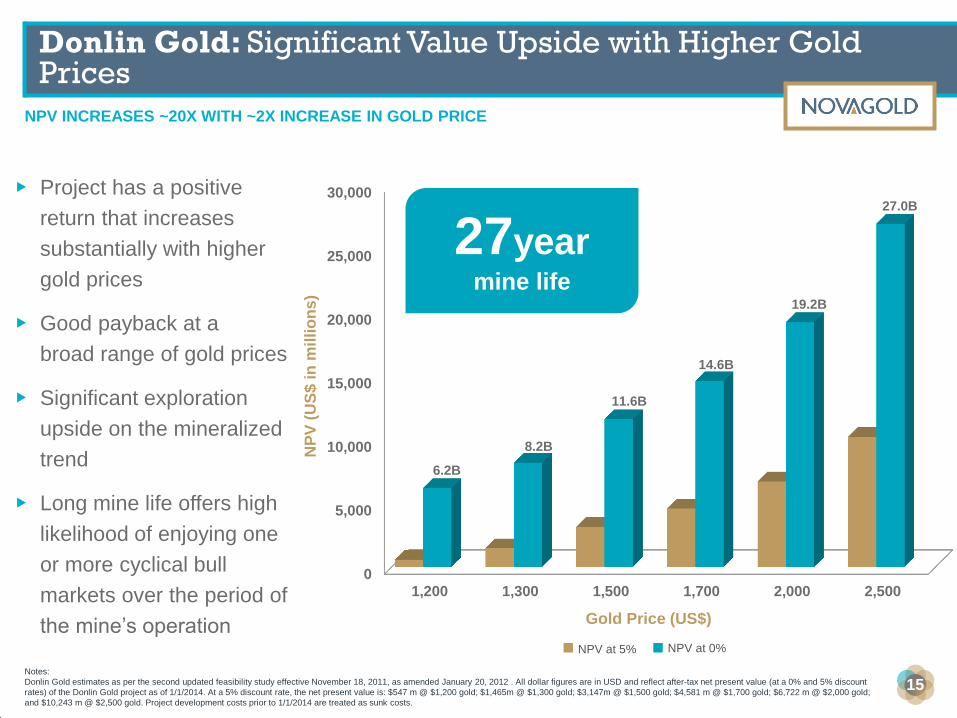
NPV INCREASES ~20X WITH ~2X INCREASE IN GOLD PRICE
Donlin Gold: Significant Value Upside with Higher Gold Prices
15 Notes:
Donlin Gold estimates as per the second updated feasibility study effective November 18, 2011, as amended January 20, 2012 . All dollar figures are in USD and reflect after-tax net present value (at a 0% and 5% discount
rates) of the Donlin Gold project as of 1/1/2014. At a 5% discount rate, the net present value is: $547 m @ $1,200 gold; $1,465m @ $1,300 gold; $3,147m @ $1,500 gold; $4,581 m @ $1,700 gold; $6,722 m @ $2,000 gold;
and $10,243 m @ $2,500 gold. Project development costs prior to 1/1/2014 are treated as sunk costs.
27year mine life
NPV at 0% NPV at 5%
▶ Project has a positive
return that increases
substantially with higher
gold prices
▶ Good payback at a
broad range of gold prices
▶ Significant exploration
upside on the mineralized
trend
▶ Long mine life offers high
likelihood of enjoying one
or more cyclical bull
markets over the period of
the mine’s operation
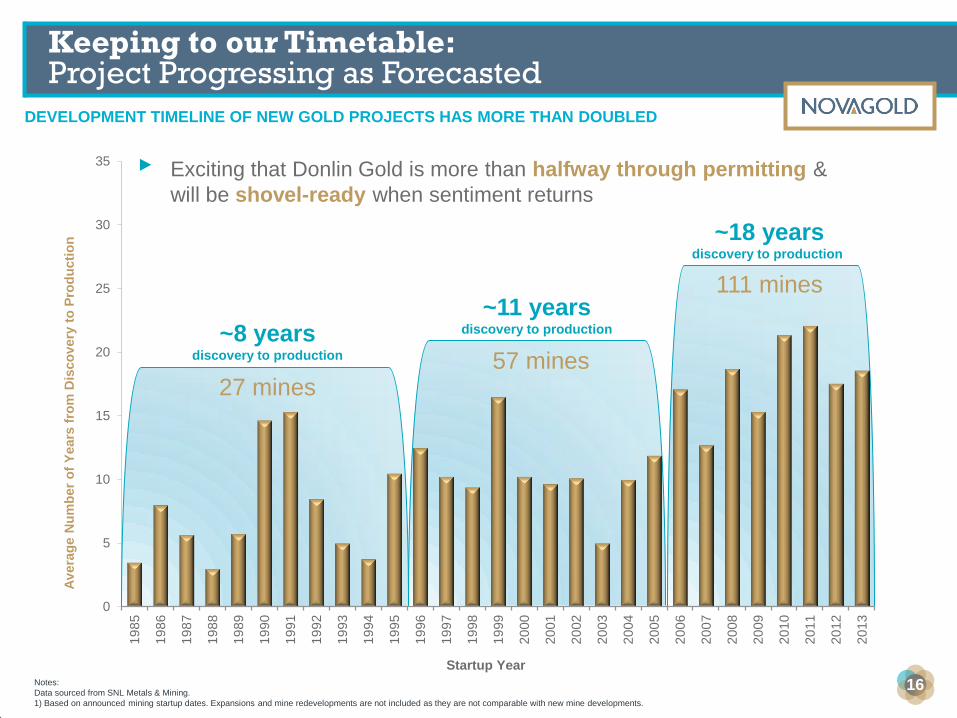
Notes:
Data sourced from SNL Metals & Mining.
1) Based on announced mining startup dates. Expansions and mine redevelopments are not included as they are not comparable with new mine developments.
27 mines
~8 years discovery to production 57 mines
111 mines ~11 years
discovery to production
~18 years discovery to production
0
5
10
15
20
25
30
35
19
85
19
86
19
87
19
88
19
89
19
90
19
91
19
92
19
93
19
94
19
95
19
96
19
97
19
98
19
99
20
00
20
01
20
02
20
03
20
04
20
05
20
06
20
07
20
08
20
09
20
10
20
11
20
12
20
13
Av
era
ge N
um
ber
of
Years
fro
m D
isco
very
to
Pro
du
cti
on
Startup Year
▸ Exciting that Donlin Gold is more than halfway through permitting &
will be shovel-ready when sentiment returns
DEVELOPMENT TIMELINE OF NEW GOLD PROJECTS HAS MORE THAN DOUBLED
Keeping to our Timetable: Project Progressing as Forecasted
16
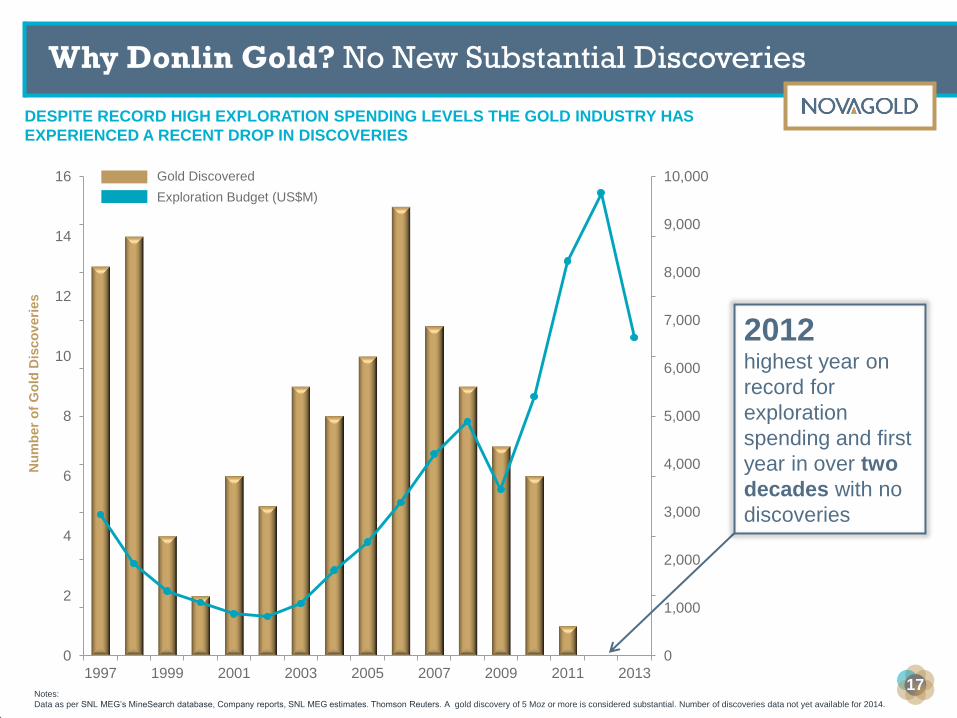
0
2
4
6
8
10
12
14
16
0
1,000
2,000
3,000
4,000
5,000
6,000
7,000
8,000
9,000
10,000
1997 1999 2001 2003 2005 2007 2009 2011 2013
Notes:
Data as per SNL MEG’s MineSearch database, Company reports, SNL MEG estimates. Thomson Reuters. A gold discovery of 5 Moz or more is considered substantial. Number of discoveries data not yet available for 2014.
Nu
mb
er
of
Go
ld D
isco
veri
es
Gold Discovered
Exploration Budget (US$M)
2012 highest year on
record for
exploration
spending and first
year in over two
decades with no
discoveries
DESPITE RECORD HIGH EXPLORATION SPENDING LEVELS THE GOLD INDUSTRY HAS
EXPERIENCED A RECENT DROP IN DISCOVERIES
Why Donlin Gold? No New Substantial Discoveries
17
LOCATED IN ALASKA, ONE OF THE TRULY SAFE MINING JURISDICTIONS
Donlin Gold: The Right Project
partnerships grade
growth jurisdiction
size
DONLIN GOLD
longevity
leverage to gold 18

Donlin Gold located in Alaska, one of
the safest jurisdictions in the world with a
history of successful mine development
▶ Alaska is the second largest U.S.
gold-producing State
▶ Well-defined permitting process
▶ Natural resource projects integral
to the State’s economy
▶ Strong and time-tested community
support
ALASKA – A RESOURCE-RICH STATE WITH AN ESTABLISHED RULE OF LAW
Donlin Gold: Located in a Favorable Jurisdiction
19 19
STRONG PARTNERSHIPS
Donlin Gold: The Right Project
partnerships grade
growth jurisdiction
size
DONLIN GOLD
longevity
leverage to gold 20
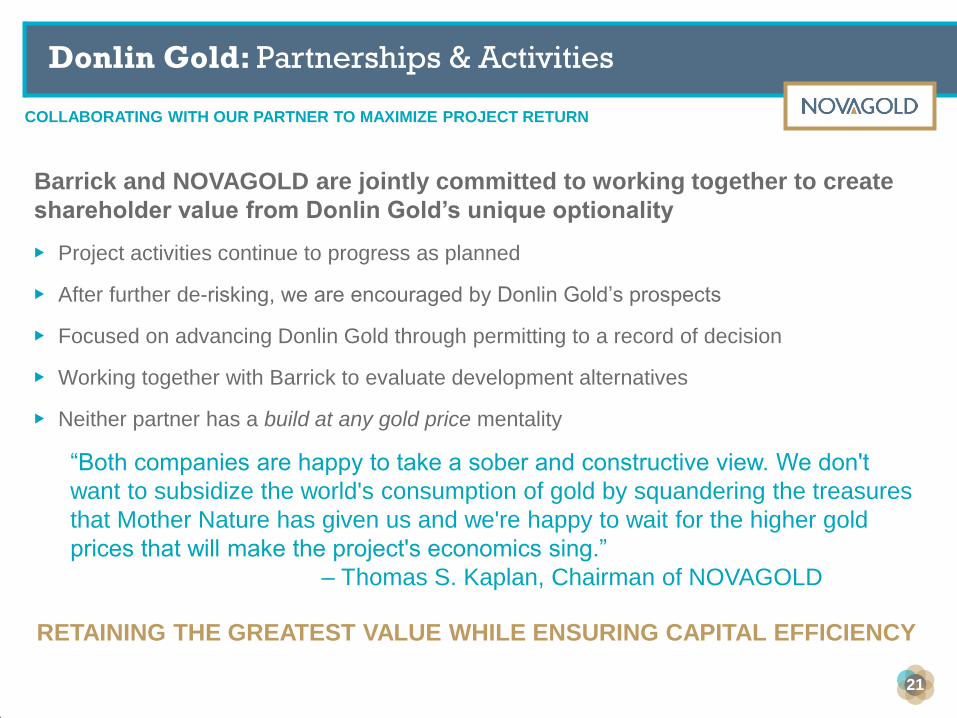
COLLABORATING WITH OUR PARTNER TO MAXIMIZE PROJECT RETURN
Donlin Gold: Partnerships & Activities
Barrick and NOVAGOLD are jointly committed to working together to create
shareholder value from Donlin Gold’s unique optionality
▶ Project activities continue to progress as planned
▶ After further de-risking, we are encouraged by Donlin Gold’s prospects
▶ Focused on advancing Donlin Gold through permitting to a record of decision
▶ Working together with Barrick to evaluate development alternatives
▶ Neither partner has a build at any gold price mentality
“Both companies are happy to take a sober and constructive view. We don't
want to subsidize the world's consumption of gold by squandering the treasures
that Mother Nature has given us and we're happy to wait for the higher gold
prices that will make the project's economics sing.”
– Thomas S. Kaplan, Chairman of NOVAGOLD
RETAINING THE GREATEST VALUE WHILE ENSURING CAPITAL EFFICIENCY
21
Barrick Gold Fourth Quarter 2014 Results
“The 50% owned Donlin Gold project located in Alaska is one of the largest undeveloped gold deposits in the
world. In terms of size, grade, and jurisdictional safety, Donlin Gold is an excellent asset in Barrick's portfolio
with significant leverage to the price of gold. The Donlin Gold project has approximately 39 million ounces of
contained gold (100% basis) in the measured and indicated resource categories (approximately 8 million
tonnes grading 2.52 g/t (measured) and 533 million tonnes grading 2.24 g/t (indicated)). In addition to its
already large mineral endowment, the project also has exploration potential which could expand the current
open pit resource.
Under our disciplined capital allocation framework, we have continued to work with our partner, Novagold
Resources, to advance the Donlin Gold project. Current activities, by which we maintain and enhance the
option value of this project at a modest cost, are focused on permitting, community outreach and workforce
development. In 2014, Donlin Gold secured long-term surface use rights and significantly advanced the
permitting of the Donlin Gold project which is now about halfway complete.
Barrick is working closely with its partner on alternatives designed to minimize initial capital outlay. The
outcome of that effort may include engagement of third party operators and exploring possibilities for third
party financing of some capital intensive infrastructure. Collectively, we are also investing about $3 million
(100% basis) on technical studies to identify potential design and execution enhancements. Donlin Gold has
substantial leverage to gold prices and has the potential to add significant value to Barrick and its future
growth pipeline in a higher gold price environment. Any decision to proceed with development, either as
currently envisaged, or in an optimized scenario, will depend on the project meeting Barrick's minimum
hurdle rate which will depend in large part on the prevailing gold prices and market conditions.”
BARRICK AND NOVAGOLD NARRATIVE IS COMPLETELY ALIGNED
Donlin Gold: Perfect Alignment between Partners
22 Notes:
As per Barrick Gold’s Fourth Quarter and Full Year 2014 Results disclosed on February 18, 2015.
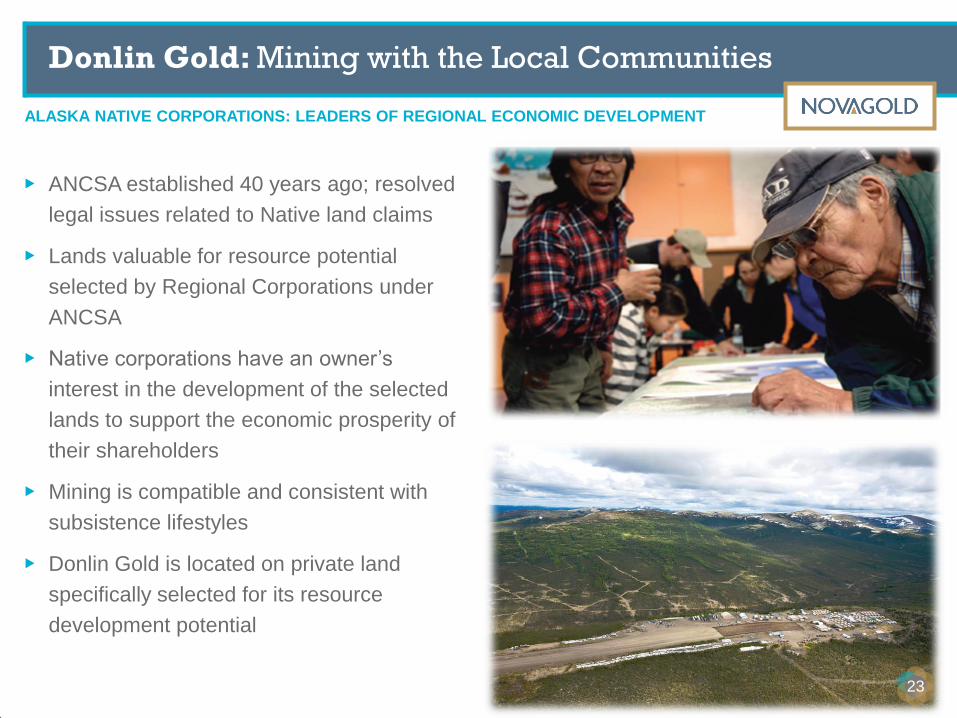
Donlin Gold: Mining with the Local Communities
ALASKA NATIVE CORPORATIONS: LEADERS OF REGIONAL ECONOMIC DEVELOPMENT
23
▶ ANCSA established 40 years ago; resolved
legal issues related to Native land claims
▶ Lands valuable for resource potential
selected by Regional Corporations under
ANCSA
▶ Native corporations have an owner’s
interest in the development of the selected
lands to support the economic prosperity of
their shareholders
▶ Mining is compatible and consistent with
subsistence lifestyles
▶ Donlin Gold is located on private land
specifically selected for its resource
development potential
23
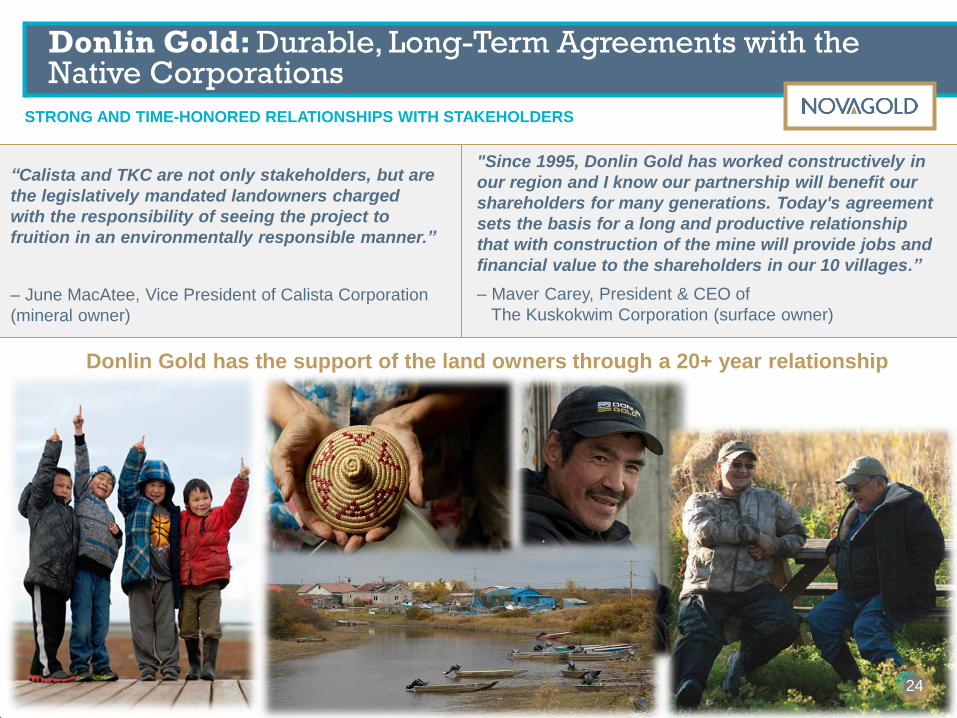
Donlin Gold has the support of the land owners through a 20+ year relationship
“Calista and TKC are not only stakeholders, but are
the legislatively mandated landowners charged
with the responsibility of seeing the project to
fruition in an environmentally responsible manner.”
– June MacAtee, Vice President of Calista Corporation
(mineral owner)
"Since 1995, Donlin Gold has worked constructively in
our region and I know our partnership will benefit our
shareholders for many generations. Today's agreement
sets the basis for a long and productive relationship
that with construction of the mine will provide jobs and
financial value to the shareholders in our 10 villages.”
– Maver Carey, President & CEO of
The Kuskokwim Corporation (surface owner)
STRONG AND TIME-HONORED RELATIONSHIPS WITH STAKEHOLDERS
Donlin Gold: Durable, Long-Term Agreements with the Native Corporations
24 24
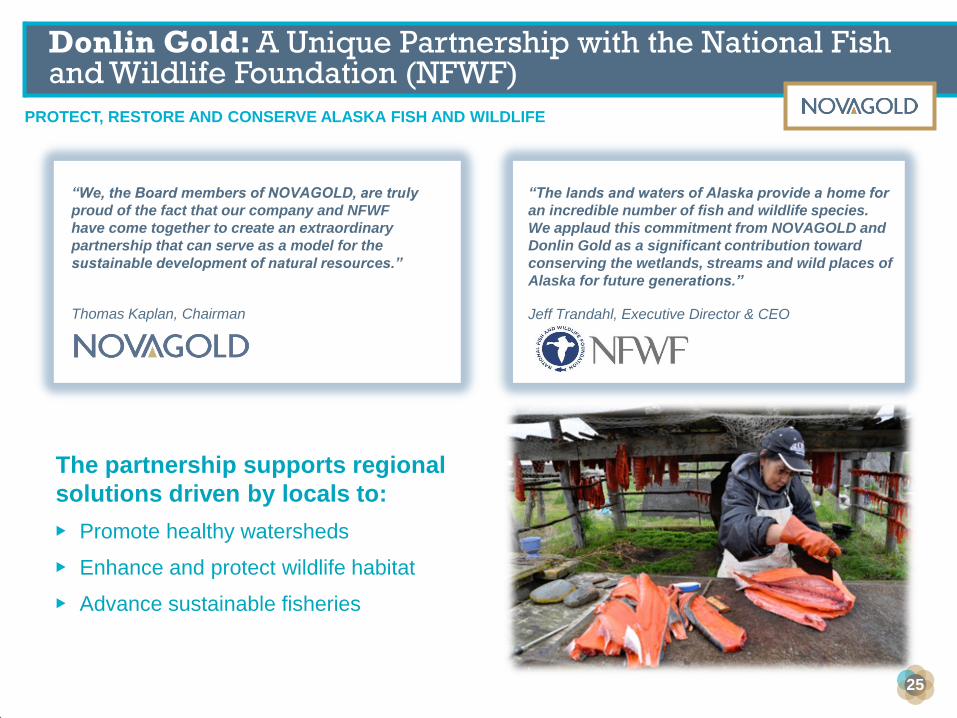
“We, the Board members of NOVAGOLD, are truly
proud of the fact that our company and NFWF
have come together to create an extraordinary
partnership that can serve as a model for the
sustainable development of natural resources.”
Thomas Kaplan, Chairman
“The lands and waters of Alaska provide a home for
an incredible number of fish and wildlife species.
We applaud this commitment from NOVAGOLD and
Donlin Gold as a significant contribution toward
conserving the wetlands, streams and wild places of
Alaska for future generations.”
Jeff Trandahl, Executive Director & CEO
The partnership supports regional
solutions driven by locals to:
▶ Promote healthy watersheds
▶ Enhance and protect wildlife habitat
▶ Advance sustainable fisheries
PROTECT, RESTORE AND CONSERVE ALASKA FISH AND WILDLIFE
Donlin Gold: A Unique Partnership with the National Fish and Wildlife Foundation (NFWF)
25
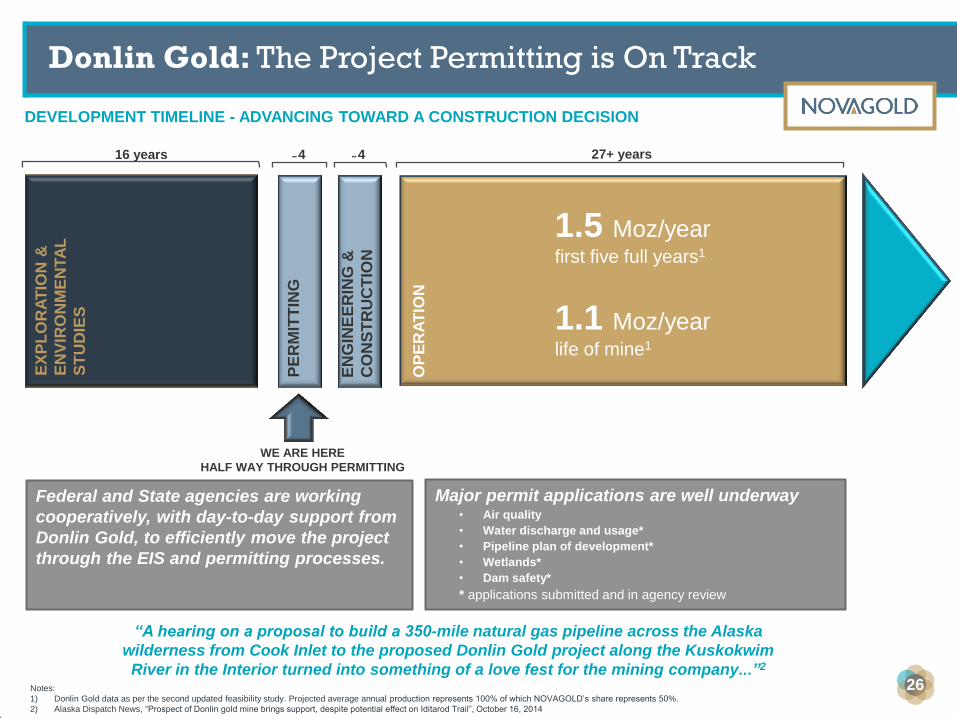
DEVELOPMENT TIMELINE - ADVANCING TOWARD A CONSTRUCTION DECISION
Donlin Gold: The Project Permitting is On Track
16 years 4 27+ years
EX
PL
OR
AT
ION
&
EN
VIR
ON
ME
NTA
L
ST
UD
IES
PE
RM
ITT
ING
EN
GIN
EE
RIN
G &
CO
NS
TR
UC
TIO
N
OP
ER
AT
ION
WE ARE HERE
HALF WAY THROUGH PERMITTING
1.5 Moz/year first five full years1
1.1 Moz/year life of mine1
4
Notes:
1) Donlin Gold data as per the second updated feasibility study. Projected average annual production represents 100% of which NOVAGOLD’s share represents 50%.
2) Alaska Dispatch News, “Prospect of Donlin gold mine brings support, despite potential effect on Iditarod Trail”, October 16, 2014
Federal and State agencies are working
cooperatively, with day-to-day support from
Donlin Gold, to efficiently move the project
through the EIS and permitting processes.
Major permit applications are well underway • Air quality
• Water discharge and usage*
• Pipeline plan of development*
• Wetlands*
• Dam safety*
* applications submitted and in agency review
26
“A hearing on a proposal to build a 350-mile natural gas pipeline across the Alaska
wilderness from Cook Inlet to the proposed Donlin Gold project along the Kuskokwim
River in the Interior turned into something of a love fest for the mining company...”2
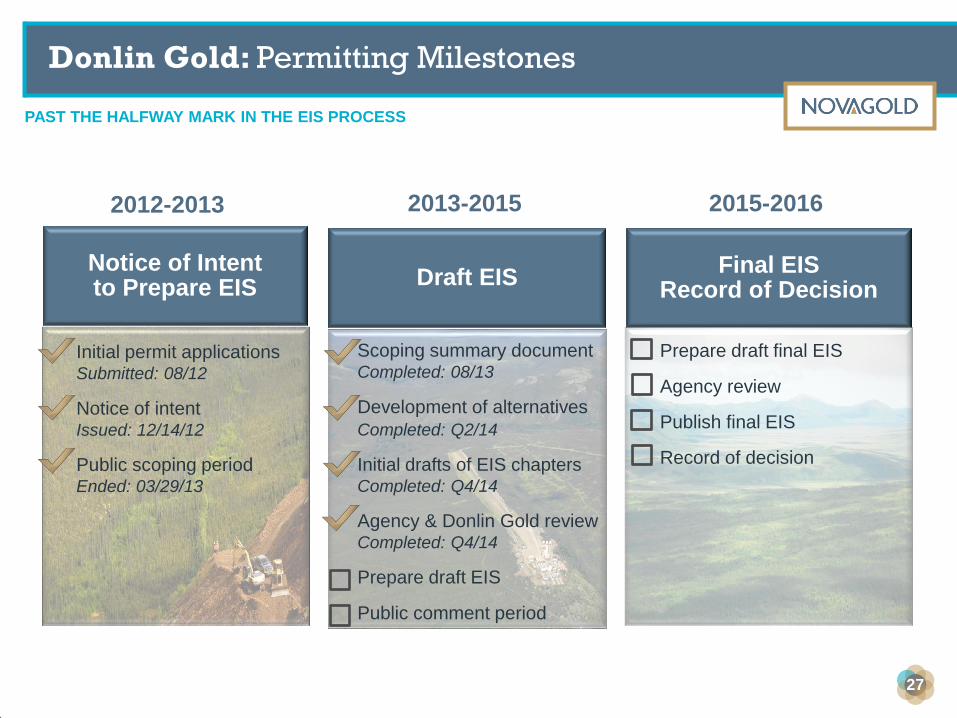
Notice of Intent to Prepare EIS
Draft EIS
Final EIS Record of Decision
Initial permit applications Submitted: 08/12
Notice of intent Issued: 12/14/12
Public scoping period Ended: 03/29/13
Scoping summary document Completed: 08/13
Development of alternatives
Completed: Q2/14
Initial drafts of EIS chapters Completed: Q4/14
Agency & Donlin Gold review Completed: Q4/14
Prepare draft EIS
Public comment period
Prepare draft final EIS
Agency review
Publish final EIS
Record of decision
2012-2013 2013-2015 2015-2016
PAST THE HALFWAY MARK IN THE EIS PROCESS
Donlin Gold: Permitting Milestones
27
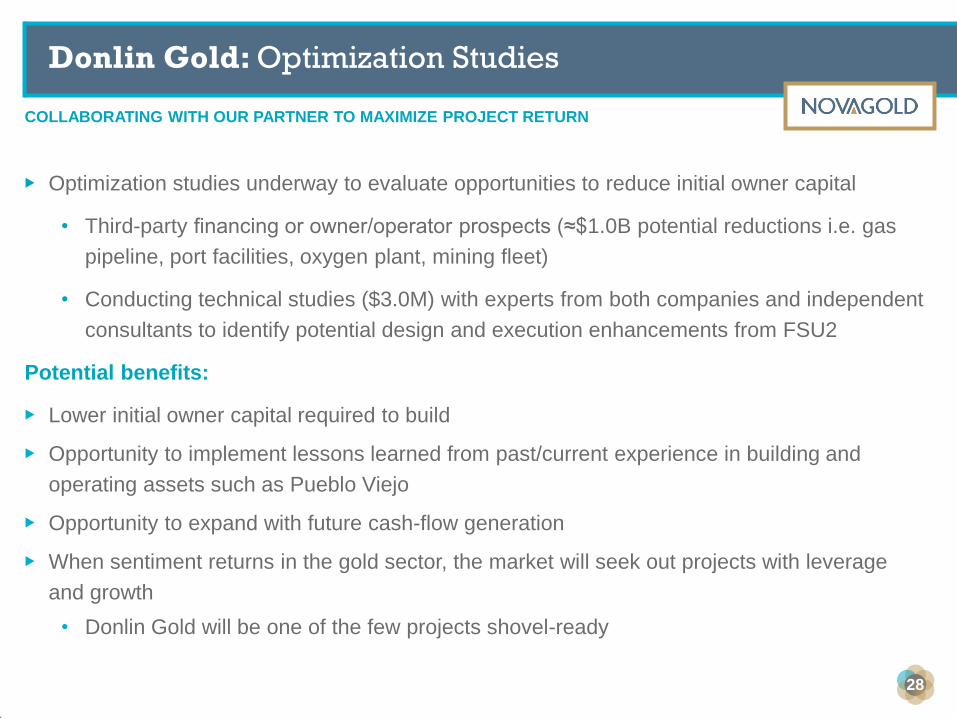
COLLABORATING WITH OUR PARTNER TO MAXIMIZE PROJECT RETURN
Donlin Gold: Optimization Studies
28
▶ Optimization studies underway to evaluate opportunities to reduce initial owner capital
• Third-party financing or owner/operator prospects (≈$1.0B potential reductions i.e. gas
pipeline, port facilities, oxygen plant, mining fleet)
• Conducting technical studies ($3.0M) with experts from both companies and independent
consultants to identify potential design and execution enhancements from FSU2
Potential benefits:
▶ Lower initial owner capital required to build
▶ Opportunity to implement lessons learned from past/current experience in building and
operating assets such as Pueblo Viejo
▶ Opportunity to expand with future cash-flow generation
▶ When sentiment returns in the gold sector, the market will seek out projects with leverage
and growth
• Donlin Gold will be one of the few projects shovel-ready
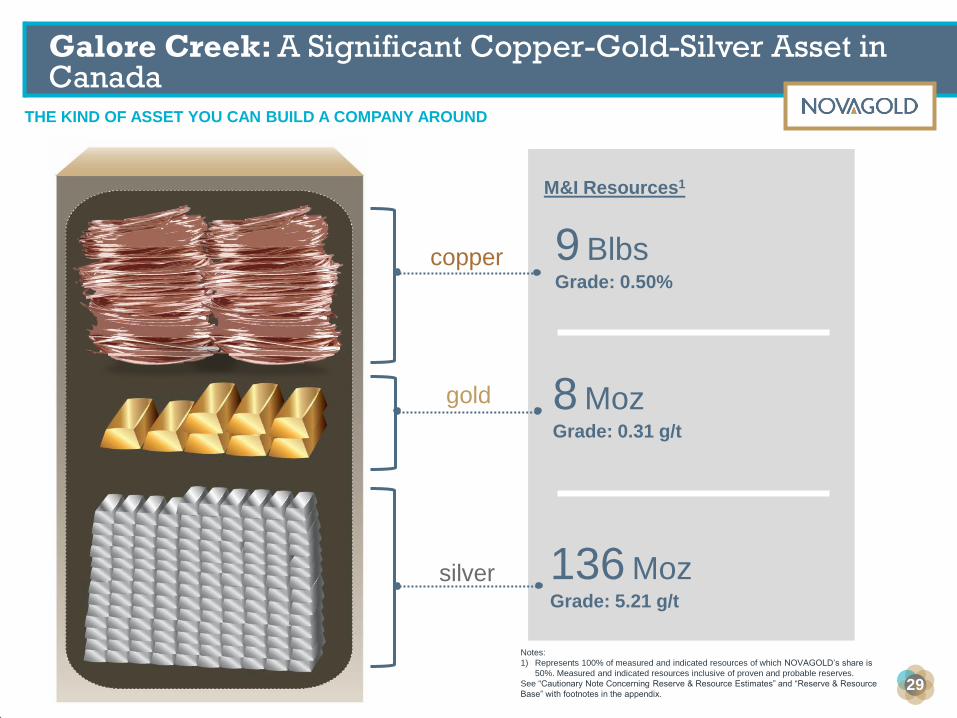
THE KIND OF ASSET YOU CAN BUILD A COMPANY AROUND
Galore Creek: A Significant Copper-Gold-Silver Asset in Canada
Notes:
1) Represents 100% of measured and indicated resources of which NOVAGOLD’s share is
50%. Measured and indicated resources inclusive of proven and probable reserves.
See “Cautionary Note Concerning Reserve & Resource Estimates” and “Reserve & Resource
Base” with footnotes in the appendix.
9 Blbs Grade: 0.50%
8 Moz Grade: 0.31 g/t
136 Moz Grade: 5.21 g/t
copper
gold
silver
M&I Resources1
29

AMONG HIGHEST COPPER GRADE COMPARED TO NORTH AMERICAN ASSETS
Galore Creek: Peer Comparison
P&P + M&I grade (Cu%)
Notes:
Data as per SNL MEG’s MineSearch database, Company reports, SNL MEG estimates.
30
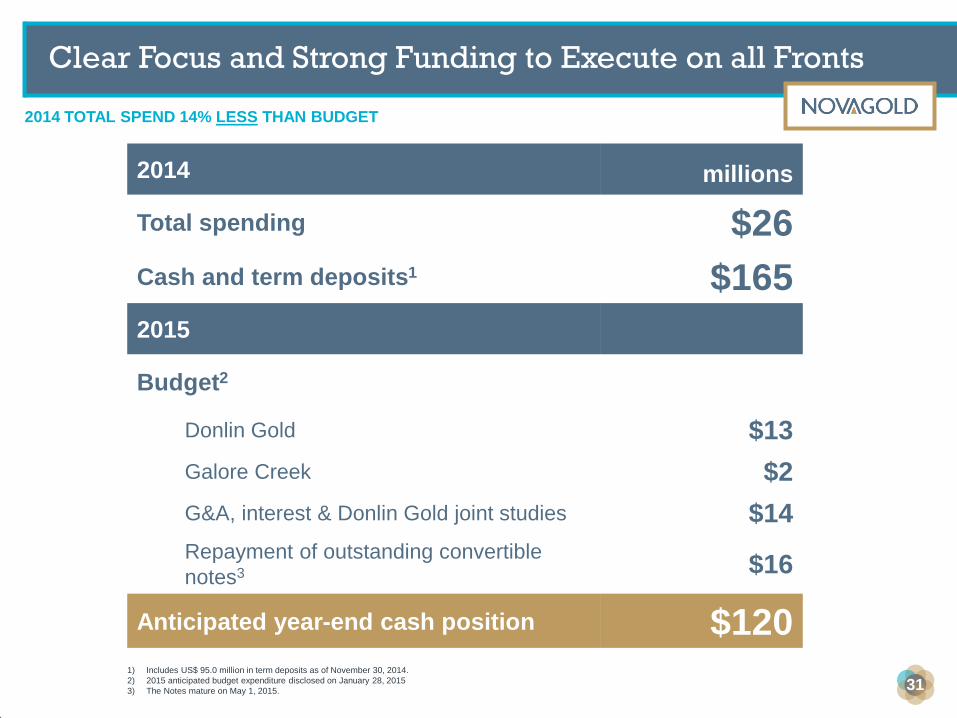
2014 millions
Total spending $26
Cash and term deposits1 $165
2015
Budget2
Donlin Gold $13
Galore Creek $2
G&A, interest & Donlin Gold joint studies $14
Repayment of outstanding convertible
notes3 $16
Anticipated year-end cash position $120 1) Includes US$ 95.0 million in term deposits as of November 30, 2014.
2) 2015 anticipated budget expenditure disclosed on January 28, 2015
3) The Notes mature on May 1, 2015.
2014 TOTAL SPEND 14% LESS THAN BUDGET
Clear Focus and Strong Funding to Execute on all Fronts
31
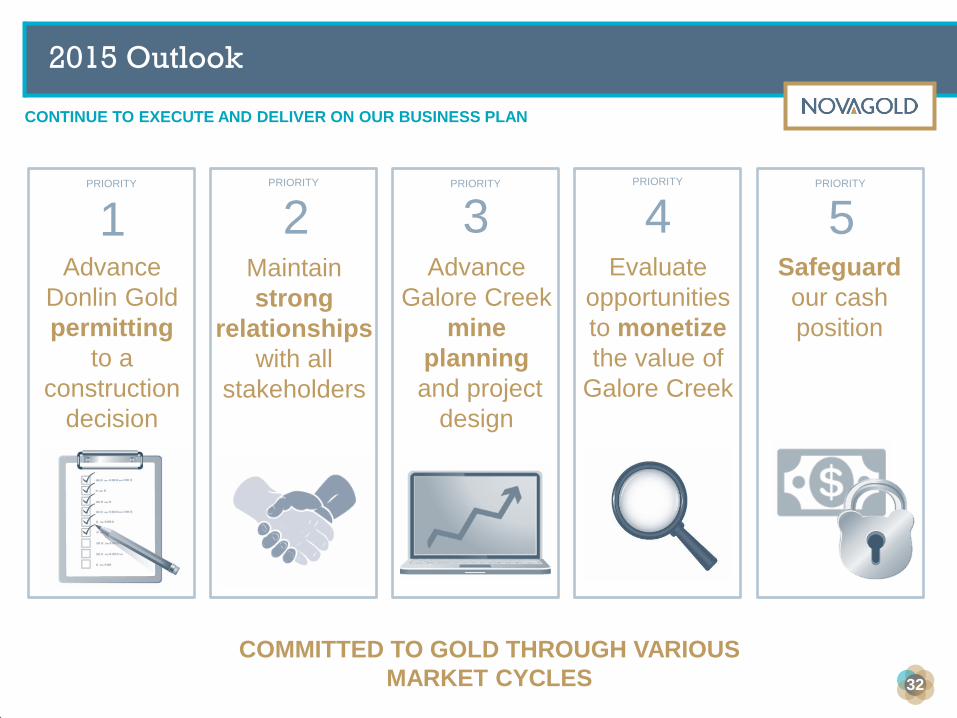
CONTINUE TO EXECUTE AND DELIVER ON OUR BUSINESS PLAN
2015 Outlook
1 2 3 4 5 PRIORITY PRIORITY PRIORITY PRIORITY PRIORITY
Advance
Donlin Gold
permitting
to a
construction
decision
Advance
Galore Creek
mine
planning
and project
design
Evaluate
opportunities
to monetize
the value of
Galore Creek
Safeguard
our cash
position
Maintain
strong
relationships
with all
stakeholders
COMMITTED TO GOLD THROUGH VARIOUS
MARKET CYCLES 32
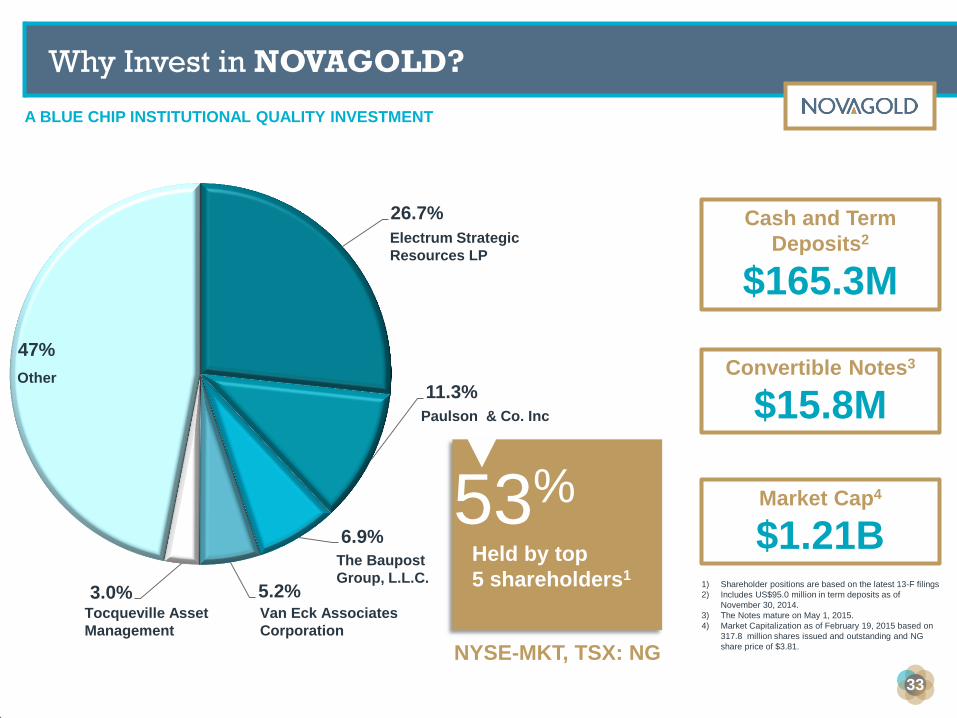
26.7%
11.3%
6.9%
5.2% 3.0%
47%
A BLUE CHIP INSTITUTIONAL QUALITY INVESTMENT
Why Invest in NOVAGOLD?
Held by top
5 shareholders1
53%
Electrum Strategic
Resources LP
Paulson & Co. Inc
The Baupost
Group, L.L.C.
Van Eck Associates
Corporation
Tocqueville Asset
Management
Other
Market Cap4
$1.21B
Cash and Term
Deposits2
$165.3M
Convertible Notes3
$15.8M
1) Shareholder positions are based on the latest 13-F filings
2) Includes US$95.0 million in term deposits as of
November 30, 2014.
3) The Notes mature on May 1, 2015.
4) Market Capitalization as of February 19, 2015 based on
317.8 million shares issued and outstanding and NG
share price of $3.81.
NYSE-MKT, TSX: NG
33
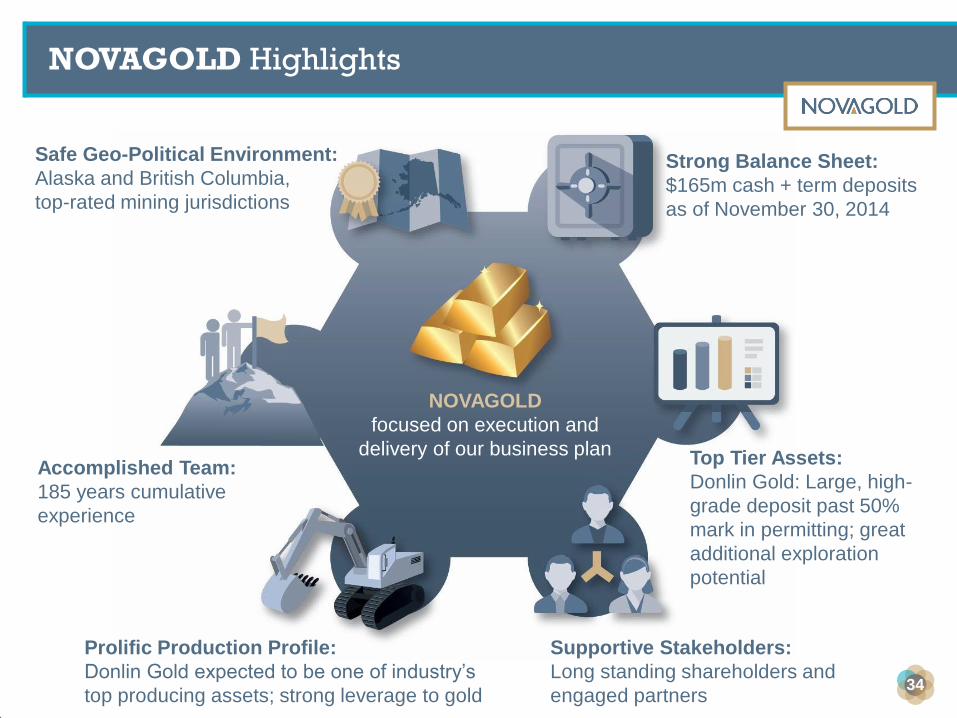
NOVAGOLD
focused on execution and
delivery of our business plan
NOVAGOLD Highlights
Safe Geo-Political Environment:
Alaska and British Columbia,
top-rated mining jurisdictions
Accomplished Team:
185 years cumulative
experience
Prolific Production Profile:
Donlin Gold expected to be one of industry’s
top producing assets; strong leverage to gold
Supportive Stakeholders:
Long standing shareholders and
engaged partners
Strong Balance Sheet:
$165m cash + term deposits
as of November 30, 2014
Top Tier Assets:
Donlin Gold: Large, high-
grade deposit past 50%
mark in permitting; great
additional exploration
potential
34
novagold.com
Appendix
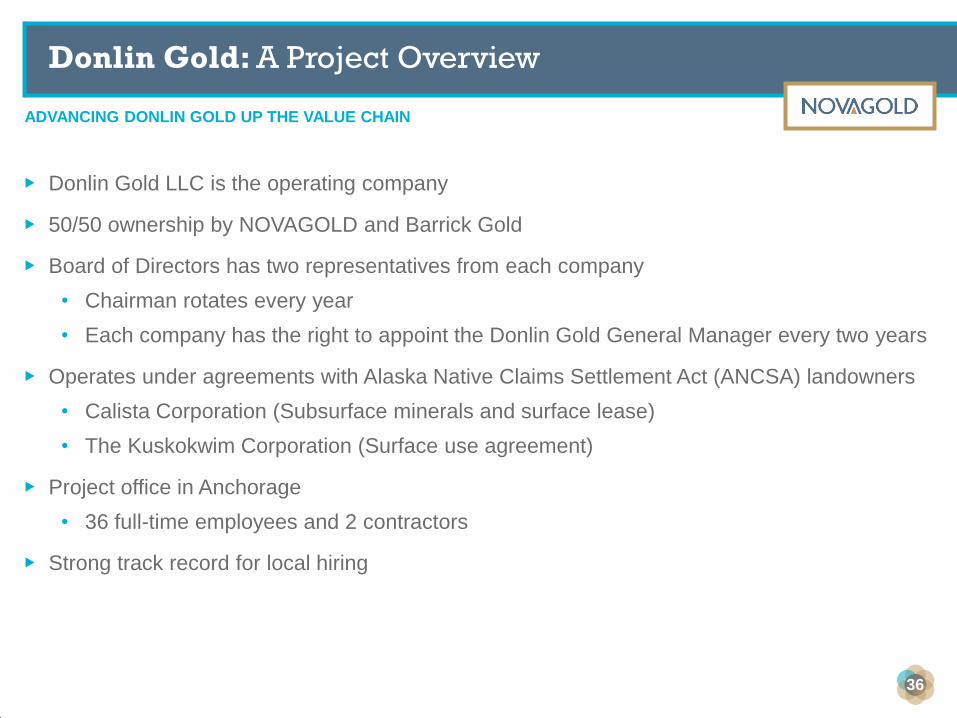
ADVANCING DONLIN GOLD UP THE VALUE CHAIN
Donlin Gold: A Project Overview
36
▶ Donlin Gold LLC is the operating company
▶ 50/50 ownership by NOVAGOLD and Barrick Gold
▶ Board of Directors has two representatives from each company
• Chairman rotates every year
• Each company has the right to appoint the Donlin Gold General Manager every two years
▶ Operates under agreements with Alaska Native Claims Settlement Act (ANCSA) landowners
• Calista Corporation (Subsurface minerals and surface lease)
• The Kuskokwim Corporation (Surface use agreement)
▶ Project office in Anchorage
• 36 full-time employees and 2 contractors
▶ Strong track record for local hiring
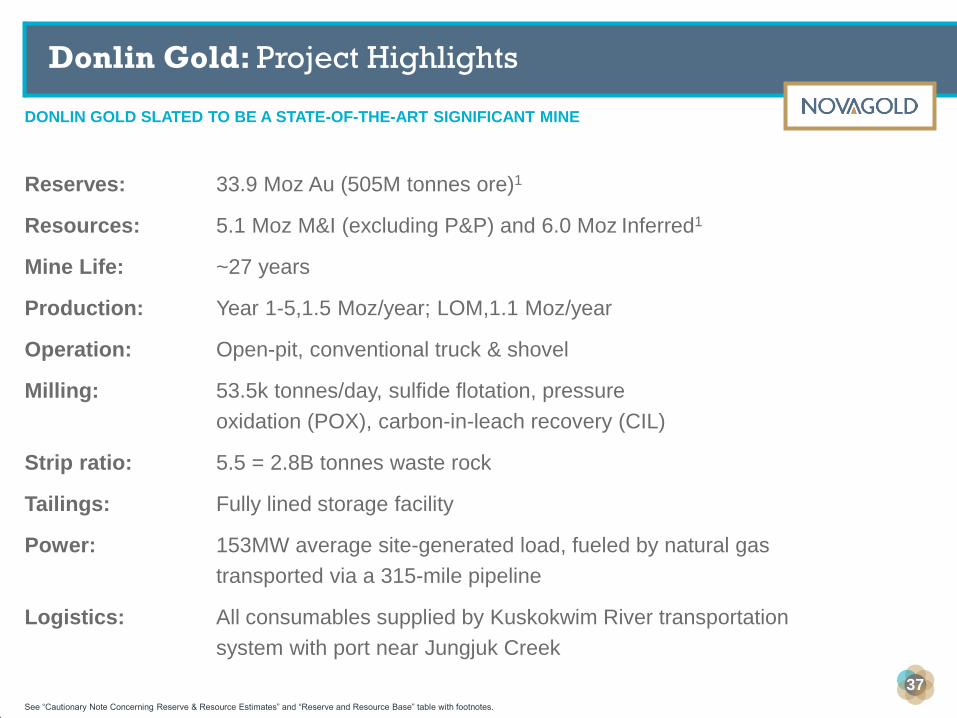
DONLIN GOLD SLATED TO BE A STATE-OF-THE-ART SIGNIFICANT MINE
Donlin Gold: Project Highlights
Reserves: 33.9 Moz Au (505M tonnes ore)1
Resources: 5.1 Moz M&I (excluding P&P) and 6.0 Moz Inferred1
Mine Life: ~27 years
Production: Year 1-5,1.5 Moz/year; LOM,1.1 Moz/year
Operation: Open-pit, conventional truck & shovel
Milling: 53.5k tonnes/day, sulfide flotation, pressure
oxidation (POX), carbon-in-leach recovery (CIL)
Strip ratio: 5.5 = 2.8B tonnes waste rock
Tailings: Fully lined storage facility
Power: 153MW average site-generated load, fueled by natural gas
transported via a 315-mile pipeline
Logistics: All consumables supplied by Kuskokwim River transportation
system with port near Jungjuk Creek
See “Cautionary Note Concerning Reserve & Resource Estimates” and “Reserve and Resource Base” table with footnotes.
37
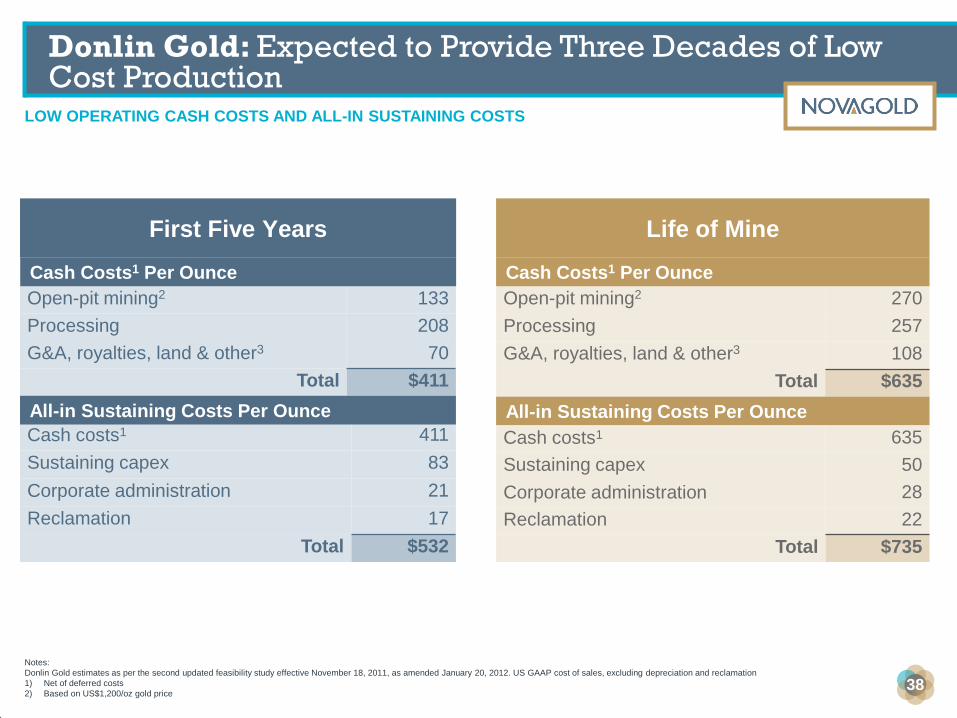
Donlin Gold: Expected to Provide Three Decades of Low Cost Production
LOW OPERATING CASH COSTS AND ALL-IN SUSTAINING COSTS
Open-pit mining2 270
Processing 257
G&A, royalties, land & other3 108
Total $635
Open-pit mining2 133
Processing 208
G&A, royalties, land & other3 70
Total $411
Cash Costs1 Per Ounce
First Five Years
Notes:
Donlin Gold estimates as per the second updated feasibility study effective November 18, 2011, as amended January 20, 2012. US GAAP cost of sales, excluding depreciation and reclamation
1) Net of deferred costs
2) Based on US$1,200/oz gold price
All-in Sustaining Costs Per Ounce
Cash costs1 635
Sustaining capex 50
Corporate administration 28
Reclamation 22
Total $735
Cash costs1 411
Sustaining capex 83
Corporate administration 21
Reclamation 17
Total $532
Life of Mine
Cash Costs1 Per Ounce
All-in Sustaining Costs Per Ounce
38
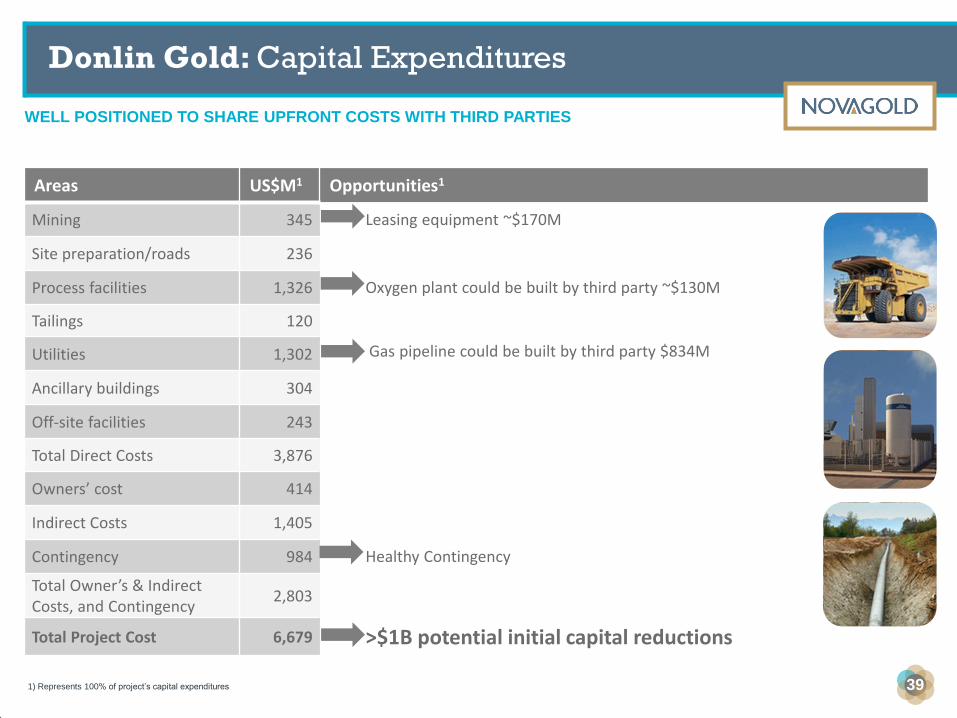
WELL POSITIONED TO SHARE UPFRONT COSTS WITH THIRD PARTIES
Donlin Gold: Capital Expenditures
Areas US$M1 Opportunities1
Mining 345 Leasing equipment ~$170M
Site preparation/roads 236
Process facilities 1,326 Oxygen plant could be built by third party ~$130M
Tailings 120
Utilities 1,302
Ancillary buildings 304
Off-site facilities 243
Total Direct Costs 3,876
Owners’ cost 414
Indirect Costs 1,405
Contingency 984 Healthy Contingency
Total Owner’s & Indirect Costs, and Contingency
2,803
Total Project Cost 6,679 >$1B potential initial capital reductions
Gas pipeline could be built by third party $834M
1) Represents 100% of project’s capital expenditures 39
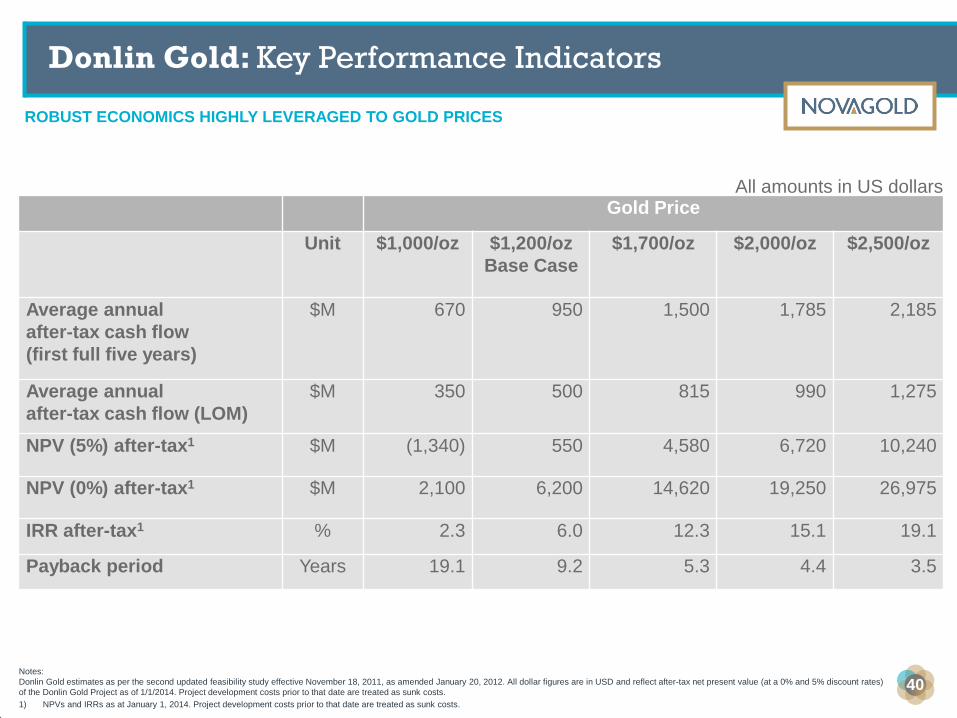
ROBUST ECONOMICS HIGHLY LEVERAGED TO GOLD PRICES
Donlin Gold: Key Performance Indicators
Gold Price
Unit $1,000/oz $1,200/oz
Base Case
$1,700/oz $2,000/oz $2,500/oz
Average annual
after-tax cash flow
(first full five years)
$M 670 950 1,500 1,785 2,185
Average annual
after-tax cash flow (LOM)
$M 350 500 815 990 1,275
NPV (5%) after-tax1 $M (1,340) 550 4,580 6,720 10,240
NPV (0%) after-tax1 $M 2,100 6,200 14,620 19,250 26,975
IRR after-tax1 % 2.3 6.0 12.3 15.1 19.1
Payback period Years 19.1 9.2 5.3 4.4 3.5
Notes:
Donlin Gold estimates as per the second updated feasibility study effective November 18, 2011, as amended January 20, 2012. All dollar figures are in USD and reflect after-tax net present value (at a 0% and 5% discount rates)
of the Donlin Gold Project as of 1/1/2014. Project development costs prior to that date are treated as sunk costs.
All amounts in US dollars
1) NPVs and IRRs as at January 1, 2014. Project development costs prior to that date are treated as sunk costs.
40
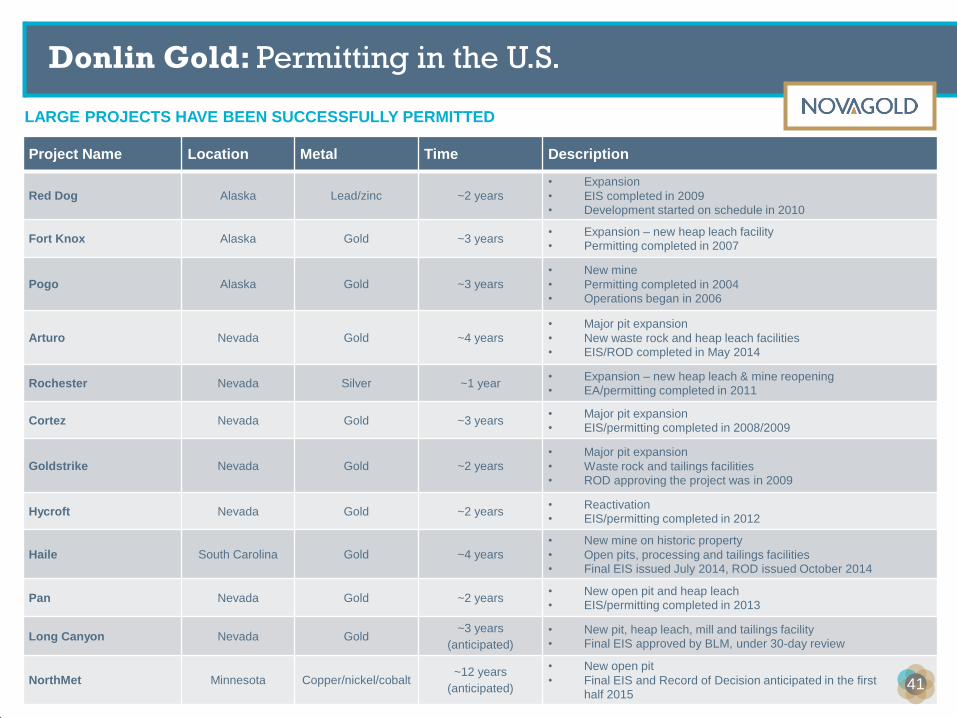
LARGE PROJECTS HAVE BEEN SUCCESSFULLY PERMITTED
Donlin Gold: Permitting in the U.S.
Project Name Location Metal Time Description
Red Dog Alaska Lead/zinc ~2 years • Expansion
• EIS completed in 2009
• Development started on schedule in 2010
Fort Knox Alaska Gold ~3 years • Expansion – new heap leach facility
• Permitting completed in 2007
Pogo Alaska Gold ~3 years • New mine
• Permitting completed in 2004
• Operations began in 2006
Arturo Nevada Gold ~4 years • Major pit expansion
• New waste rock and heap leach facilities
• EIS/ROD completed in May 2014
Rochester Nevada Silver ~1 year • Expansion – new heap leach & mine reopening
• EA/permitting completed in 2011
Cortez Nevada Gold ~3 years • Major pit expansion • EIS/permitting completed in 2008/2009
Goldstrike Nevada Gold ~2 years • Major pit expansion
• Waste rock and tailings facilities
• ROD approving the project was in 2009
Hycroft Nevada Gold ~2 years • Reactivation
• EIS/permitting completed in 2012
Haile South Carolina Gold ~4 years • New mine on historic property
• Open pits, processing and tailings facilities
• Final EIS issued July 2014, ROD issued October 2014
Pan Nevada Gold ~2 years • New open pit and heap leach
• EIS/permitting completed in 2013
Long Canyon Nevada Gold ~3 years
(anticipated)
• New pit, heap leach, mill and tailings facility
• Final EIS approved by BLM, under 30-day review
NorthMet Minnesota Copper/nickel/cobalt ~12 years
(anticipated)
• New open pit
• Final EIS and Record of Decision anticipated in the first
half 2015 41 41
GALORE CREEK, AN EXCEPTIONAL ASSET
Galore Creek: Project Overview
42
▶ Galore Creek Mining Corporation (GCMC) is the operating company
▶ 50/50 ownership by NOVAGOLD and Teck Resources Inc.
▶ Management Committee has two representatives from each company
• Chairman rotates every year
▶ Project is located within the Tahltan Nation Territory and operates under a Participation
Agreement
▶ All mineral claims are on Crown land
▶ Project office in Vancouver
• Abundance of technical strength to draw from within Teck
▶ Strong track record for Tahltan hiring at project site as well as contracting and procurement
with Tahltan businesses and joint ventures
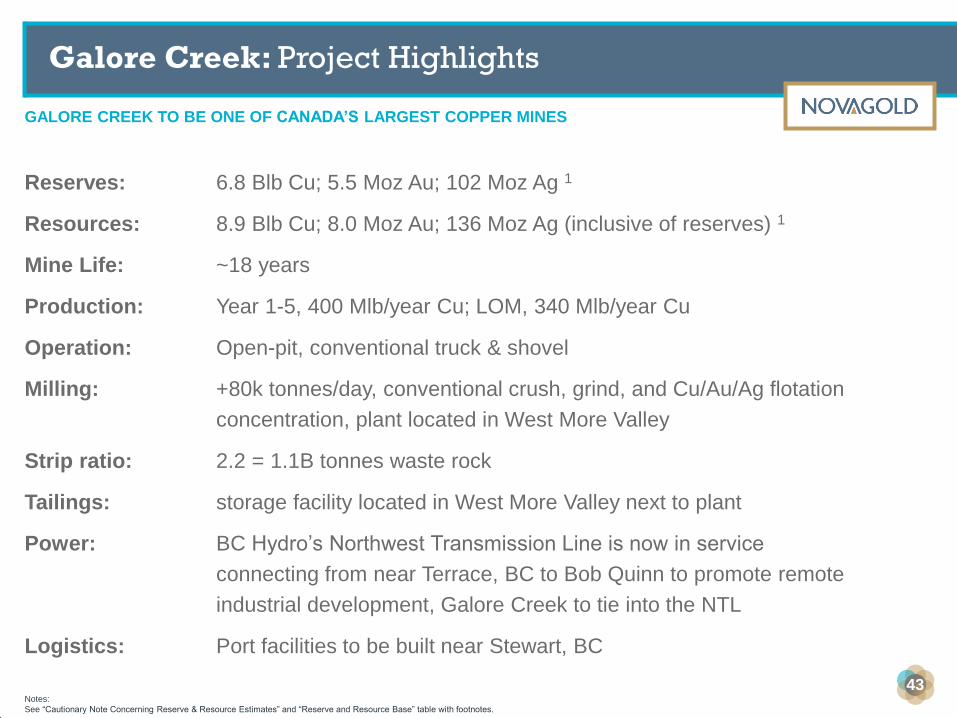
GALORE CREEK TO BE ONE OF CANADA’S LARGEST COPPER MINES
Galore Creek: Project Highlights
Reserves: 6.8 Blb Cu; 5.5 Moz Au; 102 Moz Ag 1
Resources: 8.9 Blb Cu; 8.0 Moz Au; 136 Moz Ag (inclusive of reserves) 1
Mine Life: ~18 years
Production: Year 1-5, 400 Mlb/year Cu; LOM, 340 Mlb/year Cu
Operation: Open-pit, conventional truck & shovel
Milling: +80k tonnes/day, conventional crush, grind, and Cu/Au/Ag flotation
concentration, plant located in West More Valley
Strip ratio: 2.2 = 1.1B tonnes waste rock
Tailings: storage facility located in West More Valley next to plant
Power: BC Hydro’s Northwest Transmission Line is now in service
connecting from near Terrace, BC to Bob Quinn to promote remote
industrial development, Galore Creek to tie into the NTL
Logistics: Port facilities to be built near Stewart, BC
Notes:
See “Cautionary Note Concerning Reserve & Resource Estimates” and “Reserve and Resource Base” table with footnotes.
43
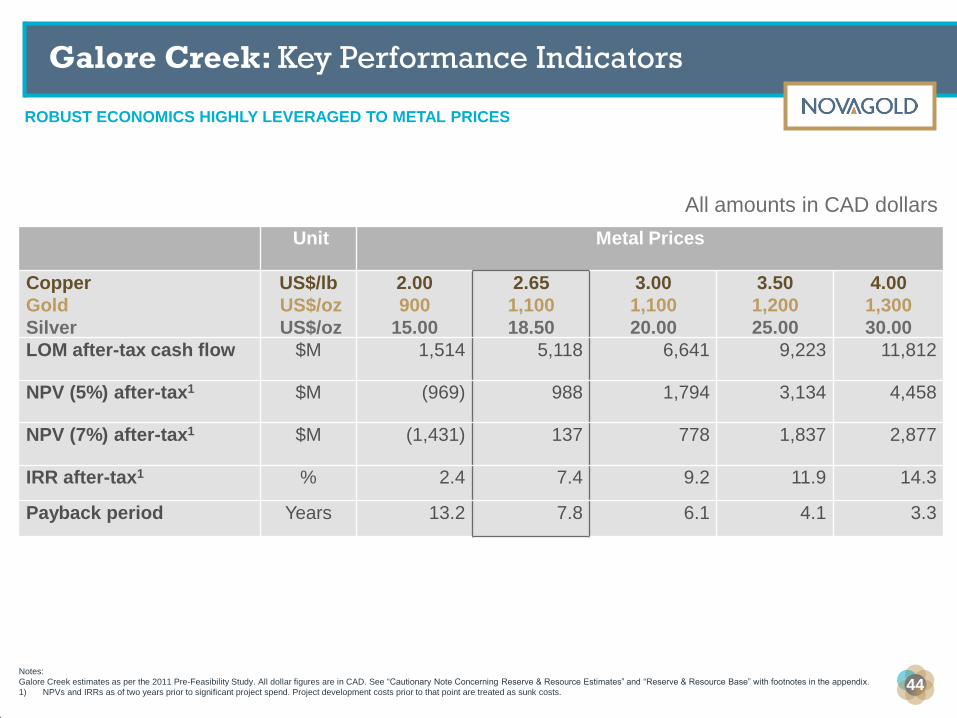
ROBUST ECONOMICS HIGHLY LEVERAGED TO METAL PRICES
Galore Creek: Key Performance Indicators
Unit
Metal Prices
Copper
Gold
Silver
US$/lb
US$/oz
US$/oz
2.00
900
15.00
2.65
1,100
18.50
3.00
1,100
20.00
3.50
1,200
25.00
4.00
1,300
30.00
LOM after-tax cash flow $M 1,514 5,118 6,641 9,223 11,812
NPV (5%) after-tax1 $M (969) 988 1,794 3,134 4,458
NPV (7%) after-tax1 $M (1,431) 137 778 1,837 2,877
IRR after-tax1 % 2.4 7.4 9.2 11.9 14.3
Payback period Years 13.2 7.8 6.1 4.1 3.3
Notes:
Galore Creek estimates as per the 2011 Pre-Feasibility Study. All dollar figures are in CAD. See “Cautionary Note Concerning Reserve & Resource Estimates” and “Reserve & Resource Base” with footnotes in the appendix.
1) NPVs and IRRs as of two years prior to significant project spend. Project development costs prior to that point are treated as sunk costs.
All amounts in CAD dollars
44
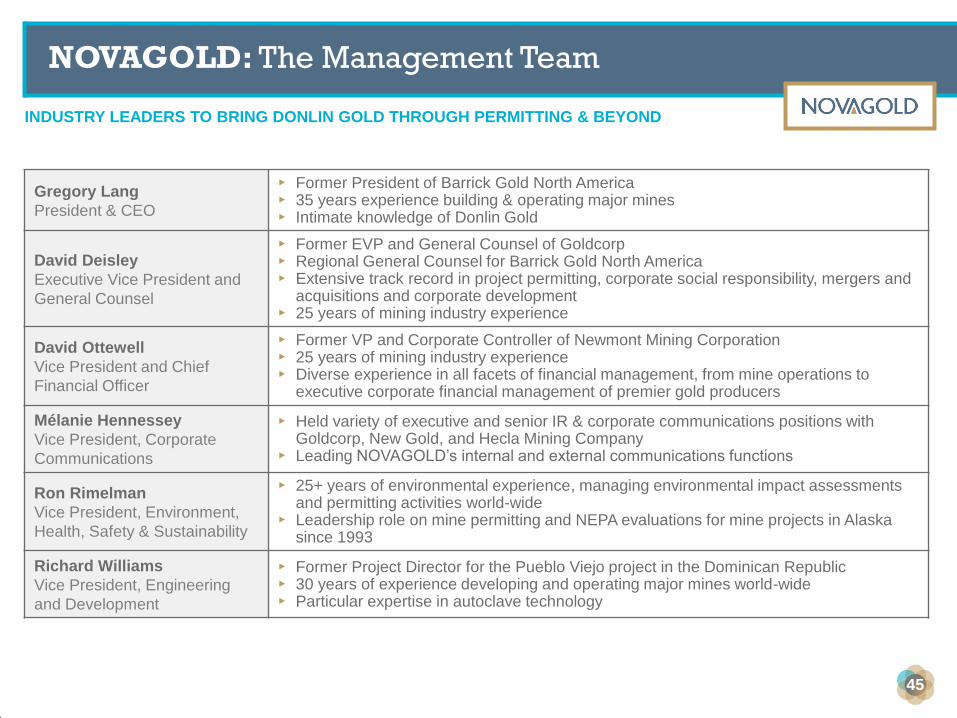
NOVAGOLD: The Management Team
Gregory Lang
President & CEO
▸ Former President of Barrick Gold North America ▸ 35 years experience building & operating major mines ▸ Intimate knowledge of Donlin Gold
David Deisley
Executive Vice President and
General Counsel
▸ Former EVP and General Counsel of Goldcorp ▸ Regional General Counsel for Barrick Gold North America ▸ Extensive track record in project permitting, corporate social responsibility, mergers and
acquisitions and corporate development ▸ 25 years of mining industry experience
David Ottewell
Vice President and Chief
Financial Officer
▸ Former VP and Corporate Controller of Newmont Mining Corporation ▸ 25 years of mining industry experience ▸ Diverse experience in all facets of financial management, from mine operations to
executive corporate financial management of premier gold producers
Mélanie Hennessey
Vice President, Corporate
Communications
▸ Held variety of executive and senior IR & corporate communications positions with Goldcorp, New Gold, and Hecla Mining Company
▸ Leading NOVAGOLD’s internal and external communications functions
Ron Rimelman
Vice President, Environment,
Health, Safety & Sustainability
▸ 25+ years of environmental experience, managing environmental impact assessments and permitting activities world-wide
▸ Leadership role on mine permitting and NEPA evaluations for mine projects in Alaska since 1993
Richard Williams
Vice President, Engineering
and Development
▸ Former Project Director for the Pueblo Viejo project in the Dominican Republic ▸ 30 years of experience developing and operating major mines world-wide ▸ Particular expertise in autoclave technology
INDUSTRY LEADERS TO BRING DONLIN GOLD THROUGH PERMITTING & BEYOND
45

NOVAGOLD: The Board of Directors
Dr. Thomas Kaplan
Chairman
Chairman and CIO of The Electrum Group LLC, a privately held natural resources investor
that controls a diversified portfolio of precious and base metals assets
Sharon Dowdall Former Chief Legal Officer and Corporate Secretary with Franco-Nevada, transforming an
industry pioneer into one of the most successful precious metals enterprises in the world
Dr. Marc Faber A well-known commentator and author on global investing, publisher of The Gloom, Boom &
Doom Report
Greg Lang
President & CEO
Former President of Barrick Gold North America, 35 years experience building & operating major mines with intimate knowledge of Donlin Gold
Gil Leathley COO and Director of Sunward Resources, former Senior Vice President and Chief Operating
Officer of the Company
Igor Levental President of The Electrum Group LLC, former VP of Homestake Mining and International
Corona Corp.
Kalidas Madhavpeddi Overseas Chief Executive Officer of China Moly Corp. Former Executive with Phelps Dodge.
Gerald McConnell Former Chairman and CEO of NOVAGOLD, CEO of Namibia Rare Earths Inc.
Clynton Nauman CEO of Alexco Resources, formerly with Viceroy Gold and Kennecott Minerals
Rick Van Nieuwenhuyse CEO of NovaCopper, founder and former CEO of NOVAGOLD
Anthony Walsh Former President and Chief Executive Officer of Miramar Mining Corporation, which in 2007
was sold to Newmont Mining Corporation.
46
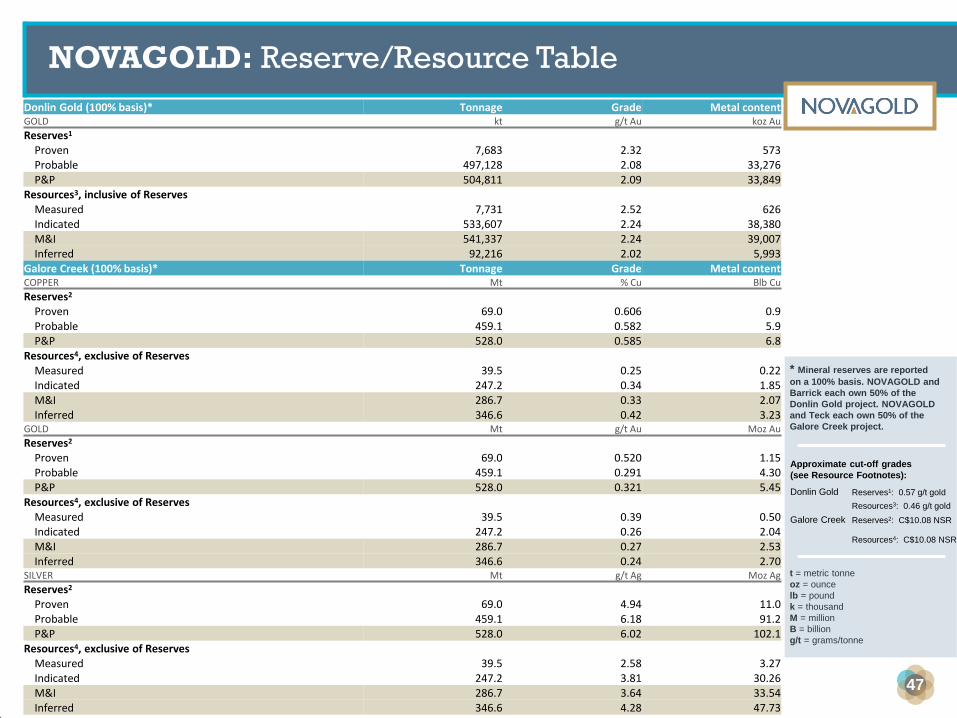
NOVAGOLD: Reserve/Resource Table
47
Donlin Gold (100% basis)* Tonnage Grade Metal content GOLD kt g/t Au koz Au
Reserves1 Proven 7,683 2.32 573 Probable 497,128 2.08 33,276 P&P 504,811 2.09 33,849 Resources3, inclusive of Reserves Measured 7,731 2.52 626 Indicated 533,607 2.24 38,380 M&I 541,337 2.24 39,007 Inferred 92,216 2.02 5,993 Galore Creek (100% basis)* Tonnage Grade Metal content COPPER Mt % Cu Blb Cu
Reserves2 Proven 69.0 0.606 0.9 Probable 459.1 0.582 5.9 P&P 528.0 0.585 6.8 Resources4, exclusive of Reserves Measured 39.5 0.25 0.22 Indicated 247.2 0.34 1.85 M&I 286.7 0.33 2.07 Inferred 346.6 0.42 3.23 GOLD Mt g/t Au Moz Au
Reserves2 Proven 69.0 0.520 1.15 Probable 459.1 0.291 4.30 P&P 528.0 0.321 5.45 Resources4, exclusive of Reserves Measured 39.5 0.39 0.50 Indicated 247.2 0.26 2.04 M&I 286.7 0.27 2.53 Inferred 346.6 0.24 2.70 SILVER Mt g/t Ag Moz Ag
Reserves2 Proven 69.0 4.94 11.0 Probable 459.1 6.18 91.2 P&P 528.0 6.02 102.1 Resources4, exclusive of Reserves Measured 39.5 2.58 3.27 Indicated 247.2 3.81 30.26 M&I 286.7 3.64 33.54 Inferred 346.6 4.28 47.73
* Mineral reserves are reported
on a 100% basis. NOVAGOLD and
Barrick each own 50% of the
Donlin Gold project. NOVAGOLD
and Teck each own 50% of the
Galore Creek project.
t = metric tonne
oz = ounce
lb = pound
k = thousand
M = million
B = billion
g/t = grams/tonne
Approximate cut-off grades
(see Resource Footnotes):
Donlin Gold Reserves1: 0.57 g/t gold
Resources3: 0.46 g/t gold
Galore Creek Reserves2: C$10.08 NSR
Resources4: C$10.08 NSR

Notes:
a. These resource estimates have been prepared in accordance with NI43-101 and the CIM Definition Standard, unless otherwise noted.
b. See numbered footnotes below on resource information.
c. Rounding as required by reporting guidelines may result in apparent summation differences between tonnes, grade and contained metal content
d. Tonnage and grade measurements are in metric units. Contained gold and silver ounces are reported as troy ounces, contained copper pounds as imperial pounds
Resource Footnotes:
1) Mineral Reserves are contained within Measured and Indicated pit designs, and supported by a mine plan, featuring variable throughput rates, stockpiling and cut-off optimization. The pit designs and mine plan were optimized on diluted
grades using the following economic and technical parameters: Metal price for gold of US$975/oz; reference mining cost of US$1.67/t incremented US$0.0031/t/m with depth from the 220 m elevation (equates to an average mining cost of
US$2.14/t), variable processing cost based on the formula 2.1874 x (S%) + 10.65 for each US$/t processed; general and administrative cost of US$2.27/t processed; stockpile rehandle costs of US$0.19/t processed assuming that 45% of
mill feed is rehandled; variable recoveries by rock type, ranging from 86.66% in shale to 94.17% in intrusive rocks in the Akivik domain; refining and freight charges of US$1.78/oz gold; royalty considerations of 4.5%; and variable pit slope
angles, ranging from 23º to 43º. Mineral Reserves are reported using an optimized net sales return value based on the following equation: Net Sales Return = Au grade * Recovery * (US$975/oz – (1.78 + (US$975/oz – 1.78) * 0.045)) -
(10.65 + 2.1874 * (S%) + 2.27 + 0.19) and reported in US$/tonne. Assuming an average recovery of 89.54% and an average S% grade of 1.07%, the marginal gold cutoff grade would be approximately 0.57 g/t, or the gold grade that would
equate to a 0.001 NSR cutoff at these same values. The life of mine strip ratio is 5.48. The assumed life-of-mine throughput rate is 53.5 kt/d.
2) Mineral Reserves are contained within Measured and Indicated pit designs using metal prices for copper, gold and silver of US$2.50/lb, US$1,050/oz, and US$16.85/oz, respectively. Appropriate mining costs, processing costs, metal
recoveries and inter ramp pit slope angles varying from 42º to 55º were used to generate the pit phase designs. Mineral Reserves have been calculated using a 'cashflow grade' ($NSR/SAG mill hr) cut-off which was varied from year to year
to optimize NPV. The net smelter return (NSR) was calculated as follows: NSR = Recoverable Revenue – TCRC (on a per tonne basis), where: NSR = Net Smelter Return; TCRC = Transportation and Refining Costs; Recoverable
Revenue = Revenue in Canadian dollars for recoverable copper, recoverable gold, and recoverable silver using metal prices of US$2.50/lb, US$1,050/oz, and US$16.85/oz for copper, gold, and silver, respectively, at an exchange rate of
CDN$1.1 to US$1.0; Cu Recovery = Recovery for copper based on mineral zone and total copper grade; for Mineral Reserves this NSR calculation includes mining dilution. SAG throughputs were modeled by correlation with alteration
types. Cash flow grades were calculated as the product of NSR value in $/t and throughput in t/hr. The life of mine strip ratio is 2.16.
3) Mineral Resources are contained within a conceptual Measured, Indicated and Inferred optimized pit shell using the following assumptions: gold price of US$1,200/oz; variable process cost based on 2.1874 * (sulphur grade) + 10.6485;
administration cost of US$2.29/t; refining, freight & marketing (selling costs) of US$1.85/oz recovered; stockpile rehandle costs of US$0.20/t processed assuming that 45% of mill feed is rehandled; variable royalty rate, based on royalty of
4.5% * (Au price – selling cost). Mineral Resources have been estimated using a constant Net Sales Return cut-off of US$0.001/t milled. The Net Sales Return was calculated using the formula: Net Sales Return = Au grade * Recovery *
(US$1200/oz – (1.85 + ((US$1200/oz – 1.85) * 0.045)) - (10.65 + 2.1874 * (S%) + 2.29 + 0.20)) and reported in US$/tonne. Mineral Resources are inclusive of Mineral Reserves. Mineral Resources that are not Mineral Reserves do not have
demonstrated economic viability. Inferred Resources are in addition to Measured and Indicated Resources. Inferred Resources have a great amount of uncertainty as to their existence and whether they can be mined legally or
economically. It cannot be assumed that all or any part of the Inferred Resources will ever be upgraded to a higher category. See "Cautionary Note Concerning Reserve & Resource Estimates".
4) Mineral resources are contained within a conceptual Measured, Indicated and Inferred optimized pit shell using the same economic and technical parameters as used for Mineral Reserves. Tonnages are assigned based on proportion of
the block below topography. The overburden/bedrock boundary has been assigned on a whole block basis. Mineral resources have been estimated using a constant NSR cut-off of C$10.08/t milled. The Net Smelter Return (NSR) was
calculated as follows: NSR = Recoverable Revenue – TCRC (on a per tonne basis), where: NSR = Diluted Net Smelter Return; TCRC = Transportation and Refining Costs; Recoverable Revenue = Revenue in Canadian dollars for
recoverable copper, recoverable gold, and recoverable silver using silver using the economic and technical parameters mentioned above. The mineral resource includes material within the conceptual M,I&I pit that is not scheduled for
processing in the mine plan but is above cutoff. Mineral Resources are inclusive of Mineral Reserves. Mineral Resources that are not Mineral Reserves do not have demonstrated economic viability. Inferred Resources are in addition to
Measured and Indicated Resources. Inferred Resources have a great amount of uncertainty as to their existence and whether they can be mined legally or economically. It cannot be assumed that all or any part of the Inferred Resources
will ever be upgraded to a higher category. See "Cautionary Note Concerning Reserve & Resource Estimates".
Cautionary Note Concerning Reserve & Resource Estimates
This summary table uses the term “resources”, “measured resources”, “indicated resources” and “inferred resources”. United States investors are advised that, while such terms are recognized and required by Canadian securities laws, the
United States Securities and Exchange Commission (the “SEC”) does not recognize them. Under United States standards, mineralization may not be classified as a “reserve” unless the determination has been made that the mineralization
could be economically and legally produced or extracted at the time the reserve determination is made. Mineral resources that are not mineral reserves do not have demonstrated economic viability. United States investors are cautioned not to
assume that all or any part of measured or indicated resources will ever be converted into reserves. Further, inferred resources have a great amount of uncertainty as to their existence and as to whether they can be mined legally or
economically. It cannot be assumed that all or any part of the inferred resources will ever be upgraded to a higher category. Therefore, United States investors are also cautioned not to assume that all or any part of the inferred resources
exist, or that they can be mined legally or economically. Disclosure of “contained ounces” is permitted disclosure under Canadian regulations, however, the SEC normally only permits issuers to report “resources” as in place tonnage and
grade without reference to unit measures. Accordingly, information concerning descriptions of mineralization and resources contained in this release may not be comparable to information made public by United States companies subject to
the reporting and disclosure requirements of the SEC.
NI 43-101 is a rule developed by the Canadian Securities Administrators, which established standards for all public disclosure an issuer makes of scientific and technical information concerning mineral projects. Unless otherwise indicated, all
resource estimates contained in this circular have been prepared in accordance with NI 43-101 and the CIM Definition Standards.
Technical Reports and Qualified Persons
The documents referenced below provide supporting technical information for each of NOVAGOLD's projects.
Project Qualified Person(s) Most Recent Disclosure & Filing Date
Donlin Gold Gordon Seibel R.M. SME, AMEC “Donlin Creek Gold Project Alaska, USA, NI 43-101 Technical Report on Second Updated Feasibility Study” effective November 18, 2011, amended January 20, 2012.
Kirk Hanson P.E., AMEC
Galore Creek Jay Melnyk, P.Eng., AMEC “Galore Creek Copper-Gold Project NI 43-101 Technical Report on Pre-Feasibility Study, British Columbia – Canada” effective July 27, 2011.
Greg Kulla, P.Geo., AMEC
Heather White, B.Sc., P.Eng., who is a consultant to NOVAGOLD and a “qualified person” under NI 43-101, has approved the scientific and technical information included in this Reserve and Resource Table.
NOVAGOLD: Reserve/Resource Table (con’t)
48
NOVAGOLD RESOURCES INC.
Suite 720 – 789 West Pender Street
Vancouver, BC
Canada V6C 1H2
T 604 669 6227 TF 1 866 669 6227 F 604 669 6272
www.novagold.com
Mélanie Hennessey
VP, Corporate Communications
Erin O’Toole
Analyst, Investor Relations
Contact Us
49