PCR INO Community and Local Gov Support FINAL VERSION · INO: Community and Local Government...
82
Completion Report Project Number: 32103 Loan Number: 1677/1678 October 2006 INO: Community and Local Government Support Sector Development Program
Transcript of PCR INO Community and Local Gov Support FINAL VERSION · INO: Community and Local Government...

Completion Report
Project Number: 32103 Loan Number: 1677/1678 October 2006
INO: Community and Local Government Support Sector Development Program

CURRENCY EQUIVALENTS
Currency Unit – rupiah (Rp)
At Appraisal At Program Completion (28 February 1999) (21 December 2001 [Program Loan])
Rp1.00 = $0.000117 $0.000100 $1.00 = Rp8,550 Rp10,050
ABBREVIATIONS
ADB – Asian Development Bank APBD – Anggaran Pendapatan dan Belanja Daerah (local government
budget) BAPPENAS – Badan Perencanaan Pembangunan Nasional (National
Development Planning Board) BPKP -- Badan Pemeriksa Keuangan Pembangunan (State Auditor) CF – conversion factor CLGS – community and local government support CLGSSDP – Community and Local Government Support Sector
Development Project DAK – Dana Alokasi Khusus (special budgetary allocation) DAU – Dana Alokasi Umum (general budgetary allocation) DIPP – Daftar Isian Pembiayaan Proyek (annual development budget)EIRR – economic internal rate of return IEE – initial environmental examination KDP – Kecamatan Development Project LKMD – lembaga ketahanan masyarakat desa (village resilience
board) NGO – nongovernment organization O&M – operation and maintenance PCR – project completion report PCT – provincial coordination teams PMC – project management consultant PMO – project management office PMU – project management unit PPME – participatory planning, monitoring, and evaluation RRP – Report and Recommendation to the President TA – technical assistance SERD – Southeast Asia Department UPP – Urban Poverty Project

GLOSSARY
program – The Community and Local Government Support Sector
Development Program (CLGSSDP) refers to the policy loan and the accompanying investment or project loan through which individual micro-level subprojects were funded and referred to in the report as type A or type B subprojects.
desa – Village juklak-juknis
– detailed technical and operational handbooks for subproject implementation
kabupaten – regency or district kecamatan – subdistrict of a regency kelurahan – smallest administrative unit of a city keppres – presidential decree kota – city or district pedoman umum
– general guidelines for CLGSSDP program implementation issued by Bappenas
tim inti – the core team
NOTES
(i) The fiscal year (FY) of the Government of Indonesia ends on 31 December. (ii) In this report, "$" refers to US dollars.
Vice President C. Lawrence Greenwood, Jr., Operations Group 2 Director General R. Nag, Southeast Asia Department (SERD) Director S. Lateef, Social Sectors Division, SERD Team leader F. Steinberg, Housing and Urban Development Specialist, SERD Team member R. Alvarez, Assistant Project Analyst, SERD

CONTENTS
Page
BASIC DATA ii
MAP vii
I. PROGRAM DESCRIPTION 1 II. EVALUATION OF DESIGN AND IMPLEMENTATION 3
A. Relevance of Design and Formulation 3 B. Program Outputs 5 C. Program Costs 6 D. Disbursements 6 E. Program Schedule 7 F. Implementation Arrangements 8 G. Conditions and Covenants 10 H. Related Technical Assistance 10 I. Consultant Recruitment and Procurement 11 J. Performance of Consultants, Contractors, and Suppliers 12 K. Performance of the Borrower and the Executing Agency 13 L. Performance of the Asian Development Bank 14
III. Evaluation of Performance 14
A. Relevance 14 B. Effectiveness in Achieving Outcome 15 C. Efficiency in Achieving Outcome and Outputs 16 D. Preliminary Assessment of Sustainability 17 E. Impact 18
IV. OVERALL ASSESSMENT AND RECOMMENDATIONS 20
A. Overall Assessment 20 B. Lessons 21 C. Recommendations 24
APPENDIXES 1. Policy Matrix 27 2. Program Framework 35 3. Status of Completion of Investment Project Components 38 4. Revisions in Loan Allocations 57 5. Investment Project Cost by Component 58 6. Program Implementation Schedule 59 7. Program and Investment Project Structures 61 8. Status of Compliance with Loan Covenants 63 9. Financial and Economic Evaluation of Investment Project 69
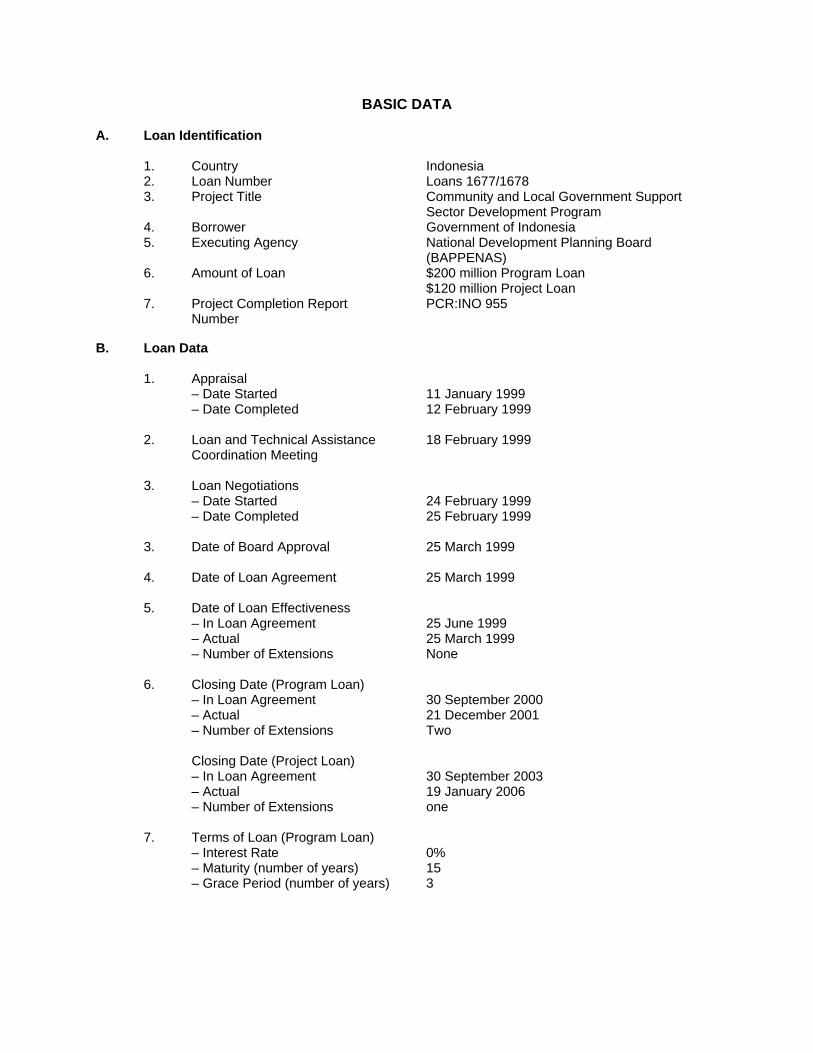
BASIC DATA A. Loan Identification 1. Country 2. Loan Number 3. Project Title
4. Borrower 5. Executing Agency 6. Amount of Loan 7. Project Completion Report
Number
Indonesia Loans 1677/1678 Community and Local Government Support Sector Development Program Government of Indonesia National Development Planning Board (BAPPENAS) $200 million Program Loan $120 million Project Loan PCR:INO 955
B. Loan Data 1. Appraisal – Date Started – Date Completed
2. Loan and Technical Assistance Coordination Meeting
3. Loan Negotiations
– Date Started – Date Completed 3. Date of Board Approval 4. Date of Loan Agreement 5. Date of Loan Effectiveness – In Loan Agreement – Actual – Number of Extensions 6. Closing Date (Program Loan) – In Loan Agreement – Actual – Number of Extensions Closing Date (Project Loan) – In Loan Agreement – Actual – Number of Extensions 7. Terms of Loan (Program Loan) – Interest Rate – Maturity (number of years) – Grace Period (number of years)
11 January 1999 12 February 1999 18 February 1999 24 February 1999 25 February 1999 25 March 1999 25 March 1999 25 June 1999 25 March 1999 None 30 September 2000 21 December 2001 Two 30 September 2003 19 January 2006 one 0% 15 3

iii
Terms of Loan (Project Loan) – Interest Rate – Maturity (number of years) – Grace Period (number of years)
1% (during grace period)1 1.5% (during amortization) 24 4
8. Disbursements
a. Dates
Initial Disbursement
25 March 1999
Final Disbursement
25 November 2005
Time Interval
80 months
Effective Date
25 March 1999
Original Closing Date
30 September 2003
Time Interval
54 months
Effective Date
25 March 1999
Revised Closing Date
19 January 2006
Time Interval
82 months
b. Amount (Project Loan) ($ million)
Last Net Original Revised Amount Amount Amount Undisbursed Category Allocation Allocation Cancelled Available Disbursed Balance 1 Block Grants 94.3 68.2 26.1 68.2 67.2 1.0 1A Type A 54.3 39.5 14.8 39.5 38.9 0.6 1B Type B 40.0 28.7 11.3 28.7 28.3 0.4 2 Capacity Building 16.0 17.2 (1.2) 17.2 16.1 1.1 2A PMO Consultants 3.3 6.2 (2.9) 6.2 5.4 0.8 2B PMU Consultants 4.5 5.7 (1.2) 5.7 5.6 0.2 2C Facilitators 8.2 5.2 3.0 5.2 5.1 0.1 3 Unallocated 9.7 1.0 8.7 1.0 0.0 1.0
Total 120.0 86.4 33.6 86.4 83.3 3.1 Note: Totals may not add up due to rounding. Program Loan Tranche Releases 1st Tranche Release $70.0 million 25 March 1999 2nd Tranche Release $70.0 million 19 December 2000 3rd Tranche Release $60.0 million 21 December 2001 9. Local Costs (Financed) - Amount ($ million) 40.2 - Percent of Local Costs 40 - Percent of Total Cost 28 1 On a grant basis under the Interest Payment Assistance of the Asian Currency Crisis Special Fund.

iv
C. Project Data
1. Program ($ million) Cost Appraisal Estimate Actual
A. Program Loan Foreign Exchange Cost 200.0 200.0
B. Project Loan Foreign Exchange Cost 58.3 43.1 Local Currency Cost 61.7 40.2 Total 320.0 283.3
2. Financing Plan – Project Loan only ($ million) Cost Appraisal Estimate Actual Implementation Costs Borrower Financed 80.0 60.4 ADB Financed 120.0 83.3 Other External Financing 0.0 0.0 Total 200.0 143.7 IDC Costs Borrower Financed 10.7 0.0 ADB Financed 0.0 0.0 Other External Financing 0.0 0.0 Total 10.7 0.0
ADB = Asian Development Bank, IDC = interest during construction. 3. Cost Breakdown by Project Component – Project Loan only ($ million)
Appraisal Actual
Component Foreign
Exchange Local
Currency Total Cost
Foreign Exchange
Local Currency
Total Cost
A. Block Grant to Districts 1. Village Subprojects 19.8 65.7 85.5 13.5 50.6 64.1 2. District Subprojects 42.8 43.2 86.0 26.6 34.1 60.7 Subtotal (A) 62.6 108.9 171.5 40.1 84.7 124.8 B. Project Management/
Capacity Building 1. Central Consultants 1.9 5.1 3.7 3.0 2.4 5.4 2. District Consultants 0.0 5.5 5.5 0.0 5.6 5.6 3. Facilitators 0.0 8.8 8.8 0.0 5.1 5.1 Subtotal (B) 1.9 19.4 18.0 3.0 13.1 16.1 C. Project Management Costs 2.8 2.8
D. Interest During Construction 0.0 10.5 10.5 0.0 0 0
Total 64.5 138.8 200.0 43.1 100.6 143.7

v
4. Program Schedule
Item Appraisal Estimate Actual Contract with Consultants
PMO Consultants January 2000 April 2000 PMU Consultants March 2000 June 2001 PAC Consultants December 2000 March 2003 SSEA Consultants - October 2004
Project Implementation Targeting/Selection of Participating Districts June 1999 June 1999 Development of CLGS Work Plan October 2001 October 2001 Batch 1A Subprojects June 2001 June 2001 Batch 1B Subprojects January 2002 January 2002 Batch 1C Sustainability February 2003 February 2003 Batch 2A Subprojects April 2002 April 2002 Batch 2B Subprojects February 2003 February 2003 Batch 2C Sustainability November 2003 November 2003 Batch 3A Subprojects May 2003 May 2003 Batch 3B Subprojects March 2004 March 2004
Training Procurement of Type A and B Projects October 2000 June 2001 PMU Consultant Training June 2001 June 2001 Facilitator Training Workshop August 2001 August 2001 PPME Facilitators August 2001 August 2001 Report Preparation October 2001 October 2001
Public Awareness Campaign October 2001 March 2003 Participatory Planning, Monitoring, and Evaluation
PPME Field Trips June 2000 August 2001 Establish Reporting System October 2001 October 2001 Conduct of PPME Workshops June 2001 June 2001 Project Review
Mid-Term September 2000 January 2003 Completion March 2005 May 2006
Other Milestones 1st Tranche Release March 1999 March 1999 2nd Tranche Release October 1999 December 2000 3rd Tranche Release March 2000 December 2001
CLGS = community and local government support, PAC = public awareness campaign, PMO = project management office, PMU = project management unit, PPME = participatory planning, monitoring, and evaluation, SSEA = statistical survey and econometric analysis. 5. Program Performance Report Ratings
Ratings Implementation Period
Development Objectives
Implementation Progress
Loan 1677 From 25 March 1999 to 30 April 2000 Satisfactory Satisfactory From 01 May 2000 to 31 December 2000 Satisfactory Partly Satisfactory From 1 January 2001 to 30 April 2001 Satisfactory Satisfactory From 1 May 2001 to 21 December 2001 Satisfactory Partly Satisfactory Loan 1678 From 25 March 1999 to 19 January 2006 Satisfactory Satisfactory

vi
D. Data on Asian Development Bank Missions
Name of Mission
Date
No. of Persons
No. of Person-Days
Specialization of Membersa
Fact-Finding 12 October–27 November 1998
10 52 e,f,g,h,j,l,m,n,p,s,z
Appraisal 11 January–12 February1999
5 45 e,f,g,h,k
Inception (Program Loan) 30 August–10 September 1999
3 c,e,g,
Special Investment Project Administration
30 August–10 September 1999
2 15 e,q
Review 11–17 November 1999 2 14 g,q Review 6–10 March 2000 2 8 g,j, Consultation 3–5 May 2000 1 3 b Consultation 12–19 June 2000 2 12 a,w Inception (Project Loan) 25 June–5 July 2000 1 7 n Portfolio Review 19–31 July 2000 3 27 j,x,y Review 8–30 August 2000 1 23 n Review 31 October–
17 November 2000 1 18 n
Review 27 February–16 March 2001
1 15 n
Special Project Administration 11–20 June 2001 1 8 n Review 16–26 April 2002 3 7 d,u,v Review 20 January–4 February
2003 3 16 u,y,z
Review 22–28 October 2003 2 12 u,t SOE Audit Mission 4–7 November 2003 1 4 v Review 27 June–9 July 2004 1 10 u Review 17–20 January 2005 2 8 o,y Program Completion Reviewb 8–19 May 2006 3 20 o,y,z SOE = statement of expense. a a - director, AED, b - deputy director, Agriculture East Department (AED), c - manager, Agriculture East Water
Supply and Urban Development (AEWU), d - senior urban development specialist, e - senior project engineer, f - senior programs officer, g - senior sector specialist, h - senior counsel, i - senior financial analyst, j - senior environment specialist, k - social development specialist, l - social development programs officer, m - project economist/enterprise support, n - urban development specialist, o - housing and urban development specialist, p - social development specialist, q - project economist, r - rural development specialist, s - financial analyst, t - project implementation specialist, u - project engineer, v - control officer, w - young professional, x - senior project officer, y - assistant project analyst, z – consultant.
J a v a S e a
B a n d a S e a
A r u f u r a S e a
I N D I A N O C E A N
S o u t h C h i n a S e a
P A C I F I C O C E A N
S u l a w e s i S e a
S U M A T R AK A L I M A N T A N
S U L A W E S I
H A L M A H E R A
I R I A N
J A V A
S E R A M
ARU
SULA
BURU
WAIGEO
YAPEN
BIAK
DOLAK
LOMBOK
SUMBAWA
SUMBA
BALIFLORES
TIMOR
WETAR
ALOR TANIMBAR
BACANBANGGAI
MOROTAI
OBIMATOR
BATAONE
LAUT
BUTON
MUNA
BELITUNG
BANGKA
LINGGA
NIAS
SIBERUT
PAGAI
BATU
SIMEULUE
WEH
NATUNA
MADURA
Palembang
JambiPangkal Pinang
Bandar Lampung
SerangJakarta
Bengkulu
Padang
Pekanbaru
Medan
Banda Aceh
Pontianak
Palangkaraya
Banjarmasin
Samarinda
Kendari
Makassar
Palu
Mamuju
Ambon
Ternate
Manokwari
Jayapura
Gorontalo
Manado
Semarang
Surabaya
Yogyakarta Mataram
Denpasar
Kupang
Bandung
RIAU ISLANDS
Tanjung Pinang
BANGKA-BELITUNG
NANGGROE ACEHDARUSSALAM
NORTHSUMATRA
RIAU
WEST SUMATRAJAMBI
BENGKULU
SOUTH SUMATRA
LAMPUNG
WEST JAVA
BANTEN
CENTRALJAVA
BALI
WEST NUSATENGGARA
EAST NUSATENGGARA
SOUTHSULAWESI
WESTSULAWESI
SOUTHEASTSULAWESI
CENTRALSULAWESI
SOUTHKALIMANTAN
CENTRALKALIMANTAN
WESTKALIMANTAN
EAST KALIMANTAN
EAST JAVA
YOGYAKARTA
GORONTALO
NORTH SULAWESI
NORTH MALUKU
MALUKU
PAPUA
WESTIRIAN JAYA
TIMOR-LESTE
M A L A Y S I A
BRUNEI DARUSSALAM
PA
PU
A N
EW
GU
INE
A
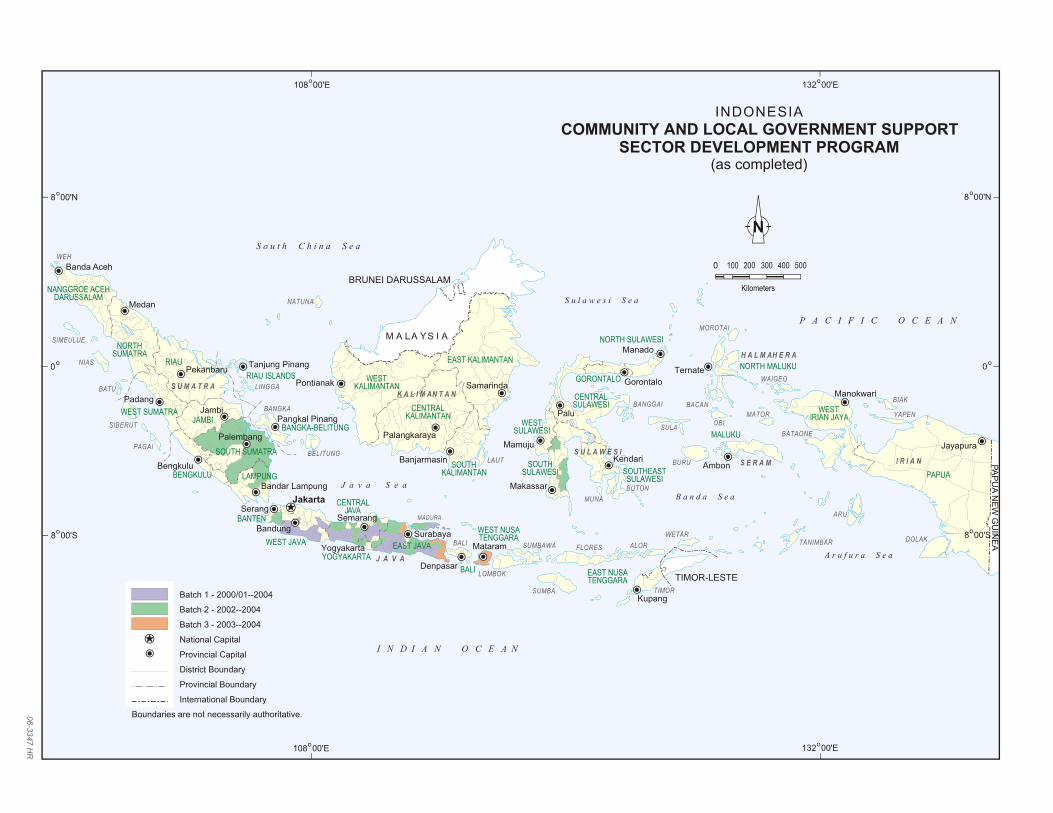
Batch 1 - 2000/01--2004
Batch 2 - 2002--2004
Batch 3 - 2003--2004
National Capital
Provincial Capital
District Boundary
Provincial Boundary
International Boundary
Boundaries are not necessarily authoritative.
INDONESIA
COMMUNITY AND LOCAL GOVERNMENT SUPPORTSECTOR DEVELOPMENT PROGRAM
(as completed)
0 100 200 300 400 500
Kilometers
N
06
-33
47
HR
108 00'Eo
108 00'Eo
132 00'Eo
132 00'Eo
0o
0o
8 00'So
8 00'No
8 00'No
8 00'So

I. PROGRAM DESCRIPTION 1. The Community and Local Government Support Sector Development Program (CLGSSDP)1 was a combination of two loans proposed in a single Report and Recommendation of the President (RRP): a program loan (1677-INO) of $200 million designed to support the comprehensive decentralization reform program of the Government of Indonesia, and a project loan (1678-INO) of $120 million which funded poverty alleviation through improved access to basic services and labor-based infrastructure development and improvement. The Program was designed in 1998–1999 as an emergency response measure to the economic crisis gripping the country at that time. As the Program progressed, the economic crisis became less of a concern and gradually greater emphasis was placed on introducing decentralization and democratization measures. 2. The primary objective of the Program was to improve socioeconomic well-being in Indonesia through poverty alleviation and restoration of economic activity; support the Government’s ongoing decentralization efforts; implement decentralization by increasing the capacity of the districts to implement local public services; empower villages and civil society to participate more fully in local development; and improve transparency, governance, monitoring, and accounting procedures at the district and subdistrict levels. 3. The policy component of the Program (i.e., the program loan) supported improvement of local government processes, as part of the Government’s response to the 1997 Asian economic crisis. The Government’s reform program was designed to (i) increase involvement of local communities in decision making through the devolution of administrative and fiscal authority to district governments; (ii) improve performance and accountability of the district governments through rationalization of functions and responsibilities of civil servants at the district level, and through measures relating to district-level activities; and (iii) pass legislation as a basis for regional autonomy and intergovernmental fiscal relations. These policies were set out in the Loan Agreement (footnote 2) and the policy matrix.2 CLGSSDP was designed as a quick-disbursing loan in three tranches of $70 million, $70 million, and $60 million. The first tranche was made available immediately upon loan effectiveness, while the second and third tranches were made available following the fulfillment of conditions described in the policy matrix of the RRP. 4. The investment project (i.e., the project loan) of the Program aimed to (i) reduce poverty of an estimated 450,000 families by providing employment in project-financed works; (ii) reduce poverty indirectly by improving basic services to an estimated 10 million people; and (iii) provide general capacity building to participating districts and their villages to prepare them for their roles and responsibilities under decentralization. 5. When the decentralization law (Law No. 22, 1999) became effective in 1999, the original program design was altered to include decentralized provision and management of infrastructure services. The introduction of the decentralization law caused some confusion for CLGSSDP, in particular as the law reduced the role of provincial governments significantly. At the subdistrict, or kecamatan, level, the main development role was transferred to village-level administrations, i.e., to desa in rural areas or to kelurahan in cities.
1 ADB. 1999. Report and Recommendation of the President to the Board of Directors on Proposed Loans and
Technical Assistance Grant to the Republic of Indonesia for the Community and Local Government Support Sector Development Program. Manila.
2 Appendix 2 of the Report and Recommendation of the President (footnote1).
2
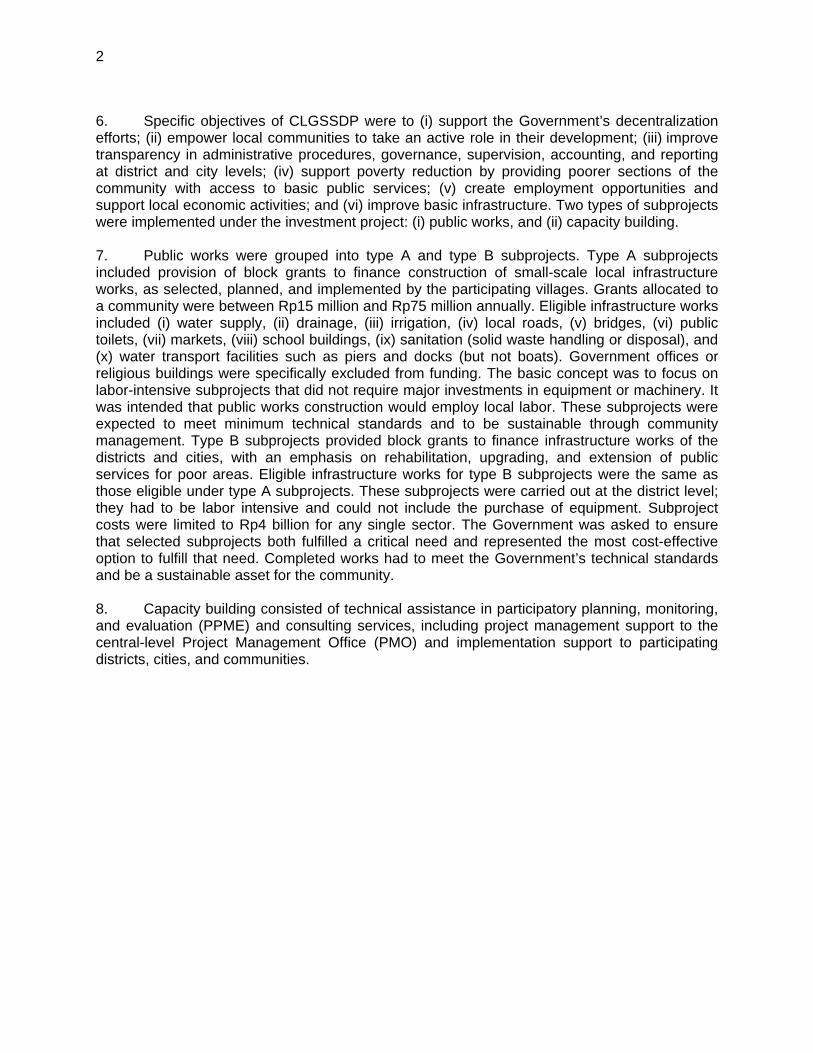
6. Specific objectives of CLGSSDP were to (i) support the Government’s decentralization efforts; (ii) empower local communities to take an active role in their development; (iii) improve transparency in administrative procedures, governance, supervision, accounting, and reporting at district and city levels; (iv) support poverty reduction by providing poorer sections of the community with access to basic public services; (v) create employment opportunities and support local economic activities; and (vi) improve basic infrastructure. Two types of subprojects were implemented under the investment project: (i) public works, and (ii) capacity building. 7. Public works were grouped into type A and type B subprojects. Type A subprojects included provision of block grants to finance construction of small-scale local infrastructure works, as selected, planned, and implemented by the participating villages. Grants allocated to a community were between Rp15 million and Rp75 million annually. Eligible infrastructure works included (i) water supply, (ii) drainage, (iii) irrigation, (iv) local roads, (v) bridges, (vi) public toilets, (vii) markets, (viii) school buildings, (ix) sanitation (solid waste handling or disposal), and (x) water transport facilities such as piers and docks (but not boats). Government offices or religious buildings were specifically excluded from funding. The basic concept was to focus on labor-intensive subprojects that did not require major investments in equipment or machinery. It was intended that public works construction would employ local labor. These subprojects were expected to meet minimum technical standards and to be sustainable through community management. Type B subprojects provided block grants to finance infrastructure works of the districts and cities, with an emphasis on rehabilitation, upgrading, and extension of public services for poor areas. Eligible infrastructure works for type B subprojects were the same as those eligible under type A subprojects. These subprojects were carried out at the district level; they had to be labor intensive and could not include the purchase of equipment. Subproject costs were limited to Rp4 billion for any single sector. The Government was asked to ensure that selected subprojects both fulfilled a critical need and represented the most cost-effective option to fulfill that need. Completed works had to meet the Government’s technical standards and be a sustainable asset for the community. 8. Capacity building consisted of technical assistance in participatory planning, monitoring, and evaluation (PPME) and consulting services, including project management support to the central-level Project Management Office (PMO) and implementation support to participating districts, cities, and communities.

3
Table 1: Investment Project Components ($ million)
Appraisal Actual
Component Foreign
Exchange Local
Currency Total Cost
Foreign Exchange
Local Currency
Total Cost
1. Block Grant to Districts a. Village Subprojects 19.8 65.7 85.5 13.5 50.6 64.1 b. District Subprojects 42.8 43.2 86.0 26.6 34.1 60.7 Subtotal (A) 62.6 108.9 171.5 40.1 84.7 124.8 2. Project Management/
Capacity Building a. Central Consultants 1.9 5.1 3.7 3.0 2.4 5.4 b. District Consultants 0.0 5.5 5.5 0.0 5.6 5.6 c. Facilitators 0.0 8.8 8.8 0.0 5.1 5.1 Subtotal (B) 1.9 19.4 18.0 3.0 13.1 16.1 3. Project Management Costs 2.8 2.8 4. Interest During Construction 0.0 10.5 10.5 0.0 0.0 0.0 Total 64.5 138.8 200.0 43.1 100.6 143.7
Source: Asian Development Bank. 9. There were three supplementary technical assistance (TA) projects, namely TA 3177-INO: Capacity Building to Support Decentralized Administration System; TA 3178-INO: Capacity Building for Setting Up District Level Financial Budgetary System; and TA 3179-INO: Capacity Building for Participatory Planning, Monitoring, and Evaluation.3 The TAs were approved along with the program and project loans in March 1999 and implemented from 2000 to 2003.4
II. EVALUATION OF DESIGN AND IMPLEMENTATION A. Relevance of Design and Formulation 10. The Program was an integral part of a larger assistance package of $2.8 billion provided by ADB to mitigate adverse socioeconomic consequences of the Asian economic crisis. 5 Hardships brought about the Asian financial crisis were exacerbated in Indonesia by serious droughts in 1997 in many parts of the country, resulting in severe unemployment, drastically cut incomes, and social unrest. The aim of the Program was to prevent conditions from worsening 3 ADB. 1999. Technical Assistance to Indonesia for Capacity Building to Support Decentralized Administrative
Systems. Manila; ADB. 1999. Technical Assistance to Indonesia for Capacity Building for Setting Up District Level Financial Budgetary System. Manila; ADB. 1999. Technical Assistance to Indonesia for Capacity Building for Participatory Planning, Monitoring and Evaluation. Manila.
4 ADB. 2001. Technical Assistance Completion Report for Indonesia on Capacity Building to Support Decentralized Administrative Systems. Manila; ADB. 2002. Technical Assistance Completion Report for Indonesia on Capacity Building for Setting Up District-Level Financial and Budgetary Systems. Manila; ADB. 2004. Technical Assistance Completion Report for Indonesia on Capacity Building for Participatory Planning, Monitoring, and Evaluation. Manila. All three TAs were rated as successful.
5 ADB provided five crisis support loans and associated TAs. The loans were the (i) ADB. 1998. Report and Recommendation of the President to the Board of Directors on a Proposed Loan to Indonesia for the Financial Governance Reforms Sector Development Program. Manila. ($1.5 billion), (ii) ADB. 2003. Report and Recommendation of the President to the Board of Directors on a Proposed Loan to Indonesia for the Social Protection Sector Development Program. Manila. ($300 million), (iii) ADB. 1999. Report and Recommendation of the President to the Board of Directors on a Proposed Loan to Indonesia for the Health and Nutrition Sector Development Program. Manila. ($400 million), and (v) ADB. 1999. Report and Recommendation of the President to the Board of Directors on a Proposed Loan to Indonesia for the Community and Local Government Support Sector Development Program. Manila. ($320 million).

4
by creating employment opportunities through the investment project of the Program, while maintaining or improving the level of services in poor areas where the investment project was implemented. The Program addressed the decentralization reform agenda (see Appendix 1) and was a product of an intensive dialogue between ADB and the Government. The Program was conceived as part of long-term reform agenda, which has also been the reference point for many later Asian Development Bank (ADB) projects. The transitional government of President Habibie initiated political reforms in 1999 aimed at increasing local autonomy and improving governance, transparency, and accountability. Enabling legislation for the policy reforms was passed by parliament in May 1999: Law 22/1999 on Regional Government, and Law 25/1999 on Fiscal Balance. The transitional government prepared a decentralization policy matrix aimed at increasing the administrative and fiscal autonomy of district governments. During 2000, the Government prepared implementing regulations and guidelines and other "starting conditions" necessary to launch decentralization in 2001. Laws 22/1999 and 25/1999 became effective on 1 January 2001, 3 months ahead of the original target. During 2001, the Government installed decentralized administrative and financial systems that required the transfer of almost 2.1 million central Government civil servants, the audit and transfer of most central Government assets and documents in the regions, and a new system of intergovernmental fiscal transfers. Within their own capabilities, district governments across Indonesia are now delivering public services ranging across education and culture, health, public works, agriculture, transport, industry and trade, environmental management and land use, and cooperatives and human resources. District administrations are accountable to their own local parliaments, and they have effective budgetary and financial autonomy, including levying local taxes, fees, and charges. These expanded mandates are set within a regulatory environment requiring transparency, broad-based participatory planning, and decision making at the lowest appropriate level. President Megawati reaffirmed the Government's commitment to decentralization by allocating 27% of the 2002 national budget to regional government, and reviewing Law 22/1999, which was meant to enhance the efficiency of the decentralization program. 11. The Program design was innovative, as it combined the policy agenda with social environmental measures and capacity building at various levels (central government, districts, and villages). Through the investment project, communities were empowered through the establishment of local democratic self-governing bodies, as the participatory nature of the investment project called for the strengthening of village development committees through the inclusion of civil society representatives. Gender considerations, including equitable access to employment opportunities, were addressed, and local nongovernment organizations were actively involved in the development of subproject proposals and the planning, implementation, and monitoring of local civil works. Capacity building was directed at 30–40 districts and 6,000 villages participating in the investment project through hands-on experience in transparency and accountability, in addition to the technical side of subproject preparation, implementation, and monitoring. These technically more complex roles were considered crucial in regard to the new roles for local-level institutions under the decentralization. 12. The design and formulation of the investment project 6 was consistent with the Government’s decentralization policy, and ADB’s strategy for the country (Appendix 2). The provinces and districts chosen to participate in the investment project were selected on the basis of their poverty profile and demand for assistance. The design of the investment project loan was similar to other parallel programs like the World Bank-funded Kecamatan
6 The project loan was designed without a project preparatory technical assistance (PPTA). For more details refer to
section H.
5
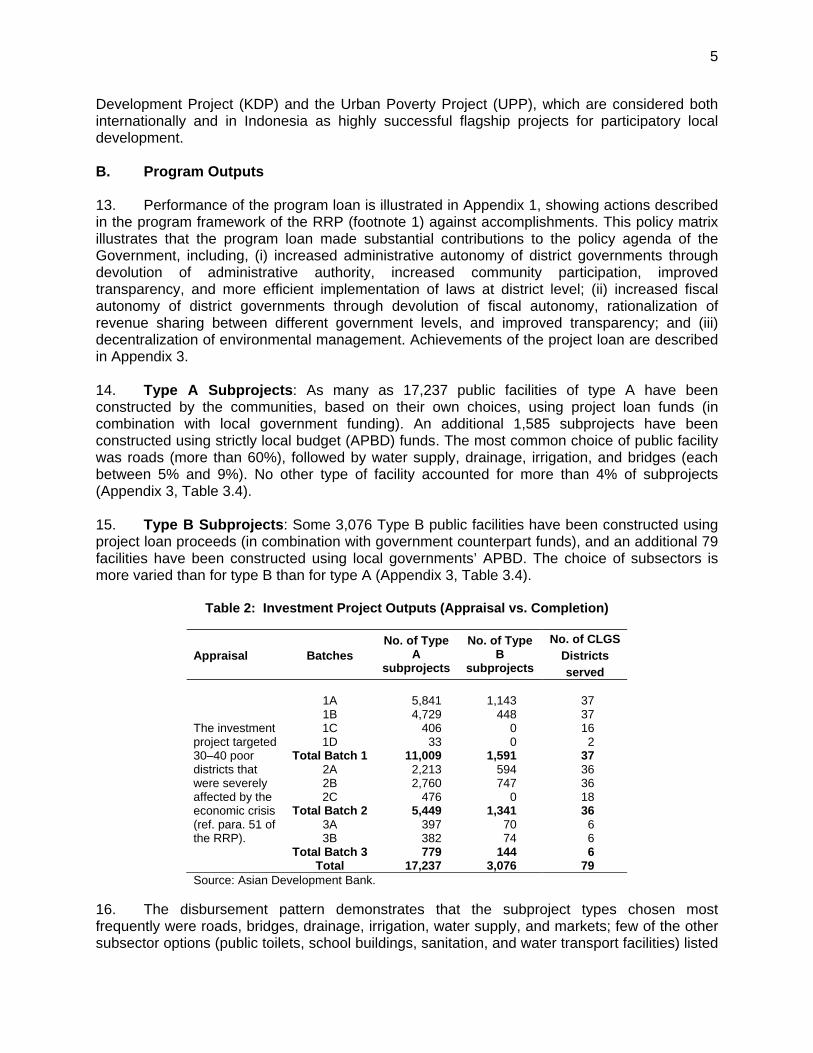
Development Project (KDP) and the Urban Poverty Project (UPP), which are considered both internationally and in Indonesia as highly successful flagship projects for participatory local development. B. Program Outputs 13. Performance of the program loan is illustrated in Appendix 1, showing actions described in the program framework of the RRP (footnote 1) against accomplishments. This policy matrix illustrates that the program loan made substantial contributions to the policy agenda of the Government, including, (i) increased administrative autonomy of district governments through devolution of administrative authority, increased community participation, improved transparency, and more efficient implementation of laws at district level; (ii) increased fiscal autonomy of district governments through devolution of fiscal autonomy, rationalization of revenue sharing between different government levels, and improved transparency; and (iii) decentralization of environmental management. Achievements of the project loan are described in Appendix 3. 14. Type A Subprojects: As many as 17,237 public facilities of type A have been constructed by the communities, based on their own choices, using project loan funds (in combination with local government funding). An additional 1,585 subprojects have been constructed using strictly local budget (APBD) funds. The most common choice of public facility was roads (more than 60%), followed by water supply, drainage, irrigation, and bridges (each between 5% and 9%). No other type of facility accounted for more than 4% of subprojects (Appendix 3, Table 3.4). 15. Type B Subprojects: Some 3,076 Type B public facilities have been constructed using project loan proceeds (in combination with government counterpart funds), and an additional 79 facilities have been constructed using local governments’ APBD. The choice of subsectors is more varied than for type B than for type A (Appendix 3, Table 3.4).
Table 2: Investment Project Outputs (Appraisal vs. Completion)
No. of CLGS
Appraisal Batches Districts
No. of Type A
subprojects
No. of Type B
subprojects served
1A 5,841 1,143 37 1B 4,729 448 37 1C 406 0 16 1D 33 0 2
Total Batch 1 11,009 1,591 37 2A 2,213 594 36 2B 2,760 747 36 2C 476 0 18
Total Batch 2 5,449 1,341 36 3A 397 70 6
The investment project targeted 30–40 poor districts that were severely affected by the economic crisis (ref. para. 51 of the RRP). 3B 382 74 6 Total Batch 3 779 144 6 Total 17,237 3,076 79 Source: Asian Development Bank.
16. The disbursement pattern demonstrates that the subproject types chosen most frequently were roads, bridges, drainage, irrigation, water supply, and markets; few of the other subsector options (public toilets, school buildings, sanitation, and water transport facilities) listed
6
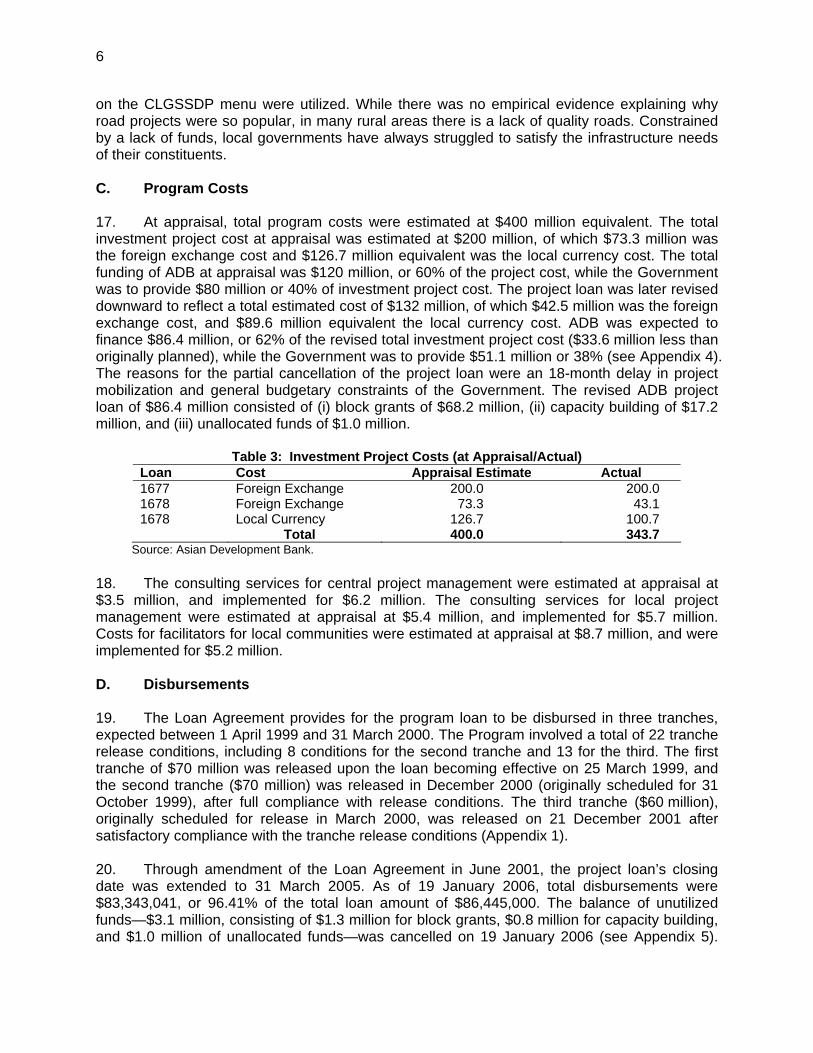
on the CLGSSDP menu were utilized. While there was no empirical evidence explaining why road projects were so popular, in many rural areas there is a lack of quality roads. Constrained by a lack of funds, local governments have always struggled to satisfy the infrastructure needs of their constituents. C. Program Costs 17. At appraisal, total program costs were estimated at $400 million equivalent. The total investment project cost at appraisal was estimated at $200 million, of which $73.3 million was the foreign exchange cost and $126.7 million equivalent was the local currency cost. The total funding of ADB at appraisal was $120 million, or 60% of the project cost, while the Government was to provide $80 million or 40% of investment project cost. The project loan was later revised downward to reflect a total estimated cost of $132 million, of which $42.5 million was the foreign exchange cost, and $89.6 million equivalent the local currency cost. ADB was expected to finance $86.4 million, or 62% of the revised total investment project cost ($33.6 million less than originally planned), while the Government was to provide $51.1 million or 38% (see Appendix 4). The reasons for the partial cancellation of the project loan were an 18-month delay in project mobilization and general budgetary constraints of the Government. The revised ADB project loan of $86.4 million consisted of (i) block grants of $68.2 million, (ii) capacity building of $17.2 million, and (iii) unallocated funds of $1.0 million.
Table 3: Investment Project Costs (at Appraisal/Actual)
Loan Cost Appraisal Estimate Actual 1677 Foreign Exchange 200.0 200.0 1678 Foreign Exchange 73.3 43.1 1678 Local Currency 126.7 100.7 Total 400.0 343.7
Source: Asian Development Bank. 18. The consulting services for central project management were estimated at appraisal at $3.5 million, and implemented for $6.2 million. The consulting services for local project management were estimated at appraisal at $5.4 million, and implemented for $5.7 million. Costs for facilitators for local communities were estimated at appraisal at $8.7 million, and were implemented for $5.2 million. D. Disbursements 19. The Loan Agreement provides for the program loan to be disbursed in three tranches, expected between 1 April 1999 and 31 March 2000. The Program involved a total of 22 tranche release conditions, including 8 conditions for the second tranche and 13 for the third. The first tranche of $70 million was released upon the loan becoming effective on 25 March 1999, and the second tranche ($70 million) was released in December 2000 (originally scheduled for 31 October 1999), after full compliance with release conditions. The third tranche ($60 million), originally scheduled for release in March 2000, was released on 21 December 2001 after satisfactory compliance with the tranche release conditions (Appendix 1). 20. Through amendment of the Loan Agreement in June 2001, the project loan’s closing date was extended to 31 March 2005. As of 19 January 2006, total disbursements were $83,343,041, or 96.41% of the total loan amount of $86,445,000. The balance of unutilized funds—$3.1 million, consisting of $1.3 million for block grants, $0.8 million for capacity building, and $1.0 million of unallocated funds—was cancelled on 19 January 2006 (see Appendix 5).

7
The substantial savings realized in the capacity building component were the result of reduced time requirements for the project management consultants (PMC). This in turn was partly a result of delays in hiring certain personnel, a 6-month vacancy in the team leader position, and reduced travel costs and workshops. 21. Fund channeling from central government to local government was incorporated into the annual development budget (DIPP), and funds were ongranted; disbursement was through a special local government account. During the lifespan of the investment project loan, a general disbursement lag was observed. Most of the delays resulted from late reporting by the districts; as Central Project Office (CPO) endorsements for disbursements were required, late reporting resulted in late reimbursements. Monthly progress field reports by the districts—i.e., subproject financial statements—were often dispatched late and/or contained incomplete data, which adversely affected loan disbursements. 7 The Executing Agency states that delays in disbursements also affected the progress of physical works and the continuity of consultant assignments. 22. The utilization of electronic media, internet, fax, and other high-speed communication for quick and efficient transmission of data would have improved financial management and disbursement in the highly decentralized investment project. Unfortunately, very few districts utilized these technologies, because in general local governments still utilizes original signatures and seals for official communication. The investment project failed to provide any special budget funds for facilitating modern high-speed communication. 23. An overview of disbursements made under the project loan—for type A and type B subprojects, capacity building, and consultants—is contained in Appendix 5. E. Program Schedule 24. The Program was approved on 25 March 1999, and the Loan Agreement was signed on the same day. The loan was declared effective on the same date, 3 months ahead of the assumed effectiveness date in the Loan Agreement. The original closing date of the program loan was 20 September 2000, while the actual closing date was 21 December 2001. 25. The project loan was expected to be implemented over 52 months, and to be completed by March 2003. Uncertainty in the wake of the introduction of the decentralization law of 1999 contributed to the 17-month delay in the start-up of investment project activities. 26. The contract for the PMC was awarded in April 2000, 12 months behind schedule, because of (i) significant changes in the scope of the PMC assignment, and (ii) significant delays in the procurement and evaluation of proposals. The PMC started in June 2000 and was operational for only 39 months (Appendix 6). 27. The implementation of the investment project was about 2 years behind schedule mainly because the issue of how funds would be channeled to special project accounts took 17 months for the Ministry of Finance and ADB to resolve. The development of the PPME process required a separate Technical Assistance (TA 3179-INO: Capacity Building for Participatory Planning and Monitoring and Evaluation) to develop and field-test the PPME, and to train project
7 Disbursements to Kabupaten Sinjai and Kabupaten Pasuruan were done after the loan closing date. Delays in
submission of payment requests for these disbursements were caused by a delay in allocation of local government counterpart funds.

8
personnel and stakeholders in PPME. As the PPME design was new to Indonesia, its introduction required central Government endorsement, which took longer than anticipated, and was the primary reason for the implementation delays. F. Implementation Arrangements 28. The Program started under crisis conditions and necessitated that people embrace unfamiliar working practices willingly so as to quickly maximize the benefits of the Program to its target groups. In an unusual effort of coordination and transparency, the various agencies involved in the design of the Program quickly agreed on the features of the Program. As can be seen from the schedule of program processing, the approval and signing of the Loan Agreement were swift and accelerated (see para. 24), underlining the urgency of the Program. For such an innovative Program, put together on very short notice, one would expect the process of implementation—particularly on the investment side—to be less than smooth. Successful implementation required innovative program management mechanisms and unfamiliar administrative procedures involving public participation, accountability, and transparency. The Program required a fairly complex implementation arrangement involving the effective participation of a large number of stakeholders. A simplified diagram of the program implementation structure is in Appendix 7 (section A). 29. The Executing Agency of the investment project was the National Development Planning Agency (BAPPENAS), which played a key role in program formulation in addition to assuming the unusual role of Executing Agency. Because BAPPENAS' interests spanned various subsectors, it was free to implement the investment project without conflicting with the line ministries. The investment project management structure is in Appendix 7 (section B). 30. To oversee the investment project, a steering committee was established at the central level. Its members comprises representatives of BAPPENAS, the Ministry of Public Works, the Ministry of Finance, and the Ministry of Home Affairs. The steering committee was responsible for directing the investment project’s implementation policy and strategy. Its most important activity was to guide the formulation of the project guidelines (Pedoman Umum) 8 and to coordinate among the participating agencies of the steering committee. 31. A technical team was also established to develop policy and coordinate between agencies, but real coordination tended to take place at the operational level. The technical team’s members consisted of staff from BAPPENAS, the Ministry of Public Works, the Ministry of Finance, and the Ministry of Home Affairs. PMO, within BAPPENAS was the executing office of the Program. The PMO was responsible for daily operations of the CLGSSDP, including program management, management of disbursement, and monitoring of progress.9 The PMC consisted of a team of international and local consultants assigned to assist the PMO. The PMC contributed expertise in project management, community development, monitoring and evaluation, finance, public awareness campaigns, and training. Initially, for subproject batch 1,
8 BAPPENAS. October 2001. Pedoman Umum - Program Pendukung Pemberdayan Masyarakat dan Pemerintah
Daerah (P2MPD), Sekretariat P2MPD Pusat. Jakarta. 9 BAPPENAS set up a project management office in close proximity to its own office. The location allowed for easy
contact between BAPPENAS and the Program. However, contacts with local governments engaged in execution of subprojects were more problematic. The subprojects required a substantial number of visits to local governments to review, monitor, and assist local government in project procurement and implementation. However, the monitoring efforts, while extensive, were often insufficient to monitor implementation effectively. The Executing Agency has commented that satellite offices might have allowed for greater contact with the regions, particularly regions that are difficult to reach.
9
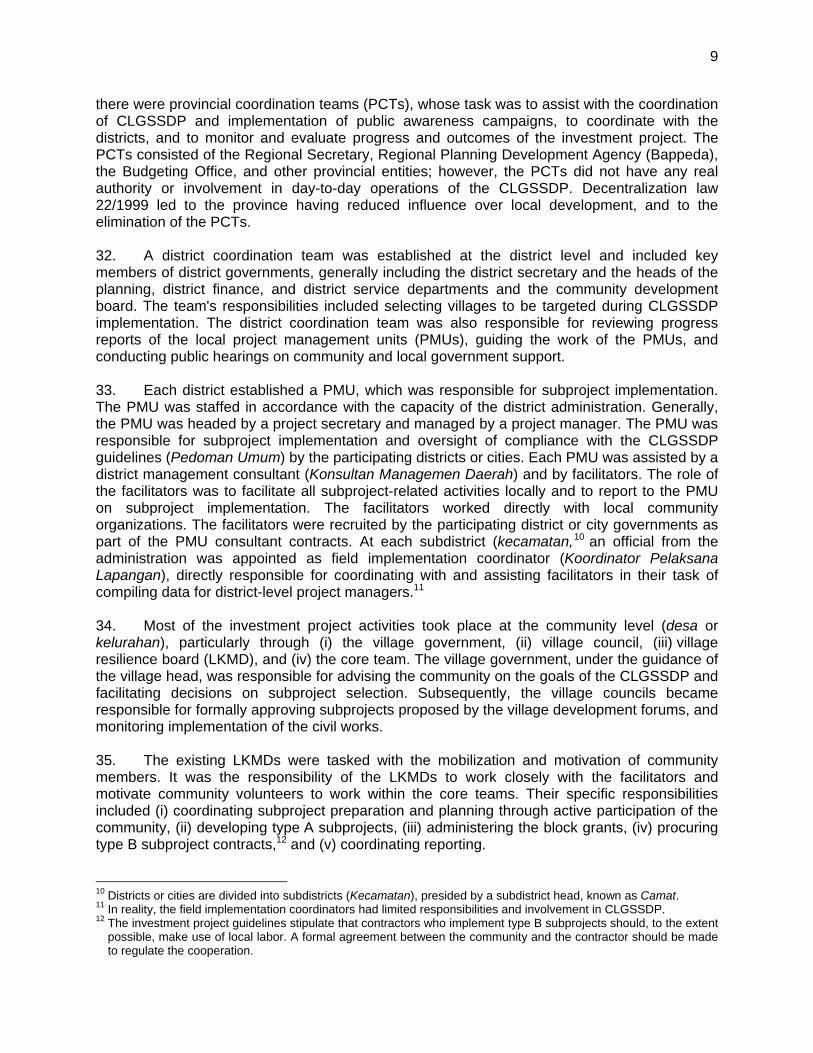
there were provincial coordination teams (PCTs), whose task was to assist with the coordination of CLGSSDP and implementation of public awareness campaigns, to coordinate with the districts, and to monitor and evaluate progress and outcomes of the investment project. The PCTs consisted of the Regional Secretary, Regional Planning Development Agency (Bappeda), the Budgeting Office, and other provincial entities; however, the PCTs did not have any real authority or involvement in day-to-day operations of the CLGSSDP. Decentralization law 22/1999 led to the province having reduced influence over local development, and to the elimination of the PCTs. 32. A district coordination team was established at the district level and included key members of district governments, generally including the district secretary and the heads of the planning, district finance, and district service departments and the community development board. The team's responsibilities included selecting villages to be targeted during CLGSSDP implementation. The district coordination team was also responsible for reviewing progress reports of the local project management units (PMUs), guiding the work of the PMUs, and conducting public hearings on community and local government support. 33. Each district established a PMU, which was responsible for subproject implementation. The PMU was staffed in accordance with the capacity of the district administration. Generally, the PMU was headed by a project secretary and managed by a project manager. The PMU was responsible for subproject implementation and oversight of compliance with the CLGSSDP guidelines (Pedoman Umum) by the participating districts or cities. Each PMU was assisted by a district management consultant (Konsultan Managemen Daerah) and by facilitators. The role of the facilitators was to facilitate all subproject-related activities locally and to report to the PMU on subproject implementation. The facilitators worked directly with local community organizations. The facilitators were recruited by the participating district or city governments as part of the PMU consultant contracts. At each subdistrict (kecamatan,10 an official from the administration was appointed as field implementation coordinator (Koordinator Pelaksana Lapangan), directly responsible for coordinating with and assisting facilitators in their task of compiling data for district-level project managers.11 34. Most of the investment project activities took place at the community level (desa or kelurahan), particularly through (i) the village government, (ii) village council, (iii) village resilience board (LKMD), and (iv) the core team. The village government, under the guidance of the village head, was responsible for advising the community on the goals of the CLGSSDP and facilitating decisions on subproject selection. Subsequently, the village councils became responsible for formally approving subprojects proposed by the village development forums, and monitoring implementation of the civil works. 35. The existing LKMDs were tasked with the mobilization and motivation of community members. It was the responsibility of the LKMDs to work closely with the facilitators and motivate community volunteers to work within the core teams. Their specific responsibilities included (i) coordinating subproject preparation and planning through active participation of the community, (ii) developing type A subprojects, (iii) administering the block grants, (iv) procuring type B subproject contracts,12 and (v) coordinating reporting. 10 Districts or cities are divided into subdistricts (Kecamatan), presided by a subdistrict head, known as Camat. 11 In reality, the field implementation coordinators had limited responsibilities and involvement in CLGSSDP. 12 The investment project guidelines stipulate that contractors who implement type B subprojects should, to the extent
possible, make use of local labor. A formal agreement between the community and the contractor should be made to regulate the cooperation.
10
36. The core teams (Tim Inti) were responsible for identification, design, construction, and maintenance of type A subprojects. These core teams were initiated by the LKMD and would consist of approximately 15 members of the community, including representatives from the dusun level, 13 who volunteered to participate in subproject implementation. The LKMD encouraged the participation of the poor and women, seeking equal representation of males and females. The targets participation level of women in the core groups was 20%; this target was designed to give voice to normally disenfranchised members of the community who by and large had been overlooked in the conventional political dynamics. It was assumed that women would have a better understanding of both family needs and the economic interests of their communities. Income-enhancing opportunities as well as quality-of-life concerns, particularly for women, were factored into the decision-making process on CLGSSDP subprojects. G. Conditions and Covenants 37. Forty-one policy actions contained in the Program’s policy matrix were completed during implementation. Four policy actions were completed prior to board submission to fulfill the conditions for the first tranche release at loan effectiveness. Sixteen policy actions were completed to fulfill the conditions for the release of the second tranche, and another 14 were completed for the third tranche release. An additional seven conditions were fulfilled without any time-related benchmark given. The Government complied with all of these conditions, enabling ADB to transfer the three tranches. Compliance with conditions and covenants contained in the Program Loan Agreement is shown in Appendix 8. Generally all covenants were complied with. 38. However, one district (Tana Toraja) appears to have violated procurement regulations, as reported by the State Auditor (BPKP) on various occasions since July 2004. BAPPENAS has taken action to identify and correct the deficiencies, without receiving any reply from the Tana Toraja district government. The PPME methodology required independent facilitators and no local government interference in subproject selection. Instead, it appears that the Tana Toraja local government implemented subprojects it had chosen with little if any community participation.14 When the deficiency was noted, BAPPENAS requested that the Ministry of Finance suspend further payments to Tana Toraja. However, the Tana Toraja subprojects had already obtained payment from Bank Indonesia without central Government approval. The lack of control at the central Government level allowed reimbursement despite BAPPENAS’ disapproval of the procurement procedures.15 H. Related Technical Assistance 39. As the loans were formulated in 1999 in response to the economic crisis, there was no separate project preparatory technical assistance (PPTA). The Program was prepared by the then-Agriculture and Social Sectors Department (East) and fast-tracked for approval.16
13 The Dusun or Rukun Warga (RK) is a grouping of village neighborhoods chosen by the TA team as the lowest
group where participatory activities can be implemented. 14 Kabupaten Tana Toraja has opted to handle community facilitation through its own staff (swakelola), without using
external facilitators. 15 Noncompliance by the district is not a breach of the Loan Agreement between the Government and ADB. As such
there was no basis for ADB to disallow funding of the subprojects carried out in Tana Toraja district. The matter is strictly for the Government and the district to resolve.
16 The CLGSSDP did not have a detailed implementation schedule. This was developed by the PMC during implementation of the Program. The investment project framework was revised in November 1999.

11
40. There were three supplementary TAs appended to the Program, namely (i) TA 3177-INO: Capacity Building to Support Decentralized Administration System, (ii) TA 3178-INO: Capacity Building for Setting Up District Level Financial Budgetary System, and (iii) TA 3179-INO: Capacity Building for Participatory Planning, Monitoring, and Evaluation (see also para. 9 and footnote 3). TA 3179-INO was the most relevant for the CLGSSDP as it developed the base tools for participatory implementation for the project loan and it designed the PPME approach that became the operational basis of the CLGSSDP. The focus of the PPME approach was on type A subprojects, since type B subprojects were the responsibility of district governments. However, for type A village-level subprojects, government mechanisms—while existent—were regarded as inadequate and often unresponsive to the direct needs of the target population, particularly the poor and women. I. Consultant Recruitment and Procurement 1. International Consultants 41. The Executing Agency recruited the PMC for the implementation of the investment project, which consisted of both international and local consultants. The PMC provided skills in (i) project management and implementation, (ii) participatory mechanisms, (iii) monitoring and evaluation (iv) accounting, (v) media and public campaigns, (vi) training of trainers (including the development of manuals), (vii) local government capacity building and training, (viii) technical quality control, and (iv) comprehensive reporting. 42. The selection and engagement of these consultants was based on ADB’s Guidelines on the Use of Consultants. The PMC were scheduled to start in early 2000, and recruitment was delayed until July 2000. The initial PMC contract was for the period of July 2000 to March 2003—later extended to March 2005. Additional consultant services for the public awareness campaign were engaged for the period of March to September 2003. 43. The statistical survey and econometric analysis consultant was engaged from October 2004 to March 2005 to determine whether the CLGSSDP had achieved its objectives, and to illustrate community feedback through statistical data. 17 An independent evaluation of the Program's investment project, conducted at the same time, assessed the scope for a proposed second investment project. 2. Local Consultants 44. Local consultants and local nongovernment organizations (NGOs) were engaged to assist implementation of the investment project at district and city levels. The main tasks of these consultants were to support local governments in (i) project management and implementation, (ii) monitoring and evaluation, (ii) accounting, (iii) capacity building and training, (iv) quality control of construction, and (v) reporting. Meanwhile, the community facilitators, most of whom were staff members of associated NGOs, were responsible for steering and supporting community participation. 45. The recruitment of local consultants was done in accordance with the Government’s presidential regulation (Keppres) 18/2000 and ADB’s Guidelines on the Use of Consultants. Procurement of local consultants, expected to be undertaken immediately after PMC
17 Unfortunately, the statistical survey and econometric analysis failed to provide any data on the economic impacts of
subprojects that could be used for the economic internal rate of return analysis.
12
procurement, was delayed until July 2001 because of a discrepancy between financial administrative procedures outlined in the Loan Agreement, and Government best practices. This discrepancy caused the Ministry of Finance to withhold issuing the required payment notification. In the absence of a payment notification, none of the participating local governments were able to procure local consultant services. A total of 197 contracts were signed to support 79 participating districts during 2001–2004. 3. Procurement of Goods and Services 46. Procurement of civil works, goods, and services for the investment project was divided into two categories: type A, which were implemented directly by the communities; and type B local government projects, which were implemented by contractors. The implementation of both subproject types complied with the Government’s procurement legislation (Keppres 18/2000 and, later, the revised Keppres 80/2003) and ADB’s Guidelines for Procurement. 47. Type A civil works were proposed, designed, and constructed by the communities applying the “community procurement” method. Type A contracts are categorized as small-scale contracts. Since a large number of small subprojects were carried out through the participating community groups, thousands of contracts needed to be managed and overseen under the investment project. A total of 15,904 contracts were managed by the local consultants under the supervision of the PMC and PMO during 2001–2004. 48. Type B civil works were implemented by local governments and carried out by contractors. About 50% of the type B subprojects had some degree of public participation through public hearings organized by the local governments during subproject preparation (Appendix 3). The local governments approved 962 type B contracts during 2001–2004.18 49. The investment project channeled type A block grants to more than 12,000 village communities and type B block grants to about 3,000 local contractors. The average block grant for type A was Rp49.5 million per village, with a minimum of Rp9.4 million and a maximum of Rp82.5 million, including taxes. The average type B block grant per contractor was Rp175.9 million, with a minimum of Rp13.0 million and a maximum of Rp412.0 million, including taxes (Appendix 3, Table 3.4). Both type A and type B block grants were well within the limit set by the loan design, namely $1,000–$10,000 per village for type A subprojects, and less than $50,000 per contract for type B subprojects. Seventy-nine districts (instead of 30–40 at appraisal) were reached because in general the subprojects funded were smaller than expected, thus allowing more villages and districts to participate in the CLGSSDP. J. Performance of Consultants, Contractors, and Suppliers 50. Most of the consultants and contractors of the investment project performed satisfactorily and fulfilled the expected quality standards. Most of the civil works demonstrated good quality, although many works were completed behind schedule because of delays in release of counterpart funds and/or technical problems. Most type A construction subprojects exceeded expected quality levels—an indication that the communities were exercising a high degree of care and attention and were willing to committed additional resources to ensure quality.
18 It should be noted that the district of Sleman had the most effective public awareness campaign. The regent
(bupati) was actively engaged in each subproject opening. Occasional visits by the governor added visibility to the Program, and the press was often called in to cover the inaugural ceremonies of subprojects.

13
51. In general, consulting services for the investment project performed satisfactory.19 The PMU consultants, despite being mobilized late, got off to a quick start and worked to the satisfaction of their clients. Delays in the consultants’ work, when they occurred, had limited influence on overall subproject implementation. The need to extend the duration of the subproject was not caused by any underperformance of the consultants but by the delay in subproject startup, the initial slow pace of the subproject, and the delayed release of local government counterpart funds (from the DIPP). For instance, all consulting services that were scheduled to be performed in fiscal year 2000 were put off until 2001, resulting in a higher workload for most consultants. Nevertheless, the performance of most of the consultants was competent and up to the expected standards. 52. Technical assistance played an important and synergetic role in the management of type A subprojects. The community facilitators applied the tools of the PPME and assisted the community groups through training and hands-on advice. This support was not only highly appreciated but also responsive to the needs and capabilities of communities. K. Performance of the Borrower and the Executing Agency 53. The success of the Program had a lot to do with the Government's sustained commitment to supporting employment and poverty reduction initiatives during the economic crisis. Over the course of the Program, the Government embarked on policy changes in the delivery of basic services that demonstrated greater openness, encouraged civil society involvement in decision making, and devolved budgetary and decision-making responsibility. The process of reform was given impetus by the crisis, and the Program provided direction that continues to this day. The overall performance of the Borrower was assessed as satisfactory. 54. After loan effectiveness, the Government and ADB had some differences of opinion regarding the establishment of the imprest account. This led to a delay in the startup of the investment project. Subsequently, the financing plan of the investment project was changed through an amendment of the Loan Agreement requiring participating districts, instead of the national Government, to provide all counterpart funding (which accounted for 40% of the investment project cost). Originally, the national Government had agreed to provide counterpart funds to the participating districts and cities, in addition to providing the general annual budget allocations. These negotiations between the Government and ADB required 17 months and delayed the investment project’s start date. However, in principle the Government met its counterpart fund obligations, and moreover the Government provided significant counterpart funding for PMO expenditures. 55. BAPPENAS was successful as the lead agency, meeting all of its coordination and supervision responsibilities. BAPPENAS established the PMO and appointed a project manager to manage and supervise the investment project. The Directorate of Settlement and Housing under BAPPENAS' Deputy for Means and Infrastructure regularly conducted technical team meetings to monitor the performance of the investment project. The PMO constantly monitored the investment project and reported on its implementation, and on the operational and financial performance of the participating districts and cities. The PMO, assisted by the PMC, prepared
19 There are also exceptions, where local governments have suggested that it would have been more beneficial to
engage NGOs instead of local consultant firms, because of their advanced capacity and better access to local communities.

14
monthly progress reports and submitted these to ADB on a quarterly basis. The performance of the Executing Agency was highly satisfactory. 56. At district and city levels, district or city coordinating teams supervised subproject activities, which were coordinated by the PMUs with assistance from PMU consultants. While the performance of the PMUs was generally satisfactory, delays in reporting were frequent and occasionally caused bottlenecks, as late reporting usually led to delays in the processing of invoices and reimbursements. Coordination between the PMO and the PMUs in the 79 participating districts and cities—an extraordinarily intensive task at times—was also considered highly satisfactory. L. Performance of the Asian Development Bank 57. The Program formulation was relatively quick, taking 6 months from appraisal to board approval. ADB undertook 16 investment project administration missions, including 11 review missions. These provided sufficient advice on technical and loan administration matters. There was close communication, both formal and informal, between ADB and the PMO concerning the issuance of procurement contract summary sheets. This close communication contributed to efficient problem solving and acceleration of disbursements and fund replenishment. As a result of this intensive support, the CLGSSDP was completed as per its revised schedule. The PMO and ADB were able to jointly manage and replenish about 40,000 invoices from the 79 participating districts during the 5-year duration of the investment project. ADB’s performance was highly satisfactory.
III. EVALUATION OF PERFORMANCE A. Relevance 58. The design of the Program was highly relevant to both the short-term requirements of the financial crisis and the need for longer-term structural reforms. Policy reforms had been on the Government’s agenda since the mid-1990s, and had been a major subject for dialogue with external aid agencies prior to the crisis. The Program’s policy reforms provided an essential basis for decentralizing the provision of infrastructure services.20 The Program also entailed close cooperation between the Government and external aid agencies, and strong leadership by BAPPENAS. The exemplary efforts which went into the preparation of the Program underlines the shared sense of purpose amidst Indonesia's severest economic crisis in recent history. While the introduction of the 1999 decentralization law created administrative uncertainties that led to a 17-month delay in startup and a nearly 2-year delay in the implementation of the investment project activities (paras. 25 and 27), the CLGSSDP was only extended for 9.5 months and most type A construction was of higher quality than expected. The communities exercised a high degree of participation, and even provided additional resources to ensure quality (para. 50). 59. The CLGSSDP has brought economic and social benefits to the targeted districts and cities, villages, community groups, and individuals who were selected on the basis of poverty level and vulnerability. The basic infrastructure provided is essential to their continued well-being and future productivity. Besides improvement of infrastructure, the management capacity of local communities, villages, districts, and cities was increased through their active involvement in planning and implementation of subprojects, and through capacity building 20 The People’s Consultative Assembly passed Decentralization Laws No. 22 and 25 in 1999.

15
support. 60. The CLGSSDP directly benefited (i) about 6.4 million households (equal to 32 million people), most of them poor, by providing improved water supply, irrigation, drainage, roads, public toilets, school buildings, sanitation, markets, and boat piers, with associated positive impacts on public health, economic opportunities, and quality of life; and (ii) about 458,000 households (equal to 2.3 million people), mostly poor, who obtained part-time employment during construction, providing them with much-needed help in the aftermath of the economic crisis. These activities were highly cost efficient, with high social and economic returns. 61. Physical access to basic services is crucial to local economies and social development. Good or improved access to services leads to lower transport costs, reduced travel times, and higher producer prices, and enables the sale of a wider variety of products, including perishable products. The physical improvements of markets and roads helped stimulate local trade. Since more than 68% of the public facilities built were roads and bridges, and 2.3% were markets, these two subsectors made particularly strong contributions to achieving the expected benefits of the investment project. Type A community-managed subprojects were warmly received by the communities. The process of selection was democratic and encouraged participation of poor and disenfranchised members of the community. Limited direct involvement by local governments gave villages a high degree of autonomy in their decision making. Infrastructure generally complied with investment project objectives and proved useful. Technical standards for infrastructure design and development were simple and uncomplicated, and did not require major inputs from consultants. 62. One of the CLGSSDP’s objectives was to empower local community institutions to overcome poverty and give them a lead role in infrastructure development. The investment project successfully empowered local communities by establishing more than 12,200 village core groups to manage all stages of infrastructure development—i.e., planning, implementation, and monitoring and evaluation. NGOs played an important role as facilitators in mobilizing community and women’s participation. More than 3,500 facilitators, 16% of them women, were engaged in the investment project. These facilitators were provided by at least 79 mostly local NGOs. Women participated in decision making and contributed labor during construction. Income enhancing opportunities, as well as quality-of-life concerns, played an important role in women's decision-making, and in some instances women have become public figures. These experiences contributed to the empowerment of women. About 16% of those participating in all core group activities were women, slightly less than the 20% targeted at appraisal. Women accounted for about 16% of facilitators, but only about 9% of laborers were women. 63. Community members had few complaints regarding the choice, usefulness, and results of subprojects. However, most communities still face a long list of additional urgent investment requirements that must be addressed through other means. The CLGSSDP has put in place a mechanism of partnership-based development that is being used by local governments in a variety of sectors. 64. Because of the above, the Program is rated “highly relevant.” B. Effectiveness in Achieving Outcome 65. The Program substantially met its three main objectives—poverty reduction, decentralization support, and empowerment of communities. The Program also helped improve levels of infrastructure services and employment in the beneficiary communities. In regard to
16
poverty reduction, the Program contributed by correctly targeting poor villages, as illustrated in the 2003 national census (para 66). 66. Poverty Reduction. It is difficult to measure the CLGSSDP's impacts on incomes and poverty reduction at the village level because of a lack of data on incomes both prior to and after completion of the CLGSSDP. It is also difficult to distinguish which positive impacts are attributable to the CLGSSDP, and which of those impacts are attributable to other programs and projects that have been implemented in the same villages. The importance of the CLGSSDP is best demonstrated by the benefits felt by the communities regarding subproject outcomes and their appreciation of these outcomes. The Statistical Survey and Econometric Analysis (2005)21 showed that more than 50% of beneficiaries appreciated the outcome of subprojects. The survey indicates that, as a result of the investment project, it takes less time to reach public facilities. The survey also points to some cost savings associated with reduced travel costs and other factors. However, the survey failed to demonstrate a direct link between increased local economic production and reduced poverty ratios on one hand, and CLGSSDP investments on the other hand. In fact, the national census (Susenas) of 2003 illustrated that the average household income of non-CLGSSDP villages was higher than those of CLGSSDP villages. However, this may only underscore that CLGSSDP correctly targeted the poorest villages. 67. Support to Decentralization. The implementation of the policy matrix contributed substantially to increasing the country’s administrative autonomy, increasing fiscal autonomy, and decentralizing environmental management. The application of these policies helped enable the Government to finance its share of the investment project. CLGSSDP funding rules for type A subprojects required that the central Government allocate 69% of the cost, through the loan, while the districts and cities allocated 31%. The cost of type B subprojects was shared equally by the central and local governments. However, the actual government allocation was slightly less than planned at appraisal. Government funding for batches of subprojects ranged from 94% to 100%, with an overall average of 97%. Theses numbers show that local governments largely fulfilled their funding requirements (Appendix 3, Table 3.4). 68. Empowerment of Communities. Communities themselves have mobilized substantial efforts and in-kind contributions to the implementation of subprojects, particularly type A subprojects. In-kind contributions included construction materials, right of way on their land, and unpaid labor (“gotong royong”). Often community members preferred that their labor be purely voluntary and did not want to be paid, even when payment would have been possible. In-kind contributions to subprojects averaged 12% of total subproject costs. In some cases in-kind contributions amounted to four or five times more than contributions provided by the investment project. These community contributions demonstrate a high level of ownership—potentially an important precondition for sustainability. 69. On the basis of the above, the Program is rated “highly effective.” C. Efficiency in Achieving Outcome and Outputs 70. The economic internal rates of return (EIRR) were measured for a very limited sample of subprojects visited by the Project Completion Review Mission22 (i.e., roads and bridges, public
21 BAPPENAS. 2005. Statistical Survey and Econometric Analysis of Community and Local Government Support
Sector Development Project. **Place of publication: Publisher** (April). 22 Subprojects visited were located in Kabupaten East Lombok, Kabupaten West Lombok, Kabupaten Malang, and
Kabupaten Tana Toraja.

17
markets, irrigation and water supply). Because of the absence of detailed surveys of conditions both prior to and after implementation of the subprojects, only a limited assessment of EIRR can be made. The analysis samples show that road, bridge, and irrigation subprojects (with the exception of Tana Toraja) were "efficient," while EIRRs for public markets and water projects could not be calculated because of a lack of available data or small sample sizes (more details are in Appendix 9).23
Table 4: Economic Internal Rate of Return of Selected Subsectors
Type of Infrastructure Location of Subprojects EIRR Roads/Bridges Kabupaten Lombok Barat 22.3% Public Markets Kabupaten Malang, Lombok Barat, — Lombok Timur, Kota Kediri Irrigation Kabupaten Lombok Barat 13% Water Supply Kabupaten Tanah Toraja, Kota Makasar — Kota Bandung — = not available. Source: Asian Development Bank. 71. Based on these limited results of the economic internal rates of return analysis, the performance of the investment project is rated “less efficient.” D. Preliminary Assessment of Sustainability 72. The main purpose of the Program was to improve socioeconomic well-being and generate employment through improved service delivery for an estimated 450,000 families living in poor communities (see para. 4). The commitment to support the decentralization of service provision through an agenda of policy reforms, and to increase the proportion of government spending devoted to community infrastructure services, has been achieved. The policy components of the Program aimed at more investments for infrastructure from national and donor-aided assistance, among those also from the World Bank-funded KDP and UPP. When it was formulated, the Program was ahead of its time in its approval to support decentralization in its thrust towards sustainability and accountability, and the responsiveness to local needs. 73. CLGSSDP funds were used as “seed” funds, supplemented by local government budgets and community resources (in-kind). Local participation is now a requirement under the decentralized administrative structure, and the principle of nongovernment participation has received strong recognition. The World Bank-funded KDP and UPP likewise supported the concept of cooperation between stakeholders and local development partners. 74. The fact that multilateral development banks have partially financed such programs has made participating stakeholders confident that this new funding approach is being taken seriously. 75. Some local governments have reported that they have recently introduced partnerships and the concept of using public resources as seed funds to many of their ongoing investment
23 For the World Bank-funded Kecamatan Development Project (KDP), a large-scale survey was undertaken and
EIRRs were calculated for roads, bridges, water supply, and irrigation. The EIRRs were greater than 12% and thus considered “effective,” and showed positive economic net present values (i.e., economic viability). See Geoffrey Dent/Project Appraisals Pte Ltd. 2001. Ex-Post Evaluation of Kecamatan Development Program (KDP) Infrastructure Projects. Unpublished report.

18
projects. This marks the emergence of the institutionalization (and sustainability) of an important new development paradigm. 76. Operation and maintenance (O&M) of subprojects, as is common in Indonesia, was one of the weaker aspects of the CLGSSDP. No O&M guidelines were established by communities and no funding was allocated for future O&M.24 It is expected that the Executing Agency will dedicate continued post-program efforts towards this aspect. 77. The Executing Agency continues to promote the CLGSSDP approach through regular publication of a CLGSSDP newsletter. It has been reported that some local governments have adopted the CLGSSDP approach in 2006—i.e., after the Program. O&M issues have also been featured prominently in the CLGSSDP newsletter. 78. Given the above developments and the ongoing efforts to improve O&M, the sustainability of both the policy component and the investment project can be rated as “likely sustainable.” E. Impact 79. The Program’s targeted impact has been convincingly pro-poor and its main impact of improved socioeconomic well-being must be considered as achieved. Although the Program was primarily aimed at crisis alleviation rather than poverty reduction, the underlying and correct assumption was that the poor were the hardest hit by the crisis and therefore most deserving of assistance. The Program demonstrated that something could be done about poverty reduction and improvement of infrastructure service levels. The Program also had an impact on issues of governance by introducing measures that enhanced transparency and accountability and reduced corruption, collusion, and nepotism through the application of more open, representative, and responsive forms of project management and, thus, local governance. The introduction of nongovernment participation, the attempts to increase public awareness, the structures for complaint handling, and the concept of participatory monitoring are all innovations associated with the Program. While every one of the above concepts was not successfully implemented everywhere, the Program did raise expectations in regard to transparency and accountability, and these CLGSSDP features will remain a benchmark for future programs. 80. The investment project’s environmental classification at appraisal was category B, and this classification remained appropriate throughout implementation. Each individual subproject 24 In Nov–Dec 2003, the PMO and PMCs collected sample data on O&M in 13 districts/cities, 42 subdistricts, and 55
villages of batch 1. The study covered seven types of infrastructure constructed in 2001 and 2002, namely (i) roads (32 units—59%), (ii) water supply (8 units—15%), (iii) schools (5 units—9%), (iv) public toilets (4 units—7%), (v) irrigation (3 units—5%), (vi) markets (2 units—4%), and (vii) boat piers (1 unit—2%). The survey showed that infrastructure is operated and maintained by the users, under the coordination of the O&M team of the core group. Fifty one percent of the infrastructure is maintained by the users (water supply, irrigation, roads, public toilets, markets, schools, and piers), 18% by the O&M teams (water supply, irrigation, and schools), 9% by users and the village government (roads, markets, schools), 7% by the village government (water supply, roads, schools), 4% by the users and the district government (water supply), and 4% by individuals (public toilets). The source of funding for O&M is the community itself (60%), the community and the village government jointly (7%), the village government (7%), or the community, the village government, and the district jointly (4%). However, the source of O&M funding for 18% could not be identified. Thus, the PMO has concluded that 18% of infrastructure facilities are not maintained. More than half (55%) of the subprojects are provided for free, user fees collected (example: water supply, roads, public toilets, markets, and schools), 40% collected fees between Rp500 to Rp5,000 per month (schools, water supply, irrigation, and roads), and 5% collect user fees based on frequency of use (markets, piers, and roads).

19
was preceded by an initial environmental examination (IEE) to show adherence to ADB and Government environmental assessment requirements. Sample IEE documents of the first three IEEs only were reviewed by ADB and later the local governments did review IEEs for larger type B subprojects. No funding was provided to subprojects that did not meet IEE criteria. All works funded were small-scale in nature, and any negative impact of immediate construction activities were both minor and temporary. Subsequent use of the provided technologies and infrastructure (e.g., feeder roads, bridges, water supplies, drainage, sanitation facilities, irrigation structures, etc.) has led to a net positive environmental impact because these technologies and infrastructure, when properly used, are less environmentally damaging. Most construction activities carried out were small-scale and there were no negative environmental impacts. The overall environmental impact of the investment project is positive. 81. A key aim of the CLGSSDP was to ensure greater transparency, accountability, and community participation at all stages of subproject selection, formulation, and implementation. In this respect the Program had substantial and positive impacts upon the participating communities, helping to significantly increase the degree of democracy and genuine participation in local planning and investment. In particular, the successful application of the PPME approach in conjunction with both community and local government capacity building has been of direct benefit in strengthening the current decentralization and democratization process in Indonesia. 82. Designed in response to the Asian economic crisis, the CLGSSDP was oriented toward economic recovery and employment generation. In addition to achieving both these aims, the Program has also created a process of local ownership in infrastructure development that was not necessarily envisaged at appraisal. 83. People’s welfare and hygiene have improved with the construction of infrastructure works at the village and district levels, including water supply facilities (1,108 subprojects), drainage facilities (1,858 subprojects), irrigation channels (1,980 subprojects), bridges (1,709 subprojects), roads (13,395 subprojects), public toilets (286 subprojects), markets (512 subprojects), school buildings (982 subprojects), sanitation facilities (113 subprojects), and boat piers (44 subprojects). These have led to environmental improvements. The overall environmental impact of the investment project is positive. The improved public infrastructure facilities have improved public health, increased economic opportunities, and enhanced quality of life in the affected communities. The achievement of the investment project in terms of number of beneficiaries exceeded the targeted 15 million people.
84. The lives of 1.5 million people benefited positively from the investment project. About 458,000 jobs for the poor were created during the construction period. This is equivalent to around 2.3 million people who received help during the crisis. The achievement of the investment project in terms of number of job opportunities for the poor exceeded the target of 300,000 jobs. 85. Given the above environmental, social, and other impacts, the investment project impacts are rated as “highly significant.”

20
IV. OVERALL ASSESSMENT AND RECOMMENDATIONS A. Overall Assessment 86. The Program contributed to mitigating some of the adverse impacts of Indonesia's serious economic crisis. It promoted reforms to decentralize and improve the efficiency of management of infrastructure service delivery. The Program was successful in achieving its objectives despite the fact that it had to be formulated in a very short time, during unstable political and economic conditions. As such, the Program was highly relevant, innovative, and timely, and had the full support of the Government in the policy dimensions of the Program as well as the investment project component. 87. The investment project is considered “successful” based on a review of its achievements covering outputs and purposes. The investment project was implemented in nine provinces (including provinces outside Java) and 79 districts and cities—or almost twice the original target of 30–40 districts. More than 12,200 villages implemented the PPME approach, which empowers communities to become the planners and implementers of their own development. Put in position to review their options and make choices consistent with their own needs and the available resources, these villages built or improved 18,800 basic public facilities. Meanwhile, local governments improved more than 3,000 public facilities in less-developed areas within their districts. The enthusiasm of community groups, which were able to participate in subprojects for their own direct benefit and experience a vital democratic process, underscores the importance of empowering and emancipating project beneficiaries. For this project, the resulting transparency and community supervision helped ensure a relatively high quality of civil works at low cost. Hasty preparation of the investment project, and lack of experience with new implementation procedures by program management caused a few problems at the outset of the investment project, but these were rectified and overcome. 88. Because of the exigencies of the crisis situation, detailed implementation arrangements were not fully developed at the outset of the Program. Nevertheless, both the Government and ADB decided to push ahead before detailed guidelines had been established. While this may be considered a risky strategy, it was driven by the urgent need to mitigate the economic crisis by providing poor communities with more employment opportunities and better access to public infrastructure facilities. 89. The overall performance of the Borrower and the Executing Agency were assessed as satisfactory. The Government met its counterpart fund requirements despite the difficult times after the economic crisis, but some local governments experienced delays in providing their counterpart share. The PMO very successfully undertook its role as lead agency. At the district and city levels, the district and city coordinating teams supervised subproject activities, which were coordinated by PMUs. Performance of the PMUs was generally satisfactory, although there were widespread delays in reporting. Coordination between the PMO and PMUs in the 79 participating districts and cities was also considered satisfactory. 90. The Program has contributed to improved quality of life of an estimated 32 million people, mostly poor, and exceeded the targeted 15 million persons. About 458,000 jobs for the poor were created during the construction period. The achievement in terms of number of work opportunities for the poor exceeded the targeted of 300,000 jobs (1.5 million people). The CLGSSDP has furthered both economic and social development by ensuring access to basic public infrastructure for the targeted vulnerable districts, villages, community groups, and individuals. This infrastructure is essential to their continued well-being and future productivity.

21
In particular, the management capacity of local communities, villages, and districts and their administrative offices has been increased through training and by directly involving these communities in the planning and implementation of the subprojects. 91. The overall assessment of the Program is “successful”. 25 B. Lessons 92. The Program demonstrates that it is possible for the Government and ADB to develop an effective large-scale emergency response program in a timely manner through fast-track approaches. The set of policy reforms proposed by the Program not only reinforced the implementation of the project loan, but also has relevance for the decentralization of governance in Indonesia and will continue to affect the way development cooperation utilizes the new decentralized structures. 93. A number of lessons during the first year of the investment project led to adjustments during the second year. The impact of these changes was felt when the investment project was extended to areas outside Java. The investment project successfully adapted to other major events and changes within the country, for example by mitigating the effects of the Bali bombing on the surrounding districts in East Java and Nusa Tenggara Barat. Annual district-, city-, provincial-, and national-level evaluation workshops led to a better understanding of project implementation constraints and measures to overcome these constraints. More effective management structures evolved over the course of investment project implementation. And as the PCR review has shown, these arrangements have been maintained and will be valid for future programs involving the participating local governments and communities. 1. Central Government Funding Contributions 94. The Ministry of Finance’s task in the investment project was to determine the amounts of grants and funding for CLGSSDP subprojects. This required an early advanced planning of capital expenditures in national budgets. As national budgets are approved by parliament and then disbursed to local governments based on the annual development budget (DIPP), a further step is required to activate disbursal of counterpart funding. That step involves obtaining local assembly approval for counterpart funding levels, as prescribed in the loan agreement. This counterpart funding is essential to obtaining central Government grant funding. In 2002 a new decree was issued requiring all local governments to expend allocated funds within the fiscal year of the grant. This pronouncement caused considerable problems for the CLGSSDP, as in many cases the DIPP was not released until around July. While local assemblies did allocate counterpart funds, in some cases those funds did not match the requirements of the block grants. Furthermore, local governments were not allowed to act until they had received notification that funding was being provided. All of the above resulted in shortened actual implementation periods, and local governments were pressed to hurry through procurement and physical implementation of type B works.
2. Guidelines and Cost Ceilings for Subprojects 95. In 2001 BAPPENAS issued a general CLGSSDP guideline (see footnote 8) that was meant to serve as orientation and basis for local governments to prepare their own detailed
25 This PCR is part of a sample of PCRs independently reviewed by the Operations Evaluation Department. The
review has validated the methodology used and the rating given.

22
technical and operational handbooks for subproject implementation (Juklak-Juknis). The guideline included information on detailed subproject processing and administration procedures, sample formats, and technical standards. However, it appears that the local governments have not been able to formulate such handbooks on their own (the auditor also noted this), nor have they received adequate support from the PMU consultants. It appears that the local governments were expecting the central Government to furnish them with a more detailed implementation guideline.26 96. Most villages are in need of additional, much larger investments in many subsectors. Since the formulation of the CLGSSDP there have been substantial increases in construction costs. Hence, many local communities felt that the cost ceilings for type A and B subprojects specified in the Program were too low and not in accordance with the reality of construction costs. Government-defined ceilings on grants to villages meant that no village could receive grants for type A subprojects of more than Rp75 million ($8,823); individual type A subprojects were limited to half that amount, or Rp37.5 million ($4,411). Thus, many of the subprojects were very small-scale and had limited impact on village economies. Furthermore, it was often difficult for these communities to identify subprojects small enough to qualify for CLGSSDP funding. In a large number of instances, only a portion of the funding necessary to complete the subproject was available; however, many such subprojects were initiated anyway in the hope that additional funding to complete the subproject would become available in the following year. However, there are no instances where CLGSSDP has actually funded a second stage of civil works for one subproject. 3. Control Issues 97. From a control point of view, the PMO would have liked to execute approval authority over disbursements. However, the delegated project implementation arrangements did not give the PMO any role for approval. This remoteness of the PMO was questioned by the Executing Agency; on the other hand it does reflect the requirements of decentralization. Without proper fast-track reporting via the internet (or other means), the PMO could not possibly have acted as the approval authority for such a large number of subprojects—particularly the larger type B subprojects. 98. As BPKP’s audit report27 demonstrated, there were only a few examples of misuse of funds. The total amount involved in those cases was Rp689 million (approximately $81,000)—less than 1% of the ADB loan amount. The Executing Agency is actively pushing to correct all misuses of funds detected by BPKP, and the local governments concerned are expected to pay back the indicated amounts. 4. Procurement 99. Many local governments hired new consultants for the second year of their subprojects. This often resulted in extraordinary delays and had adverse effects on implementation, in addition to causing the PMO and PMC to expend considerable effort keeping track of these changes and ensuring compliance with relevant project guidelines.
26 Obviously, this also indicates that the TA consultants were not able to build such capacity. 27 BPKP. 27 September (Lap. SP-425/D.I.04/2005). The report lists irregularities in districts in Central Java, East
Java, Lampung, South Sulawesi and South Sumatra. South Sulawesi (particularly Tana Toraja) alone was responsible for Rp395 million ($46,000) of the above amount.

23
5. Type B Subprojects 100. The subprojects grouped under type B tended to be bigger. Communities did not necessarily participate in the decision to construct these subprojects. By and large, community groups considered type B subprojects to be local government activities, with no (or limited) sense of ownership accruing to the community. Type B subprojects were supposed to have longer gestation periods and be more complicated and resource intensive. To encourage greater community participation, public hearings were encouraged for type B subprojects to invite an open forum for discussion of these subprojects. Unfortunately, the public hearing concept was entertained only by about 50% of the participating local governments. It is believed that more widely applied public hearings would have benefited all stakeholders involved and would have assured wider community support for these subprojects. Unfortunately, public disclosure, transparency, and public accountability are rarely practiced in Indonesia; where such practices do exist, they are often jeopardized by the local bureaucracy, which considers them too expensive. 6. Operations and Maintenance 101. O&M did not receive enough attention. Most subprojects failed to provide funding for the O&M of subprojects, and did not take into account eventual replacement of major equipment or broken or worn parts. This would have required an effort to price the costs of ongoing maintenance and asset replacement, and formulate O&M management plans. O&M training, which was planned too late under the investment project, was rarely implemented. In most districts and cities, the envisaged O&M subteams of the core teams did not function properly. These subteams were meant to establish O&M plans for all facilities. Very few subprojects are charging any user or maintenance fees to fund maintenance works and asset replacement. Despite the large potential of user associations in water and irrigation subprojects, none have been formed to date. Such associations could assume responsibility for collecting service charges and maintenance fees and regular maintenance. Nor have already existing market vendor associations taken on an active role in O&M. 7. Satellite Offices 102. The PMC had much difficulty covering all districts through field visits, partly because poor transport infrastructure made it difficult to cover the enormous distances between field locations. Often monitoring and evaluation was done through long distance means (e.g. telephone) only and reports received. The original terms of reference (TOR) failed to identify the need for field visits. However, during implementation of the investment project five regional program staff were added and tasked with undertaking subproject visits and monitoring progress in the field. 8. Training Programs 103. TA 3179-INO (see footnote 4) designed a number of training programs on PPME, emphasizing participatory methods and role-playing (Appendix 2). However, the training programs failed to cover project management and failed to ensure local government commitment toward compliance with investment project guidelines. The training completely ignored sustainability issues and the concept of generating revenue to fund O&M.
24
9. Public Awareness Campaign 104. Difficulties defining the objectives of the public awareness campaign of the investment project led to it being launched only in 2003. Campaign activities included bulletins, leaflets, reports, a website, and videos. Public awareness campaign training was included in the training programs for facilitators. Some of these efforts were well intended and helped bridge the gap between the perceptions of local government and the communities. However, much more could have been done. Better public awareness campaigns could have encouraged local government officials to participate more in construction efforts, and encouraged core teams to work more closely with communities. C. Recommendations 1. Program Related 105. The lessons from the Program could be very relevant to future program design and implementation, and should be made widely accessible to the international community. 106. Although the Program has finished, many of its features continue to be incorporated into ongoing Government programs designed to provide community infrastructure and generate employment. In particular, block grants and measures to mobilize community participation have been introduced to other programs, and will continue to be utilized in both crisis and non-crisis situations.
2. Investment Project Related 107. The experience of the investment project points at the following recommendations which should be taken care of before similar ADB support becomes available in 2008 through the Second Community and Local Government Support Program (CLGSII):28
(i) The CLGSSDP’s approach of "stimulation” funding for community development projects through local government budgets (APBD) and community resources should be introduced in the national APBP guidelines. (Action: Ministry of Finance)
(ii) The Ministry of Finance should undertake efforts to accelerate finalization of
annual development budget (DIPP) allocations and transfers (most local governments receive DIPP funds only in July, i.e., after half of the budget year has passed). Accelerated fund transfer could help avoid hastened subproject implementation or the need for extensions of budget validity into the subsequent calendar year. (Action: Ministry of Finance)
(iii) The central Government should develop procedures and technologies to
streamline project reporting via electronic media (internet) in order to increase control over data transfer and speed up transmission. For the purpose of obtaining valid legal documentation, electronic transmissions can be supplemented with signed originals to be submitted via conventional mail. (Action: Ministry of Home Affairs)
28 It is suggested that TA4683-INO: Preparation of the Second Community and Local Government Support Project
shall monitor the implementation of these recommendations.

25
(iv) Local governments should be allowed to extend contracts of consultants and
contractors to the following year(s) without re-tender, through simplified procedures for contract extension. (Action: Secretariat of the President)
(v) The Government should review guidelines for grant funding to local governments
(via APBN and other general or special allocations known as DAU or DAK, and define realistic cost-responsive new ceilings for subprojects. (Action: Ministry of Finance)
(vi) All subprojects that have a direct visible impact on the economy or well being of
the population (like water supply, irrigation, and markets) should charge service and maintenance fees to cover community-operated maintenance work and asset replacement. (Action: Ministry of Home Affairs)
(vii) Since user associations are a large and as yet untapped asset, it is
recommended that water and irrigation users’ associations are introduced to handle collection of service charges and maintenance fees; they should also be tasked with regular maintenance responsibilities. Where market vendor associations already exist, such associations should be involved in the management and maintenance of market facilities. (Action: Ministry of Home Affairs)
(viii) The Executing Agency should seek resources for an O&M-related training
program that reaches out to all districts and conveys the message of community-based maintenance of CLGSSDP-sponsored civil works. Public campaign instruments (like the CLGSSDP newsletter) should be continued. (Action: BAPPENAS)
3. General
108. Future ADB projects—in particular the proposed CLGS II currently under preparation—should consider the following general recommendations based on the key lessons learned from this program review:
(i) A unified and harmonized approach and methodology should be applied by the Government and donors to all community-based development projects, namely CLGS II, KDP, UPP and other bilateral donor projects.29 The basic model of management, the approach to financial management and disbursement, and the level of grant support, counterpart funding, and community contributions should all be harmonized.
(ii) New programs (like CLGS II) should focus on poverty reduction, development of
democratic institutions, and reform of procedures of project management and implementation. Project objectives should be simplified so that development results are easy to monitor; long-term sustainability (including O&M) should be ensured.
29 The Decentralization Support Facility (DSF) of BAPPENAS, DFID, World Bank, ADB and AusAID are aiming at
such harmonization of donor-supported community development programs. If agreement can be reached on this, future projects may follow a common pattern in objectives and operational guidelines.

26
(iii) Cost ceilings of subprojects should be increased to realistic levels. It is
recommended that the Keppres 80/2003 rule, which puts financial ceilings on community-managed projects, be waived. Community-managed projects should be implemented without tenders, with the community managing or supervising the works, undertaking direct purchases of materials, and directly appointing specialized workers and craftsmen.
(iv) There is a need for more bundled investment in each village. Villages should be
entitled to receive more than one subproject when adequate justification is provided.
(v) Future investment projects may expand the physical scope of subprojects to
include funding for health, education, and nonphysical aspects (skills training, etc.).
(vi) Detailed technical and operational handbooks (Juklak-Juknis) need to be
developed by the Executing Agency and made available to all participating communities and local governments.
(vii) Project management should look for a more decentralized, regional structure;
satellite offices should be established to provide more proximity to local developments and implementation requirements.
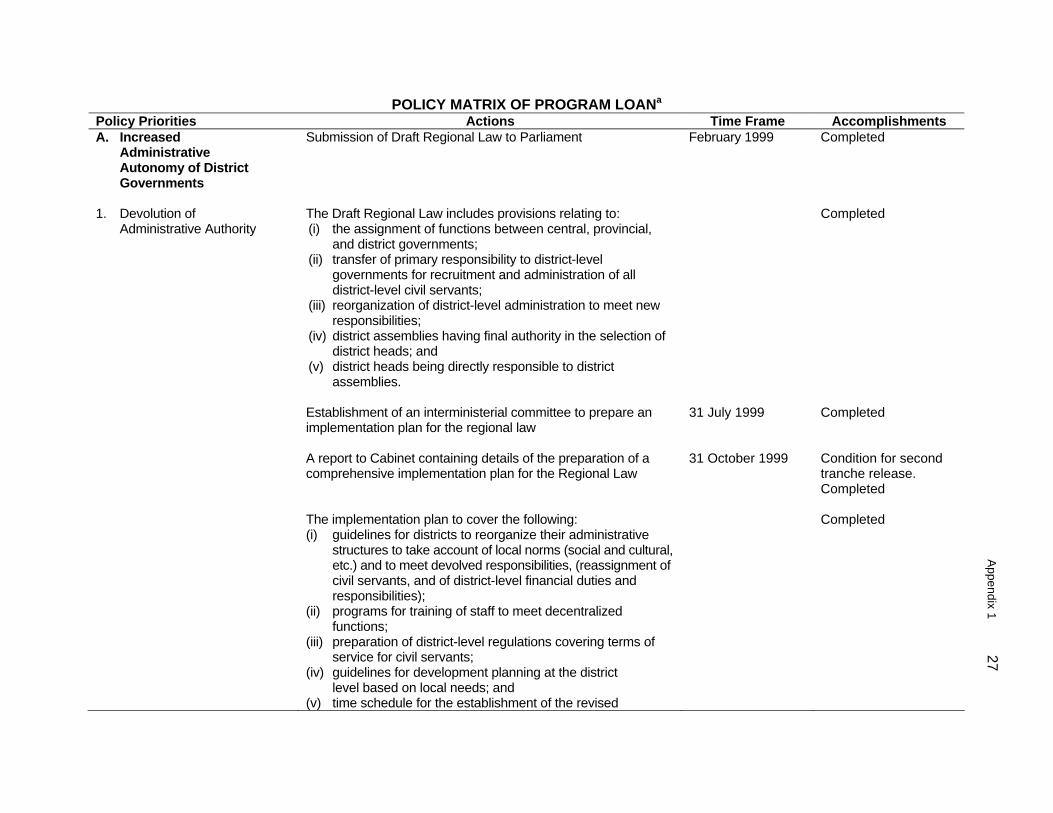
Appendix 1 27
POLICY MATRIX OF PROGRAM LOANa Policy Priorities Actions Time Frame Accomplishments A. Increased
Administrative Autonomy of District Governments
Submission of Draft Regional Law to Parliament February 1999 Completed
1. Devolution of Administrative Authority
The Draft Regional Law includes provisions relating to: (i) the assignment of functions between central, provincial,
and district governments; (ii) transfer of primary responsibility to district-level
governments for recruitment and administration of all district-level civil servants;
(iii) reorganization of district-level administration to meet new responsibilities;
(iv) district assemblies having final authority in the selection of district heads; and
(v) district heads being directly responsible to district assemblies.
Completed
Establishment of an interministerial committee to prepare an implementation plan for the regional law
31 July 1999 Completed
A report to Cabinet containing details of the preparation of a comprehensive implementation plan for the Regional Law
31 October 1999 Condition for second tranche release. Completed
The implementation plan to cover the following: (i) guidelines for districts to reorganize their administrative
structures to take account of local norms (social and cultural, etc.) and to meet devolved responsibilities, (reassignment of civil servants, and of district-level financial duties and responsibilities);
(ii) programs for training of staff to meet decentralized functions;
(iii) preparation of district-level regulations covering terms of service for civil servants;
(iv) guidelines for development planning at the district level based on local needs; and
(v) time schedule for the establishment of the revised
Completed

28 Appendix 1
Policy Priorities Actions Time Frame Accomplishments district-level administrative system
Issuance of ministerial decree for districts to reorganize their administrative structures and to meet their devolved responsibilities
31 March 2000 Condition for third tranche release. Completed
Programs for training of staff to meet decentralized functions to commence
2–3 year program Program for training to commence by October 1999. Commenced
Issuance of district-level regulations covering terms of service of district-level civil servants
Mid- to late 2000 Terms of service of civil servants is either covered in district level regulations already issued for organizational structures and staffing lists, or will be covered separately.
Issuance of guidelines for development planning at the district level based on local needs
31 March 2000 Condition for third tranche release. Completed
Issuance of time schedule for the establishment of revised district-level administrative system
31 March 2000 Condition for third tranche release. Completed
Issuance of regulations to initiate administrative devolution The regulations will cover: (i) the assignment of administrative responsibilities at the
district level; (ii) the transfer of responsibility to district-level civil servants
for recruitment and administration of all district-level civil servants; and
(iii) the reorganization of district-level administration to meet new responsibilities.
31 October 1999 Condition for second Tranche release. Completed.
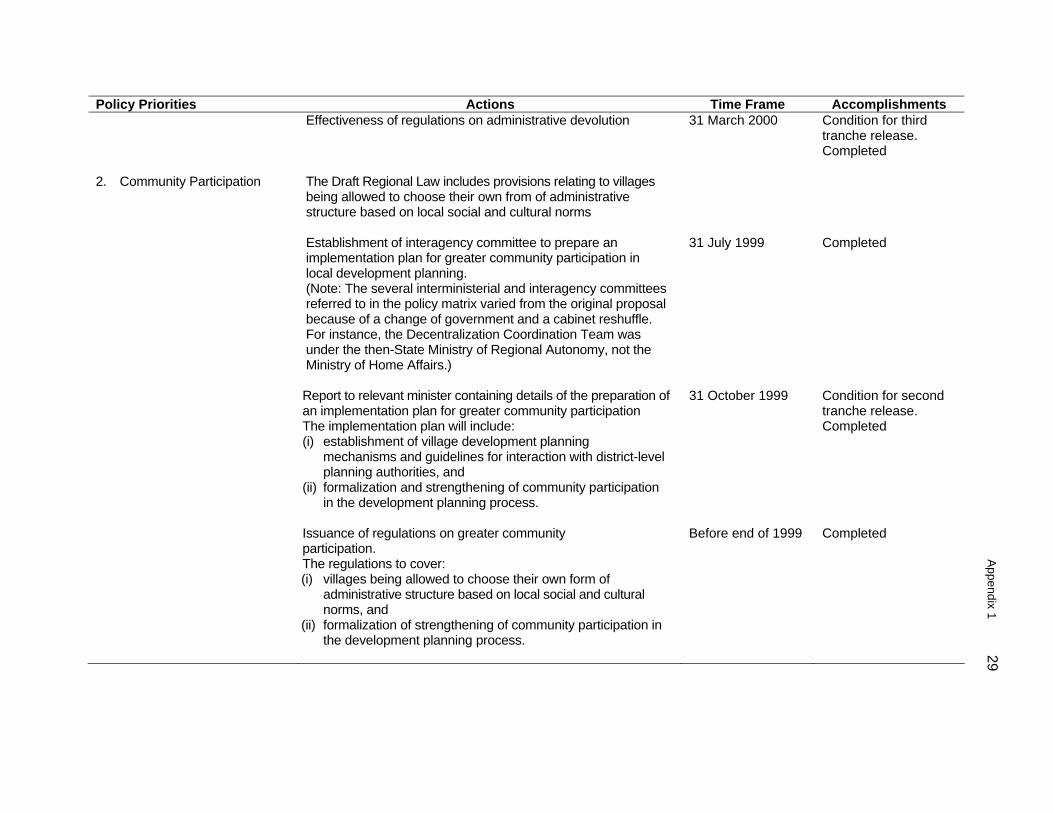
Appendix 1 29
Policy Priorities Actions Time Frame Accomplishments Effectiveness of regulations on administrative devolution 31 March 2000 Condition for third
tranche release. Completed
2. Community Participation The Draft Regional Law includes provisions relating to villages being allowed to choose their own from of administrative structure based on local social and cultural norms
Establishment of interagency committee to prepare an implementation plan for greater community participation in local development planning. (Note: The several interministerial and interagency committees referred to in the policy matrix varied from the original proposal because of a change of government and a cabinet reshuffle. For instance, the Decentralization Coordination Team was under the then-State Ministry of Regional Autonomy, not the Ministry of Home Affairs.)
31 July 1999 Completed
Report to relevant minister containing details of the preparation of an implementation plan for greater community participation The implementation plan will include: (i) establishment of village development planning
mechanisms and guidelines for interaction with district-level planning authorities, and
(ii) formalization and strengthening of community participation in the development planning process.
31 October 1999 Condition for second tranche release. Completed
Issuance of regulations on greater community participation. The regulations to cover: (i) villages being allowed to choose their own form of
administrative structure based on local social and cultural norms, and
(ii) formalization of strengthening of community participation in the development planning process.
Before end of 1999 Completed

30 Appendix 1
Policy Priorities Actions Time Frame Accomplishments Effectiveness of regulations on greater community
participation 31 March 2000 Condition for third
tranche release. Completed
3. Improved Transparency Draft Regional law includes provisions relating to the preparation and presentation of district head's annual report to district assembly
Establishment of interagency committee to prepare an implementation plan for improved transparency relating to the preparation and presentation of district head's annual report to district assembly
31 July 1999 Completed
Report to relevant minister containing details of implementation plan for improved transparency relating to the preparation and presentation of district head's annual report to district assembly
31 October 1999 Condition for second tranche release. Completed
Issuance of regulations stipulating public disclosure of the district head's annual report to district assembly
31 March 2000 Condition for third tranche release. Completed
4. Efficient Implementation of Laws at District Level
Establishment of interministerial committee to formulate administrative measures necessary for accelerated implementation of legislation at district level
31 October 1999 Completed
The Government begins phased adoption of administrative measures for the accelerated implementation of legislation at district level as formulated by interministerial committee
Over 1–2 years, beginning late 1999
Proceeding. For instance, the Government is reviewing local regulations submitted by districts.
B. Increased Fiscal Autonomy of District Governments
Submission of draft law on intergovernmental fiscal relations to Parliament (Fiscal Balance)
February 1999 Completed
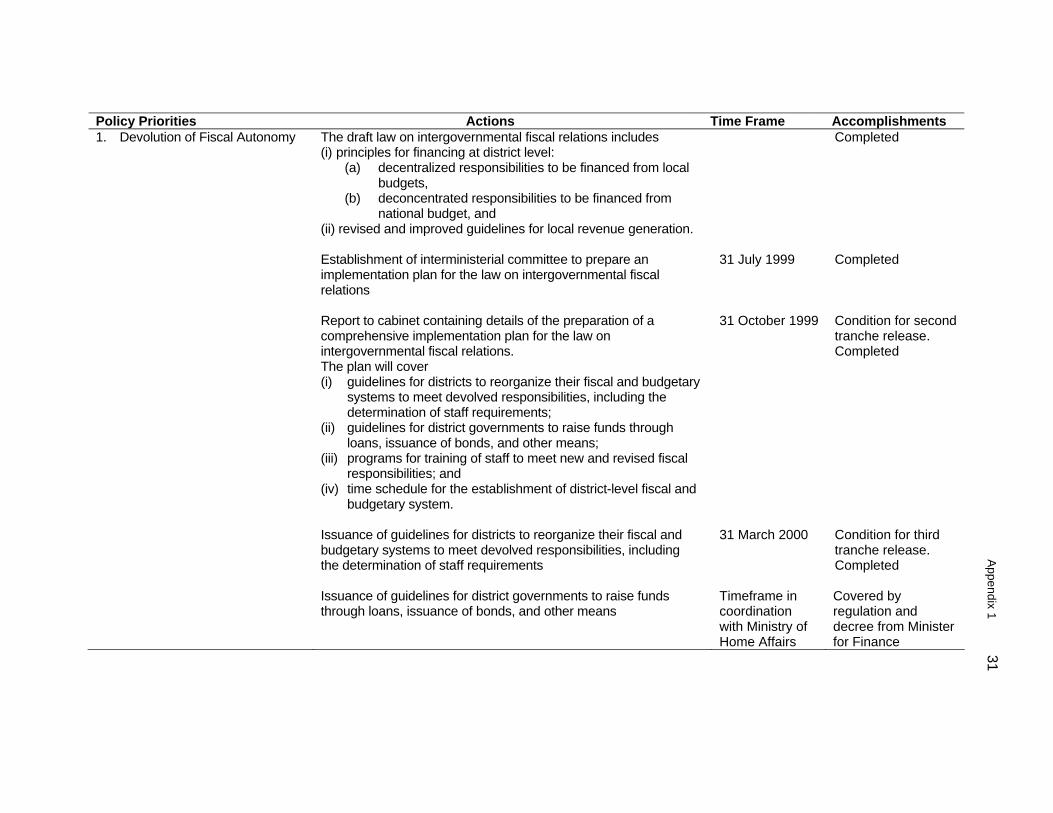
Appendix 1 31
Policy Priorities Actions Time Frame Accomplishments 1. Devolution of Fiscal Autonomy The draft law on intergovernmental fiscal relations includes
(i) principles for financing at district level: (a) decentralized responsibilities to be financed from local
budgets, (b) deconcentrated responsibilities to be financed from
national budget, and (ii) revised and improved guidelines for local revenue generation.
Completed
Establishment of interministerial committee to prepare an implementation plan for the law on intergovernmental fiscal relations
31 July 1999 Completed
Report to cabinet containing details of the preparation of a comprehensive implementation plan for the law on intergovernmental fiscal relations. The plan will cover (i) guidelines for districts to reorganize their fiscal and budgetary
systems to meet devolved responsibilities, including the determination of staff requirements;
(ii) guidelines for district governments to raise funds through loans, issuance of bonds, and other means; (iii) programs for training of staff to meet new and revised fiscal responsibilities; and (iv) time schedule for the establishment of district-level fiscal and
budgetary system.
31 October 1999 Condition for second tranche release. Completed
Issuance of guidelines for districts to reorganize their fiscal and budgetary systems to meet devolved responsibilities, including the determination of staff requirements
31 March 2000 Condition for third tranche release. Completed
Issuance of guidelines for district governments to raise funds through loans, issuance of bonds, and other means
Timeframe in coordination with Ministry of Home Affairs
Covered by regulation and decree from Minister for Finance

32 Appendix 1
Policy Priorities Actions Time Frame Accomplishments Program for training of staff to meet new and revised fiscal
responsibilities 2–3 year program
Covered in national framework for decentralization of capacity building
Issuance of time schedule for establishment of district-level fiscal and budgetary system
31 March 2000 Condition for third tranche release. Completed
2. Rationalization of Revenue Sharing between Different Government Levels
The draft law on intergovernmental fiscal relations will include (i) simple and transparent formula for sharing of revenues
between central and provincial governments, and (ii) simple and transparent formula for block grants from central
to provincial governments
Issuance of regulations for the application of new formulas for sharing of revenues and for block grants
31 October 1999 Condition for second tranche release. Completed
Effectiveness of regulations for the application of new formulae for sharing of revenues and for block grants
31 March 2000 Condition for third tranche release. Completed
Phased introduction of new system using formulas for sharing of revenues and for block grants initiated
2–3 year program
Formula issued for 2001, and new formula for 2002 under preparation
Establishment of interministerial committee to consider formulas for sharing of revenues and for block grants from provincial to district governments
31 October 1999 Condition for second tranche release. Completed
Report to Cabinet containing proposals for sharing of revenues and for block grants from provincial to district governments
31 March 2000 Condition for third tranche release. Completed

Appendix 1 33
Policy Priorities Actions Time Frame Accomplishments 3. Improved Transparency Draft law on intergovernmental fiscal relations includes
provisions relating to (i) public disclosure of fiscal and budgetary information at the
district level, and (ii) improved district financial management and accountability
procedures.
31 March 2000 Condition for third tranche release. Completed
Establishment of interministerial committee to prepare an implementation plan to improve mechanisms for public disclosure of fiscal and budgetary information at the district level and to improve district financial management and accountability procedures.
31 October 1999 Completed.
Report to Cabinet containing details of the preparation of an implementation plan to improve public disclosure of fiscal and budgetary information at the district level and to improve district financial management and accountability procedures. The plan will cover (i) district budgets, (ii) district project finances, (iii) government audits at district level, (iv) improvements in district finance management
and accountability procedures, and (v) time schedule for the implementation of the plan.
31 October 1999 Condition for second tranche release. Completed.
Issuance of time schedule for the implementation of the plan to improve mechanisms for public disclosure of information at the district level and to improve local finance management and accountability procedures
31 March 2000 Condition for third tranche release. Completed.
The Government begins phased adoption of plan to improve mechanisms for public disclosure of information at the district level and to improve local finance management and accountability procedures
Over 1–2 years beginning mid-2000
Public disclosure of regulation and guidelines are now effective, and local government capacity building covers financial management and

34 Appendix 1
Policy Priorities Actions Time Frame Accomplishments
a Columns 1–3 taken from the policy matrix attached to the Government’s development policy letter of 24 February 1999. Source: ADB. 2001. Progress Report on the Community and Local Government Support Sector Development Program (Loan 1677-INO) in the Republic of Indonesia. Manila.
accountability. C. Decentralization of
Environmental Management Issuance of regulations pertaining to decentralization of environmental management to the district level, in accordance with Articles 12, 13, and 22 of Act of the Republic of Indonesia No. 23 of 1997 concerning Environmental Management (Act 23)
31 March 2000 Condition for third tranche release. Completed
Issuance of ministerial decree relating to implementation of mandatory environmental audit in accordance with Article 29 of Act 23 of 1997
31 March 2000 Condition for third tranche release. Completed
Effectiveness of regulations pertaining to decentralization of environmental management to the district level in accordance with Articles 12, 13, and 22 of Act 23 of 1997.
Over 1–2 years beginning in mid-2000
Most districts have operational environmental impact management agencies that are already exercising devolved mandates.
Effectiveness of ministerial decree relating to implementation of mandatory environmental audit in accordance with Article 29 of Act 23 of 1997
Most districts have operational environmental impact management agencies that are already exercising devolved mandates.

Appendix 2 35
PROGRAM FRAMEWORK
Design Summary Performance Targets Monitoring Mechanisms Assumptions and Risks 1. Goals • Improved socioeconomic well-being • Level of household well-
being improved • Benchmark, midterm,
and post-implementation project appraisal surveys
• Government secondary data
• A: Central government commitment to improve macroeconomic, social, and political conditions
2. Purpose 2.1 Reduce poverty and restore economic
activity 2.2 Support Government’s decentralization
efforts 2.3 Empower local community to participate
in local development
• Level of household income raised
• Devolution of administrative and fiscal authority to district governments
• Rationalization of the functions and responsibilities of civil servants at district level
• Increased involvement of local communities in decision making within their district government
• Greater information disclosure and transparency relating to district activities
• Quarterly and semiannual status reports
• Midterm review and field reports
• Government secondary data
• Quarterly and semiannual status reports
• Midterm review and field-trip reports
• Government secondary data
• Quarterly and
semiannual status reports
• Midterm review and field trip reports
• Government secondary data
• Adoption of participatory planning, monitoring, and evaluation (PMES) as part of annual development planning within participating districts
• A: Lack of reliable data • R: Technical and financial
authorities fail to agree on priority of community needs
• R: Failure to implement policies because of poor administrative capacity and lack of political will
• R: Recognition of key policy issues may not occur
• A: Willingness and commitment to involve project stakeholders in all aspects of project planning, implementation, and monitoring
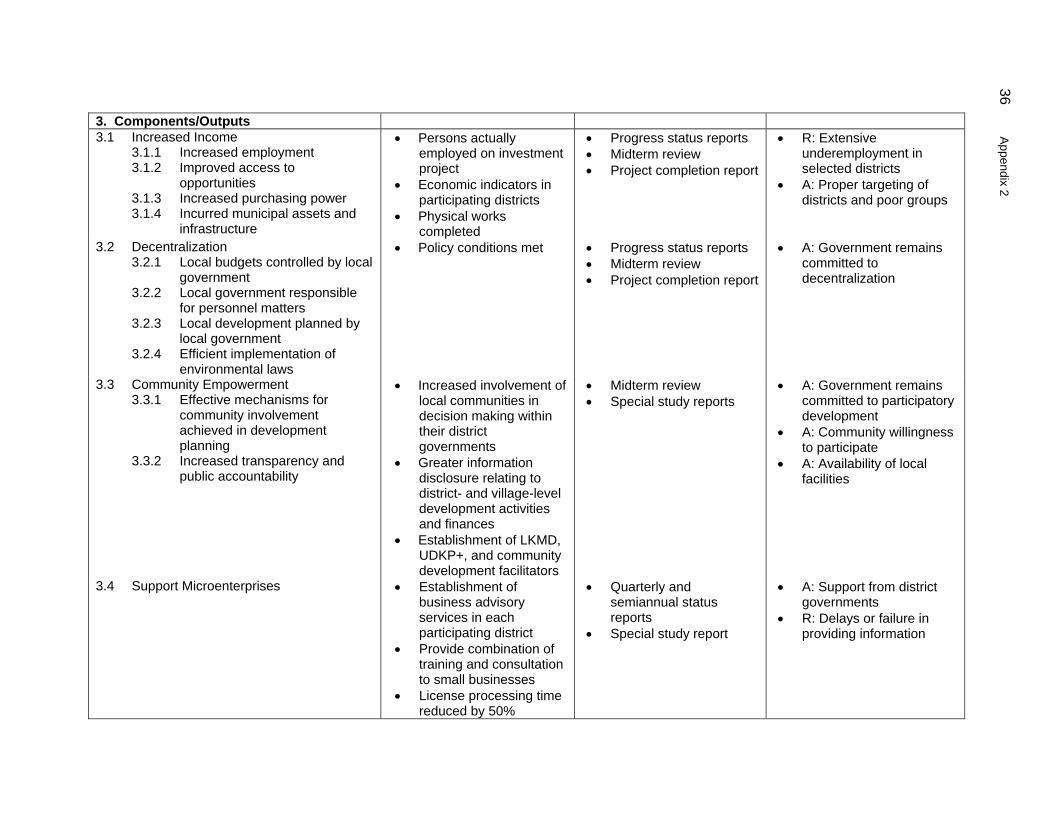
36 Appendix 2
3. Components/Outputs 3.1 Increased Income
3.1.1 Increased employment 3.1.2 Improved access to
opportunities 3.1.3 Increased purchasing power 3.1.4 Incurred municipal assets and
infrastructure
• Persons actually employed on investment project
• Economic indicators in participating districts
• Physical works completed
• Progress status reports • Midterm review • Project completion report
• R: Extensive underemployment in selected districts
• A: Proper targeting of districts and poor groups
3.2 Decentralization 3.2.1 Local budgets controlled by local
government 3.2.2 Local government responsible
for personnel matters 3.2.3 Local development planned by
local government 3.2.4 Efficient implementation of
environmental laws
• Policy conditions met • Progress status reports • Midterm review • Project completion report
• A: Government remains committed to decentralization
3.3 Community Empowerment 3.3.1 Effective mechanisms for
community involvement achieved in development planning
3.3.2 Increased transparency and public accountability
• Increased involvement of local communities in decision making within their district governments
• Greater information disclosure relating to district- and village-level development activities and finances
• Establishment of LKMD, UDKP+, and community development facilitators
• Midterm review • Special study reports
• A: Government remains committed to participatory development
• A: Community willingness to participate
• A: Availability of local facilities
3.4 Support Microenterprises • Establishment of business advisory services in each participating district
• Provide combination of training and consultation to small businesses
• License processing time reduced by 50%
• Quarterly and semiannual status reports
• Special study report
• A: Support from district governments
• R: Delays or failure in providing information

Appendix 2 37
4. Inputs/Activities 4.1 Infrastructure Development
4.1.1 Civil Works (roads, bridges, irrigation, waste disposal, water supply, sanitation, etc.)
4.1.2 Equipment and materials 4.1.3 Consultants services 4.1.4 Implementation strategy
• National and district consultants in place
• Project administration memorandum prepared
• Detailed work plan • Quarterly reports, annual
evaluation, and audit reports
• Progress reports • Project administration
memorandum
• A: Cost estimates for the investment project are sufficient
• A: Availability and timeliness of inputs
• A: No major price or demand deviation from investment project forecast
4.2 Institutional Establishment 4.2.1 Establish national and district
project implementation unit 4.2.2 Develop investment project
guidelines 4.2.3 Develop training modules 4.2.4 Establish village, subdistrict, and
district community development forums
4.2.5 Consultant services for PPME
• National and district offices established
• Relevant decrees and
district regulations
• Progress report • Investment project
reports • Investment project
reports • Progress reports
• A: Assignment of sufficiently senior people to national and district investment project management offices
• A: Assignment of sufficiently local government staff to the investment Project
• A: District Mayor participation condition
4.3 Enterprises Support Component 4.3.1 Identify business organizations 4.3.2 Participatory workshops on
business problems 4.3.3 Formulate assistance strategies 4.3.4 Implement strategies
• List of enterprises requiring help
• Establishment of new licensing offices and procedures
• Regular reviews • R: Lack of commitment to change licensing procedures
4.4 Policy Reform 4.4.1 Consultant services for TA for
capacity building to support decentralized administrative system
4.4.2 Consultant services for TA for capacity building for setting up district-level budgetary system
4.4.3 Training workshops for staff at district level
4.4.4 Monitoring and evaluation of decentralization policies
• Consultants recommendations implemented
• Consultants
recommendations implemented
• All policy matrix
conditions met
• Consultants’ reports • Consultants reports • Progress status reports • Progress status reports
• A: Qualified persons available
• A: Government staff of
sufficient senior officials assigned to studies
• A: Government
commitment to changes • A: Implementation of new
laws and regulations
A = assumption, LKMD = village resilience board, PPME = participatory planning, monitoring, and evaluation, R = risk, TA = technical assistance. Source: National Development Planning Agency (BAPPENAS).
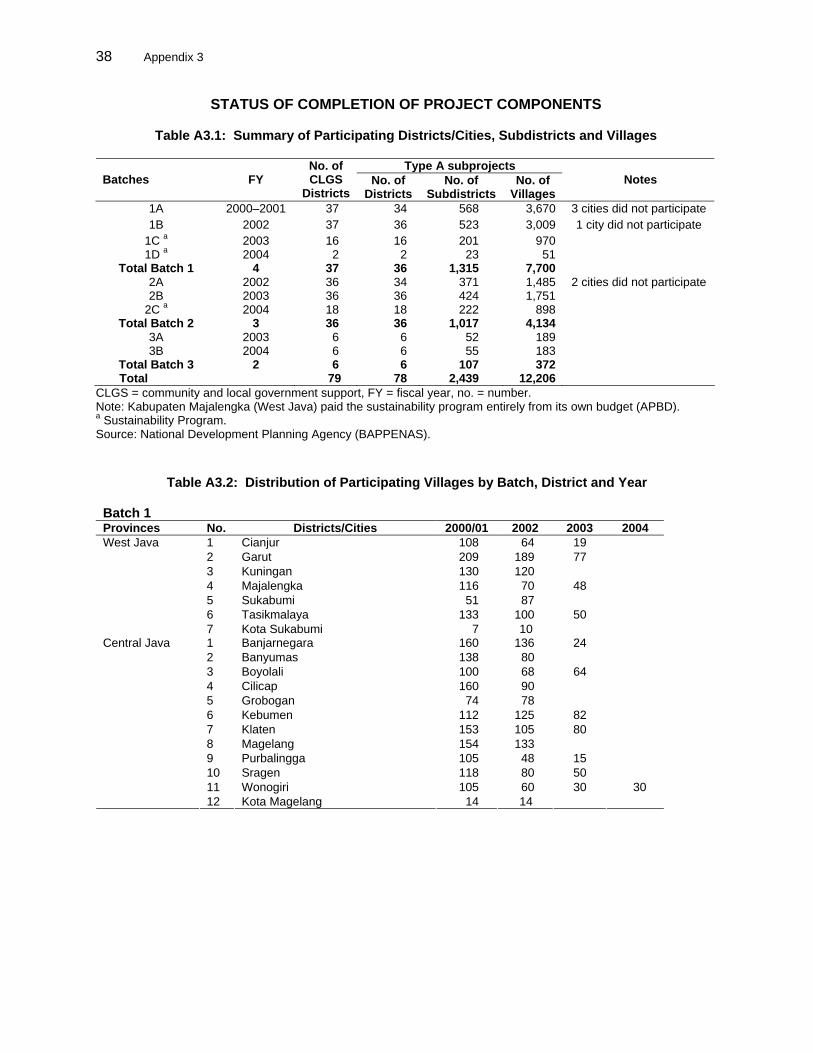
38 Appendix 3
STATUS OF COMPLETION OF PROJECT COMPONENTS
Table A3.1: Summary of Participating Districts/Cities, Subdistricts and Villages Type A subprojects
Batches FY No. of CLGS
Districts No. of
Districts No. of
Subdistricts No. of
Villages Notes
1A 2000–2001 37 34 568 3,670 3 cities did not participate 1B 2002 37 36 523 3,009 1 city did not participate
1C a 2003 16 16 201 970 1D a 2004 2 2 23 51
Total Batch 1 4 37 36 1,315 7,700 2A 2002 36 34 371 1,485 2 cities did not participate 2B 2003 36 36 424 1,751
2C a 2004 18 18 222 898 Total Batch 2 3 36 36 1,017 4,134
3A 2003 6 6 52 189 3B 2004 6 6 55 183
Total Batch 3 2 6 6 107 372 Total 79 78 2,439 12,206
CLGS = community and local government support, FY = fiscal year, no. = number. Note: Kabupaten Majalengka (West Java) paid the sustainability program entirely from its own budget (APBD). a Sustainability Program. Source: National Development Planning Agency (BAPPENAS).
Table A3.2: Distribution of Participating Villages by Batch, District and Year Batch 1 Provinces No. Districts/Cities 2000/01 2002 2003 2004
1 Cianjur 108 64 19 2 Garut 209 189 77 3 Kuningan 130 120 4 Majalengka 116 70 48 5 Sukabumi 51 87 6 Tasikmalaya 133 100 50
West Java
7 Kota Sukabumi 7 10 1 Banjarnegara 160 136 24 2 Banyumas 138 80 3 Boyolali 100 68 64 4 Cilicap 160 90 5 Grobogan 74 78 6 Kebumen 112 125 82 7 Klaten 153 105 80 8 Magelang 154 133 9 Purbalingga 105 48 15 10 Sragen 118 80 50 11 Wonogiri 105 60 30 30
Central Java
12 Kota Magelang 14 14

Appendix 3 39
Provinces No. Districts/Cities 2000/01 2002 2003 2004
1 Blitar 90 59 248 2 Jember 169 237 3 Jombang 82 82 4 Kediri 142 74 5 Lumajang 82 60 6 Madiun 65 51 7 Magetan 131 79 8 Nganjuk 84 70 9 Ngawi 198 140 71 10 Pacitan 68 97 11 Pamekasan 58 75 37 12 Ponorogo 90 96 13 Sumenep 140 94 14 Trenggalek 66 67 48 15 Tulungagung 58 48 16 Kota Blitar 6 17 Kota Kediri
East Java
18 Kota Madiun 17 27 21 Subtotal 3,670 3,009 970 51 No = number. Source: National Development Planning Agency (BAPPENAS). Batch 2 Provinces No. Districts/Cities 2000/01 2002 2003 2004
1 Musi Banyuasin 42 42 2 Musi Rawas 65 30 32 3 Ogan Komering Ilir 42 50 4 Ogan Komering Ulu 40 50
South Sumatera
5 Kota Palembang 13 26 30 1 Lampung Tengah 47 60 14 2 Tulang Bawang 36 30
Lampung
3 Kota Bandar Lampung 14 Banten 1 Lebak 87 75 44 West Java 1 Kota Bandung 35 45
1 Batang 32 36 21 2 Blora 50 70 3 Brebes 31 75 4 Pati 40 65 51 5 Pemalang 45 45 6 Purworejo 35 48 80 7 Tegal 31 35 8 Temanggung 25 35 60
Central Java
9 Wonosobo 30 58 1 Bantul 34 50 40 2 Kulon Progo 45 45 45
DI Yogyakarta
3 Sleman 54 54 54 1 Bangkalen 48 53 2 Bojonegoro 45 64 3 Bondowoso 30 30 4 Malang 175 174 175 5 Pasuruan 33 40 20 6 Probolinggo 41 50 7 Sampang 87 64 105
East Java
8 Tuban 43 44

40 Appendix 3
Provinces No. Districts/Cities 2000/01 2002 2003 2004
1 Bantaeng 24 32 34 2 Bone 24 25 23 3 Sinjai 32 34 40 4 Tana Toraja 19 27 5 Wajo 25 50
South Sulawesi
6 Kota Makassar 26 30 Subtotal 1,485 1,751 898
No = number. Source: National Development Planning Agency (BAPPENAS). Batch 3 Provinces No. Districts/Cities 2000/01 2002 2003 2004
1 Banyuwangi 36 28 2 Lamongan 54 55
East Java
3 Situbondo 26 26 1 Lombok Barat 24 24 2 Lombok Tengah 26 26
West Nusa Tenggara
3 Lombok Timur 23 24 Subtotal 189 183
9 79 3,670 4,4,94 2,910 1,132 No. = number. Source: National Development Planning Agency (BAPPENAS).
Table A3.3: Participating Subdistricts by Districts/Cities, Batch and Year
Batch 1 Provinces No Districts/Cities 2000/01 2002 2003 2004
1 Cianjur 23 19 8 2 Garut 30 34 23 3 Kuningan 20 21 4 Majalengka 15 8 15 5 Sukabumi 25 26 6 Tasikmalaya 29 29 22
West Java
7 Kota Sukabumi 3 2 1 Banjarnegara 11 10 4 2 Banyumas 23 11 3 Boyolali 10 7 5 4 Cilicap 23 18 5 Grobogan 19 19 6 Kebumen 14 14 12 7 Klaten 21 21 18 8 Magelang 20 16 9 Purbalingga 16 11 12 10 Sragen 20 14 13 11 Wonogiri 20 14 11 20
Central Java
12 Kota Magelang 2 2

Appendix 3 41
1 Blitar 22 17 22 2 Jember 21 31 3 Jombang 21 16 4 Kediri 23 19 5 Lumajang 12 11 6 Madiun 8 8 7 Magetan 15 15 8 Nganjuk 19 13 9 Ngawi 17 17 18 10 Pacitan 12 7 11 Pamekasan 6 10 6 12 Ponorogo 10 12 13 Sumenep 18 21 14 Trenggalek 14 14 9 15 Tulungagung 8 10 16 Kota Blitar 23 3 17 Kota Kediri 30
East Java
18 Kota Madiun 20 3 3 3 Subtotal 570 523 201 23
No = number. Source: National Development Planning Agency (BAPPENAS). Batch 2 Provinces No Districts/Cities 2000/01 2002 2003 2004
1 Musi Banyuasin 15 5 2 Musi Rawas 11 13 14 3 Ogan Komering Ilir 7 12 4 Ogan Komering Ulu 23 23
South Sumatera
5 Kota Palembang 7 11 14 1 Lampung Tengah 12 12 8 2 Tulang Bawang 5 5
Lampung
3 Kota Bandar Lampung 3 Banten 1 Lebak 10 5 11 West Java 1 Kota Bandung 22 22
1 Batang 12 12 12 2 Blora 8 14 3 Brebes 5 9 4 Pati 10 14 15 5 Pemalang 14 14 6 Purworejo 5 10 16 7 Tegal 7 10 8 Temanggung 20 19 20
Central Java
9 Wonosobo 6 10 1 Bantul 13 16 17 2 Kulon Progo 8 8 8
DI Yogyakarta
3 Sleman 16 16 16 1 Bangkalen 17 17 2 Bojonegoro 5 11 3 Bondowoso 7 7 4 Malang 18 18 17 5 Pasuruan 14 15 11 6 Probolinggo 20 19 7 Sampang 6 10 12
East Java
8 Tuban 11 15

42 Appendix 3
Provinces No Districts/Cities 2000/01 2002 2003 2004
1 Bantaeng 3 3 3 2 Bone 7 7 7 3 Sinjai 8 8 8 4 Tana Toraja 9 9 5 Wajo 10 10
South Sulawesi
6 Kota Makassar 12 13 Subtotal 371 424 222 No = number. Source: National Development Planning Agency (BAPPENAS). Batch 3 Provinces No. Districts/Cities 2000/01 2002 2003 2004
1 Banyuwangi 9 7 2 Lamongan 20 22
East Java
3 Situbondo 7 7 1 Lombok Barat 4 4 2 Lombok Tengah 3 3
West Nusa Tenggara
3 Lombok Timur 9 12 Subtotal 52 55
9 79 570 894 677 300 No = number. Source: National Development Planning Agency (BAPPENAS).
Tables A3.4: Distribution of Type A and Type B Subprojects
Table A3.4a: Subsectoral Distribution of Subprojects by Batch and FY
Batches FY WS DRN IRR BRG RD PT MKT SCH SN PR Total Type A subprojects:
1A 2000–2001 267 381 480 538 3,798 81 120 164 11 1 5,841 1B 2002 170 295 430 353 3,186 35 93 162 3 2 4,729 1C 2003 5 33 26 20 284 9 10 16 3 0 406 1D 2004 0 6 3 5 18 0 0 1 0 0 33 2A 2002 180 242 142 274 1,155 34 73 79 22 12 2,213 2B 2003 167 286 179 196 1,671 62 36 136 19 8 2,760 2C 2004 18 59 22 34 303 4 6 18 8 4 476 3A 2003 60 55 39 46 146 21 9 11 10 0 397 3B 2004 38 55 44 36 162 16 6 14 11 0 382
Total 905 1,412 1,365 1,502 10,723 262 353 601 87 27 17,237 Type B subprojects:
1A 2000–2001 40 93 154 69 715 3 38 20 11 0 1,143 1B 2002 34 64 112 17 80 4 45 86 4 2 448 1C 2003 1D 2004 2A 2002 21 33 76 21 321 3 25 87 1 6 594 2B 2003 51 118 133 21 243 7 28 133 7 6 747 2C 2004 3A 2003 5 7 7 0 43 0 3 5 0 0 70 3B 2004 10 6 14 4 34 0 3 3 0 0 74
Total 161 321 496 132 1,436 17 142 334 23 14 3,076 BRG = bridges, DRN = drainage, IRR = irrigation, MKT = markets, PR = piers, PT = public toilets, RD = roads, SCH = school buildings, SN = sanitation, WS = water supply. Source: National Development Planning Agency (BAPPENAS).

Appendix 3 43
Table A3.4b: Sustainability Program: Subprojects Funded by Local Government Budget
(APBD) Batches FY WS DRN IRR BRG RD PT MKT SCH SN PR Total Type A subprojects:
1A 2000–2001 1B 2002 1C 2003 9 59 55 19 704 2 8 16 0 1 873 1D 2004 1 13 0 2 23 0 0 1 0 0 40 2A 2002 2B 2003 2C 2004 31 49 39 48 468 4 7 21 3 2 672 3A 2003 3B 2004
Total 41 121 94 69 1,195 6 15 38 3 3 1,585 Type B subprojects:
1A 2000–2001 1B 2002 1C 2003 0 0 11 2 3 0 0 0 0 0 16 1D 2004 0 0 0 0 0 0 0 0 0 0 0 2A 2002 2B 2003 2C 2004 1 4 14 4 28 1 2 9 0 0 63 3A 2003 3B 2004
Total 1 4 25 6 31 1 2 9 0 0 79 BRG = bridges, DRN = drainage, IRR = irrigation, MKT = markets, PR = piers, PT = public toilets, RD = roads, SCH = school buildings, SN = sanitation, WS = water supply. Source: National Development Planning Agency (BAPPENAS).
Table A3.4c: Subsectoral Distribution of Subprojects by Batches Batches WS DRN IRR BRG RD PT MKT SCH SN PR Total
Type A subprojects: 1 442 715 939 916 7,286 125 223 343 17 3 11,009 2 365 587 343 504 3,129 100 115 233 49 24 5,449 3 98 110 83 82 308 37 15 25 21 0 779
Total 905 1,412 1,365 1,502 10,723 262 353 601 87 27 17,237 % 5.3 8.2 7.9 8.7 62.2 1.5 2.0 3.5 0.5 0.2 100.0
Type B subprojects: 1 74 157 266 86 795 7 83 106 15 2 1,591 2 72 151 209 42 564 10 53 220 8 12 1,341 3 15 13 21 4 77 0 6 8 0 0 144
Total 161 321 496 132 1,436 17 142 334 23 14 3,076 % 5.2 10.4 16.1 4.3 46.7 0.6 4.6 10.9 0.7 0.5 100.0
BRG = bridges, DRN = drainage, IRR = irrigation, MKT = markets, PR = piers, PT = public toilets, RD = roads, SCH = school buildings, SN = sanitation, WS = water supply. Source: National Development Planning Agency (BAPPENAS).

44 Appendix 3
Table A3.4d: Sustainability Program: Subprojects Funded by Local Government Budget
(APBD) Batches WS DRN IRR BRG RD PT MKT SCH SN PR Total
Type A work subprojects: 1 10 72 55 21 727 2 8 17 0 1 913 2 31 49 39 48 468 4 7 21 3 2 672 3
Total 41 121 94 69 1195 6 15 38 3 3 1,585 % 2.6 7.6 5.9 4.4 75.4 0.4 0.9 2.4 0.2 0.2 100.0
Type B subprojects: 1 0 0 11 2 3 0 0 0 0 0 16 2 1 4 14 4 28 1 2 9 0 0 63 3
Total 1 4 25 6 31 1 2 9 0 0 79 % 1.3 5.1 31.6 7.6 39.2 1.3 2.5 11.4 0.0 0.0 100.0
BRG = bridges, DRN = drainage, IRR = irrigation, MKT = markets, PR = piers, PT = public toilets, RD = roads, SCH = school buildings, SN = sanitation, WS = water supply. Source: National Development Planning Agency (BAPPENAS).
Table A3.4e: Total of Subprojects by Batches
Batches WS DRN IRR BRG RD PT MKT SCH SN PR Total Type A subprojects:
1 452 787 994 937 8,013 127 231 360 17 4 11,922 2 396 636 382 552 3,597 104 122 254 52 26 6,121 3 98 110 83 82 308 37 15 25 21 0 779
Total 946 1533 1459 1571 11918 268 368 639 90 30 18,822 % 5.0 8.1 7.8 8.3 63.3 1.4 2.0 3.4 0.5 0.2 100.0
Type B subprojects: 1 74 157 277 88 798 7 83 106 15 2 1,607 2 73 155 223 46 592 11 55 229 8 12 1,404 3 15 13 21 4 77 0 6 8 0 0 144
Total 162 325 521 138 1467 18 144 343 23 14 3,155 % 5.1 10.3 16.5 4.4 46.5 0.6 4.6 10.9 0.7 0.4 100.0
WS = water supply, DRN = drainage, IRR = irrigation, BRG = bridges, RD = roads, PT = public toilets, MKT = markets, SCH = school buildings, SN = sanitation, PR = piers. Source: National Development Planning Agency (BAPPENAS).
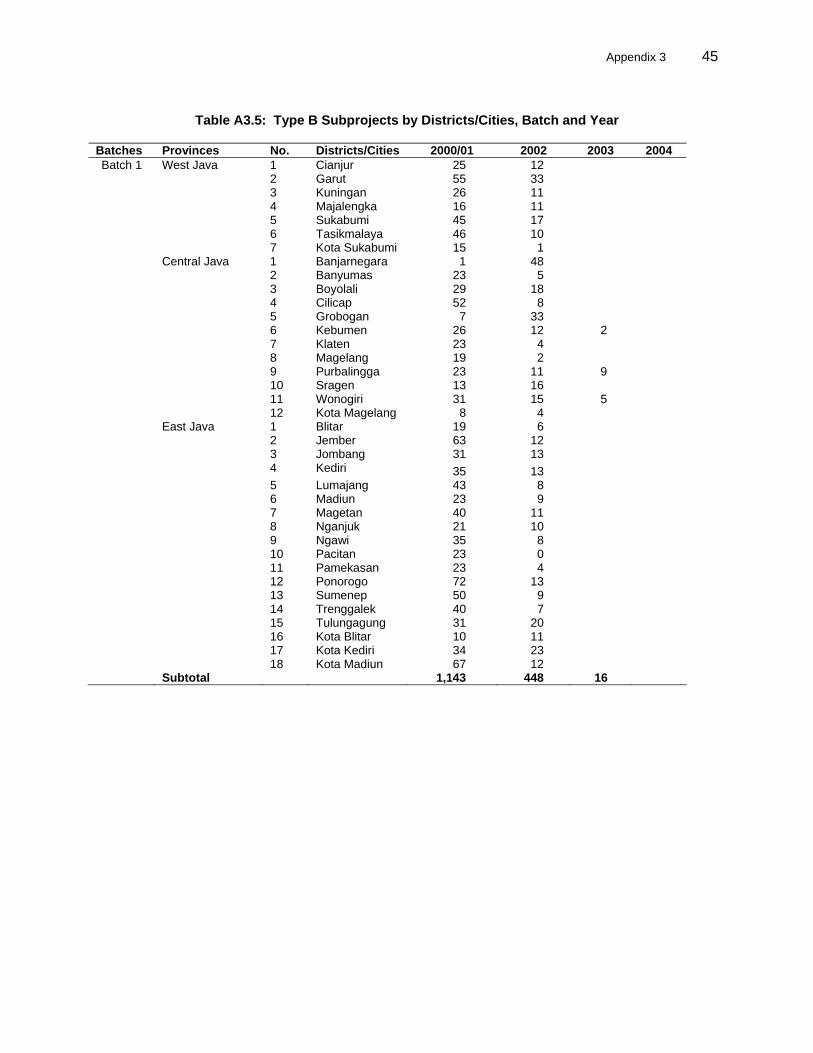
Appendix 3 45
Table A3.5: Type B Subprojects by Districts/Cities, Batch and Year
Batches Provinces No. Districts/Cities 2000/01 2002 2003 2004 Batch 1 West Java 1 Cianjur 25 12
2 Garut 55 33 3 Kuningan 26 11 4 Majalengka 16 11 5 Sukabumi 45 17 6 Tasikmalaya 46 10 7 Kota Sukabumi 15 1 Central Java 1 Banjarnegara 1 48 2 Banyumas 23 5 3 Boyolali 29 18 4 Cilicap 52 8 5 Grobogan 7 33 6 Kebumen 26 12 2 7 Klaten 23 4 8 Magelang 19 2 9 Purbalingga 23 11 9 10 Sragen 13 16 11 Wonogiri 31 15 5 12 Kota Magelang 8 4 East Java 1 Blitar 19 6 2 Jember 63 12 3 Jombang 31 13 4 Kediri 35 13 5 Lumajang 43 8 6 Madiun 23 9 7 Magetan 40 11 8 Nganjuk 21 10 9 Ngawi 35 8 10 Pacitan 23 0 11 Pamekasan 23 4 12 Ponorogo 72 13 13 Sumenep 50 9 14 Trenggalek 40 7 15 Tulungagung 31 20 16 Kota Blitar 10 11 17 Kota Kediri 34 23 18 Kota Madiun 67 12 Subtotal 1,143 448 16
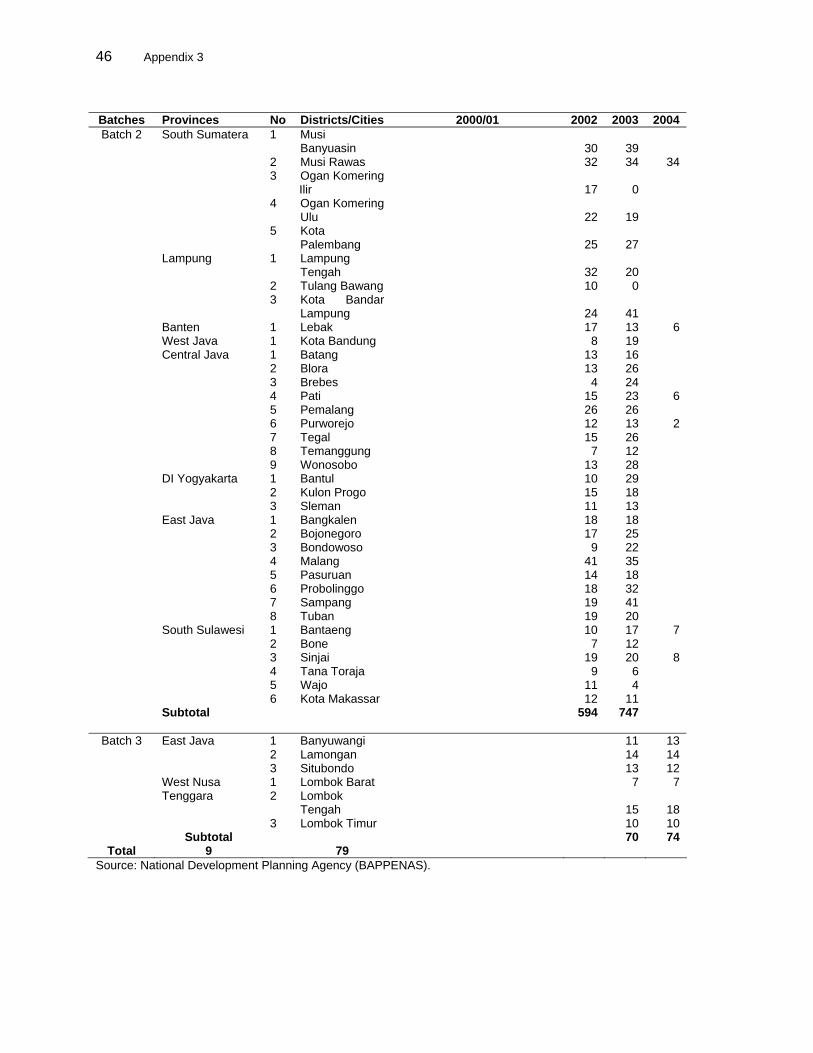
46 Appendix 3
Batches Provinces No Districts/Cities 2000/01 2002 2003 2004 Batch 2 South Sumatera 1 Musi
Banyuasin
30 39
2 Musi Rawas 32 34 34 3 Ogan Komering
Ilir
17 0
4 Ogan Komering Ulu
22 19
5 Kota Palembang
25 27
Lampung 1 Lampung Tengah
32 20
2 Tulang Bawang 10 0 3 Kota Bandar
Lampung
24 41
Banten 1 Lebak 17 13 6 West Java 1 Kota Bandung 8 19 Central Java 1 Batang 13 16 2 Blora 13 26 3 Brebes 4 24 4 Pati 15 23 6 5 Pemalang 26 26 6 Purworejo 12 13 2 7 Tegal 15 26 8 Temanggung 7 12 9 Wonosobo 13 28 DI Yogyakarta 1 Bantul 10 29 2 Kulon Progo 15 18 3 Sleman 11 13 East Java 1 Bangkalen 18 18 2 Bojonegoro 17 25 3 Bondowoso 9 22 4 Malang 41 35 5 Pasuruan 14 18 6 Probolinggo 18 32 7 Sampang 19 41 8 Tuban 19 20 South Sulawesi 1 Bantaeng 10 17 7 2 Bone 7 12 3 Sinjai 19 20 8 4 Tana Toraja 9 6 5 Wajo 11 4 6 Kota Makassar 12 11 Subtotal 594 747
Batch 3 East Java 1 Banyuwangi 11 13 2 Lamongan 14 14 3 Situbondo 13 12 1 Lombok Barat 7 7
West Nusa Tenggara 2 Lombok
Tengah
15 18 3 Lombok Timur 10 10 Subtotal 70 74
Total 9 79 Source: National Development Planning Agency (BAPPENAS).

Appendix 3 47
Figure A3.1: Framework for Implementing Participatory Planning for Construction Of Type A Infrastructure
Village Level
Subdistrict Level
District Level
1. Meeting of Facilitators and Village Government Participants: Facilitator, Village Officials, BPD/LMD, LKMD Activity: Explanation of CLGS and duties of Facilitators. Collection of
Village Monograph Data.
2. Assessment of Village Condition Participant: Facilitator, accompanied by someone who knows the Village
conditions very well. Activity: Collection of preliminary information by head of hamlet
(Dusun/RW), identification of poor. Start identifying Dusun/RW representatives for Core Group
3. Learning and Action Workshop on Participatory Planning, Monitoring, and Evaluation
Participants: Facilitator, Members of Core Group, engineer (at the end of workshop)
Activity: Identification of facilities/infrastructure to be developed/repaired. Identification of facilities/infrastructure proposed to be developed as Type B subprojects. Development plan for type A subprojects, including technical design. Establishment of Implementation, Monitoring & Evaluation, and Operation & Maintenance Teams. Signature of Chairman of the Core Group, Chairman of LKMD, and Village Head on development plan.
Facilitator
4. Collection and Submission of Development Plan
Participant: Field Implementing Coordinator. Activity: Collection of Type A Development Plan and Technical Design
from Village and submission of these plans to District/ Municipality PMU
5. Signing of Contract for Community Project
Participants: District/Municipality PMU and Chairman of BKM/LKMD. Activity: Verification of all requirements that should be met in the
development of Type A facilities and infrastructure by the Project Manager. Project Manager and the Chairman of BKM/LKMD sign the Contract for Community-managed civil works (SP3).
CLGS = community and local government support, LKMD = village resilience board, PMU = project management unit. Source: National Development Planning Agency (BAPPENAS).

48 Appendix 3
Table A3.6: Distribution of Village Facilitators By Batch and FY
No. of Facilitators Batches FY Male Female Total
% Female
Ave. no. of Village/
Facilitators
Ave. no. of Facilitators
1A 2000–2001 717 149 866 17.21 4.2 1.5 1B 2002 608 108 716 15.04 4.2 1.4 C 2003 190 35 225 15.58 4.3 1.1
1D 2004 15 1 16 6.25 3.2 0.7 2A 2002 345 59 404 14.60 3.7 1.1 2B 2003 393 76 469 16.20 3.7 1.1 2C 2004 195 50 245 20.41 3.7 1.1 3A 2003 48 6 54 11.11 3.5 1.0 3B 2004 49 5 54 9.26 3.4 1.0
Total 2,560 489 3,049 16.03 4.0 1.3 By Fiscal Year Provinces
2000–2001 3 717 149 866 17.21 4.2 1.5 2002 7 953 167 1,120 14.88 4.0 1.3 2003 9 631 117 748 15.65 3.9 1.1 2004 8 259 56 315 17.78 3.6 1.1
Total 9 2,560 489 3,049 16.03 4.0 1.3 By Batch
1 3 1,530 293 1,823 16.06 4.2 1.4 2 7 933 185 1,118 16.55 3.7 1.1 3 2 97 11 108 10.19 3.4 1.0
Total 9 2,560 489 3,049 16.03 4.0 1.3 FY = fiscal year. Source: National Development Planning Agency (BAPPENAS).
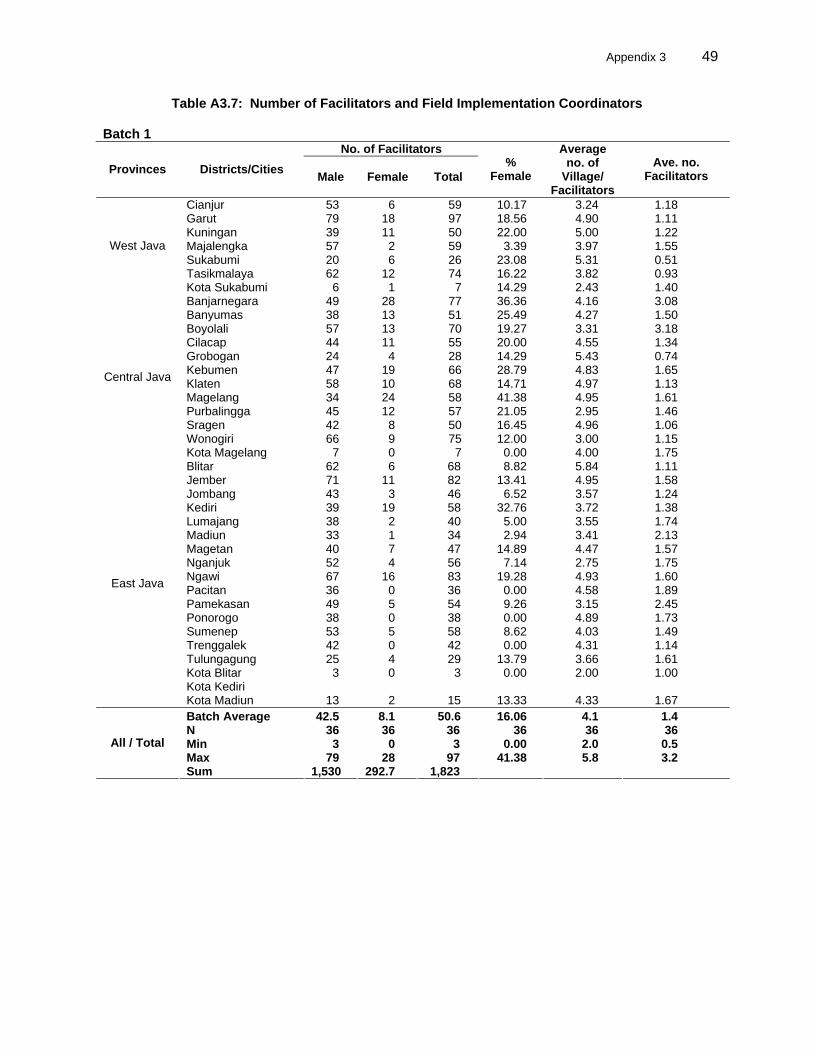
Appendix 3 49
Table A3.7: Number of Facilitators and Field Implementation Coordinators
Batch 1 No. of Facilitators
Provinces Districts/Cities Male Female Total %
Female
Average no. of
Village/ Facilitators
Ave. no. Facilitators
Cianjur 53 6 59 10.17 3.24 1.18 Garut 79 18 97 18.56 4.90 1.11 Kuningan 39 11 50 22.00 5.00 1.22 Majalengka 57 2 59 3.39 3.97 1.55 Sukabumi 20 6 26 23.08 5.31 0.51 Tasikmalaya 62 12 74 16.22 3.82 0.93
West Java
Kota Sukabumi 6 1 7 14.29 2.43 1.40 Banjarnegara 49 28 77 36.36 4.16 3.08 Banyumas 38 13 51 25.49 4.27 1.50 Boyolali 57 13 70 19.27 3.31 3.18 Cilacap 44 11 55 20.00 4.55 1.34 Grobogan 24 4 28 14.29 5.43 0.74 Kebumen 47 19 66 28.79 4.83 1.65 Klaten 58 10 68 14.71 4.97 1.13 Magelang 34 24 58 41.38 4.95 1.61 Purbalingga 45 12 57 21.05 2.95 1.46 Sragen 42 8 50 16.45 4.96 1.06 Wonogiri 66 9 75 12.00 3.00 1.15
Central Java
Kota Magelang 7 0 7 0.00 4.00 1.75 Blitar 62 6 68 8.82 5.84 1.11 Jember 71 11 82 13.41 4.95 1.58 Jombang 43 3 46 6.52 3.57 1.24 Kediri 39 19 58 32.76 3.72 1.38 Lumajang 38 2 40 5.00 3.55 1.74 Madiun 33 1 34 2.94 3.41 2.13 Magetan 40 7 47 14.89 4.47 1.57 Nganjuk 52 4 56 7.14 2.75 1.75 Ngawi 67 16 83 19.28 4.93 1.60 Pacitan 36 0 36 0.00 4.58 1.89 Pamekasan 49 5 54 9.26 3.15 2.45 Ponorogo 38 0 38 0.00 4.89 1.73 Sumenep 53 5 58 8.62 4.03 1.49 Trenggalek 42 0 42 0.00 4.31 1.14 Tulungagung 25 4 29 13.79 3.66 1.61 Kota Blitar 3 0 3 0.00 2.00 1.00 Kota Kediri
East Java
Kota Madiun 13 2 15 13.33 4.33 1.67 Batch Average 42.5 8.1 50.6 16.06 4.1 1.4 N 36 36 36 36 36 36 Min 3 0 3 0.00 2.0 0.5 Max 79 28 97 41.38 5.8 3.2
All / Total
Sum 1,530 292.7 1,823

50 Appendix 3
Batch 2
No. of Facilitators Provinces Districts/ Cities Male Female Total
% Female
Average no. of
Villages/ Facilitators
Ave. no. Facilitators
Musi Banyuasin 18 0 18 0.00 4.67 0.90 Musi Rawas 27 15 42 35.71 3.02 1.11 Ogan Komering Ilir 20 0 20 0.00 4.60 1.05 Ogan Komering Ulu 19 1 20 5.00 4.50 0.43
South Sumatera
Kota Palembang 12 5 17 29.41 4.06 0.53 Lampung Tengah 35 6 41 14.63 2.95 1.28 Tulang Bawang 14 5 19 26.32 3.47 1.90 Lampung Kota B. Lampung 4 0 4 0.00 3.50 1.33
Banten Lebak 43 7 50 14.00 4.12 1.92 West Java Kota Bandung 12 4 16 25.00 5.00 0.36
Batang 21 7 28 25.00 3.18 0.78 Blora 24 2 26 7.69 4.62 1.18 Brebes 25 1 26 3.85 4.08 1.86 Pati 33 12 45 26.67 4.11 1.13 Pemalang 24 6 30 20.00 3.00 1.07 Purworejo 43 3 46 6.52 3.54 1.48 Tegal 18 2 20 10.00 3.30 1.18 Temanggung 28 6 34 17.65 3.53 0.58
Central Java
Wonosobo 20 1 21 4.76 4.19 1.31 Bantul 28 3 31 9.68 4.00 0.67 Kulon Progo 38 4 42 9.52 3.21 1.75 DI
Yogyakarta Sleman 28 24 52 46.15 3.12 1.08 Bangkalan 25 0 25 0.00 4.04 0.74 Bojonegoro 27 0 27 0.00 4.04 1.69 Bondowoso 18 2 20 10.00 3.00 1.43 Malang 115 11 126 8.73 4.16 2.38 Pasuruan 17 8 25 32.00 3.72 0.63 Probolinggo 22 7 29 24.14 3.14 0.74 Sampang 52 16 68 23.53 3.76 2.43
East Java
Tuban 18 7 25 28.00 3.48 0.96 Bantaeng 22 1 23 4.35 3.91 2.56 Bone 18 3 21 14.29 3.43 1.00 Sinjai 29 3 32 9.38 3.31 1.33 Tana Toraja 16 4 20 20.00 2.30 1.11 Wajo 16 4 20 20.00 3.75 1.00
South Sulawesi
Kota Makasar 12 0 12 0.00 4.67 0.48 Batch Average 26.1 5.0 31.1 16.06 3.7 1.2 N 36 36 36 36 36 36 Min 4 0 4 0.00 2.3 0.4 Max 115 24 126 46.15 5.0 2.6
All / Total
Sum 941 180 1,121 Batch 3
No. of Facilitators Provinces Districts/ Cities Male Female Total
% Female
Average no. of Villages / Facilitators
Ave. no. Facilitators
Banyuwangi 14 4 18 22.22 4.00 1.00 Lamongan 22 4 26 15.38 4.15 0.65 East Java Situbondo 16 0 16 0.00 3.25 1.14 Lombok Barat 12 4 16 25.00 3.00 2.00 Lombok Tengah 16 0 16 0.00 3.25 2.67 NTB Lombok Timur 16 0 16 0.00 2.88 0.89 Batch Average 16.0 2.0 18.0 11.11 3.4 1.4 N 6 6 6 6 6 6 Min 12 0 16 0.00 2.9 0.7 Max 22 4 26 25.00 4.2 2.7
All/Total
Sum 96 12 108
NTB = Nusa Tenggara Barat. Source: National Development Planning Agency (BAPPENAS).
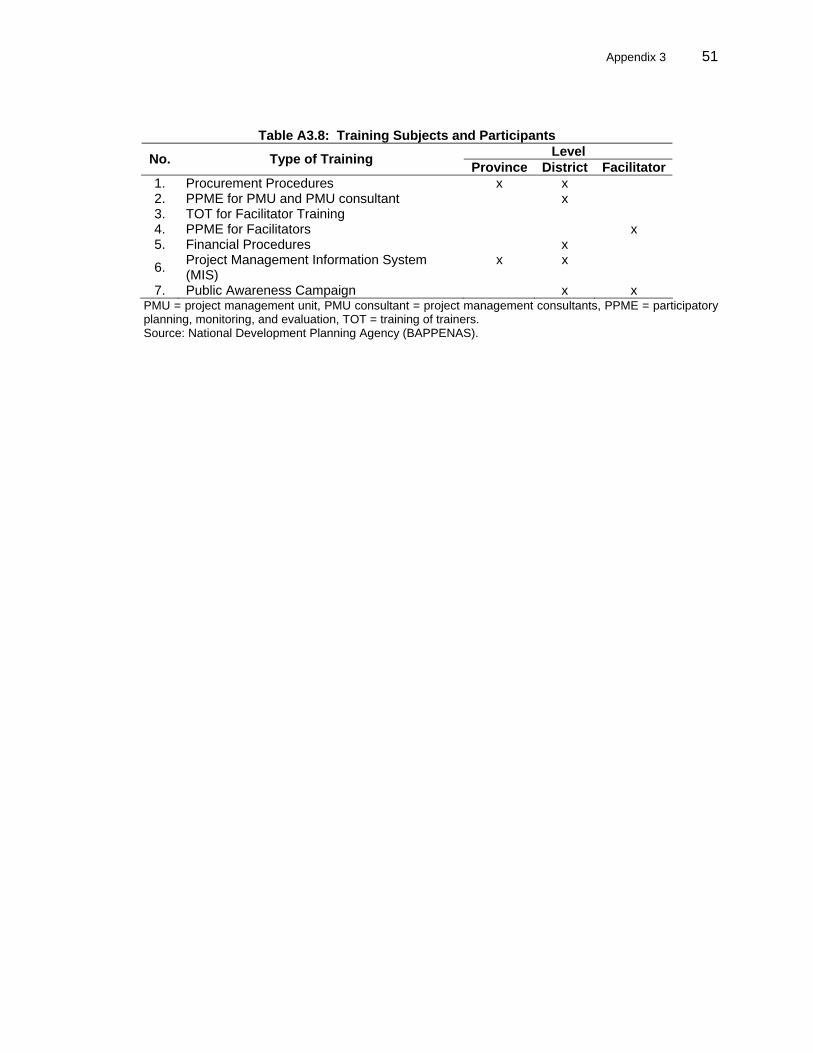
Appendix 3 51
Table A3.8: Training Subjects and Participants Level No. Type of Training Province District Facilitator
1. Procurement Procedures x x 2. PPME for PMU and PMU consultant x 3. TOT for Facilitator Training 4. PPME for Facilitators x 5. Financial Procedures x
6. Project Management Information System (MIS)
x x
7. Public Awareness Campaign x x PMU = project management unit, PMU consultant = project management consultants, PPME = participatory planning, monitoring, and evaluation, TOT = training of trainers. Source: National Development Planning Agency (BAPPENAS).

52 Appendix 3
Table A3.9: Training Activities and Participants
CDS = community development specialist, KMD = project management unit consultant, MIS = management information system, PMC = project management consultant, PMO = project management office, PMU = project management unit, PPME = participatory planning, monitoring, and evaluation. Source: National Development Planning Agency (BAPPENAS).
Training Subjects Trainees Number of Persons Trained
Implementation Date Trainers
Batch 1 Procurement of Consultants and Facilitators District Project Management Unit staff 184 October 2000 PMC staff PPME, Administration, Procurement Type B and A projects, MIS
District Project Management Unit staff, District Project Management Consultants 300 June—July 2001 PMC staff, TA staff
Training of Trainers for Facilitator Training External Trainers 30 August 2001 PMC staff, TA staff Training of Facilitators Facilitators 856 August—September 2001 External Trainers
Batch 2
PPME, Procurement, Financial Administration District Coordinating Committee & District Project Management Unit staff 202 July 2002 PMC staff
PPME, Procurement, Financial Administration, MIS District Project Management Consultants 108 October 2002 PMC staff
Training of Trainers for Facilitator Training External Trainers, Batch 2 PMU consultant staff (CDS) 50 October 2002 PMC staff
Training of Facilitators Facilitators 385 October—November 2002 External Trainers, Batch 2 PMU consultant staff (CDS)
Batch 3 Procurement of Consultants and Facilitators District Project Management Unit staff 18 May 2003 PMO staff PPME, Administration, Procurement Type B & A projects, MIS
District Project Management Unit staff, District Project Management Consultants 30 August 2003 PMC staff
Training of Trainers for Facilitator Training External Trainers 2 August 2003 PMC staff, PMO staff
Training of Facilitators & CDS Facilitators, CDS 79 September 2003 PMC staff, External Trainers

Appendix 3 53
Table A3.10: Number of Participants in Village-level PPME Workshops No. of participants No. of team members
Batches FY Male Female Total %
Femalea Imple-menting O&M M&E
Duration (days)
1A 2000-2001 70,546 13,760 84,306 16.32 22,012 14,739 14,848 2.9 1B 2002 58,041 10,689 68,729 15.55 17,340 11,419 10,946 2.6 1C 2003 16,042 2,853 18,895 15.10 5,084 3,321 3,175 2.5 1D 2004 604 75 679 11.03 168 148 158 2.0 2A 2002 20,739 4,188 24,927 16.80 8,305 5,810 5,513 3.9 2B 2003 22,394 3,913 26,307 14.88 8,470 6,456 6,266 3.9 2C 2004 12,514 2,437 14,950 16.30 4,245 3,201 3,025 3.9 3A 2003 2,328 479 2,808 17.08 1,011 803 821 3.4 3B 2004 2,096 347 2,443 14.20 918 735 706 3.2 Total/Average 205,303 38,742 244,045 15.88 67,554 46,633 45,459 3.2
Batches Villages 1 7,700 145,232 27,377 172,609 15.86 44,604 29,628 29,127 2.8 2 4,134 55,646 10,539 66,185 15.92 21,021 15,467 14,804 3.9 3 372 4,425 827 5,251 15.74 1,929 1,538 1,527 3.3
Total 12,206 205,303 38,742 244,045 15.88 67,554 46,633 45,459 3.2 Average no. of participants/village Average no. of team members/village Batches Male Female Total Implementing O&M M&E
1 18.9 3.6 22.4 5.8 3.8 3.8 2 13.5 2.5 16.0 5.1 3.7 3.6 3 11.9 2.2 14.1 5.2 4.1 4.1
Total 16.8 3.2 20.0 5.5 3.8 3.7 FY = fiscal year, M&E = monitoring and evaluation, O&M = operation and maintenance, PPME = participatory planning, monitoring and evaluation. a Below threshold level of 20% women participation rate Source: National Development Planning Agency (BAPPENAS).
Table A3.11: Implementation of Public Hearings
Yes No/ No data Total Percent Batches FY
(districts) (districts) (districts) Yes No Note
1A 2000–2001 17 20 37 45.95 54.05 1B 2002 24 13 37 64.86 35.14 1C 2003 1 2 3 33.33 66.67 No Type B in 13 districts 1D 2004 0 0 0 No Type B in 2 districts 2A 2002 15 21 36 41.67 58.33 2B 2003 15 21 36 41.67 58.33 2C 2004 3 2 5 60.00 40.00 No Type B in 13 districts 3A 2003 5 1 6 83.33 16.67 3B 2004 3 3 6 50.00 50.00
Total 83 83 166 50.00 50.00
Summary of Public Hearings Batch Yes No districts % Yes % No
1 42 35 77 54.55 45.45 2 33 44 77 42.86 57.14 3 8 4 12 66.67 33.33
Total 83 83 166 50.00 50.00 Source: National Development Planning Agency (BAPPENAS).

54 Appendix 3
Table A3.12: Number of Beneficiaries (1,000 prs) Type of Beneficiaries Location of
Beneficiaries Batches FY Poor Women Student Others Inside
Village Outside Village
Totala
1A 2000-2001 2,419 2,860 1,042 1,808 8,130 1,342 9,472 1B 2002 2,616 1,942 768 1,244 6,570 1,077 7,647 1C 2003 389 708 358 454 1,909 993 2,902 1D 2004 30 22 9 11 73 17 90 2A 2002 1,070 1,646 539 588 3,843 389 4,232 2B 2003 1,150 1,842 679 577 4,247 505 4,752 2C 2004 456 344 272 179 1,251 277 1,528 3A 2003 182 222 36 68 507 65 572 3B 2004 209 331 203 67 811 101 912
Total 8,521 9,918 3,906 4,996 27,342 4,766 32,108 Batch
1 5,455 5,532 2,178 3,518 16,682 3,429 20,111 2 2,676 3,833 1,490 1,344 9,342 1,171 10,513 3 391 553 239 135 1,318 166 1,484
Total 8,521 9,918 3,906 4,996 27,342 4,766 32,108 Fiscal Year 2000–2001 2,419 2,860 1,042 1,808 8,130 1,342 9,472
2002 3,686 3,589 1,307 1,832 10,414 1,466 11,879 2003 1,720 2,771 1,073 1,099 6,663 1,563 8,227 2004 696 698 484 257 2,135 395 2,530 Total 8,521 9,918 3,906 4,996 27,342 4,766 32,108
FY = fiscal year. a Exceeding RRP threshold of 15 million beneficiaries Source: National Development Planning Agency (BAPPENAS).
Table A3.13: Estimated Labor Type A Subproject
Batches FY Estimated
Person-days (1,000)
Estimated Employment (1,000 pers.)
% Male % Femalea
1A 2000-2001 3,565 139 92.09 7.91 1B 2002 2,115 94 92.09 7.91 1C 2003 472 22 94.41 5.59 1D 2004 46 2 94.87 5.13 2A 2002 1,190 49 92.09 7.91 2B 2003 2,659 90 95.35 4.65 2C 2004 829 38 93.48 6.52 3A 2003 334 11 73.79 26.21 3B 2004 372 13 79.46 20.54
Total 11,581 458 92.09 7.91 Batch
1 6,198 257 92.55 7.45 2 4,678 176 93.67 6.33 3 706 25 76.63 23.37
Total 11,581 458 92.09 7.91 FY = fiscal year. a Only Batch 3 met RRP threshold level of 20% women participation rate. Source: National Development Planning Agency (BAPPENAS).

Appendix 3 55
Table A3.14: Spending by Cost Components (% of Total) Spending on Type A Subprojects (%) Spending on Type B Subprojects (%) Batches Material Equip Labor Misc. Total Material Equip Labor Misc. Total
1A 63.38 3.84 27.60 5.17 100 73.64 6.33 13.53 6.50 100 1B 69.28 3.56 24.31 2.86 100 65.29 3.99 24.92 5.80 100 1C 71.19 4.75 20.97 3.10 100 61.34 6.20 26.79 5.68 100 1D 68.30 2.15 25.93 3.62 100 2A 70.77 4.33 23.42 1.48 100 78.21 6.69 12.67 2.42 100 2B 69.03 5.13 23.71 2.16 100 71.20 4.26 21.97 2.57 100 2C 68.31 5.33 25.72 0.64 100 74.70 5.48 17.32 2.50 100 3A 64.11 4.26 29.64 1.98 100 66.27 5.23 24.38 4.12 100 3B 58.56 8.22 32.27 0.95 100 70.82 5.40 19.31 4.47 100 1 67.22 3.85 25.09 3.85 100 68.02 5.34 20.57 6.07 100 2 69.58 4.85 24.00 1.58 100 74.70 5.48 17.32 2.50 100 3 61.33 6.24 30.95 1.47 100 68.55 5.31 21.85 4.30 100
Total 67.95 4.46 24.94 2.65 100 71.15 5.40 19.14 4.30 100 Note: Spending on Labor for type A subprojects fell within RRP threshold range of 20-30% of total cost. Source: National Development Planning Agency (BAPPENAS).
Table A3.15: Allocation of Investments by Local Government and Subsectors
Batches FY WS DRN IRR BRG RD PT MKT SCH SN PR Total Investments for Type A Subprojects by Subsector (Rp billion)
1A 2000-2001 2.7 3.4 4.1 4.7 37.0 0.5 1.1 1.4 0.1 0.0 55.0 1B 2002 1.7 3.0 4.3 3.5 34.1 0.3 0.9 1.5 0.0 0.0 49.4 1C 2003 0.3 1.4 2.1 1.5 24.4 0.2 0.6 0.8 0.1 0.0 31.7 1D 2004 0.0 0.4 0.0 0.2 1.0 0.0 0.0 0.0 0.0 0.0 1.7 2A 2002 1.6 2.8 1.1 3.7 11.7 0.6 0.5 0.7 0.1 0.1 22.9 2B 2003 1.6 2.8 1.8 1.9 19.9 0.5 0.4 1.4 0.2 0.1 30.7 2C 2004 1.1 2.4 1.4 1.8 19.2 0.1 0.4 1.1 0.2 0.1 27.8 3A 2003 0.5 0.4 0.3 0.3 1.4 0.2 0.1 0.1 0.1 0.0 3.3 3B 2004 0.3 0.5 0.4 0.3 1.5 0.1 0.1 0.1 0.0 0.0 3.3
Batch 1 4.8 8.2 10.5 9.9 96.5 1.1 2.6 3.7 0.2 0.1 137.9 Batch 2 4.4 8.1 4.3 7.4 50.8 1.3 1.2 3.1 0.5 0.3 81.4 Batch 3 0.7 0.9 0.7 0.6 2.9 0.3 0.1 0.2 0.1 0.0 6.5 Total 9.8 17.2 15.5 17.9 150.2 2.6 4.0 7.0 0.9 0.4 225.8
Investment Fund for Type B Facilities by Subsector (Rp billion) 1A 2000-2001 4.5 6.6 13.3 6.6 73.0 0.1 4.6 1.4 1.0 0.0 111.2 1B 2002 1.8 4.1 6.4 1.1 4.0 0.2 3.2 3.7 0.3 0.1 25.1 1C 2003 0.0 0.0 3.7 0.6 0.8 0.0 0.0 0.0 0.0 0.0 5.2 1D 2004 2A 2002 1.0 2.3 2.8 1.0 30.1 0.1 0.9 16.6 0.0 0.2 55.0 2B 2003 5.2 12.0 14.1 1.7 26.1 0.4 2.9 10.6 0.5 0.6 74.0 2C 2004 0.1 0.4 1.0 0.5 3.2 0.0 0.1 0.7 0.0 0.0 6.1 3A 2003 0.6 0.7 0.8 0.0 5.2 0.0 0.3 0.4 0.0 0.0 8.1 3B 2004 1.2 0.7 1.8 0.3 2.7 0.0 0.3 0.4 0.0 0.0 7.2
Batch 1 6.3 10.7 23.5 8.3 77.9 0.4 7.9 5.2 1.3 0.1 141.5 Batch 2 6.4 14.6 17.9 3.1 59.5 0.5 3.8 27.9 0.5 0.8 135.1 Batch 3 1.8 1.4 2.6 0.3 7.9 0.0 0.6 0.8 0.0 0.0 15.3 Total 14.5 26.8 44.0 11.7 145.2 0.9 12.3 33.8 1.8 0.9 291.8
WS = water supply, DRN = drainage, IRR = irrigation, BRG = bridges, RD = roads, PT = public toilets; MKT = markets, SCH = school buildings, SN = sanitation, PR = piers. Source: National Development Planning Agency (BAPPENAS).

56 Appendix 3
Table A3.16: Block Grant to Villages and Districts Block Grant per Village
(Rp million) Block Grant per Contractor
(Rp million) Batches FY Min Max Ave Min Max Ave
1A 2000-01 15.1 62.9 45.4 13.0 412.0 191.0 1B 2002 9.4 82.5 53.4 25.3 385.2 122.3 2A 2002 15.1 75.0 47.6 30.2 393.8 182.4 1C 2003 15.9 82.5 37.0 2B 2003 25.2 79.1 58.5 30.0 390.0 175.5 3A 2003 46.1 77.8 51.2 57.7 371.0 220.9 1D 2004 23.2 39.5 37.9 2C 2004 15.8 77.8 35.1 3B 2004 26.0 77.8 55.3 73.0 411.0 202.2
Total 9.4 82.5 49.5 13.0 412.0 175.9 Source: National Development Planning Agency (BAPPENAS).
Table A3.17: Community Contributions In kind
Batches FY Cash (Rp m)
Labors (1,000 pers.
days)
In kind(Rp m) No. of
distr. %
districts
Partici-pating
districts
Total Contribution
(Rp b) 1A 2000-2001 7,597 209 4,108 7 20.59 34 15.89 1B 2002 9,491 260 2,519 9 25.00 36 17.21 1C 2003 5,840 95 1,307 3 18.75 16 9.05 1D 2004 1 30 0 2 100.00 2 0.60 2A 2002 970 184 449 5 13.89 36 5.10 2B 2003 7,702 184 8,510 10 27.78 36 19.89 2C 2004 963 73 994 6 33.33 18 3.42 3A 2003 301 2 100 2 33.33 6 0.45 3B 2004 701 20 0 2 33.33 6 1.10
Total 33,568 1,058 17,987 46 24.21 190
In kind Batches Cash
(Rp m)
Labor (1,000 pers days)
In kind (Rp m) No. of
distr. %
districts
Particip.districts
Total Contrib. (Rp b)
Total Type A funded by Govt (Rp b)
% Contrib.
1 22,930 595 7,934 21 23.86 88 43 393 10.88 2 9,635 441 9,953 21 23.33 90 28 224 12.65 3 1,002 22 100 4 33.33 12 2 20 7.88
Total 33,568 1,058 17,987 46 24.21 190 73 637 11.41 FY = fiscal year Source: National Development Planning Agency (BAPPENAS).

Appendix 4 57
REVISIONS IN LOAN ALLOCATIONS
1. The amount of the Asian Development Bank (ADB) project loan was reduced by $33.5 million on 25 June 2002. From the original amount of $200.0 million, the final amount became $86.4 million. The partial cancellation was due to loan savings resulting from a reduction in the number of participating districts, which in turn was due to ineligibility per investment project guidelines and limited counterpart fund availability. 2. The investment project area was expanded with the addition of 42 districts, including 6 districts1 affected by the Bali Bombing in October 2002, in addition to the 37 districts in Batch 1. A reallocation of funds was made to provide sufficient funding for the project management office (PMO) and project management unit (PMU) consultants and facilitators, and to undertake public awareness campaign activities for the investment project (see Table A3.1).
Table A4.1: Loan Allocation
($ million)
Last Net Original Revised Amount Amount Amount UndisbursedCategory Allocation Allocation Cancelled Available Disbursed Balance 1 Block Grants 94.3 68.2 26.1 68.2 67.2 1.0
1A Type A 54.3 39.5 14.8 39.5 38.9 0.6 1B Type B 40.0 28.7 11.3 28.7 28.3 0.4
2 Capacity Building 16.0 17.2 (1.2) 17.2 16.1 1.1
2A PMO Consultants 3.3 6.2 (2.9) 6.2 5.4 0.8
2B PMU Consultants 4.5 5.7 (1.2) 5.7 5.6 0.2
2C Facilitators 8.2 5.2 3.0 5.2 5.1 0.1 3 Unallocated 9.7 1.0 8.7 1.0 0.0 1.0
Total 120.0 86.4 33.6 86.4 83.3 3.1 PMO = project management office, PMU = project management unit. Source: National Development Planning Agency (BAPPENAS).
1 Neighboring districts in East Java and Nusa Tenggara Barat (NTB).

58 A
ppendix 5 INVESTMENT PROJECT COST BY COMPONENT
($ million)
Appraisal Actual ADB GOI ADB GOI
Component Foreign
Exchange Local
Currency Total Cost
Local Currency
Total Cost
Foreign Exchange
Local Currency
Total Cost
Local Currency
Total Cost
1. Block Grant to Districts A. Village subprojects 19.8 37.1 56.9 28.6 85.5 13.5 25.4 38.9 25.2 64.1 B. District Subprojects 42.8 2.7 45.5 40.5 86.0 26.6 1.7 28.3 32.4 60.7 Subtotal (A) 62.6 39.8 102.4 69.1 171.5 40.1 27.1 67.2 57.6 124.8 2. Project Management/ Capacity Building
A. Central Consultants 1.9 1.6 3.5 0.2 3.7 3.0 2.4 5.4 0.0 5.4 B. District Consultants 0.0 5.4 5.4 0.1 5.5 0.0 5.6 5.6 0.0 5.6 C. Facilitators 0.0 8.7 8.7 0.1 8.8 0.0 5.1 5.1 0.0 5.1 Subtotal (B) 1.9 15.7 17.6 0.4 18.0 3.0 13.1 16.1 0 16.1
3. Project Management Costs 2.8 2.8
4. Interest During
Construction 0.0 0.0 0.0 10.5 10.5 0.0 0.0 0.0 0.0 0.0 Total 64.5 55.5 120.0 80.0 200.0 43.1 40.2 83.3 60.4 143.7 ADB = Asian Development Bank, GOI = Government of Indonesia. Source: National Development Planning Agency (BAPPENAS).
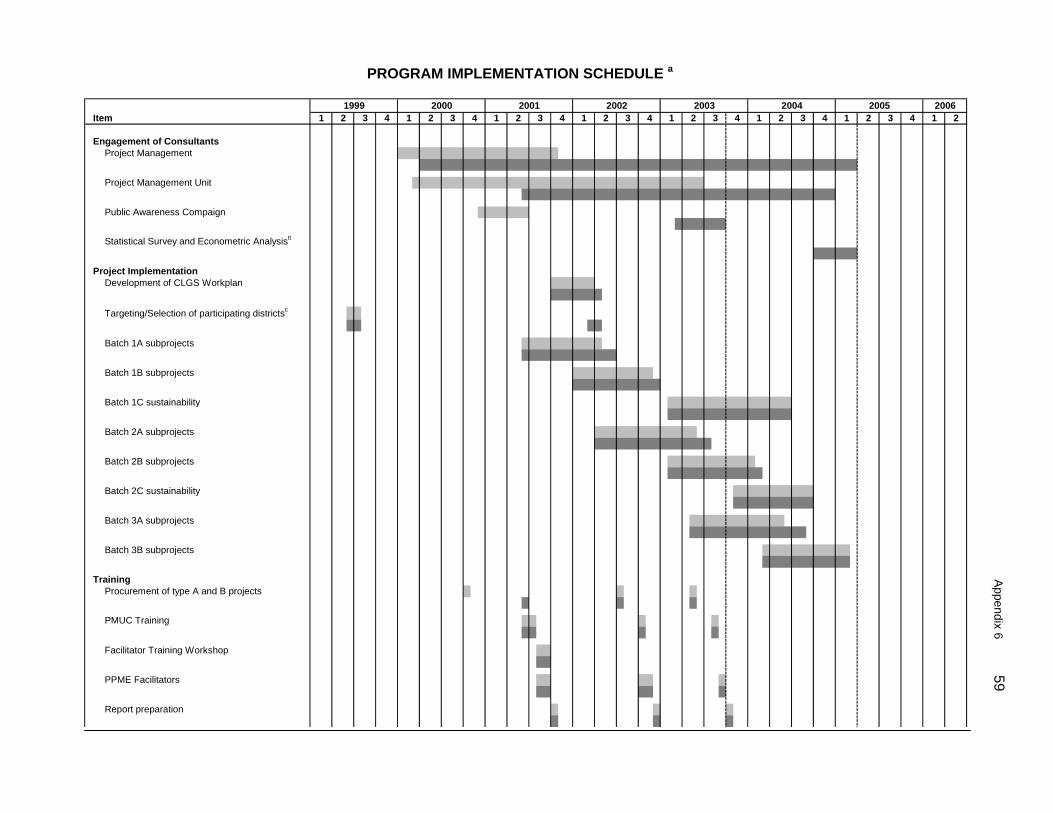
Appendix 6 59
PROGRAM IMPLEMENTATION SCHEDULE a
Engagement of ConsultantsProject Management
Project Management Unit
Public Awareness Compaign
Statistical Survey and Econometric Analysisb
Project ImplementationDevelopment of CLGS Workplan
Targeting/Selection of participating districtsc
Batch 1A subprojects
Batch 1B subprojects
Batch 1C sustainability
Batch 2A subprojects
Batch 2B subprojects
Batch 2C sustainability
Batch 3A subprojects
Batch 3B subprojects
TrainingProcurement of type A and B projects
PMUC Training
Facilitator Training Workshop
PPME Facilitators
Report preparation
Item1999 2001
41 2 31 2 3 42000
1 2 3 4 3 41 2 32004
1 2 3 42003
1 2 4 1 22005 2006
1 2 32002
4

60 Appendix 6
Public Awareness Campaign
Participatory Planning, Monitoring and EvaluationPPME field trips
Establish reporting system
Conduct of PPME Workshops
Project ReviewMid-term
Completion
Tranche Releases (Program Loan)1st Tranche
2nd Tranche
3rd Tranche
a The Project implementation schedule was developed during implementation of the accompanying TA 3179-INO: Capacity Building for Participatory Planing and Monitoring and Evaluation.The Program Loan was extended twice, initially by 12 months from the original loan closing date of 30 September 2000 to 30 September 2001; secondly by 3 months, or up to 31 December 2001.The Project Loan was extended by 18 months, from the original loan closing date of 30 September 2003 to 31 March 2005.
b The engagement of SSEA Consultants was not planned during project preparation, but was deemed necessary (ref. para. 38 of the main PCR report).c Selection of Batch 2 districts were made in April 2002 (ref. Appendix 3 of the PCR Report) .
actual implementation periodoriginal estimate
220062005
144 1 24 1 32 31 342 2 3 24 1
CLGS=Community and Local Government Support Project, PMUC=project management unit consultants, PPME=participatory planning, monitoring and evaluation, SSEA=statistical survey and econometric analysis.
2 3 34 1 220042001 2002 2003
3 4 11999 2000
1Item

Appendix 7 61
PROGRAM AND PROJECT STRUCTURES
Figure A7.1: Program Management Structure
Project loan
Program loan
BAPPENAS
ADB
Provinces
Districts (Kabupaten/Kota)
Subdistricts
Committee
Ministry of Finance
fund flow Type B subprojects
Type A subprojects
consultation
consultation
consultation
consultation
ADB = Asian Development Bank, BAPPENAS = National Planning Development Agency.
Source: National Development Planning Agency (BAPPENAS).

62 Appendix 7
Figure A7.2: Investment Project Management Structure
Central Level
Steering Committee
Technical Team
Project Management Office (PMO)
Project Management Consultant (PMC)
Province
Provincial Coordination Team
District / City
District Coordination Team
Project Management Unit Consultant
Project Implementation Unit
Subdistrict
CAMAT & Aparat
Field Implementation Coordinator
Facilitator
Community
Village Council
Village Head
Core Team
Village Resilience Board (LKMD)
Source: BAPPENAS
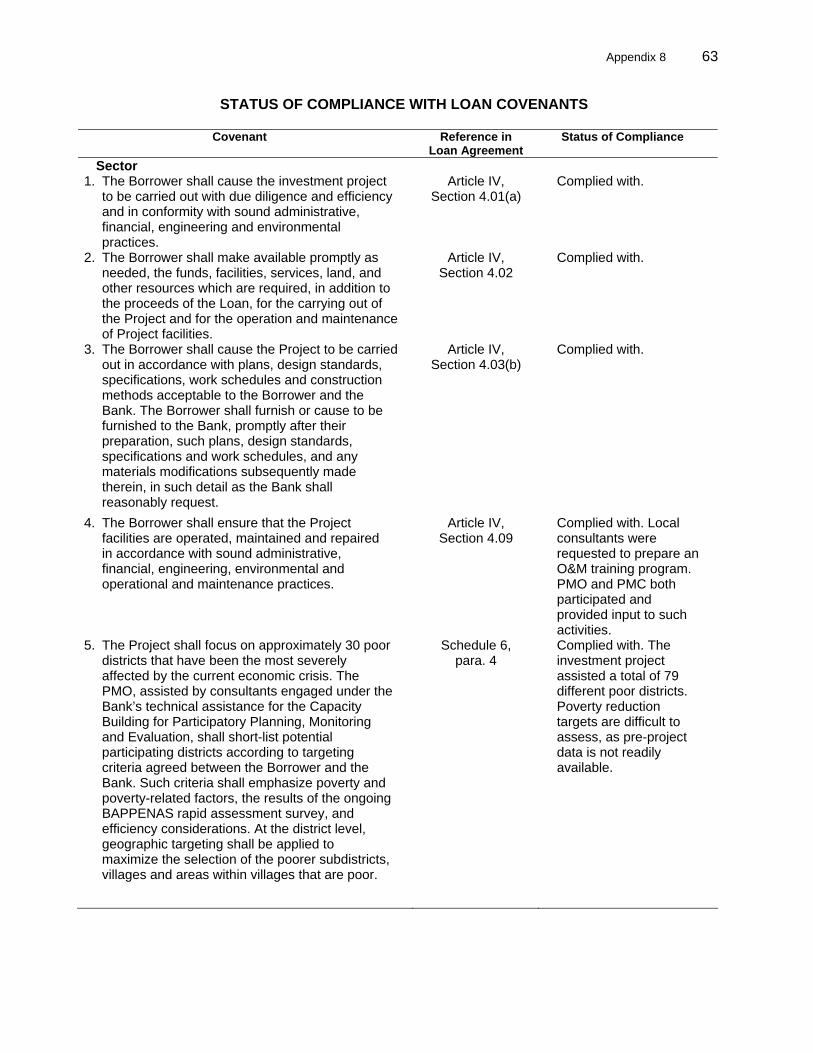
Appendix 8 63
STATUS OF COMPLIANCE WITH LOAN COVENANTS
Covenant Reference in Loan Agreement
Status of Compliance
Sector 1. The Borrower shall cause the investment project
to be carried out with due diligence and efficiency and in conformity with sound administrative, financial, engineering and environmental practices.
Article IV, Section 4.01(a)
Complied with.
2. The Borrower shall make available promptly as needed, the funds, facilities, services, land, and other resources which are required, in addition to the proceeds of the Loan, for the carrying out of the Project and for the operation and maintenance of Project facilities.
Article IV, Section 4.02
Complied with.
3. The Borrower shall cause the Project to be carried out in accordance with plans, design standards, specifications, work schedules and construction methods acceptable to the Borrower and the Bank. The Borrower shall furnish or cause to be furnished to the Bank, promptly after their preparation, such plans, design standards, specifications and work schedules, and any materials modifications subsequently made therein, in such detail as the Bank shall reasonably request.
Article IV, Section 4.03(b)
Complied with.
4. The Borrower shall ensure that the Project facilities are operated, maintained and repaired in accordance with sound administrative, financial, engineering, environmental and operational and maintenance practices.
Article IV, Section 4.09
Complied with. Local consultants were requested to prepare an O&M training program. PMO and PMC both participated and provided input to such activities.
5. The Project shall focus on approximately 30 poor districts that have been the most severely affected by the current economic crisis. The PMO, assisted by consultants engaged under the Bank’s technical assistance for the Capacity Building for Participatory Planning, Monitoring and Evaluation, shall short-list potential participating districts according to targeting criteria agreed between the Borrower and the Bank. Such criteria shall emphasize poverty and poverty-related factors, the results of the ongoing BAPPENAS rapid assessment survey, and efficiency considerations. At the district level, geographic targeting shall be applied to maximize the selection of the poorer subdistricts, villages and areas within villages that are poor.
Schedule 6, para. 4
Complied with. The investment project assisted a total of 79 different poor districts. Poverty reduction targets are difficult to assess, as pre-project data is not readily available.

64 Appendix 8
Covenant Reference in
Loan Agreement Status of Compliance
6. The PMO shall visit each district on the short list and conduct public meetings and workshops with representative from the districts, subdistricts, villages and civil society groups and organizations to explain the Project and the conditions and requirements for participating in detail. The main participation criteria include (i) inadequate existing level of public infrastructure, (ii) commitment to a fully participatory approach, transparency and good governance, (iii) willingness to aim the infrastructure works at the poor areas, establish permanent participatory mechanisms, including the subdistrict and district community forums, and (iv) agreement to finance the participatory and transparency approaches from the block grants. The PMO shall consider applications to participate in the Project until the funds budgeted are exhausted or until 31 December 2000, whichever is earlier.
Schedule 6, para. 5
Complied with.
7. While it is preferable that all subdistricts within a selected district participate in the Project to maximize efficiency and the impact of the participatory and transparency approaches, certain subdistricts may be excluded if they fail to satisfy the participation criteria. However, every village in a participating subdistrict would participate unless there were compelling reasons related to lack of commitment to the participatory approach or direct overlap with similar works financed by other donors.
Schedule 6, para. 6
Complied with.
8. It is preferable that all participating districts, subdistricts and villages participate in the Project for three years. No district, subdistrict or village shall be permitted to participate for less than two years.
Schedule 6, para. 7
Complied with.
9. The PMO shall determine which district, subdistrict and village satisfy the participation criteria and considerations described in paragraphs 5, 6 and 7 above. Each selected district shall sign an agreement with PMO stating that the district will follow the conditions and procedures of the Project, and agreeing to ensure that the selected subdistricts and villages within its jurisdiction abide by the participation criteria. The selected district shall also advise those subdistricts and villages which are not selected promptly about the reasons for their exclusion. The PMO shall retain all the signed agreements and make them available to the Bank as requested.
Schedule 6, para. 8
Complied with.
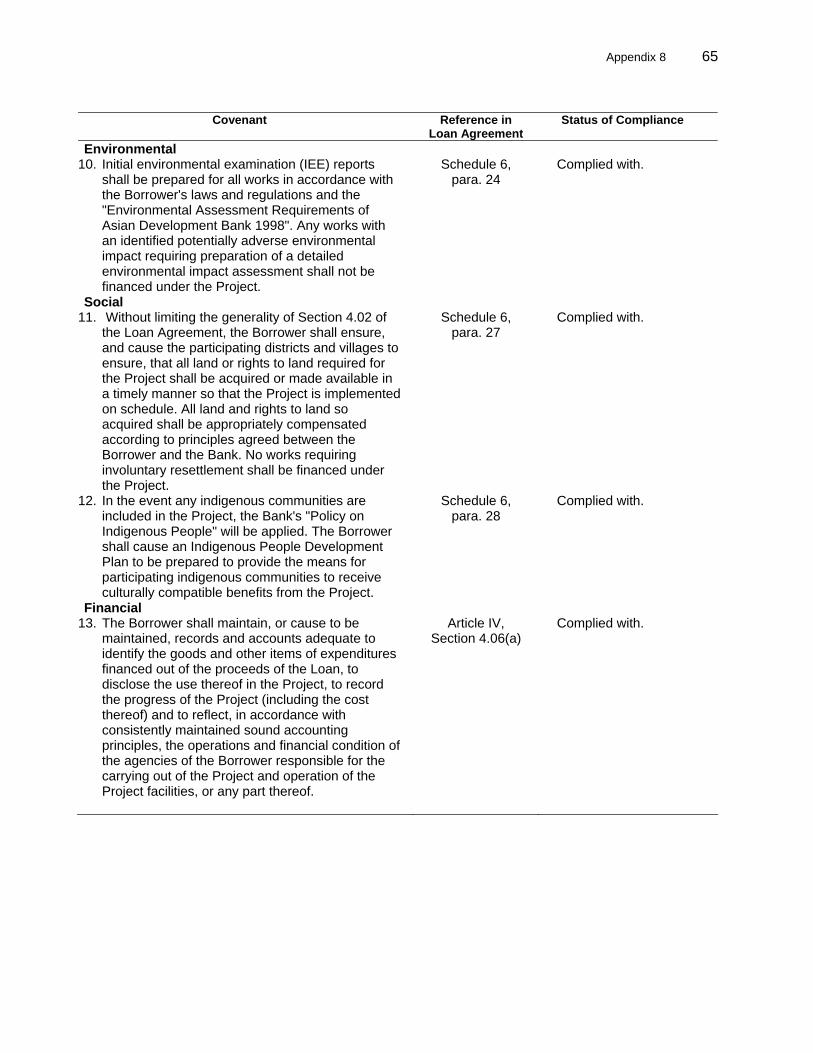
Appendix 8 65
Covenant Reference in
Loan Agreement Status of Compliance
Environmental 10. Initial environmental examination (IEE) reports
shall be prepared for all works in accordance with the Borrower's laws and regulations and the "Environmental Assessment Requirements of Asian Development Bank 1998". Any works with an identified potentially adverse environmental impact requiring preparation of a detailed environmental impact assessment shall not be financed under the Project.
Schedule 6, para. 24
Complied with.
Social 11. Without limiting the generality of Section 4.02 of
the Loan Agreement, the Borrower shall ensure, and cause the participating districts and villages to ensure, that all land or rights to land required for the Project shall be acquired or made available in a timely manner so that the Project is implemented on schedule. All land and rights to land so acquired shall be appropriately compensated according to principles agreed between the Borrower and the Bank. No works requiring involuntary resettlement shall be financed under the Project.
Schedule 6, para. 27
Complied with.
12. In the event any indigenous communities are included in the Project, the Bank's "Policy on Indigenous People" will be applied. The Borrower shall cause an Indigenous People Development Plan to be prepared to provide the means for participating indigenous communities to receive culturally compatible benefits from the Project.
Schedule 6, para. 28
Complied with.
Financial 13. The Borrower shall maintain, or cause to be
maintained, records and accounts adequate to identify the goods and other items of expenditures financed out of the proceeds of the Loan, to disclose the use thereof in the Project, to record the progress of the Project (including the cost thereof) and to reflect, in accordance with consistently maintained sound accounting principles, the operations and financial condition of the agencies of the Borrower responsible for the carrying out of the Project and operation of the Project facilities, or any part thereof.
Article IV, Section 4.06(a)
Complied with.

66 Appendix 8
Covenant Reference in
Loan Agreement Status of Compliance
14. The Borrower shall (i) maintain, or cause to be maintained, separate accounts for the Project; (ii) have such accounts and related financial statements audited annually, in accordance with appropriate auditing standards consistently applied, by independent auditors whose qualifications, experience and terms of reference are acceptable to the Bank; (iii) furnish to the Bank, as soon as available but in any event not later than nine months after the end of each related fiscal year, certified copies of such audited accounts and financial statements and the report of the auditors relating thereto (including the auditors’ opinion on the use of the Loan proceeds and compliance with the covenants of this Loan Agreement as well as on the use of the procedures for imprest account/statement of expenditures), all in the English language; and (iv) furnish to the Bank such other information concerning such accounts and financial statements and the audit thereof as the Bank shall from time to time reasonably request.
Article IV, Section 4.06(b)
Complied with. Audit recommendations have been substantially complied with.
Others 15. Established, Staffed, and Operating PMU/PIU
As the Project Executing Agency, BAPPENAS shall be responsible for the overall coordination of the Project. A Working Group within BAPPENAS under the Deputy Chairman for Regional Development shall act as the PMO, to be assisted by a team of management and training consultants.
Schedule 6, para. 1
Complied with.
15. Fielding of Consultants
In carrying out the Project, the Borrower shall cause competent and qualified consultants and contractors, acceptable to the Borrower and the Bank, to be employed to an extent and upon the terms and conditions satisfactory to the Borrower and the Bank.
Article IV, Section 4.03(a)
Complied with.
16. International Consultants (100 person-months) shall be selected by the Project Executing Agency.
Schedule 5, para. 4
Complied with late. Uncertainties involving the services of the team leader contributed to the delay in project implementation.
17. Selection of local consultants (500 person-months) shall be subject to the approval of the Bank with regard to their competence and experience for carrying out the assignment.
Schedule 5, para. 5
Complied with.
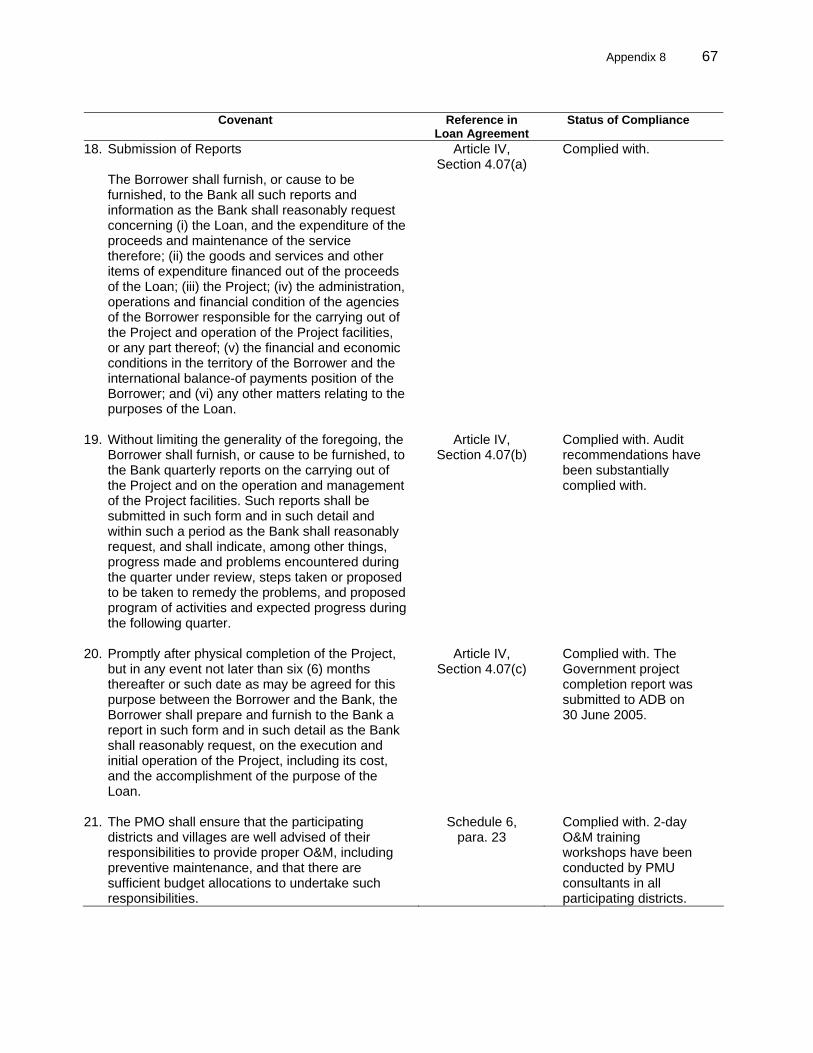
Appendix 8 67
Covenant Reference in
Loan Agreement Status of Compliance
18. Submission of Reports
The Borrower shall furnish, or cause to be furnished, to the Bank all such reports and information as the Bank shall reasonably request concerning (i) the Loan, and the expenditure of the proceeds and maintenance of the service therefore; (ii) the goods and services and other items of expenditure financed out of the proceeds of the Loan; (iii) the Project; (iv) the administration, operations and financial condition of the agencies of the Borrower responsible for the carrying out of the Project and operation of the Project facilities, or any part thereof; (v) the financial and economic conditions in the territory of the Borrower and the international balance-of payments position of the Borrower; and (vi) any other matters relating to the purposes of the Loan.
Article IV, Section 4.07(a)
Complied with.
19. Without limiting the generality of the foregoing, the Borrower shall furnish, or cause to be furnished, to the Bank quarterly reports on the carrying out of the Project and on the operation and management of the Project facilities. Such reports shall be submitted in such form and in such detail and within such a period as the Bank shall reasonably request, and shall indicate, among other things, progress made and problems encountered during the quarter under review, steps taken or proposed to be taken to remedy the problems, and proposed program of activities and expected progress during the following quarter.
Article IV, Section 4.07(b)
Complied with. Audit recommendations have been substantially complied with.
20. Promptly after physical completion of the Project, but in any event not later than six (6) months thereafter or such date as may be agreed for this purpose between the Borrower and the Bank, the Borrower shall prepare and furnish to the Bank a report in such form and in such detail as the Bank shall reasonably request, on the execution and initial operation of the Project, including its cost, and the accomplishment of the purpose of the Loan.
Article IV, Section 4.07(c)
Complied with. The Government project completion report was submitted to ADB on 30 June 2005.
21. The PMO shall ensure that the participating districts and villages are well advised of their responsibilities to provide proper O&M, including preventive maintenance, and that there are sufficient budget allocations to undertake such responsibilities.
Schedule 6, para. 23
Complied with. 2-day O&M training workshops have been conducted by PMU consultants in all participating districts.

68 Appendix 8
Covenant Reference in Loan Agreement
Status of Compliance
22. The PMO shall establish a project monitoring and evaluation system (PMES): (i) to assess the progress and implementation of the Project; and (ii) to measure the impact and outcomes of Project initiatives.
Schedule 6, para. 25
Complied with. The statistical survey and econometric analysis included an independent assessment of the overall performance of the Project and identification of strengths and weaknesses for consideration in formulating the proposed CLGS-II Project.
BAPPENAS = National Development Planning Agency, CLGS II = Second Community and Local Government Support, O&M = operation and maintenance, PIU = project implementation unit, PMC = project management consultant, PMO = project management office, PMU = project management unit. Source: National Development Planning Agency (BAPPENAS).

Appendix 9 69
FINANCIAL AND ECONOMIC EVALUATION OF INVESTMENT PROJECT A. Introduction
1. For the project completion review, 16 subprojects were subjected to economic and financial evaluation to determine their continued viability. The economic impact of the investment project has been estimated through economic internal rate of return (EIRR) and economic net present value (ENPV) calculations, using economic opportunity cost of capital of 12%. A project with EIRR greater than 12% and positive ENPV is considered economically viable. The results of these calculations indicate that, despite the very small sample covered, the investment project was efficient (see Tables 9.1 and 9.2). Viability was established by computing for economic internal rates of return and net present values following the Asian Development Bank's (ADB) Guidelines for the Economic Analysis of Water Supply Projects and Guidelines for the Financial Governance and Management of Investment Projects Financed by the Asian Development Bank.
2. The financial costs have been valued at their economic prices by applying the conversion factors (CF)1:
CF tradables (SERF) 1.11 CF unskilled labor (SWRF) 0.85 CF others 1.00 Standard conversion factor (SCF) 0.90
3. Interviews with beneficiaries have been implemented in several locations of Kabupaten Malang, Kabupaten Lombok Barat, Kabupaten Lombok Timur, Kabupaten Tanah Toraja, and Kota Makasar, 2 and additional data from Kota Kediri has been obtained through written communication. After careful screening, only the data on irrigation and roads and bridges in Kabupaten Lombok Barat, Lombok Timur, and Toraja were considered adequate for the economic analysis. Available data on the markets in Kota Kediri and Kabupaten Malang, and on the water subproject in Kota Makasar, allowed for the calculation of cost recovery levels only (see Table 9.1).
4. There is no baseline data available for these subprojects. Data gathered during the field visit through interviews of beneficiaries is very limited and mostly based on assumptions or approximation. The exception is the market subproject in the city of Kediri, which was managed by the Market Department (Dinas Pasar). The national social census (SUSENAS) of 2003 does not provide any of the required data for the EIRR analysis.
5. It is mentioned in the report and recommendation of the President (RRP) and midterm review report that subprojects with investment costs above Rp1.6 billion require economic analysis. However, during implementation, none of the subprojects reached that amount, which meant that no economic analysis was required. However, to satisfy the requirements of this project completion report (PCR), which called for measuring the economic impact of the
1 ADB. 1999. Report and Recommendation of the President to the Board of Directors on Proposed Loans and
Technical Assistance Grant to the Republic of Indonesia for the Community and Local Government Support Sector Development Program. Manila.
2 The Mission visited the following districts and subprojects: Malang (school rehabilitation, drainage, village market, public toilet-cum-washing place, irrigation, village road), West Lombok (village road, market hall, irrigation channel and bridge), East Lombok (two market halls, drainage and bridge, urban road, irrigation), Tana Toraja (water supply, two irrigation schemes), Makassar city (boat pier, water supply, footpath, neighborhood road), Kota Bandung (water supply, public toilets).
70 Appendix 9
investment project quantitatively, a limited economic analysis has been done of a few subprojects, regardless the size of the investment. This economic analysis is based on very limited data that was gathered during the site visits of the PCR Mission. B. Economic Internal Rate of Return and Cost Recovery
6. Irrigation Subprojects. The economic impact of irrigation subprojects, is measured based on the increase of income of the farmers and has varied for each district. In Kabupaten Lombok Barat and Lombok Timur the irrigation projects have improved the quantity of the agricultural commodities—like rice and tobacco—that farmers can sell in the market. However, in the case of Kabupaten Tanah Toraja, the prime commodity is rice, which is not necessarily sold but used for daily consumption. Thus, an increase in rice production means monetary savings through a reduction in expenditures by farm households.
7. Road Subprojects. The efficiency of road subprojects was measured based on the time and cost savings attained after completion of the subprojects. There is no data on daily traffic and road utilization of CLGSSDP-funded roads, and national census (SUSENAS) traffic statistics are available only for provincial, district, and urban roads. The economic impact is evident by the small stores that are beginning to emerge along these roads, and by the fact that already established stores have experienced income increases. Generally, people are expecting that more stores will emerge and receive the benefits of these road subprojects. The site visits illustrated that aside from small commercial facilities (shops), mechanical workshops (repair shops), home industries, and services (like motorbike taxis) have also been established as a direct result of the newly improved infrastructure.
8. Bridge Subprojects. Most bridges, like the bridge in Kabupaten Lombok Timur, which is connecting a village with the Kecamatan center, are small type A subprojects. The construction of the bridge in Lombok Timur has had a tremendously positive effect on the village in question. The community has been motivated to build roads at both ends of the bridge using its own resources. The new bridge has halved normal transportation expenses both for regular transport of commodities to market and for farmers during the planting season.
9. Water Subprojects. Water subprojects are mostly tiny type A subprojects like those in Kota Makasar and Bandung. The costs and economic impact of these subprojects have been too small to measure quantitatively. However, subproject beneficiaries have confirmed that the water facility has provided them with better access to clean water, reduced distance to water sources (collection points), or provided house connections. One way to measure the efficiency of water subprojects would be to compare revenues, or revenue potential, with operation and maintenance costs. In Kabupaten Tanah Toraja there is a larger type B water subproject, but it has not been in operation for the last year due to a failure of some piping which have not been repaired yet at the time of inspection; therefore no EIRR analysis could be undertaken.
10. Market Subprojects. Type B market subprojects are usually under the management of the municipal Market Department (Dinas Pasar) or the Revenue Department (Dinas Pendapatan). Kota Kediri has built a livestock market which, as per the financial statement for 2006 (provided by the Market Department), showed substantial income from market fees. Unfortunately, the operation and maintenance costs could not be identified since they were not reported separately. Thus, while the positive economic impact is certain, it cannot be measured since data on the income of the cattle sellers was not available. For the cost recovery analysis, an operation and maintenance cost of 2.5% of the capital cost was assumed. Type A markets are economically less efficient; most of them involved rehabilitating old markets. Financially, type A market subprojects may have recovered costs fully, but they have had limited impact on

Appendix 9 71
the economy of the community. The market sellers interviewed stated that their income had not changed much since the completion of the type A market subprojects. However, the rehabilitated markets are cleaner and, thus, present fewer risks to health and the quality of merchandise. However, not all markets are well located and some of them are developed as extensions of existing markets, and far from the entrance to existing market.
11. Public Toilet Subprojects. Most of public toilets visited were in poor condition. Nobody seemed to be in charge of the operation and maintenance of these facilities, and user fees were not being collected. In the case of Kota Bandung it is obvious that the public toilet provides an important service to local residents. People have been using it for the last 6 years.
12. The results of the economic and financial analysis (Table 9.1), and the related sensitivity analysis (Table 9.2) are presented below:
Table A9.1: Results of Economic and Financial Analysis
Subproject City / Location
Subprojects (Type A or B) EIRR
NPV (Rp
million) Cost
Recovery Remarks
I Kabupaten Malang Market (A) n.a.
246.9%
Roads (B) n.a. No data available Irrigation (A) n.a. No data available II Kabupaten
Lombok Market (B) n.a Data insignificant for
analysis Barat Irrigation (B) 13.0% 14 Roads (B) 22.3% 158 III Kabupaten
Lombok Market (B) n.a. Data insignificant for
analysis Timur Bridge (A) 50.7% 715 Roads (B) n.a. Data insignificant for
analysis Irrigation (A) 161.2% 655 IV Kabupaten
Tanah Water (A) n.a. Not operational
Toraja Irrigation (A) 6.2% (11)
V Kota Makasar Water (A) n.a.
67.2% Without depreciation CR>100%
Roads (A) n.a. Data not available
VI Kota Kediri Market (B) n.a.
63.4% Without depreciation CR>100%
VII Kota Bandung Water (A) n.a. 120%
n.a. = not available. Note: EIRRs for three categories as at appraisal of investment project: water supply 16–28%; roads 24–35%; drainage 19–32%. Source: Asian Development Bank.
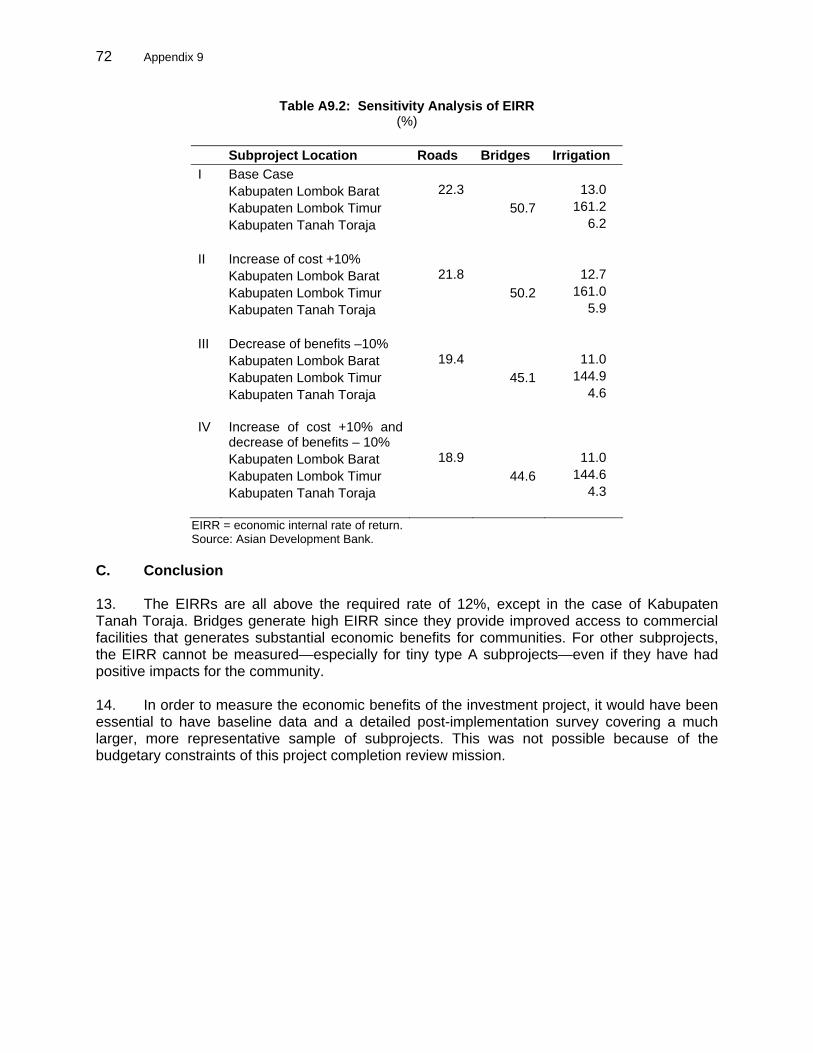
72 Appendix 9
Table A9.2: Sensitivity Analysis of EIRR (%)
Subproject Location Roads Bridges Irrigation I Base Case Kabupaten Lombok Barat 22.3 13.0 Kabupaten Lombok Timur 50.7 161.2 Kabupaten Tanah Toraja 6.2 II Increase of cost +10% Kabupaten Lombok Barat 21.8 12.7 Kabupaten Lombok Timur 50.2 161.0 Kabupaten Tanah Toraja 5.9 III Decrease of benefits –10% Kabupaten Lombok Barat 19.4 11.0 Kabupaten Lombok Timur 45.1 144.9 Kabupaten Tanah Toraja 4.6 IV Increase of cost +10% and
decrease of benefits – 10%
Kabupaten Lombok Barat 18.9 11.0 Kabupaten Lombok Timur 44.6 144.6 Kabupaten Tanah Toraja 4.3
EIRR = economic internal rate of return. Source: Asian Development Bank.
C. Conclusion 13. The EIRRs are all above the required rate of 12%, except in the case of Kabupaten Tanah Toraja. Bridges generate high EIRR since they provide improved access to commercial facilities that generates substantial economic benefits for communities. For other subprojects, the EIRR cannot be measured—especially for tiny type A subprojects—even if they have had positive impacts for the community. 14. In order to measure the economic benefits of the investment project, it would have been essential to have baseline data and a detailed post-implementation survey covering a much larger, more representative sample of subprojects. This was not possible because of the budgetary constraints of this project completion review mission.