PCASE2 - transportation.erdc.dren.mil User Manual.pdf · workshop registration, training modules,...
137
PCASE2.09 September 2010 User Manual
Transcript of PCASE2 - transportation.erdc.dren.mil User Manual.pdf · workshop registration, training modules,...

PCASE2.09 September 2010
User Manual

PCASE2.09
US Army Corps of Engineers
Transportation Systems Center & Engineering Research and Development Center
Mary Adolf, P.E. With special assistance from: Andrew Harrison Carlos Gonzalez, P.E. Patrick McCaffrey Robert Walker Haley Bell John Lott
User Manual
www.pcase.com https://transportation.wes.army.mil/pcase/

Disclaimer This user manual is furnished by the United States Government and is accepted and used by the recipient with the express understanding that the United States Government makes no warranties, expressed or implied, concerning the accuracy, completeness, reliability, usability, or suitability of any particular purpose of the information or the data contained in this user manual or furnished in connection therewith, and the United States shall be under no liability whatsoever to any person by reason of any use thereof. The user manual belongs to the United States Government. Therefore, the recipient further agrees not to assert any proprietary rights therein or to represent this user manual to anyone as other than a United States Government user manual.

Chapter Listing Chapter 1 Introduction............................................................................................... 1 Chapter 2 Getting Started ......................................................................................... 3 2.1 Hardware Requirements........................................................................... 3 2.2 Downloading PCASE................................................................................ 3 2.3 Installing PCASE ...................................................................................... 4 2.4 Starting a Project File ............................................................................... 4 2.5 Navigating the Toolbar ............................................................................. 5 2.6 Using the Help/Utilities ............................................................................. 6 2.7 Launch Pad .............................................................................................. 6 2.8 Utilities...................................................................................................... 8 2.9 Help .......................................................................................................... 9 2.10 Vehicles Currently Available................................................................... 10 2.11 Traffic Patterns ....................................................................................... 11 2.12 GIS Features .......................................................................................... 11 Chapter 3 Traffic ..................................................................................................... 14 3.1 Traffic Patterns ....................................................................................... 14 3.2 Opening the Traffic Module .................................................................... 14 3.3 Creating a Traffic Pattern ....................................................................... 14 3.4 Analysis Type ......................................................................................... 16 3.5 Adding Deleting and Modifying Vehicles ................................................ 16 3.6 Changing Loads and Pass Levels for Airfield Traffic .............................. 19 3.7 Changing Loads and Pass Levels for Road Traffic................................. 20 3.8 Using an Airfield Standard Traffic Pattern .............................................. 20 3.9 Other Traffic Buttons and Options .......................................................... 21 3.10 Show Mixed Traffic Tab.......................................................................... 23 Chapter 4 Design .................................................................................................... 26 4.1 Starting the Module ................................................................................ 26 4.2 Building a New Design ........................................................................... 26 4.3 Modifying a Design ................................................................................. 28 4.4 Copying a Design ................................................................................... 28 4.5 Deleting a Design ................................................................................... 28 4.6 Creating a Flexible Pavement Design using CBR Criteria...................... 28 4.7 Adding Layers to a Flexible CBR Design................................................ 30 4.8 Changing a Layer ................................................................................... 31 4.9 Modifying Layers .................................................................................... 31 4.10 Using the Drainage Layer Worksheet..................................................... 32

4.11 Frost Design ........................................................................................... 35 4.12 Creating a Flexible Shoulder Design using CBR Criteria (airfields) ................................................................................................ 39 4.13 Creating a Flexible Pavement Design using Layered Elastic (LED) Criteria.................................................................................................... 40 4.14 Creating Season Sets for Layered Elastic Designs ................................ 42 4.15 Creating a Rigid Pavement Design using CBR Criteria .......................... 46 4.16 Adding Layers to a Rigid CBR Design.................................................... 47 4.17 Creating a Rigid Shoulder Design using CBR Criteria (airfields) ............ 50 4.18 Creating a Rigid Pavement Design using Layered Elastic (LED) Criteria.................................................................................................... 51 4.19 Creating Season Sets for Layered Elastic Designs ................................ 53 4.20 Multiple Design Builder........................................................................... 53 4.21 Material Cost ........................................................................................... 59 4.22 View Alternatives .................................................................................... 59 4.23 Layer Details .......................................................................................... 62 4.24 Sensitivity ............................................................................................... 63 4.25 Damage.................................................................................................. 63 4.26 Subgrade Prep ....................................................................................... 65 4.27 Compaction ............................................................................................ 65 4.28 Drainage................................................................................................. 68 4.29 Joints/Dowels ......................................................................................... 69 4.30 Reports................................................................................................... 69 4.31 English / Metric ....................................................................................... 69 4.32 Exit ......................................................................................................... 69 Chapter 5 Evaluation............................................................................................... 70 5.1 Identifying Sections ................................................................................ 70 5.2 Starting the Evaluation Module............................................................... 71 5.3 Create/Retrieve Section ......................................................................... 71 5.4 Run Properties ....................................................................................... 73 5.5 Layer Manager for Empirical (CBR/K) Analysis; Entering a Layer Structure................................................................................................. 75 5.6 Layer Properties for Empirical (CBR/K) Analysis; Importing Layers from Dynamic Cone Penetrometer (DCP)................................... 77 5.7 Layer Manager for Layered Elastic Analysis; Entering a Layer Structure................................................................................................. 78 5.8 Edit Settings ........................................................................................... 82 5.9 Run Analysis .......................................................................................... 86 5.10 Evaluation Results.................................................................................. 87 5.11 ACN/PCN Procedure (for airfields only) ................................................. 88 5.12 Other Evaluation Tools ........................................................................... 90

Chapter 6 Dynamic Cone Penetrometer (DCP) ...................................................... 93 6.1 Starting the DCP Module........................................................................ 93 6.2 Create/Retrieve Section ......................................................................... 94 6.3 DCP Data Toolbox.................................................................................. 95 6.4 Entering DCP Data ................................................................................. 96 6.5 Data Reduction....................................................................................... 98 Chapter 7 Non Destructive Testing (NDT)............................................................. 104 7.1 Starting the NDT Module ...................................................................... 104 7.2 Importing NDT Data.............................................................................. 104 7.3 Viewing NDT Data ................................................................................ 106 7.4 Charting NDT Data ............................................................................... 107 7.5 Assigning Sections Using FWD/HWD Data.......................................... 109 Chapter 8 Climate ................................................................................................. 112 8.1 Starting the Climate Module ................................................................. 112 8.2 Using the Climate Module to Calculate the Five Day Mean.................. 112 8.3 Operational Climatic Data Summary .................................................... 113 Chapter 9 Vehicle Edit .......................................................................................... 114 9.1 Starting the Vehicle Edit Module .......................................................... 114 9.2 Editing the Standard Load of an Existing Vehicle................................. 114 9.3 Copying and Editing an Existing Vehicle .............................................. 117 9.4 Creating a New Vehicle ........................................................................ 118 9.5 Field Descriptions for Editing an Existing Vehicle or Creating a New Vehicle.................................................................................................. 119 9.6 Editing a Custom Vehicle ..................................................................... 122 9.7 Other Vehicle Edit Options & Tabs....................................................... 123 Chapter 10 Core Reports ........................................................................................ 127 10.1 Starting the Core Reports Module ........................................................ 127 10.2 Physical Property Data ......................................................................... 127 10.3 Core Log Data Sheet............................................................................ 129 10.4 Cursory Pavement Condition Survey.................................................... 130 10.5 Core Log............................................................................................... 130 10.6 Construction History ............................................................................. 131

PCASE User Manual 30 Sep 2010
Chapter 1. Introduction
Pavement-Transportation Computer Assisted Structural Engineering (PCASE) develops software tools to aid in the design and evaluation of transportation systems. A product of PCASE is the PCASE desktop which converts pavement design and evaluation criteria into a stand-alone software package.
Table 1-1. UFC documents used for PCASE desktop development.
Unified Facility Criteria Title
UFC 3-250-01 Pavement Design for Roads, Streets, Walks, and Open Storage Areas
UFC 3-250-09 Aggregate Surfaced Roads and Airfields Areas
UFC 3-260-01 Airfield and Heliport Planning and Design
UFC 3-260-02 Pavement Design for Airfields
UFC 3-260-03 Airfield Pavement Evaluation
PCASE software is used by Pavement Engineers as a tool for designing pavements and repair alternatives for both airfields and roadways. The PCASE tool gives the Engineer the ability to perform pavement designs quickly and thereby providing the ability to make decisions faster and with precision and consistency. PCASE is also used for determining pavement life. The analysis information obtained from the software (allowable passes, loads, pavement classification numbers, etc.) is critical to engineers, pilots, and airfield administrators. PCASE is used as a tool for technology transfer and is continuously being updated to include the latest research and criteria. To further aide the users the UFC documents are available within the desktop. The PCASE desktop is made up of modules which include Traffic, Design, Evaluation, Dynamic Cone Penetrometer (DCP), NonDestructive Testing (NDT), Vehicle Edit, Climate, and Core Reports.
Traffic module is capable of building traffic models to be used in the design or evaluation modules using vehicles provided in the database. Standard Air Force, Army, and Navy criteria patterns are also available for use.
Design module is capable of designing flexible, rigid, and aggregate roadway pavement and flexible, rigid, mat, and aggregate airfield pavement using empirical or layered elastic methods. A cost comparison tool is also available.
1

PCASE User Manual 30 Sep 2010
Evaluation module is capable of analyzing flexible, rigid, and aggregate roadway and airfield pavement using empirical or layered elastic methods and producing resultant allowable loads, passes, Aircraft Classification Numbers (ACN), Pavement Classification Numbers (PCN), and overlay requirements. DCP module is capable of analyzing field DCP data and providing resultant pavement layer strengths. NDT module is capable of importing and viewing falling weight deflectometer data (FWD), defining section boundaries and assigning data for backcalculation. Climate module is capable of calculating temperature data used in the evaluation module. Vehicle Edit module is capable of creating vehicles not available in the database or editing an existing vehicle (i.e. load, gear configuration, tire pressure, contact area, tire shape, and analysis points). The module also provides Aircraft Classification Numbers (ACN) and vehicle characteristics. Core Reports module provides a spreadsheet of physical property, core log, cursory pavement condition survey, and construction history data.
2

PCASE User Manual 30 Sep 2010
Chapter 2. Getting Started
2.1 Hardware Requirements Before you install the PCASE software ensure your computer meets or exceeds the specifications listed in Table 2-1.
Table 2-1. PCASE Hardware and Software Requirements
Hardware/Software Minimum Recommended
Processor 300 MHZ 3 GHZ
Video Card Standard VGA 16 MB Graphics Card
CDRom 12x Speed 40x Speed
Monitor Resolution* 1024x768 1024x768
Memory 64 MB 256 MB
Sound Card Any Any
Microsoft Office** 2000 2000 or Higher
Monitor Size 15” 21” or Higher
* A minimum resolution of 1024x768 is necessary to view all windows ** Reports within PCASE are generated using Microsoft Office 2000 Professional
2.2 Downloading PCASE To download the PCASE software, go to the PCASE website at https://transportation.wes.army.mil/pcase or www.pcase.com and follow the instructions below. (1) At the top of the website page click on the Register button. (2) Fill in the requested personal information, click the Next button, and follow the
registration instructions. Registering is a one-time process. The next time you visit the site, enter your e-mail address and password at the top of the page to sign-in. Once you sign-in you will have full access to the software downloads, workshop registration, training modules, and subscriptions to e-mail notifications.
(3) Once you have registered and signed-in, click the Software button at the top of
the website page.
3

PCASE User Manual 30 Sep 2010
(4) To download the PCASE Desktop, click the Download PCASE Desktop button. (5) As soon as you click the link, a File Download – Security Warning dialog box
will display. Click the Save button and store the PCASE installation file named pcasesetup209f.exe in a directory on your hard drive. This does not install PCASE; this only downloads the installation file to your computer.
2.3 Installing PCASE Once you have downloaded the file, go to My Computer or Windows Explorer and browse to the folder that contains the file. Double-click the file to start the installation process. Most users can simply select the Next button on all installation windows without making any changes. The installation creates an icon on your desktop called PCASE 2.09. Double-click this icon to start using PCASE. If you do not have write permissions to your computer you will need to contact your Information Technology department to install the software. 2.4 Starting a Project File Once you open the PCASE software, the Open window displays (as shown in Figure 2-1). The tab headings are Create New Project, Open Existing Project, and Recent Projects.
Figure 2-1. Welcome to PCASE Window
4

PCASE User Manual 30 Sep 2010
Creating a New Project. To create a new project, double-click the red Create New Project icon or click the Open button on the bottom right of the Open window. In the Enter New File Name window, enter your project file name. You don’t need to add the .pvr extension; it will be added to the file name automatically. This creates a new database with a clean inventory, ready for data entry.
Opening an Existing Project. To open an existing project, click the Open Existing Project tab. Scroll to the project file (the .pvr file, not the folder of the same name) and double-click the file name or highlight the file name and click the Open button.
Opening a Recently Created File. To open a recently created file, click the Recent Projects tab. Scroll to the project file (the .pvr file, not the folder of the same name) and double-click the file name or highlight the file name and click the Open button.
Note: In the Open window, you can access the Help System by clicking the Help button. The Help System provides help topics through a table of contents, index, or search. The Getting Started button takes you directly to the PCASE Tutorials in the Help System. [Helpful Hint: Clicking on the Cancel button in the Open window will open up the last project you were working in.] 2.5 Navigating the Toolbar Once a project file is opened the toolbar as shown in Figure 2-2 appears at the top of the screen. The first row of options includes File, Tables, Preferences, Add-Ins, Window, and Help: File - allows you to open, delete, or create a new database; setup your printer; or
exit PCASE. Tables - options for the PAVER software only. Preferences allow you to designate metric or English units (PAVER only) and turn on
and off PCASE and PAVER toolbars. Add-Ins is for PAVER only. Windows allows you to change the appearance of your windows. Help provides version information for PCASE and PAVER. The second row consists of buttons for the PCASE desktop modules. Each PCASE module is summarized in Chapter 1 and described in detail in subsequent chapters. The third row consists of PAVER placeholders; you will need to install PAVER for full use of these options. More information on PAVER can be found on the website at www.cecer.army.mil/paver.
5

PCASE User Manual 30 Sep 2010
Figure 2-2. PCASE Desktop Toolbar 2.6 Using the Help/Utilities To open the Help/Utilities module, click the Help/Utilities button on the toolbar. The screen shown in Figure 2-3 will open.
Figure 2-3. PCASE Desktop Utility Menu 2.7 Launch Pad The Launch Pad in Help/Utilities contains several PCASE utilities for file management. Click the “+” plus sign next to “Launch Pad” to view the management tools as shown in Figure 2-4 and described below.
Figure 2-4. Launch Pad Menu
6

PCASE User Manual 30 Sep 2010
Pack A Database allows you to compress a project file into one single zipped file. To start the pack file process, click the “+” plus sign next to the “Pack A Database” node. This will list all the projects you created and are available for packing. Click on the project file you wish to “Pack” and click Yes to continue packing the database. Follow the Pack Database Wizard instructions and the software will zip up the database, notify you that your project has been successfully packed, and place the zip file in the selected location. The packed database will be given an .EMSZ extension. The file can be sent to any user to “Unpack” and use in their Desktop.
Unpack A Database allows you to unpack a database that has been given to you in a zipped format. Click on Unpack A Database, click Yes to unpacking a set of PCASE data, browse to the location of the zipped database (it will have an .EMSZ extension), click Open, and you will receive a message that the database was successfully unzipped. Click OK to complete the unpacking process. You can now go to File (at the top of the toolbar) and Open Database to find and select the project file you unpacked.
Export Vehicle(s) allows you to export a vehicle that you created in Vehicle Edit. Click on Export Vehicle(s) and the Export Custom Vehicles window opens. Check the box in front of the vehicles you wish to export and click the Export button as shown in Figure 2-5. A message will come up identifying the location of the “custom.zip” file. The file can be sent to any user to “Import Vehicle(s)” and use in their Desktop.
Figure 2-5. Export Custom Vehicles
7

PCASE User Manual 30 Sep 2010
Import Vehicle(s) allows you to import a vehicle that has been given to you in a zipped format. Click on Import Vehicle(s) and the Import Custom Vehicles window opens. Click on the Open ZIP File button to locate the “custom.zip” file, select the vehicle(s) to import by clicking on the box, and click on the Import button as shown in Figure 2-6. The newly imported vehicle will now show up in the vehicle database.
Figure 2-6. Import Custom Vehicles
File Explorer opens up the Windows Explorer.
Calculator opens the Windows calculator.
PCASE Web Site connects you to the PCASE website at www.pcase.com or https://transportation.wes.army.mil/pcase. You must be connected to an Internet browser to enable this feature.
2.8 Utilities “Utilities” is reserved for useful tools that do not belong in the main PCASE toolbar. Click the “+” plus sign next to “Utilities” to view the utility tools as shown in Figure 2-7 and described below.
8

PCASE User Manual 30 Sep 2010
Figure 2-7. Utilities Menu
Decision Tree gives repair alternatives for pavement distresses and dust control based on input. Condition Factor Cb Cr calculates the pavement condition factors (Cb and Cr) used in overlay thickness calculations based on the pavement condition index (PCI) and percent load distress.
File Version Info generates a file version report and error log. WinJULEA provides software for multi-layer linear elastic analysis of pavements.
2.9 Help Help offers tutorials and other tools for using the PCASE Desktop. Click the “+” plus sign next to “Help” to view the tools as shown in Figure 2-8 and described below.
9

PCASE User Manual 30 Sep 2010
Figure 2-8. Help Menu
.PDF Files provides all the criteria manuals (in .pdf) used in the development of the PCASE Desktop. .DOC Files provides walk through examples for using various features of the software. It is recommended that the examples be printed out; then you can follow along using the software. .HLP Files provides a link to the Help System which consists of tutorials for using PCASE. .TXT Files provide a glossary of terms and examples for using the various modules of PCASE. Quick Start provides easy to follow steps for creating a pavement design.
2.10 Vehicles Currently Available Click the “+” plus sign next to “Vehicles Currently Available” to view all the vehicles currently available in the database.
Custom Vehicles provides a listing of the vehicles you created in Vehicle Edit or imported. Standard Vehicles provides a listing of the vehicles in the database that were installed with the software.
10

PCASE User Manual 30 Sep 2010
2.11 Traffic Patterns Click the “+” plus sign next to “Traffic Patterns” to view all patterns that you have created in the Traffic module for Individual, Mixed, Cumulative Mixed (Navy evaluation only), and Cumulative Groups (Navy evaluation only) traffic. 2.12 GIS Features PCASE shares Geographical Information Systems (GIS) tools with MicroPAVER™, an automated pavement management system. MicroPAVER™ is a decision making tool for the development of cost effective maintenance and repair alternatives for roads and streets, parking lots, and airfields. MicroPAVER™ capabilities include: pavement network inventory, pavement condition rating, development of pavement condition deterioration models (Family Curves), determination of present and future pavement condition (Condition Analysis), determination of maintenance and repair (M&R) needs and analyzing the consequence of different budget scenarios (Work Planning), and project formulation. Information for obtaining the latest version of MicroPAVER™ is available on the website at http://www.cecer.army.mil/paver. The User Manual is also available on the MicroPAVER website and contains helpful instructions for using the GIS tools and shapefile conversions/modifications (Chapter 14) and GIS reports (Chapter 8). In order to use the GIS tools with PCASE you must have GIS data. To view your GIS data you first have to activate the Visual Menu. Click on the Visual Menu button; select the radio button for Reports; select GIS Reports from the column on the right; then click Continue (Figure 2-9). The visual menu has to be activated each time you restart PCASE. Once the Select GIS Views window opens (Figure 2-10) you can select to display general, ACN/PCN ratio, Pavement Condition Index (PCI), or subgrade category information. For example, in Figure 2-11 the GIS data for subgrade category is displayed.
11

PCASE User Manual 30 Sep 2010
Figure 2-9. Visual Menu for GIS display
Figure 2-10. PCASE GIS Views
12

PCASE User Manual 30 Sep 2010
Figure 2-11. GIS View of Subgrade Category for an example airfield The GIS Tree Selector allows you to view the pavement sections in GIS view. You can point to a section on the GIS view and it will identify the section in the tree (on the left) or you can select the section in the tree and it will display it on the GIS view (figure 2-12, section R1A_KEEL is selected). The GIS Assignment tool links PCASE/PAVER data for individual pavement sections to GIS data. The GIS Assignment Tool provides a ‘point-and-click’ interface to create, remove, or change the link between pavement sections and GIS map features.
Figure 2-12. GIS Tree Selector
13

PCASE User Manual 30 Sep 2010
Chapter 3. Traffic
3.1 Traffic Patterns All pavement designs and evaluations are based on a planned set of traffic. Before beginning a pavement design or evaluation you must first build a traffic pattern. 3.2 Opening the Traffic Module The traffic module allows you to build a traffic model to be used on the airfield or roadway you are designing or evaluating. To open the traffic module click the Traffic button in the toolbar (Figure 3-1).
Figure 3-1. Traffic Module Button Once the Traffic Module window opens you have two choices: you can create a traffic pattern or choose a standard pattern. 3.3 Creating a Traffic Pattern When you click the Create Pattern button (Figure 3-2), the initial window for building the pattern will open (Figure 3-3). Fill in the pattern name, choose the design type, and specify whether the traffic will be entered for the entire design life or for multiple design periods (see descriptions below).
14

PCASE User Manual 30 Sep 2010
Figure 3-2. Creating a Pattern
Figure 3-3. Traffic Pattern Window
Pattern Name is a user-defined name given to the traffic pattern.
Helpful Hint: It will be helpful once you get to the Design module if you assign a pattern name that will be distinctive to your pattern. Also keep the nomenclature short because the design module displays only up to 11 characters of your pattern name.
15

PCASE User Manual 30 Sep 2010
Design Type identifies the type of pavement you are designing or evaluating. Set to either Airfield or Roads depending on whether this pattern will be for airfield or road pavement analysis.
Passes Entered for Entire Design Life versus Multiple Design Periods. If you select Passes entered for entire design life (the default), this indicates that you are entering passes for the entire life of the pavement. Typically, the passes are entered for the entire life of the pavement. For example, if the you are analyzing a pavement that will support 2,000 passes per year of a C-17 and the design life is for 20 years, then you will select Passes entered for entire design life and on a later window (after you add your vehicle to the pattern) you will enter 40,000 passes. If you select Multiple Design Periods (for layered elastic design only), then you would enter the number of design periods. After you add your vehicle(s) to the pattern you can then assign the periods and apply growth factors (see Paragraph 3-5). 3.4 Analysis Type Mixed Traffic versus Individual Traffic. By setting the Analysis Type, you can select how to use your traffic pattern.
Mixed analysis uses all of the vehicles in your traffic pattern and reduces the mix to one controlling vehicle and equivalent pass level. Only the controlling vehicle will then be used for the design or evaluation. For pavement designs and evaluations using the empirical (CBR/K) model, use the mixed traffic analysis.
Individual analysis will analyze each vehicle in the traffic pattern. This type of pattern is used for layered elastic design and evaluation.
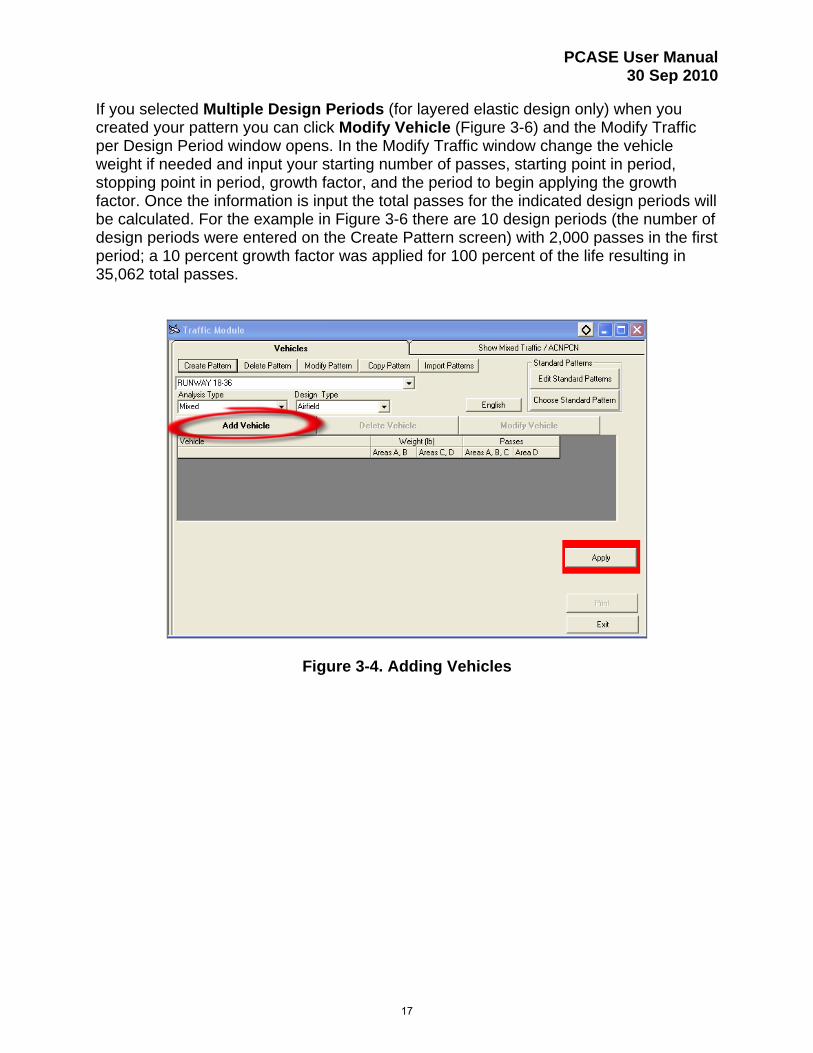
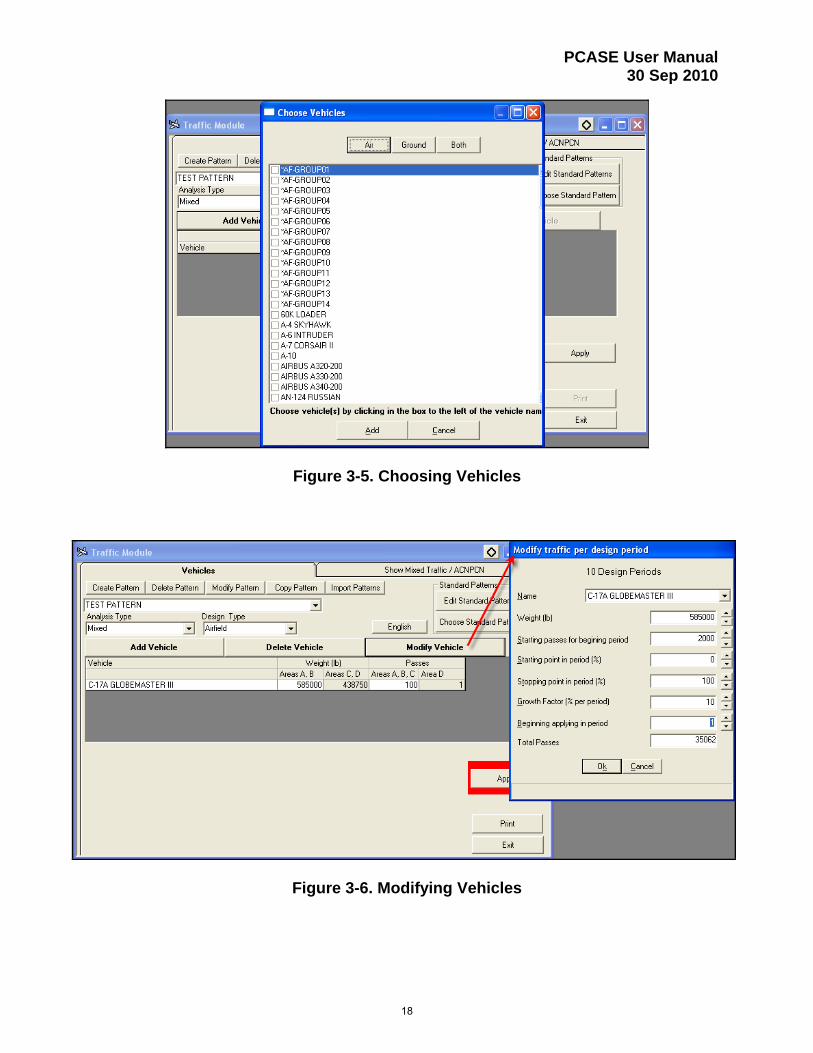
3.5 Adding, Deleting, and Modifying Vehicles in a Traffic Pattern After you click the Ok button on the Traffic Pattern window, you can start adding vehicles by clicking the Add Vehicle button (Figure 3-4). The Air button on the top of the window limits the display to aircraft only (Figure 3-5). The Ground button limits the display to ground vehicles only. The Both button displays all vehicles; aircraft and ground. To select vehicle(s) for a traffic pattern, you must click the check box next to the vehicle name. Be sure to click inside the box or double-click the vehicle name. You can use the scrollbar on the right side to scroll down to see more vehicles. Once you have selected all the vehicles for your design or evaluation, click the Add button at the bottom of the window. The Cancel button cancels the action of adding vehicles to the traffic pattern and returns you to the Traffic Module window. If you would like to delete a selected vehicle from your traffic mix, click the Delete Vehicle button.
16
PCASE User Manual 30 Sep 2010
If you selected Multiple Design Periods (for layered elastic design only) when you created your pattern you can click Modify Vehicle (Figure 3-6) and the Modify Traffic per Design Period window opens. In the Modify Traffic window change the vehicle weight if needed and input your starting number of passes, starting point in period, stopping point in period, growth factor, and the period to begin applying the growth factor. Once the information is input the total passes for the indicated design periods will be calculated. For the example in Figure 3-6 there are 10 design periods (the number of design periods were entered on the Create Pattern screen) with 2,000 passes in the first period; a 10 percent growth factor was applied for 100 percent of the life resulting in 35,062 total passes.
Figure 3-4. Adding Vehicles
17
PCASE User Manual 30 Sep 2010
Figure 3-5. Choosing Vehicles
Figure 3-6. Modifying Vehicles
18

PCASE User Manual 30 Sep 2010
3.6 Changing Loads and Pass Levels for Airfield Traffic After you select vehicles to add to the traffic pattern and click Add, the Add Vehicle window closes and your selected list of vehicles and their default loads and pass levels are imported to the Traffic Module window. Edit the weight(s) and pass level(s) as needed (see descriptions below). Click the Apply button to send the traffic information to the other modules.
Figure 3-7. Airfield Traffic Areas
Vehicle lists the vehicles selected for the pattern.
Traffic Area Weight Column - Areas A, B displays the full aircraft weight. The weight can be changed by clicking in the cell displaying the weight and entering the new weight.
Traffic Area Weight Column - Areas C, D displays the aircraft weight reduced by 25 percent. If the full weight was changed in column for Area A, B then the weight in Areas C, D will automatically be reduced by 25 percent.
Traffic Area Pass Levels Areas A, B, C displays the pass level for the life of the pavement. The screen defaults to 100 passes, but you must enter the number of passes (by clicking in the cell displaying the pass level and typing in the new passes) for each aircraft for the life of the pavement. For example, enter 40,000 passes for a 20-year design life at 2,000 passes per year.
Traffic Area Pass Levels Area D – Displays 1 percent of the passes entered for the life of the pavement (1 percent of Areas A, B, C).
19

PCASE User Manual 30 Sep 2010
3.7 Changing Loads and Pass Levels for Road Traffic After you select vehicles to add to the traffic pattern and click Add, the Add Vehicle window closes and your selected list of vehicles and their default loads and pass levels are imported to the Traffic Module window (Figure 3-8). Edit the weight(s) and pass level(s) as needed (see descriptions below). Click the Apply button to have the data available for use in the Design and Evaluation modules.
Figure 3-8. Road Traffic
Vehicle lists the vehicles selected for the pattern.
Weight Column displays the full vehicle weight. The weight can be changed by clicking in the cell displaying the weight and entering the new weight.
Passes Column displays the pass level for the design life of the pavement. The screen defaults to 100 passes, but you must enter the number of passes (by clicking in the cell displaying the pass level and typing in the new passes) for each vehicle for the life of the pavement. For example, enter 40,000 passes for a 20-year design life at 2,000 passes per year.
3.8 Using an Airfield Standard Traffic Pattern Instead of creating a traffic pattern, you have the option of using an airfield pattern that has been built for you according to Army, Air Force, or Navy criteria. The vehicles, weights, and passes for each standard pattern are listed in UFC 03-260-02. To select an airfield standard pattern, click the button Choose Standard Pattern from the Traffic
20

PCASE User Manual 30 Sep 2010
Module window (see Figure 3-9). To select a standard pattern, you must select (click) the check box next to the pattern name. Be sure to click inside the square or double-click the pattern name. You can use the scrollbar on the right side to scroll down for more patterns. Once you have selected your pattern, click Ok. This will make a copy of the standard pattern. Any changes made to the pattern after it is selected will not be made permanently to the standard pattern list. Click the Apply button to send the traffic information to the other modules.
Figure 3-9. Standard Patterns 3.9 Other Traffic Buttons and Options
Delete Pattern allows you to delete the current traffic pattern from your project file. Be sure you are on the appropriate pattern before you click the Delete button. Modify Pattern allows you to rename the traffic pattern. Copy Pattern makes a duplicate copy of the current traffic pattern. Import Patterns allows you to import a traffic pattern from another project. Click on the Import Patterns button and the Import Patterns window will display (Figure 3-10a). Click on the Traffic Files button and the Select traffic file to Import from window displays (Figure 3-10a). Select the project file you wish to import your pattern from and click the Open button (Figure 3-10b). Check the box in front of the pattern you wish to import and click Ok (Figure 3-10c). The pattern will now be available in your current project file.
21

PCASE User Manual 30 Sep 2010
Figure 3-10a. Import Patterns
Figure 3-10b. Import Patterns
Figure 3-10c. Import Patterns
22

PCASE User Manual 30 Sep 2010
Edit Standard Patterns allows you to edit the standard patterns. The existing standard patterns are based on criteria, and it is strongly recommended that you do not edit the standard patterns. English/Metric allows you to toggle between metric and English units. Print exports the displayed traffic pattern to a Word document for printing. Exit closes the Traffic module.
3.10 Show Mixed Traffic Tab At the top of the Traffic Module window there are tabs for Vehicles and Show Mixed Traffic. The Vehicle tab is for creating a pattern or choosing a standard pattern as described above. Mixed analysis takes all of the vehicles in your traffic pattern and reduces the mix to one controlling vehicle and equivalent pass level. In order to accurately calculate the controlling vehicle and equivalent passes you must identify the pavement type, subgrade category, and traffic area you are evaluating. The controlling vehicle and equivalent passes changes with a change in these parameters. The Show Mixed Traffic tab is used for evaluation purposes only. The Design Module calculates the controlling vehicle and equivalent passes internally so it is not necessary to go to this tab if you are performing a design. To set up traffic for evaluation create a pattern or choose a standard pattern as described paragraphs 3.3 and 3.8, then click on the Show Mixed Traffic tab to display the Window shown in Figure 3-11. Pull down the arrows for Pavement Type, Subgrade Category, and Traffic Area and select the appropriate type for each pull down. The table at the bottom of the window displays the ranges of subgrade strengths and the corresponding subgrade category and also the descriptions for the various traffic areas. For example, if you are evaluating a runway interior with a flexible pavement and subgrade strength (CBR) of 9; it falls in the range of a subgrade category “B” and traffic area “C”. At the top of the window you would enter “B” for the subgrade category and “C” for the traffic area. Once you have made your changes the resulting controlling vehicle and equivalent passes will be displayed at the bottom of the vehicle list, as identified in Figure 3-12.
23

PCASE User Manual 30 Sep 2010
Figure 3-11. Show Mixed Traffic Tab
Figure 3-12. Controlling Vehicle and Equivalent Passes Auto Detect Controlling allows you to force the controlling vehicle and calculate the equivalent passes. In the example shown in Figure 3-11 and 3-12, the controlling vehicle is the C-17. To calculate the equivalent passes of the B-52, uncheck the box in front of Auto Detect Controlling and click on Choose Controlling. In the Choose Controlling Vehicle/Group window (Figure 3-13), select the B-52 and click OK. The B-52 will be displayed as the controlling vehicle with the resulting equivalent passes. Go back
24

PCASE User Manual 30 Sep 2010
to the Vehicles tab and click Apply; your design or evaluation will be now based on the B-52 as your controlling vehicle. Hint: you may want to indicate in the traffic file name that you chose a controlling vehicle other than the calculated vehicle. You can modify patterns names on the Vehicle tab by clicking on Modify Pattern.
Figure 3-13. Choosing the Controlling Vehicle ACN/PCN button displays various charts related to the Aircraft Classification Number (ACN) and Pavement Classification Number (PCN) (Figure 3-14). The ACN and PCN are described in detail in Chapter 5.
Figure 3-14. Show Mixed Traffic – ACN/PCN.
25

PCASE User Manual 30 Sep 2010
Chapter 4. Pavement Design
4.1 Starting the Design Module
After you have built a traffic pattern, you are ready to open the design module to perform a pavement design. To open the Design module, click on the Design button in the toolbar (Figure 4-1).
Figure 4-1. Opening the Design Module
4.2 Building a New Design With the Design Module window open, click the Add button under the top grid (Figure 4-2) to create a new pavement design. The Add Design window will display (Figure 4-3) requiring the information described below. Once you enter the appropriate fields, click the Ok button at the bottom of the window to continue. A series of windows will display to help you build a layer structure. A separate window will display for each required layer in the structure.
Figure 4-2. Add a Design
26

PCASE User Manual 30 Sep 2010
Figure 4-3. Add a Design for Airfields (left) and Roads (right) Design Name. Enter a user-defined name for the design. Design Type. Select either Airfield or Roads. Pavement Type. Select the pavement type you are designing: flexible, rigid, unsurfaced (aggregate surfaced), mat (airfields only), flexible shoulder (airfields only), or rigid shoulder (airfields only).
Analysis Type. Select the design model: empirical (CBR/K) or layered elastic design (LED). Traffic Area. For airfield designs, select the traffic area for your design.
Road Type. For road designs, select if the design is for a road, street or parking lot. Terrain Type. For Road designs, select if the design is for rolling, flat or mountainous terrain. Note: This criterion is no longer used and will not affect your calculations.
27

PCASE User Manual 30 Sep 2010
Traffic Pattern. Select the traffic pattern you created in the traffic module (see Chapter 3) from the drop-down list. You can view the vehicles in a traffic pattern by clicking the View Traffic Pattern button.
4.3 Modifying a Design After you have created a design, you may modify it by selecting the design and clicking the Modify button under the top grid. You may change the file name, design type (airfield or roads), traffic area (for airfields only), or traffic pattern. The pavement type and analysis type cannot be changed. The file name, design type (airfield or roads), traffic area (for airfields only), and traffic pattern parameters can also be modified on the main window by clicking the cell of the value to be changed and typing the new value or selecting an item from a drop-down list. After you modify your design, be sure to click Save and Calculate to recalculate and save your design. 4.4 Copying a Design Once you have created a design, you may copy it by selecting it and clicking the Copy button under the top grid. You will then need to assign a new design name to your copy. You may then modify the copy for a side-by-side comparison of similar designs. After you modify your design, be sure to click Save and Calculate to recalculate and save your design. 4.5 Deleting a Design After you have created a design, you may delete it by clicking the Delete button under the top grid. Select the design to delete by clicking on the check box in front of the design name and click on OK. You will be asked to confirm the deletion. 4.6 Creating a Flexible Pavement Design using CBR Criteria On the Add Design window, if you choose to design a flexible pavement using the CBR criteria, a series of windows will display (Figure 4-4) requiring the input described below. The first window is for the asphalt layer, followed by windows for the base course, drainage layer (if drainage is required, there will be a window for the separation layer), and subgrade. After you have entered the required information on each window, click the Ok button to continue. After you have entered all the layer information, click Save and Calculate to calculate your design.
28

PCASE User Manual 30 Sep 2010
Figure 4-4. Flexible CBR Design Input Windows
Analysis. You can manually input the thickness of your asphalt layer or have the software compute the thickness. Leaving this option on the default of Compute instructs the PCASE software to calculate the thickness required. CBR. The California Bearing Ratio indicates the strength of the layer. On the base course window, you can select a CBR of 100 (crushed graded aggregate), 80 (unbound aggregate), or 50 (unbound aggregate for roads only). You are not allowed to enter a CBR value other than 100, 80, or 50 (roads only); this is set by criteria. On the subgrade window, you must manually enter the CBR of your subgrade. Drainage. A drainage layer is a layer in the pavement structure that is specifically designed to allow rapid horizontal drainage of water from the
29

PCASE User Manual 30 Sep 2010
pavement structure. The layer is also considered to be a structural component of the pavement and may serve as part of the base or subbase. In PCASE, the drainage layer is optional. If a drainage layer is not required, click the Not Required button and the software will bypass the drainage requirements. If the drainage layer is required, click the Required button and a second window will display with a Compute Drainage Layer button (refer to Paragraph 4.10) or you can manually input the thickness of the drainage layer. If you create a drainage layer, you will also be prompted for information on a separation layer.
Thickness. In flexible design, you will input a thickness only for layers for which you select manual analysis; otherwise all thicknesses will be computed for you.
4.7 Adding Layers to a Flexible CBR Design Once you have completed the initial design, you may want to add layers that were not included in the initial step-by-step design (i.e. subbase, asphalt overlay, stabilized base). To add a layer, click the Add button at the bottom of the window under the layer grid. The Add Layer window displays the Layer Type list box (Figure 4-5). The layers that can be added and the input required for each layer is listed below. Select the layer type to be added and the material type (as applicable) and then click Ok. A series of windows prompts you for information about the layer. Enter the appropriate information and click Ok. After the last of these windows closes, click Save and Calculate on the PCASE Design Module window to recalculate your design.
Figure 4-5. Add a Layer to a Flexible CBR Design
30

PCASE User Manual 30 Sep 2010
Layers that can be added to a flexible design:
Asphalt Overlay. No additional information is required. Stabilized Base. Select the material type and input the CBR of the material. Drainage/Separation. Refer to Using the Drainage Layer Worksheet (Section 4.10). Drainage/Geotextile. Refer to Using the Drainage Layer Worksheet (Section 4.10). Stabilized Subbase. Select the material type and input the CBR of the material. Subbase. Input the CBR of the material. Modified Subgrade. Select the material type and input the thickness and the CBR of the material. Natural Subgrade. Select the material type and input the CBR of the material.
4.8 Changing a Layer Once you have completed the initial design, you may want to change a layer (e.g., use a stabilized base course instead of an aggregate base course, use a geotextile instead of a separation layer). To change a layer, click the Add button at the bottom of the window, under the layer grid. The Add Layer window displays with a list box of layer options. Select the layer to be added and then click Ok. You will then be prompted for information about the layer. Fill in the appropriate information and click Ok. You will then be returned to the PCASE Design Module window. The software will automatically replace the appropriate layer. For example, if you are replacing the separation layer with a geotextile, you only need to add the geotextile; the software will automatically take out the separation layer and replace it with the geotextile. Once the layers are in place, click Save and Calculate to recalculate your design. 4.9 Modifying Layers You may change layer data in several ways. You may change values for a specific layer directly on the PCASE Design Module window by typing the new value in the appropriate cell or by selecting the new value from a drop-down list. Alternatively, you may select a layer and click the Edit button at the bottom of the window and change the values on the window for the specific layer. The final method is to click the Layer Details button at the bottom of the PCASE Design Module window and change the values on the Layers window, which displays values for all layers in your design (refer to
31

PCASE User Manual 30 Sep 2010
Paragraph 4.23). After making any change, be sure to click Save and Calculate to recalculate and save your design. 4.10 Using the Drainage Layer Worksheet When you click Compute Drainage Layer on the Drainage window, the Drainage Worksheet window displays (Figure 4-6). To navigate through the Input Parameters, press the TAB key to go to the next parameter or use your mouse and click on the next text box. The worksheet will update the calculations only after you proceed to the next parameter. After you have entered a value in the last text box, click on the Calculate Drainage button for the Output Parameters at the bottom of the window. Input and output parameter descriptions are provided in paragraphs below. Once you have entered the required information, click the Ok button. Your required subsurface drainage thickness will be transferred to the design module.
Figure 4-6. Drainage Worksheet Subsurface Drainage Input Parameters: Design Storm Index. Rainfall data are used to determine the volume of water to be handled by the subsurface drainage system. The data can be obtained from local weather stations and entered by clicking in the cell for Design Storm Index and typing in the rainfall amount in inches per hour or by double-clicking inside
32

PCASE User Manual 30 Sep 2010
the Design Storm Index box to open the Precipitation window (precipitation database). You can select the design storm index for a given location by selecting the state or country (countries are listed after the states) from the Regions list box on the left (Figure 4-7). Selecting a state or country will populate the Stations list box on the right with the weather stations located in the selected state or country. Select the closest weather station for your design. Storm drain indices for various years will display at the bottom of the window. Clicking Ok on the Precipitation window will close the window and import the 2-year storm data to the Drainage Worksheet window. You can overwrite the default imported 2-year storm index by clicking on the cell for Design Storm Index and typing in a value.
Figure 4-7. Precipitation Database from the Drainage Worksheet
Length of Drainage Path The length of the drainage path is measured along the slope of the drainage layer from the crest of the slope to where the water will exit the drainage layer. In simple terms, the length of the drainage path is the maximum distance water will travel in the drainage layer. This value can be entered or it can be calculated by clicking the Enable Drainage Path Calculations check box.
Length of Transverse Slope of Drainage Layer is the horizontal distance from the crown to the exit point of the pavement structure. Transverse Slope of Drainage Layer is the slope of the pavement from the crown to the exit point of the pavement structure.
33
PCASE User Manual 30 Sep 2010
Longitudinal Slope of Drainage Layer is the slope of the pavement along the length of the pavement from the highest to lowest point. Permeability of Drainage Material is a measure of the rate at which water passes through a unit area of material in a given amount of time under a unit hydraulic gradient. For example, the permeability of Rapid Drainage Material (RDM) is 1000 feet/day and Open Graded Material (OGM) is 5000 feet/day. Effective Porosity is defined as the ratio of the volume of voids that will drain under the influence of gravity to the total volume of a unit of aggregate. The difference between the porosity and the effective porosity is the amount of water that will be held by the aggregate. For materials such as the rapid draining material (RDM) and open graded material (OGM), the water held by the aggregate will be small; thus, the difference between the porosity and effective porosity will be small (less than 10 percent). The effective porosity may be estimated by computing the porosity from the unit dry weight of the aggregate and the specific gravity of the solids, which then should be reduced by 5 percent to allow for water retention in the aggregate. On the worksheet you can click on the cell and type in your effective porosity or double-click the cell for a list of typical values; highlight and click on the material you would like to use for your design and the value will be entered into the worksheet.
Slope of Drainage Path is the slope (longitudinal and transverse) that water must travel to exit the pavement. This value can be entered or it can be calculated by clicking the Enable Drainage Path Calculations check box.
Infiltration Coefficient will vary over the life of the pavement depending on the type of pavement, surface drainage, pavement maintenance, and structural condition of the pavement. Since the determination of a precise value of the infiltration coefficient for a particular pavement is very difficult, a value of 0.5 is assumed for design. Subsurface Drainage Output Parameters: Required Thickness is the result of comparing the calculated thickness versus the minimum thickness; the required thickness will be the greater of the two. Minimum Thickness displays the minimum required thickness based on the drainage criteria. Calculated Thickness is computed such that the capacity of the drainage layer will be equal to or greater than the infiltration from the design storm based on the input parameters. Time for 85% Drainage (T85): The water should be drained from the base and subbase layers as rapidly as possible. The time for drainage of these layers is a
34

PCASE User Manual 30 Sep 2010
function of the effective porosity, length of the drainage path, the thickness of the layers, slope of the drainage path, and the permeability of the layers. T85 is the amount of time it will take 85 percent of the water to exit the pavement. Criteria require that T85 be less than 1 day unless designing for a parking area or other areas of low volume and slow moving traffic, for which T85 is required to be less than 10 days. If T85 is greater than required, adjust the parameters by increasing the permeability or shortening the drainage path length.
4.11 Frost Design The detrimental effects of frost action in frost-susceptible subsurface materials can cause nonuniform heave of pavements during the winter and/or loss of strength of soils during thaw periods. If frost does not penetrate into the subgrade using thicknesses for non-frost design, pavement design does not need to consider the effects of frost action unless the base and subbase courses contain other than NFS, PFS, S1, or S2 (refer to UFC-260-02, Chapter 20 for definition of the frost groups or you can click on the ? box in the Natural Subgrade cell). Calculating a Depth of Frost. In the design module, the button for opening the depth of frost calculator is located in the top grid, in the Depth of Frost column. To open the calculator, click the … (dot-dot-dot) button in the Depth of Frost column on the row of your design (Figure 4-8). Note: This button does not appear for layered elastic designs; seasonal variations are calculated in another manner (described in Paragraph 4-14).
4-8. Depth of Frost Calculator Button
35

PCASE User Manual 30 Sep 2010
In the design module, a standard non-frost design must already have been calculated in order to calculate a depth of frost. This gives the depth of frost calculator a set of existing thicknesses to use for the frost thickness determination. When you click the … button in the Depth of Frost column, the Depth of Frost Penetration Calculator worksheet will display (Figure 4-9). Descriptions of the Depth of Frost Penetration Calculator worksheet and the required input are given below. Once you have entered the required information, click the Calculate button and then the Apply and Close button. Your depth of frost calculation will be complete and transferred to the design module.
4-9. Depth of Frost Penetration Calculator Worksheet
Select a State or Country (countries are listed after the states) for which the pavement design or evaluation will be performed. Selecting a state or country from the list box on the left will populate the list box on the right with the weather stations located in the selected state or country. Select a Station or weather station closest to the area for which the pavement design or evaluation will be performed. Layer Type. The non-frost layer structure you built in the design process is imported into the form. The layers in the Depth of Frost Penetration Calculator correspond to the layers in your design. For example, AC refers to the asphalt
36

PCASE User Manual 30 Sep 2010
layer, Course Grained refers to the base course, and Fine Grained refers to the natural subgrade. Dry Unit Weight. Enter the dry unit weight of each material in your structure. Moisture Content. Enter the moisture content of each material in your structure. Calculate. Once you have entered the dry unit weights and moisture contents for each layer, click the Calculate button to perform the depth of frost calculation.
Apply & Close. Clicking this button will complete the depth of frost calculation by closing the window and transferring the value to the PCASE Design Module window (Figure 4-10).
Assigning Frost Codes to Layers. Once you have calculated the depth of frost, a new column labeled Frost Code appears in the layer grid for the current design. You can then assign a frost code to the subgrade by clicking the cell for a drop-down list of available frost codes (Figure 4-10a). If the subgrade is not frost susceptible, then a frost design is not necessary and will not be calculated. After you have entered the frost codes, click Save and Calculate to finish the frost design calculations. When you click Save and Calculate a message will appear (see Figure 4-10b) notifying you that if you change any design parameters (i.e. add a layer, delete a layer, change traffic area, etc.) you will need to go back to the Depth of Frost calculator to recalculate your frost penetration, it is not recalculated automatically.
4-10a. Depth of Frost Penetration Calculator Worksheet
37

PCASE User Manual 30 Sep 2010
4-10b. Depth of Frost Penetration Calculator Worksheet Frost Design Results are provided in the columns labeled Non-Frost Design, Reduced Subgrade Strength, and Limited Subgrade Penetration. The column not “grayed-out” (white) is the controlling design based on thickness (see example in Figure 4-11). PCASE compares the total Reduced Subgrade Strength thickness to the Limited Subgrade Penetration thickness and the thinner of the two sections is compared to the Non-Frost thickness. If the Non-Frost thickness is greater; the Non-Frost would be the controlling design. According to criteria, the pavement design method will be made in favor of the one that gives the lower cost as long as it is thicker than Non-Frost design. The controlling design in PCASE is strictly based on total section thickness, a cost analysis may be necessary to determine the section of lower cost.
Figure 4-11. Frost Design Results – controlling design is highlighted in white
38

PCASE User Manual 30 Sep 2010
4.12 Creating a Flexible Shoulder Design using CBR Criteria (airfields only) For shoulder design, you do not need to have a traffic pattern; you can go directly to the design module. [However, if you just opened a new file and have not applied a traffic pattern, you will need to do so. Any traffic pattern (standard or created) will work. The software is set up so that a traffic pattern is necessary for the design module to open.] The design module includes a pavement type that meets the shoulder criteria of 5,000 coverages of a 4,535-kg (10,000-lb) single wheel load with a tire pressure of 0.69 Mpa (100 psi). To use the shoulder criteria, go directly to the design module by clicking the Design button to open the PCASE Design Module window and follow these steps:
(1) Click the Add button to add a design. (2) On the Add Design window, enter a design name in the Design Name text box. (3) From the Design Type list box, select Airfield. (4) From the Pavement Type list box, select Flex Shoulder (Figure 4-12). (5) Click Ok. (6) After you enter the required information on each window, click Ok to continue. (7) After you enter all the layer information and you add any additional layers required, click Save and Calculate to calculate your design. (8) If the pavement will be used by support vehicles (i.e. snow removal equipment, fire trucks, fuel trucks), the shoulder should be checked by creating a road design. You will need to create a traffic pattern that includes the support vehicles using the shoulder and create a design using Roads as your design type. Compare the results of the Shoulder and Roads designs; the governing design will be the one that produces the thickest section.
39
PCASE User Manual 30 Sep 2010
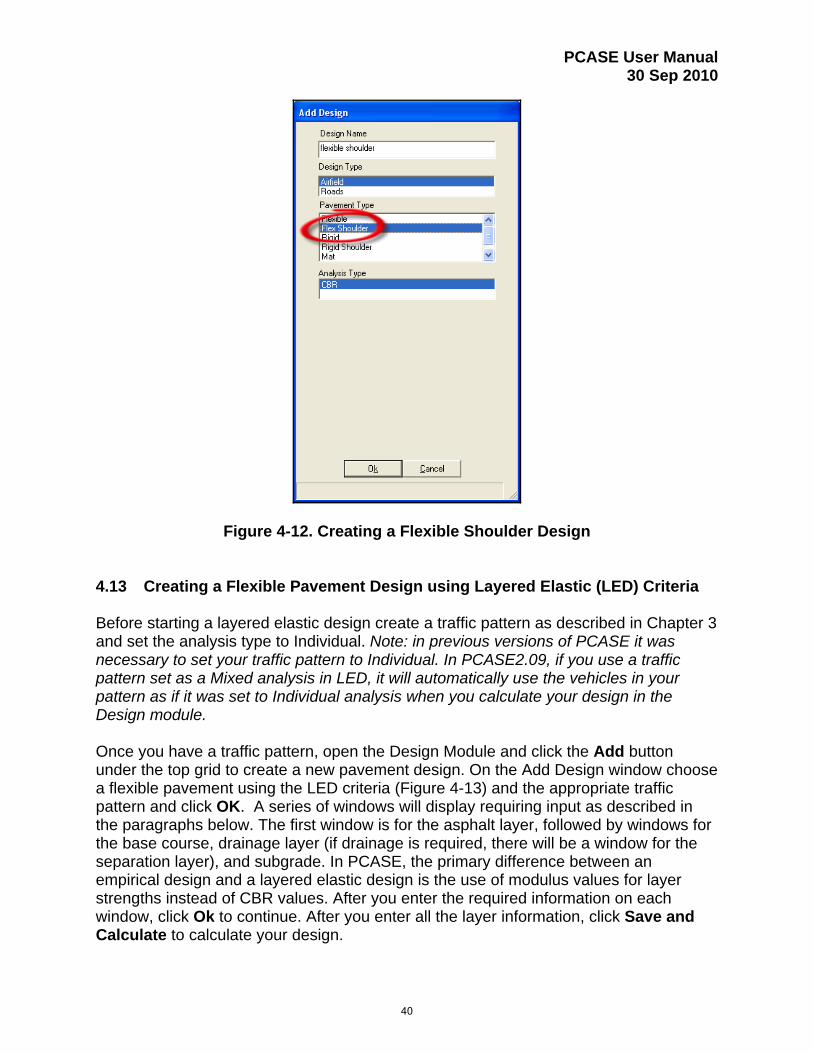
Figure 4-12. Creating a Flexible Shoulder Design 4.13 Creating a Flexible Pavement Design using Layered Elastic (LED) Criteria Before starting a layered elastic design create a traffic pattern as described in Chapter 3 and set the analysis type to Individual. Note: in previous versions of PCASE it was necessary to set your traffic pattern to Individual. In PCASE2.09, if you use a traffic pattern set as a Mixed analysis in LED, it will automatically use the vehicles in your pattern as if it was set to Individual analysis when you calculate your design in the Design module. Once you have a traffic pattern, open the Design Module and click the Add button under the top grid to create a new pavement design. On the Add Design window choose a flexible pavement using the LED criteria (Figure 4-13) and the appropriate traffic pattern and click OK. A series of windows will display requiring input as described in the paragraphs below. The first window is for the asphalt layer, followed by windows for the base course, drainage layer (if drainage is required, there will be a window for the separation layer), and subgrade. In PCASE, the primary difference between an empirical design and a layered elastic design is the use of modulus values for layer strengths instead of CBR values. After you enter the required information on each window, click Ok to continue. After you enter all the layer information, click Save and Calculate to calculate your design.
40
PCASE User Manual 30 Sep 2010
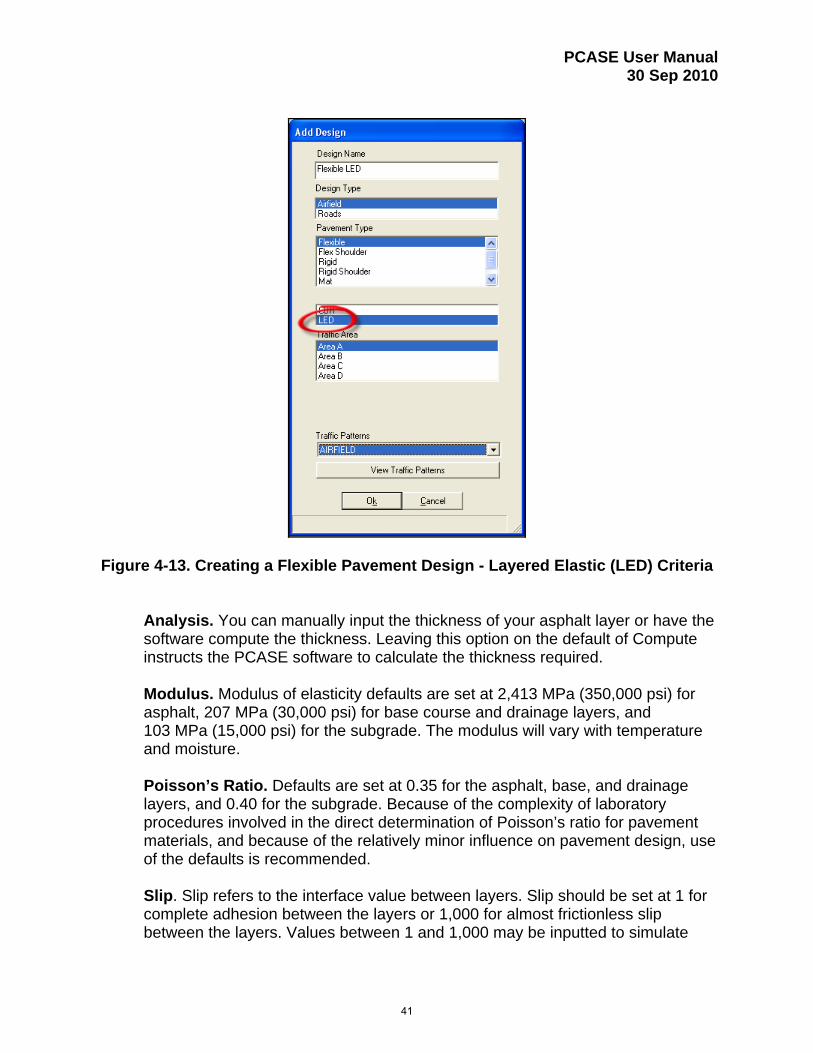
Figure 4-13. Creating a Flexible Pavement Design - Layered Elastic (LED) Criteria
Analysis. You can manually input the thickness of your asphalt layer or have the software compute the thickness. Leaving this option on the default of Compute instructs the PCASE software to calculate the thickness required. Modulus. Modulus of elasticity defaults are set at 2,413 MPa (350,000 psi) for asphalt, 207 MPa (30,000 psi) for base course and drainage layers, and 103 MPa (15,000 psi) for the subgrade. The modulus will vary with temperature and moisture. Poisson’s Ratio. Defaults are set at 0.35 for the asphalt, base, and drainage layers, and 0.40 for the subgrade. Because of the complexity of laboratory procedures involved in the direct determination of Poisson’s ratio for pavement materials, and because of the relatively minor influence on pavement design, use of the defaults is recommended. Slip. Slip refers to the interface value between layers. Slip should be set at 1 for complete adhesion between the layers or 1,000 for almost frictionless slip between the layers. Values between 1 and 1,000 may be inputted to simulate
41

PCASE User Manual 30 Sep 2010
varying degrees of friction. Almost frictionless slip is usually assumed at the bottom of a PCC layer and full adhesion is generally assumed for most other pavement materials. Drainage. In PCASE, the drainage layer is optional. If a drainage layer is not required, click the Not Required button and the software will bypass the drainage requirements. If the drainage layer is required, click the Required button and a second window will display with a Compute Drainage Layer button (refer to paragraph 4-10 “Using the Drainage Layer Worksheet”) or you can manually input a thickness of the drainage layer. If you create a drainage layer, you will be prompted for information on a separation layer. Thickness. In flexible design, you will input a thickness only for layers for which you select manual analysis; otherwise, all thicknesses will be computed for you.
4.14 Creating Season Sets for Layered Elastic Designs One of the most powerful features of the layered elastic criteria is the ability to model your design to account for changing conditions—to assign different modulus values to different seasons of the year. When you design a pavement using layered elastic criteria, PCASE defaults to one annual season. To build a custom season (or assign the percentage of the year per season), follow these steps:
(1) Go to the Seasons form by clicking the Edit Seasons button located on the right side of design window under the design grid. A dialog box will display indicating that your values (e.g., modulus, Poisson’s ration) will be reset to the defaults (Figure 4-14). (2) Click Ok; you will be entering new values for each season. (3) On the Seasons window, click the Add button to build a new season set (Figure 4-15). (4) Enter a name to identify your season set (e.g., 3 seasons, 4 seasons, my seasons); then click Ok. You will then divide the year into various seasons. The easiest way to create the seasons is to click the end date of each season (e.g., Feb 28, May 10, Aug 31, Nov 1). PCASE will then assign a percentage of the year to each season (Figure 4-16). (5) When you have completed building a season set, click Exit to return to the PCASE Design Module window. (6) On the PCASE Design Module window, click the … (dot-dot-dot) button in the Seasons column of the design grid to assign the newly created season set to your design (Figure 4-17).
42

PCASE User Manual 30 Sep 2010
(7) When the Seasons window displays (Figure 4-17) select the appropriate season set and then click Ok. The Seasons window closes and the season(s) you created is applied to the appropriate design on the PCASE Design Module window. (8) You must now enter modulus values for each of the seasons. Enter the modulus values and Poisson’s ratio (PR) for each season by typing them in the Modulus and PR columns of the layer grid. Above the layer grid, on the right side, is a scrollbar indicating the season. To go to the next season, click the > (right arrow) button (Figure 4-18). Continue scrolling to the next season and entering modulus values until you have changed the values for all seasons. (9) After you enter all seasons of modulus values, click Save and Calculate.
Figure 4-14. Creating Season Sets for Layered Elastic Designs
43

PCASE User Manual 30 Sep 2010
Figure 4-15. Add Seasons Window for Creating LED Season Sets
Figure 4-16. Creating a Calendar for LED Season Sets
44

PCASE User Manual 30 Sep 2010
Figure 4-17. Assigning a Newly Created Season Set
Figure 4-18. Scroll Bar for Entering Modulus Values for Each Season
45

PCASE User Manual 30 Sep 2010
4.15 Creating a Rigid Pavement Design using CBR Criteria On the Add Design window, if you choose to design a rigid pavement using the K criteria, a series of windows will display (Figure 4-19) requiring the input described below. The first window is for the rigid layer, followed by windows for the drainage layer (if drainage is required, there will be a window for the separation layer) and subgrade. After you enter the required information on each window, click Ok to continue. After you enter all the layer information, click Save and Calculate on the PCASE Design Module window to calculate your design.
4.19. Rigid CBR Design Input Windows
46

PCASE User Manual 30 Sep 2010
Flexural Strength. Enter the flexural strength of the new concrete to be placed.
Percent Steel. If the new concrete will be reinforced, enter the percent steel to be used for reinforcement.
% Joint Load Transfer. For airfields and parking areas, the design charts were developed based on a 25 percent load transfer value, which is the default in PCASE. A load transfer value of 25 percent is typically used as a reasonable approximation of the load transfer measured over time on the types of joints approved for use on airfields. For roads, the load transfer is set to zero. You can override the default by entering a new value.
Modulus. This refers to the modulus of elasticity of concrete. The default is 27,579 MPa (4,000,000 psi).
Poisson’s Ratio. The default for the Poisson’s ratio of the concrete material is 0.15.
Drainage. A drainage layer is a layer in the pavement structure that is specifically designed to allow rapid horizontal drainage of water from the pavement structure. The layer is also considered to be a structural component of the pavement and may serve as part of the base or subbase. In PCASE, the drainage layer is optional. If a drainage layer is not required, click the Not Required button and the software will bypass the drainage requirements. If the drainage layer is required, click the Required button and a second window will display with a Compute Drainage Layer button (refer to section 4.10) or you can manually input the thickness of the drainage layer. If you create a drainage layer, you will also be prompted for information on a separation layer.
Thickness. In rigid design, you will input a thickness only for layers for which you select manual analysis; otherwise, all thicknesses will be computed for you.
4.16 Adding Layers to a Rigid CBR Design Once you have completed the initial design, you may want to add layers that were not included in the step-by-step design builder (e.g., add a base course to your rigid structure, add an overlay). To add a layer, click the Add button at the bottom of the window under the layer grid. The Add Layer window displays the Layer Type list box (Figure 4-20). The layers that can be added and the input required for each layer is listed below. Select the layer type to be added and the material type (as applicable) and then click Ok. A series of windows prompts you for information about the layer. Enter the appropriate information and click Ok. After the last of these windows closes, click Save and Calculate on the PCASE Design Module window to recalculate your design.
47

PCASE User Manual 30 Sep 2010
4.20. Add a Layer to a Rigid CBR Design
Layers that can be added to a rigid design: Base. Input thickness and strength (K) of the base course. If you have a K that was measured on top of the base course enter the K value, otherwise leave at 0 (default) and the software will calculate and use the effective K (based on the K of the subgrade and thickness of base course material – Figure 4-21). Stabilized Base. Select the material type and input the K of the material. Asphalt Overlay. No additional information is required. PCC Fully Bonded Overlay. Input the flexural strength of the new overlay (4.48 MPa (650 psi) default), percent steel (0 default), percent joint load transfer (25 percent default), modulus (27,579 MPa (4,000,000 psi) default), and Poisson’s ratio (0.15 default). PCC Unbonded Overlay. Input the flexural strength of the new overlay (4.48 MPa (650 psi) default), percent steel (0 default), condition factor of the existing pavement (1.0 default), percent joint load transfer (25 percent default), modulus (27,579 MPa (4,000,000 psi) default), and Poisson’s ratio (0.15 default).
48

PCASE User Manual 30 Sep 2010
PCC Partially Bonded Overlay. Input the flexural strength of the new overlay (4.48 MPa (650 psi) default), percent steel (0 default), condition factor of the existing pavement (1.0 default), percent joint load transfer (25 percent default), modulus (27,579 MPa (4,000,000 psi) default), and Poisson’s ratio (0.15 default). Drainage/Separation. Refer to Using the Drainage Layer Worksheet (Section 4.10). Drainage/Geotextile. Refer to Using the Drainage Layer Worksheet (Section 4.10). Natural Subgrade. Select the material type and input the K of the material.
4-21. Calculated Effective K (based on the K of the subgrade and thickness of base course material)
Note: Refer to Paragraphs 4.8, 4.9, 4.10, and 4.11 for instructions for changing a layer, modifying layers, using the drainage layer worksheet, and for frost design, respectively.
49

PCASE User Manual 30 Sep 2010
4.17. Creating a Rigid Shoulder Design using CBR Criteria (airfields only) For shoulder design, you do not need to have a traffic pattern; you can go directly to the design module. However, if you just opened a new file and have not applied a traffic pattern, you will need to do so. Any traffic pattern (standard or created) will work. The software is set up so that a traffic pattern is necessary for the design module to open. The design module provides a pavement type that meets the shoulder criteria of 5,000 coverages of a 4,535-kg (10,000-lb) singe wheel load with a tire pressure of 0.69 Mpa (100 psi). To use the shoulder criteria, go directly to the design module by clicking the Design button to open the PCASE Design Module window and follow these steps:
(1) On the PCASE Design Module window, select the Add button under the design grid. (2) On the Add Design window, enter a design name in the Design Name text box. (3) From the Design Type list box, select Airfields. (4) From the Pavement Type list box, select Rigid Shoulder (Figure 4-22). (5) Click Ok. (6) After you enter the required information on each window (PCC, Drainage, and Subgrade), click the Ok button to continue.
(7) After you enter all the layer information and add any additional layers required, click Save and Calculate to calculate your design. (8) If the pavement will be used by support vehicles (e.g., snow removal equipment, fire trucks, fuel trucks), the shoulder should be checked by creating a road design. You will need to create a traffic pattern that includes the support vehicles using the shoulder and create a design using Roads as your design type. Compare the results of the Shoulder and Roads designs; the governing design will be the one that produces the thickest section.
50

PCASE User Manual 30 Sep 2010
Figure 4-22. Creating a Rigid Shoulder Design
4.18. Creating a Rigid Pavement Design using Layered Elastic (LED) Criteria Before starting a layered elastic design create a traffic pattern as described in Chapter 3 and set the analysis type to Individual. Note: in previous versions of PCASE it was necessary to set your traffic pattern to Individual. In PCASE2.09, if you use a traffic pattern set as a Mixed analysis in LED, it will automatically use the vehicles in your pattern as if it was set to Individual analysis when you calculate your design in the Design module. Once you have a traffic pattern set for Individual analysis, open the Design Module and click the Add button under the top grid to create a new pavement design. On the Add Design window choose a rigid pavement using the LED criteria (Figure 4-23) and the appropriate traffic pattern and click OK. A series of windows will display requiring input as described in the paragraphs below. The first window is for the rigid layer, followed by windows for the drainage layer (if drainage is required, there will be a window for the separation layer) and subgrade. In PCASE, the primary difference between an empirical design and a layered elastic design is the use of modulus values for layer strengths instead of K values. After you enter the required information on each window, click the Ok button to continue. After you enter all the layer information, click Save and Calculate to calculate your design.
51

PCASE User Manual 30 Sep 2010
Figure 4-23. Creating a Rigid Pavement Design - Layered Elastic (LED) Criteria
Flexural Strength. Enter the flexural strength of the new concrete to be placed.
Percent Steel. If the new concrete will be reinforced, enter the percent steel to be used for reinforcement.
% Joint Load Transfer. For airfields and parking areas, the design charts were developed based on a 25 percent load transfer value, which is the default in PCASE. A load transfer value of 25 percent is typically used as a reasonable approximation of the load transfer measured over time on the types of joints approved for use on airfields. For roads, the load transfer is set to zero. You can override the default by entering a new value. Modulus. The modulus of elasticity of concrete default is 27,579 MPa (4,000,000 psi).
Poisson’s Ratio (PR). Defaults are 0.15 for the concrete layer, 0.35 for the drainage layer, and 0.40 for the subgrade. Because of the complexity of laboratory procedures involved in the direct determination of Poisson’s ratio for pavement materials, and because of the relatively minor influence on pavement design, use of the defaults is recommended.
52
PCASE User Manual 30 Sep 2010
Slip. Slip refers to the interface value between layers. Slip should be set at 1 for complete adhesion between the layers or 1,000 for almost frictionless slip between the layers. Values between 1 and 1,000 may be input to simulate varying degrees of friction. Almost frictionless slip is usually assumed at the bottom of a PCC layer and full adhesion is generally assumed for most other pavement materials.
Drainage. A drainage layer is a layer in the pavement structure that is specifically designed to allow rapid horizontal drainage of water from the pavement structure. The layer is also considered to be a structural component of the pavement and may serve as part of the base or subbase. In PCASE, the drainage layer is optional. If a drainage layer is not required, click the Not Required button and the software will bypass the drainage requirements. If the drainage layer is required, click the Required button and a second window will display with a Compute Drainage Layer button (refer to section 4.10) or you can manually input the thickness of the drainage layer. If you create a drainage layer, you will also be prompted for information on a separation layer.
Thickness. In rigid design, you will input a thickness only for layers for which you select manual analysis; all other thicknesses will be computed for you.
4.19 Creating Season Sets for Layered Elastic Designs In the layered elastic criteria you have the ability to model your design to account for changing conditions—to assign different modulus values to different seasons of the year. When you design a pavement using layered elastic criteria, PCASE defaults to one annual season. To build a custom season (or assign the percentage of the year per season), follow the steps outlined in Paragraph 4.14. 4.20 Multiple Design Builder The Multiple Design Builder allows you to perform multiple designs at a time. You could potentially perform 4,210,050 designs at one time; however the more options you select the longer your calculation time. Click on the Multiple Design Builder button to display the Multiple Design Setup window (Figure 4-24) and click the Add button. On the New Multiple Design Set window (Figure 4-24) enter an identifier (three (3) characters maximum) for your design sets and click OK. The ID will be used to identify your designs in the Design and View Alternative windows.
53

PCASE User Manual 30 Sep 2010
4-24. Multiple Design Builder Windows Once you have entered the ID for your Multiple Design Set the depth of frost penetration window opens (Figure 4-25). Select a State or Country (countries are listed after the states) for your pavement designs. Selecting a state or country from the list box on the left will populate the list box on the right with the weather stations located in the selected state or country. After you have selected the location click Apply & Close. If you are not concerned with frost then click on Cancel to bypass the frost calculations.
4-25. Depth of Frost Penetration Window
54

PCASE User Manual 30 Sep 2010
On the next window, Multiple Design Selection (Figure 4-26), identify your design type (airfield or road), pavement type (both flexible and rigid may be selected), analysis type (both CBR and LED may be selected), traffic area (airfields only), road type (roads only), terrain type (roads only), and click OK. On the Traffic Pattern window (Figure 4-27) select the pattern(s) (more than one pattern may be selected) for your design and click OK.
Figure 4-26. Multiple Design Builder – Multiple Design Selections Window
Figure 4-27. Multiple Design Builder – Traffic Pattern Selection Window
55
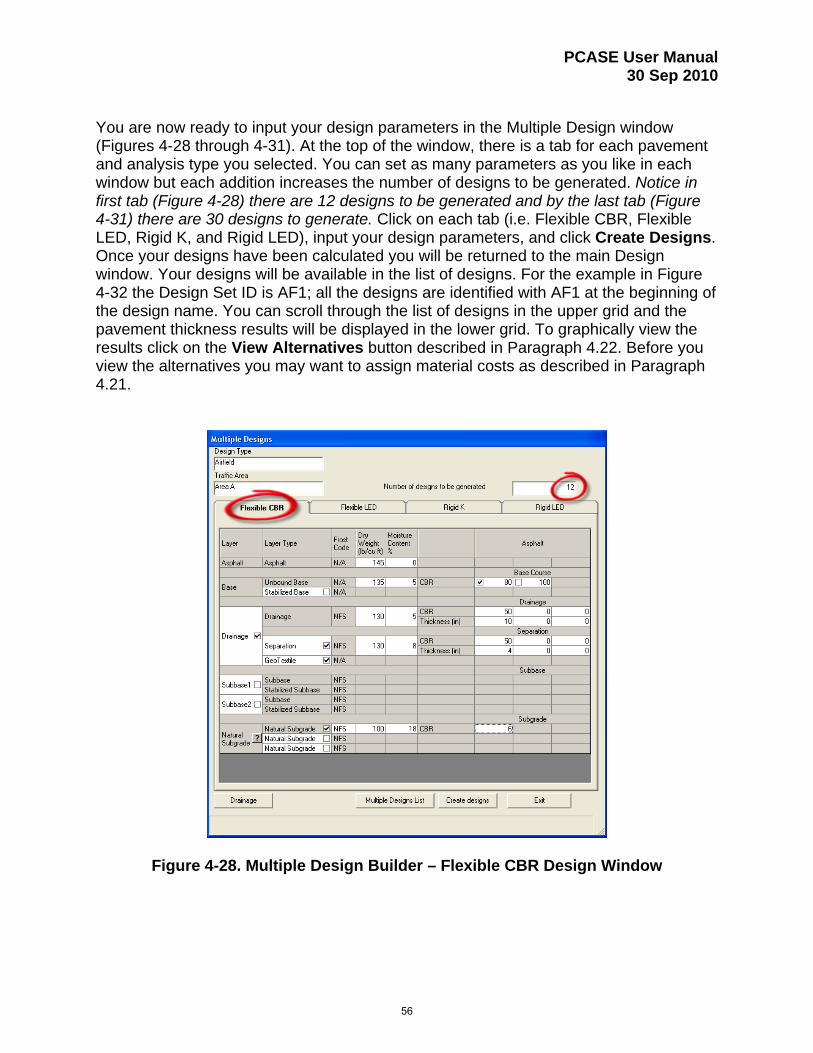
PCASE User Manual 30 Sep 2010
You are now ready to input your design parameters in the Multiple Design window (Figures 4-28 through 4-31). At the top of the window, there is a tab for each pavement and analysis type you selected. You can set as many parameters as you like in each window but each addition increases the number of designs to be generated. Notice in first tab (Figure 4-28) there are 12 designs to be generated and by the last tab (Figure 4-31) there are 30 designs to generate. Click on each tab (i.e. Flexible CBR, Flexible LED, Rigid K, and Rigid LED), input your design parameters, and click Create Designs. Once your designs have been calculated you will be returned to the main Design window. Your designs will be available in the list of designs. For the example in Figure 4-32 the Design Set ID is AF1; all the designs are identified with AF1 at the beginning of the design name. You can scroll through the list of designs in the upper grid and the pavement thickness results will be displayed in the lower grid. To graphically view the results click on the View Alternatives button described in Paragraph 4.22. Before you view the alternatives you may want to assign material costs as described in Paragraph 4.21.
Figure 4-28. Multiple Design Builder – Flexible CBR Design Window
56

PCASE User Manual 30 Sep 2010
Figure 4-29. Multiple Design Builder – Flexible LED Design Window
Figure 4-30. Multiple Design Builder – Rigid CBR Design Window
57

PCASE User Manual 30 Sep 2010
Figure 4-31. Multiple Design Builder – Rigid LED Design Window
Figure 4-32. Multiple Design Builder – Results
58

PCASE User Manual 30 Sep 2010
4.21 Material Cost Material Cost allows you to enter the unit cost for the various layers of your design. These costs will be used in the View Alternatives (see Paragraph 4.22) to calculate an estimate for your design sections. Click on the Material Cost button in the middle of the design window (Figure 4-33). On the Layer Costs window (Figure 4-33) the Unit of Measure can be changed by clicking on the cell in the “Sold by” column for the appropriate layer, pulling down the arrow, and selecting the Unit of Measure. The Sold By (Unit of Measure) options for each layer are: Area (square yards), Weight (tons), and Volume (cubic yards). After you identify the unit of measure enter a unit cost for each of the layers used in your design, click Save, and click Exit.
Figure 4-33. Material Cost Button and Window
4.22 View Alternatives Click the View Alternatives button in the lower left corner of the PCASE Design Module window (Figure 4-34) to display a graphical representation of the designs you have created. If you have not assigned material costs, as described in Paragraph 4.21, you will get a warning message as shown in Figure 4-35. If you click OK on the warning window it will continue the view alternative process; if you click Cancel it will take you out of the view alternatives. In the next window, the Design Area window (Figure 4-36), input the length and width or the area of your project and click OK. Costs will be calculated and displayed on the View Alternative window. If you leave the length, width,
59

PCASE User Manual 30 Sep 2010
and area at the default of zero, no costs will be calculated. The Select Design window (Figure 4-37) allows you to select the designs you would like to view. Select the designs to view by clicking on the box(es) in front of the design or click the Select All button at the bottom of the window; then click OK. Once you click OK the selected alternatives will be displayed (Figure 4-38). Moving the mouse across the various layers will display the layer thickness and material type at the bottom of the window. You can also choose other alternatives to view by clicking on the Choose Designs to View button. Click on the Print button to print your alternatives. Click on Exit to return to the design module.
4-34. View Alternatives Button
4-35. View Alternatives Cost Analysis Warning Button
60

PCASE User Manual 30 Sep 2010
4-36. View Alternatives Design Area Window
4-37. View Alternatives Select Design Window
61
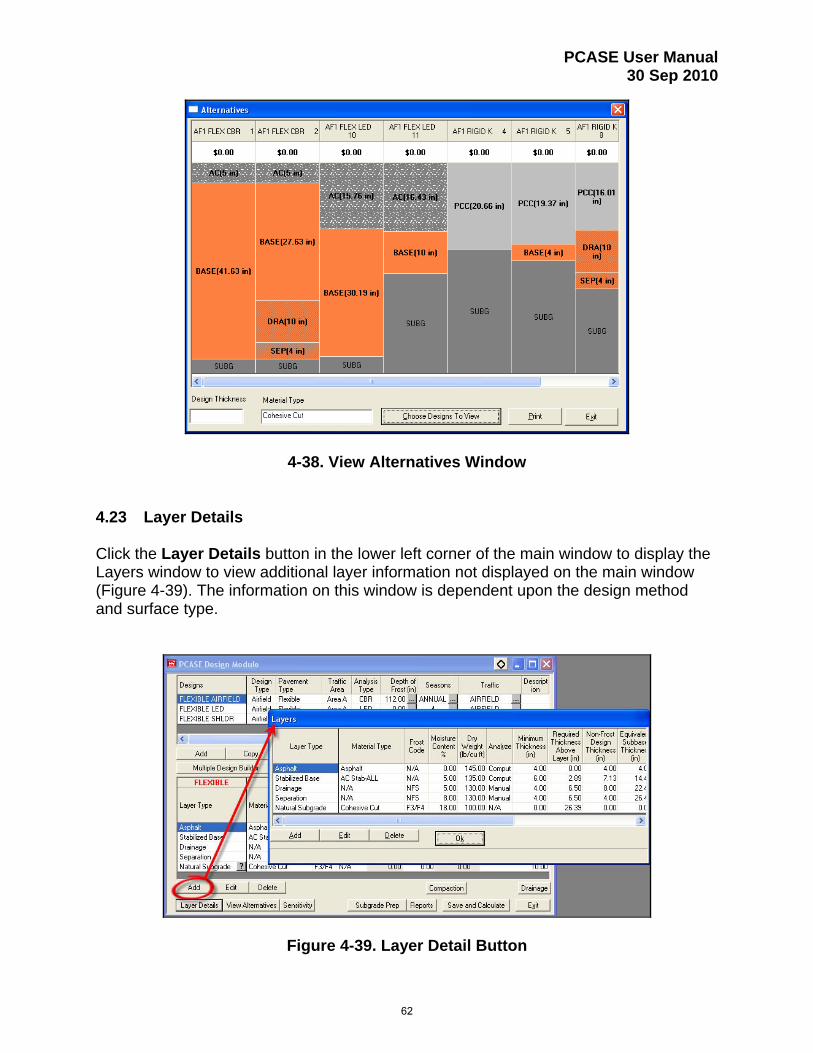
PCASE User Manual 30 Sep 2010
4-38. View Alternatives Window 4.23 Layer Details Click the Layer Details button in the lower left corner of the main window to display the Layers window to view additional layer information not displayed on the main window (Figure 4-39). The information on this window is dependent upon the design method and surface type.
Figure 4-39. Layer Detail Button
62
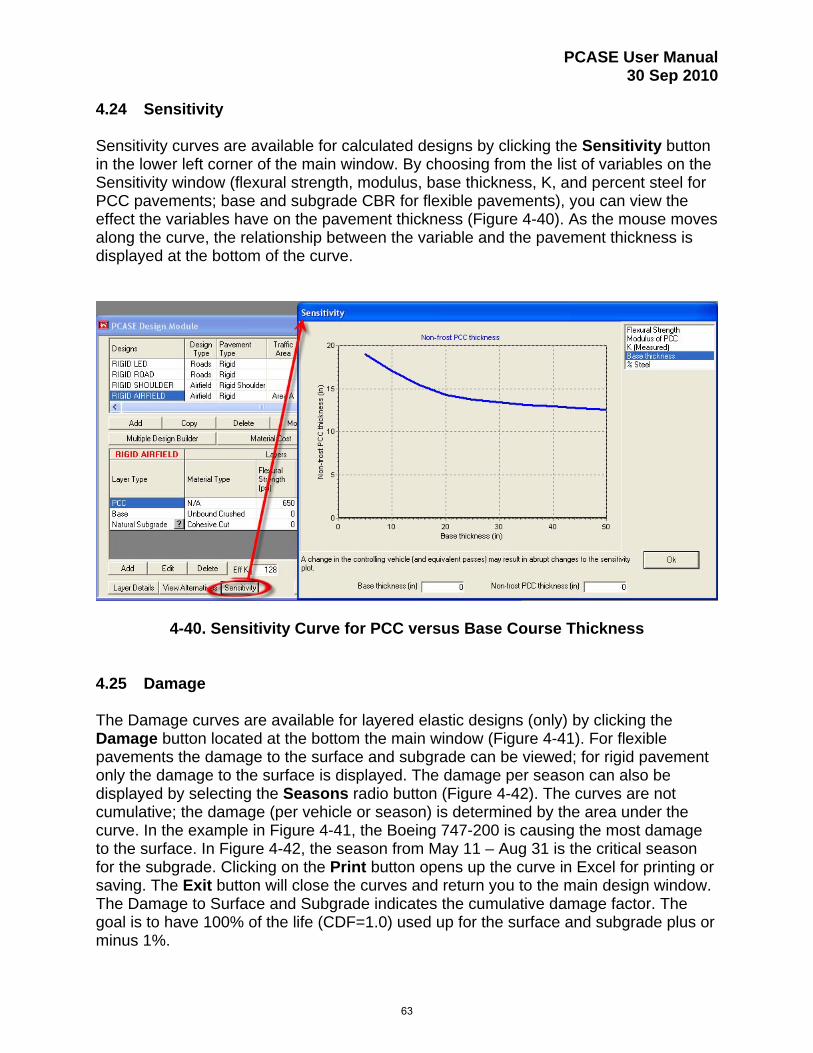
PCASE User Manual 30 Sep 2010
4.24 Sensitivity Sensitivity curves are available for calculated designs by clicking the Sensitivity button in the lower left corner of the main window. By choosing from the list of variables on the Sensitivity window (flexural strength, modulus, base thickness, K, and percent steel for PCC pavements; base and subgrade CBR for flexible pavements), you can view the effect the variables have on the pavement thickness (Figure 4-40). As the mouse moves along the curve, the relationship between the variable and the pavement thickness is displayed at the bottom of the curve.
4-40. Sensitivity Curve for PCC versus Base Course Thickness 4.25 Damage The Damage curves are available for layered elastic designs (only) by clicking the Damage button located at the bottom the main window (Figure 4-41). For flexible pavements the damage to the surface and subgrade can be viewed; for rigid pavement only the damage to the surface is displayed. The damage per season can also be displayed by selecting the Seasons radio button (Figure 4-42). The curves are not cumulative; the damage (per vehicle or season) is determined by the area under the curve. In the example in Figure 4-41, the Boeing 747-200 is causing the most damage to the surface. In Figure 4-42, the season from May 11 – Aug 31 is the critical season for the subgrade. Clicking on the Print button opens up the curve in Excel for printing or saving. The Exit button will close the curves and return you to the main design window. The Damage to Surface and Subgrade indicates the cumulative damage factor. The goal is to have 100% of the life (CDF=1.0) used up for the surface and subgrade plus or minus 1%.
63

PCASE User Manual 30 Sep 2010
Figure 4-41. Damage per Vehicle Window for Layered Elastic Design
Figure 4-42. Damage per Season Window for Layered Elastic Design
64

PCASE User Manual 30 Sep 2010
4.26 Subgrade Prep Click the Subgrade Prep button located at the bottom of the main window to display the subgrade preparation guidance from the appropriate design UFC (Figure 4-43).
Figure 4-43. Subgrade Preparation Windows
4.27 Compaction Click the Compaction button located at the bottom of the main window to display the compaction requirements from the appropriate design UFC (Figure 4-44 & 4-45). If you are performing an airfield design, once you click the compaction button, the requirements for airfields will be displayed (Figure 4-44). Select from the list at the top of the Compaction Requirements window, the agency and soil type for your design (i.e. Air Force – Cohesive Subgrade, Air Force – Cohesionless Subgrade, Army – Cohesive Subgrade, etc). A table from the UFC will display the depth required for 85, 90, 95, and 100 percent compaction in inches from the top of the pavement surface. In the example in Figure 4-44, a design for a Medium-load Airfield, Type A traffic area, would require compaction at the following depths (from the top of the surface): 100% compaction - 17 inches, 95% compaction - 31 inches, 90% compaction - 46 inches, and 85% compaction - 62 inches. If you are performing a road design, once you click the compaction button, the requirements for roads will be displayed (Figure 4-45). A table from the UFC will display the depth required for 100, 95, 90, 85, and 80 percent compaction in inches from the top of the pavement surface based on the equivalent passes of an 18,000-lb equivalent single axle load (ESAL). PCASE calculates an equivalent pass level for each design; to view the pass level scroll to the far right in the top grid of the design window (Figure 4-46). The example in Figure 4-45 and 4-46 is for a flexible road design with cohesive
65

PCASE User Manual 30 Sep 2010
soils at 20,389,000 ESALs which requires compaction at the following depths (from the top of the surface): 100% compaction - 7 inches, 95% compaction - 14 inches, 90% compaction - 19 inches, 85% compaction - 25 inches, and 80% compaction – 31 inches.
4-44. Compaction Button and Requirements for Airfield Design
4-45. Compaction Button and Requirements for Road Design
66

PCASE User Manual 30 Sep 2010
4-46. Equivalent Single Wheel Load Display
67

PCASE User Manual 30 Sep 2010
4.28 Drainage Click the Drainage button located at the bottom right of the main window to display your drainage worksheet (Figure 4-47). The button only appears if drainage is in your layer structure.
4-47. Drainage Button and Worksheet Window
68

PCASE User Manual 30 Sep 2010
4.29 Joints/Dowels Click the Joints/Dowels button located at the bottom right of the main window to display the joint spacing and dowel requirements based on the concrete thickness (Figure 4-48). The button appears only for rigid designs.
4-48. Joint and Dowel Button and Window for Rigid Design 4.30 Reports Click the Reports button in the lower right corner of the PCASE Design Module window (next to the Save and Calculate button) to obtain printable reports of your design. The data from the design and traffic modules are provided in a Microsoft® Office Excel spreadsheet. Templates have been created for you providing a summary of the data that went into your design and the results. More information is available by clicking the Data and Drainage tabs at the bottom of the spreadsheet. If you want to save the spreadsheet, it is strongly recommended that you select Save As from the File menu and rename the file; otherwise, you will overwrite the PCASE template. 4.31 English / Metric Click the English button to display your design in SI (metric) units. Click the Metric button to display your design in U.S. Customary (English) units. 4.32 Exit Click the Exit button to close the Design window.
69

PCASE User Manual 30 Sep 2010
Chapter 5. Pavement Evaluation
5.1 Identifying Sections A pavement evaluation is performed to determine the load-carrying capacity of pavements used (or to be used) for the support of aircraft or ground vehicles. The evaluation results are in terms of the allowable traffic that a pavement can sustain for given load conditions or the allowable load for a given amount of traffic without producing unexpected or uncontrolled distress. Before beginning an evaluation, it is important to divide your pavement system into manageable sections or features. Sections are based upon common characteristics: pavement type, thickness, use, traffic type, soil layers, pavement condition, and construction history. Details for identifying s for airfield pavements is available in ETL 02-19, “Airfield Pavement Evaluation Standards and Procedures” and UFC 03-260-16FA, “Airfield Pavement Condition Survey Procedures Pavements”. Details for identifying s for roadway pavements are available in UFC 03-270-08 (previously TM 5-623), “Pavement Maintenance Management”. [Note: These documents are available in the PCASE Desktop in the Help/Utilities module under .PDF Files (see Paragraph 2.9).] An example of an airfield system divided into sections is shown in Figure 5-1.
Figure 5-1. Example of Airfield System Divided into Sections
70

PCASE User Manual 30 Sep 2010
5.2 Starting the Evaluation Module After you have built a traffic pattern and have divided your pavements into sections, you are ready to open the evaluation module. To open the Evaluation module, click on the Evaluation button in the toolbar (Figure 5-2).
Figure 5-2. Opening the Evaluation Module 5.3 Create/Retrieve Section The Evaluation module window opens to the Run Properties tab. Click Create/Retrieve Section (Figure 5-3) and the Select Inventory window opens (Figure 5-4).
Figure 5-3. Evaluation Module Opening Window – Run Properties Tab
71

PCASE User Manual 30 Sep 2010
Figure 5-4. Select Inventory Window
To model the example airfield layout in Figure 5-1, inventory can be added at the branch level (Table 5-1) or at the section level (Table 5-2). Identify the section level by selecting the appropriate radio button on the Select Inventory Window.
Network Branch Section InspectionPolk AAF A03B 01 07/04/2004
A04B 01 07/04/2004 R01A 01 07/04/2004 R02C 01 07/04/2004 R03A 01 07/04/2004
Table 5-1. Sections Created at the Branch Level
Network Branch Section Inspection Polk AAF PANW A03B 07/04/2004
PASW A04B 07/04/2004 RW90 R01A 07/04/2004 RW90 R02C 07/04/2004 RW90 R03A 07/04/2004
Table 5-2. Sections Created at the Section Level
72

PCASE User Manual 30 Sep 2010
To add your inventory, click on Add under Network and type in your network name and click Done. In the example above the network name is “Polk AAF”. To create your inventory on the Section Level, as in Table 5-2, click Add under Branch and enter “PANW” (Polk Apron Northwest); click Add under Section and enter “A03B”; click Add under Inspection and enter “07/04/2004”; select the Section radio button under Section Level (Figure 5-5 shows the resulting inventory window for this example); and click Assign. To analyze an existing section (previously created) use the pull down arrows behind Network, Branch, Section, or Inspection to find the section you wish to analyze; select the appropriate choice; and click Assign.
Figure 5-5. Select Inventory for Polk AAF Example 5.4 Run Properties Once the inventory for the section has been added and assigned, your input for the section will appear on the Run Properties tab. Above the tabs on the Evaluation window the current section is identified; in this example, “A03B PANW 7/4/2004” (Figure 5-6). The remaining data to be entered on the Run Properties window applies only to the current section and is described below. Once the data is entered click on the Layer Properties tab (see Paragraph 5.5) to continue the evaluation process.
73

PCASE User Manual 30 Sep 2010
Figure 5-6. Run Properties Window Evaluation Type. Select either Airfield or Road. Traffic Area (airfields only). Select the traffic area for your evaluation. Traffic areas are defined in UFC 03-260-01, “Airfield and Heliport Planning and Design”. [Note: This document is available in the PCASE Desktop in the Help/Utilities module under .pdf Files (see Paragraph 2.9).] Analysis Type. If your analysis will be based on layer strengths using CBR or K values, select CBR/K Criteria – APE. If your analysis will be based on layer strengths using modulus values, select Layered Elastic Criteria (Modulus Values) – LEEP. Pavement Condition. Select Good, Fair or Poor based on your current pavement condition. If you select Poor (PCI<40), the note “Load Reduction in Effect” appears and the software reduces the Allowable Gross Load (AGL) automatically by 25 percent. If you select Good or Fair, then no reduction is applied to the AGL. Information on the load reduction factor is available in UFC 3-260-03, “Airfield Pavement Evaluation”, section 3. Traffic Pattern. Select the appropriate traffic pattern for your evaluation. Refer to Chapter 3, “Traffic”, for creating traffic patterns.
74

PCASE User Manual 30 Sep 2010
5.5 Layer Manager for Empirical (CBR/K) Analysis; Entering a Layer Structure The Layer Manager window allows you to create the layer structure for your evaluation. To input the layer structure, click on the tab labeled Layer Manager and click Edit under the layer grid (Figure 5-7). Enter the Layer Type (Figure 5-8), Material Type (Figure 5-9), Frost Code, Thickness, and CBR/K as described in the paragraphs below for each layer in your structure. After you have entered your layer structure click the “Save” button located under the layer grid (Figure 5-10).
Figure 5-7. Layer Manager Window for Empirical (CBR/K) Analysis Layer Type. To enter a layer type, click inside the “Layer Type” cell, click the pull down arrow, and select the layer type for each layer in your existing layer structure. Build your layer structure one layer at a time by selecting the layers from the top down in the grid (Figure 5-8). The values displayed in the pull down box, next to the layer type, indicate the default Poisson’s ratio and modulus values, respectively.
75

PCASE User Manual 30 Sep 2010
Figure 5-8. Layer Manager Window – Selecting the Layer Types Material Type. While still in the Edit mode select a “Material Type” for each layer in your structure (except for asphalt and PCC surface layers). Click inside the “Material Type” cell, click the pull down arrow, and select the material type. Identifying the material type for each layer is for the purpose of assigning equivalency factors that will be used in the evaluation. The values displayed indicate the equivalency factors for base and subbase courses, respectively. For example, in Figure 5-9 if the Unbound Crushed Stone material type is selected for the base course then every inch of base greater than the minimum required will be multiplied by two when determining the equivalent subbase. [For more information on equivalency factors refer to UFC 3-260-03, “Airfield Pavement Evaluation”.]
Figure 5-9. Layer Manager Window – Selecting the Material Types
Frost Code. Enter the frost code for each layer (F0, F1, F2, or F3); refer to UFC-260-02, Chapter 20 for definition of the frost groups. If frost is not of concern then leave the default of F0. If you are performing a pavement evaluation for frost conditions, you will also need to input a Depth of Frost on the Edit Settings Tab (see Paragraph 5.8). Information for calculating a depth of frost is available in Paragraph 4.11 of this manual. Thick. Enter the thickness of each layer (except Natural Subgrade).
76

PCASE User Manual 30 Sep 2010
CBR/K. Enter the CBR or K value for each layer (except for asphalt and PCC surface layers). Flexural Strength (for PCC pavements only). Enter the flexural strength of your concrete.
Figure 5-10. Layer Manager Window – Saving Layer Information 5.6 Layer Properties for Empirical (CBR/K) Analysis; Importing Layers from Dynamic Cone Penetrometer (DCP) The Dynamic Cone Penetrometer (DCP) device is used in the field to measure blows and penetrations. The DCP module is a software tool for analyzing the field DCP data; providing a resultant pavement structure with layer thicknesses and strengths. Chapter 6 of this manual provides instructions for using the DCP module. The pavement structure created in the DCP module can be imported in the Evaluation module, eliminating the need to recreate the structure. If you used the DCP module to analyze your DCP data the software will notify you that you have DCP data available for the section you are evaluating. Be sure on the Run Properties tab that you have selected CBR/K Criteria – APE for the analysis type. When you click on the Layer Manager tab the message shown in Figure 5-11 appears.
77

PCASE User Manual 30 Sep 2010
Click Use DCP Layers and the layers created in the DCP module are imported into the layer grid of the Evaluation module.
Figure 5-11. Layer Manager Window – Using Imported DCP Data
5.7 Layer Manager for Layered Elastic Analysis; Entering a Layer Structure The Layer Manager window allows you to create the layer structure for your evaluation. To input the layer structure, click Edit under the layer grid (Figure 5-12). Enter the Layer Type (Figure 5-13), Frost Code, Thickness, Flexural Strength (for PCC pavements only), and select the Backcalculation E and Analysis E methods (Figure 5-14) as described in the paragraphs below for each layer in your structure. After you have entered your layer structure click the “Save” button located under the layer grid (Figure 5-15).
78

PCASE User Manual 30 Sep 2010
Figure 5-12. Layer Manager Window for Layered Elastic Analysis
Layer Type. To enter a layer type, click inside the “Layer Type” cell, click the pull down arrow, and select the layer type for each layer in your existing layer structure. Build your layer structure one layer at a time by selecting the layers from the top down in the grid (Figure 5-13). The values displayed in the pull down box, next to the layer type, indicate the default Poisson’s ratio and modulus values, respectively.
Figure 5-13. Layer Manager Window – Selecting the Layer Types
79

PCASE User Manual 30 Sep 2010
Frost Code. Enter the frost code for each layer (F0, F1, F2, or F3). If frost is not of concern then leave the default of F0. If you are performing a pavement evaluation for frost conditions, you will also need to input a Depth of Frost on the Edit Settings Tab (see Paragraph 5.8). Information for calculating a depth of frost is available in Paragraph 4.11 of this manual. Thick. Enter the thickness of each layer (except Natural Subgrade). Flexural Strength (for PCC pavements only). Enter the flexural strength of your concrete. Backcalc E and Analysis E. The Backcalc E options (which are the same as the Analysis E options in Figure 5-14) are for setting the method for backcalculating modulus values. Backcalc E is used only when importing NDT data (see Chapter 7). Leave the default, Wesdef, if you are not backcalculating values. The Analysis E options in Figure 5-14 are for setting the analysis method for calculating the pavement strength. The options are described below.
Figure 5-14. Analysis E Options
80

PCASE User Manual 30 Sep 2010
Temp. The Temp option is only used if the layer type is set to asphalt and NDT data is available. In the Backcalc E option, the Temp refers to the temperature at time of NDT testing and sets asphalt modulus based on previous 5 day mean temperature (see Chapter 8) for backcalulating other layers. The temp option should be considered in the Backcalculate E option if the asphalt thickness is less than 4.0 inches or the backcalculated values are outside the acceptable range of asphalt modulus. In the Analysis E option, the temp refers to the design pavement temperature (Operational Climate Data Summary – see Chapter 8) and sets the design modulus for the asphalt layer.
Manual. If you select manual you will need to go to the Edit Settings Tab to input your value (value based on layer material type). The manual option may be selected in the Backcalc E if backcalculated modulus values fall significantly outside the range for that layer type. In the Analysis E option, if the layer type is PCC, the selection should always be set to Manual (Army and Navy use modulus values of 5,000,000 psi and 4,000,000 psi, respectively). Typically the Manual option is not selected for the subsurface layers in the Backcalc or Analysis E options.
Wesdef. The Wesdef option is the default setting for both the Backcalculate E and Analysis E option. When using NDT data, the first trial should always be set to the Wesdef option for the Backcalculate E.
En+1. The En+1 option for the base (or subbase) layer should only used when unrealistic values are backcalculated for granular layers. This option is based on a study of unbound granular base and subbase course material. The method is presented in Technical Report S-75-17, “Development of a Structural Design Procedure for Flexible Airport Pavements”, Appendix G, 1975. This option is typically used when the backcalculated base modulus is significantly lower than the backcalculated subbase or subgrade modulus values.
Flex. The Flex option only appears when the surface layer type is set to PCC. This value is determined either from construction history records or in-situ field tests (portable seismic pavement analyzer). For airfield PCC pavements, a value of 650 psi is common, if unknown.
81

PCASE User Manual 30 Sep 2010
Figure 5-15. Layer Manager Window – Saving Layer Information
5.8 Edit Settings In the Evaluation module you have the option of changing various settings. When you click on the Edit Settings tab it opens to the Backcalculation window (Figure 5-16a). To edit settings for analysis click on the Analysis radio button (Figure 5-16b). Descriptions for editing options are given below.
82

PCASE User Manual 30 Sep 2010
Figure 5-16a. Edit Settings for Backcalculation
Backcalculation Settings. The Backcalculation Settings screen defines the properties used during Backcalculation of NDT data. Default values for Maximum Iterations, Deflection Tolerance, Modulus Tolerance and Load Frequency should never be changed. The table shown in the screen identifies the layer type and default engineering properties for that layer type. The Min Strength and Max Strength values are estimated and may be modified slightly. The check box to Stay in Limits uses the defined ranges in the table. If you are hitting limits in the Backcalculation, this box can be unchecked to determine where the limits are trying to go, and the ranges in the table may be modified as such. The temperature calculation settings are based on an FWD loading frequency of 20 Hz and the temperature at time of testing, generally imported from the FWD file.
83
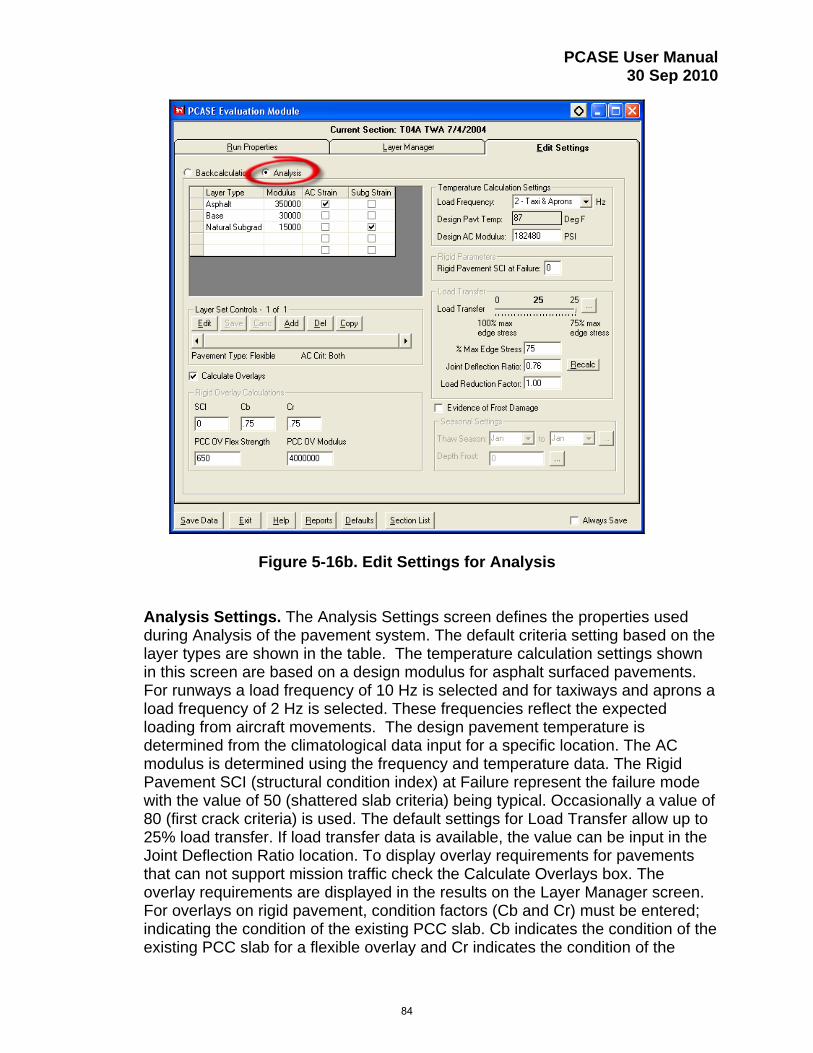
PCASE User Manual 30 Sep 2010
Figure 5-16b. Edit Settings for Analysis
Analysis Settings. The Analysis Settings screen defines the properties used during Analysis of the pavement system. The default criteria setting based on the layer types are shown in the table. The temperature calculation settings shown in this screen are based on a design modulus for asphalt surfaced pavements. For runways a load frequency of 10 Hz is selected and for taxiways and aprons a load frequency of 2 Hz is selected. These frequencies reflect the expected loading from aircraft movements. The design pavement temperature is determined from the climatological data input for a specific location. The AC modulus is determined using the frequency and temperature data. The Rigid Pavement SCI (structural condition index) at Failure represent the failure mode with the value of 50 (shattered slab criteria) being typical. Occasionally a value of 80 (first crack criteria) is used. The default settings for Load Transfer allow up to 25% load transfer. If load transfer data is available, the value can be input in the Joint Deflection Ratio location. To display overlay requirements for pavements that can not support mission traffic check the Calculate Overlays box. The overlay requirements are displayed in the results on the Layer Manager screen. For overlays on rigid pavement, condition factors (Cb and Cr) must be entered; indicating the condition of the existing PCC slab. Cb indicates the condition of the existing PCC slab for a flexible overlay and Cr indicates the condition of the
84

PCASE User Manual 30 Sep 2010
existing PCC slab for a PCC overlay. A condition factor calculator is available in the “HELP / UTILITIES” tab in the main desktop window. To use the calculator you must know the Pavement Condition Index (PCI) and the percent distress due to load. PCI and percent load damage information can be obtained from MicroPAVER data. More information on condition factors is available in UFC 03-260-02, Airfield Design Manual, Chapter 17, Overlay Pavement Design. The PCC OV (overlay) Flex Strength and Modulus values are strengths are used to calculate the PCC overlays and are set at a default of 650psi and 4,000,000psi, respectively. If the existing pavement exhibits distresses due to frost damage (typically in northern regions), check the box for Evidence of Frost Damage; indicate the Thaw Season by using the pull down options; and input the depth of frost (if known) or calculate the depth of frost by clicking the “…” (dot-dot-dot) button. On the Layer Manager screen, after you Run Analysis, results will be displayed for both the normal and thaw seasons. Note: thaw seasons will only be calculated if there is a frost susceptible subgrade indicated in the layer structure.
85

PCASE User Manual 30 Sep 2010
5.9 Run Analysis Whether you manually inputted your layer structure (Paragraph 5.5 for empirical and Paragraph 5.7 for layered elastic) or imported the layer structure from the DCP module (Paragraph 5.6), you are now ready to run the analysis. Click Run Analysis in the middle of the window and your results will be displayed on the grid at the bottom (Figure 5-17). Results are described in Paragraph 5.10.
Figure 5-17. Run Analysis and Evaluation Results
86

PCASE User Manual 30 Sep 2010
5.10 Evaluation Results In Figures 5-18a and 5-18b the evaluation results are identified by number and described in detail below.
Figure 5-18a. Evaluation Results
Figure 5-18b. Evaluation Results
1. Passes. The number of required vehicles passes. The pass level comes from the traffic pattern created in the Traffic module (Chapter 3) and selected on the “Run Properties” tab (Paragraph 5.4). In the Traffic module if you selected “mixed” analysis the pass level is the equivalent passes for the controlling vehicle as displayed on the Show Mixed Traffic screen (paragraph 3.10).
2. ACN (calculated for airfields only). The calculated ACN (Aircraft Classification
Number) value as described in Paragraph 5.11. 3. PCN (calculated for airfields only). The calculated PCN (Pavement
Classification Number) value as described in Paragraph 5.11.
87

PCASE User Manual 30 Sep 2010
4. Allowable Load in Kips (1,000 Pounds). Indicates the maximum load your
pavement can support if all the required passes are applied. In the example in Figure 5-18, a mission required 401,924 passes of a C-17 aircraft at 585,000 pounds. The analysis indicates that the pavement will not support the full load at 401,924 passes but could support the passes at a reduced allowable load of 346.9 kips (346,900 pounds).
5. Allowable Passes. Indicates the maximum passes your pavement can
support if the full load of the vehicle is applied. In the example in Figure 5-18, a mission required 401,924 passes of a C-17 aircraft at 585,000 pounds. The analysis indicates that the pavement will not support the full load at 401,924 passes but could support a fully loaded (585,000 pound) C-17 at a reduced pass level of 8,882 passes.
6. Overlays – If your existing pavement is not capable of supporting the
required traffic, overlays will be calculated and displayed (AC – asphalt overlay, PCCNB – PCC overlay unbonded, PCCPB – PCC overlay partially bonded). If your existing pavement is asphalt only the AC overlay will be calculated. The thickness of the overlay is dependent on the condition of the existing surface (condition factor – Cb and Cr). The default condition factors are set at 0.75 but can be changed in the Edit Settings tab for Analysis (see Paragraph 5.8).
7. ACN/PCN Ratio (for airfields only). Displays the ACN divided by the PCN and
the resultant color code described in Paragraph 5.11. 8. Current Vehicle. Displays the controlling vehicle used in the evaluation. The
controlling vehicle comes from the traffic pattern created in the Traffic module (Chapter 3) and selected on the “Run Properties” tab (Paragraph 5.4). In the Traffic module if you selected “mixed” analysis the controlling vehicle is displayed on the Show Mixed Traffic screen (paragraph 3.9).
9. NOTE. A note will be displayed with an AC overlay indicating that even
though your pavement might not need an overlay for structural purposes it may need an overlay to meet minimum thickness requirements.
5.11 ACN/PCN Procedure (for airfields only) According to UFC 3-260-03, “Airfield Pavement Evaluation”:
The Aircraft Classification Number (ACN) is a number that expresses the relative structural effect of an aircraft on different pavement types for specified standard subgrade strengths in terms of a standard single-wheel load. ACN values will normally be provided by the aircraft manufacturers. The ACN has been
88

PCASE User Manual 30 Sep 2010
developed for two types of pavements, flexible and rigid, and for four levels of subgrade strength. The Pavement Classification Number (PCN) is a number that expresses the relative load-carrying capacity of a pavement in terms of a standard single-wheel load. The system is structured so that a pavement with a particular PCN value can support, without weight restrictions, an aircraft that has an ACN value equal to or less than the pavement’s PCN value. The PCN numerical value for a particular pavement is determined from the allowable load carrying capacity of the pavement. Once the allowable load is established, the determination of the PCN value is a process of converting that load to a standard relative value. The allowable load to use for Army, Navy, and Marine Corps evaluations is the maximum allowable load of the most critical aircraft that can use the pavement for the number of equivalent passes expected to be applied for the remaining life. The allowable load to use for Air Force evaluations is to be based on 50,000 passes of the C-17 aircraft. The PCN value is for reporting pavement strength only. The PCN value expresses the results of pavement evaluation in relative terms and cannot be used for pavement design or as a substitute for evaluation.
In PCASE the ACN and PCN are calculated based on your input for the section. ACN is based on aircraft type, load, and the subgrade strength and PCN is based on the layer structure. Based on the ACN and PCN a ratio is determined (#7 in Figure 5-18a) and displayed as red, yellow, or green, as defined in Figure 5-19. As an example, if the ACN of the mission aircraft is 45 and the PCN of the pavement being evaluated is 55, the ACN/PCN ratio is 0.82. This ratio is less than 1.0, therefore the evaluation is “green” or full aircraft operations are allowable.
Figure 5-19. Color code limits for ACN/PCN
89

PCASE User Manual 30 Sep 2010
5.12 Other Evaluation Tools Multi-File Import. On the Run Properties window, click the Multi-File Import button (Figure 5-20) to create a set of sections based on Falling Weight Deflectometer (FWD) or Heavy Weight Deflectometer (HWD) data files. See Chapter 7 for more information on FWD and HWD data files.
Figure 5-20. Multi-File Import
Rigid Criteria – First Crack versus Shattered Slab (Figure 5-21). There are two evaluation criteria for plain concrete pavements in the empirical model (APE): First Crack and Shattered Slab. First Crack is based upon criteria where 50 percent of the slabs are cracked into two or three pieces at the end of traffic. Shattered slab is based where 50 percent of the slabs are cracked into six pieces at the end of traffic. Army evaluations are to be reported for both criteria. Air Force evaluations are to be reported using the Shattered Slab criteria.
90

PCASE User Manual 30 Sep 2010
Figure 5-21. Rigid Criteria Option Save Data. Click the Save Data button at the bottom of the window to save your data for this section. Exit. Click the Exit button at the bottom of the window to exit the evaluation module. Help. Click the Help button at the bottom of the window to open the evaluation module help file.
91

PCASE User Manual 30 Sep 2010
Reports. Click the Reports button at the bottom of the window (Figure 5-22) to open the Evaluation Report module to obtain printable reports of your design. The data is provided in a Microsoft® Office Excel spreadsheet. You can create section level reports for a variety of data sets. Templates have been created for you providing a summary of the data that went into your evaluation. If you want to save the spreadsheet, it is strongly recommended that you select Save As from the File menu and rename the file; otherwise, you will overwrite the template.
Figure 5-22. Evaluation Reports Module Defaults. Click the Defaults button at the bottom of the window to set defaults for various options in the evaluation module. For example, the Evaluation module uses the layered elastic criteria by default, but if you select CBR criteria in the Defaults window then the module will open using the CBR criteria. Section List. Click the Section List button at the bottom of the window to display all the sections created in the current project file. Always Save. Check the Always Save box to have your changes automatically save. If the Always Save check box is not checked a dialog box will pop up asking if you want to save your changes every time you exit the section. If this check box is selected the box will not appear and changes will be saved automatically. [Note: Checking the Always Save box is recommended.]
92

PCASE User Manual 30 Sep 2010
Chapter 6. Dynamic Cone Penetrometer (DCP) Module
The Dynamic Cone Penetrometer (DCP) device is used in the field to measure blows and penetrations. The DCP module is a software tool for analyzing the field DCP data; providing a resultant pavement structure with layer thicknesses and strengths. 6.1 Starting the DCP Module To open the DCP module, click on the DCP button in the toolbar (Figure 6-1).
Figure 6-1. Opening the DCP Module
93

PCASE User Manual 30 Sep 2010
6.2 Create/Retrieve Section The DCP module window opens to the Data Entry tab. Click Create/Retrieve Section (Figure 6-2) and the Select Inventory window opens (Figure 6-3). Refer to Chapter 5, Paragraph 5.3 for creating or selecting inventory.
Figure 6-2. DCP Module – Data Entry Tab .
Figure 6-3. Select Inventory Window
94

PCASE User Manual 30 Sep 2010
6.3 DCP Data Toolbox Before you begin entering your data, use the Toolbox (Figure 6-4) to make any changes to your settings; be sure to click Apply to save your toolbox changes. Toolbox options are described below.
Figure 6-4. Data Entry Toolbox
CBR / K / Modulus. Strength correlations available for determining the layer strength: CBR, K, and Modulus. In Units. Units used for measuring and inputting Penetration depths. Options are either SI (International System of Units – Metric) or English units. Out Units. Units used for displaying the depth of correlated soil strength. The units selected here will also be used on the DCP plot (Paragraph 6.5). Options are either English or SI (International System of Units – Metric) units.
95

PCASE User Manual 30 Sep 2010
Hammer. The type of DCP hammer used in the field. Hammer type used usually depends on the soil strength. Options in PCASE are either the 17.6 pound or 10.1 pound hammer. Correlation. Soil correlations available for determining the layer strength: All Soils, Heavy Clay, or Lean Clay. Generally this is left on “All Soils”, but if you know the soil type is heavy or lean clay, change the correlation.
6.4 Entering DCP Data To begin entering DCP data, click Edit under the entry grid (Figure 6-5), and type in the Blows and Penetrations (collected from your field tests) in the appropriate column. The remaining columns (Hammer, Correlation, CBR, and Depth) are filled in automatically as the data is entered. The hammer and correlation columns correspond to the settings in the toolbox (Paragraph 6.3). Once you have entered all the field data, click Save (Figure 6-6).
Figure 6-5. DCP Module – Data Entry
96
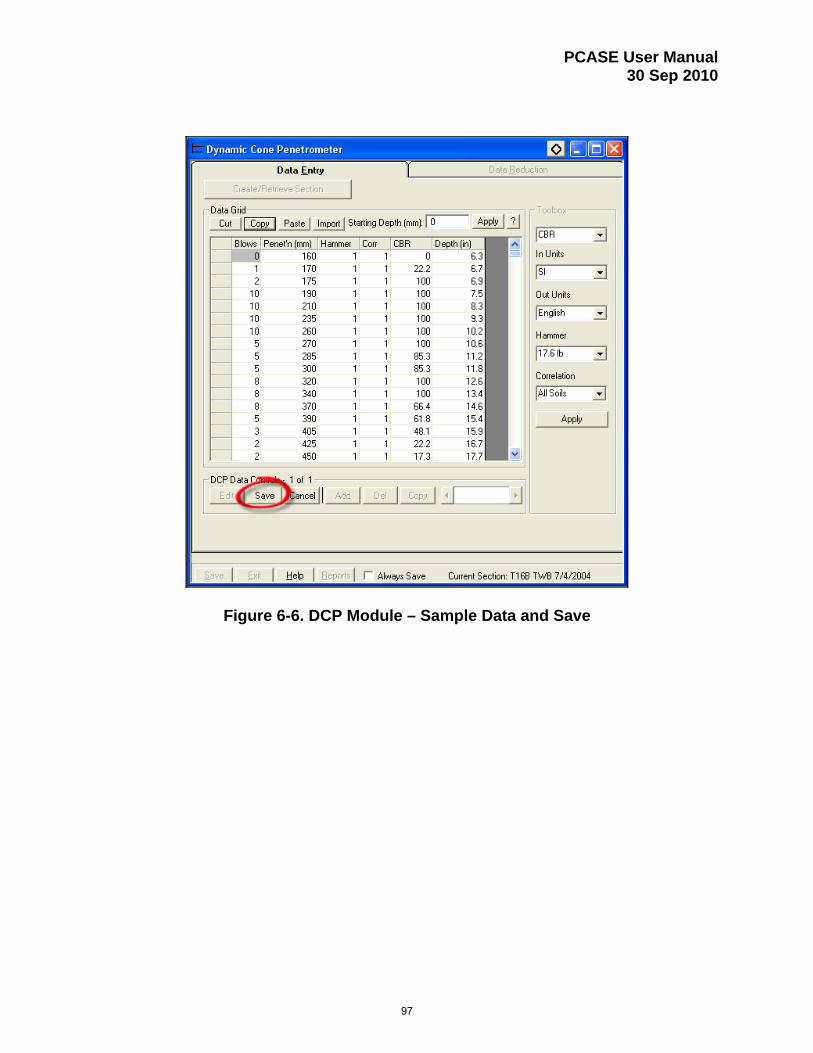
PCASE User Manual 30 Sep 2010
Figure 6-6. DCP Module – Sample Data and Save
97
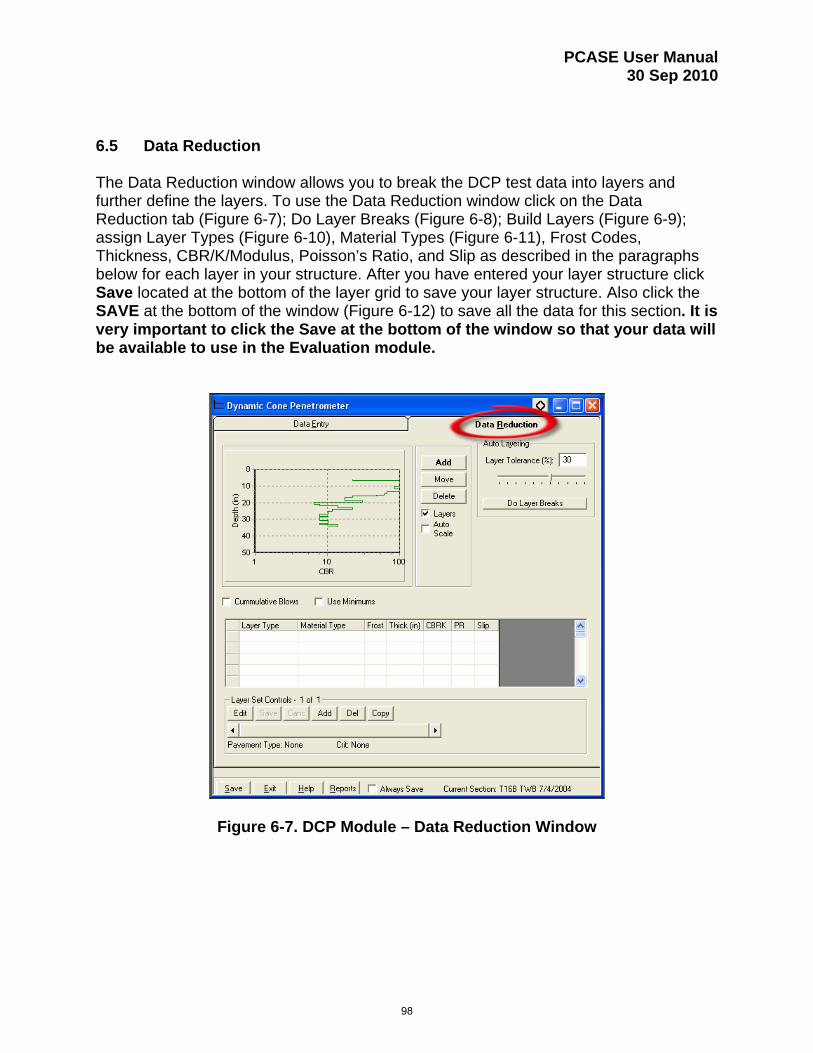
PCASE User Manual 30 Sep 2010
6.5 Data Reduction The Data Reduction window allows you to break the DCP test data into layers and further define the layers. To use the Data Reduction window click on the Data Reduction tab (Figure 6-7); Do Layer Breaks (Figure 6-8); Build Layers (Figure 6-9); assign Layer Types (Figure 6-10), Material Types (Figure 6-11), Frost Codes, Thickness, CBR/K/Modulus, Poisson’s Ratio, and Slip as described in the paragraphs below for each layer in your structure. After you have entered your layer structure click Save located at the bottom of the layer grid to save your layer structure. Also click the SAVE at the bottom of the window (Figure 6-12) to save all the data for this section. It is very important to click the Save at the bottom of the window so that your data will be available to use in the Evaluation module.
Figure 6-7. DCP Module – Data Reduction Window
98

PCASE User Manual 30 Sep 2010
Do Layer Breaks. Click Do Layer Breaks (Figure 6-8) to automatically break your DCP plot into layers based on the Layer Tolerance set in the Auto Layering. This algorithm computes a running average of the CBR data and when the average changes to a value greater that the “Layer Tolerance” then the software interprets that as a layer interface.
Figure 6-8. DCP Module – Auto Layering
99

PCASE User Manual 30 Sep 2010
Building Layers Manually. Click the Add, Move, and Delete buttons to build the layer structure by hand. With the Add button selected click on the graph and a layer interface will be created wherever you clicked on the graph. With the Move button selected, click and drag an existing layer interface to a new position. With the Delete button selected you can eliminate a layer by clicking on the line to delete. As you build layers by interacting with the plot, the grid automatically displays the defined layers with the calculated thickness and CBR/K for each layer (Figure 6-9).
Figure 6-9. DCP Module – Building Layers
100

PCASE User Manual 30 Sep 2010
Assigning Layers. To finish the layer structure, click Edit under the layer grid, click on the “Unassigned” cells, click on the pull down arrow, and select the layer type for each layer in the existing layer structure (Figure 6-10).
Figure 6-10. DCP Module – Assigning Layers
101

PCASE User Manual 30 Sep 2010
Material Type. While still in the Edit mode select a “Material Type” for each layer in your structure (except for asphalt and PCC surface layers). Click inside the “Material Type” cell, click the pull down arrow, and select the material type. Identifying the material type for each layer is for the purpose of assigning equivalency factors that will be used in the evaluation. The values displayed indicate the equivalency factors for base and subbase courses, respectively. For example, in Figure 6-11 if the Unbound Crushed Stone material type is selected for the base course then every inch of base greater than the minimum required will be multiplied by two when determining the equivalent subbase. [For more information on equivalency factors refer to UFC 3-260-03, “Airfield Pavement Evaluation”.]
Figure 6-11. Figure 6-9. DCP Module – Assigning Material Types
Frost Code. Enter the frost code for each layer (F0, F1, F2, or F3). If frost is not of concern then leave the default of F0. Information for calculating a depth of frost is available in Paragraph 4.11 of this manual. Thick. Calculated thickness of the layer based on your data reduction.
102

PCASE User Manual 30 Sep 2010
CBR/K/Modulus. Calculated layer strength based on your data reduction.
Poisson’s Ratio. Defaults are set at 0.35 for the asphalt, base, and drainage layers, and 0.40 for the subgrade. Because of the complexity of laboratory procedures involved in the direct determination of Poisson’s ratio for pavement materials, and because of the relatively minor influence on pavement design, use of the defaults is recommended.
Slip. Slip refers to the interface value between layers. Slip should be set at 1 for complete adhesion between the layers or 1,000 for almost frictionless slip between the layers. Values between 1 and 1,000 may be input to simulate varying degrees of friction. Almost frictionless slip is usually assumed at the bottom of a PCC layer and full adhesion is generally assumed for most other pavement materials.
Save. After you have entered your layer structure click Save located at the bottom of the layer grid to save your layer structure. Also click the SAVE at the bottom of the window (Figure 6-12) to save all the data for this section. It is very important to click the Save at the bottom of the window so that your data will be available to use in the Evaluation module.
Figure 6-12. DCP Module – Save Data
103

PCASE User Manual 30 Sep 2010
Chapter 7. Non-Destructive Testing (NDT)
The NDT (Non-Destructive Testing) module is a tool for importing falling weight deflectometer (FWD) or heavy weight deflectometer (HWD) data. Once the data is imported you can use various charts in the NDT module to view the data, define section boundaries, and assign the data for backcalculation. Backcalculating modulus values are performed in the Evaluation module as described in Chapter 5, Evaluation. 7.1 Starting the NDT Module To open the NDT module, click on the NDT Data button in the toolbar (Figure 7-1).
Figure 7-1. Opening the NDT Module
7.2 Importing NDT Data With the NDT Module window open, click the Import button (Figure 7-2) to import the FWD or HWD file created from the falling weight software (PCASE currently imports only data in ASCII format). On the Select File to Import dialog window (Figure 7-3) select the files to Import and click Open. [Note: You can import multiple files by using the Microsoft® standard CTRL or SHIFT keys when selecting multiple files.]
104
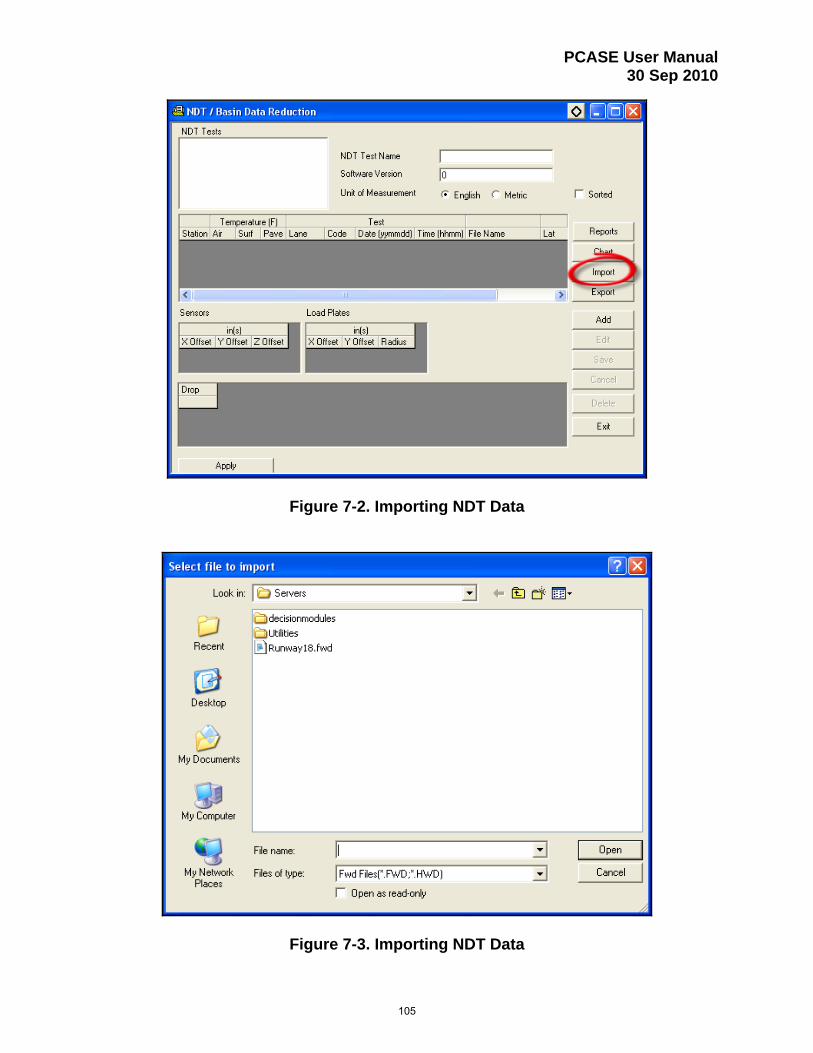
PCASE User Manual 30 Sep 2010
Figure 7-2. Importing NDT Data
Figure 7-3. Importing NDT Data
105

PCASE User Manual 30 Sep 2010
7.3 Viewing NDT Data The imported FWD or HWD file is displayed in the numbered NDT window grids (Figure 7-4). The numbered grids and button options are described below.
Figure 7-4. Viewing NDT Data Grid Information:
1. NDT Tests. Displays the files imported, and any sections created from the Chart window (see Paragraph 7.4).
2. Station Listing. Displays all the stations from the FWD/HWD file and station
specific information such as temperatures and time stamps. 3. Sensors. Displays the sensor setup from the FWD file. 4. Load Plates. Displays the load plate setup from the FWD file.
106

PCASE User Manual 30 Sep 2010
5. Drops. Displays the drops for the station selected in the station grid.
Button Options:
Reports. Provides ability to print FWD/HWD data in an Excel spreadsheet. Chart. Charts the FWD/HWD data (see Paragraph 7.4). Export. Exports the NDT data to an Excel spreadsheet. Add, Edit, and Delete. Provides ability to manually add, edit, and delete the imported data.
7.4 Charting NDT Data The most powerful feature of the NDT module is the ability to chart the FWD/HWD data. Once data has been imported, click the Chart button (Figure 7-5) and the charting tool will open to the default Impulse Strength Modulus (ISM) or “Stiffness” chart, using the first imported file (Figure 7-6). Features of the Chart window are described below.
Figure 7-5. Charting NDT Data1
107

PCASE User Manual 30 Sep 2010
Figure 7-6. NDT Chart Window for Stiffness2 Grid information: NDT Tests. The grid for NDT Tests displays the list of files imported from the previous screen. Check the box(es) in front of the test(s) to select the test(s) to chart. Dates. Each FWD/HWD file may have multiple dates. Check the box(es) in front of the date(s) to select the date(s) to chart. Lanes. Each FWD/HWD file may have multiple lanes. Check the box(es) in front of the lane(s) to select the lane(s) to chart. Codes. Each FWD/HWD file may have multiple user defined codes. Check the box(es) in front of the code(s) to select the code(s) to chart. Drops. Each station may have multiple drops. Check the box(es) in front of the drops to select the drops to chart.
108
PCASE User Manual 30 Sep 2010
Chart Options. The grid in the upper right corner displays a list of the chart options available:
Area. Displays the area under the deflection basin as a function of the X or Y coordinate. Basin. Plots the deflection basin for any selected point(s). See button options below for instructions on selecting points. Deflection Ratio. Plots the deflection ratio between two selected sensors. Displacement. Charts the displacement (deflection) readings for the selected sensor. Estimated Subgrade Modulus. Estimates the subgrade modulus based on the 72 inch sensor displacement. Joint Load Reduction Factor. Displays the load reduction factor between two selected sensors. Load. Plots the measured load for each drop at each station. Load-Displacements. Plots the Load versus Displacement for any selected point(s). See button options below for instructions on selecting points. Temperature. Plots the air, surface, or pavement temperatures for the stations. Volumetric K. Plots the volumetric K as a function of the X or Y coordinate.
Button options. Buttons on the bottom of the NDT Chart Window:
Select All. To select all the points in the chart, click Select All. Clear All. To unselect all the previously selected points, click Clear All. Select Range On. To select a “Range” of points, click Select Range On and pick the beginning and ending points in the chart area. Select Points On. To select individual points, click Select Points On and click on the individual points. Assign to Section. See Paragraph 7.5. Statistics. To view the average, standard deviation, and co-efficient of variation for all and selected points in the chart; click on Statistics. Exit. Exits the NDT module.
109
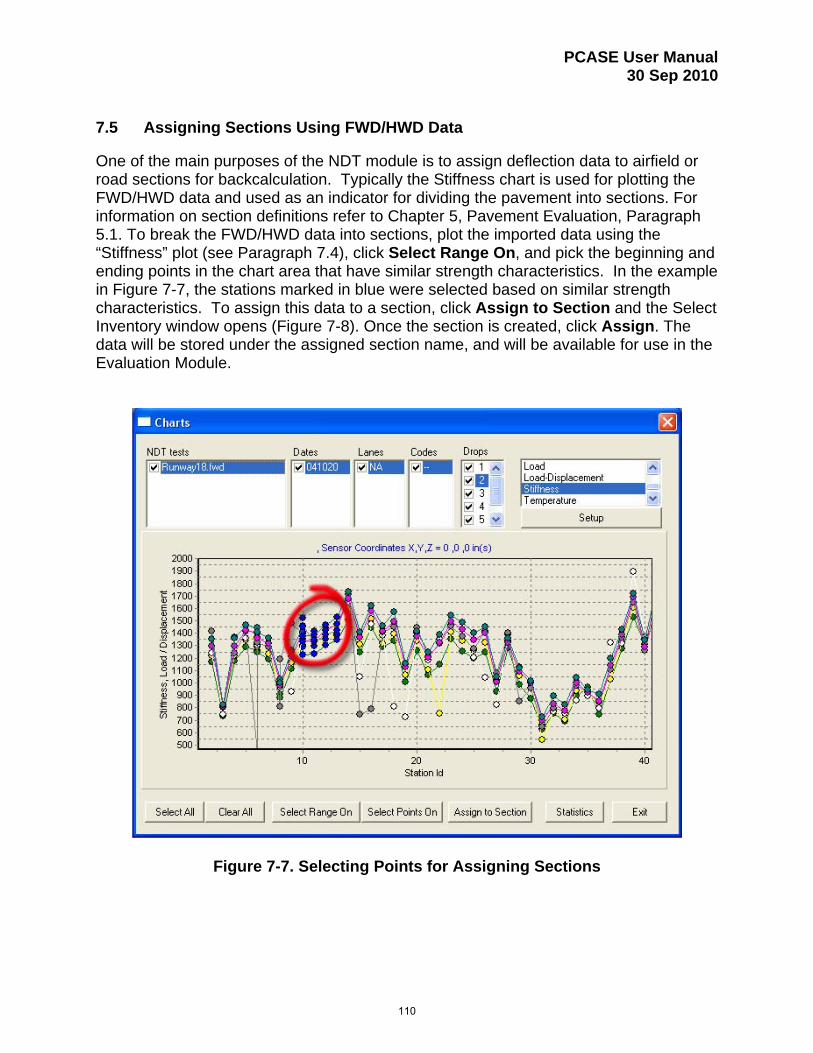
PCASE User Manual 30 Sep 2010
7.5 Assigning Sections Using FWD/HWD Data One of the main purposes of the NDT module is to assign deflection data to airfield or road sections for backcalculation. Typically the Stiffness chart is used for plotting the FWD/HWD data and used as an indicator for dividing the pavement into sections. For information on section definitions refer to Chapter 5, Pavement Evaluation, Paragraph 5.1. To break the FWD/HWD data into sections, plot the imported data using the “Stiffness” plot (see Paragraph 7.4), click Select Range On, and pick the beginning and ending points in the chart area that have similar strength characteristics. In the example in Figure 7-7, the stations marked in blue were selected based on similar strength characteristics. To assign this data to a section, click Assign to Section and the Select Inventory window opens (Figure 7-8). Once the section is created, click Assign. The data will be stored under the assigned section name, and will be available for use in the Evaluation Module.
Figure 7-7. Selecting Points for Assigning Sections
110
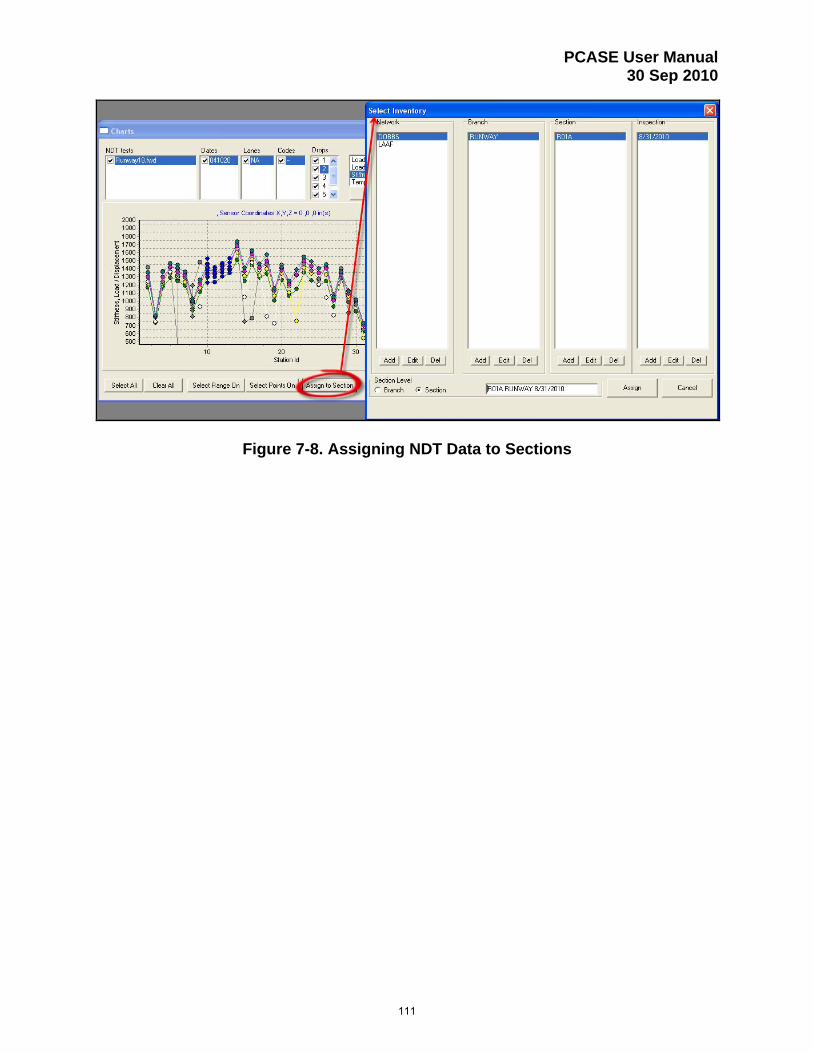
PCASE User Manual 30 Sep 2010
Figure 7-8. Assigning NDT Data to Sections
111

PCASE User Manual 30 Sep 2010
Chapter 8. Climate
The five-day temperature mean is used in evaluation (Chapter 5) to determine the asphalt modulus, when it is based on temperature. The Climate module is a tool for calculating the five-day mean based on the temperature data collected during Non-Destructive Testing (NDT).
8.1 Starting the Climate Module To open the Climate module, click on the Climate button in the toolbar (Figure 8-1).
Figure 8-1. Opening the Climate Module 8.2 Using the Climate Module to Calculate the Five Day Mean With the Climate module window open (Figure 8-2), click the on the date(s) in the calendar that the falling weight deflectometer (FWD) or heavy weight deflectometer (HWD) data was collected; click Edit under the temperature grid; and enter the high and low temperatures for the previous five days; and click Save. The resulting five day mean will be calculated and displayed in the box under the temperature grid.
112

PCASE User Manual 30 Sep 2010
Figure 8-2. Climate Module – 5 Day Mean Window
8.3 Operational Climatic Data Summary The Operational Climatic Data Summary (Figure 8-3) can be edited by clicking on the Edit button under the climate temperature grid. Once the Save button is clicked the Hottest Month, Design Air Temperature, and Design Pavement Temperature data will be updated.
Figure 8-3. Operational Climatic Data Summary
113

PCASE User Manual 30 Sep 2010
Chapter 9. Vehicle Edit
Vehicle Edit module is capable of creating vehicles not available in the database or editing an existing vehicle (i.e. load, gear configuration, tire pressure, contact area, tire shape, and analysis points). The module also provides Aircraft Classification Numbers (ACN) and vehicle characteristics.
9.1 Starting the Vehicle Edit Module To open the Vehicle Edit module, click on the Vehicle Edit button in the toolbar (Figure 9-1).
Figure 9-1. Opening the Vehicle Edit Module 9.2 Editing the Standard Load of an Existing Vehicle To edit an existing vehicle pull down the list of vehicles and select the vehicle to edit (Figure 9-2). Click Edit at the bottom of the screen (Figure 9-3). In the edit mode you can only change the standard load on an existing vehicle in the database, as indicated in the pop-up message (Figure 9-3). Click in the cell for Standard Load, type in the new load, and click Save (Figure 9-4). A message will pop up indicating that any changes to the vehicle will not appear until the PCASE desktop has been closed and reopened (Figure 9-5). If you change the standard load in Vehicle Edit it will permanently change the load for that vehicle. [Note: to edit other features of the vehicle you need to copy and rename the vehicle as described in Paragraph 9.3.]
114
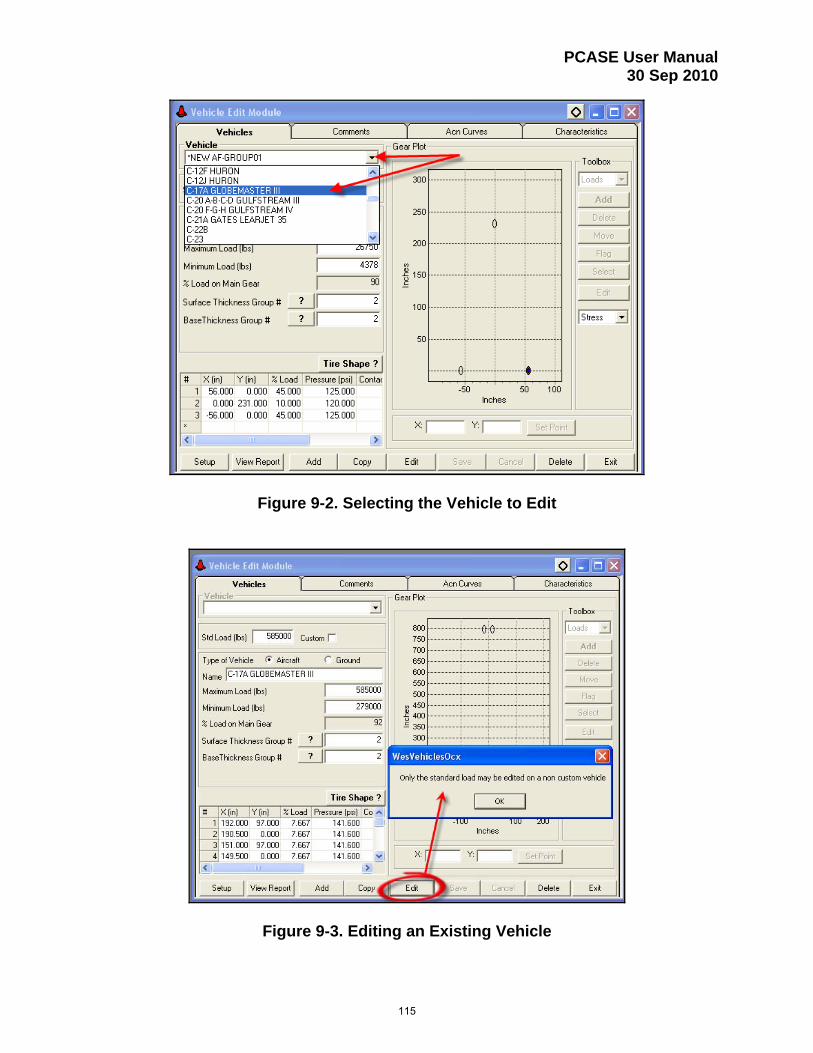
PCASE User Manual 30 Sep 2010
Figure 9-2. Selecting the Vehicle to Edit
Figure 9-3. Editing an Existing Vehicle
115

PCASE User Manual 30 Sep 2010
Figure 9-4. Editing Standard Load of an Existing Vehicle
Figure 9-5. Editing a Vehicle
116

PCASE User Manual 30 Sep 2010
9.3 Copying and Editing an Existing Vehicle To be able to edit all features of an existing vehicle pull down the list of vehicles and select the vehicle to edit (Figure 9-2). Click Copy at the bottom of the screen and enter a new vehicle name (Figure 9-6). Once your new vehicle appears in the window, click Edit at the bottom of the screen. All fields (see Paragraph 9.5 for descriptions) are now active, make changes as needed and click Save (Figure 9-4). Any changes to the vehicle will not appear until the PCASE desktop has been closed and reopened (Figure 9-5).
Figure 9-6. Copying and Editing an Existing Vehicle
117

PCASE User Manual 30 Sep 2010
9.4 Creating a New Vehicle To create a new vehicle you will need the vehicle information identified in Table 9-1 and described in Paragraph 9.5. This information is typically obtained from the manufacturer. Once you have the information click Add at the bottom of the screen, fill in all applicable fields, and click Save. [Note: the standard load (pounds) must be entered first.] When you click Save the vehicle configuration will appear on the graph on the right side of the window. The red ovals indicate the wheels, and the blue dots indicate the analysis points. Paragraph 9.6 describes the graph and toolbox for editing the analysis points. The new vehicle will not appear in Traffic or Vehicle Edit until the PCASE desktop has been closed and reopened.
Table 9-1. Information Needed for Creating a Vehicle
Name of Vehicle
Standard Load (lbs)
Maximum Load (lbs)
Minimum Load (lbs)
Surface Thickness Group #
Base Thickness Group #
Tire
Number X-coordinate
(in) Y-coordinate
(in) Percent of
Load Tire Pressure
(psi) Contact
Area (in2) Tire
Shape
1
2
3
4
Etc.
118
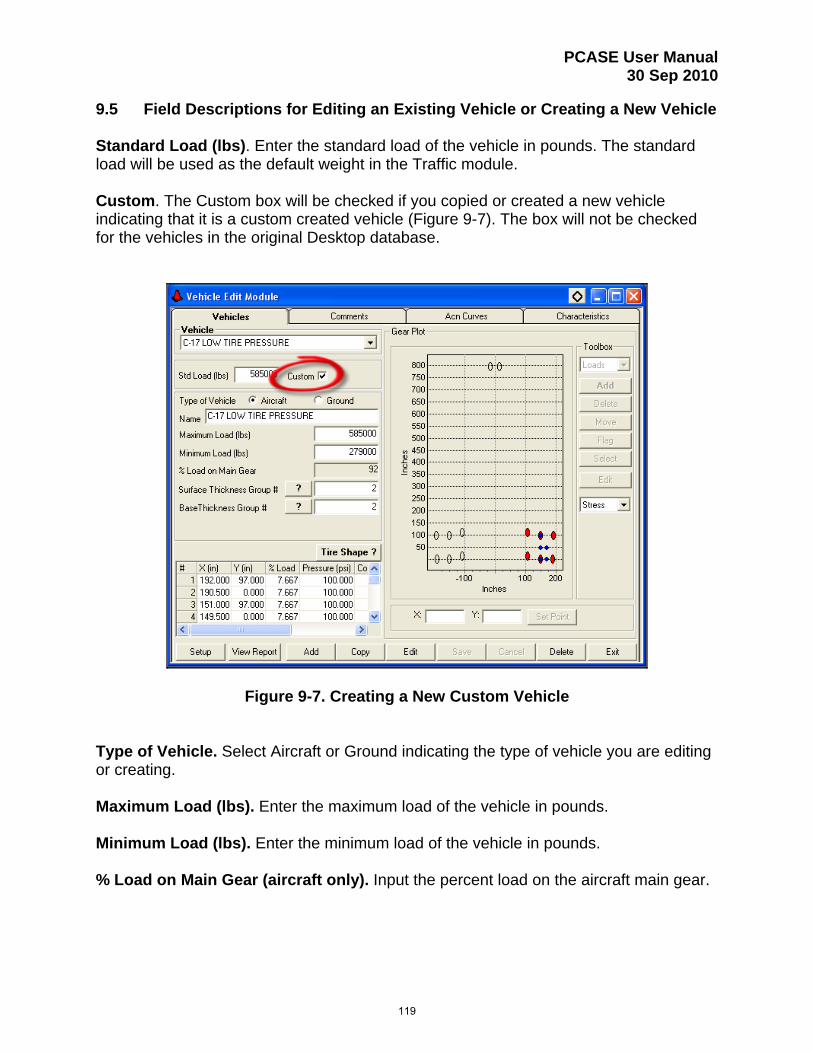
PCASE User Manual 30 Sep 2010
9.5 Field Descriptions for Editing an Existing Vehicle or Creating a New Vehicle
Standard Load (lbs). Enter the standard load of the vehicle in pounds. The standard load will be used as the default weight in the Traffic module. Custom. The Custom box will be checked if you copied or created a new vehicle indicating that it is a custom created vehicle (Figure 9-7). The box will not be checked for the vehicles in the original Desktop database.
Figure 9-7. Creating a New Custom Vehicle
Type of Vehicle. Select Aircraft or Ground indicating the type of vehicle you are editing or creating. Maximum Load (lbs). Enter the maximum load of the vehicle in pounds. Minimum Load (lbs). Enter the minimum load of the vehicle in pounds. % Load on Main Gear (aircraft only). Input the percent load on the aircraft main gear.
119

PCASE User Manual 30 Sep 2010
Surface and Base Thickness Group Number (aircraft only). The assigned Group number will determine the minimum thickness of the asphalt layer and base course for flexible airfield pavement designs. For aircraft, input the surface thickness group number (1-6) and base thickness group number (1-3). Figure 9-8 shows the base thickness group numbers (1-3) and surface thickness group numbers (1-6) across the top of the chart. The numbers with blue or yellow highlight indicate the minimum thickness that will be used in the desktop calculations based on the base course CBR and traffic area. The blue highlight are the values that will be used with a base course CBR=80. The yellow highlight are the values that will be used with a base course CBR=100. If you are uncertain which group numbers to use, it is recommended you find a vehicle in the database with a similar gear configuration and weight and copy the group numbers for your aircraft. Minimum thicknesses for road design are determined based on ranges of Equivalent Single Axle Loads (ESAL), not the group number. When creating a ground vehicle you can keep the defaults for the surface and base group numbers, any group number selected will not affect your design calculations.
Figure 9-8. Surface and Base Thickness Group Numbers Type of Ground Vehicle (ground vehicles only). Enter the type of ground vehicle (wheeled, forklift, or tracked), by pulling down the arrow and selecting the vehicle type. This option only appears if Ground was selected for Type of Vehicle.
120
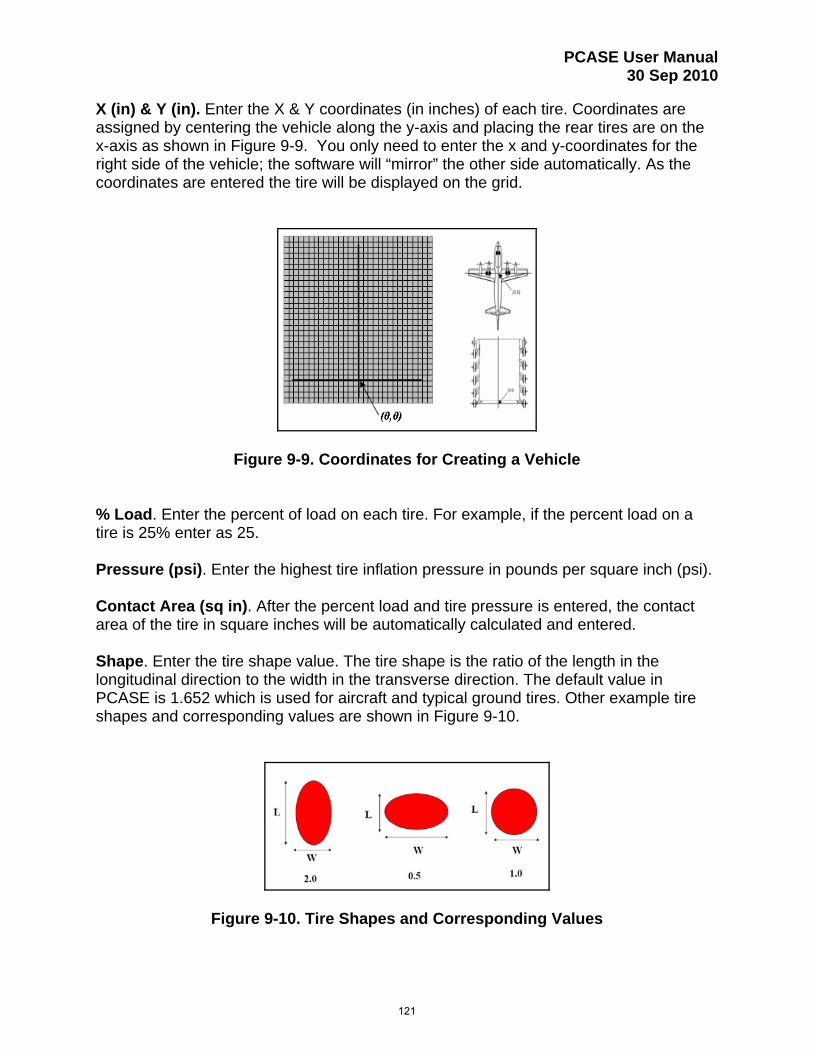
PCASE User Manual 30 Sep 2010
X (in) & Y (in). Enter the X & Y coordinates (in inches) of each tire. Coordinates are assigned by centering the vehicle along the y-axis and placing the rear tires are on the x-axis as shown in Figure 9-9. You only need to enter the x and y-coordinates for the right side of the vehicle; the software will “mirror” the other side automatically. As the coordinates are entered the tire will be displayed on the grid.
Figure 9-9. Coordinates for Creating a Vehicle % Load. Enter the percent of load on each tire. For example, if the percent load on a tire is 25% enter as 25. Pressure (psi). Enter the highest tire inflation pressure in pounds per square inch (psi). Contact Area (sq in). After the percent load and tire pressure is entered, the contact area of the tire in square inches will be automatically calculated and entered. Shape. Enter the tire shape value. The tire shape is the ratio of the length in the longitudinal direction to the width in the transverse direction. The default value in PCASE is 1.652 which is used for aircraft and typical ground tires. Other example tire shapes and corresponding values are shown in Figure 9-10.
Figure 9-10. Tire Shapes and Corresponding Values
121

PCASE User Manual 30 Sep 2010
9.6 Editing a Custom Vehicle As described in Paragraph 9.4, after you create and save your vehicle the vehicle configuration will appear on the graph on the right side of the window. The red ovals indicate the tires, and the blue dots indicate the analysis points. In the Graph you can add, delete, move, and flag tires. To add a tire, click Edit at the bottom of the screen which will activate the graph and Toolbox, set the Toolbox to “Load”, click Add, and click on the location in the grid where you want the new tire added. You can also move, flag, or delete a tire in the same manner. You can also add, delete, move, and flag analysis points for Stress, ESWL, PCR, Nose, ACN, and LEA (see descriptions below). For example, to delete a Stress analysis point, click Edit at the bottom of the screen which will activate the graph and Toolbox, set the Toolbox to “Point” by pulling down the arrow next to “Load”, click Delete, and click on the blue dot for the analysis point you want to delete (Figure 9-11).
Tires
Calculation Points
Figure 9-11. Editing a Custom Vehicle
122

PCASE User Manual 30 Sep 2010
Stress. Maximum tensile stresses at the edge of rigid pavements. ESWL. Equivalent single-wheel load required in flexible and unsurfaced pavement design and evaluation. PCR. Pass-to-coverage ratio required to convert passes to coverages. Nose. Tires to be considered as aircraft nose gear. ACN. Maximum tensile stresses in the center (interior) of PCC slabs used to calculate the Aircraft Classification Number (ACN). LEA. Stresses and strains in a pavement according to the layered elastic theory. 9.7 Other Vehicle Edit Options & Tabs Setup. The setup button allows you the option of displaying all vehicles, aircraft only, or ground vehicles only. Click Setup at the bottom of the screen and select your preference for displaying vehicles (Figure 9-12). Warning: if you choose to display aircraft only you will no longer have the option to choose ground vehicles in the Traffic module. Any traffic patterns you created with ground vehicles will no longer be valid or usable. If you choose to display ground vehicles only, aircraft and patterns with aircraft will no longer be available.
Figure 9-12. Vehicle Edit Setup Button
123

PCASE User Manual 30 Sep 2010
View Report. The View Report button provides vehicle specification data in a Microsoft® Office Word document for saving or printing. Delete. The Delete button will delete the vehicle currently showing in the Vehicle Edit window. Warning: do NOT delete a vehicle from the standard database. If the “Custom” button is not marked, do not delete the vehicle. Exit. Exits the Vehicle Edit module. Comments tab. Any comments about the vehicle can be added on the Comments tab (Figure 9-13). On the Vehicles tab, click Edit, then click on the Comments tab and type in your comments, go back to the Vehicles tab, and click Save. Any changes to the vehicle will not appear until the PCASE desktop has been closed and reopened (Figure 9-5).
Figure 9-13. Vehicle Edit Comments Tab
124

PCASE User Manual 30 Sep 2010
ACN Curves tab. To view the Aircraft Classification Number (ACN) curves for the selected vehicle click on the ACN Curves tab, input the load (in kips), and click Update. The flexible (left) and rigid (right) ACN curves will be generated as well as the numerical ACN’s for subgrade categories A, B, C, and D (Figure 9-14). The subgrade category ranges are given at the bottom of the screen.
Figure 9-14. Vehicle Edit ACN Curve Tab
125

PCASE User Manual 30 Sep 2010
Characteristics Tab. To view characteristics of the selected vehicle click the Characteristics tab (Figure 9-15). [Note: Characteristics are not available for all vehicles.]
Figure 9-15. Vehicle Edit Characteristics Tab
126

PCASE User Manual 30 Sep 2010
Chapter 10. Core Reports
The Core Reports module provides a spreadsheet of physical property, core log, cursory pavement condition survey, and construction history data.
10.1 Starting the Core Reports Module To open the Core Reports module, click on the Core Reports button in the toolbar (Figure 10-1).
Figure 10-1. Opening the Core Reports Module 10.2 Physical Property Data The Core Reports module opens to the Physical Property Data tab (Figure 10-2). The sections created in the Evaluation module will populate the form. If there were no sections created the message in Figure 10-3 will appear. Enter the physical property data for each section: Overlay pavement (if applicable)
Thickness. Enter the overlay thickness in inches by clicking on the cell and typing in the thickness.
Description. Enter the overlay type by clicking on the cell and selecting AC, PCC or DBST (double bituminous surface treatment).
Flex (rigid pavement only). Enter the flexural strength in pounds per square inch by clicking on the cell and typing in the flexural strength.
Pavement (original wearing surface)
Thickness. Enter the pavement thickness in inches by clicking on the cell and typing in the thickness.
Description. Enter the pavement type by clicking on the cell and selecting AC, PCC or DBST (double bituminous surface treatment).
Flex (rigid pavement only). Enter the flexural strength in pounds per square inch by clicking on the cell and typing in the flexural strength.
127

PCASE User Manual 30 Sep 2010
Base
Thickness. Enter the base course thickness in inches by clicking on the cell and typing in the thickness.
Description. Enter the base course type by clicking on the cell and selecting the appropriate material.
K/CBR. Enter the strength of the base course. Enter the K for a rigid pavement or CBR for a flexible pavement.
Subbase
Thickness. Enter the subbase course thickness in inches by clicking on the cell and typing in the thickness.
Description. Enter the subbase course type by clicking on the cell and selecting the appropriate material.
K/CBR. Enter the strength of the subbase course. Enter the K for a rigid pavement or CBR for a flexible pavement.
Subgrade
Description. Enter the natural subgrade type by clicking on the cell and selecting the appropriate material.
K/CBR. Enter the strength of the natural subgrade. Enter the K for a rigid pavement or CBR for a flexible pavement.
Figure 10-2. Physical Property Data
128

PCASE User Manual 30 Sep 2010
Figure 10-3. Physical Property Data – Missing Sections Message
10.3 Core Log Data Sheet To input core log data click on the Core Log Data Sheet tab, click Add Row, and select the section that corresponds to the core log (Figure 10-4). For each core and layer enter the thickness (inches), description (click on the cell and select PCC or AC), and flexural strength (for PCC only).
Figure 10-4. Core Log Data Sheet
129

PCASE User Manual 30 Sep 2010
10.4 Cursory Pavement Condition Survey To input pavement condition information click on the Cursory Pavement Condition Survey tab, click Add Row, and select the section that corresponds to the survey data to input (Figure 10-5). For each section enter the severity level of each distress (click in the cell and select X-excellent, L-low, M-medium, H-high).
Figure 10-5. Cursory Pavement Condition Survey 10.5 Core Log To input core log data click on the Core Log tab, click Add Row, and select the section that corresponds to the core log. The core log data that was entered in the Core Log Data Sheet (see Paragraph 10.4) will populate the form. On the Core Log tab the Old Section name, Remarks, Latitude, and Longitude (Figure 10-6) can be entered.
Figure 10-6. Core Log
130
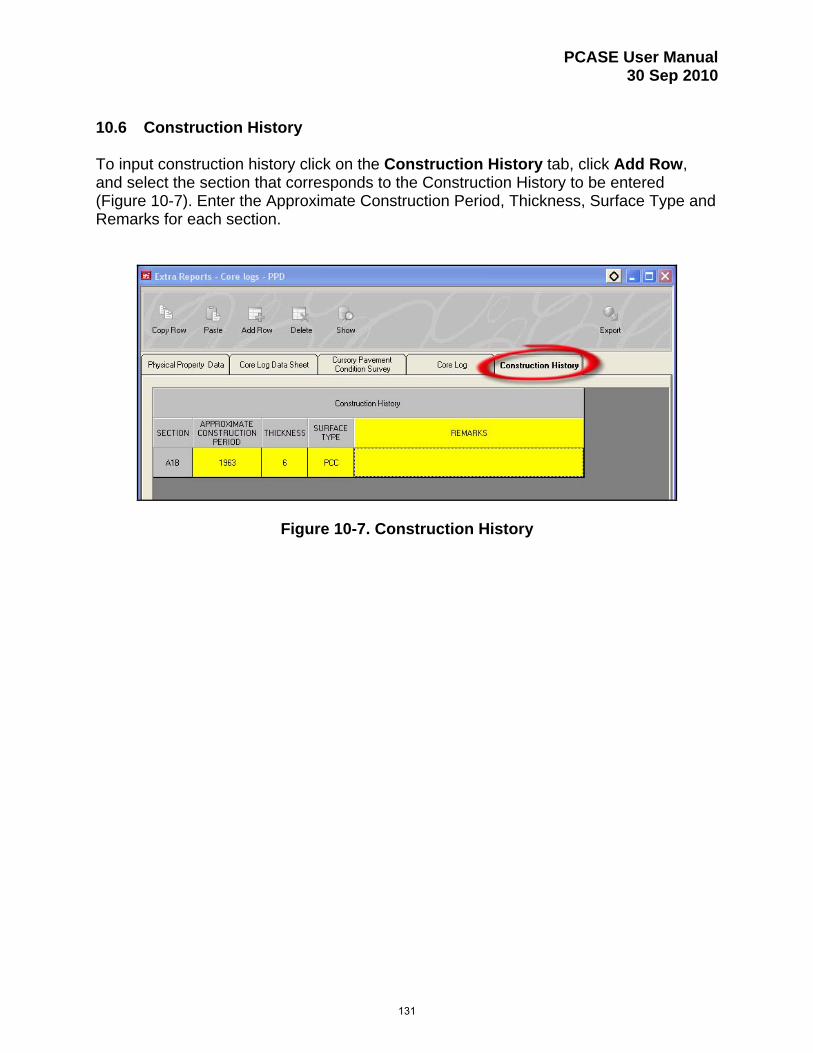
PCASE User Manual 30 Sep 2010
10.6 Construction History To input construction history click on the Construction History tab, click Add Row, and select the section that corresponds to the Construction History to be entered (Figure 10-7). Enter the Approximate Construction Period, Thickness, Surface Type and Remarks for each section.
Figure 10-7. Construction History
131