Energetic Competition Between Neanderthals and Anotomically Modern Humans
Upload
dorthy-stoneCategory
view
215download
0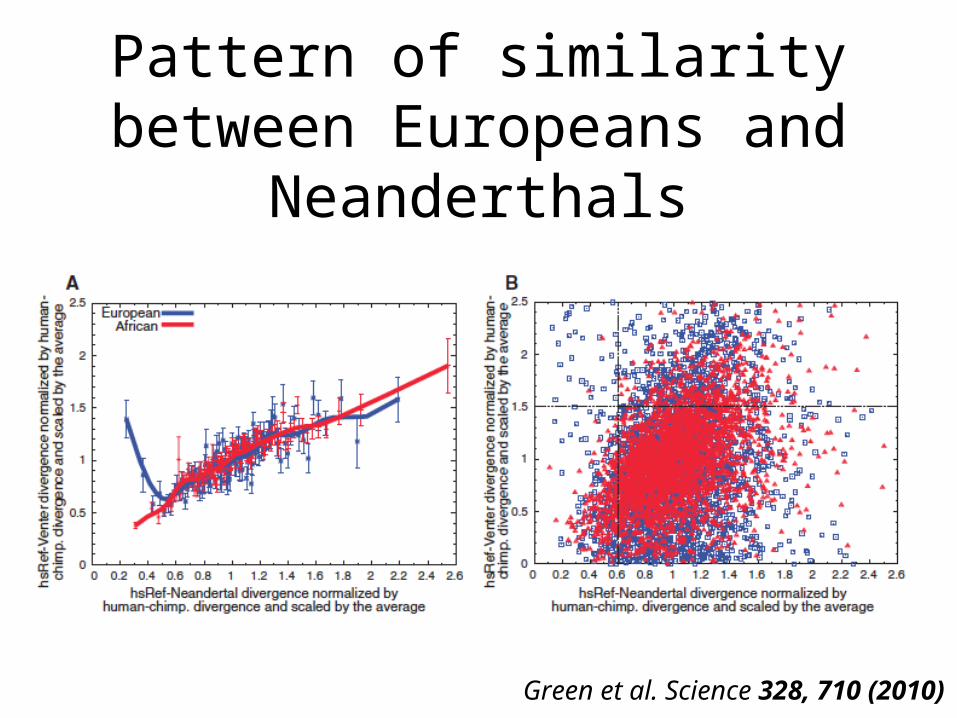
Pattern of similarity between Europeans and Neanderthals
Green et al. Science 328, 710 (2010)

Summary of recent human history
Reich et al. Nature 468, 1053 (2010)
Adaptive evolution in human brain development genes

Neutral Balancing Selection Selective Sweep
Gene Trees and Evolutionary Hypotheses

Effect of selection on Tajima’s D
selective sweep
balancing selection
neutral
D = 0
Many low frequency
variants and singletons,D negative
Pairwise differences (k)
increase faster than SD positive
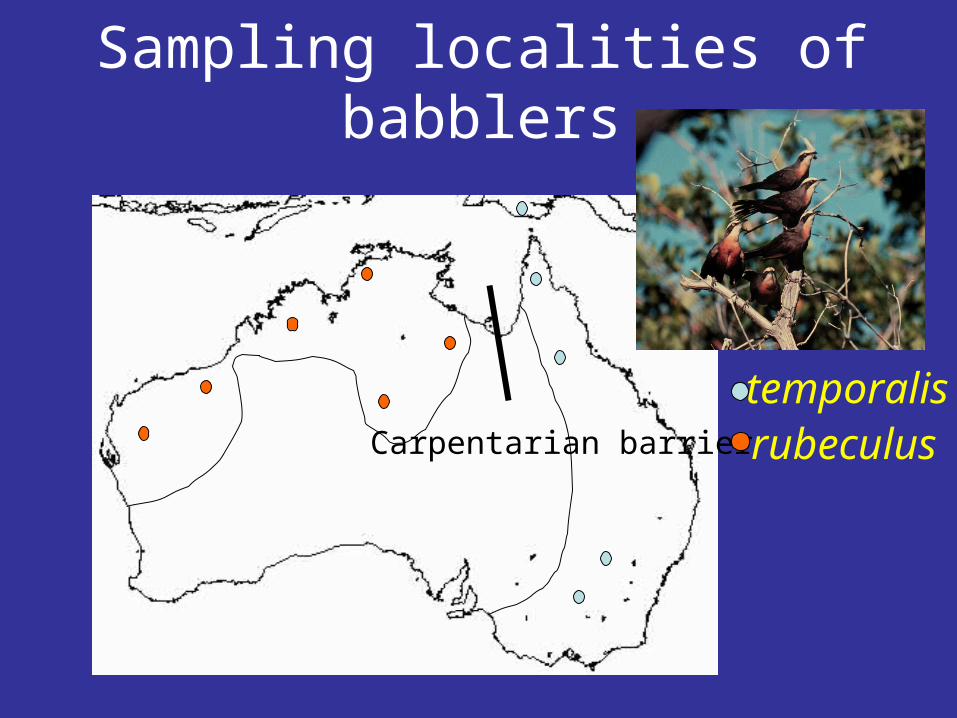
Sampling localities of babblers
Carpentarian barrier
temporalisrubeculus

Tajima’s test of neutrality for 12populations (A-K)
• In this diagram, each letter represents a different population
• Under neutrality, k and s should be equal, as they estimate the same quantity
(Edwards, 1997)
Tajima’s D = (or k) - D
(K same as

The site frequency spectrum under selection and neutrality
Nielsen, Annu. Rev. Genet. 2005. 39:197–218
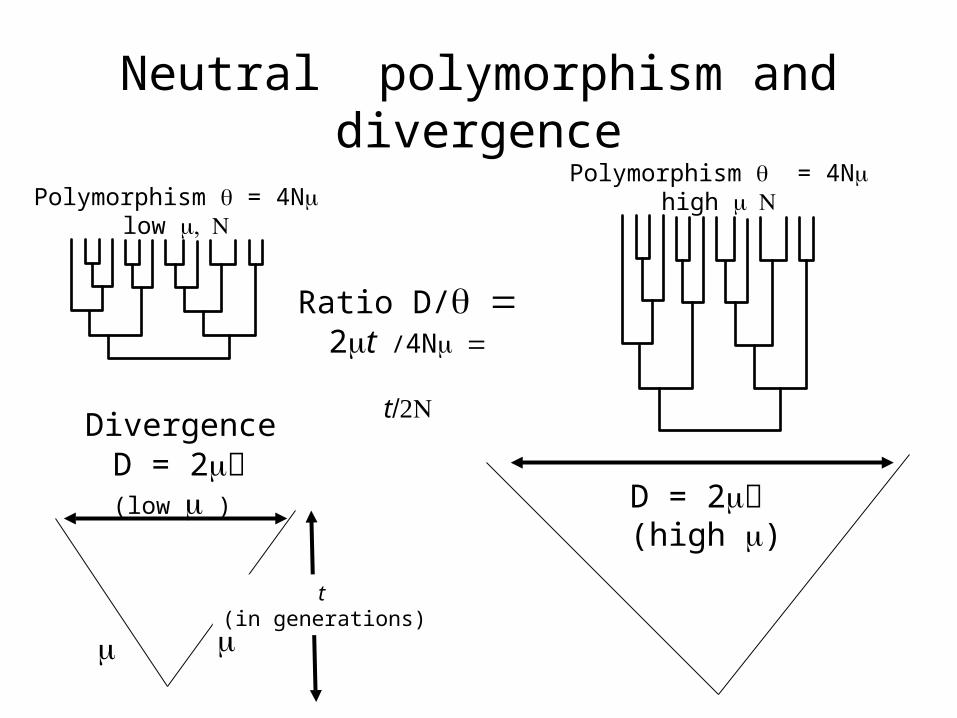
Neutral polymorphism and divergence
D = 2(low )
t (in generations)
Divergence
Polymorphism = 4Nlow
Polymorphism = 4Nhigh
D = 2(high )
Ratio D/2t /4N
t
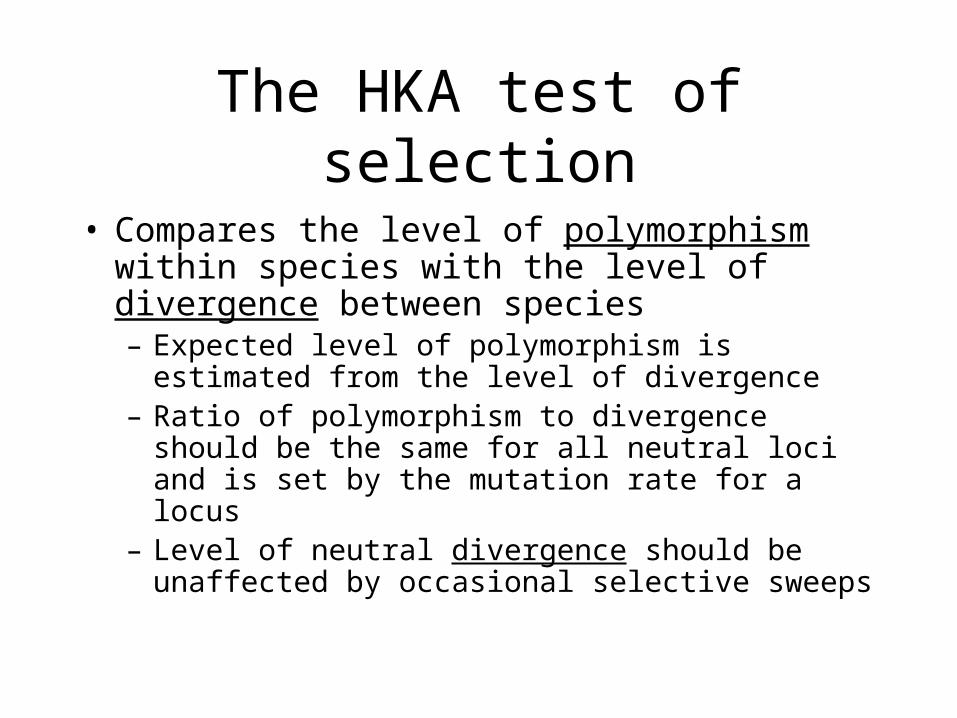
The HKA test of selection
• Compares the level of polymorphism within species with the level of divergence between species– Expected level of polymorphism is estimated from the
level of divergence– Ratio of polymorphism to divergence should be the
same for all neutral loci and is set by the mutation rate for a locus
– Level of neutral divergence should be unaffected by occasional selective sweeps
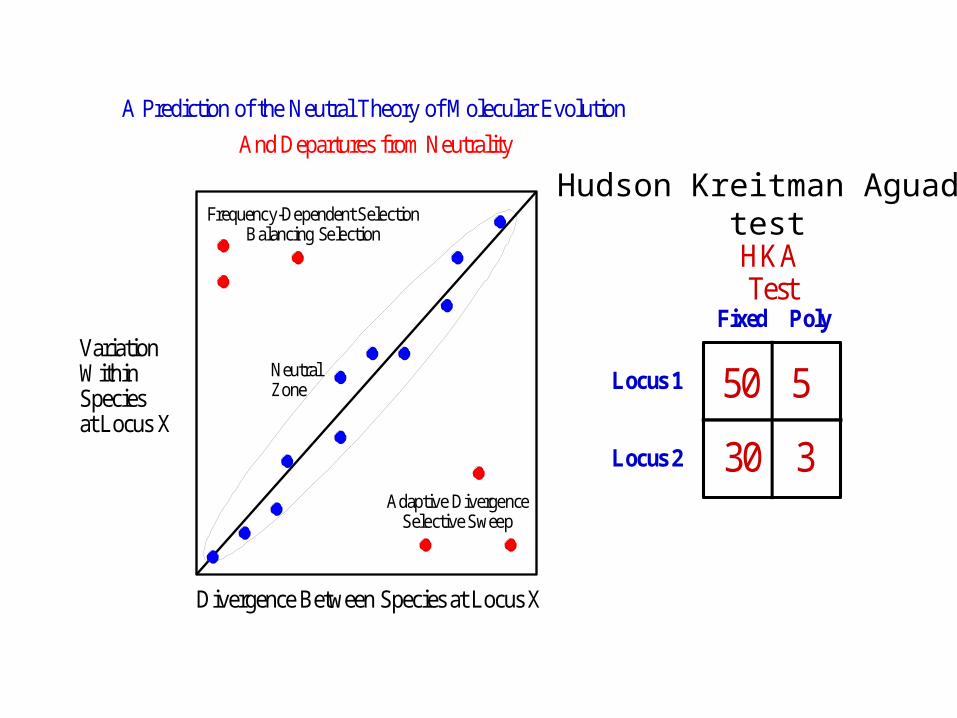
Divergence Between Species at Locus X
VariationWithinSpeciesat Locus X
Frequency-Dependent SelectionBalancing Selection
Adaptive Divergence Selective Sweep
A Prediction of the Neutral Theory of Molecular Evolution
And Departures from Neutrality
NeutralZone
Fixed Poly
Locus 1 50 5
330
HKATest
Locus 2
Hudson Kreitman Aguadétest

Fast/Slowpolymorphism
Adh locus Adh-dup
polymorphism
Fixed Poly
Locus 1 50 5
330
HKATest
Locus 2
16
50
20
13
P < 0.02
Adh
Adh-dup
FFFFSSSS
FastFastFastFastSlowSlowSlowSlow
Adjacent silent sitesin linkage disequilibrium
Distant sites in Linkage Equiluilibrium
The “footprint” of balancing selection at Adh in DrosophilaAdapted from Kreitman and Hudson (1991) Genetics 127:565-82
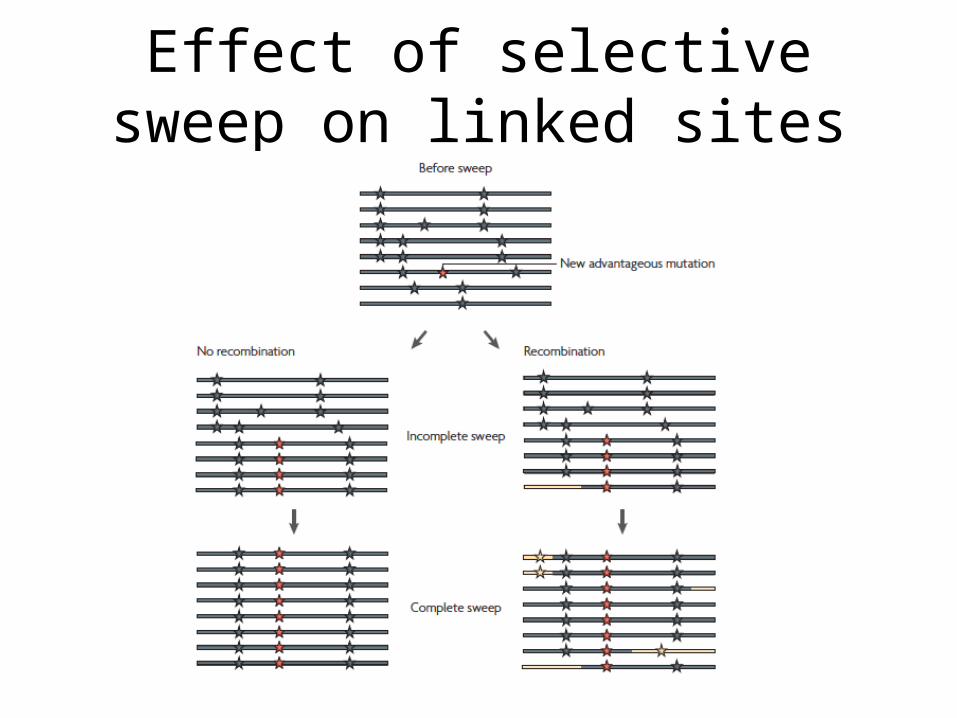
Effect of selective sweep on linked sites
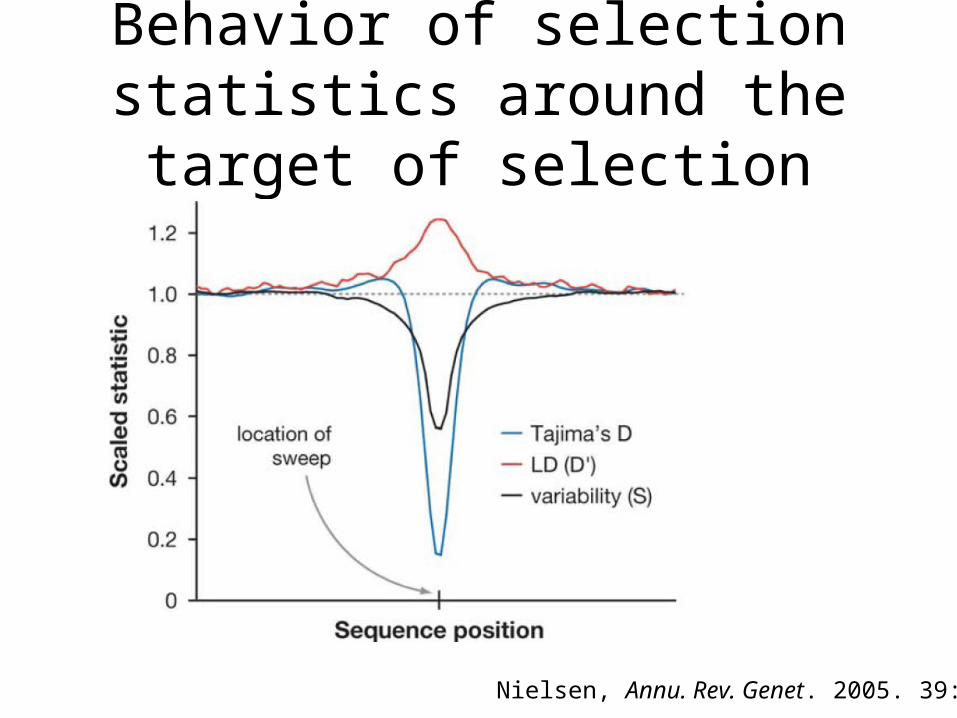
Behavior of selection statistics around the target of selection
Nielsen, Annu. Rev. Genet. 2005. 39:197–218

Selective sweep in Microcephalin

Zebra Finch: a population genomics model system
N=8N=8
N=8
N=8
N=12
2kb
10 kb
Locus 1Locus 2 Locus 3
Seven ‘locus trios’
Balakrishnan, C.B. & Edwards, S. V. 2009. Genetics 181: 645-660
0
0.005
0.01
0.015
0.02
0.025
0.03
1 2 3 4 5 6 7 8 9 10 11 12 13 14 15 16 17 18 19 20 21 22 23 24 25 26
Nu
cleoti
de d
ivers
ity
Balakrishnan, C.B. & Edwards, S. V. 2009. Genetics 181: 645-660
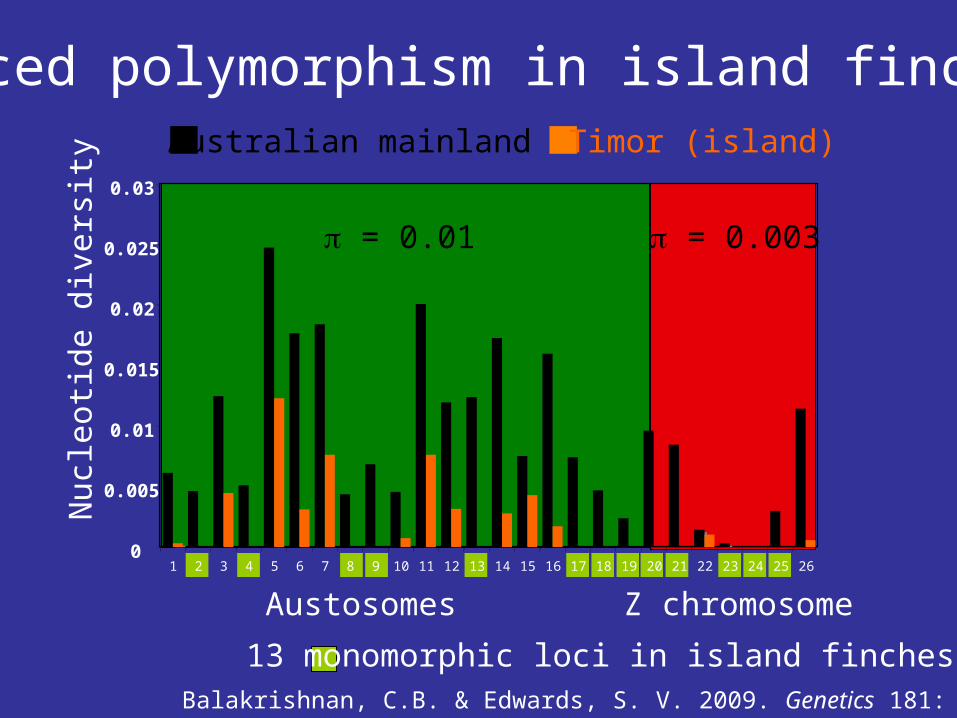
Reduced polymorphism in island finches
13 monomorphic loci in island finches
Australian mainland Timor (island)
Austosomes Z chromosome
= 0.01 = 0.003

Low levels of linkage disequilibrium in mainland birds
LD measured in r2

Enhanced LD in island zebra finches
Balakrishnan, C.B. & Edwards, S. V. 2009. Genetics 181: 645-660
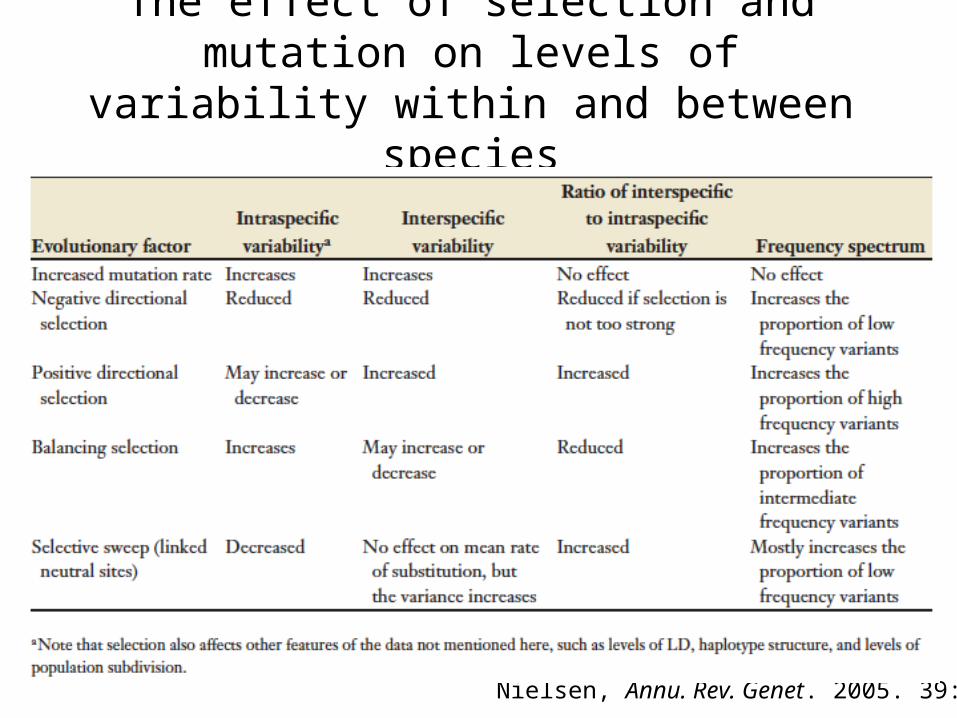
The effect of selection and mutation on levels of variability within and between species
Nielsen, Annu. Rev. Genet. 2005. 39:197–218
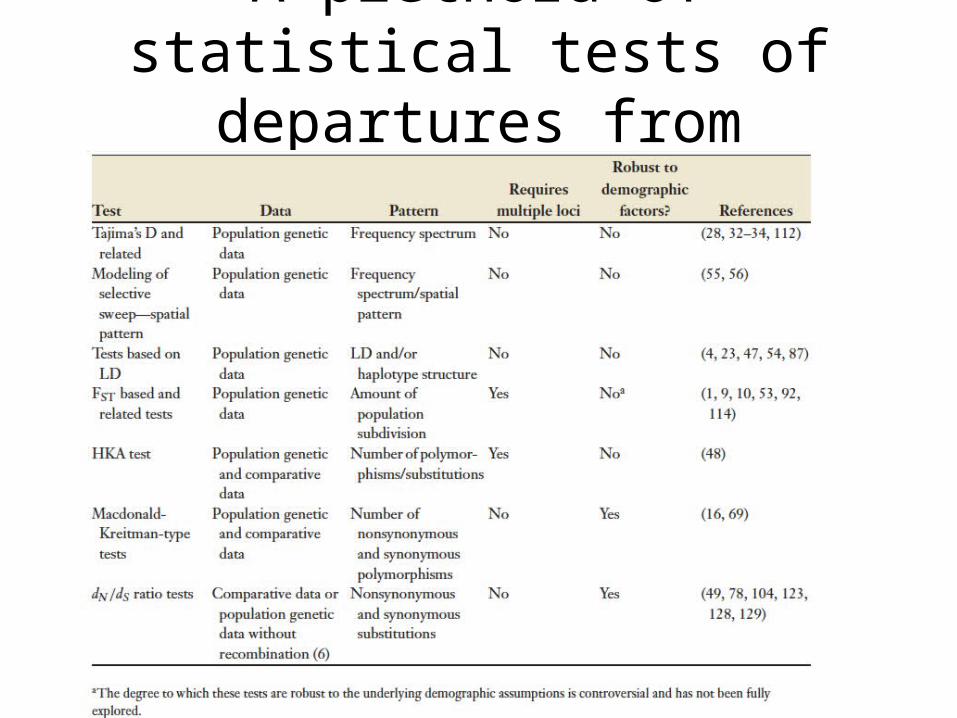
A plethora of statistical tests of departures from neutrality