Workplace & HIV/AIDS Unit Department of HIV/AIDS Prevention & Care.

WHO Collaborating Centre for
Palliative Care & Older People
Patient-reported outcome measurement in HIV care: what matters now?
Dr Richard Harding
Department of Palliative Care, Policy & Rehabilitation
Cicely Saunders Institute
King’s College London
& University of Cape Town

Background
• Improved mortality →policy shifts to full social participation
• Contribution of physical and mental health to QoL is current
“critical challenge” in HIV medicine (Buscher JAMA 2010)
• Emerging physical complications (e.g. bone density, cancer,
cardiovascular, renal, liver, NCD) (Harding et al CID 2011)
• What is “clinically important”?
– Physicians detect 1/3 of problems Justice 2001, 2011
• “POSITIVE FUTURES” Harding & Molloy 2007
– “Less ignorance more understanding from the HIV doctors. i.e. side effects
and mental illness”
– “Improved clinical services/mental health”
– “I need to rebuild my confidence and self esteem” “need to find a way a
mental structure to move forward in every area of life

N=778: UK outpatients most prevalent (physical)
Symptom 7 day
prev
Level of distress (% whole sample)
Not at all Little bit Some-
what
Quite a
bit
Very
much
Lack energy 70.8% 10.8% 19.8% 12.3% 12.1% 10.8%
Drowsy/ tired 67.5% 10.7% 19.8% 9.8% 12.3% 10%
Difficulty
sleeping 61.8% 13.5% 10.9% 9.5% 12.1% 10.9%
Difficulty
concentrating 60.7% 16.6% 15.2% 10.3% 9.1% 5.5%
Diarrhoea 53.6% 17.6% 12.6% 7.5% 7.5% 5.4%
Sexual activity 53.5% 15.7% 8.1% 6.6% 7.1% 12.2%
Pain 53.2% 18.0% 12.0% 5.9% 8.6% 5.4%
Study 1: UK 10 most prevalent (psychological)
7 day
period
prev
Intensity
Rarely Occasionally Frequently Constantly
Worried 69.9% 8.4% 25.4% 21.5% 9.1%
Sad 66.3% 11.8% 26.9% 16.7% 6.2%
Feeling
irritable 56.6% 10.4% 22.4% 16.3% 4.2%
Harding et al BMJ STI 2010

1. Suicidal ideation 31% 7-day period
prevalence Sherr et al AIDS 2008
2. Risk and poor adherence associated with
burden Harding et al BMJ STI 2010; Harding et al AIDS & Behavior
2012
3. Symptom burden predictive of viral rebound Lampe et al JAIDS 2010
Key messages continued

MSAS-SF adult HIV datasets
Argentina
n=200
outpatients
London
n=778
outpatients
SOWETO
n= 385
ART
outpatients
5 sites
Uganda
& South
Africa
n= 224
advanced
pts
Uganda
n= 200
newly
diagnosed
UK
n= 347
Gay men
Kenya n=376 Vietnam n=800
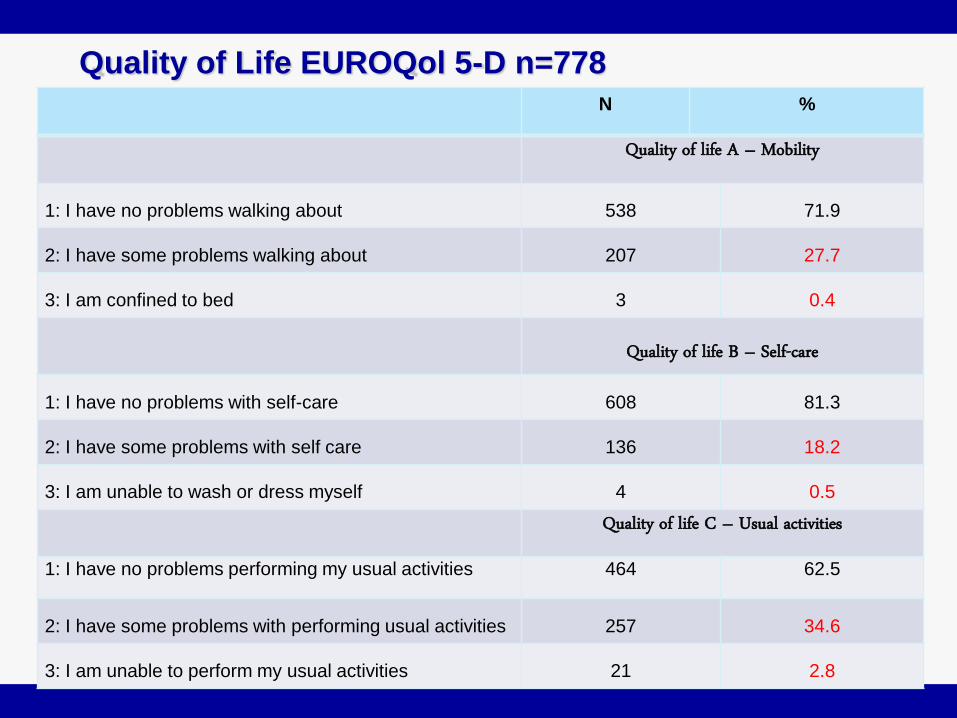
Quality of Life EUROQol 5-D n=778 N %
Quality of life A – Mobility
1: I have no problems walking about 538 71.9
2: I have some problems walking about 207 27.7
3: I am confined to bed 3 0.4
Quality of life B – Self-care
1: I have no problems with self-care 608 81.3
2: I have some problems with self care 136 18.2
3: I am unable to wash or dress myself 4 0.5
Quality of life C – Usual activities
1: I have no problems performing my usual activities 464 62.5
2: I have some problems with performing usual activities 257 34.6
3: I am unable to perform my usual activities 21 2.8

Results 3: Quality of Life EUROQol 5-D
N %
Quality of Life D- Pain/discomfort
1: I have no pain or discomfort 413 55.7
2: I have moderate pain or discomfort 287 38.7
3: I have extreme pain or discomfort 42 5.7
Quality of Life E- Anxiety/
Depression
1: I am not anxious or depressed 312 41.9
2: I am moderately anxious or depressed 355 47.7
3: I am extremely anxious or depressed 78 10.5

Results 5: Multiple regression, 5D associations with VAS r2=43.5%
Variables Groups N B 95% CI for B P value
A Mobility I have no problems walking about [ref] 522 0
-5.51
0
-9.20, -1.81
.004**
I have some problems walking about/I am confined
to bed
200
B Self-care I have no problems with self-care [ref] 591 0
-2.83
0
-6.83, 1.17
.166
I have some problems with performing my usual
activities/I am unable to wash or dress myself
133
C Usual activities I have no problems performing my usual activities
[ref]
454 0
-9.48
-16.42
0
-12.92, -6.04
-24.99, -7.86
<.001***
I have some problems with performing usual
activities
248
I am unable to perform my usual activities 18
D Pain/ discomfort I have no pain or discomfort [ref] 405 0
-5.90
-13.83
0
-8.90, -2.89
-20.01, -7.65
<.001***
I have moderate pain or discomfort 276
I have extreme pain or discomfort 40
E Anxiety/ depression I am not anxious or depressed [ref] 305 0
-9.87
-16.05
0
-12.53, -7.22
-20.75, -11.35
<.001***
I am moderately anxious or depressed 344
I am extremely anxious or depressed 73

Results 6: Addition of demog, behavioural, disease variables to model
• EUROQOL dimensions:
– Mobility (95% CI) -4.25 (-8.25, -.24) for some problems compared to no
problems, p = .038*,
– Usual activities B (95% CI) -6.97 (-10.54, 3.41) and -12.24 (-20.85, -3.63) for
some problems and unable to perform compared to no problems, p
<0.001***
– Pain/discomfort B (95% CI) -4.18 (-7.24, -1.11) and -10.32 (-16.67, 3.96) for
moderate and extreme compared to no problems, p <.001***
– Anxiety/depression B (95% CI) -8.08 (-10.90, -5.26) and -13.16 (-18.32, -
8.01) for moderate and extreme compared to no problems, p <.001***
• Treatment optimism
– B (95% CI) 4.83 (1.77, 7.89) for optimistic compared to not optimistic, p =
.008**
• Sexual partner
– having a sexual partner B (95% CI) 3.58 (.42, 6.74) p = .035*
• NOT SIG
– Self care, employment, Education, UK born, age, relationship,
gender/sexuality, ethnicity, sexual risk, STI, disclosure, ART, CD4

Measuring what is important to patients & families:
• Patient report outcome measures (PROMs) essential to quality
and equity (BMJ 2010)
• Aids assessment, evaluation, monitoring of treatments and care,
influences clinical decision-making and contributes to staff
education and training
• Can we direct appropriate care without knowing what matters to
the patient? (Harding BMJ 2013; Harding Psycho-oncology 2013)
• Need for scientifically robust and valid outcome measures

Clinicians want/need practical, user-friendly,
simple tools to aid them in this endeavour.
NOT…

“From the life of the virus
to the life of the host”
Spiritual
problems
Emotional
problems
Social
problems
Physical
problems
Optimal
quality of
life here?
*From diagnosis alongside treatment*
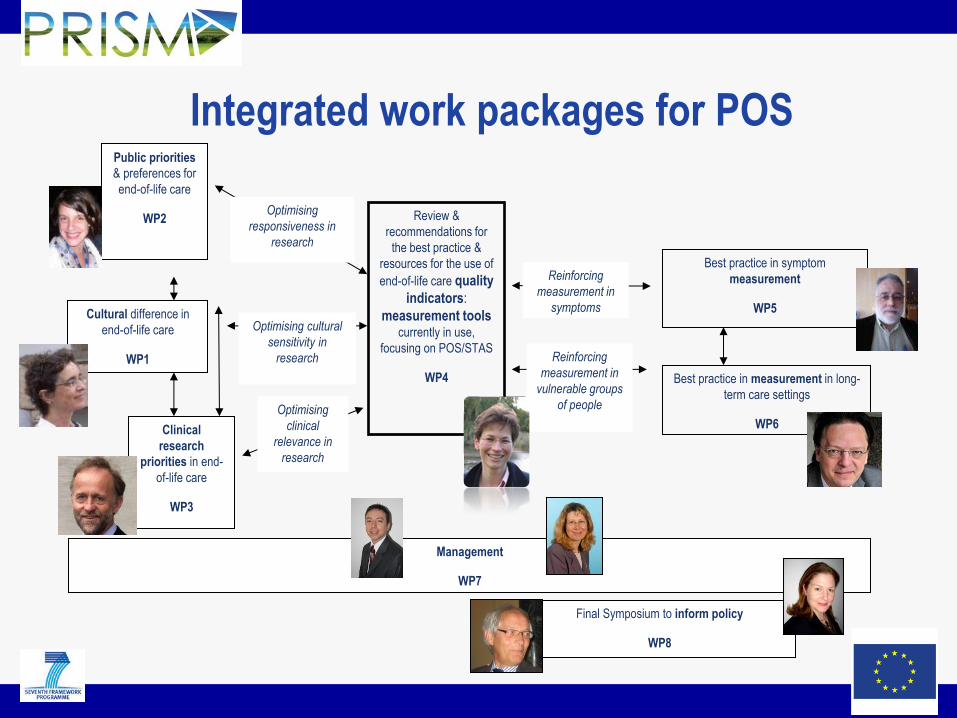
Integrated work packages for POS
Cultural difference in
end-of-life care
WP1
Public priorities
& preferences for
end-of-life care
WP2
Clinical
research
priorities in end-
of-life care
WP3
Review &
recommendations for
the best practice &
resources for the use of
end-of-life care quality
indicators:
measurement tools currently in use,
focusing on POS/STAS
WP4
Best practice in symptom
measurement
WP5
Best practice in measurement in long-
term care settings
WP6
Optimising
responsiveness in
research
Optimising cultural
sensitivity in
research
Optimising
clinical
relevance in
research
Management
WP7
Final Symposium to inform policy
WP8
Reinforcing
measurement in
symptoms
Reinforcing
measurement in
vulnerable groups
of people

Evolution of African POS measurement
•Consensus validity
•Face validity
•Test-retest validity
•Sensitivity to
change
•Time to complete
•Internal
consistency
•778 patients, 480
family caregivers
•APCA, HPCA, U of
Maryland, NHPCO, 8
African sites
•Now PedPOS,
Vietnam/Harvard
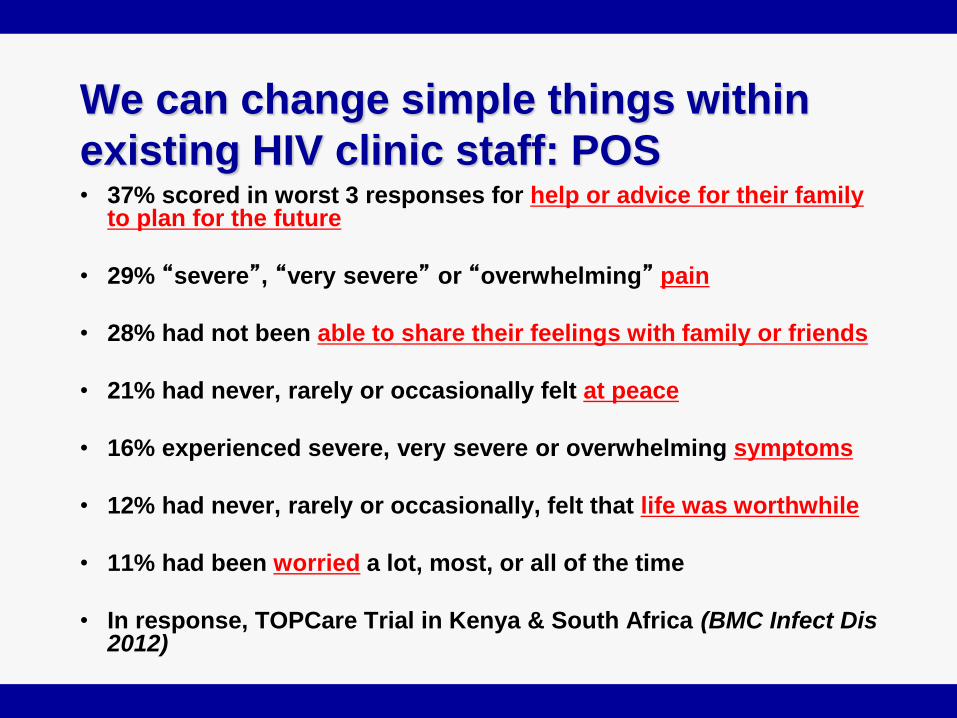
We can change simple things within
existing HIV clinic staff: POS • 37% scored in worst 3 responses for help or advice for their family
to plan for the future
• 29% “severe”, “very severe” or “overwhelming” pain
• 28% had not been able to share their feelings with family or friends
• 21% had never, rarely or occasionally felt at peace
• 16% experienced severe, very severe or overwhelming symptoms
• 12% had never, rarely or occasionally, felt that life was worthwhile
• 11% had been worried a lot, most, or all of the time
• In response, TOPCare Trial in Kenya & South Africa (BMC Infect Dis 2012)

Monthly analysis
Psychological well-being (GHQ-12)
Multivariate regression analysis
Coefficient (CI) p value
Baseline -0.22 (-1.63-
1.20) 0.76
Month 1 -1.23 (-2.46-
0.01) 0.05
Month 2 -1.12 (-2.26-
0.02) 0.05
Month 3 -0.71 (-1.86-
0.45) 0.23
Month 4 -0.65 (-1.73-
0.42) 0.23
0
1
2
3
4
5
6
7
8
9
10
T0 T1 T2 T3 T4
GH
Q s
core
Median and IQR for psychiatric morbidity comparing control and
intervention arms Control Lowerquartile
Control Median
Control Upperquartile
InterventionLower quartile
InterventionMedian
InterventionUpper quartile
Initial more rapid improvement at one and two month time points attenuated over time.
Regression coefficient for effect of study arm on GHQ data at monthly intervals throughout the study period adjusting for partner status, TB treatment, time since diagnosis, time on ART and baseline score

Monthly analysis Social well-being (interpersonal factor)
There is evidence for
improvement in the intervention
arm from baseline throughout
the study period
Multivariate regression analysis
Coefficient (CI) p value
Baseline -0.82 (-0.53-
2.16) 0.23
Month 1 1.71 (0.50-2.93) 0.01
Month 2 1.79 (0.57-3.01) <0.01
Month 3 2.00 (0.68-3.33) <0.01
Month 4 1.87 (0.46-3.29) 0.01
Regression coefficient for effect of study arm on APCA African POS interpersonal factor data at monthly intervals throughout the study period adjusting for baseline difference in partner status, TB treatment, time since diagnosis, time on ART and baseline score.
0
1
2
3
4
5
6
7
8
9
10
T0 T1 T2 T3 T4
Inte
rper
son
al s
core
Median and IQR of social well-being comparing control and intervention
arms Controlmedian
Controlupperquartile
Control lowerquartile
Interventionmedian
Interventionupperquartile
Interventionlowerquartile

Area under curve (AUC) –
psychological well-being
Variable Regression coefficient
(CI) p value
Gender 0.77
(-9.46-11.01) 0.88
Age -0.21
(-0.67-0.24) 0.36
Wealth -3.84
(-7.56- -0.13) 0.04
Baseline score 19.02
(15.45-22.59) <0.001
Study arm 9.76
(2.21-17.31) 0.01
Variable Regression
coefficient (CI) p value
Age 0.07
(-0.10-0.24) 0.43
Wealth 1.37
(-0.02-2.76) 0.05
Baseline score
-1.41 (-1.81- -1.00)
<0.001
Study arm -3.26
(-6.08- -0.42) 0.02
•Multivariate regression of MOS-HIV MHSS AUC and variables which were statistically significant at bivariate analysis. •Longitudinal improvement is statistically significantly and negatively associated with wealth and positively associated with baseline score and study arm.
•Multivariate regression of GHQ-12 AUC and
variables which were statistically significant at
bivariate analysis.
•Improved psychiatric morbidity is statistically
significantly and negatively associated with wealth
and positively associated with baseline score and
study arm*

Royal College Physicians Guidance: Long Term Neurological Conditions 2008

Rehabilitation Complexity Scale
• Also FIM/FAM, Goal Attainment Scaling (GAS) Turner-Stokes et al: Clinical Medicine 2007; Dis & Rehab 2013; BMJ Open 2013
Care / risk
Basic care needs
0-3
Nursing Special nursing needs 0-3
Therapy Therapy needs
No of disciplines
Intensity of treatment
0-3
0-3
Medical Medical needs 0-3

UK Rehabilitation Outcomes Collaborative
• UKROC - National Clinical Database 5yr NIHR
– For specialist rehabilitation in the UK
• Database held at KCL
– Each specialist in-pt neurorehabilitation episode
1.To collate in-patient episode data – Level 1 and 2 specialist neuro-rehabilitation services in England
2.To provide the commissioning dataset – Implementation of the multi-level payment model
3.To provide national ‘bench-marking’ information on: – Case-mix
– Outcomes
– Cost-benefits of rehabilitation
4.To inform – Capacity planning & service development

Future considerations
• What outcome measures are used
internationally UK/Canada in HIV?
– Research/practice
• Can we collaborate more closely on outcome
measurement?
• Are current rehab outcome tools adequately
validated in HIV, how much can we integrate
with current rehab outcome activity?