Pathways to higher education - UCL Institute of Education
53
© HEFCE 2006 May 2006/16 Issues paper This report is for information This report describes the attributes, progression to higher education, achievement within higher education and outcomes after graduation of students who have undertaken access courses. These courses, first established in the late 1970s, remain an important route into higher education for mature entrants: one in four first-time mature entrants to full-time degree programmes still enter via an access course. Pathways to higher education Access courses
Transcript of Pathways to higher education - UCL Institute of Education
© HEFCE 2006
May 2006/16 Issues paper This report is for information
This report describes the attributes, progression to higher education, achievement within higher education and outcomes after graduation of students who have undertaken access courses. These courses, first established in the late 1970s, remain an important route into higher education for mature entrants: one in four first-time mature entrants to full-time degree programmes still enter via an access course.
Pathways to higher education Access courses
1
Contents Page
Summary 3
Introduction 5
Sources and definitions 6
Trends in student numbers 9
Attributes 10
Progression from access courses to higher education 15
Achievement in higher education 31
After graduation: employment outcomes 33
Discussion and conclusions 35
References 40
Annex A: Cohort definitions 41
Annex B: Outline of overall linking process 42
Annex C: Paths of progression 44
Annex D: Universities and colleges with a QAA-recognised access course in 1998-99 45
Annex E: Extended tables 48
Annex F: Employment categories 51
List of abbreviations 52

2
Acknowledgements We are grateful to Professor Gareth Parry of the University of Sheffield, and Kath Dentith of the Quality Assurance Agency for their comments and suggestions.
3
Pathways to higher education: Access courses To Heads of publicly-funded higher education institutions in the UK
Heads of publicly-funded further education colleges in the UK Of interest to those responsible for
Student data, Widening participation, Learning and teaching
Reference 2006/16 Publication date May 2006 Enquiries to Mark Gittoes tel 0117 9317052
e-mail [email protected]
Summary Purpose 1. To describe the attributes, progression to higher education, achievement within higher education, and outcomes after graduating of students who have undertaken access courses. Key points 2. ‘Access to Higher Education’ courses, first established in the late 1970s, remain an important route into higher education for mature entrants. Though growth in student numbers has been modest in recent years, one in four first-time mature entrants to full-time degree programmes still enter via an access course. 3. We have taken the cohort of students who took access courses in 1998-99 and followed them through further study. This was the most recent cohort for whom, we were able to describe patterns of progression into and through higher education. 4. It was found that, of those starting an access course, more than half continue with some formal study, with 39 per cent on degree or other undergraduate programmes. Typically, the progression from access course to higher education involves a move from a further education college to a higher education institution (HEI). Though the access course students tend to choose an HEI near to their home, this does not mean that students on the same access course programme go to the same HEI. The average one-year access course group will have students going to about 12 different institutions to study at higher education level. 5. Of those who go on to higher education from access courses, most go onto full-time degree courses. They study a wide range of subjects, with ‘subjects allied to medicine’ being the most popular. 6. Two-thirds of these students from access courses on three or four year full-time degree programmes graduate within five years. This proportion compares favourably with other ‘non

4
A-level’ entrants. Further, six months after graduating, of those employed, 78 per cent were in ‘graduate’ jobs. 7. Given these achievements, we need to consider what potential exists to develop the ‘access course’ route? Policies are now in place to secure the funding, address the issue of fees and ensure wider recognition of access course qualifications. Together these have the potential to enable access course provision to make an even greater contribution to increasing and widening participation. Action required 8. No action is required in response to this document.
5
Introduction 9. This is the first of a series of reports providing information on pathways into higher education (HE). The series will describe the alternatives to what historically has been the ‘standard’ pathway of progression from school or college at aged 18 or 19, having gained A-levels or equivalent qualifications, to the first year of an undergraduate programme of study. There are various alternatives, involving different qualifications and modes of study, and diverse groups of students with differing experiences. In this report we consider just one such alternative: ‘Access to Higher Education’ courses, which will be simply referred to as ‘access courses’. 10. Access courses are investigated in this first report on alternative routes into HE partly for pragmatic reasons; they are relatively easy to identify. They are also important. For example, 25 percent of all the first time mature entrants to full-time degree programmes entered via an access course1. 11. Access courses were first established in the late 1970s. They provided an alternative to taking A-levels, often through part-time evening study, or taking a university-specific direct entry examination, for adults intending to enter higher education. At first the initiatives tended to be local, and the recognition of individual access qualifications was typically restricted to a small number of higher education institutions and departments. In 1989 a national framework, developed by the Committee of Vice-Chancellors and Principals (CVCP, the forerunner of Universities UK) and the Council for National Academic Awards, was launched. Responsibility for this scheme passed to the Higher Education Quality Council in 1992 and, in 1997, to the Quality Assurance Agency for Higher Education (QAA 2004a). 12. Though this scheme is now in its second decade, some courses still take place outside the national framework. We estimate that in 2003-04 about 10 per cent of access course provision was on schemes outside the QAA recognition process2. This is somewhat surprising because, at least in theory if not in practice, gaining recognition should have led to a more favourable funding status. The Learning and Skills Development Agency (LSDA 2003) found a variety of reasons why courses did not have recognition. They could be new innovative programmes which had not been through the recognition procedure, programmes for students under 21, ‘fast track’ programmes with lower levels of contact time, and so on. In some cases the courses had a narrow focus, for example for particular students, like, say, classroom assistants, preparing for particular programmes in higher education. 13. The QAA has published information about access courses from a variety of sources (QAA 2002, 2003, 2004a, 2005). This includes information about the characteristics of access courses and the students on them, their progression through the UCAS application system, and the courses and students within higher education whose highest qualification on entry 1 Based on all full-time first-degree entrants to HEIs in 2003-04 aged 21 or over on 30 September 2003. 2 Based on access courses in 2002-03 running within institutions that did not have a QAA-recognised access course in 2002-03.
6
was completion of an access course. What has been missing from these publications is any detailed information on what students do after the access course: whether they progress to higher education and, if they do, where and what they study. There are some summaries of students’ intentions while on the access course but, unsurprisingly, these contain a large proportion of ‘unknowns’. In this report, as well as providing more information on students on and from access courses, we fill the information gap by providing details of progression from access courses to higher education. This has been made possible by, for the first time, linking the individualised learner records3 (ILRs) and the Higher Education Statistics Agency (HESA) student records. By creating a single longitudinal record we are able to trace the transition from further to higher education. 14. There are six sections to this report:
a. Sources and definitions.
b. Trends in student numbers.
c. Attributes: course; provider; and student.
d. Progression from access courses to higher education programmes.
e. Achievement in higher education.
f. After graduation: employment outcomes.
Sources and definitions Data sources
15. Data are drawn from the Higher Education Statistics Agency (HESA) and the Learning and Skills Council (LSC) individualised learner records (ILRs) from 1998-99 through to 2003-04. 16. Individual students were tracked within and through each annual student dataset using a number of personal characteristics. For exact data definitions and further explanation of how students are tracked, see Annex B. 17. The list of universities and colleges with QAA-recognised courses in 1998-99 was provided by the QAA and is at Annex D.
3 From 1998-99 to 2001-02, the main LSC datasets were the individualised student records (ISRs). For this report, we will refer to both the ISR and ILR as the ILR.
7
Access courses
18. An access course is designed to prepare mature students who have few or no higher education entry-level qualifications for higher education. The access course itself is a further education (FE) level qualification, which means that both the student support available and funding of the provision is at FE level. Until 2003-04 the majority of access courses only accepted students aged 21 and above; the lower age limit has since been reduced to 19. Most courses take a year to complete, but both shorter and longer courses are reported. Some access courses are designed to allow progress to particular higher education courses, such as Access to Law, others provide more general preparation for higher education. 19. The final qualification of an access course is an Access to Higher Education certificate. These certificates can be awarded through a QAA Authorised Validating Agency (AVA) or through another awarding body. A course which awards access certificates through an AVA is described as a QAA-recognised course. For the purposes of this report, we use the term ‘access course’ to identify students on both QAA-recognised courses and those from other courses described as ‘access’. For further information see the QAA web-pages on access courses4. Defining the cohorts for analysis
20. We selected students on access courses from the LSC individualised learner record and Higher Education Statistics Agency Record (HESA). This means that provision at adult/community education centres that are not funded through a further education college (FEC) are excluded 5. 21. The access courses returned on the ILR and HESA records vary in length, intensity and content. For this study, we aim to look at English domiciled students with no recent higher education experience, studying on access courses at FECs and higher education institutions (HEIs) in England of a particular length/intensity which are funded through the LSC. 22. Most of the analysis reported here is for the cohort of students studying on access courses in 1998-99. Where cohorts from later years have been taken, we have stated this. 23. The main difficulty in carrying out this analysis has been to accurately identify which students are on access courses in preparation for higher education. The ILR typically has about 8 to 10 million records, less than 0.5 per cent of which relate to access courses. Further, the access courses have to be identified via a qualifications database, containing around 100,000 qualifications of which only 6,000 are access courses. Clearly there is a significant risk of misidentification. We know from investigations by the LSDA (LSDA 2003) that some colleges with access course provision had not submitted any records identifying students as being on these courses. The approach we have taken for this analysis has been
4 ‘Access to higher education – A full explanation’, www.qaa.ac.uk/access/full.asp 5 Adult/community education centres represent about 5% of providers (QAA 2004). It is not clear what proportion of these are funded through a FEC.
8
to ensure, as far as possible, that all the records used have referred to students on access courses, at the cost of probably missing some provision. 24. To ensure that, as far as possible, only records relating to access courses are included, we have excluded the following.
Courses whose level is given as not equivalent to Level 3 a. A number of courses are recorded as access courses but whose level is not recorded as Level 3 (in other words, those courses one level below HE). For the purpose of this report, we are only examining courses equivalent to Level 3. Students not funded by the LSC b. We would expect access courses to be funded by the LSC and, where provision is returned as not being so funded, it is more likely that the courses has been wrongly identified as an access course to higher education. Students who have experienced higher education in academic years 1997-98 and/or 1998-99 c. Students who have been or are already in higher education will produce misleading progression rates for access courses.
LSC funded but not English domiciled d. Small in number and could have different characteristics to the rest of the cohort, particularly in terms of progression patterns. Short and long courses e. We found courses returned with course length of short (six months or less) or long (more than two years), compared with what would normally be expected for an access course. Again, it seemed possible, or even likely, that a high proportion of these were not access courses as we understand them, and they were therefore excluded.
For most of the analysis we also exclude records from colleges which are not listed as providing QAA-recognised courses in 1998-99.
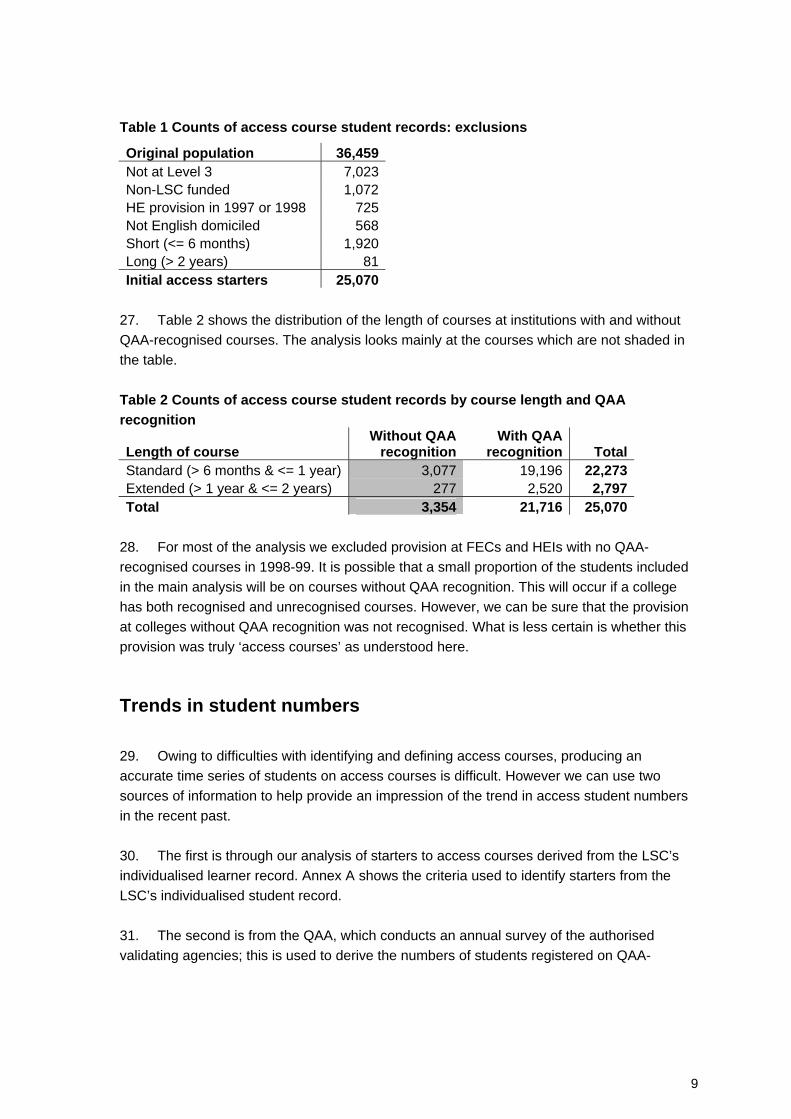
25. Table 1 shows how these exclusions affect our initial count of students on access courses. 26. For most of the analysis reported, we focus on access courses that are expected to last between 6 and 12 months (standard), and between a year and two years (extended). There is some uncertainty about whether courses outside this range are access courses as conventionally understood.
9
Table 1 Counts of access course student records: exclusions
Original population 36,459Not at Level 3 7,023Non-LSC funded 1,072HE provision in 1997 or 1998 725Not English domiciled 568Short (<= 6 months) 1,920Long (> 2 years) 81Initial access starters 25,070
27. Table 2 shows the distribution of the length of courses at institutions with and without QAA-recognised courses. The analysis looks mainly at the courses which are not shaded in the table. Table 2 Counts of access course student records by course length and QAA recognition
Length of course Without QAA
recognitionWith QAA
recognition Total Standard (> 6 months & <= 1 year) 3,077 19,196 22,273 Extended (> 1 year & <= 2 years) 277 2,520 2,797 Total 3,354 21,716 25,070
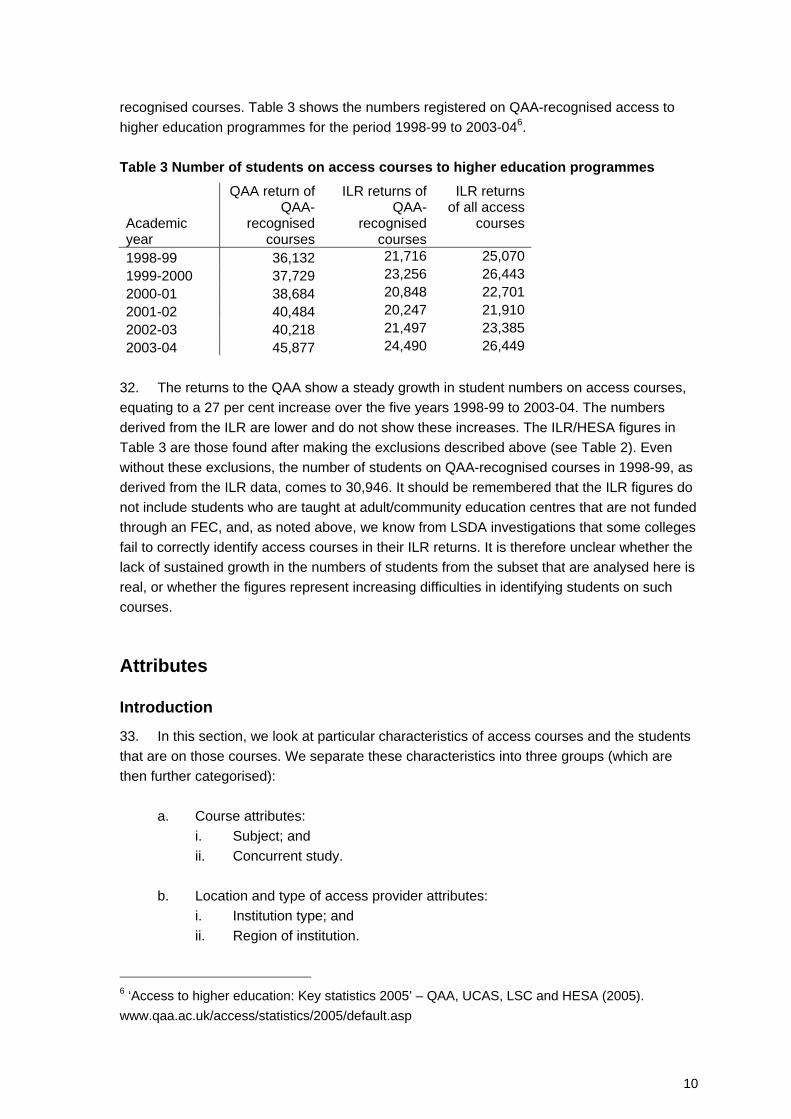
28. For most of the analysis we excluded provision at FECs and HEIs with no QAA-recognised courses in 1998-99. It is possible that a small proportion of the students included in the main analysis will be on courses without QAA recognition. This will occur if a college has both recognised and unrecognised courses. However, we can be sure that the provision at colleges without QAA recognition was not recognised. What is less certain is whether this provision was truly ‘access courses’ as understood here. Trends in student numbers 29. Owing to difficulties with identifying and defining access courses, producing an accurate time series of students on access courses is difficult. However we can use two sources of information to help provide an impression of the trend in access student numbers in the recent past. 30. The first is through our analysis of starters to access courses derived from the LSC’s individualised learner record. Annex A shows the criteria used to identify starters from the LSC’s individualised student record. 31. The second is from the QAA, which conducts an annual survey of the authorised validating agencies; this is used to derive the numbers of students registered on QAA-
10
recognised courses. Table 3 shows the numbers registered on QAA-recognised access to higher education programmes for the period 1998-99 to 2003-046. Table 3 Number of students on access courses to higher education programmes
Academic year
QAA return of QAA-
recognised courses
ILR returns of QAA-
recognised courses
ILR returns of all access
courses
1998-99 36,132 21,716 25,0701999-2000 37,729 23,256 26,4432000-01 38,684 20,848 22,7012001-02 40,484 20,247 21,9102002-03 40,218 21,497 23,3852003-04 45,877 24,490 26,449
32. The returns to the QAA show a steady growth in student numbers on access courses, equating to a 27 per cent increase over the five years 1998-99 to 2003-04. The numbers derived from the ILR are lower and do not show these increases. The ILR/HESA figures in Table 3 are those found after making the exclusions described above (see Table 2). Even without these exclusions, the number of students on QAA-recognised courses in 1998-99, as derived from the ILR data, comes to 30,946. It should be remembered that the ILR figures do not include students who are taught at adult/community education centres that are not funded through an FEC, and, as noted above, we know from LSDA investigations that some colleges fail to correctly identify access courses in their ILR returns. It is therefore unclear whether the lack of sustained growth in the numbers of students from the subset that are analysed here is real, or whether the figures represent increasing difficulties in identifying students on such courses. Attributes Introduction
33. In this section, we look at particular characteristics of access courses and the students that are on those courses. We separate these characteristics into three groups (which are then further categorised):
a. Course attributes: i. Subject; and ii. Concurrent study.
b. Location and type of access provider attributes:
i. Institution type; and ii. Region of institution.
6 ‘Access to higher education: Key statistics 2005’ – QAA, UCAS, LSC and HESA (2005). www.qaa.ac.uk/access/statistics/2005/default.asp
11
c. Student attributes: i. Sex; ii. Age on commencement; and iii. Ethnicity.
34. For analysis of students within higher education, one of the most common distinctions used is whether the student’s studies are full- or part-time. However this distinction is less meaningful when considering further education. For the purposes of this assessment of characteristics, we identify the intensity of study on the access course through the expected length of course as defined in paragraphs 26 and 27. 35. The results reported are based on English domiciled students with no recent higher education experience, who began on an access course at FECs and HEIs in England in 1998-99. This cohort contains 19,196 students on standard length access courses and 2,520 on extended length courses. Course attributes
Subject
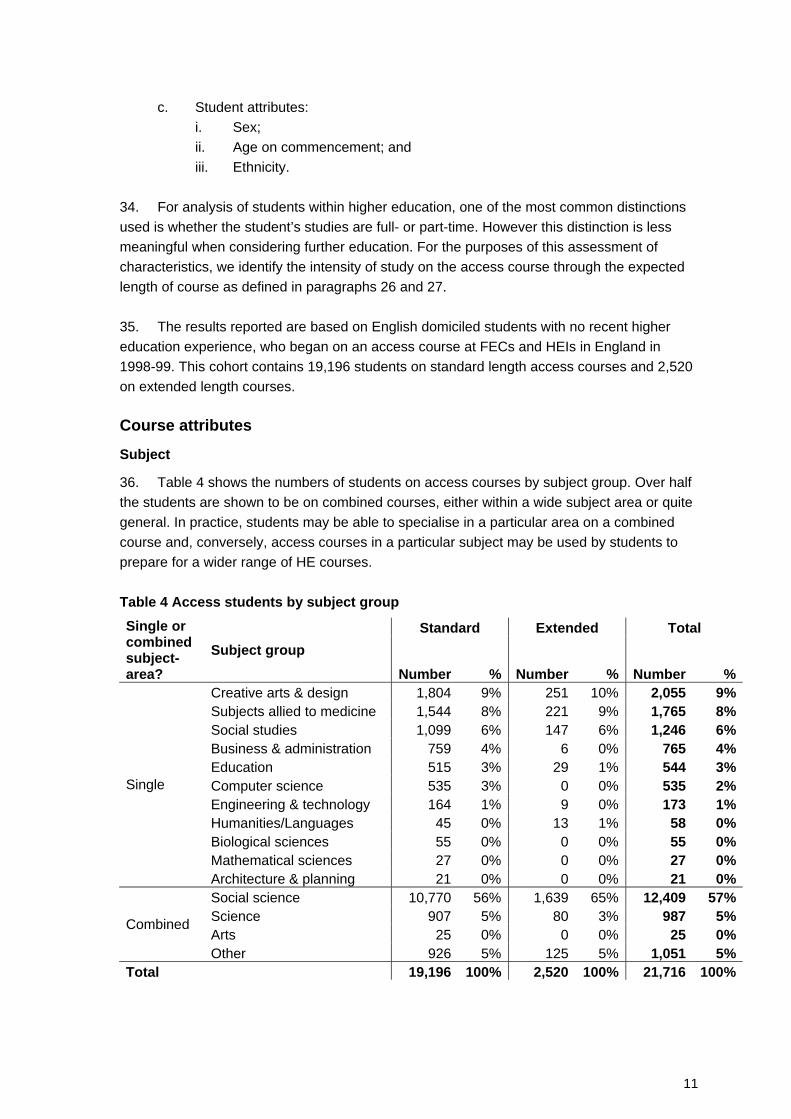
36. Table 4 shows the numbers of students on access courses by subject group. Over half the students are shown to be on combined courses, either within a wide subject area or quite general. In practice, students may be able to specialise in a particular area on a combined course and, conversely, access courses in a particular subject may be used by students to prepare for a wider range of HE courses. Table 4 Access students by subject group
Standard Extended Total Single or combined subject-area?
Subject group Number % Number % Number %
Creative arts & design 1,804 9% 251 10% 2,055 9%Subjects allied to medicine 1,544 8% 221 9% 1,765 8%Social studies 1,099 6% 147 6% 1,246 6%Business & administration 759 4% 6 0% 765 4%Education 515 3% 29 1% 544 3%Computer science 535 3% 0 0% 535 2%Engineering & technology 164 1% 9 0% 173 1%Humanities/Languages 45 0% 13 1% 58 0%Biological sciences 55 0% 0 0% 55 0%Mathematical sciences 27 0% 0 0% 27 0%
Single
Architecture & planning 21 0% 0 0% 21 0%Social science 10,770 56% 1,639 65% 12,409 57%Science 907 5% 80 3% 987 5%Arts 25 0% 0 0% 25 0%
Combined
Other 926 5% 125 5% 1,051 5%Total 19,196 100% 2,520 100% 21,716 100%
12
Concurrent study
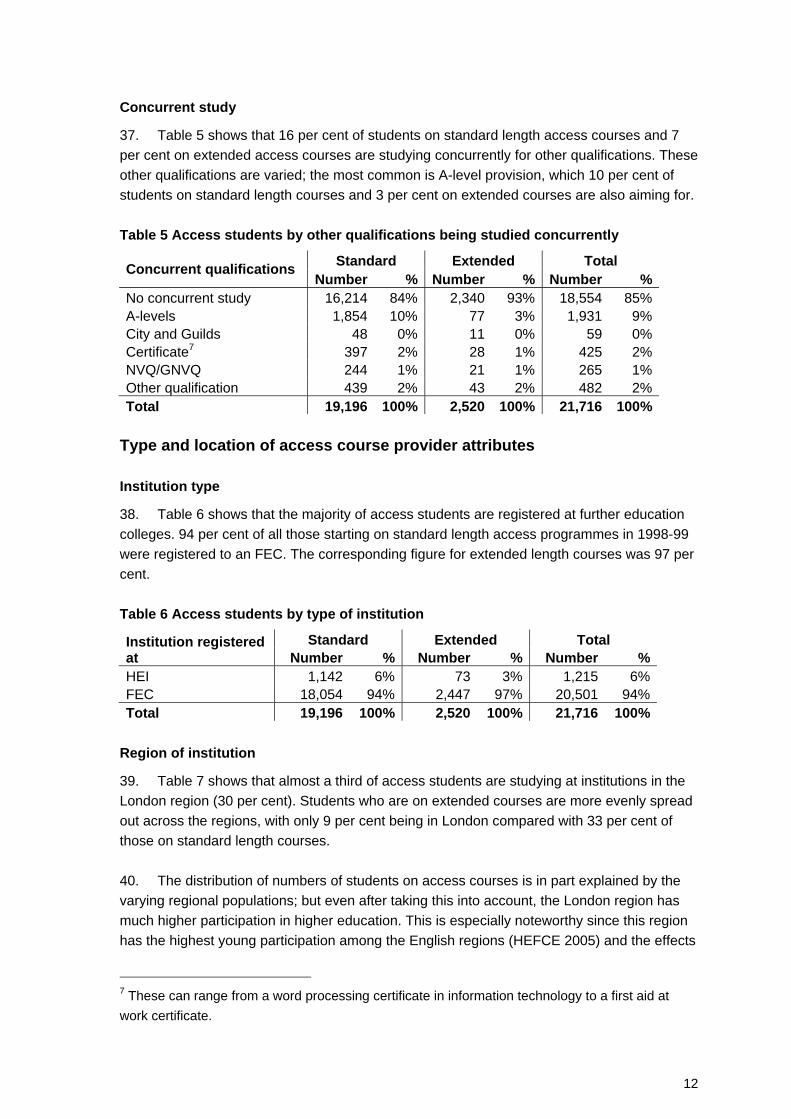
37. Table 5 shows that 16 per cent of students on standard length access courses and 7 per cent on extended access courses are studying concurrently for other qualifications. These other qualifications are varied; the most common is A-level provision, which 10 per cent of students on standard length courses and 3 per cent on extended courses are also aiming for. Table 5 Access students by other qualifications being studied concurrently
Standard Extended Total Concurrent qualifications Number % Number % Number %
No concurrent study 16,214 84% 2,340 93% 18,554 85% A-levels 1,854 10% 77 3% 1,931 9% City and Guilds 48 0% 11 0% 59 0% Certificate7 397 2% 28 1% 425 2% NVQ/GNVQ 244 1% 21 1% 265 1% Other qualification 439 2% 43 2% 482 2% Total 19,196 100% 2,520 100% 21,716 100%
Type and location of access course provider attributes Institution type
38. Table 6 shows that the majority of access students are registered at further education colleges. 94 per cent of all those starting on standard length access programmes in 1998-99 were registered to an FEC. The corresponding figure for extended length courses was 97 per cent. Table 6 Access students by type of institution
Standard Extended Total Institution registered at Number % Number % Number % HEI 1,142 6% 73 3% 1,215 6% FEC 18,054 94% 2,447 97% 20,501 94% Total 19,196 100% 2,520 100% 21,716 100%
Region of institution
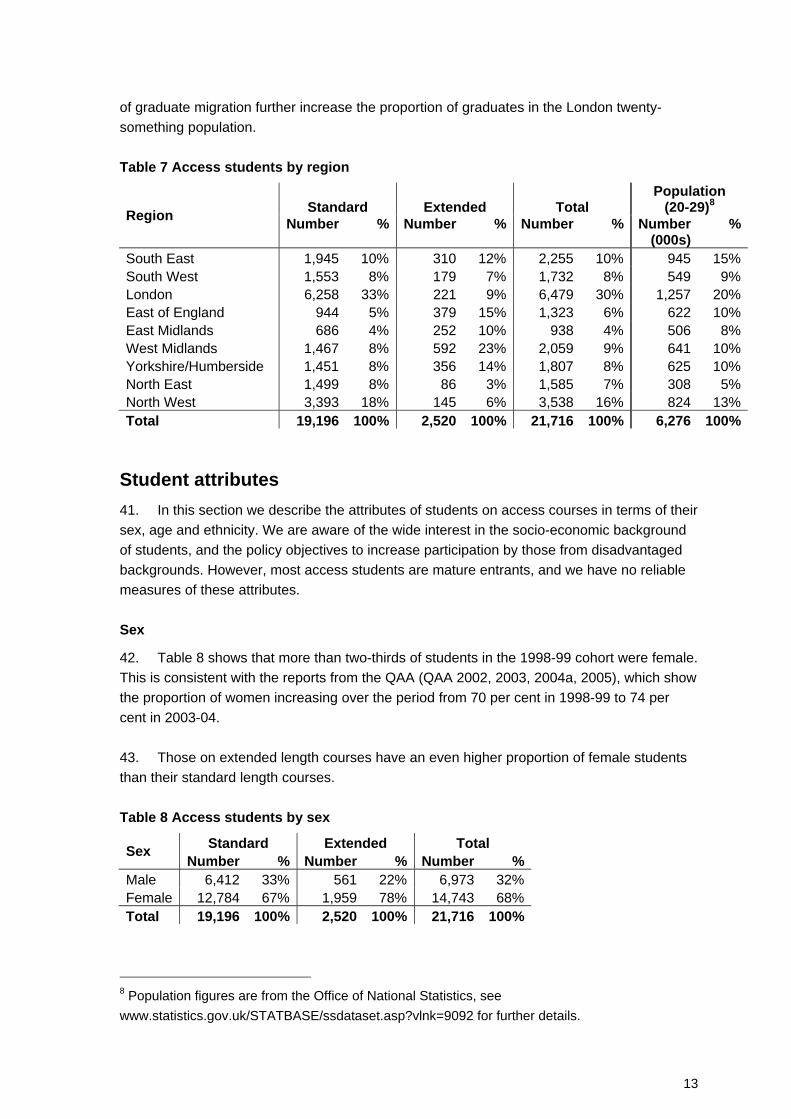
39. Table 7 shows that almost a third of access students are studying at institutions in the London region (30 per cent). Students who are on extended courses are more evenly spread out across the regions, with only 9 per cent being in London compared with 33 per cent of those on standard length courses. 40. The distribution of numbers of students on access courses is in part explained by the varying regional populations; but even after taking this into account, the London region has much higher participation in higher education. This is especially noteworthy since this region has the highest young participation among the English regions (HEFCE 2005) and the effects
7 These can range from a word processing certificate in information technology to a first aid at work certificate.
13
of graduate migration further increase the proportion of graduates in the London twenty-something population. Table 7 Access students by region
Standard Extended Total Population
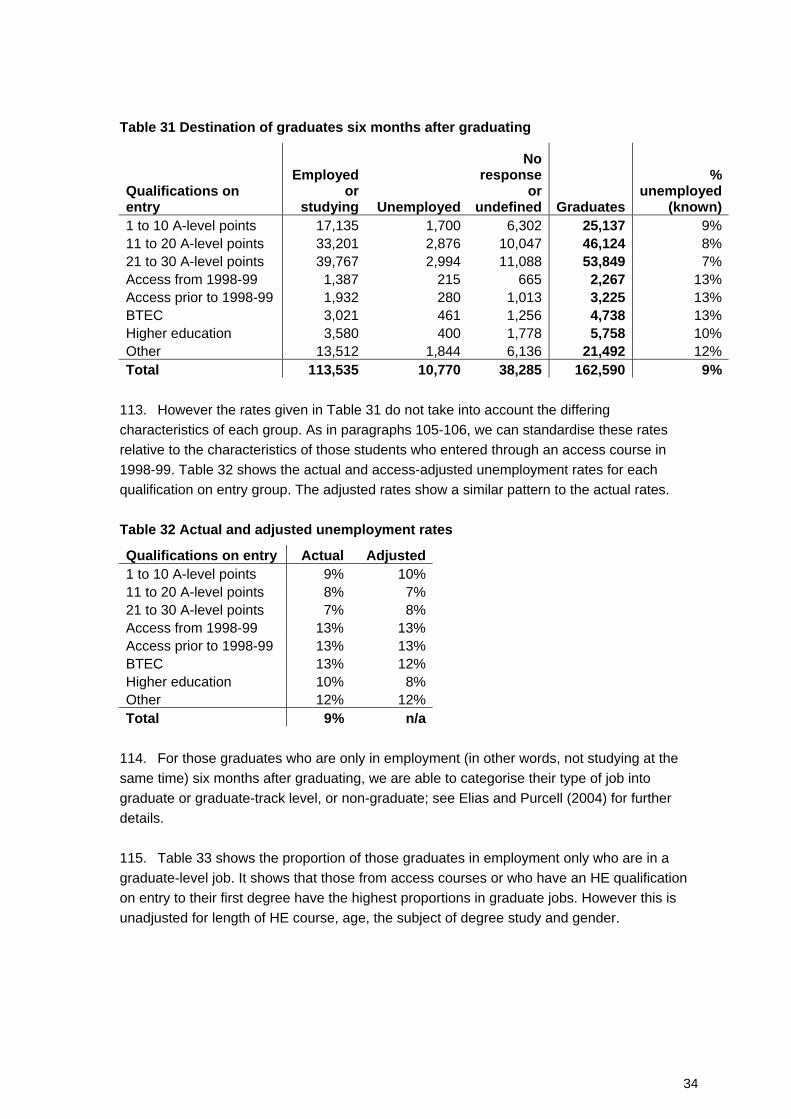
(20-29)8 Region Number % Number % Number
%
Number(000s)
%
South East 1,945 10% 310 12% 2,255 10% 945 15%South West 1,553 8% 179 7% 1,732 8% 549 9%London 6,258 33% 221 9% 6,479 30% 1,257 20%East of England 944 5% 379 15% 1,323 6% 622 10%East Midlands 686 4% 252 10% 938 4% 506 8%West Midlands 1,467 8% 592 23% 2,059 9% 641 10%Yorkshire/Humberside 1,451 8% 356 14% 1,807 8% 625 10%North East 1,499 8% 86 3% 1,585 7% 308 5%North West 3,393 18% 145 6% 3,538 16% 824 13%Total 19,196 100% 2,520 100% 21,716 100% 6,276 100%
Student attributes 41. In this section we describe the attributes of students on access courses in terms of their sex, age and ethnicity. We are aware of the wide interest in the socio-economic background of students, and the policy objectives to increase participation by those from disadvantaged backgrounds. However, most access students are mature entrants, and we have no reliable measures of these attributes. Sex
42. Table 8 shows that more than two-thirds of students in the 1998-99 cohort were female. This is consistent with the reports from the QAA (QAA 2002, 2003, 2004a, 2005), which show the proportion of women increasing over the period from 70 per cent in 1998-99 to 74 per cent in 2003-04. 43. Those on extended length courses have an even higher proportion of female students than their standard length courses. Table 8 Access students by sex
Standard Extended Total Sex Number % Number % Number %
Male 6,412 33% 561 22% 6,973 32%Female 12,784 67% 1,959 78% 14,743 68%Total 19,196 100% 2,520 100% 21,716 100%
8 Population figures are from the Office of National Statistics, see www.statistics.gov.uk/STATBASE/ssdataset.asp?vlnk=9092 for further details.
14
Age on commencement of course
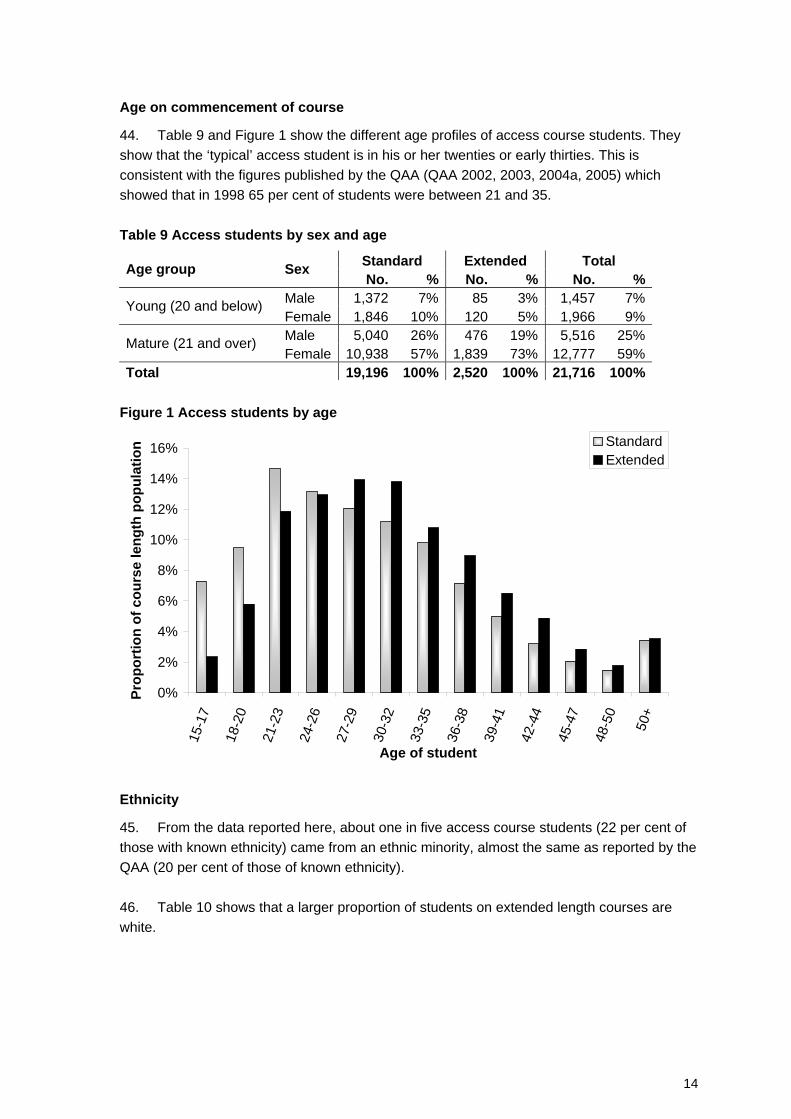
44. Table 9 and Figure 1 show the different age profiles of access course students. They show that the ‘typical’ access student is in his or her twenties or early thirties. This is consistent with the figures published by the QAA (QAA 2002, 2003, 2004a, 2005) which showed that in 1998 65 per cent of students were between 21 and 35. Table 9 Access students by sex and age
Standard Extended Total Age group Sex No. % No. % No. %
Male 1,372 7% 85 3% 1,457 7% Young (20 and below) Female 1,846 10% 120 5% 1,966 9% Male 5,040 26% 476 19% 5,516 25% Mature (21 and over) Female 10,938 57% 1,839 73% 12,777 59%
Total 19,196 100% 2,520 100% 21,716 100% Figure 1 Access students by age
0%
2%
4%
6%
8%
10%
12%
14%
16%
15-1
7
18-2
0
21-2
3
24-2
6
27-2
9
30-3
2
33-3
5
36-3
8
39-4
1
42-4
4
45-4
7
48-5
0
50+
Age of student
Prop
ortio
n of
cou
rse
leng
th p
opul
atio
n StandardExtended
Ethnicity
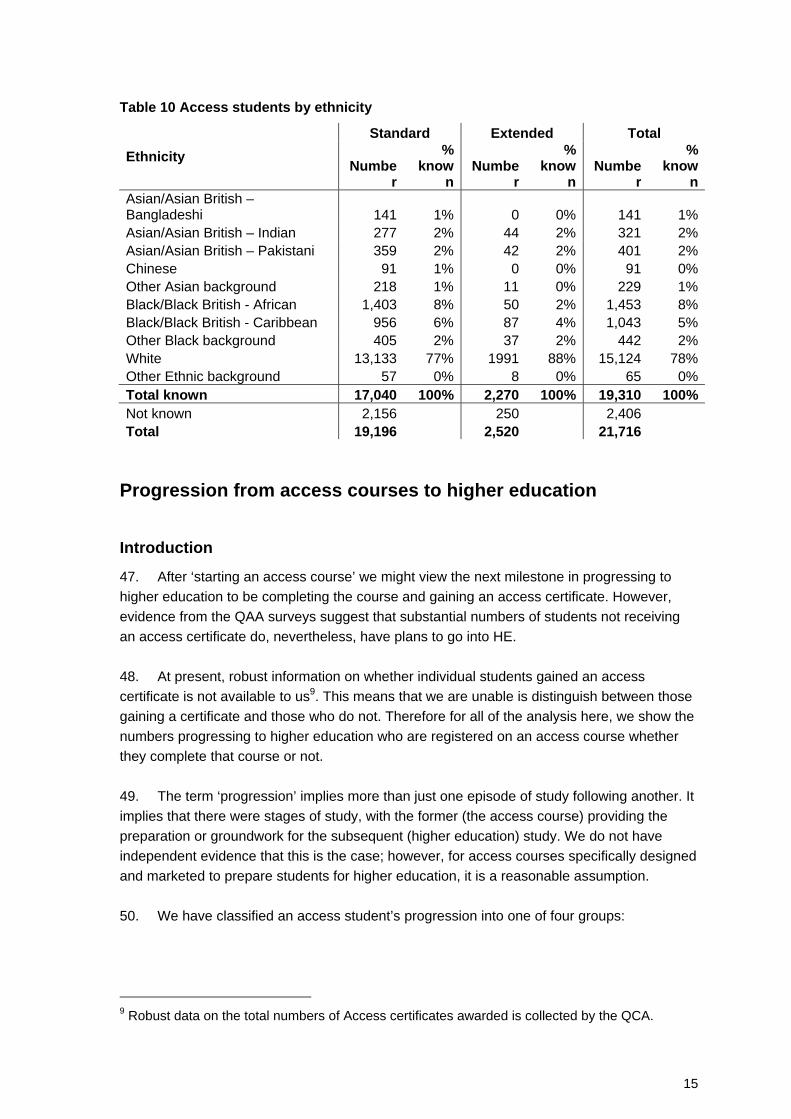
45. From the data reported here, about one in five access course students (22 per cent of those with known ethnicity) came from an ethnic minority, almost the same as reported by the QAA (20 per cent of those of known ethnicity). 46. Table 10 shows that a larger proportion of students on extended length courses are white.
15
Table 10 Access students by ethnicity Standard Extended Total
Ethnicity Number
% know
nNumbe
r
% know
n Numbe
r
% know
nAsian/Asian British – Bangladeshi 141 1% 0 0% 141 1%Asian/Asian British – Indian 277 2% 44 2% 321 2%Asian/Asian British – Pakistani 359 2% 42 2% 401 2%Chinese 91 1% 0 0% 91 0%Other Asian background 218 1% 11 0% 229 1%Black/Black British - African 1,403 8% 50 2% 1,453 8%Black/Black British - Caribbean 956 6% 87 4% 1,043 5%Other Black background 405 2% 37 2% 442 2%White 13,133 77% 1991 88% 15,124 78%Other Ethnic background 57 0% 8 0% 65 0%Total known 17,040 100% 2,270 100% 19,310 100%Not known 2,156 250 2,406 Total 19,196 2,520 21,716
Progression from access courses to higher education
Introduction
47. After ‘starting an access course’ we might view the next milestone in progressing to higher education to be completing the course and gaining an access certificate. However, evidence from the QAA surveys suggest that substantial numbers of students not receiving an access certificate do, nevertheless, have plans to go into HE. 48. At present, robust information on whether individual students gained an access certificate is not available to us9. This means that we are unable is distinguish between those gaining a certificate and those who do not. Therefore for all of the analysis here, we show the numbers progressing to higher education who are registered on an access course whether they complete that course or not. 49. The term ‘progression’ implies more than just one episode of study following another. It implies that there were stages of study, with the former (the access course) providing the preparation or groundwork for the subsequent (higher education) study. We do not have independent evidence that this is the case; however, for access courses specifically designed and marketed to prepare students for higher education, it is a reasonable assumption. 50. We have classified an access student’s progression into one of four groups:
9 Robust data on the total numbers of Access certificates awarded is collected by the QCA.
16
a. Registered on a first degree-level course or above at a UK HEI or English FEC. These are referred to simply as ‘degree level’.
b. Registered on another undergraduate level course at a UK HEI or English FEC. This includes students on programmes leading to certificates or diplomas in higher education, HNDs, HNCs, foundation degrees, or institutional undergraduate credits. These are referred to as ‘OUG level’.
c. Registered on a further education (FE) course at a UK HEI or English FEC in a later year. These are referred to as ‘FE level’.
d. Not registered on an undergraduate or FE level course at a UK HEI or English FEC, described as ‘no HE or FE’.
We refer to both ‘degree level’ (‘a’) and ‘OUG level’ (‘b’) taken together as undergraduate level (UG). 51. On leaving an access course a student could progress onto another FE course (c), then to, say, an HND (b) and finally onto a degree programme (a). We do not present such details, but only show the highest level study. The focus of this analysis is progression to higher education – levels a and b above – though we provide summary statistics on numbers of students who have studied further at FE level (level c) but no higher. References to ‘No HE’ represents students who fall into levels below b. 52. The results in this section refer to being registered on the course before 1 August 2004, having started on an access course in academic year 1998-99. 53. Our analysis of progression from an access course is split by a number of characteristics of the progression as listed below:
a. Overall progression characteristics. b. Relationship between the access course provider and institution of HE study.
c. Characteristics of access course providers.
d. Characteristics of access courses.
e. Characteristics of access students.
54. For sections c, d and e on the characteristics of providers, courses and students, any breakdowns that produce tables with less than 50 people in any particular cell are given in Annex E. Where appropriate, an aggregated table is given in the main text (marked as ‘aggregated’ in the title). This is because tables that contain cells with small numbers can cause progression rates to be highly sensitive to random variation and be potentially misleading.
17
Overall progression characteristics
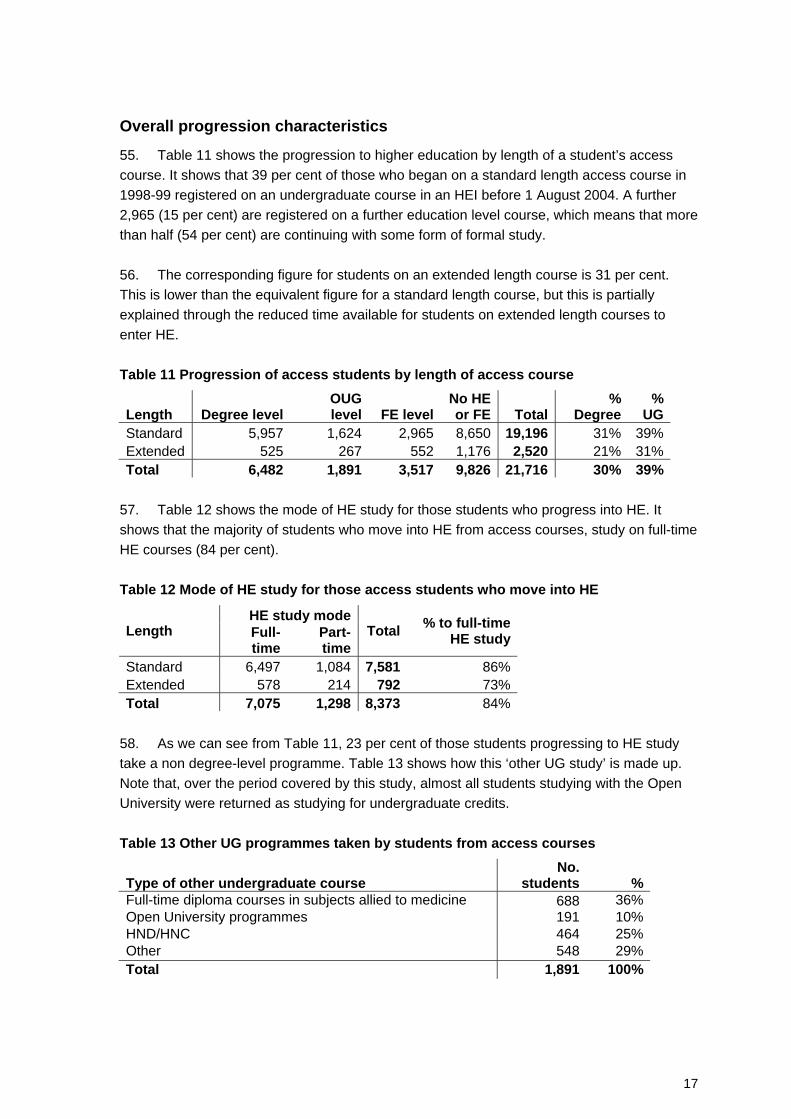
55. Table 11 shows the progression to higher education by length of a student’s access course. It shows that 39 per cent of those who began on a standard length access course in 1998-99 registered on an undergraduate course in an HEI before 1 August 2004. A further 2,965 (15 per cent) are registered on a further education level course, which means that more than half (54 per cent) are continuing with some form of formal study. 56. The corresponding figure for students on an extended length course is 31 per cent. This is lower than the equivalent figure for a standard length course, but this is partially explained through the reduced time available for students on extended length courses to enter HE. Table 11 Progression of access students by length of access course
Length Degree level OUG level FE level
No HE or FE Total
% Degree
% UG
Standard 5,957 1,624 2,965 8,650 19,196 31% 39%Extended 525 267 552 1,176 2,520 21% 31%Total 6,482 1,891 3,517 9,826 21,716 30% 39%
57. Table 12 shows the mode of HE study for those students who progress into HE. It shows that the majority of students who move into HE from access courses, study on full-time HE courses (84 per cent). Table 12 Mode of HE study for those access students who move into HE
HE study modeLength Full-
time Part-time
Total % to full-time HE study
Standard 6,497 1,084 7,581 86%Extended 578 214 792 73%Total 7,075 1,298 8,373 84%
58. As we can see from Table 11, 23 per cent of those students progressing to HE study take a non degree-level programme. Table 13 shows how this ‘other UG study’ is made up. Note that, over the period covered by this study, almost all students studying with the Open University were returned as studying for undergraduate credits. Table 13 Other UG programmes taken by students from access courses
Type of other undergraduate course No.
students % Full-time diploma courses in subjects allied to medicine 688 36% Open University programmes 191 10% HND/HNC 464 25% Other 548 29% Total 1,891 100%
18
Time to progress from access course to HE
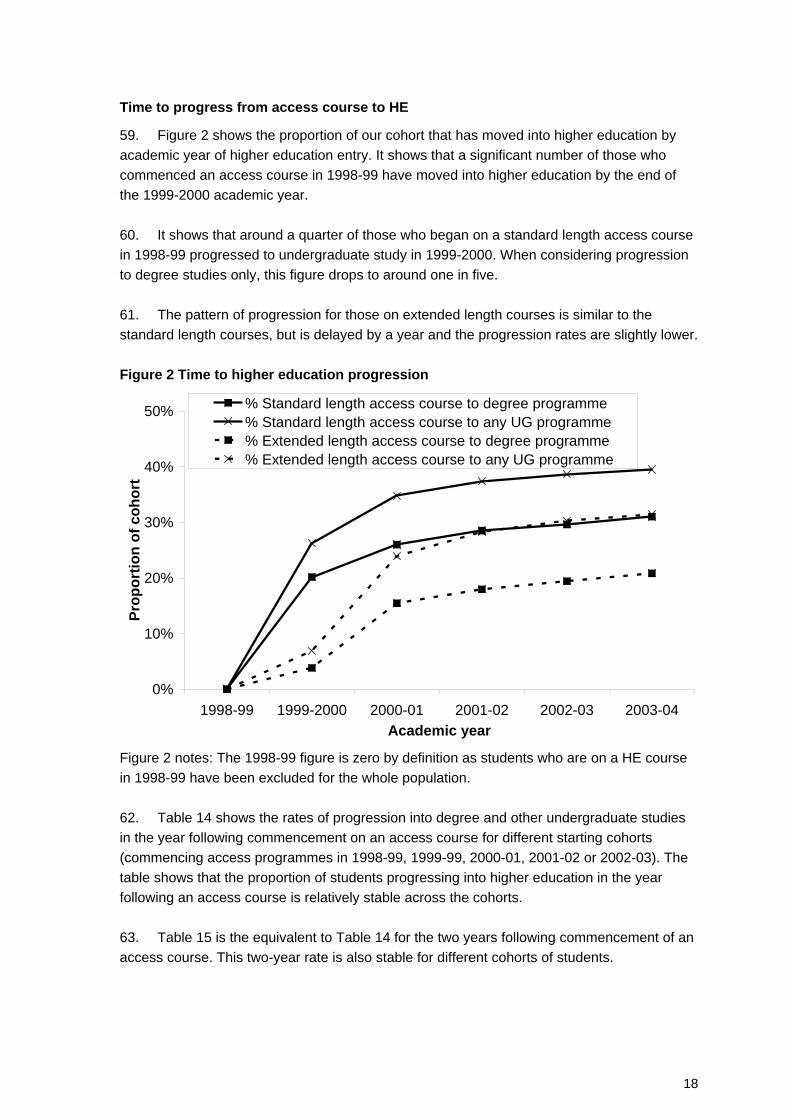
59. Figure 2 shows the proportion of our cohort that has moved into higher education by academic year of higher education entry. It shows that a significant number of those who commenced an access course in 1998-99 have moved into higher education by the end of the 1999-2000 academic year. 60. It shows that around a quarter of those who began on a standard length access course in 1998-99 progressed to undergraduate study in 1999-2000. When considering progression to degree studies only, this figure drops to around one in five. 61. The pattern of progression for those on extended length courses is similar to the standard length courses, but is delayed by a year and the progression rates are slightly lower. Figure 2 Time to higher education progression
0%
10%
20%
30%
40%
50%
1998-99 1999-2000 2000-01 2001-02 2002-03 2003-04Academic year
Prop
ortio
n of
coh
ort
% Standard length access course to degree programme% Standard length access course to any UG programme% Extended length access course to degree programme% Extended length access course to any UG programme
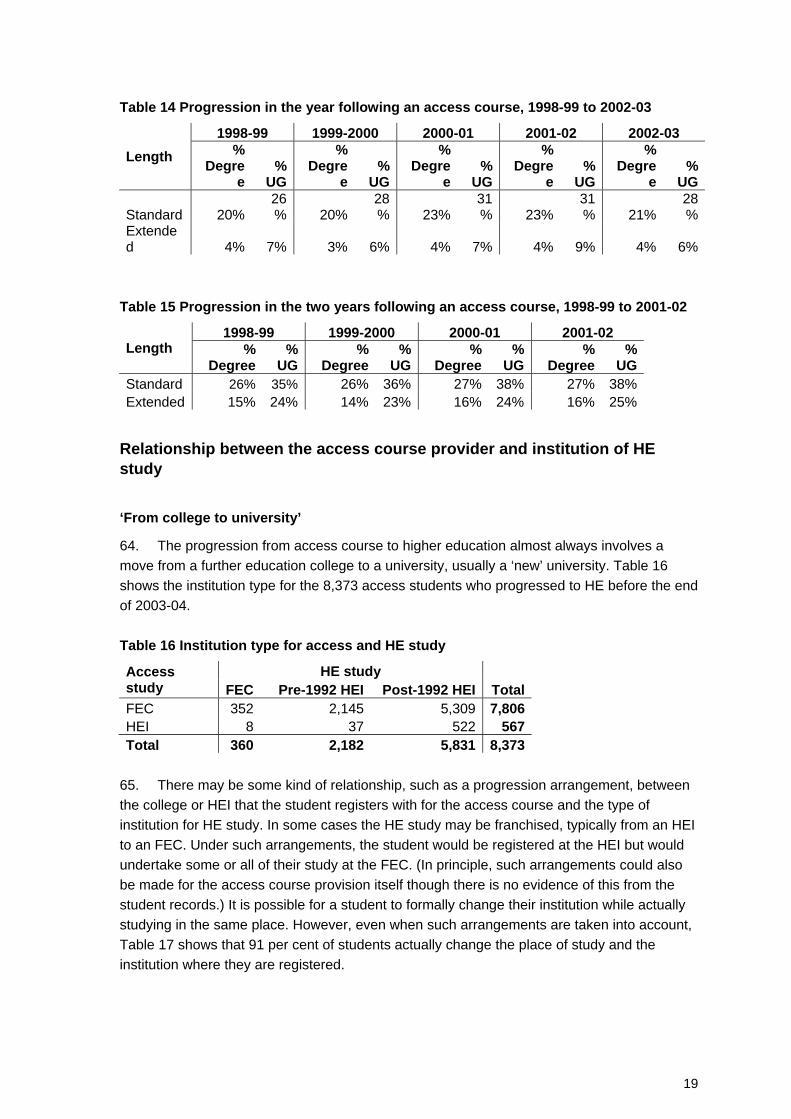
Figure 2 notes: The 1998-99 figure is zero by definition as students who are on a HE course in 1998-99 have been excluded for the whole population. 62. Table 14 shows the rates of progression into degree and other undergraduate studies in the year following commencement on an access course for different starting cohorts (commencing access programmes in 1998-99, 1999-99, 2000-01, 2001-02 or 2002-03). The table shows that the proportion of students progressing into higher education in the year following an access course is relatively stable across the cohorts. 63. Table 15 is the equivalent to Table 14 for the two years following commencement of an access course. This two-year rate is also stable for different cohorts of students.
19
Table 14 Progression in the year following an access course, 1998-99 to 2002-03
1998-99 1999-2000 2000-01 2001-02 2002-03 Length %
Degree
% UG
% Degre
e%
UG
% Degre
e%
UG
% Degre
e%
UG
% Degre
e%
UG
Standard 20%26% 20%
28% 23%
31% 23%
31% 21%
28%
Extended 4% 7% 3% 6% 4% 7% 4% 9% 4% 6%
Table 15 Progression in the two years following an access course, 1998-99 to 2001-02
1998-99 1999-2000 2000-01 2001-02 Length %
Degree %
UG %
Degree%
UG%
Degree%
UG%
Degree %
UG Standard 26% 35% 26% 36% 27% 38% 27% 38% Extended 15% 24% 14% 23% 16% 24% 16% 25%
Relationship between the access course provider and institution of HE study
‘From college to university’
64. The progression from access course to higher education almost always involves a move from a further education college to a university, usually a ‘new’ university. Table 16 shows the institution type for the 8,373 access students who progressed to HE before the end of 2003-04. Table 16 Institution type for access and HE study
HE study Access study FEC Pre-1992 HEI Post-1992 HEI TotalFEC 352 2,145 5,309 7,806HEI 8 37 522 567Total 360 2,182 5,831 8,373
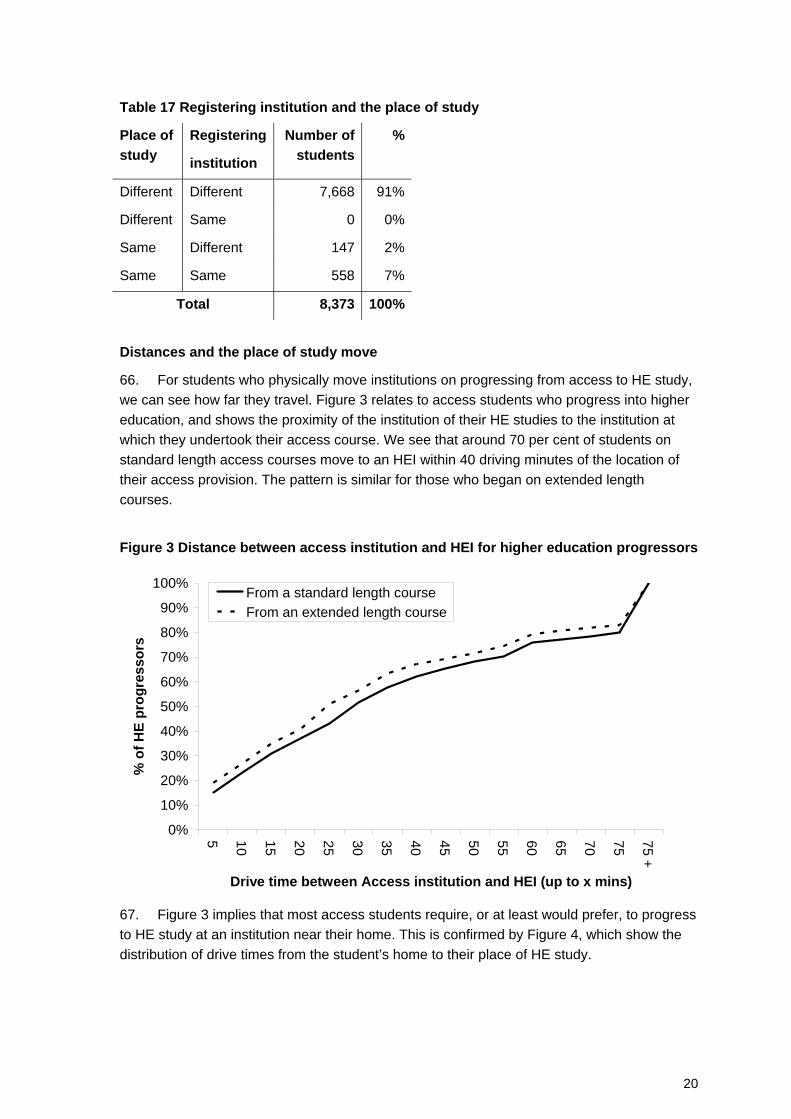
65. There may be some kind of relationship, such as a progression arrangement, between the college or HEI that the student registers with for the access course and the type of institution for HE study. In some cases the HE study may be franchised, typically from an HEI to an FEC. Under such arrangements, the student would be registered at the HEI but would undertake some or all of their study at the FEC. (In principle, such arrangements could also be made for the access course provision itself though there is no evidence of this from the student records.) It is possible for a student to formally change their institution while actually studying in the same place. However, even when such arrangements are taken into account, Table 17 shows that 91 per cent of students actually change the place of study and the institution where they are registered.
20
Table 17 Registering institution and the place of study
Place of study
Registering
institution
Number of students
%
Different Different 7,668 91%
Different Same 0 0%
Same Different 147 2%
Same Same 558 7%
Total 8,373 100%
Distances and the place of study move
66. For students who physically move institutions on progressing from access to HE study, we can see how far they travel. Figure 3 relates to access students who progress into higher education, and shows the proximity of the institution of their HE studies to the institution at which they undertook their access course. We see that around 70 per cent of students on standard length access courses move to an HEI within 40 driving minutes of the location of their access provision. The pattern is similar for those who began on extended length courses.
Figure 3 Distance between access institution and HEI for higher education progressors
0%
10%
20%
30%
40%
50%
60%
70%
80%
90%
100%5 10 15 20 25 30 35 40 45 50 55 60 65 70 75 75 +
Drive time between Access institution and HEI (up to x mins)
% o
f HE
prog
ress
ors
From a standard length courseFrom an extended length course
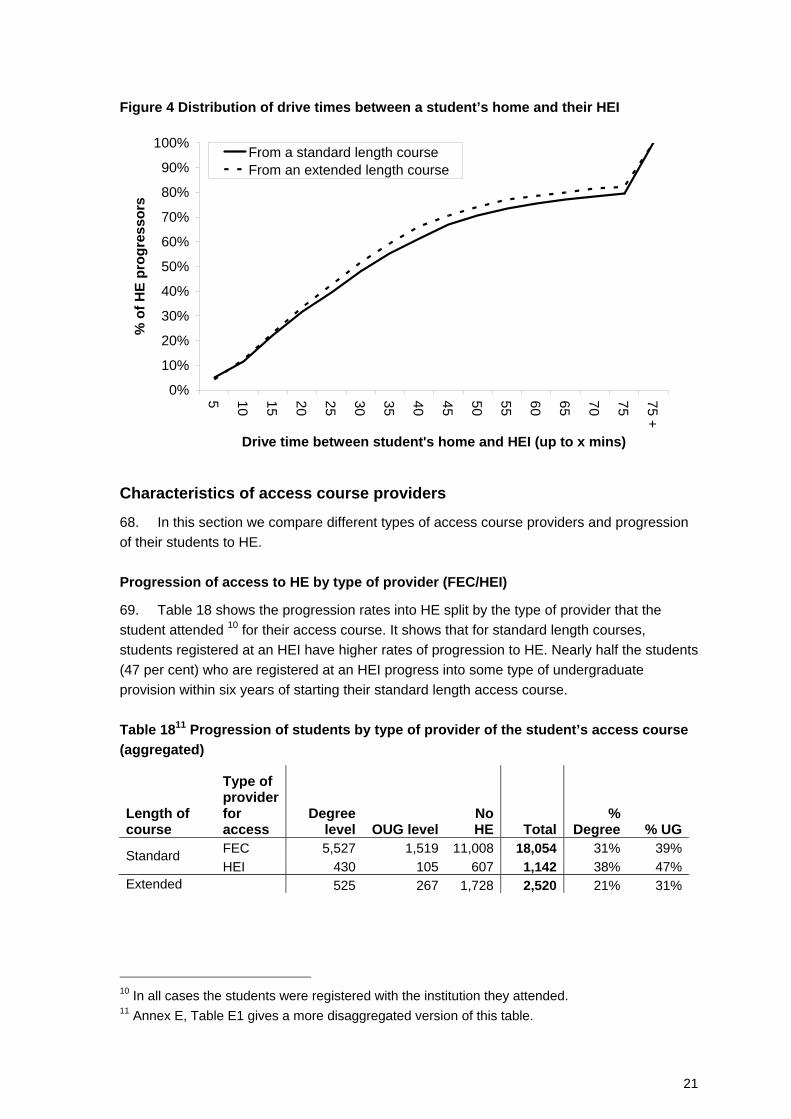
67. Figure 3 implies that most access students require, or at least would prefer, to progress to HE study at an institution near their home. This is confirmed by Figure 4, which show the distribution of drive times from the student’s home to their place of HE study.
21
Figure 4 Distribution of drive times between a student’s home and their HEI
0%
10%
20%
30%
40%
50%
60%
70%
80%
90%
100%
5 10 15 20 25 30 35 40 45 50 55 60 65 70 75 75 +
Drive time between student's home and HEI (up to x mins)
% o
f HE
prog
ress
ors
From a standard length courseFrom an extended length course
Characteristics of access course providers
68. In this section we compare different types of access course providers and progression of their students to HE. Progression of access to HE by type of provider (FEC/HEI)
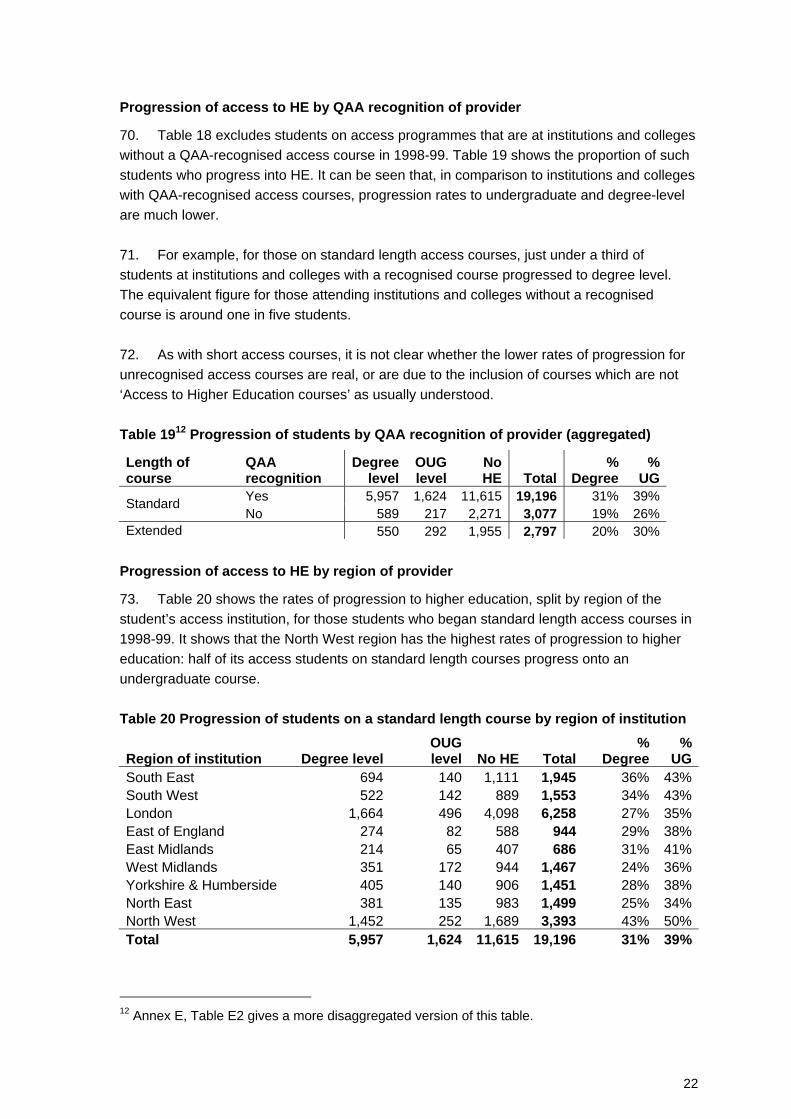
69. Table 18 shows the progression rates into HE split by the type of provider that the student attended 10 for their access course. It shows that for standard length courses, students registered at an HEI have higher rates of progression to HE. Nearly half the students (47 per cent) who are registered at an HEI progress into some type of undergraduate provision within six years of starting their standard length access course. Table 1811 Progression of students by type of provider of the student’s access course (aggregated)
Length of course
Type of provider for access
Degree level OUG level
No HE Total
% Degree % UG
FEC 5,527 1,519 11,008 18,054 31% 39%Standard HEI 430 105 607 1,142 38% 47%
Extended 525 267 1,728 2,520 21% 31%
10 In all cases the students were registered with the institution they attended. 11 Annex E, Table E1 gives a more disaggregated version of this table.
22
Progression of access to HE by QAA recognition of provider
70. Table 18 excludes students on access programmes that are at institutions and colleges without a QAA-recognised access course in 1998-99. Table 19 shows the proportion of such students who progress into HE. It can be seen that, in comparison to institutions and colleges with QAA-recognised access courses, progression rates to undergraduate and degree-level are much lower. 71. For example, for those on standard length access courses, just under a third of students at institutions and colleges with a recognised course progressed to degree level. The equivalent figure for those attending institutions and colleges without a recognised course is around one in five students. 72. As with short access courses, it is not clear whether the lower rates of progression for unrecognised access courses are real, or are due to the inclusion of courses which are not ‘Access to Higher Education courses’ as usually understood. Table 1912 Progression of students by QAA recognition of provider (aggregated)
Length of course
QAA recognition
Degree level
OUG level
No HE Total
% Degree
% UG
Yes 5,957 1,624 11,615 19,196 31% 39%Standard No 589 217 2,271 3,077 19% 26%
Extended 550 292 1,955 2,797 20% 30% Progression of access to HE by region of provider
73. Table 20 shows the rates of progression to higher education, split by region of the student’s access institution, for those students who began standard length access courses in 1998-99. It shows that the North West region has the highest rates of progression to higher education: half of its access students on standard length courses progress onto an undergraduate course. Table 20 Progression of students on a standard length course by region of institution
Region of institution Degree levelOUG level No HE Total
% Degree
% UG
South East 694 140 1,111 1,945 36% 43%South West 522 142 889 1,553 34% 43%London 1,664 496 4,098 6,258 27% 35%East of England 274 82 588 944 29% 38%East Midlands 214 65 407 686 31% 41%West Midlands 351 172 944 1,467 24% 36%Yorkshire & Humberside 405 140 906 1,451 28% 38%North East 381 135 983 1,499 25% 34%North West 1,452 252 1,689 3,393 43% 50%Total 5,957 1,624 11,615 19,196 31% 39%
12 Annex E, Table E2 gives a more disaggregated version of this table.
23
74. The equivalent table for extended length courses is not reported in the main text due to small numbers; Table E3 at Annex E gives these data. Progression of access to HE rates for individual providers
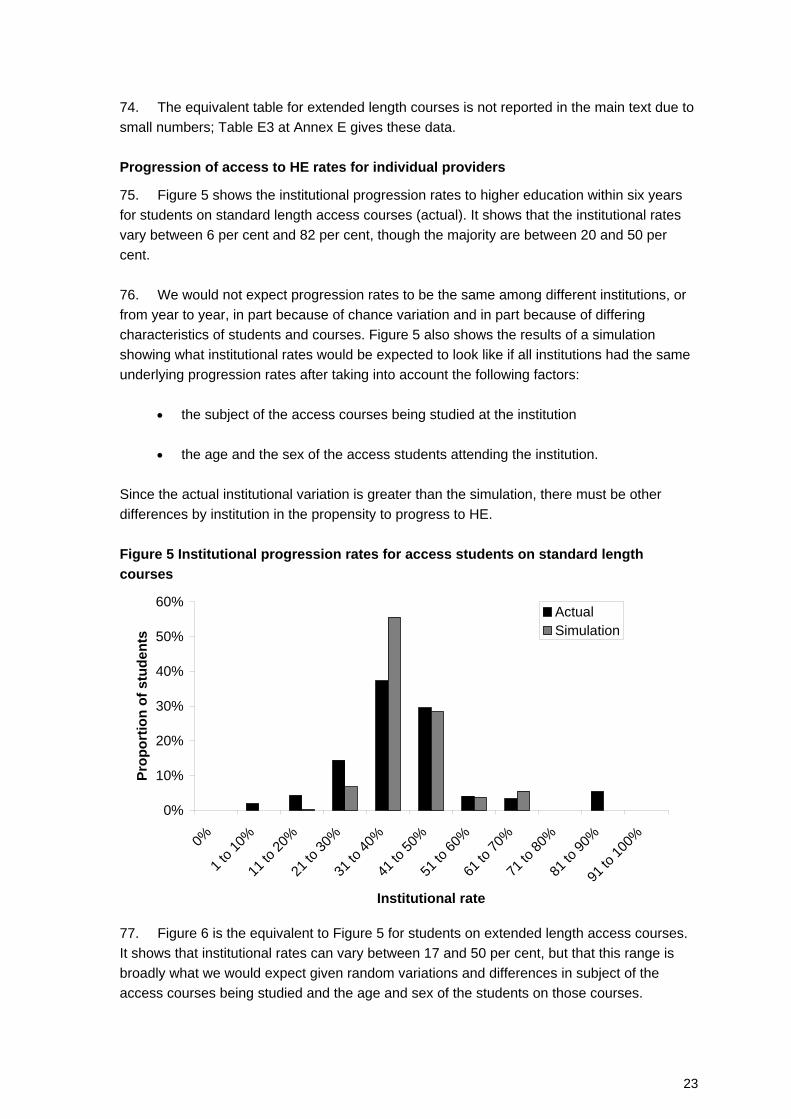
75. Figure 5 shows the institutional progression rates to higher education within six years for students on standard length access courses (actual). It shows that the institutional rates vary between 6 per cent and 82 per cent, though the majority are between 20 and 50 per cent. 76. We would not expect progression rates to be the same among different institutions, or from year to year, in part because of chance variation and in part because of differing characteristics of students and courses. Figure 5 also shows the results of a simulation showing what institutional rates would be expected to look like if all institutions had the same underlying progression rates after taking into account the following factors:
• the subject of the access courses being studied at the institution
• the age and the sex of the access students attending the institution. Since the actual institutional variation is greater than the simulation, there must be other differences by institution in the propensity to progress to HE. Figure 5 Institutional progression rates for access students on standard length courses
0%
10%
20%
30%
40%
50%
60%
0%
1 to 1
0%
11 to
20%
21 to
30%
31 to
40%
41 to
50%
51 to
60%
61 to
70%
71 to
80%
81 to
90%
91 to
100%
Institutional rate
Prop
ortio
n of
stu
dent
s
ActualSimulation
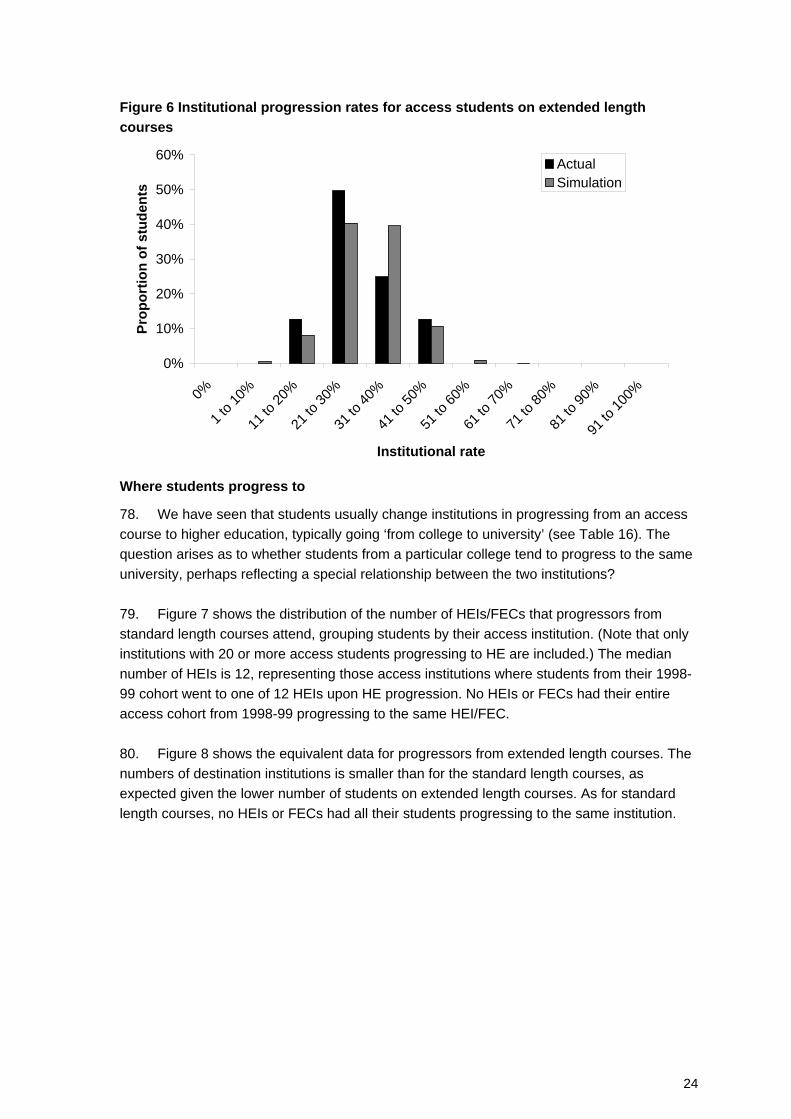
77. Figure 6 is the equivalent to Figure 5 for students on extended length access courses. It shows that institutional rates can vary between 17 and 50 per cent, but that this range is broadly what we would expect given random variations and differences in subject of the access courses being studied and the age and sex of the students on those courses.
24
Figure 6 Institutional progression rates for access students on extended length courses
0%
10%
20%
30%
40%
50%
60%
0%
1 to 1
0%
11 to
20%
21 to
30%
31 to
40%
41 to
50%
51 to
60%
61 to
70%
71 to
80%
81 to
90%
91 to
100%
Institutional rate
Prop
ortio
n of
stu
dent
sActualSimulation
Where students progress to
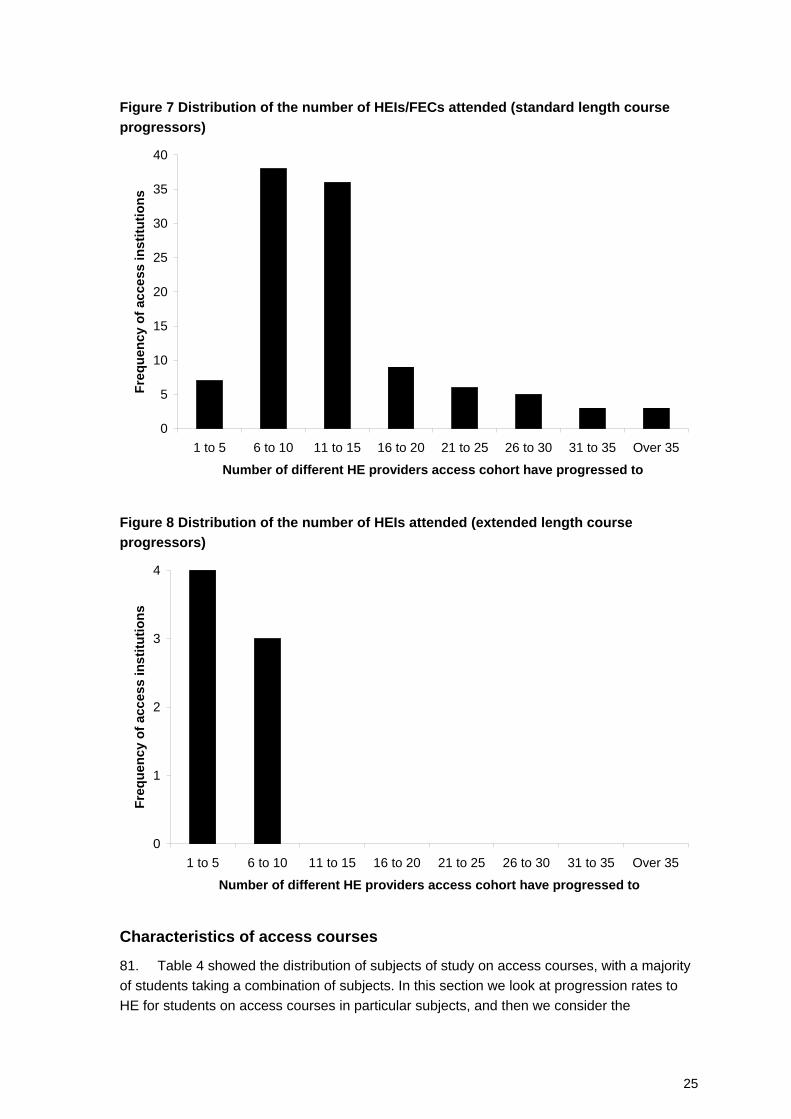
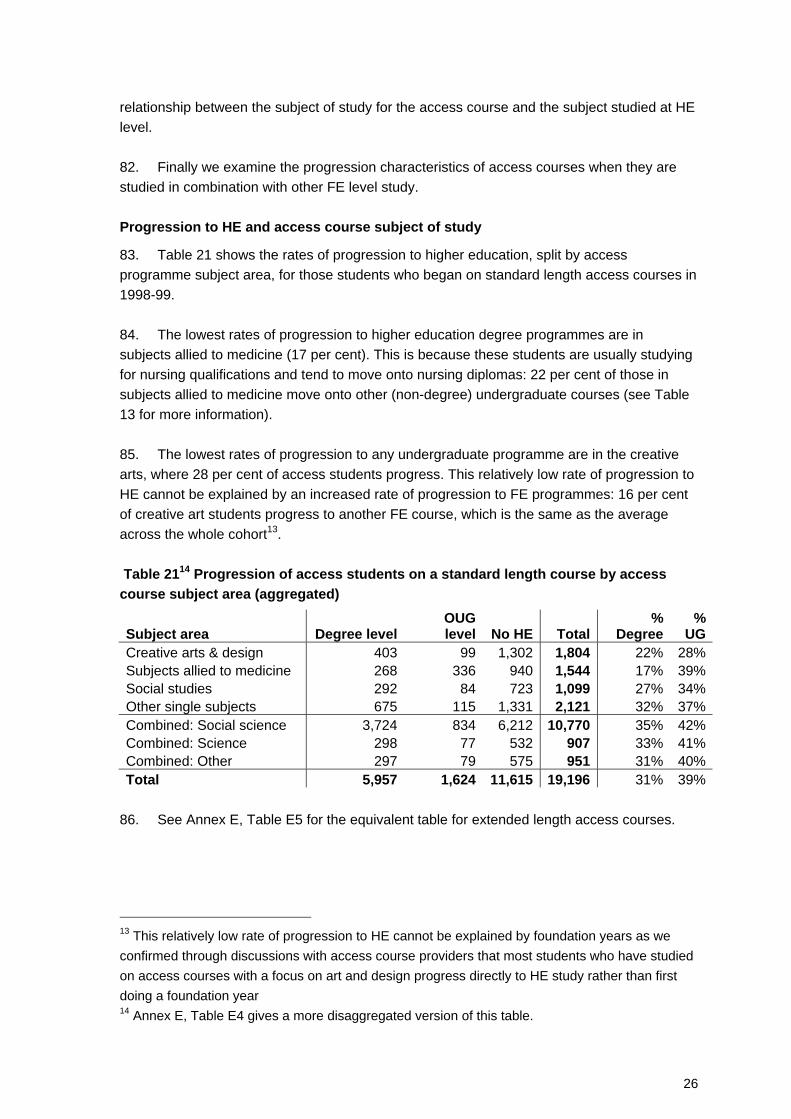
78. We have seen that students usually change institutions in progressing from an access course to higher education, typically going ‘from college to university’ (see Table 16). The question arises as to whether students from a particular college tend to progress to the same university, perhaps reflecting a special relationship between the two institutions? 79. Figure 7 shows the distribution of the number of HEIs/FECs that progressors from standard length courses attend, grouping students by their access institution. (Note that only institutions with 20 or more access students progressing to HE are included.) The median number of HEIs is 12, representing those access institutions where students from their 1998-99 cohort went to one of 12 HEIs upon HE progression. No HEIs or FECs had their entire access cohort from 1998-99 progressing to the same HEI/FEC. 80. Figure 8 shows the equivalent data for progressors from extended length courses. The numbers of destination institutions is smaller than for the standard length courses, as expected given the lower number of students on extended length courses. As for standard length courses, no HEIs or FECs had all their students progressing to the same institution.
25
Figure 7 Distribution of the number of HEIs/FECs attended (standard length course progressors)
0
5
10
15
20
25
30
35
40
1 to 5 6 to 10 11 to 15 16 to 20 21 to 25 26 to 30 31 to 35 Over 35
Number of different HE providers access cohort have progressed to
Freq
uenc
y of
acc
ess
inst
itutio
ns
Figure 8 Distribution of the number of HEIs attended (extended length course progressors)
0
1
2
3
4
1 to 5 6 to 10 11 to 15 16 to 20 21 to 25 26 to 30 31 to 35 Over 35
Number of different HE providers access cohort have progressed to
Freq
uenc
y of
acc
ess
inst
itutio
ns
Characteristics of access courses
81. Table 4 showed the distribution of subjects of study on access courses, with a majority of students taking a combination of subjects. In this section we look at progression rates to HE for students on access courses in particular subjects, and then we consider the
26
relationship between the subject of study for the access course and the subject studied at HE level. 82. Finally we examine the progression characteristics of access courses when they are studied in combination with other FE level study. Progression to HE and access course subject of study
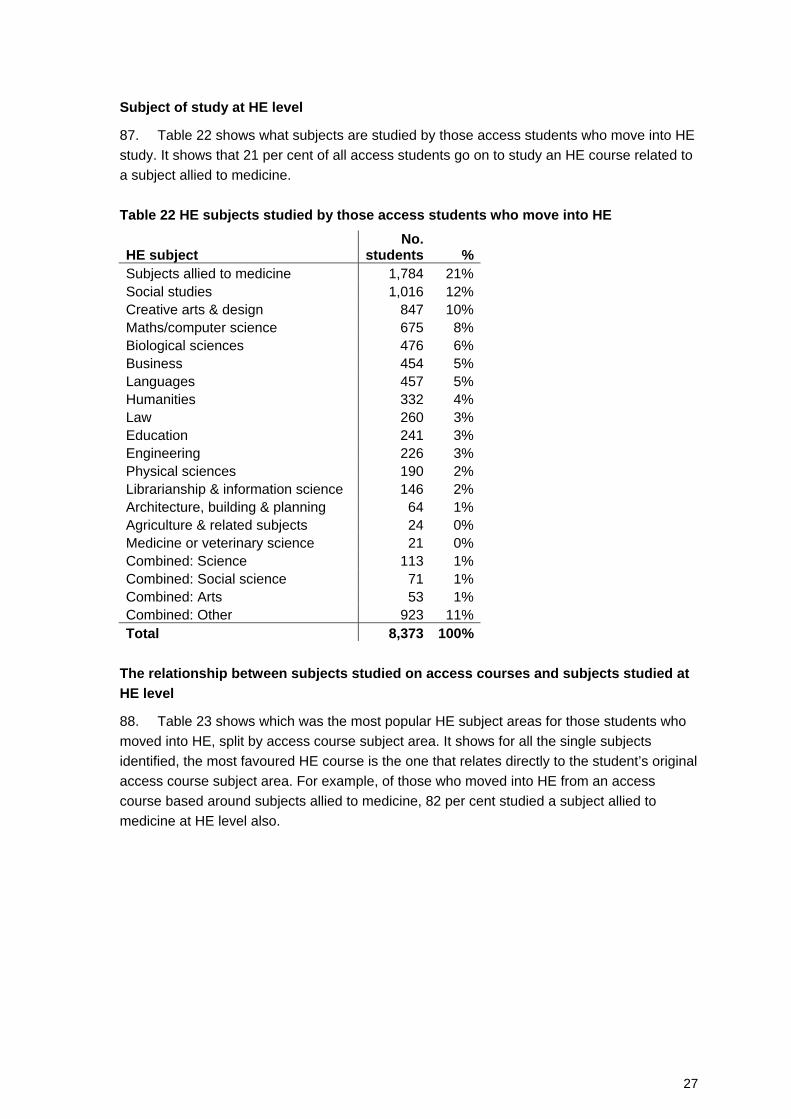
83. Table 21 shows the rates of progression to higher education, split by access programme subject area, for those students who began on standard length access courses in 1998-99. 84. The lowest rates of progression to higher education degree programmes are in subjects allied to medicine (17 per cent). This is because these students are usually studying for nursing qualifications and tend to move onto nursing diplomas: 22 per cent of those in subjects allied to medicine move onto other (non-degree) undergraduate courses (see Table 13 for more information). 85. The lowest rates of progression to any undergraduate programme are in the creative arts, where 28 per cent of access students progress. This relatively low rate of progression to HE cannot be explained by an increased rate of progression to FE programmes: 16 per cent of creative art students progress to another FE course, which is the same as the average across the whole cohort13. Table 2114 Progression of access students on a standard length course by access course subject area (aggregated)
Subject area Degree levelOUG level No HE Total
% Degree
% UG
Creative arts & design 403 99 1,302 1,804 22% 28%Subjects allied to medicine 268 336 940 1,544 17% 39%Social studies 292 84 723 1,099 27% 34%Other single subjects 675 115 1,331 2,121 32% 37%Combined: Social science 3,724 834 6,212 10,770 35% 42%Combined: Science 298 77 532 907 33% 41%Combined: Other 297 79 575 951 31% 40%Total 5,957 1,624 11,615 19,196 31% 39%
86. See Annex E, Table E5 for the equivalent table for extended length access courses.
13 This relatively low rate of progression to HE cannot be explained by foundation years as we confirmed through discussions with access course providers that most students who have studied on access courses with a focus on art and design progress directly to HE study rather than first doing a foundation year 14 Annex E, Table E4 gives a more disaggregated version of this table.
27
Subject of study at HE level
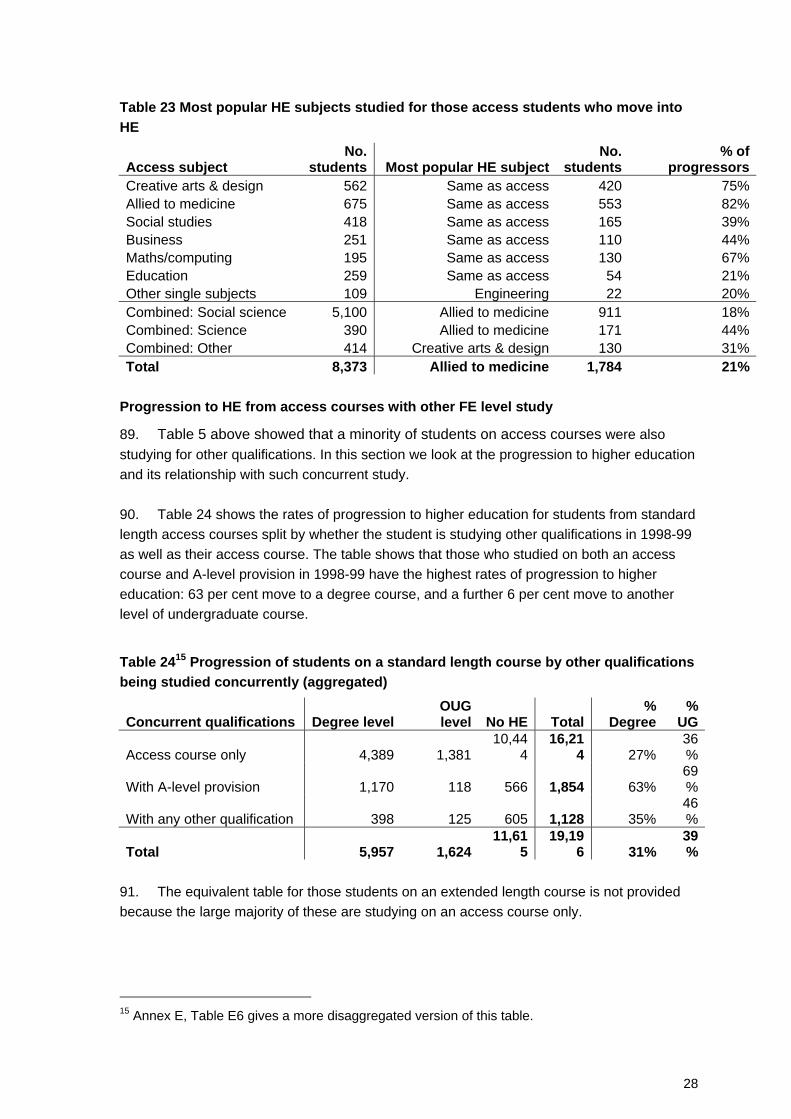
87. Table 22 shows what subjects are studied by those access students who move into HE study. It shows that 21 per cent of all access students go on to study an HE course related to a subject allied to medicine. Table 22 HE subjects studied by those access students who move into HE
HE subject No.
students %Subjects allied to medicine 1,784 21%Social studies 1,016 12%Creative arts & design 847 10%Maths/computer science 675 8%Biological sciences 476 6%Business 454 5%Languages 457 5%Humanities 332 4%Law 260 3%Education 241 3%Engineering 226 3%Physical sciences 190 2%Librarianship & information science 146 2%Architecture, building & planning 64 1%Agriculture & related subjects 24 0%Medicine or veterinary science 21 0%Combined: Science 113 1%Combined: Social science 71 1%Combined: Arts 53 1%Combined: Other 923 11%Total 8,373 100%
The relationship between subjects studied on access courses and subjects studied at HE level
88. Table 23 shows which was the most popular HE subject areas for those students who moved into HE, split by access course subject area. It shows for all the single subjects identified, the most favoured HE course is the one that relates directly to the student’s original access course subject area. For example, of those who moved into HE from an access course based around subjects allied to medicine, 82 per cent studied a subject allied to medicine at HE level also.
28
Table 23 Most popular HE subjects studied for those access students who move into HE
Access subject No.
students Most popular HE subjectNo.
students % of
progressorsCreative arts & design 562 Same as access 420 75%Allied to medicine 675 Same as access 553 82%Social studies 418 Same as access 165 39%Business 251 Same as access 110 44%Maths/computing 195 Same as access 130 67%Education 259 Same as access 54 21%Other single subjects 109 Engineering 22 20%Combined: Social science 5,100 Allied to medicine 911 18%Combined: Science 390 Allied to medicine 171 44%Combined: Other 414 Creative arts & design 130 31%Total 8,373 Allied to medicine 1,784 21%
Progression to HE from access courses with other FE level study
89. Table 5 above showed that a minority of students on access courses were also studying for other qualifications. In this section we look at the progression to higher education and its relationship with such concurrent study. 90. Table 24 shows the rates of progression to higher education for students from standard length access courses split by whether the student is studying other qualifications in 1998-99 as well as their access course. The table shows that those who studied on both an access course and A-level provision in 1998-99 have the highest rates of progression to higher education: 63 per cent move to a degree course, and a further 6 per cent move to another level of undergraduate course.
Table 2415 Progression of students on a standard length course by other qualifications being studied concurrently (aggregated)
Concurrent qualifications Degree levelOUG level No HE Total
% Degree
% UG
Access course only 4,389 1,38110,44
416,21
4 27%36%
With A-level provision 1,170 118 566 1,854 63%69%
With any other qualification 398 125 605 1,128 35%46%
Total 5,957 1,62411,61
519,19
6 31%39%
91. The equivalent table for those students on an extended length course is not provided because the large majority of these are studying on an access course only.
15 Annex E, Table E6 gives a more disaggregated version of this table.
29
Characteristics of access students
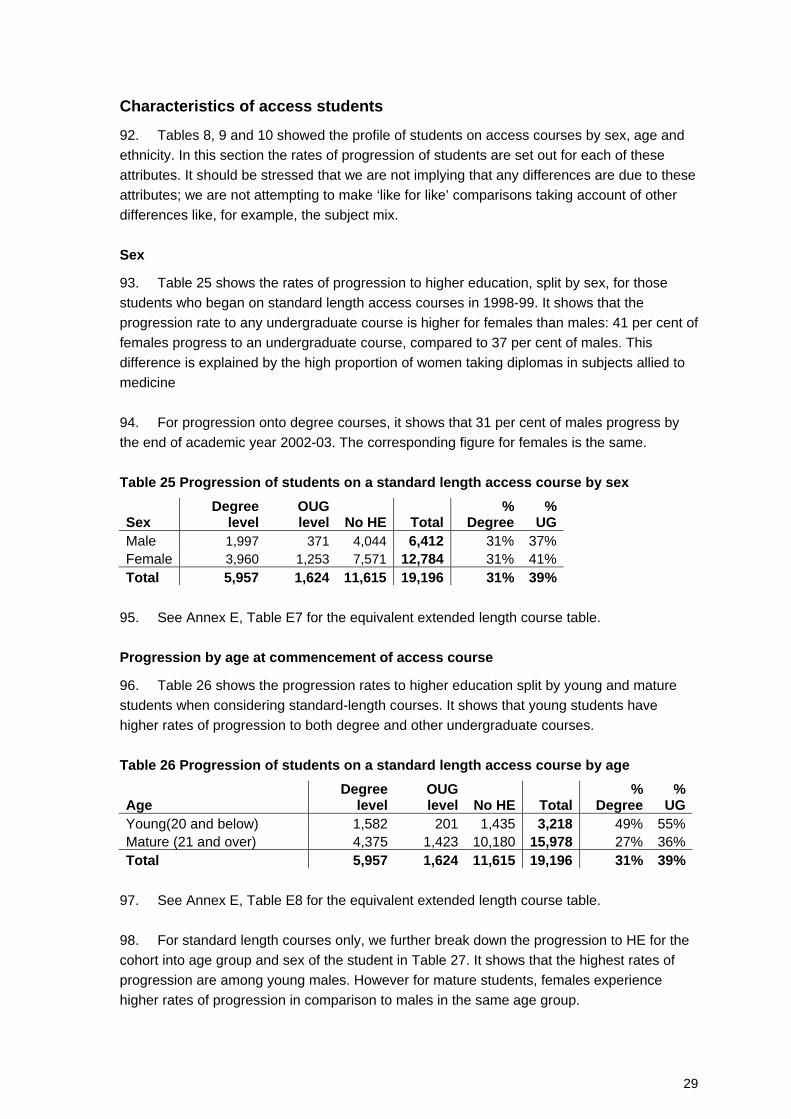
92. Tables 8, 9 and 10 showed the profile of students on access courses by sex, age and ethnicity. In this section the rates of progression of students are set out for each of these attributes. It should be stressed that we are not implying that any differences are due to these attributes; we are not attempting to make ‘like for like’ comparisons taking account of other differences like, for example, the subject mix. Sex
93. Table 25 shows the rates of progression to higher education, split by sex, for those students who began on standard length access courses in 1998-99. It shows that the progression rate to any undergraduate course is higher for females than males: 41 per cent of females progress to an undergraduate course, compared to 37 per cent of males. This difference is explained by the high proportion of women taking diplomas in subjects allied to medicine 94. For progression onto degree courses, it shows that 31 per cent of males progress by the end of academic year 2002-03. The corresponding figure for females is the same. Table 25 Progression of students on a standard length access course by sex
Sex Degree
level OUG level No HE Total
% Degree
% UG
Male 1,997 371 4,044 6,412 31% 37%Female 3,960 1,253 7,571 12,784 31% 41%Total 5,957 1,624 11,615 19,196 31% 39%
95. See Annex E, Table E7 for the equivalent extended length course table. Progression by age at commencement of access course
96. Table 26 shows the progression rates to higher education split by young and mature students when considering standard-length courses. It shows that young students have higher rates of progression to both degree and other undergraduate courses. Table 26 Progression of students on a standard length access course by age
Age Degree
levelOUG level No HE Total
% Degree
% UG
Young(20 and below) 1,582 201 1,435 3,218 49% 55%Mature (21 and over) 4,375 1,423 10,180 15,978 27% 36%Total 5,957 1,624 11,615 19,196 31% 39%
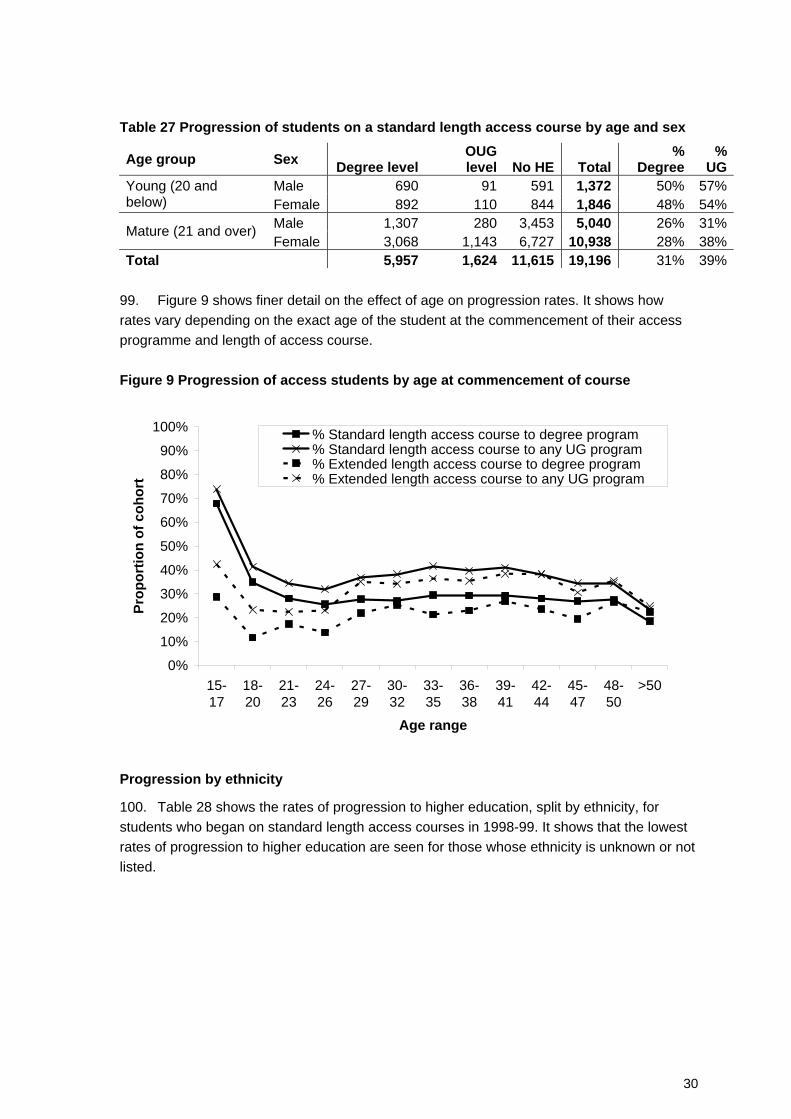
97. See Annex E, Table E8 for the equivalent extended length course table. 98. For standard length courses only, we further break down the progression to HE for the cohort into age group and sex of the student in Table 27. It shows that the highest rates of progression are among young males. However for mature students, females experience higher rates of progression in comparison to males in the same age group.
30
Table 27 Progression of students on a standard length access course by age and sex
Age group Sex Degree levelOUG level No HE Total
% Degree
% UG
Male 690 91 591 1,372 50% 57%Young (20 and below) Female 892 110 844 1,846 48% 54%
Male 1,307 280 3,453 5,040 26% 31%Mature (21 and over) Female 3,068 1,143 6,727 10,938 28% 38%
Total 5,957 1,624 11,615 19,196 31% 39% 99. Figure 9 shows finer detail on the effect of age on progression rates. It shows how rates vary depending on the exact age of the student at the commencement of their access programme and length of access course. Figure 9 Progression of access students by age at commencement of course
0%
10%
20%
30%
40%
50%
60%
70%
80%
90%
100%
15-17
18-20
21-23
24-26
27-29
30-32
33-35
36-38
39-41
42-44
45-47
48-50
>50
Age range
Prop
ortio
n of
coh
ort
% Standard length access course to degree program% Standard length access course to any UG program% Extended length access course to degree program% Extended length access course to any UG program
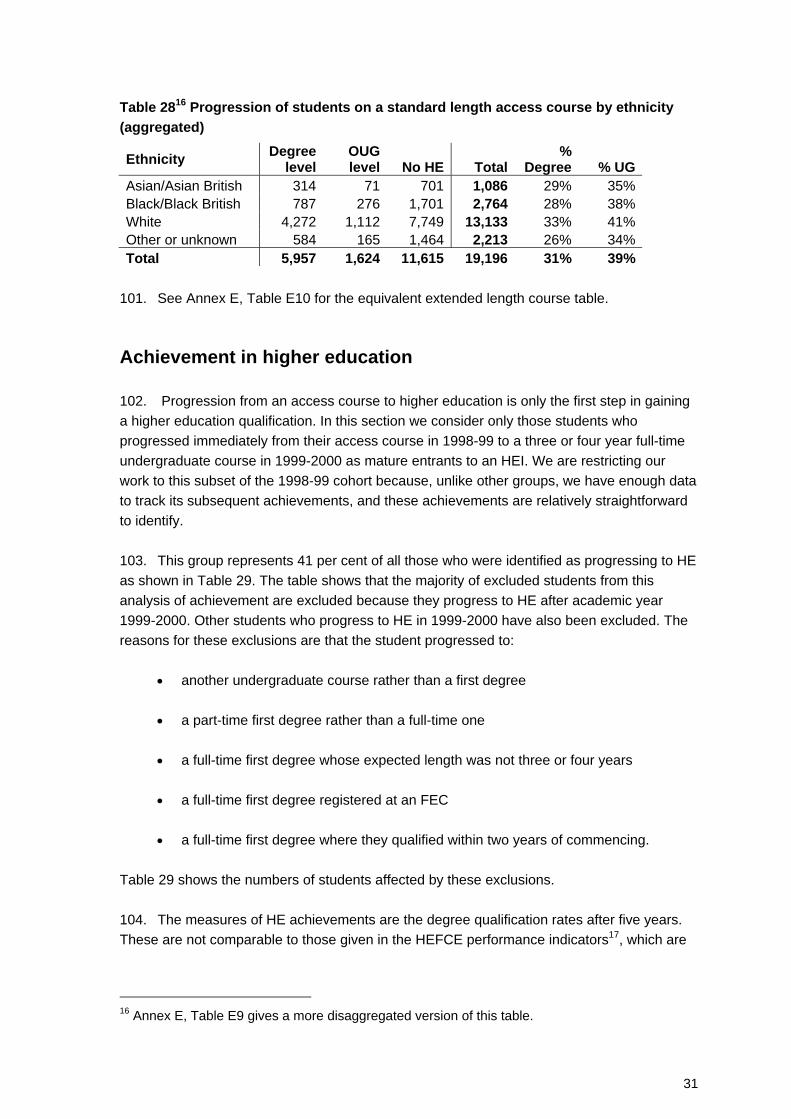
Progression by ethnicity
100. Table 28 shows the rates of progression to higher education, split by ethnicity, for students who began on standard length access courses in 1998-99. It shows that the lowest rates of progression to higher education are seen for those whose ethnicity is unknown or not listed.
31
Table 2816 Progression of students on a standard length access course by ethnicity (aggregated)
Ethnicity Degree level
OUG level No HE Total
% Degree % UG
Asian/Asian British 314 71 701 1,086 29% 35% Black/Black British 787 276 1,701 2,764 28% 38% White 4,272 1,112 7,749 13,133 33% 41% Other or unknown 584 165 1,464 2,213 26% 34% Total 5,957 1,624 11,615 19,196 31% 39%
101. See Annex E, Table E10 for the equivalent extended length course table. Achievement in higher education 102. Progression from an access course to higher education is only the first step in gaining a higher education qualification. In this section we consider only those students who progressed immediately from their access course in 1998-99 to a three or four year full-time undergraduate course in 1999-2000 as mature entrants to an HEI. We are restricting our work to this subset of the 1998-99 cohort because, unlike other groups, we have enough data to track its subsequent achievements, and these achievements are relatively straightforward to identify. 103. This group represents 41 per cent of all those who were identified as progressing to HE as shown in Table 29. The table shows that the majority of excluded students from this analysis of achievement are excluded because they progress to HE after academic year 1999-2000. Other students who progress to HE in 1999-2000 have also been excluded. The reasons for these exclusions are that the student progressed to:
• another undergraduate course rather than a first degree
• a part-time first degree rather than a full-time one
• a full-time first degree whose expected length was not three or four years
• a full-time first degree registered at an FEC
• a full-time first degree where they qualified within two years of commencing. Table 29 shows the numbers of students affected by these exclusions. 104. The measures of HE achievements are the degree qualification rates after five years. These are not comparable to those given in the HEFCE performance indicators17, which are
16 Annex E, Table E9 gives a more disaggregated version of this table.
32
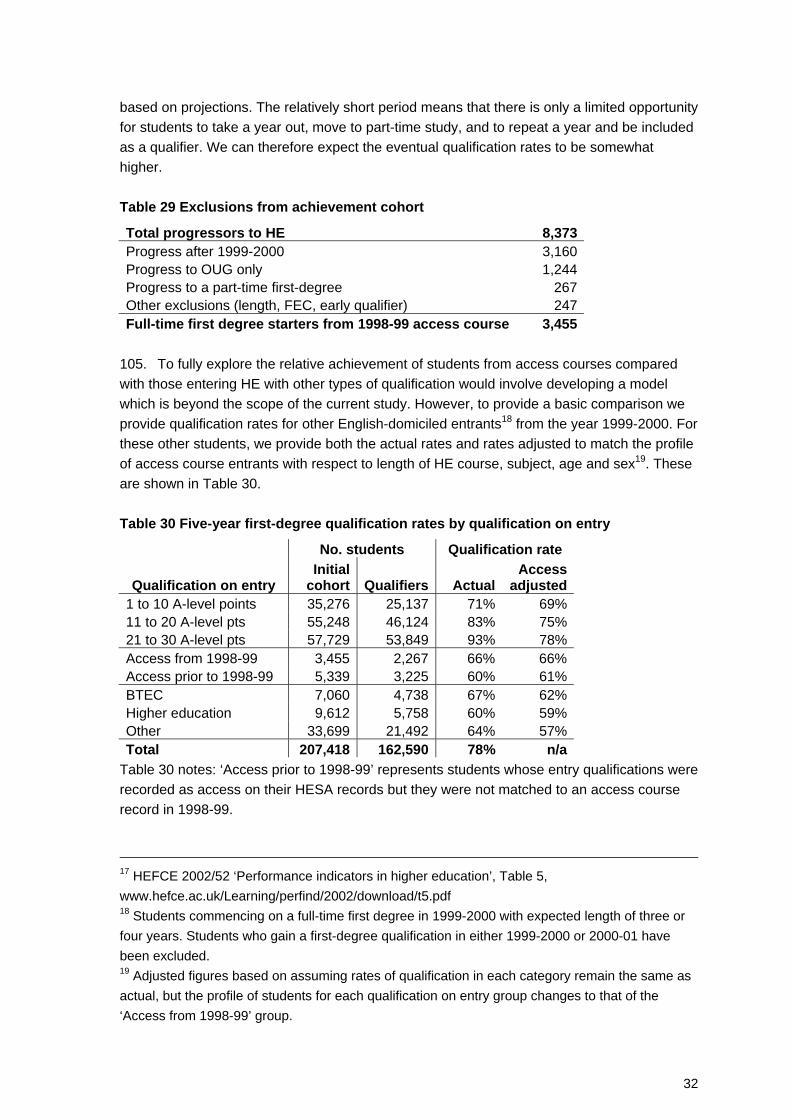
based on projections. The relatively short period means that there is only a limited opportunity for students to take a year out, move to part-time study, and to repeat a year and be included as a qualifier. We can therefore expect the eventual qualification rates to be somewhat higher. Table 29 Exclusions from achievement cohort
Total progressors to HE 8,373 Progress after 1999-2000 3,160 Progress to OUG only 1,244 Progress to a part-time first-degree 267 Other exclusions (length, FEC, early qualifier) 247 Full-time first degree starters from 1998-99 access course 3,455
105. To fully explore the relative achievement of students from access courses compared with those entering HE with other types of qualification would involve developing a model which is beyond the scope of the current study. However, to provide a basic comparison we provide qualification rates for other English-domiciled entrants18 from the year 1999-2000. For these other students, we provide both the actual rates and rates adjusted to match the profile of access course entrants with respect to length of HE course, subject, age and sex19. These are shown in Table 30. Table 30 Five-year first-degree qualification rates by qualification on entry
No. students Qualification rate
Qualification on entry Initial
cohort Qualifiers ActualAccess
adjusted 1 to 10 A-level points 35,276 25,137 71% 69% 11 to 20 A-level pts 55,248 46,124 83% 75% 21 to 30 A-level pts 57,729 53,849 93% 78% Access from 1998-99 3,455 2,267 66% 66% Access prior to 1998-99 5,339 3,225 60% 61% BTEC 7,060 4,738 67% 62% Higher education 9,612 5,758 60% 59% Other 33,699 21,492 64% 57% Total 207,418 162,590 78% n/a
Table 30 notes: ‘Access prior to 1998-99’ represents students whose entry qualifications were recorded as access on their HESA records but they were not matched to an access course record in 1998-99.
17 HEFCE 2002/52 ‘Performance indicators in higher education’, Table 5, www.hefce.ac.uk/Learning/perfind/2002/download/t5.pdf 18 Students commencing on a full-time first degree in 1999-2000 with expected length of three or four years. Students who gain a first-degree qualification in either 1999-2000 or 2000-01 have been excluded. 19 Adjusted figures based on assuming rates of qualification in each category remain the same as actual, but the profile of students for each qualification on entry group changes to that of the ‘Access from 1998-99’ group.
33
106. The A-level entrants, grouped by number of points, illustrate how the adjustment works. In all three groups the adjusted figures are lower than the actuals, largely reflecting the fact that the age profile of students with access qualifications is older, and older students have lower qualification rates. We also find that the range for actuals is much larger (93% - 71% = 22%) than for the adjusted (78% - 69% = 9%). This shows that the relationship between A-level grades and HE achievement is much weaker for mature than for young students. 107. There are two groups of students from access courses: ‘Access from 1998-99’ and ‘Access prior to 1998-99’. The first group relates to students who have been identified as being on access courses and have been described through this report. Students in the second group were recorded as having access courses as their highest qualification on entry on their HESA records, but they were not matched to an access course record in 1998-99. This second group is included for completeness, though these students’ actual experience and achievement prior to HE is uncertain. 108. We see that 66 per cent of students who progressed to a full-time first degree in 1999-2000 from an access course in 1998-99 gain a first degree within five years of commencing. This is lower than for A-level entrants. However, when we adjust for length of HE course, subject, age and sex we see that the differences are much reduced, with access course students being very similar to students with lower A-level points. 109. Table 30 also shows that students whose qualification on entry was a BTEC have a marginally higher qualification rate than students from an access course in 1998-99: 67 per cent. However the adjusted qualification rate shows that this group of BTEC students would have been expected to have a lower qualification rate (62 per cent) if their characteristics had been similar to the access from 1998-99 group (in terms of length of HE course, sex, subject of HE study and age). 110. Access course students have higher qualification rates than students with HE qualifications and ‘other’ qualifications, both in absolute terms and using adjusted figures. ‘Other’ includes those without A-levels, access, BTEC or HE qualifications. After graduation: employment outcomes 111. For those students who graduated in 2003-04 or earlier, we can use the Destination of Leavers from Higher Education (DLHE) survey to find out what the graduates subsequently did. Again we provide a basic comparison between access and other groups of mature entrants. 112. Table 31 shows the destination of the graduates from our full-time first-degree population (as defined in paragraphs 102-103,) six months after graduating. It shows that the group with the lowest unemployment rate (7 per cent) are students who began a first degree with between 21 and 30 A-level points. The corresponding unemployment rate for access entry students is 13 per cent, which is similar to the rate seen for BTECs and other unlisted qualifications on entry. (See Annex F for full definition of ‘unemployed’).
34
Table 31 Destination of graduates six months after graduating
Qualifications on entry
Employed or
studying Unemployed
No response
or undefined Graduates
% unemployed
(known)1 to 10 A-level points 17,135 1,700 6,302 25,137 9%11 to 20 A-level points 33,201 2,876 10,047 46,124 8%21 to 30 A-level points 39,767 2,994 11,088 53,849 7%Access from 1998-99 1,387 215 665 2,267 13%Access prior to 1998-99 1,932 280 1,013 3,225 13%BTEC 3,021 461 1,256 4,738 13%Higher education 3,580 400 1,778 5,758 10%Other 13,512 1,844 6,136 21,492 12%Total 113,535 10,770 38,285 162,590 9%
113. However the rates given in Table 31 do not take into account the differing characteristics of each group. As in paragraphs 105-106, we can standardise these rates relative to the characteristics of those students who entered through an access course in 1998-99. Table 32 shows the actual and access-adjusted unemployment rates for each qualification on entry group. The adjusted rates show a similar pattern to the actual rates. Table 32 Actual and adjusted unemployment rates
Qualifications on entry Actual Adjusted1 to 10 A-level points 9% 10%11 to 20 A-level points 8% 7%21 to 30 A-level points 7% 8%Access from 1998-99 13% 13%Access prior to 1998-99 13% 13%BTEC 13% 12%Higher education 10% 8%Other 12% 12%Total 9% n/a
114. For those graduates who are only in employment (in other words, not studying at the same time) six months after graduating, we are able to categorise their type of job into graduate or graduate-track level, or non-graduate; see Elias and Purcell (2004) for further details. 115. Table 33 shows the proportion of those graduates in employment only who are in a graduate-level job. It shows that those from access courses or who have an HE qualification on entry to their first degree have the highest proportions in graduate jobs. However this is unadjusted for length of HE course, age, the subject of degree study and gender.

35
Table 33 Job type of those graduates in employment only
Qualifications on entry
Graduate job
Non-graduate job Unknown
Employment only
% graduate job (known)
1 to 10 A-level points 8,394 5,021 57 13,472 63%11 to 20 A-level points 16,248 9,500 76 25,824 63%21 to 30 A-level points 18,316 8,749 123 27,188 68%Access from 1998-99 795 227 8 1,030 78%Access prior to 1998-99 1,090 335 9 1,434 76%BTEC 1,672 928 21 2,621 64%Higher education 2,174 660 27 2,861 77%Other 6,726 4,156 75 10,957 62%Total 55,415 29,576 396 85,387 65%
116. Table 34 shows the proportion of graduates who would be expected to have graduate jobs if each qualification on entry group had similar characteristics to the ‘Access from 1998-99’ group. It shows that the low proportions in graduate jobs for non-access or non-HE compared to the access and HE groups can be explained through other characteristics. Table 34 Actual and adjusted proportion of employment that is graduate-level Qualifications on entry Actual Adjusted1 to 10 A-level points 63% 76%11 to 20 A-level points 63% 75%21 to 30 A-level points 68% 76%Access from 1998-99 78% 78%Access prior to 1998-99 76% 75%BTEC 64% 78%Higher education 77% 81%Other 62% 75%Total 65% n/a
Discussion and conclusions Access courses and widening participation
117. There are large differences in the participation rates of young people from different social or area backgrounds (for example, HEFCE(2005)). Most access students are aged 21 or over on entry and, in common with other mature entrants, we have no information on what their social or area background was when they were young. For this reason, we cannot say whether the large participation differences found between social and area groupings of young people are subsequently reduced by mature access entrants. 118. Only 1 per cent of students on access courses have an HE qualification, and only about 4 per cent had entered HE previously. Therefore most, for whatever reason did not go on from school or college to higher education, and access courses have provided that further
36
opportunity20. If we view mature entry as part of the widening participation agenda, the provision of access courses represents one of the most important interventions in widening participation. Rates of progression to higher education
119. Of those starting standard length access courses, 38 per cent had progressed to higher education within five years, and 54 per cent had entered higher education or continued with other further education study. Of those not progressing, some will not have completed the access course, but some will have then decided they do not want to progress further. Some will have changed circumstances which makes progressing to higher education difficult. It should not be assumed that those who do not progress view their experience on an access course as a ‘waste of time’; there is plenty of evidence to the contrary, for example, Reay et al (2002). However, it is an important finding that the chances of progressing are not remote, and it is therefore of interest to see which groups of students have higher rates of progression. 120. We find, unsurprisingly, that young students, and students who are concurrently studying A-levels, have much higher progression rates than others. We see differences by other demographic characteristics and by subject of study, but these are not dramatic. Of some concern is the wide range of progression rates between institutions. At some colleges, less than one in five students progress to HE, and these rates do not seem to be a chance fluctuation, or due to the subjects offered, age or sex profile of the students. Patterns of progression to higher education
121. Typically, progressing to higher education means going from college to university. Of the access students who progress, nine out of ten move from one institution to another. 122. It seems that access course students are constrained, or at least prefer, to take up HE studies near their home: about half study within 30 minutes or less drive time. Despite this constraint, or preference, we do not find that students from a particular college all go to a particular university. The access course qualification is sufficiently recognised to give access course students a choice of institution; though, as might be expected, most go to post-1992 universities which have a tradition of mature entry and, in general, have less demanding entrance qualifications. 123. Most students (71 per cent) who progress go on to full-time degree programmes21. They study a wide range of subjects, with subjects allied to medicine (22 per cent), social studies (12 per cent), art and design (10 per cent), and maths and computer science (8 per cent) accounting for half the programmes. Some access courses focus on particular subjects,
20 Figures based on the 24,490 students starting on an access course in 2003-04 (see Table 3 for further details). A student’s previous HE experience is defined from HESA records between 1995-96 and 2002-03, and LSC ILRs between 1998-99 and 2002-03. 21 Of the 8,373 recorded in Table 12, 5,790 had progressed onto a full-time first-degree at some point before the end of 2003-04.
37
for example subjects allied to medicine, and many – in this case 84 per cent – students who progress to HE from such courses continue to study this subject. However, they only represent 31 per cent of those studying at HE level. Over half of the access students studying subjects allied to medicine at HE level do so from general access courses covering combined social sciences. HE achievement and employment outcomes
124. Once in higher education, access students on degree courses have completion rates which are similar to or better than those of other non A-level entrants. When the differences in age, sex and subject are taken into account, only students who enter HE with A-level scores of more than 10 have higher completion rates. 125. Six months after graduation, graduates from access courses have slightly higher unemployment rates than A-level graduates; however, three out of four are employed in a ‘graduate’ job, which is higher than for A-level graduates. This, no doubt, reflects the vocational focus demonstrated through some of the access course specialisms and the subjects that access course students study at university. Access and ‘vocational’ routes to HE
126. Much current policy development focuses on developing new and existing vocational routes to higher education, based on students’ current employment. The access course route, at least as traditionally organised, follows a somewhat different model. The need for both approaches is apparent given that some of those who left school with few or no qualifications are not in employment where work-based learning is likely to lead to higher education. Even if their employment could lead to higher education, many will not want to make a radical change from the career that developed after leaving school. 127. Access courses are usually less directed than courses designed to prepare for particular occupations. Access courses may have a significant academic content, but that does not mean they are not vocational in the sense that they are preparing student for employment rather than solely for personal development or recreation. The best evidence that access courses are vocational in this wider sense is the very high proportion of those who, on graduating, go into graduate jobs. 128. The contrast between access courses and those courses designed to develop particular skills for specific occupations can be illustrated through the actual experience of an individual whose experience (while it may particular in its detail) is typical in many respects. A case study – from hairdresser to statistician
Pauline was one of the last cohorts to leave school before the introduction of GCSEs. Like all the pupils in her school she was entered for CSE examinations and left without any ‘O’ levels. She then studied full-time at the local FE college for a City and Guilds certificate in
38
hairdressing and, after qualifying, became a hairdresser.
She then became a mother. After her son started school, she became a member of the board of governors. It was in that role that she had to consider reports on children with behavioural difficulties and became interested in the subject. Could she train as an educational psychologist? The first step was an enquiry at the local FE college which led to her enrolment on a one year full-time access course specialising in psychology.
She successfully completed this course, but two things led to a change of direction. Firstly, the access course included a certain amount of statistics. This was completely new to her and something that she found so interesting that she began to think that this is what she should study at university. Secondly, it became clear that her local post-1992 university, which had no special links or progression arrangements with the college, was unwilling to offer her a place to study psychology. This may reflect the popularity of this subject and the consequent competition for places. She was also rejected by the statistics department, but, when pressed, they offered her a place on condition she passed GCSE with at least a grade B. Back to the FE college one year later she passed this further hurdle and, after another three years, graduated with an upper second in statistics.
She has moved from the area and is now employed as a statistician within a multidisciplinary team which is involved in varied and challenging work. With support from her employer she is registered as a part-time MPhil student which she hopes may eventually lead to a PhD.
Expansion and development of access course provision 129. Pauline’s story shows that access courses can lead to a life-transforming process. Though not specifically vocational, unlike the hairdressing course, an access course can lead to a change to a more productive and satisfying occupation. Far from this experience being unique, the evidence suggests that it is shared by thousands of others. Can such provision be increased in the future? 130. For such expansion to take place there needs to be both the demand, or potential demand, and the resources to ensure an increasing supply. Clearly, the availability of public funds affects demand as well as supply, as it determines the level of student support and the size of the student contribution through fees. 131. Access courses are not well known enough to generate a large spontaneous demand, and, unlike A-level provision, there is no prior qualification to base an estimate on how many we might expect. The varying levels of provision by region, particularly the relatively high number of access course students in the London region, suggest that there may be latent unmet demand. The high take-up of access courses in the London region is particularly notable given the fact that this region has the highest level of young HE participation (HEFCE 2005) in England. It is also possible that there may be other factors, like the numbers of graduate jobs, which make access courses in London particularly attractive.
39
132. Given the lack of clear evidence for unmet or latent demand, it would be unwise to set a national target for growth. Nevertheless individual colleges should be in a position to be able to test their local markets and develop programmes sometimes in conjunction with Aimhigher partnerships22, sometimes through other initiatives. In its review of access courses, the QAA recommended that the funding arrangements should ensure security of funding and provide incentives for the development of new programmes (QAA 2004b). Since then the Learning and Skills Council, which funds access course provision, has ensured that its local offices understand the value of access courses and it has developed a higher education strategy which identifies access courses as critical to delivering the widening participation agenda. 133. Future access course take-up may also depend on the level of student support available for both maintenance and fees. The further education White Paper (DfES 2006) proposes full fee remission for access course students up to the age of 25, for those without a full level 3 qualification. For those over 25, it seems likely that full fee remission will continue to be available for those on income-related welfare benefits. 134. The case study above also highlights the fact that successful completion of an access course may not provide an opening to a higher education course. The development of Lifelong Learning Networks may help to smooth the path to progression in some cases, but the nature of access courses means that students’ ambitions are likely to be diverse and, as we have seen, students from one access course will enter a wide range of institutions. Specific arrangements between institutions, or even groups of institutions, are unlikely to fully meet the needs of these students. What is needed is an acceptance of access course preparation by a wider range of institutions and departments. This was recognised in the QAA review (QAA 2004b), and since then progress has been made to ensure the standards required to achieve an access qualification are clear and consistently applied. Further, steps are being taken to develop a system of grading for access courses so that students will be able to demonstrate achievement beyond the current threshold level. This should help students when applying to institutions and departments where there is a high demand for places. 135. Taken together, these developments may not only expand access course provision, but may enable more access course students to progress to higher education, and for these students to graduate from a wider range of institutions.
22 Aimhigher partnerships help widen participation to higher education by raising aspirations and achievement among potential HE entrants. The Aimhigher website is at www.aimhigher.ac.uk/home/index.cfm.
40
References Elias, P and Purcell, K (2004), ‘SOC(HE): A classification of occupations for studying the graduate labour market’, Research Paper No. 6, Employment Studies Research Unit and Warwick Institute for Employment Research, March 2004 DfES (2006), ‘FE Reform: Raising Skills, Improving Life Chances’, March 2006 HEFCE (2005), ‘Young participation in higher education’, HEFCE report 2005/03 Learning and Skills Development Agency (2003), ‘Access to Higher Education. Research project for QAA’, LSDA publication, December 2003 Quality Assurance Agency (2002), ‘Key statistics 2002’, Joint QAA, UCAS, HESA and HEFCE publication, May 2002 Quality Assurance Agency (2003), ‘Key statistics 2003’, Joint QAA, UCAS, HESA and HEFCE publication, May 2003 Quality Assurance Agency (2004a), ‘Key statistics 2004’, Joint QAA, UCAS, HESA and HEFCE publication, May 2004 Quality Assurance Agency (2004b), ‘Access to Higher Education Development Project‘, May 2004 Quality Assurance Agency (2005), ‘Key statistics 2005’, Joint QAA, ELWa, LSC, UCAS and HESA publication, May 2005 Reay, D, Ball, SJ and David, M (2002), ‘It’s taking me a long time but I’ll get there in the end: Mature students on access courses and higher education choice’, British Educational Research Journal 28; 1 pp. 5-19
41
Annex A Cohort definitions Original population
1. The original population, for year X, is made up of students who fit one of the following sets of criteria. Recorded on the LSC’s individualised learner (student) record and:
a. Commenced between 1 August year X and 31 July year X+1 (ILR field: START DATE between dates specified). b. Studying for an access qualification (ILR field: QUALIFICATION TYPE in (‘0004’,’0005’,’0007’)).
Or recorded on HESA’s individualised student record and: c. Commenced between 1 August year X and 31 July year X+1 (HESA field: COMDATE between dates specified). d. Studying for an access qualification (HESA field: QUALAIM in ('71','72','73','74','75','76','77','78','79','80','99'). e. Programme title (HESA field: PTITLE) contains the phrase ‘Access’ and does not contain either ‘microsoft’, ‘mcsft’, or ‘ms’. f. Student’s mode is either full-time, part-time or sandwich (HESA field 70: MODE, codes ‘01’, ‘02’, ‘23’, ‘24’, ‘25’, ‘31’, ‘38’ or ‘39’).
2. Where there are multiple instances of the same student, only a single record is selected with LSC’s ILR records favoured over HESA records. Cohort for analysis
To be included in our final cohort for analysis, students had to fulfil the following additional criteria:
a. Not on a higher education course in year X or X-1. b. Aged 19 or over at commencement of course.
c. Full-time and on course that lasts between 6 and 12 months, or part-time and on a course that last between 6 months and 2 years.
d. English-domiciled.
e. Funded through the LSC.
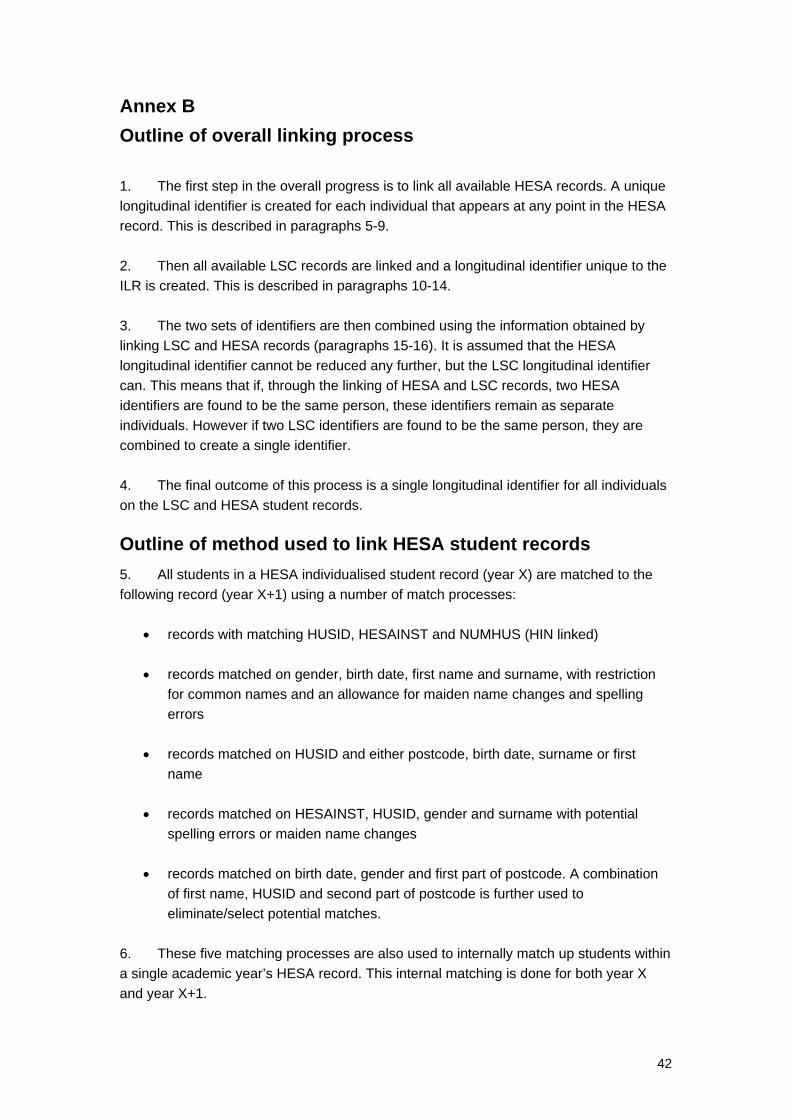
42
Annex B Outline of overall linking process 1. The first step in the overall progress is to link all available HESA records. A unique longitudinal identifier is created for each individual that appears at any point in the HESA record. This is described in paragraphs 5-9. 2. Then all available LSC records are linked and a longitudinal identifier unique to the ILR is created. This is described in paragraphs 10-14. 3. The two sets of identifiers are then combined using the information obtained by linking LSC and HESA records (paragraphs 15-16). It is assumed that the HESA longitudinal identifier cannot be reduced any further, but the LSC longitudinal identifier can. This means that if, through the linking of HESA and LSC records, two HESA identifiers are found to be the same person, these identifiers remain as separate individuals. However if two LSC identifiers are found to be the same person, they are combined to create a single identifier. 4. The final outcome of this process is a single longitudinal identifier for all individuals on the LSC and HESA student records. Outline of method used to link HESA student records
5. All students in a HESA individualised student record (year X) are matched to the following record (year X+1) using a number of match processes:
• records with matching HUSID, HESAINST and NUMHUS (HIN linked) • records matched on gender, birth date, first name and surname, with restriction
for common names and an allowance for maiden name changes and spelling errors
• records matched on HUSID and either postcode, birth date, surname or first
name • records matched on HESAINST, HUSID, gender and surname with potential
spelling errors or maiden name changes • records matched on birth date, gender and first part of postcode. A combination
of first name, HUSID and second part of postcode is further used to eliminate/select potential matches.
6. These five matching processes are also used to internally match up students within a single academic year’s HESA record. This internal matching is done for both year X and year X+1.
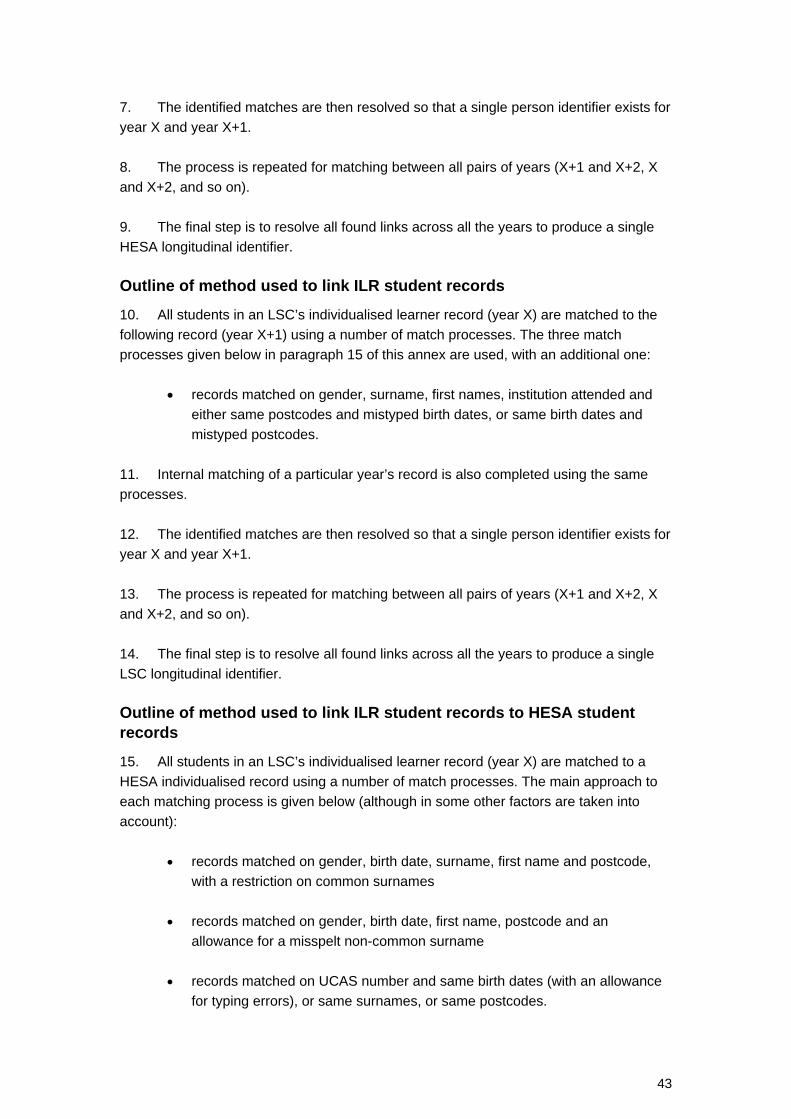
43
7. The identified matches are then resolved so that a single person identifier exists for year X and year X+1. 8. The process is repeated for matching between all pairs of years (X+1 and X+2, X and X+2, and so on). 9. The final step is to resolve all found links across all the years to produce a single HESA longitudinal identifier. Outline of method used to link ILR student records 10. All students in an LSC’s individualised learner record (year X) are matched to the following record (year X+1) using a number of match processes. The three match processes given below in paragraph 15 of this annex are used, with an additional one:
• records matched on gender, surname, first names, institution attended and either same postcodes and mistyped birth dates, or same birth dates and mistyped postcodes.
11. Internal matching of a particular year’s record is also completed using the same processes. 12. The identified matches are then resolved so that a single person identifier exists for year X and year X+1. 13. The process is repeated for matching between all pairs of years (X+1 and X+2, X and X+2, and so on). 14. The final step is to resolve all found links across all the years to produce a single LSC longitudinal identifier. Outline of method used to link ILR student records to HESA student records
15. All students in an LSC’s individualised learner record (year X) are matched to a HESA individualised record using a number of match processes. The main approach to each matching process is given below (although in some other factors are taken into account):
• records matched on gender, birth date, surname, first name and postcode, with a restriction on common surnames
• records matched on gender, birth date, first name, postcode and an
allowance for a misspelt non-common surname
• records matched on UCAS number and same birth dates (with an allowance for typing errors), or same surnames, or same postcodes.
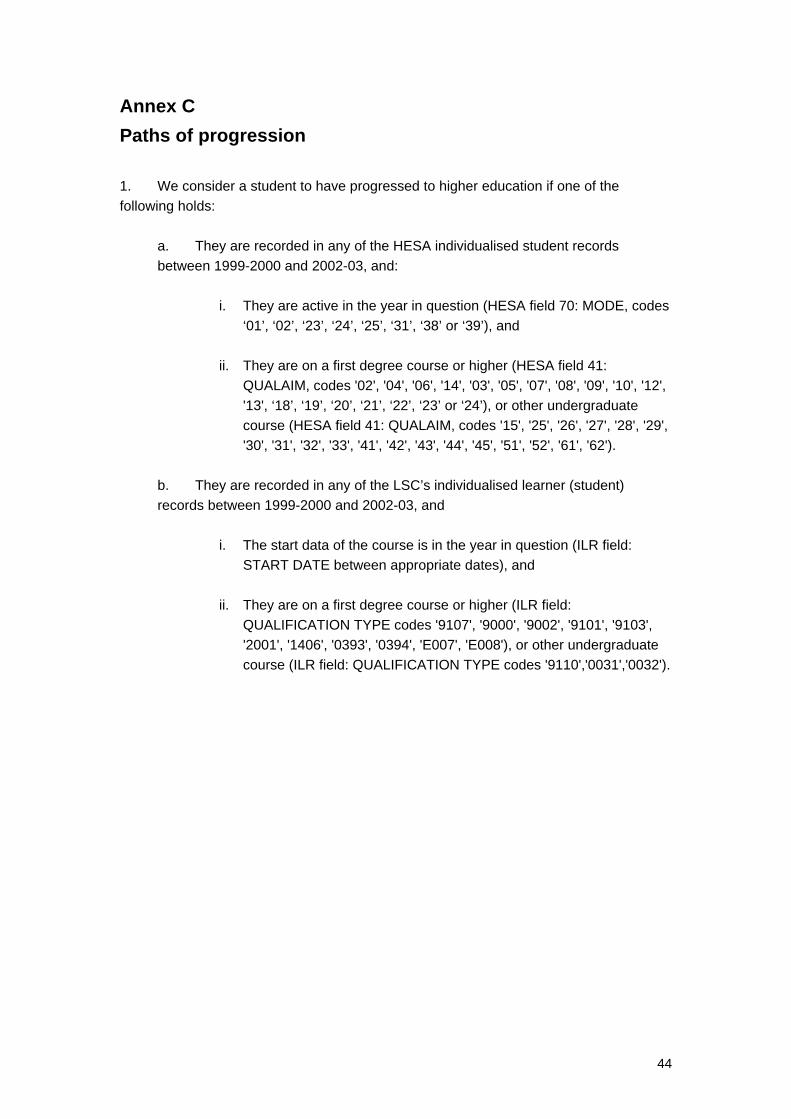
44
Annex C Paths of progression 1. We consider a student to have progressed to higher education if one of the following holds:
a. They are recorded in any of the HESA individualised student records between 1999-2000 and 2002-03, and:
i. They are active in the year in question (HESA field 70: MODE, codes
‘01’, ‘02’, ‘23’, ‘24’, ‘25’, ‘31’, ‘38’ or ‘39’), and
ii. They are on a first degree course or higher (HESA field 41: QUALAIM, codes '02', '04', '06', '14', '03', '05', '07', '08', '09', '10', '12', '13', ‘18’, ‘19’, ‘20’, ‘21’, ‘22’, ‘23’ or ‘24’), or other undergraduate course (HESA field 41: QUALAIM, codes '15', '25', '26', '27', '28', '29', '30', '31', '32', '33', '41', '42', '43', '44', '45', '51', '52', '61', '62').
b. They are recorded in any of the LSC’s individualised learner (student) records between 1999-2000 and 2002-03, and
i. The start data of the course is in the year in question (ILR field:
START DATE between appropriate dates), and ii. They are on a first degree course or higher (ILR field:
QUALIFICATION TYPE codes '9107', '9000', '9002', '9101', '9103', '2001', '1406', '0393', '0394', 'E007', 'E008'), or other undergraduate course (ILR field: QUALIFICATION TYPE codes '9110','0031','0032').
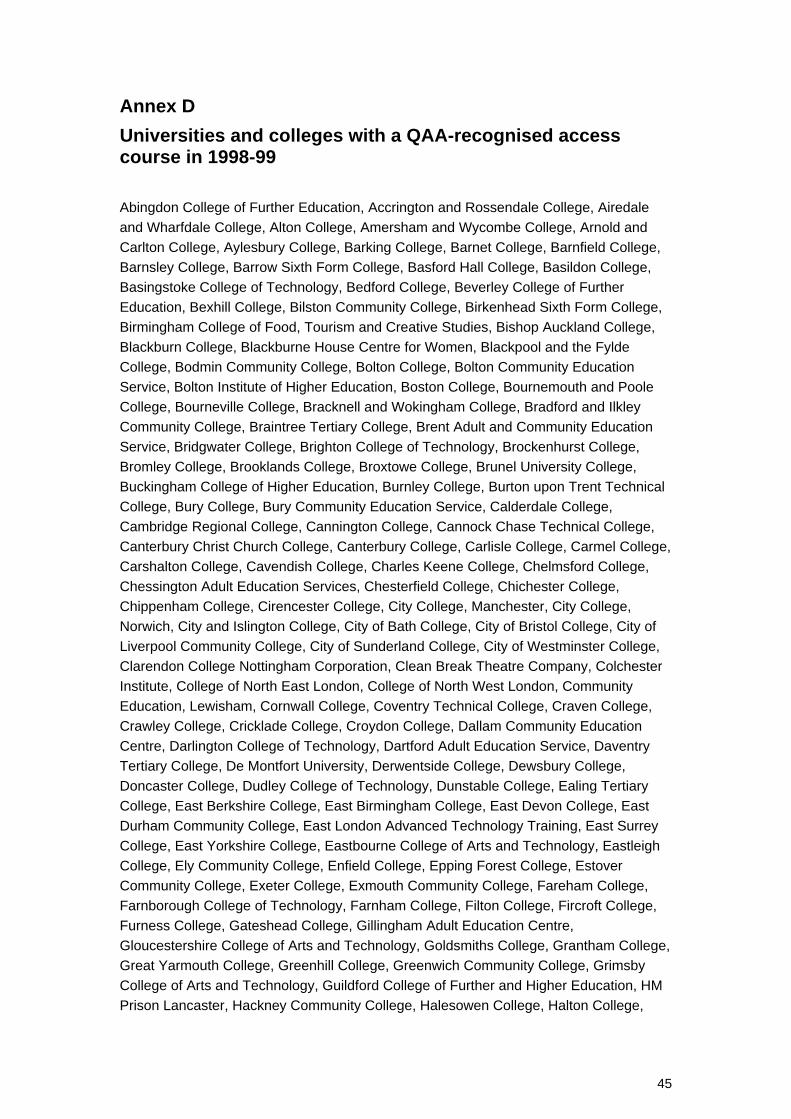
45
Annex D Universities and colleges with a QAA-recognised access course in 1998-99 Abingdon College of Further Education, Accrington and Rossendale College, Airedale and Wharfdale College, Alton College, Amersham and Wycombe College, Arnold and Carlton College, Aylesbury College, Barking College, Barnet College, Barnfield College, Barnsley College, Barrow Sixth Form College, Basford Hall College, Basildon College, Basingstoke College of Technology, Bedford College, Beverley College of Further Education, Bexhill College, Bilston Community College, Birkenhead Sixth Form College, Birmingham College of Food, Tourism and Creative Studies, Bishop Auckland College, Blackburn College, Blackburne House Centre for Women, Blackpool and the Fylde College, Bodmin Community College, Bolton College, Bolton Community Education Service, Bolton Institute of Higher Education, Boston College, Bournemouth and Poole College, Bourneville College, Bracknell and Wokingham College, Bradford and Ilkley Community College, Braintree Tertiary College, Brent Adult and Community Education Service, Bridgwater College, Brighton College of Technology, Brockenhurst College, Bromley College, Brooklands College, Broxtowe College, Brunel University College, Buckingham College of Higher Education, Burnley College, Burton upon Trent Technical College, Bury College, Bury Community Education Service, Calderdale College, Cambridge Regional College, Cannington College, Cannock Chase Technical College, Canterbury Christ Church College, Canterbury College, Carlisle College, Carmel College, Carshalton College, Cavendish College, Charles Keene College, Chelmsford College, Chessington Adult Education Services, Chesterfield College, Chichester College, Chippenham College, Cirencester College, City College, Manchester, City College, Norwich, City and Islington College, City of Bath College, City of Bristol College, City of Liverpool Community College, City of Sunderland College, City of Westminster College, Clarendon College Nottingham Corporation, Clean Break Theatre Company, Colchester Institute, College of North East London, College of North West London, Community Education, Lewisham, Cornwall College, Coventry Technical College, Craven College, Crawley College, Cricklade College, Croydon College, Dallam Community Education Centre, Darlington College of Technology, Dartford Adult Education Service, Daventry Tertiary College, De Montfort University, Derwentside College, Dewsbury College, Doncaster College, Dudley College of Technology, Dunstable College, Ealing Tertiary College, East Berkshire College, East Birmingham College, East Devon College, East Durham Community College, East London Advanced Technology Training, East Surrey College, East Yorkshire College, Eastbourne College of Arts and Technology, Eastleigh College, Ely Community College, Enfield College, Epping Forest College, Estover Community College, Exeter College, Exmouth Community College, Fareham College, Farnborough College of Technology, Farnham College, Filton College, Fircroft College, Furness College, Gateshead College, Gillingham Adult Education Centre, Gloucestershire College of Arts and Technology, Goldsmiths College, Grantham College, Great Yarmouth College, Greenhill College, Greenwich Community College, Grimsby College of Arts and Technology, Guildford College of Further and Higher Education, HM Prison Lancaster, Hackney Community College, Halesowen College, Halton College,
46
Hamilton Community College, Hammersmith and Fulham Community Education Service, Hammersmith and West London College, Handsworth College, Harlow College, Harrogate College, Hartlepool College of Further Education, Hartlepool Sixth Form College, Hastings College of Arts and Technology, Havant College, Havering College of Further and Higher Education, Haywards Heath College, Hendon College, Henley College, Hereward College, Hertford Regional College, Hexham Queen Elizabeth High School, High Peak College, Highbury College of Technology, Highfields Young and Community Centre, Highlands College, Hopwood Hall College, Huddersfield New College, Huddersfield Technical College, Hugh Baird College, Hull College of Further Education, Huntingdonshire Regional College, Hyde Clarendon College, Isle College of Further Education, Isle of Wight College, Isle of Wight Learning Centre, Ichen College, John Ellis Community Centre, Joseph Priestley College, Josiah Mason College, Keighley College, Kendal College, Kensington and Chelsea College, Kent Institute of Art and Design, Kenton School, King Edward VI College, Kingston College, Kingston Community Education, Kingsway College, Knowsley Community College, Lambeth College, Lambeth Community Education Service, Lancaster and Morecambe College, Leeds College of Art and Design, Leeds College of Music, Leeds College of Technology, Leek College of Further Education and Art, Leicester South Fields College, Lewes Tertiary College, Lewisham College, Linwood Centre, Lipson Community College, Liskeard Open Learning College, Liverpool Hope, Liverpool John Moores University, Loreto College, Loughborough College, Lowestoft College, Ludlow College, Macclesfield College, Mackworth College, Manchester Adult Education Service, Manchester College of Arts and Technology, Matthew Boulton College, Melton Mowbray College, Merton College, Mid Cheshire College, Mid Kent College of Higher and Further Education, Middlesbrough College, Milton Keynes College, Morley College, NESCOT, Nelson and Colne College, New College Durham, New College, Swindon, Newbury College, Newcastle College, Newcastle under Lyme College, Newham College of Further Education, Norfolk Adult Education department, Norfolk College, North Area College Stockport, North Birmingham College, North Derbyshire College, North Devon College, North East Worcestershire College, North Hertfordshire College, North Lincolnshire College, North Lindsey College, North Nottingham College, North Oxfordshire College, North Shropshire College, North Trafford College, North Tyneside College, North Warwickshire and Hinckley College, North West Kent College of Technology, Northampton College, Northbrook College, Northern College, Northern School of Contemporary Dance, Northumberland College, North Radstock College, Oaklands College, Okehampton College, Oldham College, Oldham Youth and Community Education Service, Orpington College, Oxford College of Further Education, Pakistani Muslim Centre, Park Lane College, Penwith College, People's College, Peter Symonds College, Peterborough Regional College, Plater College, Oxford, Plymouth College of Further Education, Preston College, Prince Edwin Adult College, Prior Pursglow College, Prudhoe County High School, Queen Elizabeth Sixth Form College, Darlington, Queen Mary's College, Reading College of Arts and Technology, Redbridge College, Regent College, Richard Huish College, Richmond Adult and Community Centre, Richmond upon Thames College, Ridge Danyers College, Riga International College of Economics and Business Administration, Rocking College of Arts and Technology, Rotherham Museum, Libraries and Arts department, Rotherham Young and Community Service, Rowley Regis College, Royal Forest of Dean College,
47
Royal National College for the Blind, Rugby College of Further Education, Runshaw College, Ruskin College, Oxford, Salford College, Salisbury College, Saltash College, Sandwell College of Further and Higher Education, Seaford Head Community College, Selby College, Sheffield Hallam University, Shrewsbury College of Arts and Technology, Skelmersdale College, Solihull College, Somerset College of Arts and Technology, Soundwell College, South Birmingham College, South Cheshire College, South Devon College, South Downs College, South East Derbyshire College, South East Essex College of Arts and Technology, South East Essex Sixth Form and Community College, South Kent College, South Nottingham College, South Thames College, South Trafford College, South Tyneside College, Southampton City College, Southgate College, Southport College, Southwark College, Spelthorne College, St Austell College, St Clare's Adult Education Centre, St Helens College, St John Rigby Sixth Form College, St Vincent College, Stafford College, Stamford College, Standish Community High School, Stanmore College, Stephenson College, Stockport Adult Education Service, Stockton and Billingham College of Further Education, Stockton Sixth Form College, Stoke on Trent College, Stourbridge College, Stratford upon Avon College, Strode College, Stroud College, Surrey Adult and Continuing Education Service, Surrey Institute of Art and Design, Sutton Coldfield College, Swartmore Centre, Swindon College, Tameside College of Technology, University of Exeter, Tamworth and Lichfield College, Taunton's College, Tavistock Community College, Teesside Tertiary College, Telford College of Arts and Technology, Thames Valley University, Thanet College, Adult College Lancaster, Charles Wootton College for Further Education, City Literary Institute, Co-operative College, Distance Learning Centre, Henley College, The London Institute, The Performing Arts Consortium, Rutland College, Sheffield College, Thomas Danby College, Thomas Rotherham College, Thurrock College, Tile Hill College, Totton College, Tower Hamlets College, Tresham Institute of Further and Higher Education, Trowbridge College, Truro College, Tynemouth College, Warrington Collegiate Institute, University of Derby, University of Hertfordshire, University of Huddersfield, University of Hull, University of Kent, University of Luton, University of North London, University of Plymouth, University of Portsmouth, University of Salford, University of Teesside, Uxbridge College, University of Sussex, Victoria Adult Education Centre, Wakefield District College, Walsall College of Arts and Technology, Waltham Forest College, Warwickshire College, Weald College, West Cheshire College, West Cumbria College, West Denton Community school, West Herts College, West Kent College, West Nottingham College, West Oxfordshire College, West Suffolk College, West Thames College, Westminster College, Weston College, Weymouth College, Wigan and Leigh College, Wigston College of Further Education, Wirral Metropolitan College, Wolverhampton Adult Education Service Woolwich College, Woolwich College, Works Education Association, Worthing Sixth Form College, Wreake Valley Community College, Wulfrun College of Further Education, Wycliffe Community College, Wyggeston and Queen Elizabeth I College, Wyke College, Yeovil College, York College of Further Education, Yorkshire Coast College
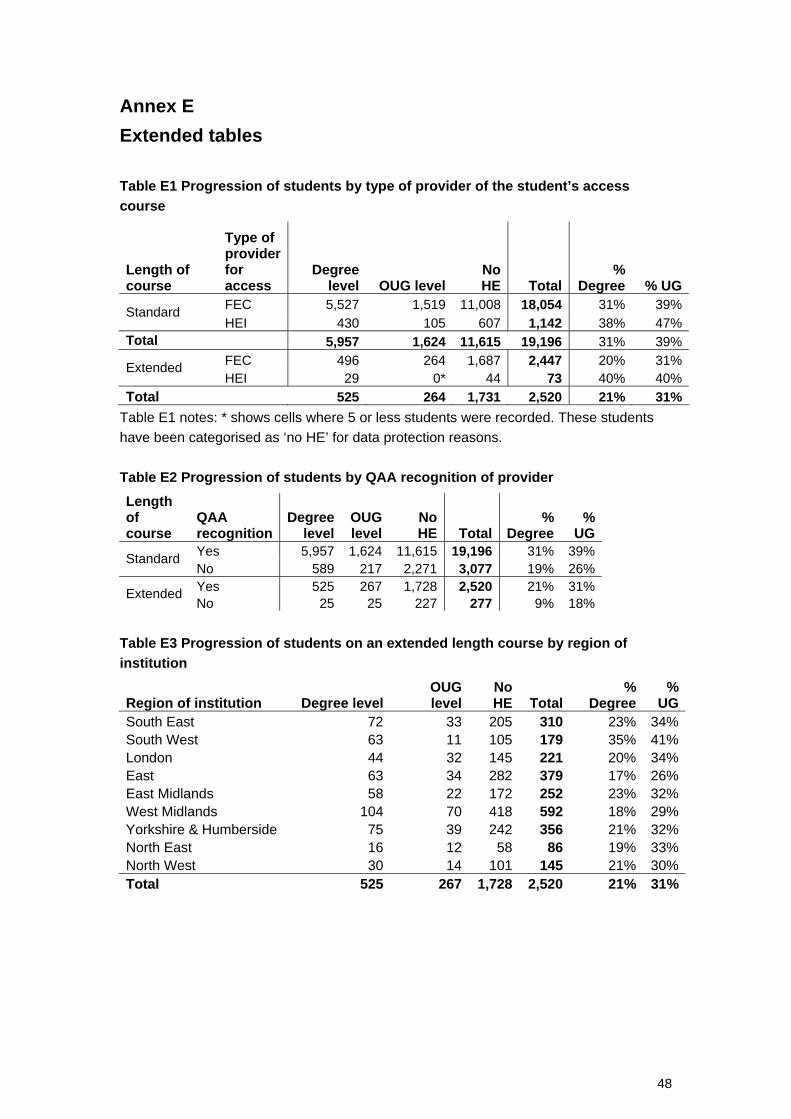
48
Annex E Extended tables Table E1 Progression of students by type of provider of the student’s access course
Length of course
Type of provider for access
Degree level OUG level
No HE Total
% Degree % UG
FEC 5,527 1,519 11,008 18,054 31% 39%Standard HEI 430 105 607 1,142 38% 47%
Total 5,957 1,624 11,615 19,196 31% 39%FEC 496 264 1,687 2,447 20% 31%Extended HEI 29 0* 44 73 40% 40%
Total 525 264 1,731 2,520 21% 31%Table E1 notes: * shows cells where 5 or less students were recorded. These students have been categorised as ‘no HE’ for data protection reasons. Table E2 Progression of students by QAA recognition of provider Length of course
QAA recognition
Degree level
OUG level
No HE Total
% Degree
% UG
Yes 5,957 1,624 11,615 19,196 31% 39% Standard No 589 217 2,271 3,077 19% 26% Yes 525 267 1,728 2,520 21% 31% Extended No 25 25 227 277 9% 18%
Table E3 Progression of students on an extended length course by region of institution
Region of institution Degree levelOUG level
No HE Total
% Degree
% UG
South East 72 33 205 310 23% 34%South West 63 11 105 179 35% 41%London 44 32 145 221 20% 34%East 63 34 282 379 17% 26%East Midlands 58 22 172 252 23% 32%West Midlands 104 70 418 592 18% 29%Yorkshire & Humberside 75 39 242 356 21% 32%North East 16 12 58 86 19% 33%North West 30 14 101 145 21% 30%Total 525 267 1,728 2,520 21% 31%
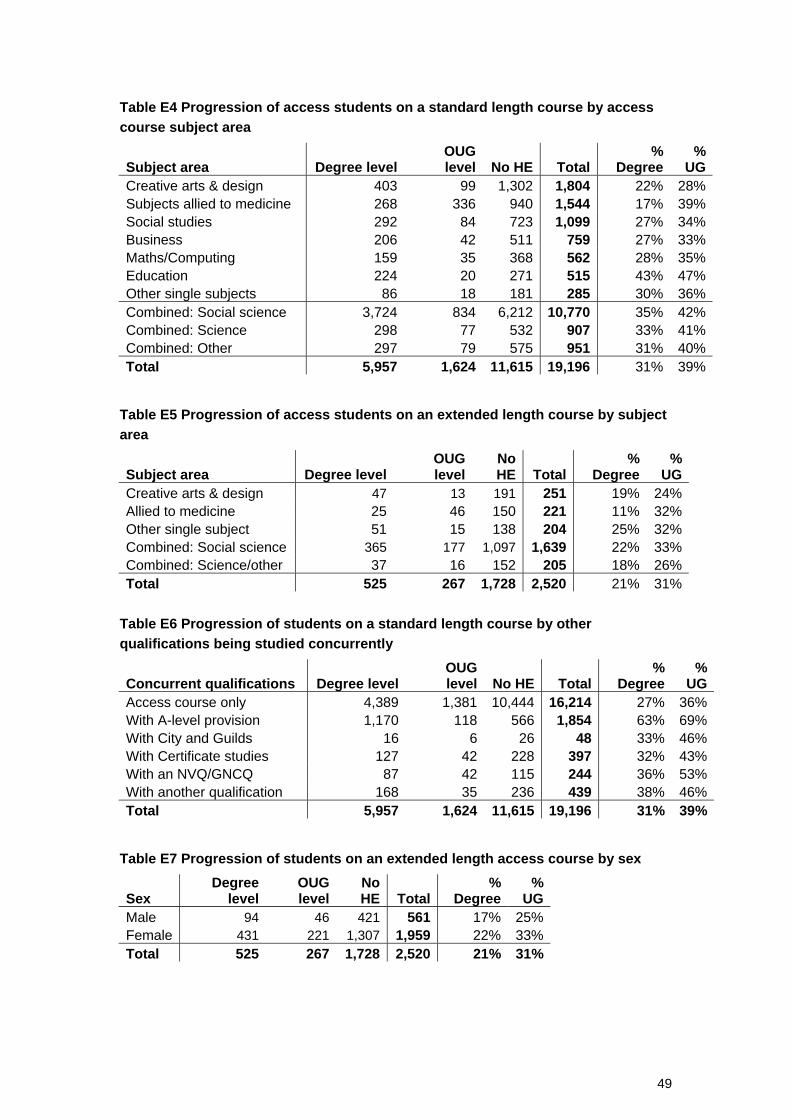
49
Table E4 Progression of access students on a standard length course by access course subject area
Subject area Degree levelOUG level No HE Total
% Degree
% UG
Creative arts & design 403 99 1,302 1,804 22% 28%Subjects allied to medicine 268 336 940 1,544 17% 39%Social studies 292 84 723 1,099 27% 34%Business 206 42 511 759 27% 33%Maths/Computing 159 35 368 562 28% 35%Education 224 20 271 515 43% 47%Other single subjects 86 18 181 285 30% 36%Combined: Social science 3,724 834 6,212 10,770 35% 42%Combined: Science 298 77 532 907 33% 41%Combined: Other 297 79 575 951 31% 40%Total 5,957 1,624 11,615 19,196 31% 39%
Table E5 Progression of access students on an extended length course by subject area
Subject area Degree levelOUG level
No HE Total
% Degree
% UG
Creative arts & design 47 13 191 251 19% 24%Allied to medicine 25 46 150 221 11% 32%Other single subject 51 15 138 204 25% 32%Combined: Social science 365 177 1,097 1,639 22% 33%Combined: Science/other 37 16 152 205 18% 26%Total 525 267 1,728 2,520 21% 31%
Table E6 Progression of students on a standard length course by other qualifications being studied concurrently
Concurrent qualifications Degree levelOUG level No HE Total
% Degree
% UG
Access course only 4,389 1,381 10,444 16,214 27% 36%With A-level provision 1,170 118 566 1,854 63% 69%With City and Guilds 16 6 26 48 33% 46%With Certificate studies 127 42 228 397 32% 43%With an NVQ/GNCQ 87 42 115 244 36% 53%With another qualification 168 35 236 439 38% 46%Total 5,957 1,624 11,615 19,196 31% 39%
Table E7 Progression of students on an extended length access course by sex
Sex Degree
level OUG level
No HE Total
% Degree
% UG
Male 94 46 421 561 17% 25%Female 431 221 1,307 1,959 22% 33%Total 525 267 1,728 2,520 21% 31%
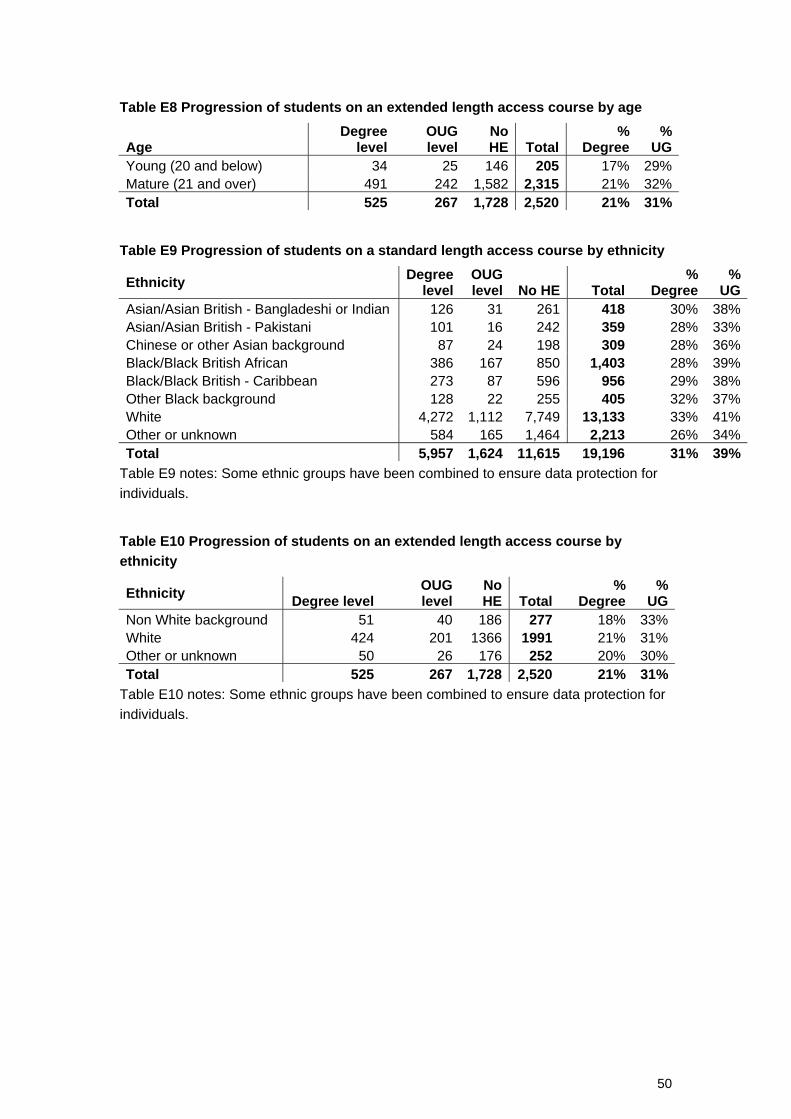
50
Table E8 Progression of students on an extended length access course by age
Age Degree
levelOUG level
No HE Total
% Degree
% UG
Young (20 and below) 34 25 146 205 17% 29%Mature (21 and over) 491 242 1,582 2,315 21% 32%Total 525 267 1,728 2,520 21% 31%
Table E9 Progression of students on a standard length access course by ethnicity
Ethnicity Degree level
OUG level No HE Total
% Degree
% UG
Asian/Asian British - Bangladeshi or Indian 126 31 261 418 30% 38%Asian/Asian British - Pakistani 101 16 242 359 28% 33%Chinese or other Asian background 87 24 198 309 28% 36%Black/Black British African 386 167 850 1,403 28% 39%Black/Black British - Caribbean 273 87 596 956 29% 38%Other Black background 128 22 255 405 32% 37%White 4,272 1,112 7,749 13,133 33% 41%Other or unknown 584 165 1,464 2,213 26% 34%Total 5,957 1,624 11,615 19,196 31% 39%
Table E9 notes: Some ethnic groups have been combined to ensure data protection for individuals.
Table E10 Progression of students on an extended length access course by ethnicity
Ethnicity Degree levelOUG level
No HE Total
% Degree
% UG
Non White background 51 40 186 277 18% 33%White 424 201 1366 1991 21% 31%Other or unknown 50 26 176 252 20% 30%Total 525 267 1,728 2,520 21% 31%
Table E10 notes: Some ethnic groups have been combined to ensure data protection for individuals.
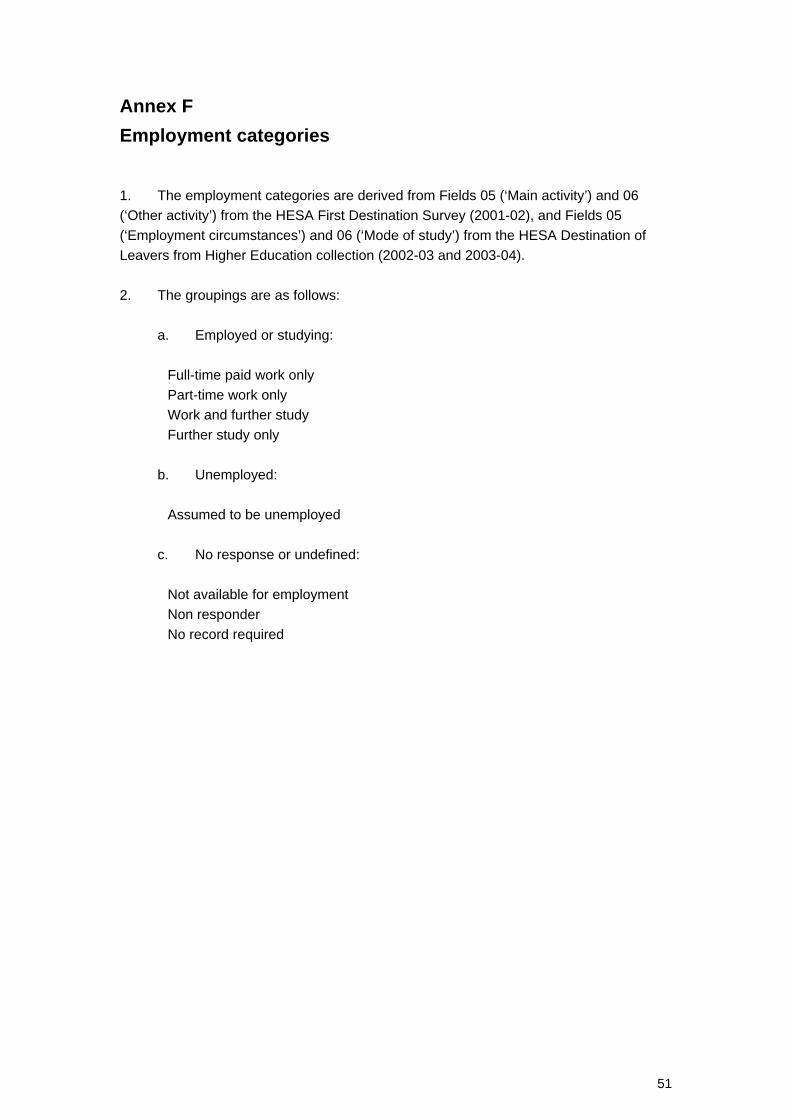
51
Annex F Employment categories 1. The employment categories are derived from Fields 05 (‘Main activity’) and 06 (‘Other activity’) from the HESA First Destination Survey (2001-02), and Fields 05 (‘Employment circumstances’) and 06 (‘Mode of study’) from the HESA Destination of Leavers from Higher Education collection (2002-03 and 2003-04). 2. The groupings are as follows:
a. Employed or studying:
Full-time paid work only Part-time work only Work and further study Further study only
b. Unemployed:
Assumed to be unemployed
c. No response or undefined:
Not available for employment Non responder No record required
52
List of abbreviations FE Further education
FEC Further education college
HE Higher education
HEFCE Higher Education Funding Council for England
HEI Higher education institution
HESA Higher Education Statistics Agency
ILR Individualised learner record
ISR Individualised student record
LSC Learning and Skills Council
LSDA Learning and Skills Development Agency
OUG Other undergraduate
QAA Quality Assurance Agency for Higher Education
TDA Training and Development Agency for Schools
UCAS Universities & Colleges Admissions Service
UG Undergraduate