Pathway Crosstalk Network Analysis Provides Insight...
8
Iran Red Crescent Med J. In Press(In Press):e12901. Published online 2017 September 5. doi: 10.5812/ircmj.12901. Research Article Pathway Crosstalk Network Analysis Provides Insight Into Novel Pathways in Breast Cancer Jin Zheng, 1 Hong Chen, 2 Ying Pan, 1 and Xin Yue 3,* 1 Breast Surgery, Lishui Central Hospital, Lishui 323000, Zhejiang Province, China 2 Department of Infection Control, Xi ‘an Hospital of Traditional Chinese Medicine, Xi-an 710021, Shaanxi Province, China 3 Department of Oncological Surgery, The First People’s Hospital of Jingzhou City, Jingzhou 434000, Hubei Province, China * Correspondence author: Xin Yue, Department of Oncological Surgery, The First People’s Hospital of Jingzhou City, No. 40 Jinlong Road, Shashi District, Jingzhou 434000, Hubei Province, China. Tel: +86-07163784295, Fax: +86-07163784295, E-mail: [email protected] Received 2017 March 15; Revised 2017 May 09; Accepted 2017 July 18. Abstract Background: Breast cancer (BC) is one of the leading causes of cancer-related mortality among females worldwide. There is no effective treatment for it, since the molecular mechanism underlying BC still remains unclear. Objectives: The current study aimed at identifying the hub pathways for BC based on pathway crosstalk networks (PCNs), and re- vealing the molecular mechanisms underlying BC. Methods: The current case-control bioinformatics analysis used the already published microarray data of BC. The current foundation-application study was performed in Moffitt cancer center, USA, in 2010. To begin with, the gene expression profile of BC (access number E-GEOD-10780), which included 185 samples (143 normal controls and 42 BC samples), was recruited from Array- Express database. Then, data pretreatment method was used. Next, the original pathways (OPs), original protein-protein interac- tion (PPI) network (OPPIN), and attract OPs (AOPs) were obtained. Then, the construction of background PCN (BPCN) and cancer PCN (CPCN) was performed, following the degree analysis of pathways in the BPCN and CPCN to further identify hub pathways. Moreover, the cross-talks for hub pathways were extracted and termed as hub cross-talks. Results: There were 300 nodes and 42,293 edges in BPCN, and 283 nodes and 25,750 edges in CPCN. According to the degree results, it was found that the degree distribution of pathways for BPCN was concentrated, while that of CPCN was dispersed. Moreover, the degree of original pathways in BPCN was greater than that of the majority of AOPs in CPCN. Based on the threshold of RankProd < 0.01 and false discovery rate of AOP < 0.01, thirteen significant pathways were detected. Using the threshold of impact factor > 240, a total of 4 hub pathways including glycolysis/gluconeogenesis, Alzheimer disease, carbon metabolism, and hepatitis C virus (HCV) infection were identified. Conclusions: Hub pathways such as glycolysis/gluconeogenesis and Alzheimer disease might be the potential signatures for BC therapy. Keywords: Breast Cancer, Network, Pathways, Biomarkers 1. Introduction Breast cancer (BC) is one of the leading causes of cancer-related mortality among females worldwide (1). Re- markably, aggressive phenotypes of BC have a poor prog- nosis (2). Currently, the standard diagnostic methods such as mammography as well as ultrasound are successfully used to detect early-stage BC (3). However, the limited sen- sitivity, incurred costs, and the expertise required for these tools restricted their application. Therefore, there is still an urgent need to seek for new and accurate screening and minimally invasive approaches for BC. Recently, pathways exerting crucial functions in onco- genesis provided new opportunities for early diagnosis of cancer (4). Given the sophisticated nature of biological sys- tems, pathways need to play roles in a coordinated man- ner to produce appropriate physiological responses to in- ternal and external stimuli. Previous studies mainly fo- cused on the single dysregulated pathways, but the cross- talks among pathways were frequently ignored (5, 6). In addition, Donato et al. (7) demonstrated that in some cases pathways with significant P values are not biologi- cally significant, while some biologically significant path- ways with nonsignificant P-values become statistically sig- nificant when the crosstalk effects of other pathways are re- moved. Moreover, a former study indicated that detecting pathway cross-talks is beneficial to reveal pathway func- tions (8). Thus, it is very important to understand the cross- talks among pathways to further understand the function of biological systems. Collectively, protein-protein inter- actions (PPIs) form a global interaction network that can elucidate the overall interaction and functional organiza- tion among functionalities. Moreover, a network-based method was utilized to analyze these interactions and ex- Copyright © 2017, Iranian Red Crescent Medical Journal. This is an open-access article distributed under the terms of the Creative Commons Attribution-NonCommercial 4.0 International License (http://creativecommons.org/licenses/by-nc/4.0/) which permits copy and redistribute the material just in noncommercial usages, provided the original work is properly cited. Uncorrected Proof
Transcript of Pathway Crosstalk Network Analysis Provides Insight...

Iran Red Crescent Med J. In Press(In Press):e12901.
Published online 2017 September 5.
doi: 10.5812/ircmj.12901.
Research Article
Pathway Crosstalk Network Analysis Provides Insight Into Novel
Pathways in Breast Cancer
Jin Zheng,1 Hong Chen,2 Ying Pan,1 and Xin Yue3,*
1Breast Surgery, Lishui Central Hospital, Lishui 323000, Zhejiang Province, China2Department of Infection Control, Xi ‘an Hospital of Traditional Chinese Medicine, Xi-an 710021, Shaanxi Province, China3Department of Oncological Surgery, The First People’s Hospital of Jingzhou City, Jingzhou 434000, Hubei Province, China
*Correspondence author: Xin Yue, Department of Oncological Surgery, The First People’s Hospital of Jingzhou City, No. 40 Jinlong Road, Shashi District, Jingzhou 434000,Hubei Province, China. Tel: +86-07163784295, Fax: +86-07163784295, E-mail: [email protected]
Received 2017 March 15; Revised 2017 May 09; Accepted 2017 July 18.
Abstract
Background: Breast cancer (BC) is one of the leading causes of cancer-related mortality among females worldwide. There is noeffective treatment for it, since the molecular mechanism underlying BC still remains unclear.Objectives: The current study aimed at identifying the hub pathways for BC based on pathway crosstalk networks (PCNs), and re-vealing the molecular mechanisms underlying BC.Methods: The current case-control bioinformatics analysis used the already published microarray data of BC. The currentfoundation-application study was performed in Moffitt cancer center, USA, in 2010. To begin with, the gene expression profile ofBC (access number E-GEOD-10780), which included 185 samples (143 normal controls and 42 BC samples), was recruited from Array-Express database. Then, data pretreatment method was used. Next, the original pathways (OPs), original protein-protein interac-tion (PPI) network (OPPIN), and attract OPs (AOPs) were obtained. Then, the construction of background PCN (BPCN) and cancer PCN(CPCN) was performed, following the degree analysis of pathways in the BPCN and CPCN to further identify hub pathways. Moreover,the cross-talks for hub pathways were extracted and termed as hub cross-talks.Results: There were 300 nodes and 42,293 edges in BPCN, and 283 nodes and 25,750 edges in CPCN. According to the degree results,it was found that the degree distribution of pathways for BPCN was concentrated, while that of CPCN was dispersed. Moreover, thedegree of original pathways in BPCN was greater than that of the majority of AOPs in CPCN. Based on the threshold of RankProd <0.01 and false discovery rate of AOP < 0.01, thirteen significant pathways were detected. Using the threshold of impact factor > 240,a total of 4 hub pathways including glycolysis/gluconeogenesis, Alzheimer disease, carbon metabolism, and hepatitis C virus (HCV)infection were identified.Conclusions: Hub pathways such as glycolysis/gluconeogenesis and Alzheimer disease might be the potential signatures for BCtherapy.
Keywords: Breast Cancer, Network, Pathways, Biomarkers
1. Introduction
Breast cancer (BC) is one of the leading causes ofcancer-related mortality among females worldwide (1). Re-markably, aggressive phenotypes of BC have a poor prog-nosis (2). Currently, the standard diagnostic methods suchas mammography as well as ultrasound are successfullyused to detect early-stage BC (3). However, the limited sen-sitivity, incurred costs, and the expertise required for thesetools restricted their application. Therefore, there is stillan urgent need to seek for new and accurate screening andminimally invasive approaches for BC.
Recently, pathways exerting crucial functions in onco-genesis provided new opportunities for early diagnosis ofcancer (4). Given the sophisticated nature of biological sys-tems, pathways need to play roles in a coordinated man-ner to produce appropriate physiological responses to in-
ternal and external stimuli. Previous studies mainly fo-cused on the single dysregulated pathways, but the cross-talks among pathways were frequently ignored (5, 6). Inaddition, Donato et al. (7) demonstrated that in somecases pathways with significant P values are not biologi-cally significant, while some biologically significant path-ways with nonsignificant P-values become statistically sig-nificant when the crosstalk effects of other pathways are re-moved. Moreover, a former study indicated that detectingpathway cross-talks is beneficial to reveal pathway func-tions (8). Thus, it is very important to understand the cross-talks among pathways to further understand the functionof biological systems. Collectively, protein-protein inter-actions (PPIs) form a global interaction network that canelucidate the overall interaction and functional organiza-tion among functionalities. Moreover, a network-basedmethod was utilized to analyze these interactions and ex-
Copyright © 2017, Iranian Red Crescent Medical Journal. This is an open-access article distributed under the terms of the Creative Commons Attribution-NonCommercial 4.0International License (http://creativecommons.org/licenses/by-nc/4.0/) which permits copy and redistribute the material just in noncommercial usages, provided theoriginal work is properly cited.
Uncorr
ected
Proo
f

Zheng J et al.
plore the molecular mechanism by which biological sys-tems work (9, 10). Hence, based on the hypothesis that 2pathways possibly interacted with each other (cross-talks)if, by chance, more protein interactions were identifiedbetween the 2 pathways than expected, the current studyaimed at extracting the pathway cross-talks via systemati-cally integrating information of pathways and PPI networkdata.
Therefore, the current study identified hub pathwaysand hub cross-talks in BC to explore the mechanisms of BCdevelopment based on the combination of biological path-ways and PPI network data. First, the original pathways(OPs), original PPI network (OPPIN), and attract OPs (AOPs)were obtained. Then, the background pathway crosstalknetwork (BPCN) and cancer pathway crosstalk network(CPCN) were constructed, following the degree analysis forthe pathways in BPCN and CPCN. Subsequently, RankProdand impact factor (IF) analyses were conducted to selectthe hub pathways. Moreover, the cross-talks for hub path-ways were extracted and named hub cross-talks. It is be-lieved that the current study results are helpful to under-stand the BC progression.
2. Methods
2.1. Microarray Data
The current case-control bioinformatics analysis usedthe already published microarray data on BC. The cur-rent foundation-application study was performed in Mof-fitt cancer center (Tampa), USA, in 2010. To the authors‘best knowledge, ArrayExpress is a larger fully public, in-ternational, innovative, and interdisciplinary repositoryfor high-throughput molecular abundance data, primar-ily gene expression data funded by 22 member states and2 associate member states. This database can help scien-tists to realize the potential of big data in biology. So far,there are a total of 2,194,040 assays in the ArrayExpressdatabase. In the current study conducted in 2016, underthe filter conditions of “transcription profiling by array”,“Homo sapiens”, and “breast cancer”, the samples were notsmall, gene expression data of BC under the access numberE-GEOD-10780 (11) were downloaded from the ArrayExpressdatabase on the basis of the platform A-AFFY-44-AffymetrixGeneChip Human Genome U133 Plus 2.0 [HG-U133_Plus_2].A total of 42 BC and 143 normal breast tissue samples werecollected from 90 patients with BC in this microarray pro-file. According to the histopathologic review by a breastpathologist, all of the 143 normal breast tissue sampleswere free from atypical ductal hyperplasia or invasive BC.Moreover, all of the 42 BC tissue samples were confirmedby the histopathologic review by the same breast pathol-ogist, using the modified Bloom and Richardson grading
scheme (12). Thus, all of the 185 samples (143 normal con-trols and 42 BC samples) were used in the current microar-ray analysis. The specific information about demograph-ical variables and confounding factors were shown in thepaper published by Chen et al. (12).
2.2. Data Pretreatment Method
Before analysis, data pretreatment method was con-ducted to control the quality of gene expression pro-file. Robust multi-array average (RMA) was firstly recom-mended to conduct background adjustment to eliminatethe influence of nonspecific hybridization (13). Then, thequantiles-based method was utilized to implement nor-malization analysis (14). This transformation was calcu-lated using the following equation:
P’n = X-1 (M (pn))
In this formula, M stood for each array empirical distri-bution and X represented the mean sample quantiles em-pirical distribution.
After normalization analysis, the “mas” algorithmwas employed to perform perfect-match (PM)/miss-match(MM) correction. Median polish was used to conduct thesummarization (15). Specifically, a multiple chip linearmodel was fit to each probe set. For a given probe set s witht = 1, …, Ts probes and data from r = 1,…, R arrays the follow-ing formula was made:
(1)log2 (PMstr) = as
t + bsr + cstr
In the equation, at was on the basis of a probe effect andbr denoted the log2 expression value.
After removing the repeated probes, aligning theprobes to the human genome to obtain the gene symbols,and eliminating the duplicated gene symbols, a total of20,102 genes were obtained.
2.3. Pathway Data and PPI Data
Kyoto encyclopedia of genes and genomes (KEGG) is adatabase that offers a reference knowledge base to under-stand cellular processes. In the current analysis, a total of300 original pathways covering 6,919 human genes werecollected, pathways from KEGG database called OPs.
All the human protein interactions (n = 1,048,576) weredownloaded from the public source of STRING. After map-ping the protein ID to the gene symbol and eliminatingrepetitive interactions, the study ended up with 787,896 in-teractions (involved in 16,730 genes). These 787,896 proteininteractions were called OPPIN.
2 Iran Red Crescent Med J. In Press(In Press):e12901.
Uncorr
ected
Proo
f

Zheng J et al.
2.4. Construction of BPCN
In an attempt to seek for the pathway cross-talks, thecrosstalk analysis was performed for all the OPs. First, thebackground distribution of protein interaction of any 2Ops was evaluated. Specifically, each OP was randomizedand all genes in a given OP were examined. If a gene did nothave any interactions with other nodes, it was removed. Ifa gene had interactions with other genes, firstly the num-ber of genes it interacted with was recorded, and then, agene was randomly drown from the protein interactiondataset, which interacted with similar or the same numberof genes, and this newly selected gene substituted the orig-inal pathway gene. Second, after randomizing both OPs,the number of protein interactions between any of the 2pathways was calculated. For each OP, the common genesof the 2 OPs were eliminated and all the protein interac-tions between the 2 pathways were computed. This step ofrandomization was repeated 10 000 rounds. The numberof total interactions of the pairs of corresponding random-ized pathways was obtained after 10,000 times of random-izations, and it was defined as the weight value. Then, BPCNwas constructed based on these OPs and weight values us-ing Cytoscape (16).
2.5. Analysis of OPs Using Attract Method
As documented, pathways with too few genes couldnot have enough biological content (17). In light of this,the 20,102 genes obtained above were mapped to theOPs, and the OPs with less than 5 genes were abandonedto select more confident pathways. Subsequently, theremaining 283 pathways were generated and named asAOPs. Then, genes enriched in the AOPs were examinedthrough GSEA-ANOVA to further obtain the F statistic value.Large F-statistic value demonstrated a strong association,but on the other hand, small F-statistic value exhibitedthat the genes revealed minimal group-specific expressionchanges. To testify this relationship, t test was used toamend log2-transformed F-statistics values. Afterwards,false discovery rate (FDR) was employed to correct the Pvalues using the Benjamini-Hochberg method (18). Then,these AOPs were sorted in the descending order of FDR.
2.6. Construction of CPCN
After attract analysis, CPCN was constructed based onthe 283 AOPs.
First, the weight values were calculated for pathwaycross-talks. It was assumed that G1 and G2 were the numberof genes enriched in any 2 AOPs. Then, the interaction anal-ysis was performed on the genes in these AOPs. If the genesin one AOP did not interact with the genes in the otherAOP, weight was determined as 0. Otherwise, the weight
values were calculated on the basis of the formula. Thus,the weights were defined as the sum of absolute value ofdifference of spearman correlation coefficient between 2AOPs divided by (G1x G2). This randomization step was du-plicated 10,000 times.
To select more confidant cross-talks, the significanceof interactions between 2 AOPs were evaluated accordingto the following 4 numbers: “m” represented the numberof interactions between AOPs, “M” as the number of over-all interactions of all AOP pairs, “a” as the mean value ofinteractions between the pair of corresponding random-ized pathways after 10,000 times of randomizations, and“A” stood for the average of overall interactions of all ran-domized pathway pairs after 10,000 times of randomiza-tions. The null hypothesis was that the ratio of actual in-teractions between 2 AOPs to all interactions (m/M) wasthe same as the ratio of random interactions to all randominteractions (a/A). The current study focused only on theAOP pairs where m/M was remarkably greater than a/A. Theweight values obtained above were computed and namedWICD. Then, the WICDs were corrected using FDR. The path-way cross-talks with FDR values < 0.05 were selected toconstruct the CPCN.
2.7. Degree analysis for BPCN and CPCN
Topological centrality is helpful to extract essentialmolecules in complex networks (19). Among the topolog-ical centralities, degree is an obvious index, which meansthe number of links of one node with its neighboringnodes (20). In the current study, degree analysis was im-plemented to deeply explore the significance of cross-talksin BPCN and CPCN.
2.8. Identification of Hub Pathways
The rank of FDR of AOPs was obtained in section 2.4 inthe current study. The AOPs with FDR < 0.01 were selectedfor further analyses. To detect important cross-talks in BC,RankProd (21) was utilized, which is a simple, yet power-ful meta-analysis tool to identify differentially expressedgenes between 2 experimental conditions in many studies(22, 23). The pathways with RankProd value < 0.01 wereconsidered as the significant pathways.
Recently, the biological impact of perturbation of path-ways in genome wide gene expression experiments wassuggested (24). IF analysis obtains deeper level of statisti-cal analysis, informed by more-specific biology than the ex-iting techniques. Thus, the current study performed the IFanalysis on the significant pathways. IFs of the significantpathways were computed using the following formula:
Ifs = (degree value of the pathways in CPCN) × (1 - FDRof AOPs)
Iran Red Crescent Med J. In Press(In Press):e12901. 3
Uncorr
ected
Proo
f

Zheng J et al.
Based on the formula, the significant pathways withIFs greater than 240 were considered as hub pathways.The cross-talks among hub pathways were regarded as hubcross-talks.
3. Results
3.1. Construction of BPCN and CPCN
As shown in Figure 1, the BPCN included 300 nodes and42 293 edges, covering 6919 genes. The construction ofCPCN was carried out based on the AOPs. Thus, the studyfirstly identified 283 AOPs using the attract method. Basedon these AOPs, cross-talks were extracted. Nevertheless, theedges where both pathways remarkably overlapped, andthe gene members stood for analogical biology were elim-inated. Ultimately, a total of 25,750 cross-talks involved in283 nodes were obtained (Figure 2).
Figure 1. Construction of Background Pathway Crosstalk Network Involving 300Nodes and 42 293 Interactions
Nodes were the original pathways, edges stood for the cross-talks among pathways;yellow nodes denoted hub pathways.
Next, the degree distribution of the pathways in BPCNand CPCN were checked to explore the significant cross-talks between BC and control samples. According to the re-sults, it was found that the degree distribution of pathwaysfor BPCN was concentrated (Figure 3A), while that of CPCNwas dispersed (Figure 3B). Moreover, the degree of originalpathways in BPCN was greater than that of the majority ofAOPs in CPCN.
3.2. Identification of Hub Pathways
Based on the threshold of RankProd < 0.01 and FDR ofAOP < 0.01, thirteen significant pathways were detected
Figure 2. Cancer Pathway Crosstalk Network Construction
There were 25,750 cross-talks involved in 283 nodes. Nodes were the attract originalpathways (AOPs); edges stood for the cross-talks among them; yellow nodes were thehub pathways.
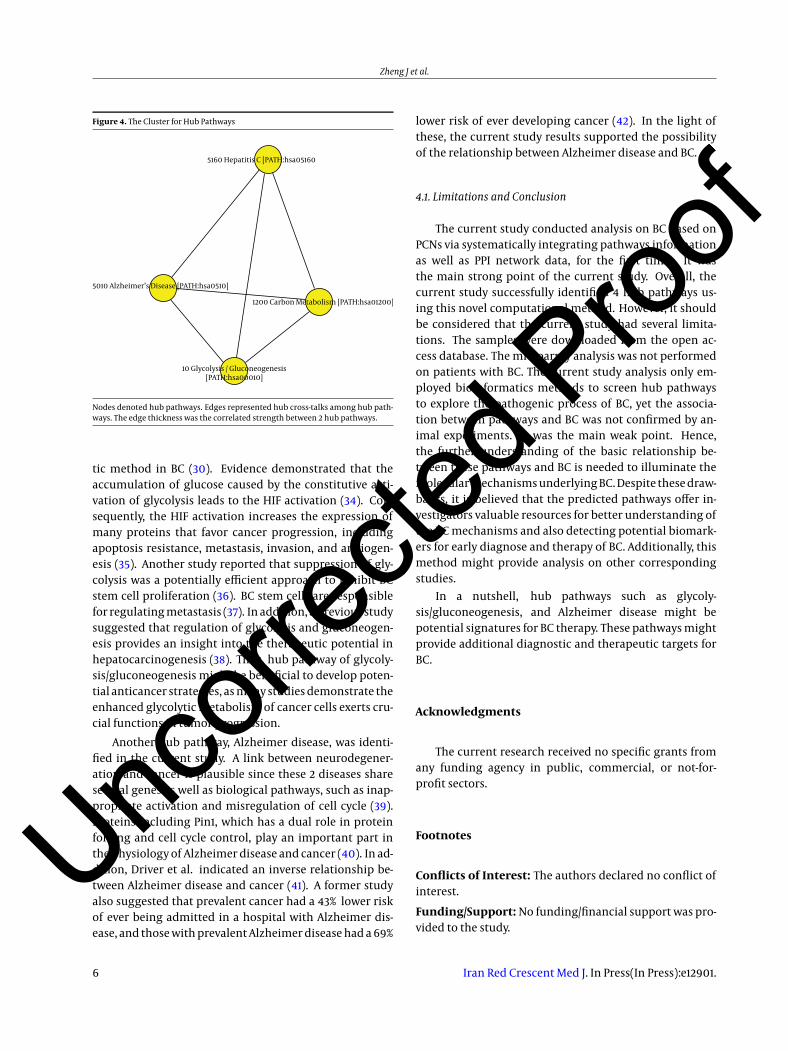
(Table 1). When the IF was set as 240, a total of 4 path-ways were identified and termed as hub pathways, includ-ing glycolysis/gluconeogenesis (IF = 255.096), Alzheimerdisease (IF= 254.187), carbon metabolism (IF = 249.144),and hepatitis C virus (HCV) infection (IF = 244.214). Sub-sequently, the hub cross-talks among hub pathways weredrawn and displayed in Figure 4.
4. Discussion
Currently, high-throughput technologies, such asgene microarray, are effective and standard means inbiomedicine. Accordingly, a series of computational ap-proaches are successfully employed to discover causaldisease-associated genes (25, 26). However, to date, anunsolved problem is how to explain these genes in thebiological contexts. A common solution is to utilize sta-tistical method to detect pathways connected with thedisease-associated genes (27). Exhilaratingly, the identi-fication of possible pathogenic pathways improves theaccuracy when these pathways are utilized as biomarkers,compared with the gene-based methods. Unfortunately,the majority of these methods do not consider the func-tional dependency among pathways, which may not becapable of generating a comprehensive view to the impactof the disease genes on pathways. Generally, pathwayscan influence each other via a phenomenon known ascrosstalk, rather than acting independently (7). Thus,a novel method was introduced to detect dysregulatedpathways in BC. Unlike the existing methods, the cur-rent study method considered the pathway interactions
4 Iran Red Crescent Med J. In Press(In Press):e12901.
Uncorr
ected
Proo
f

Zheng J et al.
Figure 3. Degree Distribution of Pathways in A, BPCN and B, CPCN
Pathway Pathway
0 50 100 150 200 250 300 0 50 100 150 200 250 300
Deg
ree
Deg
ree
300
250
200
150
100
50
250
200
150
100
50
0
BA
The degree distribution of pathways for BPCN was concentrated, while that of CPCN was dispersed. Moreover, the degree of original pathways in BPCN was greater than thatof the majority of AOPs in CPCN.
Table 1. List of Significant Pathways
Pathway Term Degree in BPCN Degree in CPCN FDR of AOP RP Value
Glycolysis/gluconeogenesis 298 257 7.41E-03 2.22E-03
VEGF signaling pathway 292 216 3.83E-05 2.31E-03
Alzheimer disease 298 255 3.21E-03 2.31E-03
Olfactory transduction 284 1 3.76E-05 3.33E-03
Focal adhesion 295 222 9.43E-05 3.51E-03
Carbon metabolism 298 250 3.42E-03 3.56E-03
Hepatitis C virus infection 294 245 3.21E-03 4.04E-03
TNF signaling pathway 293 207 3.83E-05 4.20E-03
PI3K-Akt signaling pathway 295 231 4.59E-04 4.40E-03
Pathways in cancer 297 231 5.57E-04 5.92E-03
Adherence junction 290 223 4.59E-04 6.58E-03
Chagas disease (the American trypanosomiasis) 295 224 4.59E-04 8.56E-03
Viral carcinogenesis 293 228 1.08E-03 9.44E-03
Abbreviations: AOP, The rest original pathways when abandoning the original pathways with less than 5 genes; BPCN, background pathway crosstalk network; CPCN,cancer pathway crosstalk network; RP, RankProd; FDR, false discovery rate.
among pathways. Comprehensively, the current studydiscovered that glycolysis/gluconeogenesis, Alzheimerdisease, carbon metabolism, and HCV infection were thehub pathways. These promising results suggested thatthe hub pathways indeed had cross-talks with each other,which further indicated the effectiveness of the proposedmethod.
Alterations in energy metabolism of the cell are re-garded as the hallmark of cancer (28). As already reported,cancer cells vitally need glucose similar to the metabo-lites for cancer cell growth (29). In cancer cells, glucose ismetabolized by aerobic glycolysis preferentially, and this
phenomenon, known as the Warburg effect, is character-ized by enhanced glycolysis generation (30). Dong et al.(31) also demonstrated that silencing of gluconeogenic en-zyme, fructose-1,6-biphosphatase, can activate fermenta-tive glycolysis. Except being a striking characterization ofcancer cell metabolism, the Warburg effect provides con-ditions favoring rapid proliferation and apoptosis resis-tance to cancer cells (32). It is noteworthy that the War-burg effect, as a specific metabolic pathway, might be apromising strategy to inhibit tumor growth and relapse(33). More significantly, a former study implicated that tar-geting the Warburg effect is a potentially novel therapeu-
Iran Red Crescent Med J. In Press(In Press):e12901. 5
Uncorr
ected
Proo
f
Zheng J et al.
Figure 4. The Cluster for Hub Pathways
5010 Alzheimer’s Disease [PATH:hsa0510]
10 Glycolysis / Gluconeogenesis[PATH:hsa00010]
1200 Carbon Metabolism [PATH:hsa01200]
5160 Hepatitis C [PATH:hsa05160
Nodes denoted hub pathways. Edges represented hub cross-talks among hub path-ways. The edge thickness was the correlated strength between 2 hub pathways.
tic method in BC (30). Evidence demonstrated that theaccumulation of glucose caused by the constitutive acti-vation of glycolysis leads to the HIF activation (34). Con-sequently, the HIF activation increases the expression ofmany proteins that favor cancer progression, includingapoptosis resistance, metastasis, invasion, and angiogen-esis (35). Another study reported that suppression of gly-colysis was a potentially efficient approach to inhibit BCstem cell proliferation (36). BC stem cells are responsiblefor regulating metastasis (37). In addition, a previous studysuggested that regulation of glycolysis and gluconeogen-esis provides an insight into the therapeutic potential inhepatocarcinogenesis (38). Thus, hub pathway of glycoly-sis/gluconeogenesis might be beneficial to develop poten-tial anticancer strategies, as many studies demonstrate theenhanced glycolytic metabolism of cancer cells exerts cru-cial functions in tumor progression.
Another hub pathway, Alzheimer disease, was identi-fied in the current study. A link between neurodegener-ation and cancer is plausible since these 2 diseases shareseveral genes as well as biological pathways, such as inap-propriate activation and misregulation of cell cycle (39).Proteins including Pin1, which has a dual role in proteinfolding and cell cycle control, play an important part inthe physiology of Alzheimer disease and cancer (40). In ad-dition, Driver et al. indicated an inverse relationship be-tween Alzheimer disease and cancer (41). A former studyalso suggested that prevalent cancer had a 43% lower riskof ever being admitted in a hospital with Alzheimer dis-ease, and those with prevalent Alzheimer disease had a 69%
lower risk of ever developing cancer (42). In the light ofthese, the current study results supported the possibilityof the relationship between Alzheimer disease and BC.
4.1. Limitations and Conclusion
The current study conducted analysis on BC based onPCNs via systematically integrating pathways informationas well as PPI network data, for the first time. It wasthe main strong point of the current study. Overall, thecurrent study successfully identified 4 hub pathways us-ing this novel computational method. However, it shouldbe considered that the current study had several limita-tions. The samples were downloaded from the open ac-cess database. The microarray analysis was not performedon patients with BC. The current study analysis only em-ployed bioinformatics methods to screen hub pathwaysto explore the pathogenic process of BC, yet the associa-tion between pathways and BC was not confirmed by an-imal experiments. It was the main weak point. Hence,the further understanding of the basic relationship be-tween these pathways and BC is needed to illuminate themolecular mechanisms underlying BC. Despite these draw-backs, it is believed that the predicted pathways offer in-vestigators valuable resources for better understanding ofthe BC mechanisms and also detecting potential biomark-ers for early diagnose and therapy of BC. Additionally, thismethod might provide analysis on other correspondingstudies.
In a nutshell, hub pathways such as glycoly-sis/gluconeogenesis, and Alzheimer disease might bepotential signatures for BC therapy. These pathways mightprovide additional diagnostic and therapeutic targets forBC.
Acknowledgments
The current research received no specific grants fromany funding agency in public, commercial, or not-for-profit sectors.
Footnotes
Conflicts of Interest: The authors declared no conflict ofinterest.
Funding/Support: No funding/financial support was pro-vided to the study.
6 Iran Red Crescent Med J. In Press(In Press):e12901.
Uncorr
ected
Proo
f
Zheng J et al.
References
1. McGuire S. World Cancer Report 2014. Geneva, Switzerland: WorldHealth Organization, International Agency for Research on Cancer,WHO Press, 2015. Adv Nutr. 2016;7(2):418–9. doi: 10.3945/an.116.012211.[PubMed: 26980827].
2. Chacon RD, Costanzo MV. Triple-negative breast cancer. Breast CancerRes. 2010;12 Suppl 2:S3. doi: 10.1186/bcr2574. [PubMed: 21050424].
3. Mar-Aguilar F, Mendoza-Ramirez JA, Malagon-Santiago I, Espino-Silva PK, Santuario-Facio SK, Ruiz-Flores P, et al. Serum circulatingmicroRNA profiling for identification of potential breast cancerbiomarkers. Dis Markers. 2013;34(3):163–9. doi: 10.3233/DMA-120957.[PubMed: 23334650].
4. Wan PT, Garnett MJ, Roe SM, Lee S, Niculescu-Duvaz D, Good VM, etal. Mechanism of activation of the RAF-ERK signaling pathway byoncogenic mutations of B-RAF. Cell. 2004;116(6):855–67. [PubMed:15035987].
5. Khatri P, Sirota M, Butte AJ. Ten years of pathway analysis: cur-rent approaches and outstanding challenges. PLoS Comput Biol.2012;8(2):e1002375. doi: 10.1371/journal.pcbi.1002375. [PubMed:22383865].
6. Zhai DK, Liu B, Bai XF, Wen JA. Identification of biomarkers andpathway-related modules involved in ovarian cancer based on topo-logical centralities. J BUON. 2016;21(1):208–20. [PubMed: 27061550].
7. Donato M, Xu Z, Tomoiaga A, Granneman JG, Mackenzie RG, Bao R,et al. Analysis and correction of crosstalk effects in pathway analy-sis. Genome Res. 2013;23(11):1885–93. doi: 10.1101/gr.153551.112. [PubMed:23934932].
8. Li Y, Agarwal P. A pathway-based view of human diseases and dis-ease relationships. PLoS One. 2009;4(2):e4346. doi: 10.1371/jour-nal.pone.0004346. [PubMed: 19194489].
9. Xia Y, Yu H, Jansen R, Seringhaus M, Baxter S, Greenbaum D,et al. Analyzing cellular biochemistry in terms of molecularnetworks. Annu Rev Biochem. 2004;73:1051–87. doi: 10.1146/an-nurev.biochem.73.011303.073950. [PubMed: 15189167].
10. Barabasi AL, Oltvai ZN. Network biology: understanding thecell’s functional organization. Nat Rev Genet. 2004;5(2):101–13.doi: 10.1038/nrg1272. [PubMed: 14735121].
11. Chen DT, Nasir A, Culhane A, Venkataramu C, Fulp W, RubioR, et al. Proliferative genes dominate malignancy-risk gene sig-nature in histologically-normal breast tissue. Breast Cancer ResTreat. 2010;119(2):335–46. doi: 10.1007/s10549-009-0344-y. [PubMed:19266279].
12. Robbins P, Pinder S, de Klerk N, Dawkins H, Harvey J, Sterrett G, etal. Histological grading of breast carcinomas: A study of interob-server agreement. Human Pathol. 1995;26(8):873–9. doi: 10.1016/0046-8177(95)90010-1.
13. Irizarry RA, Bolstad BM, Collin F, Cope LM, Hobbs B, Speed TP. Sum-maries of Affymetrix GeneChip probe level data. Nucleic Acids Res.2003;31(4):e15. [PubMed: 12582260].
14. Bolstad BM, Irizarry RA, Astrand M, Speed TP. A comparison of normal-ization methods for high density oligonucleotide array data basedon variance and bias. Bioinformatics. 2003;19(2):185–93. [PubMed:12538238].
15. Giorgi FM, Bolger AM, Lohse M, Usadel B. Algorithm-driven artifacts inmedian polish summarization of microarray data. BMC Bioinformat-ics. 2010;11:553. doi: 10.1186/1471-2105-11-553. [PubMed: 21070630].
16. Shannon P, Markiel A, Ozier O, Baliga NS, Wang JT, Ramage D, et al. Cy-toscape: a software environment for integrated models of biomolec-ular interaction networks. Genome Res. 2003;13(11):2498–504. doi:10.1101/gr.1239303. [PubMed: 14597658].
17. Li Y, Agarwal P, Rajagopalan D. A global pathway crosstalk net-work. Bioinformatics. 2008;24(12):1442–7. doi: 10.1093/bioinformat-ics/btn200. [PubMed: 18434343].
18. Benjamini Y, Hochberg Y. Controlling the false discovery rate: a prac-tical and powerful approach to multiple testing. Journal Royal Statisti-cal Soc. 1995:289–300.
19. Prifti E, Zucker JD, Clement K, Henegar C. Interactional and func-tional centrality in transcriptional co-expression networks. Bioin-formatics. 2010;26(24):3083–9. doi: 10.1093/bioinformatics/btq591.[PubMed: 20959383].
20. Otte E, Rousseau R. Social network analysis: a powerful strategy, alsofor the information sciences. J Inf Sci. 2002;28(6):441–53.
21. Bioconductor . Rank Product method for identifying differentiallyexpressed genes with application in meta-analysis 2015. Availablefrom: http://www.bioconductor.org/packages/release/bioc/html/RankProd.html.
22. Wilson CL, Sims AH, Howell A, Miller CJ, Clarke RB. Effects of oe-strogen on gene expression in epithelium and stroma of normalhuman breast tissue. Endocr Relat Cancer. 2006;13(2):617–28. doi:10.1677/erc.1.01165. [PubMed: 16728587].
23. Breitling R, Herzyk P. Rank-based methods as a non-parametric alter-native of the T-statistic for the analysis of biological microarray data.J Bioinform Comput Biol. 2005;3(5):1171–89. [PubMed: 16278953].
24. Draghici S, Khatri P, Tarca AL, Amin K, Done A, Voichita C, et al. Asystems biology approach for pathway level analysis. Genome Res.2007;17(10):1537–45. doi: 10.1101/gr.6202607. [PubMed: 17785539].
25. Zhang YX, Zhao YL. Pathogenic Network Analysis Predicts Can-didate Genes for Cervical Cancer. Comput Math Methods Med.2016;2016:3186051. doi: 10.1155/2016/3186051. [PubMed: 27034707].
26. Liu H, Han X, Li Y. Identifying disrupted pathways by tracking alteredmodules in type 2 DM-related heart failure. Herz. 2017;42(1):98–106.doi: 10.1007/s00059-016-4445-1. [PubMed: 27363418].
27. Li C, Li X, Miao Y, Wang Q, Jiang W, Xu C, et al. SubpathwayMiner: asoftware package for flexible identification of pathways. Nucleic AcidsRes. 2009;37(19):e131. doi: 10.1093/nar/gkp667. [PubMed: 19706733].
28. Icard P, Lincet H. A global view of the biochemical pathways involvedin the regulation of the metabolism of cancer cells. Biochim BiophysActa. 2012;1826(2):423–33. doi: 10.1016/j.bbcan.2012.07.001. [PubMed:22841746].
29. Munoz-Pinedo C, El Mjiyad N, Ricci JE. Cancer metabolism: currentperspectives and future directions. Cell Death Dis. 2012;3:e248. doi:10.1038/cddis.2011.123. [PubMed: 22237205].
30. Schell JC, Olson KA, Jiang L, Hawkins AJ, Van Vranken JG, Xie J, et al. Arole for the mitochondrial pyruvate carrier as a repressor of the War-burg effect and colon cancer cell growth. Mol Cell. 2014;56(3):400–13.doi: 10.1016/j.molcel.2014.09.026. [PubMed: 25458841].
31. Dong C, Yuan T, Wu Y, Wang Y, Fan TW, Miriyala S, et al. Lossof FBP1 by Snail-mediated repression provides metabolic advan-tages in basal-like breast cancer. Cancer Cell. 2013;23(3):316–31. doi:10.1016/j.ccr.2013.01.022. [PubMed: 23453623].
32. Vander Heiden MG, Cantley LC, Thompson CB. Understanding theWarburg effect: the metabolic requirements of cell proliferation. Sci-ence. 2009;324(5930):1029–33. doi: 10.1126/science.1160809. [PubMed:19460998].
33. Zhao Y, Butler EB, Tan M. Targeting cellular metabolism to improvecancer therapeutics. Cell Death Dis. 2013;4:e532. doi: 10.1038/cd-dis.2013.60. [PubMed: 23470539].
34. Lu H, Dalgard CL, Mohyeldin A, McFate T, Tait AS, Verma A. Reversibleinactivation of HIF-1 prolyl hydroxylases allows cell metabolismto control basal HIF-1. J Biol Chem. 2005;280(51):41928–39. doi:10.1074/jbc.M508718200. [PubMed: 16223732].
35. Lopez-Lazaro M. Hypoxia-inducible factor 1 as a possible targetfor cancer chemoprevention. Cancer Epidemiol Biomarkers Prev.2006;15(12):2332–5. doi: 10.1158/1055-9965.EPI-06-0369. [PubMed:17164353].
36. Ciavardelli D, Rossi C, Barcaroli D, Volpe S, Consalvo A, Zucchelli M, etal. Breast cancer stem cells rely on fermentative glycolysis and are sen-sitive to 2-deoxyglucose treatment. Cell Death Dis. 2014;5:e1336. doi:10.1038/cddis.2014.285. [PubMed: 25032859].
Iran Red Crescent Med J. In Press(In Press):e12901. 7
Uncorr
ected
Proo
f

Zheng J et al.
37. Charafe-Jauffret E, Ginestier C, Iovino F, Wicinski J, Cervera N, FinettiP, et al. Breast cancer cell lines contain functional cancer stem cellswith metastatic capacity and a distinct molecular signature. CancerRes. 2009;69(4):1302–13.
38. Reyes RK, Motiwala T, Jacob ST. Regulation of glucose metabolism inhepatocarcinogenesis by microRNAs. Gene Expr. 2014;16(2):85–92. doi:10.3727/105221614X13919976902093. [PubMed: 24801169].
39. Bajaj A, Driver JA, Schernhammer ES. Parkinson’s disease and can-cer risk: a systematic review and meta-analysis. Cancer Causes Con-trol. 2010;21(5):697–707. doi: 10.1007/s10552-009-9497-6. [PubMed:20054708].
40. Driver JA, Lu KP. Pin1: a new genetic link between Alzheimer’s dis-ease, cancer and aging. Curr Aging Sci. 2010;3(3):158–65. [PubMed:20735350].
41. Driver JA, Beiser A, Au R, Kreger BE, Splansky GL, Kurth T, et al. Inverseassociation between cancer and Alzheimer’s disease: results from theFramingham Heart Study. BMJ. 2012;344:e1442. doi: 10.1136/bmj.e1442.[PubMed: 22411920].
42. Roe CM, Fitzpatrick AL, Xiong C, Sieh W, Kuller L, Miller JP, et al. Can-cer linked to Alzheimer disease but not vascular dementia. Neurol-ogy. 2010;74(2):106–12. doi: 10.1212/WNL.0b013e3181c91873. [PubMed:20032288].
8 Iran Red Crescent Med J. In Press(In Press):e12901.
Uncorr
ected
Proo
f