PathTrak 4.6 (XPERTrak 1.0) Release Notescatvsupport.com/downloads/XT10/XPERTrak 1.0 Release Notes...
21
PathTrak 4.6 (XPERTrak 1.0) Release Notes XPERTrak Version 1.0 July 24, 2017
Transcript of PathTrak 4.6 (XPERTrak 1.0) Release Notescatvsupport.com/downloads/XT10/XPERTrak 1.0 Release Notes...

PathTrak 4.6 (XPERTrak 1.0) Release Notes
XPERTrak
Version 1.0
July 24, 2017

Version 1.0 Release Notes
XPERTrak
XPERTrak v1.0 Release Notes – v 1.0 1
Contents Summary of PathTrak 4.6/XPERTrak 1.0 Changes ........................................................................................ 2
New QoE metric and ranking .................................................................................................................... 3
Enhanced Alarm Data Content in SNMP Traps ......................................................................................... 5
New QoE Dashboard Login Landing page ................................................................................................. 7
The Maintenance Dashboard .................................................................................................................... 9
Element Analysis Screen ......................................................................................................................... 10
Plant Map Overlay .................................................................................................................................. 11
Performance View................................................................................................................................... 12
New Map Screens For QoE, PNM, And Downstream Monitoring .......................................................... 16
Ongoing Conversion Away From Flash ................................................................................................... 18
Other Corrections/Enhancements .......................................................................................................... 19
3rd Party Software Updates ................................................................................................................... 19
Reference Material/URL’s ....................................................................................................................... 20

Version 1.0 Release Notes
XPERTrak
XPERTrak v1.0 Release Notes – v 1.0 2
Summary of PathTrak 4.6/XPERTrak 1.0 Changes
• Rollup of additional upstream/downstream KPIs (Key Performance Indicators) creating an
entirely new QoE (Quality of Experience) metric that ranks nodes based on # of impacted
subscribers and how badly they are impacted
• Add HCU and RPM name to SNMP traps to allow user to deal with duplicate node names
• New QoE login landing dashboard
• Additional preventative maintenance dashboard
• Plant map support for ESRI, overlaid with PNM and downstream displays
• All PathTrak historical data on the same screen with new Performance View
• New QoE, PNM Pre-Eq and DS Monitoring maps to improve application navigation
• Ongoing Flash Conversion
• Other corrections/enhancements
• 3rd Party Security Updates (Java/MySQL)
• Reference Material
Version 1.0 Release Notes
XPERTrak
XPERTrak v1.0 Release Notes – v 1.0 3
New QoE metric and ranking
Today’s cable modems and CMTS are capable of providing a wealth of information that can assist in
determining if a specific subscriber is experiencing poor quality of experience and just how poor that
quality is.
This information can not only provide a clear picture of whether the problem is in the upstream or
downstream, but can pinpoint the individual subscribers that are being impacted the most severely, and
provide key performance values that can indicate what the impairment is likely to be.
Using a totally new algorithm, XPERTrak now shows a list of nodes ranked by their QoE score from worst
to best, identifying those nodes that are in the most immediate need of attention.
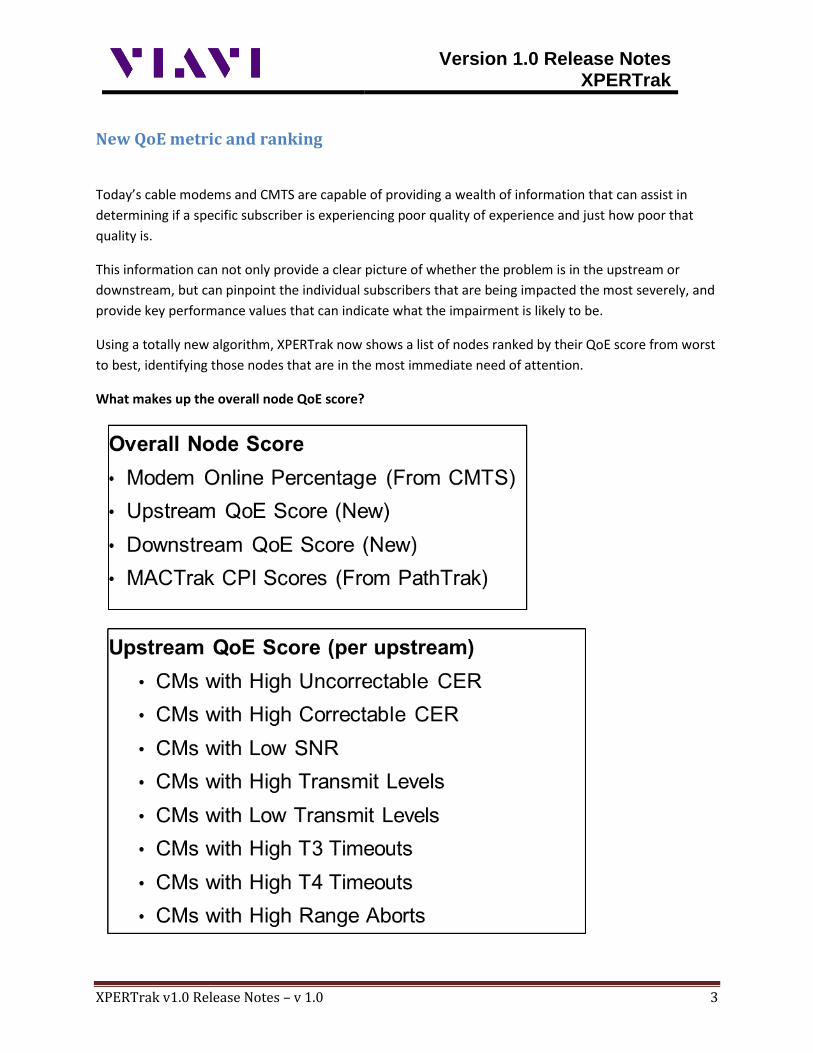
What makes up the overall node QoE score?

Version 1.0 Release Notes
XPERTrak
XPERTrak v1.0 Release Notes – v 1.0 4
What makes up the new downstream QoE score?
Implementation Details:
• Server MUST be licensed to perform the QoE measurements
• MUST have valid read only community string for each CMTS and valid read/write community
strings for all full-band capture capable cable modems
• All QoE metrics have default thresholds that are adjustable by the system administrator from the
system settings page
• Correctable CWE, uncorrectable CWE, and DOCSIS SNR determine impacted subscribers in the
upstream
• Correctable CWE, uncorrectable CWE, DOCSIS SNR and Digital Video SNR determine impacted
subscribers in the downstream
Adjusting the thresholds
• To access the QoE thresholds, as well as all other QoE, PNM and downstream full band capture
settings, click on the “Configuration” icon (The gear) on the main dashboard, and select “Settings”
from the menu

Version 1.0 Release Notes
XPERTrak
XPERTrak v1.0 Release Notes – v 1.0 5
Enhanced Alarm Data Content in SNMP Traps The HCU name and RPM name is now contained in all alarm traps sent from the Server
• Above is the SNMP MIB Tree from PathTrak V4.5 (No HCU or RPM names)

Version 1.0 Release Notes
XPERTrak
XPERTrak v1.0 Release Notes – v 1.0 6
• Here is the new SNMP MIB tree from PathTrak V4.6 showing new OIDs for HCU and RPM names

Version 1.0 Release Notes
XPERTrak
XPERTrak v1.0 Release Notes – v 1.0 7
• Details for added OIDs
New QoE Dashboard Login Landing page Gone are the days of logging into PathTrak and seeing a tree and branch hierarchy from the server on down and a list of alarms. The new QoE landing page
• Everyone lands here. URL = http://server name (or IP)/pathtrak
• Page is filtered based on user’s Server, HCU, RPM, RPM Port, or CMTS visibility and access A. Search by RPM port name, billing system node name, or cable modem MAC address B. Daily Node Health - Chart showing % of nodes that passed and % of nodes that failed vs. QoE
threshold yesterday C. Current Node Health - Chart showing % of nodes that passed and % of nodes that failed vs. QoE
threshold in the last 15 minutes D. Churn Priority Table – A ranking list of nodes from worst to best based on QoE score E. Alarms Summary – Chart showing % of nodes that good or in any of the 4 alarm states

Version 1.0 Release Notes
XPERTrak
XPERTrak v1.0 Release Notes – v 1.0 8
F. Alarms – List of all current alarms. Almost identical to the old PathTrak UI G. Administrative setup icons H. Link to the Maintenance Dashboard
At a glance, determine:
• Worst performing nodes based on adjustable QoE thresholds
• How many impacted subscribers per node
• Node quality vs time
• Nodes violating adjustable performance thresholds Drill down using mobile or desktop device to:
• Determine root cause of QoE problem
• Map impaired subscribers with plant map overlay
• Trend problems over time
• Generate live displays to resolve issue, verify fix The old hierarchy view is not gone completely…yet
• Can be accessed from the “Configuration” icon and selecting “Administration”
• Several administrative functions still must be done from here.
• Creating users and user groups
• Adding and deleting HCUs
• Naming any of the system elements
• Building, importing, exporting monitoring plans
• Firmware upgrades

Version 1.0 Release Notes
XPERTrak
XPERTrak v1.0 Release Notes – v 1.0 9
The Maintenance Dashboard
The QoE Dashboard will show what needs immediate attention. The Maintenance Dashboard is
intended to show where there are impairments in the plant that may or may not be causing subscriber
impacting issues.
A. Pre-EQ Summary - Chart showing % upstream channels that had Pre-EQ failures as well as the % of upstream channels that do not
B. Pre-EQ List – A list showing the worst 250 channels and the node they are on listed in order from worst PNM score to best
C. Downstream Summary - Chart showing % of downstream nodes that had impairments measured by full-band capture modems and % of downstream nodes that do not have impairments measured by full-band capture modems
D. Downstream List – A ranking list of nodes from worst to best based on the downstream impairments scores

Version 1.0 Release Notes
XPERTrak
XPERTrak v1.0 Release Notes – v 1.0 10
Element Analysis Screen
Clicking on any of the node names in the QoE Dashboard allows you to drill down to the Element
Analysis Screen
A. Total number of modems on the node with the count of how many are impacted by CWEs or SNR
B. Upstream Metrics – Per upstream channel – MACTrak, QoE, and Pre-EQ results C. Downstream Metrics – Per node – How many modems failed vs the QoE threshold and what and
how many RF impairments are present D. RPM Spectrum Summary – Max, Avg, Min levels over the last 15 minutes E. Launch icons for PNM, CMTS Spectrum, QAMTrak, and Performance View F. Launch icons for Monitoring View, RPM Spectrum, and Performance View G. Alarm list, Broadcast list, Event log
Focused on Subscriber impact
• Metrics driven by subscriber health Problem Segmentation
• Upstream o Spectrum o MACTrak o CMTS

Version 1.0 Release Notes
XPERTrak
XPERTrak v1.0 Release Notes – v 1.0 11
• Downstream o Spectrum o CPE
Branches workflow to right tool
• Ingress suppression
• Localized US HFC issues
• Localized DS impairments
Plant Map Overlay
If a plant mapping tool is being used that provides an API that gives us a URL that allows the system to
access a transparent .png file of the plant, we can overlay that onto the QoE, PNM and downstream
monitoring maps

Version 1.0 Release Notes
XPERTrak
XPERTrak v1.0 Release Notes – v 1.0 12
Performance View
Performance view for both spectrum and MACTrak are now on the same page along with all spectrum
performance history controls
A. Spectrum History – 15 minute intervals showing pass/fail results vs the node ranking RF threshold
B. MACTrak History – Also known as MACTrak Performance Monitoring. 15 minute intervals of the rolled up NPI score. Sill the metric that produces MACTrak alarms
C. Individual channel CPI scores D. Spectrum performance history controls
Version 1.0 Release Notes
XPERTrak
XPERTrak v1.0 Release Notes – v 1.0 13
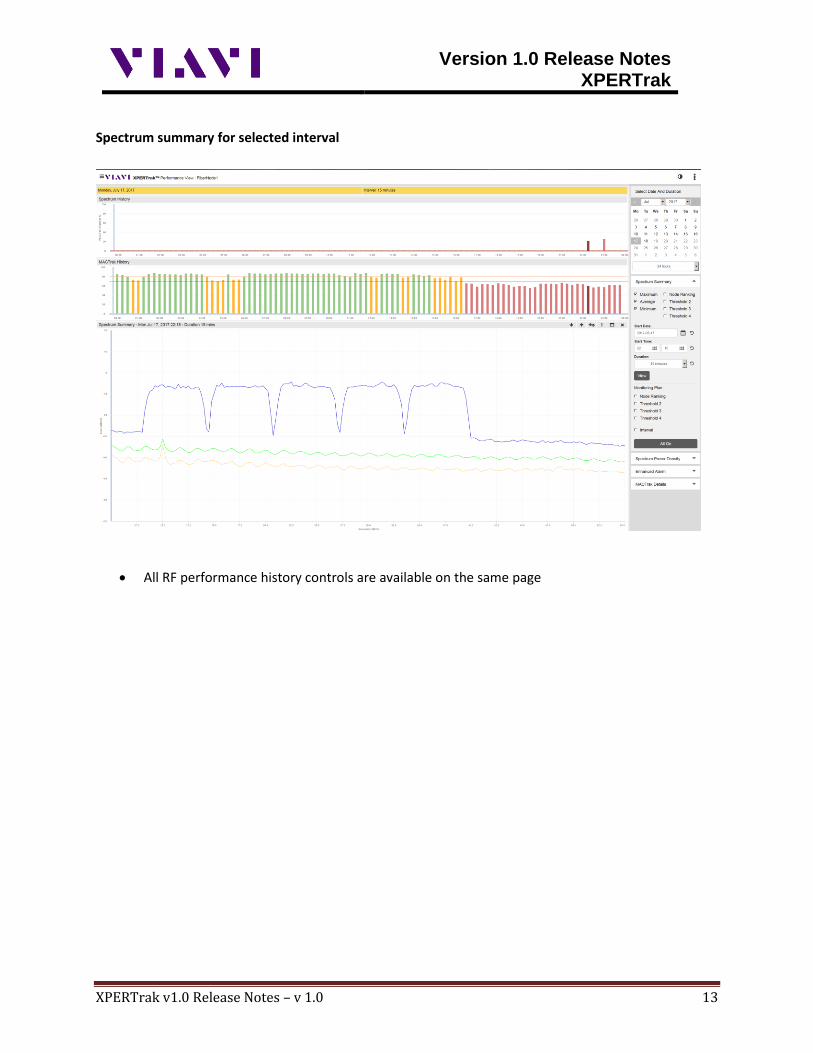
Spectrum summary for selected interval
• All RF performance history controls are available on the same page

Version 1.0 Release Notes
XPERTrak
XPERTrak v1.0 Release Notes – v 1.0 14
MACTrak Details for selected interval
• Click on any 15 minute CPI interval to see all of the MACTrak measurements during that time period
• Highlighted area matches 15 minute period selected
• Total graphs show selected 15 minute period + and – 15 minutes (45 minutes total)

Version 1.0 Release Notes
XPERTrak
XPERTrak v1.0 Release Notes – v 1.0 15
The return of the 3D Time Window Summary Performance History graph
• Shows signal levels at all frequencies over the specified period on time
• Graph can be rotated for best viewing angle
• Other graph styles available including line and dot (Surface shown)
Version 1.0 Release Notes
XPERTrak
XPERTrak v1.0 Release Notes – v 1.0 16
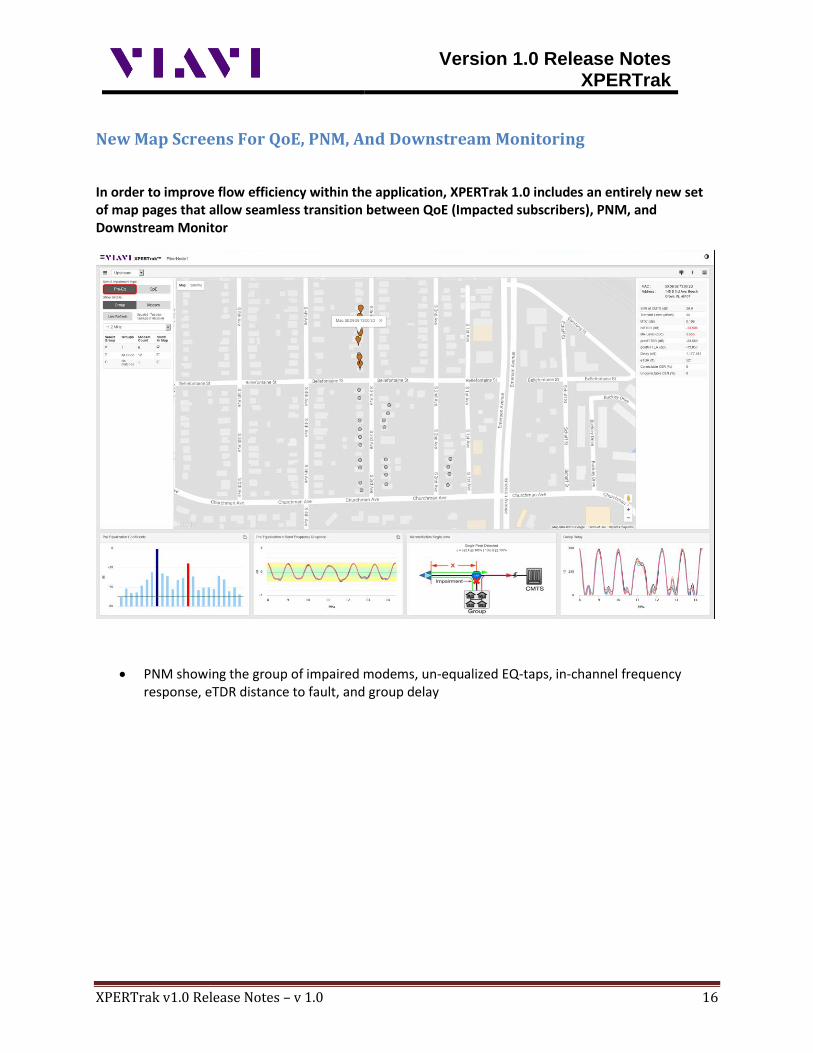
New Map Screens For QoE, PNM, And Downstream Monitoring
In order to improve flow efficiency within the application, XPERTrak 1.0 includes an entirely new set of map pages that allow seamless transition between QoE (Impacted subscribers), PNM, and Downstream Monitor
• PNM showing the group of impaired modems, un-equalized EQ-taps, in-channel frequency response, eTDR distance to fault, and group delay

Version 1.0 Release Notes
XPERTrak
XPERTrak v1.0 Release Notes – v 1.0 17
Quickly hit the QoE button and see if any of the modems have upstream QoE problems impacting subscribers at this time

Version 1.0 Release Notes
XPERTrak
XPERTrak v1.0 Release Notes – v 1.0 18
A quick change on the pull-down menu and now you are looking at the downstream impairments as
well as QoE (impacted subscribers)
Red dots indicate modems that have customer impacting impairments. Green dots are OK.
A. Spectrum Impairments table – Shows which RF impairments are present and how many there are
B. Metrics Table – What are the measurements for the QoE metrics. Offending metrics will turn red
C. Plant map overlay toggle.
Ongoing Conversion Away From Flash
All screens and application with the exception of the administrative functions mentioned on page 9 have been converted to JavaScript/HTML5. Those still require a Flash-capable browser, but work is ongoing to migrate all remaining items way from Flash.
Version 1.0 Release Notes
XPERTrak
XPERTrak v1.0 Release Notes – v 1.0 19
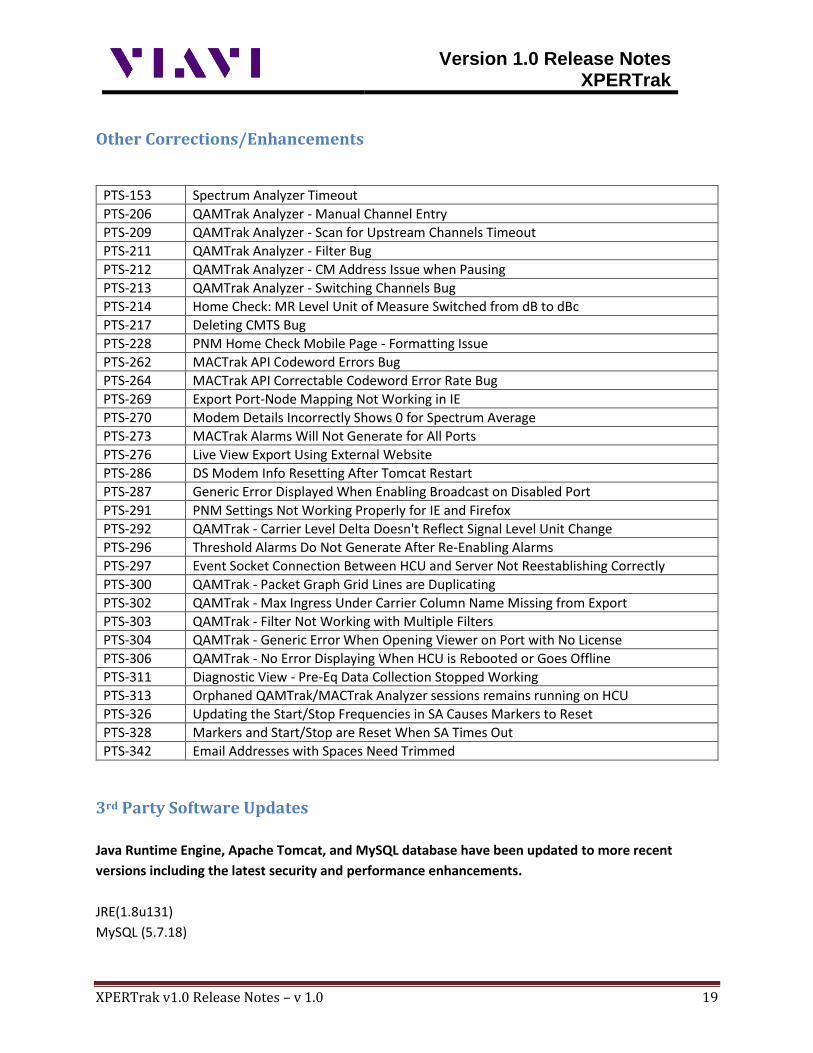
Other Corrections/Enhancements
PTS-153 Spectrum Analyzer Timeout
PTS-206 QAMTrak Analyzer - Manual Channel Entry
PTS-209 QAMTrak Analyzer - Scan for Upstream Channels Timeout
PTS-211 QAMTrak Analyzer - Filter Bug
PTS-212 QAMTrak Analyzer - CM Address Issue when Pausing
PTS-213 QAMTrak Analyzer - Switching Channels Bug
PTS-214 Home Check: MR Level Unit of Measure Switched from dB to dBc
PTS-217 Deleting CMTS Bug
PTS-228 PNM Home Check Mobile Page - Formatting Issue
PTS-262 MACTrak API Codeword Errors Bug
PTS-264 MACTrak API Correctable Codeword Error Rate Bug
PTS-269 Export Port-Node Mapping Not Working in IE
PTS-270 Modem Details Incorrectly Shows 0 for Spectrum Average
PTS-273 MACTrak Alarms Will Not Generate for All Ports
PTS-276 Live View Export Using External Website
PTS-286 DS Modem Info Resetting After Tomcat Restart
PTS-287 Generic Error Displayed When Enabling Broadcast on Disabled Port
PTS-291 PNM Settings Not Working Properly for IE and Firefox
PTS-292 QAMTrak - Carrier Level Delta Doesn't Reflect Signal Level Unit Change
PTS-296 Threshold Alarms Do Not Generate After Re-Enabling Alarms
PTS-297 Event Socket Connection Between HCU and Server Not Reestablishing Correctly
PTS-300 QAMTrak - Packet Graph Grid Lines are Duplicating
PTS-302 QAMTrak - Max Ingress Under Carrier Column Name Missing from Export
PTS-303 QAMTrak - Filter Not Working with Multiple Filters
PTS-304 QAMTrak - Generic Error When Opening Viewer on Port with No License
PTS-306 QAMTrak - No Error Displaying When HCU is Rebooted or Goes Offline
PTS-311 Diagnostic View - Pre-Eq Data Collection Stopped Working
PTS-313 Orphaned QAMTrak/MACTrak Analyzer sessions remains running on HCU
PTS-326 Updating the Start/Stop Frequencies in SA Causes Markers to Reset
PTS-328 Markers and Start/Stop are Reset When SA Times Out
PTS-342 Email Addresses with Spaces Need Trimmed
3rd Party Software Updates
Java Runtime Engine, Apache Tomcat, and MySQL database have been updated to more recent
versions including the latest security and performance enhancements.
JRE(1.8u131)
MySQL (5.7.18)

Version 1.0 Release Notes
XPERTrak
XPERTrak v1.0 Release Notes – v 1.0 20
Apache Tomcat (8.0.44)
Reference Material/URL’s
URL for preliminary user/admin guide videos (These will change when the actual guides are complete.
https://www.youtube.com/playlist?list=PLJ_RmHn6WYXTJgylZrW-7zzP9u2QRMZec