Path Planning Algorithm for Fatigue Life Prediction of SiC ...
31
Path Planning Algorithm for Fatigue Life Prediction of SiC/AL MMCs Considering Residual Stress Wenqian Shang Shanghai University of Engineering Science Xintian Liu ( [email protected] ) Shanghai University of Engineering Science https://orcid.org/0000-0002-3395-9176 Xu Wang Shanghai University of Engineering Science Xiaolan Wang Shanghai University of Engineering Science Research Article Keywords: Fatigue life estimation, Path planning, Residual temperature stress, Composite material Posted Date: May 5th, 2021 DOI: https://doi.org/10.21203/rs.3.rs-442520/v1 License: This work is licensed under a Creative Commons Attribution 4.0 International License. Read Full License
Transcript of Path Planning Algorithm for Fatigue Life Prediction of SiC ...

Path Planning Algorithm for Fatigue Life Predictionof SiC/AL MMCs Considering Residual StressWenqian Shang
Shanghai University of Engineering ScienceXintian Liu ( [email protected] )
Shanghai University of Engineering Science https://orcid.org/0000-0002-3395-9176Xu Wang
Shanghai University of Engineering ScienceXiaolan Wang
Shanghai University of Engineering Science
Research Article
Keywords: Fatigue life estimation, Path planning, Residual temperature stress, Composite material
Posted Date: May 5th, 2021
DOI: https://doi.org/10.21203/rs.3.rs-442520/v1
License: This work is licensed under a Creative Commons Attribution 4.0 International License. Read Full License

1
Path Planning Algorithm for Fatigue Life Prediction of SiC/AL
MMCs Considering Residual Stress
Wenqian Shang, Xintian Liu*1, Xu Wang and Xiaolan Wang
School of Mechanical and Automotive Engineering,
Shanghai University of Engineering Science,
No.333, Long Teng road, Shanghai, 201620, P.R. China
Abstract
To explore the influence of path deflection on crack propagation, a path planning
algorithm is presented to calculate the crack growth length. The fatigue crack growth
life of metal matrix composites (MMCs) is estimated based on an improved Paris
formula. Considering the different expansion coefficient of different materials, the
unequal shrinkage will lead to residual stress when the composite is molded and
cooled. The crack growth model is improved by the modified stress ratio based on
residual stress. Although the data obtained by the new model are not consistent with
the experimental data very well, it can still prove that the idea of establishing the
model is effective to a certain extent.
Keyword: Fatigue life estimation; Path planning; Residual temperature stress;
Composite material
*Corresponding author. Tel.: +86216779 1147. E-mail address: [email protected]

2
Nomenclature
ICK fracture toughness
F geometric factor
a crack size
0a initial crack length
ca crack size at failure
R stress ratio
ασ stress change related to residual stress
αΔ difference of expansion coefficient
tΔ temperature difference
mK elastic modulus of matrix
iK elastic modulus of reinforcement
minσ minimum stress
maxσ maximum stress
σΔ
stress amplitude
bσ tensile strength
egvσΔ
equivalent stress
iN crack initiation life
fN crack propagation life
cεΔ threshold of strain range
fε fracture fatigue strain

3
fσ fracture fatigue strength
E elastic modulus
K intensity coefficient
n strain hardening exponent
tK theoretical stress concentration factor
1τ torsional fatigue limit
ψ reduction of area
KΔ stress intensity factor range
C, m material parameters of Paris formula
θ deflection angle of crack
P coefficient of expansion

4
Introduction
Composite have been widely used in aerospace, machinery, shipbuilding and
other fields [1]. Carbon fiber composites have good mechanical properties in various
aspects, it is one of the most popular composite materials at present, but it need a
more stringent working environment temperature compare to other composite
materials. Excessive temperature will have a destructive effect on the material. The
current manufacturing cost is too high to mass-produce civilians. Particle-reinforced
metal materials are isotropy which similar to metal materials, it has been
mass-produced with different smelting technologies.
Mechanical Components often suddenly failure when subjected to cyclic stress
far below the yield limit, which is defined as fatigue failure. In engineering
applications, most failures are caused by fatigue failures, fatigue life prediction play a
significant role for reliability evaluation [2]. It is dangerous to staff in the working
environment if parts of the machine are suddenly damaged during operation. In
addition, it will also cause unnecessary economic losses to businesses and society.
Therefore, accurately predicting the fatigue life of component is of great significance
for production safety and product design [3-5]. The fatigue life prediction of
traditional metal materials includes strength degradation model, damage accumulation
model, energy method, S-N curve and other methods [6-8]. The fatigue life of
materials is affected by loading strength, load-stress ratio, and different load loading
sequences [9-13]. In addition, the surface roughness and operating temperature of
materials will affect the fatigue life of component [14-16]. Many scholars and
researchers have modified the model based on above all these factors, and propose
more prediction methods suitable for material properties and working environment
[17,18]. More and more scholars analyze the fatigue life by establishing numerical
models [19-23]. Based on the fatigue research results and experience of metal
materials, many scholars have carried out fatigue life analysis of metal matrix
composites [24, 25]. Metal matrix composites perform better than metal alloys in
terms of fatigue performance [27-29]. Researchers believe that it is caused by
multiple reasons, such as reinforcements that increase crack closure. This paper

5
interprets the increase in fatigue life of metal matrix composites as the increase in
fatigue crack length, and the reduction in the effective driving force for crack
propagation caused by the deflection angle.
Path planning was originally part of a robot behavior algorithm. Its definition
refers to finding a collision-free path from the starting position to the target position
according to certain evaluation criteria in an environment with obstacles [30, 31]. The
different distribution of obstacles in the environment directly affects the planned path.
So path planning can be defined as an active behavior that allows a robot or
mechanical device to choose a path around an obstacle based on the environment.
Path planning algorithms include Dijkstra algorithm, genetic algorithm, neural
network algorithm, ant colony algorithm and so on. In studying the crack growth of
particle-reinforced metal matrix composites, it is found that when the reinforcement
particles are distributed uniformly and disorderly in the material, fatigue crack growth
will deflect or break through the reinforcement particles when they encounter the
reinforcement particles. It is precisely because the presence of reinforcing particles
hinders the growth of fatigue cracks that the composite material exhibits a higher
fatigue life in the macro. Whether the crack passes through the reinforcing particles
depends on the current crack tip stress. In an ideal condition, all the reinforcing
particles will not be penetrated, which could be hinder crack growth and propagation
to the greatest extent. The behavior of cracks bypassing all reinforcing particles can
be similar to robot path planning, but crack growth is a passive behavior which is
different with path planning. It is possible to predict the crack path by path planning
algorithm. The fatigue behavior of composite materials is quite different from that of
traditional metals. By combining crack length and path planning, the composite
materials fatigue life prediction can be more accurate.
1 statement of the problem
The fatigue life prediction of components is of great significance to product
design and production safety. Composite materials have superior performance than
traditional materials, which are replacing traditional materials in engineering in a wide
range. As far as composite parts are concerned, the currently fatigue life estimation

6
models are only applicable within a certain range. In order to predict the life of
composite parts more accurately, the following issues need to be addressed urgently:
(1) As a new type of material, composite materials are far less mature than
traditional materials. So that the test data of composite materials are less than those of
common metal materials at present. Besides that, parameters of traditional metal
materials, such as strength, Poisson's ratio, and section shrinkage, are easy to be
collected by a great number of experiments, but there are more factors affecting the
performance of composites. For example, ceramic particle-reinforced metal-based
composite materials, its reinforcing matrix volume fraction, metal-based alloy
properties, and even the material manufacturing process will affect the material
properties, so the experimental data is difficult to reproduce。
(2) Composite materials have a different structure from traditional metal
materials. Metals usually have metal atoms arranged in a certain shape, and therefore
have certain properties. There are many forms of composite materials. The ceramic
particle reinforced metal matrix composites discussed in this paper include silicon
carbide particles and alloys. Different materials are connected through the interface.
Due to different microstructure, the internal stress distribution and fatigue crack
growth of composite materials are different from traditional metal materials.
(3) The fatigue failure mechanism of composite materials is different from that
of traditional materials. Most of the current fatigue prediction methods for composites
use traditional fatigue prediction models. Material performance parameters are
replaced during prediction to obtain rough estimates of fatigue life. For example,
when it is necessary to estimates the crack fracture length, the calculation process is
shown as follows:
21
σF
K
πa IC
c (1)
When it is necessary to calculate the crack fracture length of SiC/Al, the current
general processing method is to use the fracture toughness of SiC/Al instead of AL to
obtain the result. The force change caused by the SiC reinforcing particles inside the
material and the influence on the calculation results are not considered. This method

7
can meet engineering applications within a certain range, but it cannot reflect the
failure mechanism of the composite material. By analyzing the failure process of
composite materials, a model to improve the accuracy of life prediction is established.
2 Crack propagation path model
2.1 Dijkstra algorithm
Dijkstra algorithm is used to simulate the path planning of random paths. This
algorithm solves the single-source shortest path problem of weighted directed graphs
by breadth-first search. The principle is to go back from the end point, find the last
shortest path, and keep repeating until the start point.
Fig. 1 Schematic diagram of local shortest path
As shown in Figure 1, the purpose of the algorithm is to find the shortest path
from the starting point A to the ending point F. There are two arrays U and V, U
indicates points that have been backtracked, V indicates points that have not been
backtracked, and the number in parentheses is the shortest distance from point F. The
process is as follows:
Step 1: U=[F(0)];
V=[D(5),E(4),C(∞),B(∞),A(∞)];
Step 2: U=[F(0), ,E(4)];
V=[D(5),C(13),B(11),A(∞)];
Step 3: U=[F(0) ,E(4) ,D(5)];
V=[ C(12),B(11),A(∞)];
Step 4: U=[F(0) ,E(4) ,D(5) ,B(11)];
V=[ C(12),A(17)];

8
Step 5: U=[ F(0) ,E(4) ,D(5) ,B(11) , C(12)];
V=[ A(16)];
Step 6: U=[ F(0) ,E(4) ,D(5) ,B(11) , C(12), A(16)];
V=Ø;
As shown above, in step two, the shortest distance between point C and point F
is 13, and the path at this moment is C, E, F; after an iteration, point D is added to the
U array as the shortest path point. The shortest distance between point C and point F
is 12, and the path at this time is C, D, F. After continuous iteration, the shortest path
between any two points can be obtained.
2.2 Random barriers
SiC / AL composite material is made of aluminum alloy as the metal matrix, and
SiC particles are evenly distributed in the metal matrix as a reinforcement. SiC
particles are randomly distributed within a certain range on a microscopic scale, and
their shapes are mostly random convex quadrilaterals. According to the above
characteristics, a model for simulating the distribution of random SiC particles is
established.
The crack propagation path in the composite material will deflect when it
expands to the position of the reinforcing base, which is different from metal
materials, and the crack propagation path will be Lengthen. It is easy to find the
propagation path of cracks in composites, the law of crack propagation is similar to
robot path planning. The crack bypasses the reinforcement from the beginning to the
end, and the crack cracking rule is obtained by simulating the crack propagation path,
and the relationship between the crack and the fatigue life is obtained.
By establishing the position of the random reinforcement base, the reinforcement
base is an irregular quadrangle and is randomly distributed in the metal matrix. In the
program, by using the square interval where each quadrilateral is located as a cell, if
four random points are taken in a cell to represent the endpoints of the polygon, the
random quadrilateral formed may have a "concave polygon". However, in actual
engineering, the "concave polygon" structure is prone to stress concentration at the

9
shortest diagonal, and the reinforcing base particles often exist in the shape of
"convex polygon". In the modeling process of this paper, the strengthening basis is
treated as a random quadrilateral, and the four endpoints fall into four square
sub-regions that bisect the cell. Each sub-region is a grid, and points are randomly
taken in each grid to form a random quadrilateral representing the position and shape
of the reinforcing base. In composite materials, the reinforcing matrix is uniformly
distributed in the metal matrix on a macroscopic scale, but on microscopic
observations, the spacing between particles is randomly distributed within a certain
order of magnitude. During the modeling process, a random number is added to the
cell distance. The size of the random number determines the average distance between
the reinforcing bases, and it can also reflect the volume fraction of the reinforcing
bases in the composite. The coordinates of each endpoint of the random quadrilateral
need to be stored in matrix A for subsequent calculations. The mechanical properties
of particle-reinforced composites are affected by factors such as the volume fraction
of the reinforcing matrix and the particle size of the reinforcing matrix, so the
simulation results should be considered to match the actual material during the
simulation.
Fig .2 Random distribution of reinforcing base in matrix
It is observed from Fig. 2 that there is very little contact or even superposition
between the reinforcing groups, and we can consider it as the phenomenon of
reinforcing group polymerization in the timing material. Its endpoint coordinates are
shown in table 1.

10
Table 1 Obstacle Endpoint Matrix
Column 1 Column 2 Column 3 Column 4 Column 5 Column 6
Point 1 2.87 2.92 3.53 1.89 4.81 2.78 7.05 1.73 7.78 2.09 9.75 1.99
Point 2 2.02 2.92 2.90 2.11 4.26 2.69 6.65 1.68 7.64 1.97 9.24 1.69
Point 3 2.27 2.01 3.10 1.74 4.67 2.23 6.62 1.17 7.70 1.82 9.48 1.20
Point 4 2.60 2.24 3.42 1.33 4.80 2.00 6.96 1.39 7.98 1.75 10.13 1.56
Point 5 2.37 4.45 4.04 3.60 5.27 3.60 7.28 4.18 8.35 4.26 9.41 3.39
Point 6 2.27 4.20 3.52 3.60 4.64 3.28 6.56 4.01 7.63 4.10 9.07 3.46
Point 7 2.19 3.53 3.58 3.15 4.62 2.71 6.54 3.45 7.61 3.80 8.98 2.86
Point 8 2.50 3.92 3.71 3.10 5.49 2.94 7.07 3.55 8.21 3.69 9.30 3.05
Point 9 2.48 4.69 3.56 5.48 5.11 5.05 6.95 5.28 7.66 5.66 9.74 5.32
Point 10 2.08 5.14 3.17 5.34 4.36 5.00 6.53 5.35 7.59 5.62 9.57 5.53
Point 11 2.00 4.55 3.34 4.71 4.39 4.28 6.30 5.06 7.19 4.85 9.19 4.83
Point 12 2.53 4.37 3.76 4.95 4.80 4.30 7.06 4.86 7.80 5.06 9.92 4.84
Point 13 2.80 6.05 3.05 6.36 5.08 6.14 6.33 6.59 8.25 6.53 9.64 6.56
Point 14 2.09 6.06 2.78 6.73 4.82 6.58 5.96 6.55 7.95 6.59 9.00 6.83
Point 15 2.00 5.95 2.98 5.90 4.62 5.86 6.15 6.03 8.06 6.15 9.07 5.89
Point 16 2.80 5.69 3.30 6.07 5.04 6.06 6.34 6.02 8.64 5.87 9.68 5.94
Point 17 2.43 8.45 3.77 8.65 5.47 7.76 6.41 8.37 8.32 8.45 9.89 8.94
Point 18 2.09 8.65 3.35 8.51 4.70 7.76 5.97 8.00 8.06 8.32 8.94 8.85
Point 19 1.80 8.00 3.27 8.05 4.62 7.13 6.21 7.90 8.26 7.88 9.05 8.19
Point 20 2.43 8.08 3.82 8.08 5.55 7.54 6.48 7.46 8.61 8.01 9.69 8.45
Point 21 2.22 9.56 3.30 9.49 5.27 9.63 6.72 9.64 8.09 9.59 10.15 9.52
Point 22 1.91 9.31 2.69 9.90 5.06 9.46 6.23 9.86 7.94 9.49 9.83 9.44
Point 23 1.65 8.97 2.65 9.36 4.67 9.04 6.04 9.07 7.75 9.06 9.85 9.00
Point 24 2.57 8.89 3.35 9.44 5.47 9.32 6.57 9.17 8.49 9.33 10.09 8.74
2.3 Propagation path model
After the strengthening basis is determined, the midpoint of the line connecting
the two adjacent quadrilateral endpoints is taken as the passable point based on the
position information of the random quadrilaterals. The line connecting these passable
points is all possible paths for crack growth. The coordinates of the passable points
can be calculated from the data in matrix A, and the coordinates of each passable
point are stored in matrix B.
After determining the starting point and ending point of the crack, the shortest
crack is selected by using the Dijkstra algorithm. Considering the ideal situation of the
modeling, the stress intensity factors at the crack tip are not enough to break through
the reinforcing base, so the path between the passing points must bypass the
quadrilateral region. If the line connecting the passable points is called possible path,

11
that is, the possible path does not intersect any random quadrilateral edge. The rapid
exclusion test and straddle experiment can be used to select the connecting lines. The
principle is as follows:
Take a passable path and one side of the quadrilateral as an example, the line
segment P1P2 is a passable path, and Q1Q2 is an edge of a quadrilateral. Suppose a
rectangle with P1P2 as the diagonal, Q1Q2 is a rectangle made diagonally. When two
rectangles do not intersect, the two line segments will not intersect. If the two
rectangles do not intersect, they will not pass the fast rejection experiment. If they fail
to pass the fast rejection experiment, the two line segments will inevitably disjoin. If
rapid rejection experiment is passed, a straddle experiment is performed.
The principle of straddle experiment is that if a line segment P1P2 intersects
with a line segment Q1Q2, then P1P2 is distributed at both ends of Q1Q2.
To summarize, the following condition should be satisfied:
012121211 QPQQQQQP
(2)
where "×" is the symbol of vector products, and "*" is the symbol of quantity products.
The logical relationship is as follows:

12
Fig .3 Diagram of intersection determination
The connection relationship between the passable points is stored in the matrix C,
which can be expressed as 1 and the unconnected is recorded as 0 for subsequent
program calls, the connected matrix partial value are shown in table 2. The Dijkstra
algorithm will traverse all the paths between the set start and end points and find the
shortest path through backtracking. The program result is shown in the figure 4.
Table 2 Connected matrix partial value
1 2 3 4 5 6 7 8 9 10 11 12 13
1 0 0 1 0 1 1 0 0 0 0 0 0 0
2 0 0 1 0 1 1 0 0 0 0 0 0 0
3 1 1 0 0 1 1 1 1 0 0 0 0 0
4 0 0 0 0 0 0 0 0 0 0 0 0 0
5 1 1 1 0 0 1 1 1 1 0 0 0 0
6 1 1 1 0 1 0 1 1 1 0 0 0 0
7 0 0 1 0 1 1 0 1 1 0 0 0 0
8 0 0 1 0 1 1 1 0 1 0 0 0 0
9 0 0 0 0 1 1 1 1 0 0 0 0 0
10 0 0 0 0 0 0 0 0 0 0 1 1 1
11 0 0 0 0 0 0 0 0 0 1 0 0 1
12 0 0 0 0 0 0 0 0 0 1 0 0 1
13 0 0 0 0 0 0 0 0 0 1 1 1 0
Fig .4 Shortest path of crack propagation in composites
As the Fig .4 shows that because of the crack needs to “bypass” the reinforcing

13
base, the crack will deflect without changing the overall direction, resulting in an
increase in the total length of the crack, and this increase corresponds to the fatigue
life of the composite material and the same metal. The path planning model can select
the shortest path to avoid obstacles.
3 Fatigue life model
3.1 Residual stress model
The preparation temperature of the SiC / AL composite material is between 680
and 780 degrees, and the material is cooled to normal temperature after the
preparation is completed. It will cause the material volume to change. Since the
composite material is made of a mixture of metal and non-metal, the two materials
have different expansion coefficients based on temperature, and residual stress will be
generated during the cooling process. As shown in Figure 5, during the working
process of the test piece, the residual stress will inevitably affect the stress ratio of the
test piece.
Fig. 5 The change of stress ratio related to residual stress
The residual stress calculation equation is as follows [32]:
im
im
αKK
KKtασ
ΔΔ
(3)
Among them, αΔ is the difference between the expansion coefficients of the two
materials, tΔ is the difference between the preparation temperature and loading
temperature, which fluctuates around 650. K is the elastic modulus, the subscripts m

14
and i are the matrix and the reinforcement, respectively.
The existence of residual stress will affect the stress ratio of the load on the test
piece. The stress ratio after considering the residual stress can be shown as follows:
α
α
σσσσ
R
max
min
(4)
3.2 Initial crack model
The initial size of crack initiation should be determined first which is related to
crack initiation life calculation. The equation for calculating crack initiation life and
size can be described as [33]:
2
1
11
21
2
2
1
112
1
1
1
2
1
12
2
ΔΔ1
4
1
2
ΔΔ1
4
1
ΔΔ2
1
2
nff
f
cnegv
n
ff
nn
f
f
cegv
n
n
f
f
cn
egv
f
i
εσEεεσ
εσE
εEKεεσ
εEK
εε
EK
σε
N
n
(5)
where the fracture fatigue strength fσ and the fracture fatigue strain fε are related
to the reduction of area ψ , egvσΔ is equivalent stress, cεΔ is the threshold of strain
range, they can be calculate as follows respectively:
σKR
σ tegv Δ12
1Δ
(6)
5.3
1
10
2Δ f
c
εE
τε
(7)
ψε f 1In
(8)
bf δψ
σ
1
1In1
(9)

15
among the equation 6, tK is the stress concentration factor, taking 1tK in this
paper.
The initial crack size can be given by:
πσK
a bIC
2
0
(10)
where
nπEK IC 032.0
(11)
3.3 Crack growth model
According to fracture mechanics theory, when a component is subjected to cyclic
loading, fatigue cracks propagate until fatigue failure occurs in the component. The
relationship between crack length and crack propagation life can be constructed
according to the Paris formula [34]:
mf
KCN
a Δd
d
(12)
where a is the crack length, n is the number of stress cycles, C and m are
material coefficients.
minmaxminmaxΔ δδaπFKKK
(13)
In order to make the crack propagation life prediction more accurate, the
researchers made other improvements to the Paris formula, such as considering the
stress ratio [35]:
KKr
ΔΚC
N
a
c
m
f Δ1d
d
(14)
Integrating from the formula gives:
ca
a m
cf
aπσFC
aKKrN
0 ΔdΔ1
(15)
It can be rewritten as:
16
2
3
02
3
1
21
0
21
3Δ2
21Δ
1
mm
cm
mmc
m
cf
aamπσFC
aamπσFC
KrN
(16)
where ca is the crack length when the material breaks,
21
σF
K
πa IC
c , ICK is the
fracture toughness, nπEK IC 032.0 , n is the hardening coefficient, F is the
shape factor.
The total life of the material is the sum of the initiation life and the extended life:
fi NNN
(17)
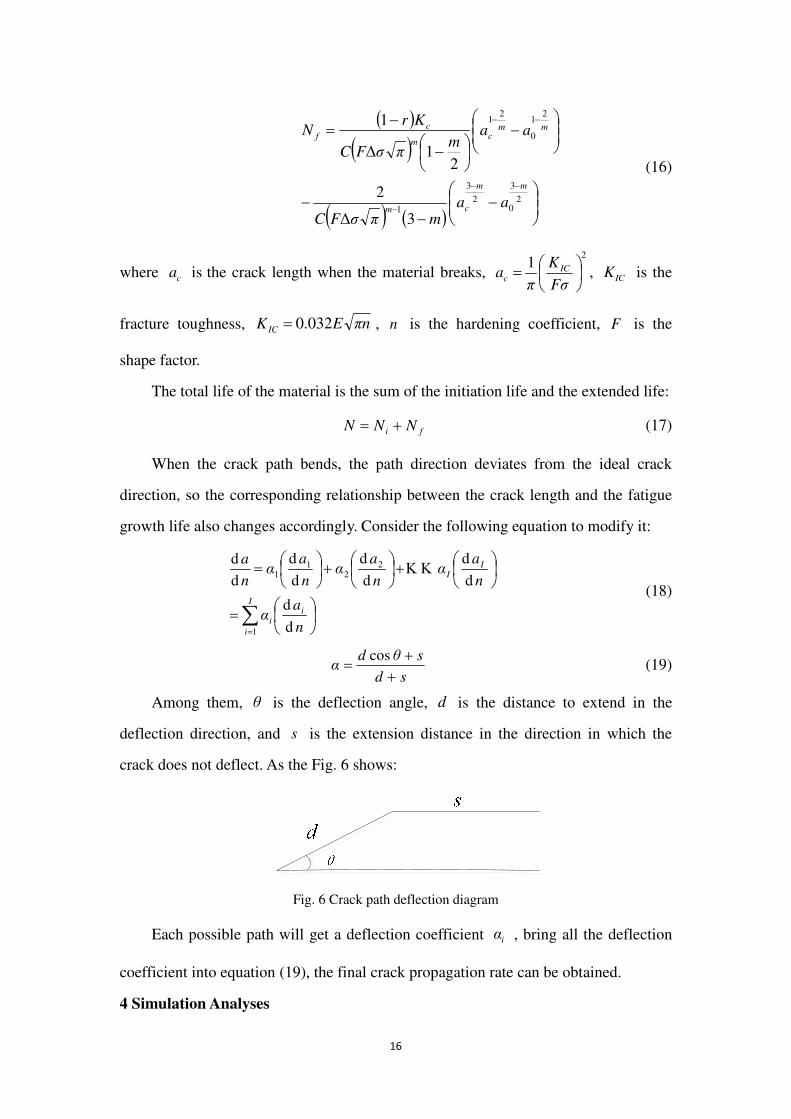
When the crack path bends, the path direction deviates from the ideal crack
direction, so the corresponding relationship between the crack length and the fatigue
growth life also changes accordingly. Consider the following equation to modify it:
I
i
ii
II
n
aα
n
aαn
aαn
aαn
a
1
22
11
d
d
d
d
d
d
d
d
d
d
(18)
sd
sθdα
cos
(19)
Among them, θ is the deflection angle, d is the distance to extend in the
deflection direction, and s is the extension distance in the direction in which the
crack does not deflect. As the Fig. 6 shows:
Fig. 6 Crack path deflection diagram
Each possible path will get a deflection coefficient iα , bring all the deflection
coefficient into equation (19), the final crack propagation rate can be obtained.
4 Simulation Analyses

17
This paper proposes a life prediction model for metal matrix particle reinforced
composites. In order to verify the accuracy of the model, the test data in the literature
[36] is used for verification.
Table 3 Composition of the Aluminum alloy (mass: %)
Material Si Mg Cu Mg Mn Al
Al alloy 20 0.3 0.116 0.3 0.116 remain
Table 4 Material properties of SiC/AL
Material E (GPa) MPabδ MPa2.0δ ψ (%) P (C-1)
Al-20Si 89.1 361 309 10 24.2
SiC 450 - - - 3.4
In the reference [36], by preparing a new type of aluminum alloy, and using this
aluminum alloy as a matrix which reinforced by SiC particles, a SiC / AL composite
material was prepared. Table 2 shows the basic properties of the metal matrix.
Material parameters C and m are equal to 4108.7 and 0.09 respectively.
Fig. 7 Comparison of experience data and fitting curve in AL alloy
The S-N curve of AL-20Si metal is fitted by equation 18 as shown in the figure 7.
18
Material parameters C is equal to5108.7 . It can be seen that most of the test value
is close to the fitted curve. When the load is 140 MPa, there are some error between
the test result and curve. Excluding experimental error factors, the possible cause is
that the load does not reach the fatigue expansion threshold, resulting in the actual life
being longer than the estimated life.
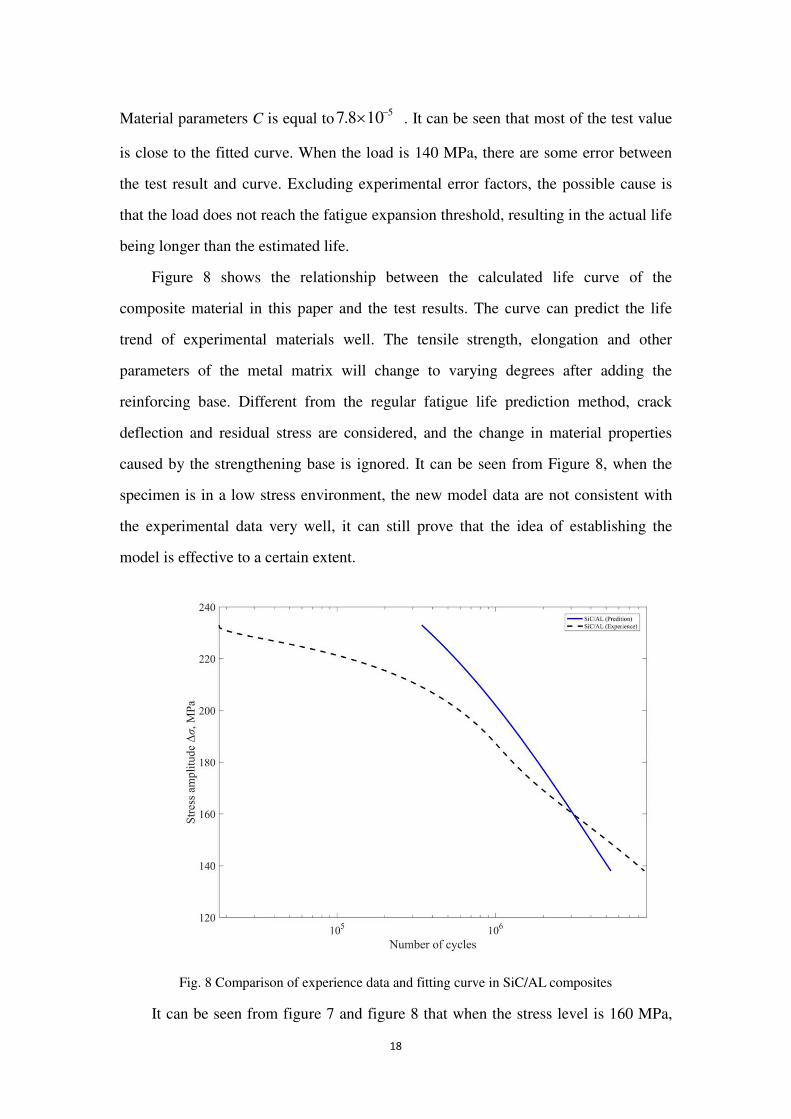
Figure 8 shows the relationship between the calculated life curve of the
composite material in this paper and the test results. The curve can predict the life
trend of experimental materials well. The tensile strength, elongation and other
parameters of the metal matrix will change to varying degrees after adding the
reinforcing base. Different from the regular fatigue life prediction method, crack
deflection and residual stress are considered, and the change in material properties
caused by the strengthening base is ignored. It can be seen from Figure 8, when the
specimen is in a low stress environment, the new model data are not consistent with
the experimental data very well, it can still prove that the idea of establishing the
model is effective to a certain extent.
Fig. 8 Comparison of experience data and fitting curve in SiC/AL composites
It can be seen from figure 7 and figure 8 that when the stress level is 160 MPa,

19
the error between the predicted data and the test data is the smallest. When the stress
level is higher than 160MPa, the estimated life is higher than the test life, and the
error increases with the increase of stress. Under high stress levels, cracks will more
easily penetrate the reinforced base without deflection, and this process cannot be
reflected by the life prediction model, so the test data will be larger than the test data.
When the stress level is lower than 160MPa, the predicted data is smaller than the test
data. The presence of the reinforcement hinders the slip of the metal crystals, thereby
greatly increasing the fatigue initiation life under small loads.
5 Conclusions
Fatigue propagation characteristic of composite materials is studied in this paper,
and a new model of the crack propagation path of composite materials is established
according to the path planning algorithm. The differences between crack propagation
length of composite materials and metal materials are estimated. The modified Paris
model is used to estimate the fatigue life, and some conclusions are drawn as follows.
(1) The crack trajectory simulated by the path planning model is closer to the
microscopic crack trajectory, and the fatigue life is more accurately calculated using
the estimated crack length. During regular fatigue failure of composite materials, the
crack path will expand around the reinforcement base. The Dijkstra algorithm can
effectively avoid the simulation of cracks passing through the strengthening base, and
the local path optimization of the Dijkstra algorithm can simulate the characteristics
of crack "steps". This model can be extended to other similarly-structured composite
materials to estimate crack growth length.
(2) Considering the residual stress cause by temperature changing, the fatigue
crack propagation model is improved. The residual thermal stress in the material is
fully considered in the improved fatigue crack growth model.
(3) Based on the propagation of microscopic cracks, a new idea for the life
prediction of composite materials is presented. Combined with the crack length
estimated by the path planning model, the fatigue crack propagation life is calculated.
The experimental data show that although the new model still has some defects, it still
has potential research value.

20
Acknowledgment
This work is supported by the National Natural Science Foundation of China
(51675324).
Conflict of Interest
The authors declare that they have no conflict of interest.
Data Availability Statement
Data sharing is not applicable to this article as no new data were created or
analyzed in this study.
Author contributions
Conceptualization and methodology were performed by Liu Xintian and Shang
Wenqian, data curation was performed by Shang Wenqian, supervision was performed
by Liu Xintian and Wang Xiaolan, reviewing and editing were performed by Wang
Xu. The first draft of the manuscript was written by Shang Wenqian and all authors
commented on previous versions of the manuscript. All authors read and approved the
final manuscript.

21
Reference
[1] Altinkok N. Application of the full factorial design to modelling of Al2O3/SiC
particle reinforced al-matrix composites. Steel and Composite Structures, 2016,
21(6):1327-1345.
[2] Nejad RM, Tohidi M, Darbandi AJ , Saber A , Shariati M. Experimental and
numerical investigation of fatigue crack growth behavior and optimizing fatigue life
of riveted joints in Al-alloy 2024 plates. Theoretical and Applied Fracture Mechanics,
2020, 108: 102669.
[3] Zhu SP, Huang HZ, Peng W, Wang HK, Mahadevan S. Probabilistic Physics of
Failure-based framework for fatigue life prediction of aircraft gas turbine discs under
uncertainty. Reliability Engineering & System Safety, 2016, 146: 1-12.
[4] Qian GA, Niffenegger M, Sharabi M, Lafferty N. Effect of non-uniform reactor
cooling on fracture and constraint of a reactor pressure vessel. Fatigue & Fracture of
Engineering Materials & Structures, 2018, 41(7): 1559-1575.
[5] Yu JW, Zheng SL, Pham H, Chen T. Reliability modeling of multi-state degraded
repairable systems and its applications to automotive systems. Quality and Reliability
Engineering International, 2018, 34(3):459-474.
[6] Wang ML, Liu XT, Wang XL, Wang YS. Probabilistic modeling of unified S-N
curves for mechanical parts. International Journal of Damage Mechanics,
2018, 27(7):979-999.
[7] Zhu MY, Liu XT, Kan FC, You ZY. Life cycle prediction and evaluation of clutch
friction plate considering wear models and thermal stress. Journal of
Tribology-Transactions of The ASME, online.
[8] Wu Q, Liu XT, Liang ZQ, Wang YS, Wang XL. Fatigue life prediction model of
metallic materials considering crack propagation and closure effect. Journal of the
Brazilian Society of Mechanical Sciences and Engineering, 2020, 42:424.
[9] Liu XT, Zhang MH, Wang HJ, Luo J, Tong JC, Wang XL. Fatigue Life Analysis of
Automotive Key Parts Based on Improved Peak-Over-Threshold Method. Fatigue &
Fracture of Engineering Materials & Structures, 2020, 43(8):1824-1836.
[10] Gao J, An Z, Liu B. A new method for obtaining P-S-N curves under the

22
condition of small sample. Journal of Risk & Reliability, 2017, 231(2):130-137.
[11] Rosa DF , Davide P , Livia S. Correlation between Thermal Behaviour of
AA5754-H111 during Fatigue Loading and Fatigue Strength at Fixed Number of
Cycles. Materials, 2018, 11:719.
Zhu ML, Xuan FZ. Fatigue Crack Initiation Potential from Defects in terms of Local
Stress Analysis. Chinese Journal of Mechanical Engineering, 2014, 27(3):496.
[12] Khan R, Alderliesten R, Badshah S. Effect of stress ratio or mean stress on
fatigue delamination growth in composites: Critical review. Composite Structures,
2015, 124:214-227.
[13] De Krijger J, Rans C, Van Hooreweder B. Effects of applied stress ratio on the
fatigue behavior of additively manufactured porous biomaterials under compressive
loading. Journal of the Mechanical Behavior of Biomedical Materials, 2017, 70:7-16.
[14] Liu HC, Liu HJ, Zhu CC, Sun ZD, Bai HY. Study on contact fatigue of a wind
turbine gear pair considering surface roughness. Friction, 2020, 8(3):553-567.
[15] Wang ML, Liu XT, Wang XL, Wang YS. Fatigue test analysis of automotive key
parts based on censored data and small sample setting. Quality and Reliability
Engineering International, 2017, 33(5):1031-1043.
[16] Cao DF, Duan QF, Li SX, Zhong YC, Hu HX. Effects of thermal residual stresses
and thermal-induced geometrically necessary dislocations on size-dependent
strengthening of particle-reinforced MMCs. Composite Structures, 2018,
200:290-297.
[17] Liu XT, Kan FC, Xin XF, Huang H, Wang ZQ. Fatigue life prediction of clutch
sleeve based on abrasion mathematical model in service period. Fatigue & Fracture
of Engineering Materials and Structures, 2020, 43(3):488-501.
[18] Zhang MH, Liu XT, Wang YS, Wang XL. Parameters Distribution Characteristics
of Material Fatigue Life Based on Improved Bootstrap Method. International Journal
of Damage Mechanics, 2019, 28(5): 772-793.
[19] You ZY, Liu XT, Wang X, Wang YS, Wang XL. Numerical method for fatigue
life of aircraft lugs under thermal stress. Journal of Aircraft, 2020, 57(4):597-602.
[20] You ZY, Fang Y, Liu XT, Chen T, Li WJ, Wang YS. Numerical method for

23
fatigue life of plane bolted joints under thermal load. Proceedings of the IMechE, Part
G: Journal of Aerospace Engineering, online.
[21] Zhu SP, Liu Q, Zhou J, Yu ZY, Fatigue reliability assessment of turbine discs
under multi-source uncertainties. Fatigue & Fracture of Engineering Materials &
Structures, 2018, 41(6): 1291-1305.
[22] Correia José A.F.O, De Jesus AMP, Ribeiro AS. Strain-based approach for
fatigue crack propagation simulation of the 6061-T651 aluminium alloy. International
Journal of Materials and Structural Integrity, 2017, 11(1-3):1.
[23] Josyula SK, Narala SKR. Study of TiC particle distribution in Al-MMCs using
finite element modeling. International Journal of Mechanical Sciences, 2018, 141,
341-358.
[24] Ananth C.R.; Chandra N. Elevated temperature interfacial behaviour of MMCs: a
computational study. Composites Part A Applied Science and Manufacturing, 1996,
27(9):805-811.
[25] Li W, Liang H, Chen J, Zhu SQ, Chen YL. Effect of SiC Particles on Fatigue
Crack Growth Behavior of SiC Particulate-reinforced Al-Si Alloy Composites
Produced by Spray Forming. Procedia Materials Science, 2014, 3:1694-1699.
[26] Ding HZ, Biermann H, Hartmann O. A low cycle fatigue model of a short-fibre
reinforced 6061 aluminium alloy metal matrix composite. Composites Science and
Technology, 2002, 62(16):2189-2199.
[27] Costanza G, Montanari R, Quadrini F, Sili A. Influence of Ti coatings on the
fatigue behaviour of Al–matrix MMCs. Part I: fatigue tests and materials
characterization. Composites Part B: Engineering, 2005, 36(5): 439-445.
[28] Friedrich K, Fels A, Hornbogen E. Fatigue and fracture of metallic glass
ribbon/epoxy matrix composites. Composites Science and Technology,
1985, 23(2):79-96.
[29] Lee SH, Choi YG, Kim ST. Initiation and Growth Behavior of Small Surface
Fatigue Cracks on SiC Particle-Reinforced Aluminum Composites. Advanced
Composite Materials, 2010, 19(4):317-330.
[30] Ma JY, Wang SB, Meng C, Ge YH, Du JT. Hybrid energy-efficient APTEEN

24
protocol based on ant colony algorithm in wireless sensor network. Eurasip Journal
on Wireless Communications and Networking, 2018, 102.
[31] Feng YX, Zhou MC, Tian GD, Li ZW, Zhang ZF, Zhang Q, Tan JR. Target
Disassembly Sequencing and Scheme Evaluation for CNC Machine Tools Using
Improved Multiobjective Ant Colony Algorithm and Fuzzy Integral. IEEE
Transactions on Systems, Man Cybernetics-Systems, 2018, 49(12): 2438-2451.
[32] Li GR, Wang HM, Zhao YT, Chen G, Dai QX, Chen XN. High-temperature
thermal expansion properties of Al2O3, Al3Zr particulate rein-forced Al-12%Si in situ
matrix composites. Chinese Journal of Engineering, 2009, 31(5):591-596.
[33] Wang Haijie, Liu Xintian, Wang Xiaolan, Wang Yansong. Numerical Method for
Estimating Fatigue Crack Initiation Size Using Elastic-plastic Fracture Mechanics
Method. Applied Mathematical Modelling, 2019, 73: 365-377.
[34] Paris P, Erdogan F. A critical analysis of crack propagation laws. Journal of Basic
Engineering, 1963, 85:528-534.
[35] Forman RG, Kearney VE, Engle RM. Numerical Analysis of Crack Propagation
in Cyclic Loaded Structures. Journal of Basic Engineering, 1967, 89:459-464.
[36] Li CH, Chen ZH, Chen D, Li Wei. Research on High-cycle Fatigue Behavior of
Spray Deposited SiCp/Al-20Si Composite. Journal of Mechanical Engineering, 2012,
48(10), 40-44.

Figures
Figure 1
Schematic diagram of local shortest path

Figure 2
Random distribution of reinforcing base in matrix
Figure 3
Diagram of intersection determination

Figure 4
Shortest path of crack propagation in composites

Figure 5
The change of stress ratio related to residual stress
Figure 6
Crack path de�ection diagram

Figure 7
Comparison of experience data and �tting curve in AL alloy

Figure 8
Comparison of experience data and �tting curve in SiC/AL composites