PATENT PENDING 2020 Annual Report - Sealed Air
149
2020 Annual Report We are in business to protect, to solve critical packaging challenges, and to make our world better than we found it.
Transcript of PATENT PENDING 2020 Annual Report - Sealed Air

PATENT PENDING
2020 Annual Report
We are in business to protect, to solve critical packaging challenges, and to make our world better than we found it.

Dear Fellow Stockholders: Our purpose has been guiding our way through the challenges 2020 presented for all of us:
We are in business to protect, to solve critical packaging challenges, and to make our world better than we found it.
Our performance in 2020 reflects the strong execution of our Reinvent SEE business transformation. We are building a powerful One SEE Operating Model to drive world-class performance to achieve our purpose and create significant long-term value for our stakeholders and the communities where we live and work. The COVID-19 pandemic tested our SEE Operating Model. Through it all, we focused on a Zero Harm mentality to protect our people, customers, and communities. We were able to provide our critical packaging solutions for essentials such as food, eCommerce, pharmaceuticals, medical equipment, and in addition, the safe and secure distribution of COVID-19 face coverings, test kits, and vaccines. In 2020, we delivered strong growth in sales, earnings, EPS, free cash flow, and a strong balance sheet.
Net Sales Adj EBITDA* Adj EPS* Free Cash Flow*
$4.9B $1.05B $3.19 $556M
+2%
+9% 21.4% margin
+13% +73%
Our iconic brands, innovative solutions portfolio, global scale, and SEE operational excellence culture are creating strong economic value. We are well on our way to driving more growth with new opportunities in automation, digital, and sustainability. I’m proud of our people, we are making our world better than we found it. Sincerely,
Edward (Ted) L. Doheny II President and CEO Certain information set forth in this letter contains “forward-looking statements,” which are subject to risks and uncertainties, many of which are outside our control and could cause actual results to differ materially from these statements.
* Please see Sealed Air’s Annual Report on Form 10-K filed on February 25, 2021 for important information about the use of non-U.S. GAAP financial measures relevant to this letter, including applicable reconciliations to U.S. GAAP financial measures.

UNITED STATESSECURITIES AND EXCHANGE COMMISSION
Washington, D.C. 20549Form 10-K
(Mark One)
☒ ANNUAL REPORT PURSUANT TO SECTION 13 OR 15(d) OF THE SECURITIES EXCHANGE ACT OF 1934
For the fiscal year ended December 31, 2020 Or
☐ TRANSITION REPORT PURSUANT TO SECTION 13 OR 15(d) OF THE SECURITIES EXCHANGE ACT OF 1934For the transition period from to
Commission file number 1-12139
SEALED AIR CORPORATION(Exact name of registrant as specified in its charter)
Delaware 65-0654331(State or other jurisdiction of
incorporation or organization) (I.R.S. Employer
Identification Number)2415 Cascade Pointe Boulevard
Charlotte North Carolina 28208(Address of principal executive offices) (Zip Code)
Registrant’s telephone number, including area code: (980)-221-3235 Securities registered pursuant to Section 12(b) of the Act:
Title of Each Class Trading Symbol(s) Name of Each Exchange on Which RegisteredCommon Stock, par value $0.10 per share SEE New York Stock Exchange
Securities registered pursuant to Section 12(g) of the Act:None
Indicate by check mark if the registrant is a well-known seasoned issuer, as defined in Rule 405 of the Securities Act. Yes ☒ No ☐Indicate by check mark if the registrant is not required to file reports pursuant to Section 13 or Section 15(d) of the Exchange Act. Yes ☐ No ☒Indicate by check mark whether the registrant (1) has filed all reports required to be filed by Section 13 or 15(d) of the Securities Exchange Act of 1934 during the
preceding 12 months (or for such shorter period that the registrant was required to file such reports), and (2) has been subject to such filing requirements for the past 90 days. Yes ☒ No ☐
Indicate by check mark whether the registrant has submitted electronically every Interactive Data File required to be submitted pursuant to Rule 405 of Regulation S-T (§ 232.405 of this chapter) during the preceding 12 months (or for such shorter period that the registrant was required to submit such files). Yes ☒ No ☐
Indicate by check mark whether the registrant is a large accelerated filer, an accelerated filer, a non-accelerated filer, a smaller reporting company, or an emerging growth company. See definitions of “large accelerated filer,” “accelerated filer,” “smaller reporting company,” and “emerging growth company” in Rule 12b-2 of the Exchange Act. (Check one):Large Accelerated Filer ☒
Accelerated filer ☐ Emerging growth company ☐
Non-accelerated filer ☐
Smaller reporting company ☐
If an emerging growth company, indicate by check mark if the registrant has elected not to use the extended transition period for complying with any new or revised financial accounting standards provided pursuant to Section 13(a) of the Exchange Act. ☐
Indicate by check mark whether the registrant has filed a report on and attestation to its management’s assessment of the effectiveness of its internal control over financial reporting under Section 404(b) of the Sarbanes-Oxley Act (15 U.S.C.7262(b)) by the registered public accounting firm that prepared or issued its audit report. ☒
Indicate by check mark whether the registrant is a shell company (as defined in Rule 12b-2 of the Exchange Act). Yes ☐ No ☒As of the last business day of the registrant’s most recently completed second fiscal quarter, June 30, 2020, the aggregate market value of the registrant’s common
stock held by non-affiliates of the registrant was approximately $5,090,724,127, based on the closing sale price as reported on the New York Stock Exchange.There were 154,919,232 shares of the registrant’s common stock, par value $0.10 per share, issued and outstanding as of February 16, 2021.
DOCUMENTS INCORPORATED BY REFERENCE:Portions of the registrant’s definitive proxy statement for its 2021 Annual Meeting of Stockholders, to be held on May 18, 2021, are incorporated by reference into
Part III of this Form 10-K.

SEALED AIR CORPORATION AND SUBSIDIARIES
Table of Contents
PART IItem 1. Business 3 Item 1A. Risk Factors 11 Item 1B. Unresolved Staff Comments 22 Item 2. Properties 23 Item 3. Legal Proceedings 24 Item 4. Mine Safety Disclosures 25 Information About Our Executive Officers 26
PART II Item 5.
Market for Registrant’s Common Equity, Related Stockholder Matters and Issuer Purchases of Equity Securities 28
Item 6. Selected Financial Data 31 Item 7. Management’s Discussion and Analysis of Financial Condition and Results of Operations 32 Item 7A. Quantitative and Qualitative Disclosures About Market Risk 62 Item 8. Financial Statements and Supplementary Data 65 Item 9. Changes in and Disagreements with Accountants on Accounting and Financial Disclosure 137 Item 9A. Controls and Procedures 137 Item 9B. Other Information 137
PART III Item 10. Directors, Executive Officers and Corporate Governance 138 Item 11. Executive Compensation 138 Item 12. Security Ownership of Certain Beneficial Owners and Management and Related Stockholder Matters 138 Item 13. Certain Relationships and Related Transactions, and Director Independence 138 Item 14. Principal Accounting Fees and Services 138
PART IV Item 15. Exhibits and Financial Statement Schedules 139 Item 16. Form 10-K Summary 145
Signatures
1

Cautionary Notice Regarding Forward-Looking Statements
This report contains “forward-looking statements” within the meaning of the safe harbor provisions of the Private Securities Litigation Reform Act of 1995 concerning our business, consolidated financial condition, results of operations, or cash flows. The Securities and Exchange Commission (“SEC”) encourages companies to disclose forward-looking statements so that investors can better understand a company’s future prospects and make informed investment decisions. Forward-looking statements are subject to risks and uncertainties, many of which are outside our control, which could cause actual results to differ materially from these statements. Therefore, you should not rely on any of these forward-looking statements. Forward-looking statements can be identified by such words as “anticipate,” “believe,” “plan,” “assume,” “could,” “should,” “estimate,” “expect,” “intend,” “potential,” “seek,” “predict,” “may,” “will” and similar references to future periods. All statements other than statements of historical facts included in this report regarding our strategies, prospects, financial condition, operations, costs, plans and objectives are forward-looking statements. Examples of forward-looking statements include, among others, statements we make regarding expected future operating results, expectations regarding the results of restructuring and other programs, anticipated levels of capital expenditures and expectations of the effect on our financial condition of claims, litigation, environmental costs, contingent liabilities and governmental and regulatory investigations and proceedings.
Please refer to Part I, Item 1A, “Risk Factors” for important factors that we believe could cause actual results to differ materially from those in our forward-looking statements. Any forward-looking statements made by us in this report is based only on information currently available to us and speaks only as of the date on which it is made. We undertake no obligation to publicly update any forward-looking statements, whether written or oral, that may be made from time to time, whether as a result of new information, future developments or otherwise.
The following are important factors that we believe could cause actual results to differ materially from those in our forward-looking statements: global economic and political conditions, currency translation and devaluation effects, changes in raw material pricing and availability, competitive conditions, the success of new product offerings, consumer preferences, the effects of animal and food-related health issues, the effects of epidemics or pandemics, including the Coronavirus Disease 2019 (COVID-19), changes in energy costs, environmental matters, the success of our restructuring activities, the success of our merger, acquisition and equity investment strategies, the success of our financial growth, profitability, cash generation and manufacturing strategies and our cost reduction and productivity efforts, changes in our credit ratings, the tax benefit associated with the Settlement agreement (as defined in Part I, Item 1A, “Risk Factors”), regulatory actions and legal matters, and the other information referenced in Part I, Item 1A, “Risk Factors.” Any forward-looking statement made by us in this report is based only on information currently available to us and speaks only as of the date on which it is made. We undertake no obligation to publicly update any forward-looking statements, whether written or oral, that may be made from time to time, whether as a result of new information, future developments or otherwise.
2

PART I
Item 1. Business
The Company
We are in business to protect, to solve critical packaging challenges, and to make our world better than we found it.
We are a leading global provider of packaging materials, equipment and services. Our portfolio of packaging solutions includes Cryovac® brand food packaging, Sealed Air® brand protective packaging, Autobag® brand automated systems, Bubble Wrap® brand packaging and SEE Automation solutions. Our packaging solutions are sold to an array of end markets including protein, foods, fluids, medical and life sciences, pet care, e-Commerce and logistics, and industrials. Our automated equipment, materials and services maximize food safety and security and product protection while minimizing waste.
Sealed Air Corporation (“Sealed Air” or the “Company”, also referred to as “we”, “us”, or “our”) was incorporated in Delaware in 1960. We conduct substantially all of our business through two wholly-owned subsidiaries, Cryovac, LLC and Sealed Air Corporation (US). We have two reportable segments, Food and Protective. Please refer to Part II, Item 8, “Financial Statements and Supplementary Data” for financial information about the Company and its subsidiaries, which is incorporated herein by reference. Please refer to “Segments”, below for information about the Company's reportable segments. Also, when we cross reference to a “Note,” we are referring to our “Notes to Consolidated Financial Statements,” unless the context indicates otherwise.
In 2020, we generated net sales of $4.9 billion, net earnings from continuing operations of $484 million, and net cash provided by operating activities of $737 million, all of which were higher than prior year results.
Market Strategy and Competitive Strengths
Our vision is to transform Sealed Air to a world-class company servicing the global packaging industry by executing our strategies:
Generate profitable growth;
Drive One SEE operational excellence;
Develop a One SEE high-performance culture; and
Deliver sustainable long-term value to our shareholders and society.
We focus on serving our customers by leveraging our competitive strengths which include differentiated materials, equipment and services; iconic brands; well-established customer relationships; and global scale and market access.
Differentiated Materials, Equipment and Services. For food industries we provide packaging materials, automated equipment, and services that extend shelf life, enhance brand images and drive operational excellence by eliminating waste, increasing processing speeds and reducing customers’ labor requirements. Within e-Commerce and industrial markets, we offer a broad range of protective packaging materials and automation solutions that prevent product damage, increase order fulfillment velocity, and generate savings through reductions in waste, dimensional weight and labor.
In 2020, we launched our SEE Automation Solutions strategy with the goal to provide a differentiated value proposition to our customers via world-class integrated solutions including automated equipment, services and materials. With SEE Automation Solutions, we aim to provide the best solutions, at the right price, while making them sustainable. We seek opportunities to help customers eliminate waste, simplify processes, remove people from harm's way and drive 'touchless' operations.
Iconic Brands. Our portfolio of leading packaging solutions includes Cryovac® brand food packaging, Sealed Air® brand protective packaging, Autobag® brand automated systems, Bubble Wrap® brand packaging, and SEE Automation solutions. We strive to ensure these brands continue to represent our commitment to deliver confidence in our solutions which provide security, safety, performance and innovation.
Well-established Customer Relationships. We have a broad and diversified customer base which includes the world’s leading food processors, e-Commerce and industrial manufacturers. We leverage extensive knowledge of our customers’ business when innovating new solutions, and partner with customers to effectively implement our solutions to improve and automate their operations. Our customer base is diverse, with no single customer or affiliated group of customers representing more than 10% of net sales in 2020, 2019 or 2018.
3
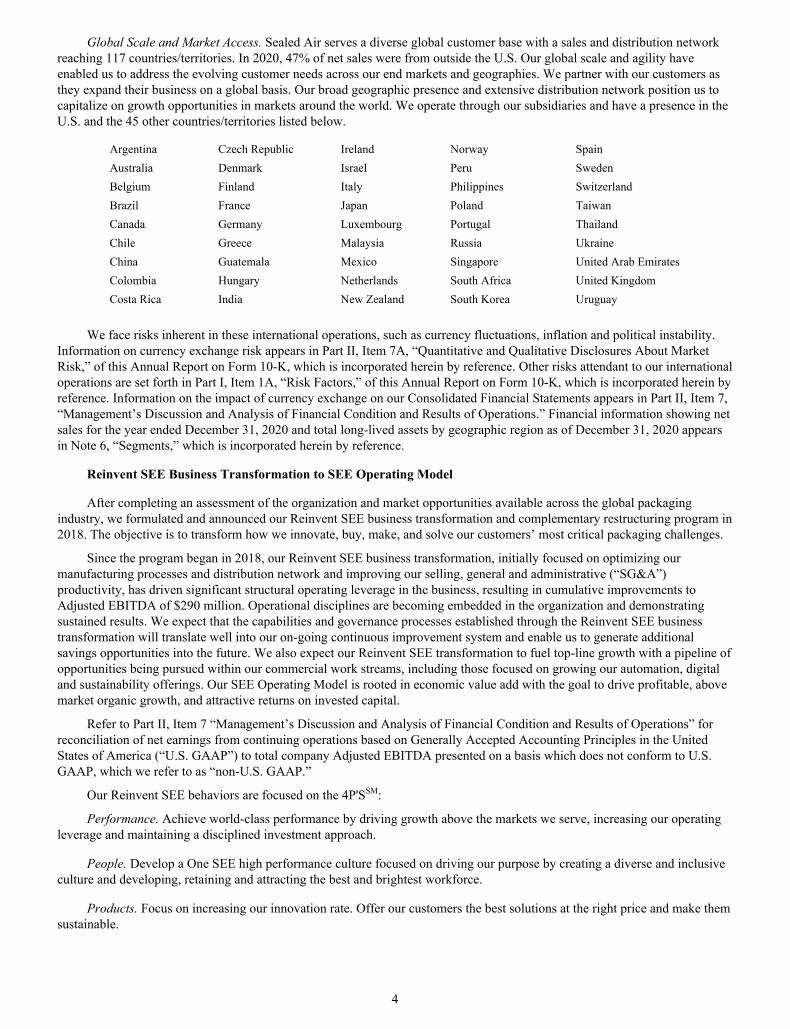
Global Scale and Market Access. Sealed Air serves a diverse global customer base with a sales and distribution network reaching 117 countries/territories. In 2020, 47% of net sales were from outside the U.S. Our global scale and agility have enabled us to address the evolving customer needs across our end markets and geographies. We partner with our customers as they expand their business on a global basis. Our broad geographic presence and extensive distribution network position us to capitalize on growth opportunities in markets around the world. We operate through our subsidiaries and have a presence in the U.S. and the 45 other countries/territories listed below.
Argentina Czech Republic Ireland Norway SpainAustralia Denmark Israel Peru SwedenBelgium Finland Italy Philippines SwitzerlandBrazil France Japan Poland TaiwanCanada Germany Luxembourg Portugal ThailandChile Greece Malaysia Russia UkraineChina Guatemala Mexico Singapore United Arab EmiratesColombia Hungary Netherlands South Africa United KingdomCosta Rica India New Zealand South Korea Uruguay
We face risks inherent in these international operations, such as currency fluctuations, inflation and political instability. Information on currency exchange risk appears in Part II, Item 7A, “Quantitative and Qualitative Disclosures About Market Risk,” of this Annual Report on Form 10-K, which is incorporated herein by reference. Other risks attendant to our international operations are set forth in Part I, Item 1A, “Risk Factors,” of this Annual Report on Form 10-K, which is incorporated herein by reference. Information on the impact of currency exchange on our Consolidated Financial Statements appears in Part II, Item 7, “Management’s Discussion and Analysis of Financial Condition and Results of Operations.” Financial information showing net sales for the year ended December 31, 2020 and total long-lived assets by geographic region as of December 31, 2020 appears in Note 6, “Segments,” which is incorporated herein by reference.
Reinvent SEE Business Transformation to SEE Operating Model
After completing an assessment of the organization and market opportunities available across the global packaging industry, we formulated and announced our Reinvent SEE business transformation and complementary restructuring program in 2018. The objective is to transform how we innovate, buy, make, and solve our customers’ most critical packaging challenges.
Since the program began in 2018, our Reinvent SEE business transformation, initially focused on optimizing our manufacturing processes and distribution network and improving our selling, general and administrative (“SG&A”) productivity, has driven significant structural operating leverage in the business, resulting in cumulative improvements to Adjusted EBITDA of $290 million. Operational disciplines are becoming embedded in the organization and demonstrating sustained results. We expect that the capabilities and governance processes established through the Reinvent SEE business transformation will translate well into our on-going continuous improvement system and enable us to generate additional savings opportunities into the future. We also expect our Reinvent SEE transformation to fuel top-line growth with a pipeline of opportunities being pursued within our commercial work streams, including those focused on growing our automation, digital and sustainability offerings. Our SEE Operating Model is rooted in economic value add with the goal to drive profitable, above market organic growth, and attractive returns on invested capital.
Refer to Part II, Item 7 “Management’s Discussion and Analysis of Financial Condition and Results of Operations” for reconciliation of net earnings from continuing operations based on Generally Accepted Accounting Principles in the United States of America (“U.S. GAAP”) to total company Adjusted EBITDA presented on a basis which does not conform to U.S. GAAP, which we refer to as “non-U.S. GAAP.”
Our Reinvent SEE behaviors are focused on the 4P'SSM:
Performance. Achieve world-class performance by driving growth above the markets we serve, increasing our operating leverage and maintaining a disciplined investment approach.
People. Develop a One SEE high performance culture focused on driving our purpose by creating a diverse and inclusive culture and developing, retaining and attracting the best and brightest workforce.
Products. Focus on increasing our innovation rate. Offer our customers the best solutions at the right price and make them sustainable.
4

Processes. Embed One SEE operational excellence culture into everything we do by eliminating waste, simplifying processes, automating and removing people from harm’s way.
Sustainability. Make our world better than we found it by reducing our resource intensity, diverting waste from landfills and improving employee safety.
Innovation, Research and Development
Our technical capabilities encompass a broad range of disciplines including food science, materials science, chemistry and chemical engineering, electrical and software engineering, microbiology, and packaging equipment design and engineering.
Our research and development activities are principally performed in:• four Packaging Development and Innovation Centers located in the U.S., Italy and Singapore;• seven Equipment Design Centers in the U.S., France, Switzerland, Italy and Singapore, targeting innovation in
equipment and digital solutions; and• 39 Package Design and Applications Centers for Protective around the globe.
Our research and development expense was $96 million in 2020, $77 million in 2019 and $81 million in 2018. In 2020, we brought our Package Design and Application Centers and certain engineering teams under our overall Innovation, Research and Development organization to focus the centers and teams on innovation and product development. This reallocation follows an operational change as well as a shift in organizational reporting and responsibility. As a result, approximately ### in expenses related to the centers and those engineering teams are now included in research and development expenses for 2020. Previously, these costs were primarily considered sales and marketing expenses within selling, general and administrative expenses on the Consolidated Statements of Operations.
In addition to our direct spend, we also, from time to time seek to expand our research and development capabilities through acquisitions and strategic equity or other investments.
In 2018, we made our first investment in disruptive technologies and business models, which we now aggregate into our recently announced SEE Ventures. Under the SEE Ventures initiative, we will make selective entrepreneurial investments that present opportunities to accelerate innovation and increase speed to market, while creating a sustainable competitive advantage. SEE Ventures is part of our capital allocation strategy focused on investing in early stage disruptive technology and new business models for growth.
We own or are the licensee of approximately 2,950 U.S. and foreign patents and patent applications, and approximately 2,360 U.S. and foreign trademark registrations and trademark applications that relate to many of our products, manufacturing processes and equipment. We file annually an average of approximately 270 U.S. and foreign patent applications and approximately 45 U.S. and foreign trademark applications. Our business is not dependent upon any single patent or trademark alone. Rather, we believe that our success depends primarily on our sales and service, marketing, engineering and manufacturing skills and on our ongoing innovation and research and development efforts. We believe that the expiration or unenforceability of any single one of our patents, applications, licenses or trademark registrations would not be material to our business or our consolidated financial condition, results of operations, or cash flows.
Sustainability
At Sealed Air, sustainability is top of mind and part of our growth strategy. We focus on reducing climate-related emissions, water use, energy use and waste in our operations and throughout the supply chain while innovating and manufacturing high performance packaging.
In the market, we are focused on creating packaging that can be recovered and recycled, contributes to consumer waste diversion efforts, reduces greenhouse gases and increases the supply of material for future reuse. We are investing in innovation and development of end-to-end packaging, including materials and automation technologies, and participating in collaborations to create a circular economy for plastic with enhanced recyclability and reusability.
We are working to achieve our 2025 Sustainability and Plastics Pledge aimed to increase plastics circularity in the packaging industry through investing in innovation, reducing plastic waste and collaborating for change.
Investment in Innovation. Dedicating R&D resources to design and advance packaging solutions to be recyclable or reusable and contain more recycled and/or renewable content.
Reduce Plastic Waste. Achieving ambitious targets of recycled content across all packaging solutions which maximize post-consumer recycled content.
5

Collaborate for Change. Aligning with strategic partners to combine resources, expertise and corporate voices to find impactful ways to create a circular economy which includes technology investments to facilitate the reuse, collection and recycling of plastic. To that end, Sealed Air is a member of the Alliance to End Plastic Waste.
Human Capital
Overview
Our people strategy is to develop a One SEE high performance culture focused on driving our purpose. We seek to bring dedicated people with diverse backgrounds, expertise and talent to work at Sealed Air. We strive to manage our business in a way that represents our core values of:
Integrity - Intentionally choosing to do the right thing, every day, no matter the circumstance;
Determined - Empowered to deliver on our commitments;
Collaborative - Operating based on mutual trust and encouraging diverse thinking to achieve common objectives; and
Innovative - Thinking without limits to solve customer, company and societal challenges.
As of December 31, 2020, we had an employee base of approximately 16,500 people. The largest component of Sealed Air's workforce is approximately 10,000 direct manufacturing employees in our manufacturing facilities. We also generally employ:
• marketing, sales, business development and technical packaging employees who work in the field and at our customers' facilities;
• innovation, sustainability and development employees who work in one of our four comprehensive packaging development and innovation centers; and
• customer service and support personnel as well as administrative and management employees who work in our offices and in remote environments.
As of December 31, 2020, we had approximately 7,000 employees in the U.S. and approximately 9,500 employees outside the U.S. Our workforce is relatively stable and does not have significant seasonal fluctuations.
We had approximately 100 U.S. employees and 4,800 non-U.S. employees who were covered by collective bargaining agreements as of December 31, 2020. Many of the covered employees are represented by works councils or industrial boards, as is customary in the jurisdictions in which they are employed. The collective bargaining agreements covering approximately 41% of such employees, primarily outside the U.S., will expire during 2021 and we will be engaged in negotiations to attain new agreements.
As a part of the Reinvent SEE business transformation, we are focusing on improving our human capital strategy to help develop a One SEE high performance culture. We are taking actions to engage our workforce and focus on growth and the execution of our business strategies. Actions to improve organizational productivity have resulted in a more cohesive and total company focused mindset while generating cost savings opportunities. Teams that have historically supported our Food or Protective segments are now focused on Sealed Air's overall platform on a regional or global basis. Organizational improvements in 2020 aligned our company-wide focus on functions including digital transformation, automation, R&D, sustainability and marketing. We are focused on developing a One SEE high performance culture by instilling a strong service culture and developing, retaining and attracting the best and brightest workforce.
Sealed Air's management regularly reports and discusses our workforce and people management strategies and related matters with our Board of Directors and the Organization and Compensation Committee of the Board of Directors, including matters related to compensation, succession planning, corporate culture, employees engagement, and diversity, equity and inclusion.
Code of Conduct, Ethics and Core Competencies
In 2019, we refreshed our written Code of Conduct which reflects our purpose and values as an organization and how we should act. It encourages all employees to promote an ethical culture and to recognize and report integrity and compliance issues. Our Code of Conduct guides us in how to manage our daily processes and interactions with professionalism, respect and integrity. Employees attest annually to reviewing and adhering to the Code of Conduct.
Employees receive regular online education as part of enhanced global ethics and compliance programs. This training includes required and monitored course training for employees in specific roles based on associated risk and function. Required sessions include the Code of Conduct, anti-bribery, anti-corruption, conflicts of interest, and workplace respect, among other legal and compliance subject matters.
6

Health and Safety
Protecting the health, safety and well-being of our people continues to be a top priority. A culture of Zero Harm and safety is an organizational imperative. Our global safety program includes behavioral-based safety training, hazard recognition and remediation and driver safety training. We also utilize a proactive approach which observes and recognizes demonstrations of proper and prudent safety operations.
In 2020, COVID-19 presented the Company with new challenges related to the health and safety of our people. The Company adopted various safety measures including enhanced cleaning procedures, employee temperature checks, use of personal protective equipment for location-dependent workers, social distancing measures within operating sites, remote work arrangements for non-location dependent employees, visitor access restrictions and limitations on travel.
Diversity, Equity and Inclusion
We are a global company with an employee population representing a broad diversity of cultures, languages, ethnicities, and races. We strive to improve our workplace diversity in many ways and support an inclusive culture across the globe. We evaluate talent acquisition, career development and succession planning to identify and remove unintended biases and facilitate increased diversity of our leadership talent pipeline. Recent examples of our commitment to diversity, equity and inclusion include the following initiatives:
• Commitment to pay equity: We seek to drive pay equity based on experience and performance across the organization utilizing a structured global compensation framework.
• Diversity, Equity and Inclusion Council: In 2020, Sealed Air formed the Diversity, Equity and Inclusion Council, which is chaired by an executive team member to promote a diverse, trusting and inclusive culture for all employees.
• Women's Initiative Network (“WIN”): The WIN has been in place at Sealed Air for over ten years, with a mission to promote gender diversity with the objective to attract, retain and promote more females within Sealed Air. As of December 31, 2020, we had active WIN employee resource groups in over 18 countries.
• Unconscious Bias Training Program: In 2019, Sealed Air launched an unconscious bias training program focused on highlighting various dimensions of diversity including age, race, ethnicity, gender and sexual orientation. The program has reached more than 1,100 employees as of December 31, 2020, including the executive leadership team, international senior leaders, U.S. managers and employees at our Charlotte, North Carolina headquarters.
• CEO Action for Diversity & InclusionTM: Sealed Air is a signatory for the CEO Action for Diversity & InclusionTM, which a CEO-driven business commitment to advance diversity and inclusion within the workplace.
Recruiting, Retaining and Engaging Employees and Learning and Development
Sealed Air utilizes a global talent acquisition model to attract and place employees. From time to time, we conduct pulse surveys to solicit valuable and timely feedback from our employees on specific topics. We use the results of the pulse surveys for initiatives related to employee engagement including increased communication from managers or leaders, targeted training opportunities or other methods to improve our employees' career experiences.
Community Support
We seek to strengthen the communities we are working and living in by leveraging our expertise in sustainability, food safety, food security, technology, and innovation to protect and solve critical challenges that face our world today. Sealed Air's community investment efforts are focused on three strategic impact areas: environmental, social and economic stability; technology and innovation; and community and equity.
Segments
We report our segment information in accordance with the provisions of Financial Accounting Standards Board (“FASB”) Accounting Standards Codification (“ASC”) Topic 280, “Segment Reporting,” (“FASB ASC Topic 280”). See Note 6, “Segments,” for further information.
Reportable Segments
Food
Food largely serves perishable food processors in fresh red meat, smoked and processed meat, poultry, seafood, plant-based and dairy (solids and liquids) markets worldwide. Food offers high-performance packaging materials and automated equipment solutions to increase food safety, extend shelf life, automate processes and optimize total cost. Its innovative, sustainable materials, automated equipment and services are designed to enable customers to reduce costs and enhance their
7
brands in the marketplace. Food solutions are marketed under the Cryovac® trademark and other highly recognized trade names including Cryovac Grip & Tear®, Cryovac Darfresh®, Cryovac Mirabella®, Simple Steps® and OptiDure™.
Food solutions are well aligned to capitalize on global market dynamics driven by continued urbanization, global growth of middle class, the e-food movement, growing consumer preference for smaller portions and healthier food choices, increasing labor scarcity and demand for more sustainable, secure packaging. Our solutions, innovative materials and proven equipment and services are designed to preserve nutrition while enhancing food safety. Technologies used in Food and continued investment in innovation positions us to not only address, but to be a global provider of solutions for sustainable packaging.
Food applications are largely sold direct to customers by our sales, marketing and customer service personnel throughout the world. Sales to governments, or government contracts, are not material to our Food segment. No single customer or affiliated group of customers represents more than 10% of segment revenue.
There are other manufacturers of products similar to those produced by Food, some that operate across multiple regions and others that operate in a single region or single country. Competing manufacturers produce a wide variety of food packaging based on plastic, metals and other materials.
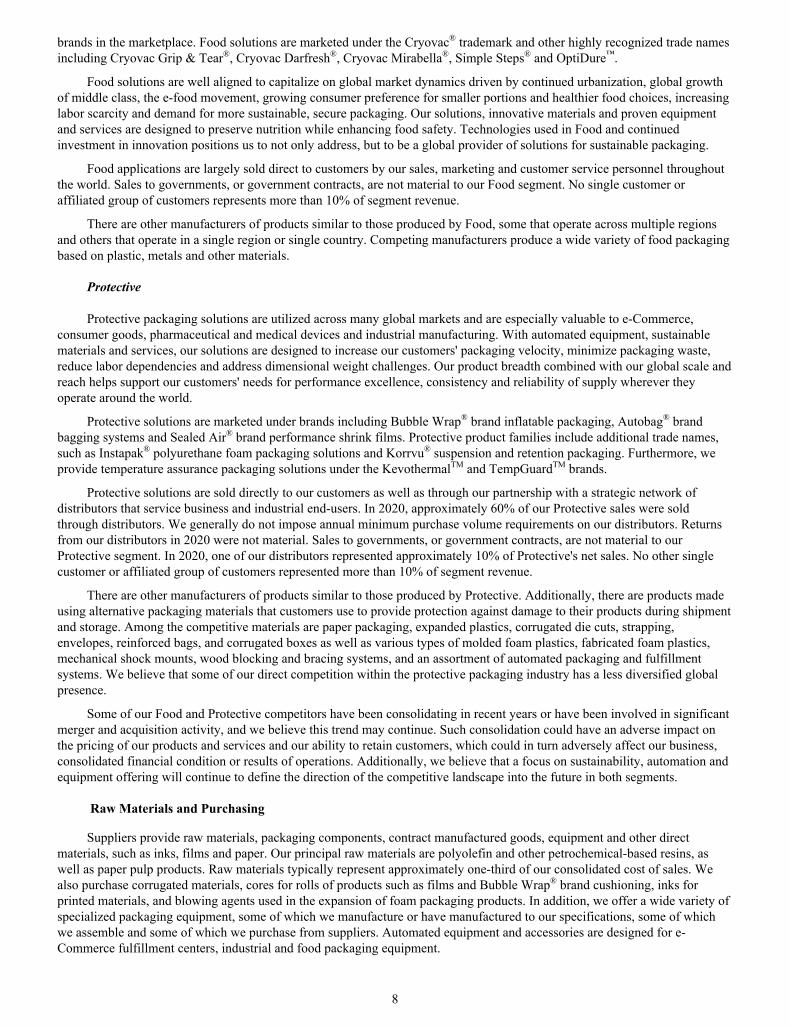
Protective
Protective packaging solutions are utilized across many global markets and are especially valuable to e-Commerce, consumer goods, pharmaceutical and medical devices and industrial manufacturing. With automated equipment, sustainable materials and services, our solutions are designed to increase our customers' packaging velocity, minimize packaging waste, reduce labor dependencies and address dimensional weight challenges. Our product breadth combined with our global scale and reach helps support our customers' needs for performance excellence, consistency and reliability of supply wherever they operate around the world.
Protective solutions are marketed under brands including Bubble Wrap® brand inflatable packaging, Autobag® brand bagging systems and Sealed Air® brand performance shrink films. Protective product families include additional trade names, such as Instapak® polyurethane foam packaging solutions and Korrvu® suspension and retention packaging. Furthermore, we provide temperature assurance packaging solutions under the KevothermalTM and TempGuardTM brands.
Protective solutions are sold directly to our customers as well as through our partnership with a strategic network of distributors that service business and industrial end-users. In 2020, approximately 60% of our Protective sales were sold through distributors. We generally do not impose annual minimum purchase volume requirements on our distributors. Returns from our distributors in 2020 were not material. Sales to governments, or government contracts, are not material to our Protective segment. In 2020, one of our distributors represented approximately 10% of Protective's net sales. No other single customer or affiliated group of customers represented more than 10% of segment revenue.
There are other manufacturers of products similar to those produced by Protective. Additionally, there are products made using alternative packaging materials that customers use to provide protection against damage to their products during shipment and storage. Among the competitive materials are paper packaging, expanded plastics, corrugated die cuts, strapping, envelopes, reinforced bags, and corrugated boxes as well as various types of molded foam plastics, fabricated foam plastics, mechanical shock mounts, wood blocking and bracing systems, and an assortment of automated packaging and fulfillment systems. We believe that some of our direct competition within the protective packaging industry has a less diversified global presence.
Some of our Food and Protective competitors have been consolidating in recent years or have been involved in significant merger and acquisition activity, and we believe this trend may continue. Such consolidation could have an adverse impact on the pricing of our products and services and our ability to retain customers, which could in turn adversely affect our business, consolidated financial condition or results of operations. Additionally, we believe that a focus on sustainability, automation and equipment offering will continue to define the direction of the competitive landscape into the future in both segments.
Raw Materials and Purchasing
Suppliers provide raw materials, packaging components, contract manufactured goods, equipment and other direct materials, such as inks, films and paper. Our principal raw materials are polyolefin and other petrochemical-based resins, as well as paper pulp products. Raw materials typically represent approximately one-third of our consolidated cost of sales. We also purchase corrugated materials, cores for rolls of products such as films and Bubble Wrap® brand cushioning, inks for printed materials, and blowing agents used in the expansion of foam packaging products. In addition, we offer a wide variety of specialized packaging equipment, some of which we manufacture or have manufactured to our specifications, some of which we assemble and some of which we purchase from suppliers. Automated equipment and accessories are designed for e-Commerce fulfillment centers, industrial and food packaging equipment.
8

The vast majority of the raw materials required for the manufacture of our products and all components related to our equipment and accessories generally have been readily available on the open market and, in most cases, are available from several suppliers and are available in amounts sufficient to meet our manufacturing requirements. However, in some regions we rely on some sole-source suppliers, and the lack of availability of supplies could have a material negative impact on our consolidated financial condition or results of operations. Natural disasters such as hurricanes, tornados, earthquakes or other severe weather events, as well as political instability and terrorist activities, may negatively impact the production or delivery capabilities of refineries and natural gas and petrochemical suppliers and suppliers of other raw materials. Due to by-product/co-product chemical relationships to the automotive and housing markets, several materials may become difficult to source. These factors could lead to increased prices for our raw materials, curtailment of supplies, allocation of raw materials and other force majeure events by our suppliers. We purchase some materials used in our packaging products from materials recycled in our manufacturing operations or obtained through participation in recycling programs. Although we purchase some raw materials under long-term supply arrangements with third parties, these arrangements follow market forces and are in line with our overall global purchasing strategy, which seeks to balance the cost of acquisition and availability of supply.
We have a centralized supply chain organization, which includes centralized management of purchasing and logistic activities. Our objective is to leverage our global scale to achieve purchasing efficiencies and reduce our total delivered cost across all our regions. We do this while adhering to strategic performance metrics and stringent purchasing practices.
Seasonality
On a consolidated basis, there is minimal seasonality in the business, with net sales slightly lower in the first quarter and slightly higher towards the end of the third quarter through the fourth quarter. Our consolidated results of operations typically trend directionally the same as our net sales seasonality. Historically, net sales in our Food segment have tended to be slightly lower in the first quarter and slightly higher towards the end of the third quarter through the fourth quarter, due to holiday events. Net sales in our Protective segment have also tended to be slightly lower in the first quarter and higher in the mid-third quarter and through the fourth quarter due to the holiday shopping season. However, the extent and timing of our results of operations may be difficult to predict if significant one-time transactions, events or non-recurring charges were to impact our business. Cash flow from operations has tended to be lower in the first quarter and higher in the fourth quarter, reflecting seasonality of sales and working capital changes, including the timing of certain annual incentive compensation payments.
Throughout 2020, the COVID-19 pandemic has resulted in anomalies to historical seasonality trends generated by changes in end-consumer behavior, such as an increase in e-Commerce sales, or temporary closures or productivity reductions within our customers' operations. We cannot predict the impact to the markets we serve or the timing or extent of sales due to the prolonged impact or future spread or worsening of the COVID-19 pandemic or future restrictions on commercial activities by governmental agencies to limit future spread of the virus. In addition to COVID-19, other factors may also outweigh the effects of seasonal changes in our net earnings results including, but not limited to, changes in raw materials and other costs, timing of pricing actions, foreign exchange rates, interest rates, taxes and the timing and amount of acquisition synergies and restructuring and other non-recurring charges.
Compliance with Government Regulations
As a manufacturer, we are subject to various laws, rules and regulations in the countries/territories, jurisdictions and localities in which we operate. These cover, among other things, the safe storage and use of raw materials and production chemicals, the release of materials into the environment, and standards for the treatment, storage and disposal of solid and hazardous wastes. We have an environmental management system that aids in our management of environmental, health and safety matters pertaining to our operations. Key elements of this environmental management system are implemented throughout our operations. We believe that compliance with current environmental and workplace health and safety laws and regulations has not had a material effect on our capital expenditures or consolidated financial condition.
In some jurisdictions in which our packaging products are sold or used, laws and regulations have been adopted or proposed that seek to regulate, among other things, minimum levels of recycled or reprocessed content and, more generally, the sale or disposal of packaging materials. We maintain programs designed to comply with these laws and regulations and to monitor their evolution. Various federal, state, local and foreign laws and regulations regulate some of our products and require us to register certain products and comply with specified requirements. We are also subject to various federal, state, local and foreign laws and regulations that regulate products manufactured and sold by us for controlling microbial growth on humans, animals and processed foods. In the U.S., these requirements are generally administered by the U.S. Food and Drug Administration (“FDA”). To date, the cost of complying with product registration requirements and FDA compliance, and similar non-U.S. laws, has not had a material adverse effect on our business, consolidated financial condition, results of operations, or cash flows.
9
We are subject to various federal, state, local and foreign laws and regulations which ensure safe working conditions for our employees. In the U.S., these requirements are generally administered by the U.S. Occupational Safety and Health Administration (“OSHA”). To date, the cost of complying with worker safety requirements and OSHA compliance, and similar non-U.S. laws, has not had a material adverse effect on our business, consolidated financial condition, results of operations, or cash flows.
Our emphasis on environmental, health and safety compliance provides us with risk reduction opportunities and cost savings through asset protection and protection of employees. We have policies in place which guide the Company in environmental, health and safety matters including training, materials conservation, communications, targets and transparency.
We maintain programs to comply with the various laws, rules and regulations related to the protection of the environment that we may be subject to in the many countries/territories in which we operate. See Part II, Item 7, “Management’s Discussion and Analysis of Financial Condition and Results of Operations” under the caption “Environmental Matters.”
Available Information
Our Internet address is www.sealedair.com. We make available, free of charge, on or through our website, our Annual Reports on Form 10-K, Quarterly Reports on Form 10-Q, Current Reports on Form 8-K, and amendments to those reports that we file or furnish pursuant to Sections 13(a) or 15(d) of the Securities Exchange Act of 1934, or the Exchange Act, as soon as reasonably practicable after we electronically file these materials with, or furnish them to, the Securities and Exchange Commission (“SEC”). The SEC maintains an Internet site that contains these filings and they can be accessed via the Internet address https://www.sec.gov. The information contained on, or that may be accessed through, our website is not incorporated by reference into, and is not a part of, this Form 10-K.
10

Item 1A. Risk Factors
Introduction
The risks described below should be carefully considered before making an investment decision. These are the most significant risk factors, but they are not the only risk factors that should be considered in making an investment decision. This Form 10-K also contains and may incorporate by reference forward-looking statements that involve risks and uncertainties. See the “Cautionary Notice Regarding Forward-Looking Statements,” immediately preceding Part I, of this Form 10-K. Our business, consolidated financial condition, results of operations, or cash flows could be materially adversely affected by any of these risks. The trading price of our securities could decline due to any of these risks, and investors in our securities may lose all or part of their investment.
Strategic Risks
The COVID-19 pandemic could adversely impact the health and safety of our employees, our business continuity, consolidated financial condition, results of operations, or cash flows.
Even though our business operations have been deemed essential by many governmental agencies in previous government-imposed commercial and social restrictions, there could be unpredictable disruptions to the Company’s operations or our customers' operations as a result of the current COVID-19 pandemic. We and some of our customers have experienced facility shutdowns during the pandemic. Unpredictable disruptions to the Company’s operations or our customers’ operations could reduce our future revenues and negatively impact the Company’s financial condition. The COVID-19 pandemic may result in supply chain and operational disruptions such as the availability and transportation of raw materials or the ability for our packaging and equipment specialists to visit customer facilities. Affected employees could impact the Company’s ability to operate our facilities and distribute products to our customers in a timely fashion.
In addition, the COVID-19 pandemic has, at times, resulted in volatility and disruptions in the capital and credit markets as well as widespread economic deterioration including an increase in global unemployment. This economic and market volatility and loss of employment may negatively impact consumer buying habits, which could adversely affect the Company’s financial results.
We experienced limited facility closures as a result of initial government orders in response to the pandemic. Additionally, in some jurisdictions, we have at times reduced production capacity due to local social distancing requirements which limit the number of employees in our facility. These instances have not had a material impact on our operations to date. However, the extent to which our operations may be impacted by the COVID-19 pandemic in the future will depend largely on continued developments, which are highly uncertain and cannot be accurately predicted, including new information which may emerge concerning the severity of the outbreak, including variants of the virus, and actions by government authorities to contain the outbreak or treat its impact, including the effectiveness and distribution of vaccines.
Uncertain global economic conditions have had and could continue to have an adverse effect on our consolidated financial condition, results of operations, or cash flows.
Uncertain global economic conditions have had and may continue to have an adverse impact on our business in the form of lower net sales due to weakened demand, unfavorable changes in product price/mix, or lower profit margins. For example, global economic downturns have adversely impacted some of our end-users and customers, such as food processors, distributors, supermarket retailers, restaurants, industrial manufacturers, retail establishments, business service contractors and e-Commerce and mail order fulfillment firms, and other end-users that are particularly sensitive to business and consumer spending.
During economic downturns or recessions, there can be a heightened competition for sales and increased pressure to reduce selling prices as our customers may reduce their volume of purchases from us. If we lose significant sales volume or reduce selling prices significantly, there could be a negative impact on our consolidated financial condition, results of operations, profitability or cash flows.
Also, reduced availability of credit may adversely affect the ability of some of our customers and suppliers to obtain funds for operations and capital expenditures. This could negatively impact our ability to obtain necessary supplies as well as our sales of materials and equipment to affected customers. This also could result in reduced or delayed collections of outstanding accounts receivable.
11

The global nature of our operations exposes us to numerous risks that could materially adversely affect our consolidated financial condition, results of operations, or cash flows.
We operate in 46 countries/territories, and our products are distributed to 117 countries/territories around the world. A large portion of our manufacturing operations are located outside of the U.S. and 47% of our net sales are generated outside of the U.S. These operations, particularly in developing regions, are subject to various risks that may not be present or as significant for our U.S. operations. Economic uncertainty in some of the geographic regions in which we operate, including developing regions, could result in the disruption of commerce and negatively impact cash flows from our operations in those areas.
Risks inherent in our international operations include:
• foreign currency exchange controls and tax rates;• foreign currency exchange rate fluctuations, including devaluations;• adverse impacts resulting from regional or global human health related illnesses;• the potential for changes in regional and local economic conditions, including local inflationary pressures or impacts
resulting from the United Kingdom's exit from the European Union;• restrictive governmental actions such as those on transfer or repatriation of funds and trade protection matters,
including antidumping duties, tariffs, embargoes and prohibitions or restrictions on acquisitions or joint ventures;• changes in laws and regulations, including the laws and policies of the U.S. affecting trade and foreign investment;• the impact of customer perceptions or regulatory developments related to sustainability concerns;• the difficulty of enforcing agreements and collecting receivables through certain foreign legal systems;• variations in protection of intellectual property and other legal rights;• more expansive legal rights of foreign unions or works councils;• changes in labor conditions and difficulties in staffing and managing international operations;• import and export delays caused, for example, by an extended strike at the port of entry, could cause a delay in our
supply chain operations;• social plans that prohibit or increase the cost of certain restructuring actions;• the potential for nationalization of enterprises or facilities;• unsettled political conditions and possible terrorist attacks against U.S. or other interests; and• potential tax inefficiencies and tax costs in repatriating funds from our non-U.S. subsidiaries.
These and other factors may have a material adverse effect on our international operations and, consequently, on our consolidated financial condition, results of operations, or cash flows.
We experience competition in the markets for our products and services and in the geographic areas in which we operate.
Our packaging products and equipment solution offerings compete with similar products made by other manufacturers and with a number of other types of materials or products. We compete on the basis of performance characteristics of our products, as well as service, price, sustainability and innovations in technology. A number of competing domestic and foreign companies are well-established.
Customers in the e-Commerce and food service industry and peers in the packaging industry have been consolidating in recent years, and we believe this trend may continue. Such consolidation could have an adverse impact on the pricing of our products and services and our ability to retain customers, which could in turn adversely affect our business, consolidated financial condition or results of operations.
Our inability to maintain a competitive advantage could result in lower prices or lower sales volumes for our products. Additionally, we may not successfully implement our pricing actions. These factors may have an adverse impact on our consolidated financial condition, results of operations, or cash flows.
Concerns about the impact that some plastic materials have on the environment, along with changes in legal or regulatory requirements, customer preferences or market measures to address these concerns, may negatively affect our business and operations.
Public attention to plastic waste and its associated environmental impact continues to increase. Some jurisdictions have laws and regulations that govern the registration and labeling of some of our products. Customer preferences and buying
12

behaviors may change as a result of public attention to plastic waste and current and future regulations. Currently, single-use plastic bans and/or proposals have focused on specific items such as grocery bags, cutlery, beverage straws and stir sticks, expanded polystyrene or oxo-degradable plastic. At present, none of the products we manufacture have been banned.
We maintain programs designed to comply with laws and regulations and to monitor their evolution. We also continue to innovate our packaging solutions to exceed recyclability or reusability requirements, address cube optimization to eliminate non-recyclable plastic waste, and increase the use of recycled and/or renewable materials. We believe that execution of our strategy positions us to exceed sustainability and recyclability demands of our customers with innovative solutions and new formulations of our materials. However, future development of government policies to restrict waste imports and/or expand bans beyond single-use plastics, as well as changes in customer preferences may have an adverse effect on our business, consolidated financial condition, results of operations, or cash flows.
We may not be able to successfully integrate acquired businesses without significant use of resources or diversion of management’s attention. Additionally, these businesses may underperform relative to our expectations.
Acquisitions involve numerous risks, including difficulty in determining valuation, integration of acquired operations, technologies, services and products, key personnel turnover, and the diversion of management's attention from other business matters. Ultimately, we may be unable to achieve the expected benefits and synergies which could adversely affect our business. Additionally, future acquisition activity may be limited by the availability of suitable acquisition candidates.
As a result of acquisitions, we may record a significant amount of goodwill and other identifiable intangible assets and we may never realize the full carrying value of the related assets.
As a result of acquisitions, we may record a significant amount of goodwill and other identifiable intangible assets, including customer relationships, trademarks and developed technologies.
We test goodwill and intangible assets with indefinite useful lives for possible impairment annually during the fourth quarter of each fiscal year or more frequently if events or changes in circumstances indicate that the asset might be impaired. Amortizable intangible assets are periodically reviewed for possible impairment whenever there is evidence that events or changes in circumstances indicate that the carrying value may not be recoverable. In the event that we determine that events or circumstances exist that indicate that the carrying value of goodwill or identifiable intangible assets may no longer be recoverable, we might have to recognize a non-cash impairment of goodwill or other identifiable intangible assets, which could have a material adverse effect on our consolidated financial condition or results of operations.
Political and economic instability and risk of government actions affecting our business and our customers or suppliers may adversely impact our business, results of operations and cash flows.
We are exposed to risks inherent in doing business in each of the countries or territories in which we or our customers or suppliers operate including: civil unrest, acts of terrorism, sabotage, epidemics, force majeure, war or other armed conflict and related government actions, including sanctions/embargoes, the deprivation of contract rights, the inability to obtain or retain licenses required by us to operate our plants or import or export our goods or raw materials, the expropriation or nationalization of our assets, and restrictions on travel, payments or the movement of funds. Geopolitical events may have a negative impact on the global industrial macro-economic environment and could materially adversely impact our consolidated financial condition, results of operations, or cash flows.
If we are not able to protect our trade secrets or maintain our trademarks, patents and other intellectual property, we may not be able to prevent competitors from developing similar products or from marketing their products in a manner that capitalizes on our trademarks, and this loss of a competitive advantage could decrease our profitability and liquidity.
Our ability to compete effectively with other companies depends, in part, on our ability to maintain the proprietary nature of our owned and licensed intellectual property. If we were unable to maintain the proprietary nature of our intellectual property and our significant current or future products, the resulting loss of associated competitive advantage could lead to decreased sales or increased operating costs, either of which could have a material adverse effect on our business, consolidated financial condition or results of operations.
We rely on trade secrets to maintain our competitive position, including protecting the formulation and manufacturing techniques of many of our products. As such, we have not sought U.S. or international patent protection for some of our principal product formulas and manufacturing processes. Accordingly, we may not be able to prevent others from developing products that are similar to or competitive with our products.
13

We own a large number of patents and pending patent applications on our products, aspects thereof, methods of use and/or methods of manufacturing. There is a risk that our patents may not provide meaningful protection and patents may never be issued for our pending patent applications.
We own, or have licenses to use, all of the material trademark and trade name rights used in connection with the packaging, marketing and distribution of our major products both in the U.S. and in other countries/territories where our products are principally sold. Trademark and trade name protection is important to our business. Although most of our trademarks are registered in the U.S. and in the foreign countries/territories in which we operate, we may not be successful in asserting trademark or trade name protection. In addition, the laws of some foreign countries/territories may not protect our intellectual property rights to the same extent as the laws of the U.S. The costs required to protect our trademarks and trade names may be substantial.
We cannot be certain that we will be able to assert these intellectual property rights successfully in the future or that they will not be invalidated, circumvented or challenged. Other parties may infringe on our intellectual property rights and may thereby dilute the value of our intellectual property in the marketplace. Third parties, including competitors, may assert intellectual property infringement or invalidity claims against us that could be upheld. Intellectual property litigation, which could result in substantial cost to and diversion of effort by us, may be necessary to protect our trade secrets or proprietary technology or for us to defend against claimed infringement of the rights of others and to determine the scope and validity of others’ proprietary rights. We may not prevail in any such litigation, and if we are unsuccessful, we may not be able to obtain any necessary licenses on reasonable terms or at all.
Any failure by us to protect our trademarks and other intellectual property rights may have a material adverse effect on our business, consolidated financial condition, results of operations, or cash flows.
Operational Risks
Raw material pricing, including how our selling prices reflect the cost of raw materials, availability and allocation by suppliers as well as energy-related costs may negatively impact our results of operations, including our profit margins.
We use petrochemical-based raw materials to manufacture many of our products. The prices for these raw materials are cyclical and increases in market demand or fluctuations in the global trade for petrochemical-based raw materials and energy could increase our costs. While historically we have been able to successfully manage the impact of higher raw material costs by increasing our selling prices, if we are unable to minimize the effects of increased raw material costs through sourcing, pricing or other actions, our business, consolidated financial condition or results of operations may be materially adversely affected. A portion of our sales prices, specifically within Food's North American and APAC business, is determined using formula based pricing which reflects changes in underlying raw material indices. Formula based pricing lags raw material cost movement by approximately six months. We may experience a benefit (when resin prices decrease) or detriment (when resin prices increase) to our cost of goods sold before those price changes are reflected in our selling prices. As such, trends in raw material pricing may have a negative impact on future profit margins. We also have some sole-source suppliers, and the lack of availability of supplies could have a material adverse effect on our consolidated financial condition, results of operations, or cash flows.
Natural disasters, such as a hurricane, tornado, earthquake or other severe weather event, as well as political instability and terrorist activities, may negatively impact the production or delivery capabilities of refineries and natural gas and petrochemical suppliers and suppliers of other raw materials in the future. These factors could lead to increased prices for our raw materials, curtailment of supplies, allocation of raw materials, and other force majeure events of our suppliers and harm relations with our customers which could have a material adverse effect on our consolidated financial condition, results of operations, or cash flows.
Unfavorable customer responses to price increases could have a material adverse impact on our sales and earnings.
From time to time, and especially in periods of rising raw material costs, we increase the prices of our products. Significant price increases could impact our earnings depending on, among other factors, the pricing by competitors of similar products and the response by the customers to higher prices. Such price increases may result in lower volume of sales and a subsequent decrease in gross margin and adversely impact our results of operations.
Demand for our products could be adversely affected by changes in consumer preferences or if we are not able to innovate and bring new products to market.
Our sales depend heavily on the volumes of sales by our customers in food processing and service industries, the industrial manufacturing and electronics sectors, and e-Commerce. Consumer preferences for food and durable goods
14

packaging can influence our sales. Consumer preferences for fresh and unpackaged foods and the global e-Commerce and industrial market change over time. Changes in consumer behavior, including changes driven by cost, availability, durability, sustainability, innovation, or various health-related concerns and perceptions, could negatively impact demand for our products.
Innovation is key to our strategy. Our performance and prospects for future growth could be adversely affected if new products do not meet sales or margin expectations and we are not able to meet our innovation rate goals. Our customers' preferences continue to trend towards sustainable packaging solutions. We believe that we are well positioned to offer these solutions to our customers, but our success is dependent on continued innovation in sustainability and our ability to bring new products to market in an efficient manner.
Our competitive advantage is due in part to our ability to develop and introduce new and sustainable products in a timely manner at favorable margins. The development and introduction cycle of new products can be lengthy and involve high levels of investment. New products may not meet sales or margin expectations due to many factors, including our inability to (i) accurately predict demand, end-user preferences and evolving industry and regulatory standards; (ii) resolve technical and technological challenges in a timely and cost-effective manner; or (iii) achieve manufacturing efficiencies.
Large-scale animal health issues as well as other health issues affecting the food industry and disruptive forces of nature, including those resulting from climate change, such as significant regional droughts, prolonged severe weather conditions, floods, and natural disasters may lead to decreased revenues.
We manufacture and sell food packaging products, among other products. Various forces of nature affecting the food industry have in the past and may in the future have a negative effect on the sales of food packaging products. Outbreaks of animal diseases may lead governments to restrict exports and imports of potentially affected animals and food products, leading to decreased demand for our products and possibly also to the culling or slaughter of significant numbers of the animal population otherwise intended for food supply. Other disruptive forces of nature such as droughts, floods and other severe weather can lead to agricultural market disruptions resulting in reduced herd size or modifications to the traditional herd cycles which could affect supply or demand for our products. Also, consumers may change their eating habits as a result of perceived problems with certain types of food. These factors may lead to reduced sales of food packaging products, which could have a material adverse effect on our consolidated financial condition, results of operations, or cash flows.
Cyber risk and the failure to maintain the integrity of our operational or security systems or infrastructure, or those of third parties with which we do business, could have a material adverse effect on our business, consolidated financial condition, results of operations, or cash flows.
We are subject to an increasing number of information technology vulnerabilities, threats and targeted computer crimes which pose a risk to the security of our systems and networks and the confidentiality, availability and integrity of our data. Disruptions or failures in the physical infrastructure or operating systems that support our businesses and customers, or cyber attacks or security breaches of our networks or systems, could result in the loss of customers and business opportunities, legal liability, regulatory fines, penalties or intervention, reputational damage, reimbursement or other compensatory costs, and additional compliance costs, any of which could materially adversely affect our business, consolidated financial condition and results of operations. To mitigate these threats to our business, we maintain a cyber security program aligned with industry frameworks designed to protect, detect, and respond to internal and external threats. While we have experienced, and expect to continue to experience, attacks attempting to breach the security of our network and systems, none have resulted in a breach with material impact or any penalties or settlement for the three years ended December 31, 2020.
We also maintain and have access to sensitive, confidential or personal data or information in certain of our businesses that is subject to privacy and security laws, regulations and customer controls. Despite our efforts to protect such sensitive, confidential or personal data or information, our facilities and systems and those of our customers and third-party service providers may be vulnerable to security breaches, theft, misplaced or lost data, programming and/or human errors that could lead to the compromising of sensitive, confidential or personal data or information, improper use of our systems, software solutions or networks, unauthorized access, use, disclosure, modification or destruction of information, defective products, production downtimes and operational disruptions, which in turn could adversely affect our business, consolidated financial condition, results of operations, or cash flows.
The regulatory environment surrounding cybersecurity and data privacy is increasingly demanding, with new and changing regulations. We could be required to expend additional resources to comply with any such regulations, and failure to comply could subject us to significant penalties or claims.
15

A major loss of or disruption in our manufacturing and distribution operations or our information systems and telecommunication resources could adversely affect our business, consolidated financial condition, results of operations, or cash flows.
If we were to experience a natural disaster, such as a hurricane, tornado, earthquake or other severe weather event, a casualty loss from an event such as a fire or flood, at one of our larger strategic facilities, or experience adverse impacts, such as plant shutdowns or travel restrictions due to regional or global human health related illness or if such events were to affect a key supplier, our supply chain or our information systems and telecommunication resources, then there could be a material adverse effect on our consolidated financial condition or results of operations. We are dependent on internal and third-party information technology networks and systems, including the Internet, to process, transmit and store electronic information. In particular, we depend on our information technology infrastructure for fulfilling and invoicing customer orders, applying cash receipts, and placing purchase orders with suppliers, making cash disbursements, and conducting digital marketing activities, data processing and electronic communications among business locations.
We also depend on telecommunication systems for communications between company personnel and our customers and suppliers. Future system disruptions, security breaches or shutdowns could significantly disrupt our operations or result in lost or misappropriated information and may have a material adverse effect on our business, consolidated financial condition, results of operations, or cash flows.
If we are unable to retain key employees and other personnel, our consolidated financial condition or results of operations may be adversely affected or we may not be able to execute our strategies.
Our success and execution of our strategy depends largely on the efforts and abilities of our management team and other key personnel. Their experience and industry contacts significantly benefit us, and we need their expertise to execute our business strategies, including our strategies related to innovation, automation and sustainability. If any such employee were to cease working for us and we were unable to replace them, our business, consolidated financial condition, results of operations, or cash flows may be materially adversely affected.
We could experience disruptions in operations and/or increased labor costs.
In Europe and Latin America, most of our employees are represented by either labor unions or workers' councils and are covered by collective bargaining agreements that are generally renewable on an annual basis. As is the case with any negotiation, we may not be able to negotiate acceptable new collective bargaining agreements, which could result in strikes or work stoppages by affected workers. Renewal of collective bargaining agreements could also result in higher wages or benefits paid to union members. A disruption in operations or higher ongoing labor costs could materially adversely affect our business.
Legal, Regulatory and Compliance Risks
We are involved in an ongoing investigation by the U.S. Securities and Exchange Commission.
The Company previously received from the staff of the SEC subpoenas for documents and requests for information in connection with the SEC's previously disclosed investigation. Those subpoenas and requests sought documents and information regarding the Company's accounting for income taxes, its financial reporting and disclosures, the process by which the Company selected its former independent audit firm which audited the fiscal years of 2015 through 2018, the independence of that audit firm, and other matters.
The Company is fully cooperating with the SEC. The Company understands that the SEC's investigation is continuing and cannot predict the outcome or duration of that investigation. Any determination that the Company's previous audit firm was not independent during the years it audited could require that certain of our historical financial statements be re-audited by a different registered public accounting firm which could affect our ability to comply with certain reporting obligations imposed by federal securities laws.
We are the subject of various legal proceedings, and may be subject to future claims and litigation, that could have a material adverse effect on our business, results of operations or cash flows.
We are involved from time to time in various legal proceedings, including the securities class action lawsuit, stockholder derivative action and other actions described in Part I, Item 3, “Legal Proceedings”. Litigation, in general, and securities, derivative actions and class action litigation, in particular, can be expensive and disruptive. Some of these proceedings may involve parties seeking large and/or indeterminate amounts, including punitive or exemplary damages, and may remain unresolved for several years. Litigation and other adverse legal proceedings could materially adversely affect our businesses,
16
operating results and/or cash flows because of reputational harm to us caused by such proceedings, the cost of defending such proceedings, the cost of settlement or judgments against us or the changes in our operations that could result from such proceedings.
Our operations are subject to a variety of environmental laws that expose us to regulatory scrutiny, potential financial liability and increased operating costs.
Our operations are subject to a number of federal, state, local and foreign environmental, health and safety laws and regulations that govern, among other things, the manufacture of our products, handling, transportation, storage and disposal of hazardous materials, and the discharge of pollutants into the air, soil and water along with similar legislation aimed at addressing climate change issues.
Many jurisdictions require us to have operating permits for our production and warehouse facilities and operations. Any failure to obtain, maintain or comply with the terms of these permits could result in fines or penalties, revocation or nonrenewal of our permits, or orders to cease certain operations, and may have a material adverse effect on our business, financial condition, results of operations, or cash flows.
We generate, use and dispose of hazardous materials in our manufacturing processes. In the event our operations result in the release of hazardous materials into the environment, we may become responsible for the costs associated with the investigation and remediation of sites at which we have released pollutants, or sites where we have disposed or arranged for the disposal of hazardous wastes, even if we fully complied with applicable environmental laws at the time of disposal. We have been, and may continue to be, responsible for the cost of remediation at some locations.
We are also subject to various federal, state, local and foreign laws and regulations that regulate products manufactured and sold by us for controlling microbial growth on humans, animals and processed foods. In the U.S., these requirements are generally administered by the FDA. We maintain programs designed to comply with these laws and regulations and to monitor their evolution. To date, the cost of complying with product registration requirements and FDA compliance has not had a material adverse effect on our business, consolidated financial condition, results of operations, or cash flows.
We cannot predict with reasonable certainty the future cost to us of environmental compliance, product registration, or environmental remediation. Environmental laws have become more stringent and complex over time. Our environmental costs and operating expenses will be subject to evolving regulatory requirements and will depend on the scope and timing of the effectiveness of requirements in these various jurisdictions. As a result of such requirements, we may be subject to an increased regulatory burden, and we expect significant future environmental compliance obligations in our operations. Increased compliance costs, increasing risks and penalties associated with violations, or our inability to market some of our products in certain jurisdictions may have a material adverse effect on our business, consolidated financial condition, results of operations, or cash flows.
Product liability claims or regulatory actions could adversely affect our financial results or harm our reputation or the value of our brands.
Claims for losses or injuries purportedly caused by some of our products arise in the ordinary course of our business. In addition to the risk of substantial monetary judgments, product liability claims or regulatory actions could result in negative publicity that could harm our reputation in the marketplace or adversely impact the value of our brands or our ability to sell our products in certain jurisdictions. We could also be required to recall possibly defective products, or voluntarily do so, which could result in adverse publicity and significant expenses. Although we maintain product liability insurance coverage, potential product liability claims could be excluded or exceed coverage limits under the terms of our insurance policies or could result in increased costs for such coverage.
Changes in U.S. trade policies and regulations, as well as the overall uncertainty surrounding international trade relations, could materially adversely affect our consolidated financial condition, results of operations, or cash flows.
Continued developments and recent changes in U.S. trade policies, have had, and we expect that they will continue to have, an adverse effect on our costs of products sold and margins in our North America region. On July 1, 2020, the United States-Mexico-Canada Agreement (USMCA) became effective which replaced the North American Free Trade Agreement (NAFTA). Uncertainty remains on future trade deals or continued tariffs placed on imports and exports to and from other countries. Additional tariffs and changes to the U.S. trade policies would likely adversely impact our business. Furthermore, other countries may change their own trade policies, including the imposition of additional tariffs and quotas, which could also adversely affect our business outside the U.S.
17

In order to mitigate the impact of these trade-related increases on our costs of products sold, we may increase prices in certain markets and, over the longer term, make changes in our supply chain and, potentially, our U.S. manufacturing strategy. Implementing price increases may cause our customers to find alternative sources for their products. We may be unable to successfully pass on these costs through price increases; adjust our supply chain without incurring significant costs; or locate alternative suppliers for raw materials or finished goods at acceptable costs or in a timely manner. Our inability to effectively manage the negative impacts of changing U.S. and foreign trade policies could materially adversely impact our consolidated financial condition, results of operations, or cash flows.
The U.S. Internal Revenue Service (the “IRS”) has indicated that it intends to disallow our deduction of the approximately $1.49 billion for the payments made pursuant to the Settlement agreement (as defined below).
In the past, we have reduced taxable income by approximately $1.49 billion for the payments made pursuant to the Settlement agreement and thus have reduced our U.S. federal tax liability by approximately $525 million. The IRS has proposed to disallow, as deductible expense, the entirety of the $1.49 billion settlement payments. Although we believe that we have meritorious defenses to the proposed disallowance and are protesting it with the IRS, this matter may not be resolved in 2021 and there can be no assurance that it will be resolved in the Company's favor. An unfavorable resolution of this matter could have a material adverse effect on our consolidated financial condition and results of operations, or cash flows.
We are subject to taxation in multiple jurisdictions. As a result, any adverse development in the tax laws of any of these jurisdictions or any disagreement with our tax positions could have a material adverse effect on our business, consolidated financial condition, results of operations, or cash flows.
We are subject to taxation in, and to the tax laws and regulations of, multiple jurisdictions as a result of the international scope of our operations and our corporate and financing structure. Tax laws are dynamic and subject to change as new laws are passed and new interpretations of the law are issued or applied. In 2017 the United States (U.S.) enacted significant tax reform, (the Tax Cuts and Jobs Act or “TCJA”) and certain provisions or interpretations of the new law may adversely affect us. For example, the one-time mandatory tax on previously deferred foreign earnings of foreign subsidiaries, or “Transition Tax”, involved complex calculations and had a material impact on our financial results in 2018.
Many countries in the European Union, as well as a number of other countries and organizations such as the Organization for Economic Co-operation and Development, are actively considering changes to existing tax laws that, if enacted, could increase our tax obligations in countries where we do business.
Additional changes in tax laws could increase our overall taxes and our business, consolidated financial condition or results of operations could be adversely affected in a material way. The tax authorities in any applicable jurisdiction, including the U.S., may disagree with the positions we have taken or intend to take regarding the tax treatment or characterization of any of our transactions. If any applicable tax authorities, including U.S. tax authorities, were to successfully challenge the tax treatment or characterization of any of our transactions, it could have a material adverse effect on our business, consolidated financial condition, results of our operations, or cash flows.
Although the Settlement agreement (as defined below) has been implemented and we have been released from the various asbestos-related, fraudulent transfer, successor liability, and indemnification claims made against us arising from a 1998 transaction with Grace (as defined below), if the courts were to refuse to enforce the injunctions or releases contained in the Plan (as defined below) and the Settlement agreement with respect to any claims and if Grace were unwilling or unable to defend and indemnify us for such claims, then we could be required to pay substantial damages, which could have a material adverse effect on our consolidated financial condition and results of operations. We were also a defendant in a number of asbestos-related actions in Canada arising from Grace’s activities in Canada prior to the 1998 transaction.
On March 31, 1998, we completed a multi-step transaction (the “Cryovac transaction”) involving W.R. Grace & Co. (“Grace”) which brought the Cryovac packaging business and the former Sealed Air’s business under the common ownership of the Company. As part of that transaction, Grace and its subsidiaries retained all liabilities arising out of their operations before the Cryovac transaction (including asbestos-related liabilities), other than liabilities relating to Cryovac’s operations, and agreed to indemnify the Company with respect to such retained liabilities. Beginning in 2000, we were served with a number of lawsuits alleging that the Cryovac transaction was a fraudulent transfer or gave rise to successor liability or both, and that as a result we were responsible for alleged asbestos liabilities of Grace and its subsidiaries. On April 2, 2001, Grace and a number of its subsidiaries filed petitions for reorganization under Chapter 11 of the U.S. Bankruptcy Code in the U.S. Bankruptcy Court for the District of Delaware (the “Bankruptcy Court”). In connection with Grace’s Chapter 11 case, the Bankruptcy Court issued orders staying all asbestos actions against the Company (the “Preliminary Injunction”) but granted the official committees appointed to represent asbestos claimants in Grace’s Chapter 11 case (the “Committees”) permission to pursue fraudulent transfer, successor liability, and other claims against the Company and its subsidiary Cryovac, Inc. based upon the
18
Cryovac transaction. In November 2002, we reached an agreement in principle with the Committees to resolve all current and future asbestos-related claims made against us and our affiliates, as well as indemnification claims by Fresenius Medical Care Holdings, Inc. and affiliated companies, in each case, in connection with the Cryovac transaction (as memorialized by the parties and approved by the Bankruptcy Court, the “Settlement agreement”). A definitive Settlement agreement was entered into as of November 10, 2003 consistent with the terms of the agreement in principle. On June 27, 2005, the Bankruptcy Court approved the Settlement agreement and the Settlement agreement was subsequently incorporated into the plan of reorganization for Grace filed in September 2008 (as filed and amended from time to time, the "Plan"). Subsequently, the Bankruptcy Court (in January and February 2011) and the United States District Court for the District of Delaware (in January and June 2012) entered orders confirming Grace’s plan of reorganization in its entirety.
On February 3, 2014 (the “Effective Date”), in accordance with the Plan, Grace emerged from bankruptcy. In accordance with the Plan and the Settlement agreement, on the Effective Date, Cryovac, Inc. made aggregate cash payments in the amount of $929.7 million to the WRG Asbestos PI Trust (the “PI Trust”) and the WRG Asbestos PD Trust (the “PD Trust”) and transferred 18 million shares of Sealed Air common stock to the PI Trust. Among other things, the Plan incorporated and implemented the Settlement agreement and provided for the establishment of two asbestos trusts under Section 524(g) of the U.S. Bankruptcy Code to which present and future asbestos-related personal injury and property damage claims are channeled. The Plan also provided injunctions and releases with respect to asbestos claims and certain other claims for our benefit. In addition, under the Plan and the Settlement agreement, Grace is required to indemnify us with respect to asbestos and certain other liabilities. Notwithstanding the foregoing, and although we believe the possibility to be remote, if any courts were to refuse to enforce the injunctions or releases contained in the Plan and the Settlement agreement with respect to any claims, and if, in addition, Grace were unwilling or unable to defend and indemnify us for such claims, then we could be required to pay substantial damages, which could have a material adverse effect on our consolidated financial condition, results of operations, profitability or cash flows.
Financial Risks
Fluctuations between foreign currencies and the U.S. dollar could materially impact our consolidated financial condition or results of operations.
Approximately 47% of our net sales in 2020 were generated outside the U.S. We translate sales and other results denominated in foreign currency into U.S. dollars for our Consolidated Financial Statements. As a result, the Company is exposed to currency fluctuations both in receiving cash from its international operations and in translating its financial results into U.S. dollars. During periods of a strengthening U.S. dollar, our reported international sales and net earnings could be reduced because foreign currencies may translate into fewer U.S. dollars. Foreign exchange rates can also impact the competitiveness of products produced in certain jurisdictions and exported for sale into other jurisdictions. These changes may impact the value received for the sale of our goods versus those of our competitors. The Company cannot predict the effects of exchange rate fluctuations on its future operating results. As exchange rates vary, the Company's results of operations and profitability may be adversely impacted. While we use financial instruments to hedge certain foreign currency exposures, this does not insulate us completely from foreign currency effects and exposes us to counterparty credit risk for non-performance. See Note 15, “Derivatives and Hedging Activities,” of the Notes. Such hedging activities may be ineffective or may not offset more than a portion of the adverse financial effect resulting from foreign currency variations. The gains or losses associated with hedging activities may negatively impact the Company's results of operations.
In all jurisdictions in which we operate, we are also subject to laws and regulations that govern foreign investment, foreign trade and currency exchange transactions. These laws and regulations may limit our ability to repatriate cash as dividends or otherwise to the U.S. and may limit our ability to convert foreign currency cash flows into U.S. dollars.
We have recognized foreign exchange losses related to the currency devaluations in Argentina and its designation as a highly inflationary economy under U.S. GAAP. See Note 2, “Summary of Significant Accounting Policies and Recently Issued Accounting Standards,” for additional information.
Our annual effective income tax rate can change materially as a result of changes in our geographic mix of U.S. and foreign earnings and other factors, including changes in tax laws and changes made by regulatory authorities.
Our overall effective income tax rate is equal to our total tax expense as a percentage of total earnings before tax. However, income tax expense and benefits are not recognized on a global basis but rather on a jurisdictional or legal entity basis. Losses in one jurisdiction may not be used to offset profits in other jurisdictions and may cause an increase in our tax rate. Changes in the mix of earnings (or losses) between jurisdictions and assumptions used in the calculation of income taxes, among other factors, could have a significant effect on our overall effective income tax rate. Additionally, changes in tax laws and changes made by regulatory authorities could have a significant effect on our overall effective income tax rate.
19

We may not be able to generate sufficient cash to service all of our indebtedness and may be forced to take other actions to satisfy our obligations under our indebtedness, which may not be successful.
Our ability to make scheduled payments on time or refinance our debt obligations depends on our financial condition and operating performance, which are subject to prevailing economic and competitive conditions and to certain financial, business, legislative, regulatory and other factors beyond our control. We may be unable to maintain a level of cash flows from operating activities sufficient to permit us to pay the principal, premium, if any, and interest on our indebtedness.
If our cash flows and capital resources are insufficient to fund our debt service obligations, we could face substantial liquidity problems and could be forced to reduce or delay investments and capital expenditures or to dispose of material assets or operations, seek additional debt or equity capital or restructure or refinance our indebtedness. We may not be able to affect any such alternative measures on commercially reasonable terms or at all and, even if successful, those alternative actions may not allow us to meet our scheduled debt service obligations. The credit agreement governing the senior secured credit facilities, the indentures that govern our senior notes and the agreements covering our accounts receivable securitization programs restrict our ability to dispose of assets and use the proceeds from those dispositions and may also restrict our ability to raise debt or equity capital to be used to repay other indebtedness when it becomes due. We may not be able to consummate those dispositions or to obtain proceeds in an amount sufficient to meet any debt service obligations then due.
In addition, we conduct a substantial portion of our operations through our subsidiaries, certain of which are not guarantors of our indebtedness. Accordingly, repayment of our indebtedness is dependent on the generation of cash flow by our subsidiaries and their ability to make such cash available to us, by dividend, debt repayment or otherwise. Unless they are guarantors of our indebtedness, our subsidiaries do not have any obligation to pay amounts due on indebtedness or to make funds available for that purpose. Our subsidiaries may not be able to, or may not be permitted to, make distributions to enable us to make payments in respect of our indebtedness. Each subsidiary is a distinct legal entity, and, under certain circumstances, legal and contractual restrictions may limit our ability to obtain cash from our subsidiaries. The indenture governing certain of our senior notes and the credit agreement governing the senior secured credit facilities limit the ability of certain of our subsidiaries to incur consensual restrictions on their ability to pay dividends or make other intercompany payments to us. These limitations are subject to qualifications and exceptions. In the event that we do not receive distributions from our subsidiaries, we may be unable to make required principal and interest payments on our indebtedness.
Our inability to generate sufficient cash flows to satisfy our debt obligations, or to refinance our indebtedness on commercially reasonable terms or at all, would materially and adversely affect our consolidated financial condition, results of operations, or cash flows.
If we cannot make scheduled payments on our debt, we will be in default, our note holders and lenders could accelerate the repayment of our borrowings, the lenders could terminate their commitments to loan money and/or foreclose against the assets securing the borrowings, and we could be forced into bankruptcy or liquidation.
The terms of our credit agreement governing our senior secured credit facilities, our accounts receivable securitization programs, our supply chain financing programs, and the indentures governing our senior notes restrict our current and future operations, particularly our ability to respond to changes in market conditions or to take certain actions.
The indentures governing our senior notes and the credit agreement governing our senior secured credit facilities and our accounts receivable securitization programs contain a number of restrictive covenants that impose significant operating and financial restrictions on us and may limit our ability to engage in acts that may be in our long-term best interest, including restrictions on our ability to:
• incur additional indebtedness;• pay dividends or make other distributions or repurchase or redeem capital stock;• prepay, redeem or repurchase certain debt;• make loans and investments;• sell assets;• incur liens;• enter into transactions with affiliates;• alter the businesses we conduct;• enter into agreements restricting our subsidiaries’ ability to pay dividends; and• consolidate, merge or sell all or substantially all of our assets.
In addition, the restrictive covenants in the credit agreement governing our senior credit facilities require us to maintain a specified net leverage ratio. Our ability to meet this financial ratio can be affected by events beyond our control.
20

A breach of the covenants under the indenture governing our senior notes or under the credit agreement governing our senior secured credit facilities could result in an event of default under the applicable indebtedness. Such a default may allow the creditors to accelerate the related debt and may result in the acceleration of any other debt to which a cross-acceleration or cross-default provision applies. In addition, an event of default under the credit agreement governing our senior secured credit facilities would permit the lenders under our senior secured credit facilities to terminate all commitments to extend further credit under those facilities. Furthermore, if we were unable to repay the amounts due and payable under our senior secured credit facilities, those lenders could proceed against the collateral granted to them to secure that indebtedness. In the event our lenders or note holders accelerate the repayment of our borrowings, we and our subsidiaries may not have sufficient assets to repay that indebtedness. As a result of these restrictions, we may be:
• limited in how we conduct our business;• unable to respond to changing market conditions;• unable to raise additional debt or equity financing to operate during general economic or business downturns or to
repay other indebtedness when it becomes due; or• unable to compete effectively or to take advantage of new business opportunities.
In addition, amounts available under our accounts receivable securitization programs and/or utilization of our supply chain financing programs can be impacted by a number of factors, including but not limited to our credit ratings, accounts receivable or payable balances, the creditworthiness of us or our customers, our receivables collection experience and/or our trade payable payment history.
Our variable rate indebtedness subjects us to interest rate risk, which could cause our debt service obligations to increase significantly.
Borrowings under our senior secured credit facilities are at variable rates of interest and expose us to interest rate risk. If interest rates increase, our debt service obligations on the variable rate indebtedness will increase even though the amount borrowed will remain the same, and our net income and cash flows, including cash available for servicing our indebtedness, will correspondingly decrease. As of December 31, 2020, we had $696 million of long-term borrowings under our senior secured credit facilities at variable interest rates. A 1/8% increase or decrease in the assumed interest rates on the senior secured credit facilities would result in a $0.9 million increase or decrease in annual interest expense. In the future, we may enter into interest rate swaps that involve the exchange of floating for fixed rate interest payments in order to reduce interest rate volatility. However, we may not maintain interest rate swaps with respect to all of our variable rate indebtedness, and any swaps we enter into may not fully mitigate our interest rate risk.
The full realization of our deferred tax assets may be affected by a number of factors, including future earnings and the feasibility of on-going planning strategies.
We have deferred tax assets including state and foreign net operating loss carryforwards, accruals not yet deductible for tax purposes, employee benefit items and other items. We have established valuation allowances to reduce the deferred tax assets to an amount that is more likely than not to be realized. Our ability to utilize the deferred tax assets depends in part upon our ability to generate future taxable income within each respective jurisdiction during the periods in which these temporary differences reverse or our ability to carryback any losses created by the deduction of these temporary differences. We expect to realize the assets over an extended period. If we are unable to generate sufficient future taxable income in the U.S. and/or certain foreign jurisdictions, or if there is a significant change in the time period within which the underlying temporary differences become taxable or deductible, we could be required to increase our valuation allowances against our deferred tax assets. Our effective tax rate would increase if we were required to increase our valuation allowances against our deferred tax assets.
Disruption and volatility of the financial and credit markets could affect our external liquidity sources.
Our principal sources of liquidity are accumulated cash and cash equivalents, short-term investments, cash flow from operations and amounts available under our lines of credit, including our senior secured credit facilities, and our accounts receivable securitization programs. We may be unable to refinance any of our indebtedness, including our senior notes, our accounts receivable securitization programs and our senior secured credit facilities, on commercially reasonable terms or at all.
Additionally, conditions in financial markets could affect financial institutions with which we have relationships and could result in adverse effects on our ability to utilize fully our committed borrowing facilities. For example, a lender under the senior secured credit facilities may be unwilling or unable to fund a borrowing request, and we may not be able to replace such lender.
21

Our insurance policies may not cover all operating risks and a casualty loss beyond the limits of our coverage could materially and adversely impact our business.
Our business is subject to operating hazards and risks relating to handling, storing, transporting and use of the products we sell. We maintain insurance policies in amounts and with coverage and deductibles that we believe are reasonable and prudent. Nevertheless, our insurance coverage may not be adequate to protect us from all liabilities and expenses that may arise from claims for personal injury or death or property damage arising in the ordinary course of business, and our current levels of insurance may not be maintained or available in the future at economical prices. If a significant liability claim is brought against us that are not adequately covered by insurance, we may have to pay the claim with our own funds, which could have a material adverse effect on our business, consolidated financial condition, results of operations, or cash flows.
Item 1B. Unresolved Staff CommentsNone.
22

Item 2. Properties
We manufacture products in 106 facilities, with 15 of those facilities serving both of our business segments. The following table shows our manufacturing facilities by geographic region and our business segment reporting structure:
Geographic Region
Number of Manufacturing
Facilities
Food Manufacturing
Facilities
Protective Manufacturing
Facilities
North America 43 10 36 Europe, Middle East and Africa ("EMEA") 29 11 24 Asia, Australia and New Zealand ("APAC") 28 9 24 South America 6 6 1 Total 106 36 85
Other Property Information
We own the large majority of our manufacturing facilities. Some of these facilities are subject to secured or other financing arrangements. We lease the balance of our manufacturing facilities, which are generally smaller sites. Our manufacturing facilities are usually located in general purpose buildings that house our specialized machinery for the manufacture of one or more products. Because of the relatively low density of our air cellular, polyethylene foam and protective mailer products, we realize significant freight savings by locating our manufacturing facilities for these products near our customers and distributors.
We also occupy facilities containing sales, distribution, technical, warehouse or administrative functions at a number of locations in the U.S. and in many foreign countries/territories. Some of these facilities are located on the manufacturing sites that we own and some of these are leased. Stand-alone facilities of these types are generally leased. Our global headquarters is located in an owned property in Charlotte, North Carolina. For a list of those countries and territories outside of the U.S. where we have operations, see Global Scale and Market Access within “Market Strategy and Competitive Strengths” above.
We believe that our manufacturing, warehouse, office and other facilities are well maintained, suitable for their purposes and adequate for our needs.
23
Item 3. Legal Proceedings
The information set forth in Note 20, “Commitments and Contingencies,” under the captions “Settlement Agreement Tax Deduction” and “Environmental Matters” is incorporated herein by reference.
Following the announcement on June 20, 2019 that the Company had terminated the employment of William G. Stiehl as Chief Financial Officer, the Company received a Grand Jury subpoena from the United States Attorney's Office for the Western District of North Carolina (the “U.S. Attorney's Office”) seeking documents relating to that termination and relating to the process by which the Company selected its former independent audit firm for the fiscal years of 2015 through 2018. The Company has been advised by the U.S. Attorney's Office that it has completed its investigation of these matters and will not be taking any action.
The Company previously received from the staff of the SEC subpoenas for documents and requests for information in connection with the SEC's previously disclosed investigation. Those subpoenas and requests sought documents and information regarding the Company's accounting for income taxes, its financial reporting and disclosures, the process by which the Company selected its former independent audit firm which audited the fiscal years of 2015 through 2018, the independence of that audit firm, and other matters. The Company is fully cooperating with the SEC. The Company understands that the SEC's investigation is continuing and cannot predict the outcome or duration of that investigation.
On November 1, 2019, purported Company stockholder UA Local 13 & Employers Group Insurance Fund filed a putative class action complaint in the United States District Court for the Southern District of New York against the Company and certain of its current and former officers. On June 4, 2020, the complaint was amended to remove all individual defendants other than the Company’s former CFO and to add a plaintiff, and on July 13, 2020, the complaint was further amended to identify a total of four plaintiffs. The complaint alleges violations of Sections 10(b) and 20(a) of the Exchange Act and Rule 10b-5 thereunder based on allegedly false and misleading statements and omissions concerning the Company’s hiring of Ernst & Young LLP as its independent auditors and concerning the Company's corporate policies and procedures. The plaintiffs seek to represent a class of purchasers of the Company’s common stock between November 17, 2014 and June 20, 2019. The complaint seeks, among other things, unspecified compensatory damages, including interest, and attorneys’ fees and costs. On September 4, 2020, the Company filed a motion to dismiss the complaint, and after briefing the motion, will await a decision by the court.
On January 14, 2020, a stockholder derivative lawsuit was filed in the United States District Court for the District of Delaware by an alleged stockholder of the Company, purportedly on the Company’s behalf. The suit was brought against certain of the Company’s current and former directors and officers and against the Company, as a nominal defendant. The complaint contains allegations against the individual defendants under Sections 10(b) and 20(a) of the Exchange Act and Rule 10b-5 thereunder similar to those in the class action complaint discussed above, as well as allegations of violations of Section 14(a) under the Exchange Act. The complaint also alleges breach of fiduciary duty, unjust enrichment and waste of corporate assets by the individual defendants for, among other things, failure to correct the alleged false and misleading statements, insider sales of the company’s stock, compensation benefiting from the alleged artificially inflated stock value, company repurchases of shares based on the alleged inflated stock value, and costs in connection with lawsuits and internal investigations. The complaint seeks unspecified damages for Sealed Air, restitution, and reformation and improvement of Sealed Air’s corporate governance and internal procedures regarding compliance with laws. On May 8, 2020, this lawsuit was stayed pending resolution of a motion to dismiss the putative class action described above.
We are also involved in various other legal actions incidental to our business. We believe, after consulting with counsel, that the disposition of these other legal proceedings and matters will not have a material effect on our consolidated financial condition or results of operations including potential impact to cash flows.
24

Item 4. Mine Safety Disclosures.
Not applicable.
25

Information About Our Executive Officers
The information appearing in the table below sets forth the current position or positions held by each of our executive officers, the officer’s age as of January 31, 2021, the year in which the officer was first elected to the position currently held with us and the year in which such person was first elected an officer. All of our officers serve at the pleasure of the Board of Directors.
There are no family relationships among any of our executive officers or directors.
Name and Current Position(1)Age as of
January 31, 2021First Elected to
Current Position
First Elected an Executive
Officer
Edward L. Doheny II President and Chief Executive Officer 58 2018 2017James M. Sullivan(2)
Senior Vice President and Chief Financial Officer 60 2019 2019Christopher J. Stephens, Jr.(2)
Senior Vice President and Chief Financial Officer-Designate 56 2021 2021Emile Z. Chammas Senior Vice President, Chief Manufacturing and Supply Chain Officer & Chief Transformation Officer 52 2019 2010Susan C. Edwards Vice President, Chief Human Resources Officer 58 2019 2019Sergio A. Pupkin Vice President, Chief Growth & Strategy Officer 55 2020 2020Angel S. Willis Vice President, General Counsel and Secretary 50 2019 2020Michael A. Leon Chief Accounting Officer and Controller 40 2018 2018
(1) Karl Deily stepped down from his position as Senior Vice President and Chief Commercial Officer effective as of December 31, 2020 and will continue to serve the Company in an advisory role until his retirement on April 2, 2021.(2) Effective February 26, 2021, Mr. Sullivan will step down as Senior Vice President and Chief Financial Officer, and Mr. Stephens will assume that position. Mr. Sullivan’s employment with the Company will continue through March 31, 2021 (or any earlier date as Mr. Sullivan and the Company may mutually agree).
Mr. Doheny joined Sealed Air as Chief Operating Officer and CEO-Designate in September 2017 and was elected a Director of Sealed Air Corporation. He became President and CEO effective January 1, 2018. Prior to joining the Company in September 2017, Mr. Doheny served as President and Chief Executive Officer and a Director of Joy Global Inc., a manufacturer and servicer of high productivity mining equipment, from 2013 through 2017. Mr. Doheny also served as Executive Vice President of Joy Global and President and Chief Operating Officer of its Underground Mining Machinery business from 2006 to 2013, where he had global responsibility for the company's underground mining machinery business. Prior to joining Joy Global, Mr. Doheny had a 21-year career with Ingersoll Rand Corporation holding a series of senior executive positions of increasing responsibility, including President of Industrial Technologies from 2003 to 2005 and President of the Air Solutions Group from 2000 to 2003.
Mr. Sullivan joined Sealed Air as Senior Vice President and Chief Financial Officer effective June 24, 2019. Mr. Sullivan joined the Company with more than 20 years of experience in leadership roles in the industrial and manufacturing sectors. He most recently served as Executive Vice President and CFO of Joy Global from 2012 to 2017, where he oversaw the company’s global finance and accounting organization. Prior to joining Joy Global, Mr. Sullivan served as Executive Vice President and CFO of Solutia, a chemical manufacturing company, from 2004 until its acquisition by Eastman Chemical Company in 2012. Prior to being appointed Solutia's CFO, Mr. Sullivan spent five years as Solutia’s Vice President and Controller.
Mr. Stephens joined Sealed Air as Senior Vice President and Chief Financial Officer-Designate effective January 1, 2021. Previously, he had served as Senior Vice President, Finance and Chief Financial Officer, of Barnes Group Inc. since January 2009. Barnes Group Inc. is a global provider of engineered products, technologies and solutions to a range of industries including aerospace, transportation, manufacturing, automation and packaging. Prior his role at Barnes Group, Mr. Stephens held key leadership roles at Honeywell International, serving as President of the Consumer Products Group from 2007 to 2008, and Vice President and Chief Financial Officer of Honeywell Transportation Systems from 2003 to 2007. Prior to Honeywell, he held roles with increasing responsibility at The Boeing Company, serving as Vice President and General Manager, Boeing
26

Electron Dynamic Devices; Vice President, Business Operations, Boeing Space and Communications; and Vice President and Chief Financial Officer, Boeing Satellite Systems.
In 2019, Mr. Chammas' responsibilities were expanded to include Chief Transformation Officer in addition to his previously existing role of Senior Vice President and Chief Manufacturing and Supply Chain Officer, which he held since November 2010. As Chief Transformation Officer, Mr. Chammas has company-wide leadership of the Reinvent SEE business transformation. Prior to joining the Company, Mr. Chammas was Vice President, Worldwide Supply Chain, for the Wm. Wrigley Jr. Company, a confectionery company, from 2008 through 2010, and served in management positions of increasing responsibility in supply chain, operations and procurement with the Wm. Wrigley Jr. Company from 2002 through 2008.
Ms. Edwards was named Vice President and Chief Human Resources Officer and appointed as an executive officer of the Company in 2019. She has had responsibility for the Company's global human resource function, including under her previous title, Vice President, Human Resources, since January 2017. Ms. Edwards initially joined Sealed Air in 2011 as Vice President, Global HR Business Partner of Food. From 2014 through 2017, she served as Vice President, HR Business Partner. Prior to joining the Company, Ms. Edwards held leadership roles for several global corporations including CIRCOR International, where she was responsible for strategic HR and integration leadership from 2009 until 2011. Prior to CIRCOR, she held many roles with increasing responsibility at Snap-on Incorporated from 2001 until 2009 culminating with her role as Vice President of Rapid Continuous Improvement.
Mr. Pupkin was named Vice President and Chief Growth & Strategy Officer and appointed an executive officer of the Company in 2020. In this role, he is responsible for corporate strategy, global mergers and acquisitions, brand communications and our digital business, including e-Commerce and SealedAir.com. Prior to his current role, Mr. Pupkin became Chief Strategy Officer in 2019 and served as Vice President, Corporate Strategy, Mergers and Acquisitions from 2016 to 2019. From 2011 to 2016 Mr. Pupkin held leadership positions in our former Diversey Care segment and joined Sealed Air in 2011 as a result of the Diversey acquisition. At the time of the acquisition, Mr. Pupkin had over 14 years of increasing responsibility in strategic marketing, business development, sales, and general management for Diversey, Inc. and predecessor companies.
Ms. Willis joined Sealed Air in 2019 as Vice President, General Counsel and Secretary. She was appointed as an executive officer of the Company in 2020. Prior to joining Sealed Air, Ms. Willis served as Vice President & Deputy General Counsel at Ingersoll Rand. In that role, she led the legal aspects of strategic transactions such as mergers and acquisitions and all legal affairs for Europe, Middle East, India and Africa. Overall, Ms. Willis held numerous legal roles with broad scope supporting commercial business units, functions and regions at Ingersoll Rand from 2005 through 2018. Prior to joining Ingersoll Rand, Ms. Willis was Corporate Counsel at Cummins, Inc. and Associate at Ice Miller, LLP.
Mr. Leon was appointed as Chief Accounting Officer and Controller in 2018. Prior to the appointment, he served as the Company’s Assistant Corporate Controller since December 2014. Before joining the Company, Mr. Leon held various accounting and finance positions with increasing levels of responsibilities at a Big 4 public accounting firm and at several diversified global manufacturing companies, including SPX Corporation from 2012 to 2014, and United Technologies Corporation and its predecessor company, Goodrich Corporation, from 2006 to 2012. He has extensive financial and accounting experience, including financial reporting, financial planning and analysis, mergers and acquisitions, and internal audit, among others.
27

PART II
Item 5. Market for Registrant’s Common Equity, Related Stockholder Matters and Issuer Purchases of Equity Securities
Market Information and Holders
Our common stock is listed on the New York Stock Exchange with the trading symbol SEE. As of February 16, 2021, there were approximately 3,172 holders of record of our common stock.
Common Stock Performance Comparisons
The following graph shows, for the five years ended December 31, 2020, the cumulative total return on an investment of $100 assumed to have been made on December 31, 2015 in our common stock. The graph compares this return (“SEE”) with that of comparable investments assumed to have been made on the same date in: (a) the Standard & Poor’s 500 Stock Index (“Composite S&P 500”) and (b) a market capitalization-weighted self-constructed peer group (“Peer Group”).
The Peer Group includes Sealed Air and the following companies: AptarGroup, Inc.; Ashland Global Holdings Inc.; Avery Dennison Corporation; Avient Corporation; Axalta Coating Systems Ltd.; Ball Corporation; Berry Global Group, Inc.; Celanese Corporation; Crown Holdings, Inc.; Graphic Packaging Holding Company; Greif, Inc.; H.B. Fuller Company; Owens-Illinois, Inc.; Packaging Corporation of America; Silgan Holdings Inc.; and Sonoco Products Company. Bemis Company, Inc. was previously included in our peer group and has been removed due to its acquisition by Amcor PLC in 2019. Maple Leaf Foods was previously included in our peer group and was replaced by H.B. Fuller Company in 2020 as H.B. Fuller's size, industry and country of domicile were deemed to be more aligned with Sealed Air. The Peer Group is consistent with the peer companies used by the Organization and Compensation Committee of our Board of Directors (“O&C Committee”) in connection with certain aspects of our executive compensation programs. The O&C Committee includes companies primarily in the materials sector that are comparable to Sealed Air based on sales, percentage of sales outside of the U.S., number of employees and market capitalization.
Total return for each assumed investment assumes the reinvestment of all dividends on December 31 of the year in which the dividends were paid.
28

5 Year Compound Annual Growth RateSEE: 3.3%
Composite S&P 500: 15.4%Peer Group: 13.2%
SEE Composite S&P 500 Peer Group
2015 2016 2017 2018 2019 20200.00
50.00
100.00
150.00
200.00
250.00
Recent Sales of Unregistered Securities
Not applicable.
Issuer Purchases of Equity Securities
The table below sets forth the total number of shares of our common stock, par value $0.10 per share, that we repurchased in each month of the quarter ended December 31, 2020, the average price paid per share and the maximum number of shares that may yet be purchased under our publicly announced plans or programs.
PeriodTotal Number of
Shares Purchased(ii) Average Price Paid Per Share
Total Number of Shares Purchased as Part of Announced Plans or Programs
Maximum Approximate Dollar Value of Shares that May
Yet be Purchased Under the Plans or Programs
(a) (b) (c) (d)
Balance as of September 30, 2020 $ 687,637,375 October 1, 2020 through October 31, 2020 102,840 $ 40.32 98,532 683,664,705 November 1, 2020 through November 30, 2020 7,745 $ 42.89 7,602 683,338,632 December 1, 2020 through December 31, 2020(i) 228,805 $ 45.08 228,805 673,023,477
Total 339,390 334,939 $ 673,023,477
(i) Of those shares purchased, 35,100 shares at an average price of $45.76 per share, settled in January 2021.
29

(ii) On May 2, 2018, the Board of Directors increased the total authorization to repurchase the Company's issued and outstanding stock to $1.0 billion. This program has no expiration date and replaced the previous authorizations. We from time to time acquire shares by means of (i) open market transactions, including through plans complying with Rule 10b5-1 under the Exchange Act, and privately negotiated transactions, including accelerated share repurchase programs, pursuant to our publicly announced program described above and (ii) shares withheld from restricted share awards under our Omnibus Incentive Plan pursuant to the provision thereof that permits tax withholding obligations or other legally required charges to be satisfied by having us withhold shares from an award under that plan. We report price calculations in column (b) in the table above only for shares purchased as part of our publicly announced program, when applicable. For shares withheld for minimum tax withholding obligations or other legally required charges, we withhold shares at a price equal to their fair market value.
PeriodShares withheld for tax obligations
and chargesAverage withholding price for shares
in column “a” (a) (b)
October 2020 4,308 $ 40.35 November 2020 143 $ 42.42 December 2020 — $ —
Total 4,451
30

Item 6. Selected Financial Data
[Reserved]
31
Item 7. Management’s Discussion and Analysis of Financial Condition and Results of Operations
The information in this MD&A should be read together with our Consolidated Financial Statements and related notes set forth in Part II, Item 8, as well as the discussion included in Part I, Item 1A, “Risk Factors,” of this Annual Report on Form 10-K. All amounts and percentages are approximate due to rounding and all dollars are in millions, except per share amounts.
Business and Reportable Segments
Sealed Air is in business to protect, to solve critical packaging challenges and to make our world better than we found it. Our materials, automated equipment and services maximize food safety and security and product protection while minimizing waste. We serve an array of end markets including protein, foods, fluids, medical and life sciences, pet care, e-Commerce and logistics, and industrials. In the markets we serve, we leverage our differentiated materials, equipment and services; iconic brands; well-established customer relationships; and global scale and market access. Our portfolio of packaging solutions includes Cryovac® brand food packaging, Sealed Air® brand protective packaging, Autobag® brand automated packaging systems, Bubble Wrap® brand packaging, and SEE Automation solutions.
The Company’s segment reporting structure consists of two reportable segments, Food and Protective, and a Corporate category. One of the components of our Reinvent SEE business transformation is to enhance the operational efficiency of the Company by acting as “One SEE”. To that end, organizations and teams focused solely on Food or Protective have merged to bring focus on the strategic direction of the total Company. Karl Deily stepped down from his position as Senior Vice President and Chief Commercial Officer effective as of December 31, 2020 and will continue to serve the Company in an advisory role until his retirement on April 2, 2021. Effective January 1, 2021, Sealed Air's regional leaders, consisting of the President of Asia Pacific (“APAC”), the President of Europe, Middle East and Africa (“EMEA”), and the President of the Americas, assumed Mr. Deily's responsibilities on a regional basis, reporting directly to the President and Chief Executive Officer. Notwithstanding these actions, the Company's chief operating decision maker continues to review and assess performance and make operating decisions based on the Food and Protective reporting structure. We continue to conclude that Food and Protective represents our reportable segments under FASB ASC Topic 280 as of December 31, 2020.
The Company’s Food and Protective segments are considered reportable segments under FASB ASC Topic 280. Our reportable segments are aligned with similar groups of products and customers. Corporate includes certain costs that are not allocated to or monitored by the reportable segments' management. See Note 6, “Segments,” for additional information.
In the second quarter 2020, we renamed our reporting segments from Food Care to Food and from Product Care to Protective. This segment reporting name change aligns with our use internally and in the markets we serve. There was no change in the composition of the segments and no impact on prior period results of our reporting segments.
Business Environment and Overview
We employ sales, marketing and customer service personnel throughout the world who sell and market our products to and through a large number of distributors, fabricators, converters, e-Commerce and mail order fulfillment firms, and contract packaging firms as well as directly to end-users such as food processors, food service businesses, supermarket retailers, lodging, retail pharmaceutical companies, healthcare facilities, medical device manufacturers, and other manufacturers. We generally do not impose annual minimum purchase volume requirements on our distributors. Returns from our distributors in 2020 were not material. In 2020, 2019 or 2018, no customer or affiliated group of customers accounted for 10% or more of our consolidated net sales.
On a consolidated basis, there is minimal seasonality in the business, with net sales slightly lower in the first quarter and slightly higher towards the end of the third quarter through the fourth quarter. Our consolidated results of operations typically trend directionally the same as our net sales seasonality. In 2021, we expect our results of operations to trend higher in the second half of the year compared to the first half, largely due to the effects of higher raw material costs along with the timing of corresponding recovery in our selling prices. Formula based pricing lags raw material cost movement by approximately six months. Approximately one-third of Food's sales are subject to formula based pricing, predominantly within North America and APAC. Formula based pricing does not comprise a significant portion of sales in our Protective segment. Historically, net sales in our Food segment have tended to be slightly lower in the first quarter and slightly higher towards the end of the third quarter through the fourth quarter, due to holiday events. Net sales in our Protective segment have also tended to be slightly lower in the first quarter and higher in the mid-third quarter and through the fourth quarter due to the holiday shopping season. However, the extent and timing of our results of operations may be difficult to predict if significant one-time transactions, events or non-recurring charges were to impact our business. Cash flow from operations has tended to be lower in the first quarter and higher in the fourth quarter, reflecting seasonality of sales and working capital changes, including the timing of certain annual incentive compensation payments.
32
Throughout 2020, the COVID-19 pandemic has resulted in anomalies to historical seasonality trends generated by changes in end-consumer behavior, such as an increase in e-Commerce sales, or temporary closures or productivity reductions within our customers' operations. We cannot predict the impact to the markets we serve or the timing or extent of sales due to the prolonged impact or future spread or worsening of the COVID-19 pandemic or future restrictions on commercial activities by governmental agencies to limit future spread of the virus. In addition to COVID-19, other factors may also outweigh the effects of seasonal changes in our net earnings results including, but not limited to, changes in raw materials and other costs, timing of pricing actions, foreign exchange rates, interest rates, taxes and the timing and amount of acquisition synergies and restructuring and other non-recurring charges.
Competition for most of our packaging products is based primarily on packaging performance characteristics, automation, service and price. Since competition is also based upon innovations in packaging technology, we maintain ongoing research and development programs to enable us to maintain technological leadership. Competition is both global and regional in scope and includes numerous smaller, local competitors with limited product portfolios and geographic reach.
Our net sales are sensitive to developments in our customers’ business or market conditions, changes in the global economy, and the effects of foreign currency translation. Our costs can vary materially due to changes in input costs, including petrochemical-related costs (primarily resin costs), which are not within our control. Consequently, our management focuses on reducing those costs that we can control and using petrochemical-based and other raw materials as efficiently as possible. We also believe that our global presence helps to mitigate the impact on the total Company of localized changes in business conditions.
We manage our businesses to generate substantial operating cash flow. We believe that our operating cash flow will permit us to continue to spend on innovative research and development and to invest in our business by means of capital expenditures for property, equipment and acquisitions. Moreover, we expect that our ability to generate substantial operating cash flow should provide us with the flexibility to repay debt and to return capital to our stockholders.
Each issue of our outstanding senior notes imposes limitations on our operations and those of specified subsidiaries. Our Credit Facility contains customary affirmative and negative covenants for credit facilities of this type, including limitations on our indebtedness, liens, investments, restricted payments, mergers and acquisitions, dispositions of assets, transactions with affiliates, amendment of documents and sale leasebacks, and a covenant specifying a maximum leverage ratio of debt to EBITDA. We expect continued compliance with our debt covenants including the covenant leverage ratio over the next 12 months. See Note 14, “Debt and Credit Facilities” for further details.
Non-U.S. GAAP Information
We present financial information that conforms to U.S. GAAP. We also present financial information that does not conform to U.S. GAAP, as our management believes it is useful to investors. In addition, non-U.S. GAAP financial measures are used by management to review and analyze our operating performance and, along with other data, as internal measures for setting annual budgets and forecasts, assessing financial performance, providing guidance and comparing our financial performance with our peers. Non-U.S. GAAP financial measures also provide management with additional means to understand and evaluate the core operating results and trends in our ongoing business by eliminating certain expenses and/or gains (which may not occur in each period presented) and other items that management believes might otherwise make comparisons of our ongoing business with prior periods and peers more difficult, obscure trends in ongoing operations or reduce management’s ability to make useful forecasts. Non-U.S. GAAP information does not purport to represent any similarly titled U.S. GAAP information and is not an indicator of our performance under U.S. GAAP. Investors are cautioned against placing undue reliance on these non-U.S. GAAP financial measures. Further, investors are urged to review and consider carefully the adjustments made by management to the most directly comparable U.S. GAAP financial measure to arrive at these non-U.S. GAAP financial measures, described below.
The non-U.S. GAAP financial metrics exclude certain specified items (“Special Items”), including restructuring charges and restructuring associated costs, certain transaction and other charges related to acquisitions and divestitures, gains and losses related to acquisitions and divestitures, special tax items or tax benefits (collectively, “Tax Special Items”) and certain other items. We evaluate unusual or Special Items on an individual basis. Our evaluation of whether to exclude an unusual or special item for purposes of determining our non-U.S. GAAP financial measures considers both the quantitative and qualitative aspects of the item, including among other things (i) its nature, (ii) whether or not it relates to our ongoing business operations, and (iii) whether or not we expect it to occur as part of our normal business on a regular basis.
When we present Non-U.S. GAAP forward-looking guidance, we do not also provide guidance for the most directly comparable U.S. GAAP financial measures, as they are not available without unreasonable effort due to the high variability, complexity, and low visibility with respect to certain Special Items, including gains and losses on the disposition of businesses,
33
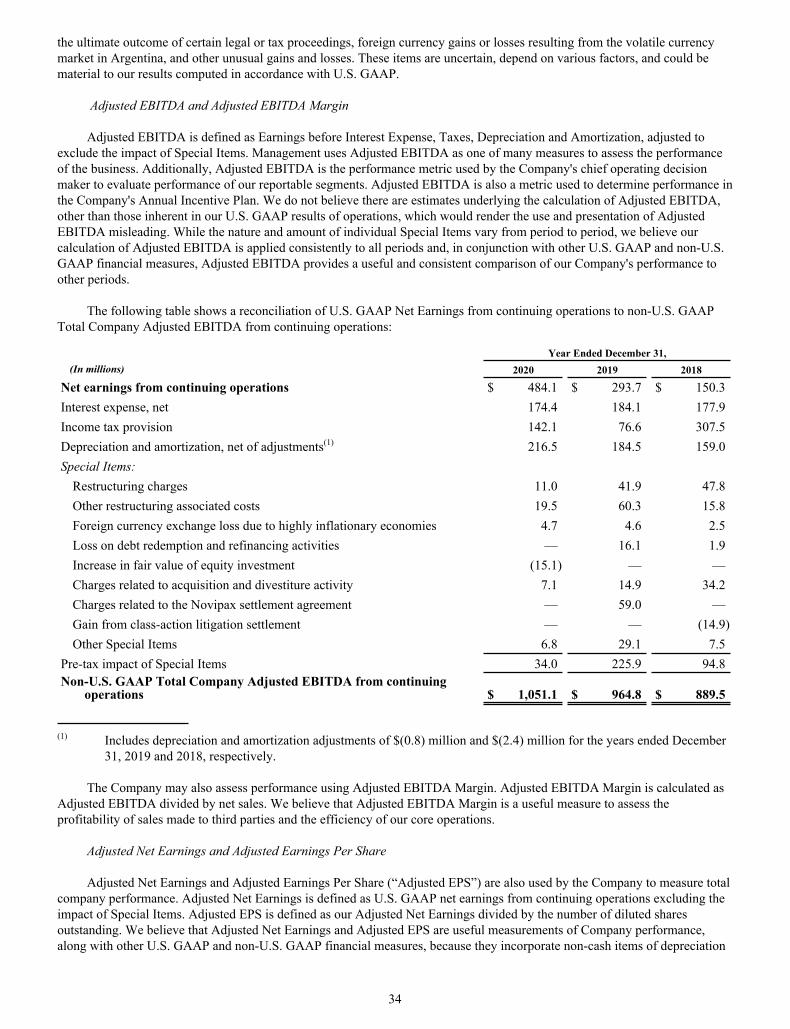
the ultimate outcome of certain legal or tax proceedings, foreign currency gains or losses resulting from the volatile currency market in Argentina, and other unusual gains and losses. These items are uncertain, depend on various factors, and could be material to our results computed in accordance with U.S. GAAP.
Adjusted EBITDA and Adjusted EBITDA Margin
Adjusted EBITDA is defined as Earnings before Interest Expense, Taxes, Depreciation and Amortization, adjusted to exclude the impact of Special Items. Management uses Adjusted EBITDA as one of many measures to assess the performance of the business. Additionally, Adjusted EBITDA is the performance metric used by the Company's chief operating decision maker to evaluate performance of our reportable segments. Adjusted EBITDA is also a metric used to determine performance in the Company's Annual Incentive Plan. We do not believe there are estimates underlying the calculation of Adjusted EBITDA, other than those inherent in our U.S. GAAP results of operations, which would render the use and presentation of Adjusted EBITDA misleading. While the nature and amount of individual Special Items vary from period to period, we believe our calculation of Adjusted EBITDA is applied consistently to all periods and, in conjunction with other U.S. GAAP and non-U.S. GAAP financial measures, Adjusted EBITDA provides a useful and consistent comparison of our Company's performance to other periods.
The following table shows a reconciliation of U.S. GAAP Net Earnings from continuing operations to non-U.S. GAAP Total Company Adjusted EBITDA from continuing operations:
Year Ended December 31,(In millions) 2020 2019 2018
Net earnings from continuing operations $ 484.1 $ 293.7 $ 150.3 Interest expense, net 174.4 184.1 177.9 Income tax provision 142.1 76.6 307.5 Depreciation and amortization, net of adjustments(1) 216.5 184.5 159.0 Special Items:
Restructuring charges 11.0 41.9 47.8 Other restructuring associated costs 19.5 60.3 15.8 Foreign currency exchange loss due to highly inflationary economies 4.7 4.6 2.5 Loss on debt redemption and refinancing activities — 16.1 1.9 Increase in fair value of equity investment (15.1) — — Charges related to acquisition and divestiture activity 7.1 14.9 34.2 Charges related to the Novipax settlement agreement — 59.0 — Gain from class-action litigation settlement — — (14.9) Other Special Items 6.8 29.1 7.5
Pre-tax impact of Special Items 34.0 225.9 94.8 Non-U.S. GAAP Total Company Adjusted EBITDA from continuing
operations $ 1,051.1 $ 964.8 $ 889.5
(1) Includes depreciation and amortization adjustments of $(0.8) million and $(2.4) million for the years ended December
31, 2019 and 2018, respectively.
The Company may also assess performance using Adjusted EBITDA Margin. Adjusted EBITDA Margin is calculated as Adjusted EBITDA divided by net sales. We believe that Adjusted EBITDA Margin is a useful measure to assess the profitability of sales made to third parties and the efficiency of our core operations.
Adjusted Net Earnings and Adjusted Earnings Per Share
Adjusted Net Earnings and Adjusted Earnings Per Share (“Adjusted EPS”) are also used by the Company to measure total company performance. Adjusted Net Earnings is defined as U.S. GAAP net earnings from continuing operations excluding the impact of Special Items. Adjusted EPS is defined as our Adjusted Net Earnings divided by the number of diluted shares outstanding. We believe that Adjusted Net Earnings and Adjusted EPS are useful measurements of Company performance, along with other U.S. GAAP and non-U.S. GAAP financial measures, because they incorporate non-cash items of depreciation
34

and amortization, including stock-based compensation, which impact the overall performance and net earnings of our business. Additionally, Adjusted Net Earnings and Adjusted EPS reflect the impact of our Adjusted Tax Rate and interest expense on a net and per share basis. While the nature and amount of individual Special Items vary from period to period, we believe our calculation of Adjusted Net Earnings and Adjusted EPS is applied consistently to all periods and, in conjunction with other U.S. GAAP and non-U.S. GAAP financial measures, Adjusted Net Earnings and Adjusted EPS provide a useful and consistent comparison of our Company's performance to other periods.
The following table shows a reconciliation of U.S. GAAP Net Earnings and Diluted Earnings per Share from continuing operations to Non-U.S. GAAP Adjusted Net Earnings and Adjusted EPS from continuing operations.
Year Ended December 31, 2020 2019 2018
(In millions, except per share data)Net
EarningsDiluted
EPSNet
EarningsDiluted
EPSNet
EarningsDiluted
EPSU.S. GAAP net earnings and diluted EPS from
continuing operations(1) $ 484.1 $ 3.10
$ 293.7
$ 1.89 $ 150.3 $ 0.94
Special Items(2) 14.3 0.09
145.0
0.93 250.6 1.56
Non-U.S. GAAP adjusted net earnings and adjusted EPS available from continuing operations $ 498.4
$ 3.19
$ 438.7
$ 2.82 $ 400.9
$ 2.50
Weighted average number of common shares outstanding – Diluted 156.0
155.2
160.2
(1) Net earnings per common share are calculated under the two-class method.(2) Includes pre-tax Special Items, less Tax Special Items and the tax impact of Special Items as seen in the following
calculation of non-U.S. GAAP Adjusted income tax rate.
Adjusted Tax Rate
We also present our adjusted income tax rate (“Adjusted Tax Rate”). The Adjusted Tax Rate is a measure of our U.S. GAAP effective tax rate, adjusted to exclude the tax impact from the Special Items that are excluded from our Adjusted Net Earnings and Adjusted EPS metrics as well as expense or benefit from any special taxes or Tax Special Items. The Adjusted Tax Rate is an indicator of the taxes on our core business. The tax circumstances and effective tax rate in the specific countries where the Special Items occur will determine the impact (positive or negative) to the Adjusted Tax Rate. While the nature and amount of Tax Special Items vary from period to period, we believe our calculation of the Adjusted Tax Rate is applied consistently to all periods and, in conjunction with our U.S. GAAP effective income tax rate, the Adjusted Tax Rate provides a useful and consistent comparison of the impact that tax expense has on our Company's performance.
The following table shows our calculation of the non-U.S. GAAP Adjusted income tax rate:
Year Ended December 31,(In millions, except per share data) 2020 2019 2018
U.S. GAAP Earnings before income tax provision from continuing operations $ 626.2 $ 370.3 $ 457.8 Pre-tax impact of Special Items 34.0 225.9 94.8 Non-U.S. GAAP Adjusted Earnings before income tax provision from continuing operations $ 660.2 $ 596.2 $ 552.6
U.S. GAAP Income tax provision from continuing operations $ 142.1 $ 76.6 $ 307.5 Tax Special Items(1) 12.1 25.5 (178.3) Tax impact of Special Items(2) 7.6 55.4 22.5
Non-U.S. GAAP Adjusted Income tax provision from continuing operations $ 161.8 $ 157.5 $ 151.7
U.S. GAAP Effective income tax rate 22.7 % 20.7 % 67.2 %Non-U.S. GAAP Adjusted income tax rate 24.5 % 26.4 % 27.5 %
35

(1) For the year ended December 31, 2020, Tax Special Items reflect net benefits from audit settlements and retroactive application of new GILTI regulations, offset by withholding expense related to cash repatriation initiatives. For the year ended December 31, 2019, Tax Special Items reflect net benefits from tax optimization initiatives and research and development credits. For the year ended December 31, 2018, the Tax Special Items included $222 million of expense for the one-time tax on unrepatriated earnings (U.S. Tax Reform Transition Tax), partially offset by the release of valuation allowances associated with tax initiatives
(2) The tax rate used to calculate the tax impact of Special Items is based on the jurisdiction in which the item was recorded.
Organic and Constant Dollar Measures
In our “Net Sales by Geographic Region,” “Net Sales by Segment” and in some of the discussions and tables that follow, we exclude the impact of foreign currency translation when presenting net sales information, which we define as “constant dollar” and we exclude acquisitions in the first year after closing, divestiture activity and the impact of foreign currency translation when presenting net sales information, which we define as “organic.” Changes in net sales excluding the impact of foreign currency translation and/or acquisition and divestiture activity are non-U.S. GAAP financial measures. As a worldwide business, it is important that we consider the effects of foreign currency translation when we view our results and plan our strategies. Nonetheless, we cannot control changes in foreign currency exchange rates. Consequently, when our management analyzes our financial results including performance metrics such as sales, cost of goods sold or selling, general and administrative expense, to measure the core performance of our business, we may exclude the impact of foreign currency translation by translating our current period results at prior period foreign currency exchange rates. We also may exclude the impact of foreign currency translation when making incentive compensation determinations. As a result, our management believes that these presentations are useful internally and may be useful to investors.
Refer to these specific tables presented later in our Management’s Discussion and Analysis of Financial Condition and Results of Operations for reconciliations of these non-U.S. GAAP financial measures to their most directly comparable U.S. GAAP measures.
Free Cash Flow
In addition to net cash provided by operating activities, we use free cash flow as a useful measure of performance and an indication of the strength and ability of our operations to generate cash. We define free cash flow as cash provided by operating activities less capital expenditures (which is classified as an investing activity). Free cash flow is not defined under U.S. GAAP. Therefore, free cash flow should not be considered a substitute for net income or cash flow data prepared in accordance with U.S. GAAP and may not be comparable to similarly titled measures used by other companies. Free cash flow does not represent residual cash available for discretionary expenditures, including certain debt servicing requirements or non-discretionary expenditures that are not deducted from this measure.
Refer to the specific tables presented later in our Management’s Discussion and Analysis of Financial Condition and Results of Operations under Analysis of Historical Cash Flow for reconciliations of these non-U.S. GAAP financial measures to their most directly comparable U.S. GAAP measures.
Executive Summary for 2020
COVID-19 presented new challenges for Sealed Air's global operations throughout 2020. While focusing on the health and safety of our employees, suppliers and customers globally, we continue to operate and serve customers' needs, with only limited facility closures as a result of initial government orders in response to the pandemic. Our local, regional and corporate crisis management teams remain active and business continuity plans remain in effect.
Since March 2020, there has been an imbalance across our end-markets due to changes in consumer behaviors, modifications made by our customers, governmental restrictions and other COVID-19 related factors. Within our Food reporting segment, there has been strong demand in retail channels with continuing softness in food service. Food processors are working hard to meet increased retail demand while balancing labor shortages and social distancing within their operations. In Protective, e-Commerce, retail and logistics exhibited strength throughout the year due to shifts in consumer behavior. The growth in e-Commerce, logistics and fulfillment was offset by industrial end-markets which were soft during the year.
In 2020, we launched our SEE Automation Solutions strategy. We seek to solve our customers’ automation needs and provide a differentiated value proposition to our customers including automated equipment, services and materials. With SEE
36

Automation, we are taking an integrated solutions approach and looking for opportunities to help customers eliminate waste, simplify processes, remove people from harm's way and drive 'touchless' operations. Across both our segments, capital-intensive equipment and automated solutions were negatively impacted during the first half of 2020 by the slowdown on capital expenditures by our customers, as well as order and installation delays due to social distancing measures. However, our equipment and automated solutions business increased in the second half of 2020 as customers resumed essential purchases and began to invest in automation.
We continue to execute our Reinvent SEE business transformation, focused on the 4P'SSM: Performance, People, Products, Process and Sustainability. During the year, Reinvent SEE delivered incremental Adjusted EBITDA benefits of $118 million. The full year benefits to Adjusted EBITDA from Reinvent SEE were partially offset by negative foreign currency impacts and higher expenses associated with labor inflation, incentive compensation and investments in the business. We expect the Reinvent SEE business transformation to deliver incremental cost benefits to Adjusted EBITDA of approximately $65 million in 2021 compared to 2020. We also expect that the capabilities and governance processes established through the Reinvent SEE business transformation will transition well into our SEE Operating Model and an on-going continuous improvement system and enable us to generate additional savings and growth opportunities beyond 2021.
For the year ended December 31, 2020, we incurred approximately $31 million, or $23 million net of tax, in restructuring and restructuring associated charges primarily related to our Reinvent SEE business transformation initiatives. Cash payments, including restructuring payments related to our Reinvent SEE business transformation and legacy programs, were $74 million. See Note 12, “Restructuring Activities,” for additional details regarding each of the Company’s restructuring programs.
In 2020, the Company's net sales increased $112 million or 2% to $4,903 million, primarily driven by incremental contributions from the 2019 acquisition of Automated Packaging Systems. Foreign currency had a negative impact on net sales of $82 million or 2%. Food's net sales decreased $55 million or 2% in 2020. The decrease was driven by the impact of unfavorable foreign currency. Excluding currency headwinds, Food net sales increased $27 million or 1% on favorable volume and pricing trends and contributions from two small acquisitions made in 2019. In Protective, net sales increased $167 million or 9%, including $166 million from the Automated Packaging Systems acquisition noted above. See Note 3, “Revenue Recognition, Contracts with Customers,” for additional details regarding revenue recognition.
Impact of COVID-19
On March 11, 2020, the World Health Organization declared the Coronavirus Disease 2019 (“COVID-19”) outbreak as a global pandemic. Additionally, many international heads of state, including the President of the United States, declared the COVID-19 outbreak to be a national emergency in their respective countries. In response to these declarations and the rapid spread of COVID-19 across many countries, governmental agencies around the world (including federal, state and local governments in the U.S.) implemented varying degrees of restrictions on social and commercial activities to promote social distancing in an effort to slow the spread of the illness. These measures, as well as future measures, had and will continue to have a significant adverse impact upon many sectors of the global economy. Additionally, the virus continues to spread in some parts of the world, including regions of the U.S.
We continue to monitor the impact that COVID-19 has on all aspects of our business and geographies, including the impact on our employees, customers, suppliers, business partners and distribution channels. Our crisis management teams, which are comprised of cross functional and regional leaders, continue to assess the evolving situation and implement business continuity plans at both the regional and headquarter levels. See Part I, Item 1A, “Risk Factors,” above for additional risks related to the COVID-19 pandemic.
We cannot predict the impact on our operations or markets we serve due to the future spread or worsening of the COVID-19 pandemic or future restrictions on commercial activities by governmental agencies to limit the spread of the virus.
Employee Health and Safety and Business Continuity
The health and safety of Sealed Air’s employees, suppliers and customers globally continues to be the Company’s top priority. Safety measures remain in place at Sealed Air sites such as: enhanced cleaning procedures, employee temperature checks, use of personal protective equipment for location-dependent workers, social distancing measures within operating sites, remote work arrangements for non-location dependent employees, visitor access restrictions and limitations on travel.
In remote working environments, we continue our efforts to mitigate information technology risks including failures in the physical infrastructure or operating systems that support our businesses and customers, or cyber attacks and security breaches of our networks or systems. Additionally, we continue to execute all activities related to our internal control over financial
37

reporting in our remote environment. There has not been any change in our internal control over financial reporting during the year ended December 31, 2020 that has materially affected, or is reasonably likely to materially affect, our internal control over financial reporting.
Supply Chain and Operations
Sealed Air's global operations continue to operate and serve customers' needs. We experienced limited facility closures in 2020 as a result of initial government orders in response to the pandemic. Additionally, in some jurisdictions, we have at times reduced production capacity due to local social distancing requirements which limit the number of employees at any given time in our facilities. These instances have not had a material impact on our operations to date. We continue to closely monitor our location-dependent operations.
The impact of COVID-19 has resulted in approximately $16 million in unanticipated net expenses for the year ended December 31, 2020. These costs included additional personal protective gear, cleaning and other health and hygiene supplies and related expenses; higher employment costs related to COVID-19; and incremental freight due to sourcing changes along with other higher manufacturing related costs, net of direct government assistance.
The health of our workforce, and our ability to meet staffing needs in our manufacturing facilities, distribution of our products and other critical functions are key to our operations.
Markets We Serve
Early during the implementation of initial commercial and social restrictions due to the pandemic, employees within “Food and Agriculture” and “Transportation and Logistics” sectors, including their respective supply chains such as packaging material providers, were deemed “Essential Critical Infrastructure Workers” by the U.S. Department of Homeland Security and similarly by other international governmental agencies. These designations covered the majority of Sealed Air employees and allowed us to continue operations in order to serve our customers.
Some sectors, such as industrial goods, capital-intensive equipment and parts of the food industry including food service and restaurants have experienced adverse impacts as a result of the pandemic. Early in the pandemic, sales of capital-intensive equipment that serves food market segments was negatively impacted due to customers' re-evaluation of investments and delays due to restrictions on third-party visitors and installations in light of current social distancing measures. However, our equipment solutions business increased in the second half of the year as customers began to resume essential investments. Some end-segments of our business experienced increased demand from shifts in consumer behavior, including e-Commerce and fulfillment within our Protective segment.
Liquidity and Financial Position
As of December 31, 2020, Sealed Air had approximately $1.7 billion of liquidity available, comprised of $549 million in cash and $1,146 million of undrawn, committed credit facilities. The Company does not have long-term debt maturing until August 2022. See Note 10, “Accounts Receivable Securitization Programs” and Note 14, “Debt and Credit Facilities” for further details.
38

Highlights of Financial Performance
Below are the highlights of our financial performance for the three years ended December 31, 2020, 2019 and 2018.
Year Ended December 31, % Change(In millions, except per share amounts) 2020 2019 2018 2020 vs. 2019 2019 vs. 2018
Net sales $ 4,903.2 $ 4,791.1 $ 4,732.7 2.3 % 1.2 %Gross profit $ 1,609.3 $ 1,564.8 $ 1,502.1 2.8 % 4.2 %As a % of net sales 32.8 % 32.7 % 31.7 %Operating profit $ 788.1 $ 578.5 $ 656.3 36.2 % (11.9) %As a % of net sales 16.1 % 12.1 % 13.9 %Net earnings from continuing operations $ 484.1 $ 293.7 $ 150.3 64.8 % 95.4 %Gain (Loss) on sale of discontinued operations, net of tax 18.8 (30.7) 42.8 # #Net earnings $ 502.9 $ 263.0 $ 193.1 91.2 % 36.2 %Basic:Continuing operations $ 3.12 $ 1.90 $ 0.94 64.2 % #Discontinued operations 0.12 (0.20) 0.27 # #Net earnings per common share - basic $ 3.24 $ 1.70 $ 1.21 90.6 % 40.5 %Diluted:Continuing operations $ 3.10 $ 1.89 $ 0.94 64.0 % #Discontinued operations 0.12 (0.20) 0.26 # #Net earnings per common share - diluted $ 3.22 $ 1.69 $ 1.20 90.5 % 40.8 %Weighted average number of common shares
outstanding:Basic 155.2 154.3 159.4 Diluted 156.0 155.2 160.2 Non-U.S. GAAP Total Company Adjusted EBITDA
from continuing operations(1) $ 1,051.1 $ 964.8 $ 889.5 8.9 % 8.5 %Non-U.S. GAAP Adjusted EPS from continuing
operations(2) $ 3.19 $ 2.82 $ 2.50 13.1 % 12.8 %
# Denotes a variance greater than or equal to 100% or equal to or less than (100)%. (1) See “Non-U.S. GAAP Information” for a reconciliation of U.S. GAAP net earnings from continuing operations to non-
U.S. GAAP Total Company Adjusted EBITDA from continuing operations.(2) See “Non-U.S. GAAP Information” for a reconciliation of U.S. GAAP net earnings and diluted earnings per share
from continuing operations to our non-U.S. GAAP Adjusted Net Earnings and Adjusted EPS from continuing operations.
Foreign Currency Translation Impact on Consolidated Financial Results
Since we are a U.S. domiciled company, we translate our foreign currency-denominated financial results into U.S. dollars. Due to the changes in the value of foreign currencies relative to the U.S. dollar, translating our financial results from foreign currencies to U.S. dollars may result in a favorable or unfavorable impact. Historically, the most significant currencies that have impacted the translation of our consolidated financial results are the euro, the Australian dollar, the Mexican peso, the British pound, the Canadian dollar, the New Zealand dollar, the Brazilian real and the Chinese renminbi.
The following table presents the approximate favorable or (unfavorable) impact foreign currency translation had on certain of our consolidated financial results:
39

(In millions) 2020 vs. 2019 2019 vs. 2018
Net sales $ (81.8) $ (137.2) Cost of sales 60.0 98.4 Selling, general and administrative expenses 5.6 16.3 Net earnings (8.7) (15.7) Non-U.S. GAAP Adjusted EBITDA (15.6) (25.3)
Net Sales by Geographic Region
The following tables present the components of the change in net sales by geographic region for the year ended December 31, 2020 compared with 2019 and for the year ended December 31, 2019 compared with 2018.
(In millions) North America EMEA APAC South America Total2019 Net Sales $ 2,828.1 59.0 % $ 1,010.4 21.1 % $ 718.8 15.0 % $ 233.8 4.9 % $ 4,791.1 100.0 %
Price (36.5) (1.3) % 1.7 0.2 % (1.0) (0.1) % 35.0 15.0 % (0.8) — %Volume(1) 21.6 0.8 % (14.8) (1.5) % 11.5 1.6 % 4.0 1.7 % 22.3 0.4 %
Total organic change (non-U.S. GAAP) (14.9) (0.5) % (13.1) (1.3) % 10.5 1.5 % 39.0 16.7 % 21.5 0.4 %
Acquisition 133.5 4.7 % 33.0 3.3 % 5.6 0.7 % 0.3 0.1 % 172.4 3.6 %Total constant dollar change (non-U.S. GAAP) 118.6 4.2 % 19.9 2.0 % 16.1 2.2 % 39.3 16.8 % 193.9 4.0 %Foreign currency translation (18.6) (0.7) % 1.3 0.1 % 1.1 0.2 % (65.6) (28.0) % (81.8) (1.7) %Total change (U.S. GAAP) 100.0 3.5 % 21.2 2.1 % 17.2 2.4 % (26.3) (11.2) % 112.1 2.3 %
2020 Net Sales $ 2,928.1 59.7 % $ 1,031.6 21.0 % $ 736.0 15.0 % $ 207.5 4.2 % $ 4,903.2 100.0 %
(In millions) North America EMEA APAC South America Total2018 Net Sales $ 2,734.9 57.8 % $ 1,038.5 21.9 % $ 729.8 15.4 % $ 229.5 4.8 % $ 4,732.7 100.0 %
Price (7.3) (0.3) % 1.0 0.1 % (0.6) (0.1) % 49.4 21.5 % 42.5 0.9 %Volume(1) (42.8) (1.5) % (3.8) (0.4) % (6.9) (0.9) % 11.6 5.1 % (41.9) (0.9) %
Total organic change (non-U.S. GAAP) (50.1) (1.8) % (2.8) (0.3) % (7.5) (1.0) % 61.0 26.6 % 0.6 — %
Acquisition 147.5 5.4 % 24.1 2.4 % 23.2 3.2 % 0.2 0.1 % 195.0 4.1 %Total constant dollar change (non-U.S. GAAP) 97.4 3.6 % 21.3 2.1 % 15.7 2.2 % 61.2 26.7 % 195.6 4.1 %Foreign currency translation (4.2) (0.2) % (49.4) (4.8) % (26.7) (3.7) % (56.9) (24.8) % (137.2) (2.9) %Total change (U.S. GAAP) 93.2 3.4 % (28.1) (2.7) % (11.0) (1.5) % 4.3 1.9 % 58.4 1.2 %
2019 Net Sales $ 2,828.1 59.0 % $ 1,010.4 21.1 % $ 718.8 15.0 % $ 233.8 4.9 % $ 4,791.1 100.0 %
(1) Our volume reported above includes the net impact of changes in unit volume as well as the period-to-period change in
the mix of products sold.
Net Sales by Segment
The following tables present the components of change in net sales by our segment reporting structure for the year ended December 31, 2020 compared with 2019 and for the year ended December 31, 2019 compared with 2018.
40

(In millions) Food Protective Total Company2019 Net Sales $ 2,880.5 60.1 % $ 1,910.6 39.9 % $ 4,791.1 100.0 %
Price 14.2 0.5 % (15.0) (0.8) % (0.8) — %Volume(1) 6.6 0.2 % 15.7 0.8 % 22.3 0.4 %Total organic change (non-U.S. GAAP) 20.8 0.7 % 0.7 — % 21.5 0.4 %Acquisitions 6.5 0.2 % 165.9 8.7 % 172.4 3.6 %Total constant dollar change (non-U.S.
GAAP) 27.3 0.9 % 166.6 8.7 % 193.9 4.0 %Foreign currency translation (82.3) (2.8) % 0.5 — % (81.8) (1.7) %Total change (U.S. GAAP) (55.0) (1.9) % 167.1 8.7 % 112.1 2.3 %
2020 Net Sales $ 2,825.5 57.6 % $ 2,077.7 42.4 % $ 4,903.2 100.0 %
(In millions) Food Protective Total Company2018 Net Sales $ 2,908.1 61.4 % $ 1,824.6 38.6 % 4,732.7 100.0 %
Price 32.7 1.1 % 9.8 0.5 % $ 42.5 0.9 %Volume(1) 30.3 1.1 % (72.2) (3.9) % (41.9) (0.9) %Total organic change (non-U.S. GAAP) 63.0 2.2 % (62.4) (3.4) % 0.6 — %Acquisitions 16.6 0.5 % 178.4 9.8 % 195.0 4.1 %Total constant dollar change (non-U.S.
GAAP) 79.6 2.7 % 116.0 6.4 % 195.6 4.1 %Foreign currency translation (107.2) (3.6) % (30.0) (1.7) % (137.2) (2.9) %Total change (U.S. GAAP) (27.6) (0.9) % 86.0 4.7 % 58.4 1.2 %
2019 Net Sales $ 2,880.5 60.1 % $ 1,910.6 39.9 % $ 4,791.1 100.0 %
(1) Our volume reported above includes the net impact of changes in unit volume as well as the period-to-period change in
the mix of products sold.
Food
2020 compared with 2019
As reported, net sales decreased $55 million, or 2%, in 2020 compared with 2019. Foreign currency had a negative impact of $82 million. On a constant dollar basis, net sales increased $27 million, or 1%, in 2020 compared with 2019 primarily due to the following:
• favorable price of $14 million, primarily in South America driven by U.S. dollar-based indexed pricing, partially offset by formula-based pricing declines in North America;
• higher volume of $7 million, primarily driven by increased demand for retail protein packaging and equipment sales, partially offset by a decline in global food service sales driven by COVID-19 stay-at-home restrictions; and
• contributions from acquisition activities of approximately $7 million.
2019 compared with 2018
As reported, net sales decreased $28 million, or 1% in 2019 compared with 2018. Foreign currency had a negative impact of $107 million. On a constant dollar basis, net sales increased $80 million, or 3% in 2019 compared with 2018 primarily due to the following:
• favorable price of $33 million, primarily in South America driven by U.S. dollar-based indexed pricing, partially offset by North America, which was driven by formula-based pricing;
• higher volume of $30 million, primarily in North America, South America and APAC, partially offset by EMEA; and• contributions from acquisition activities of $17 million.
41
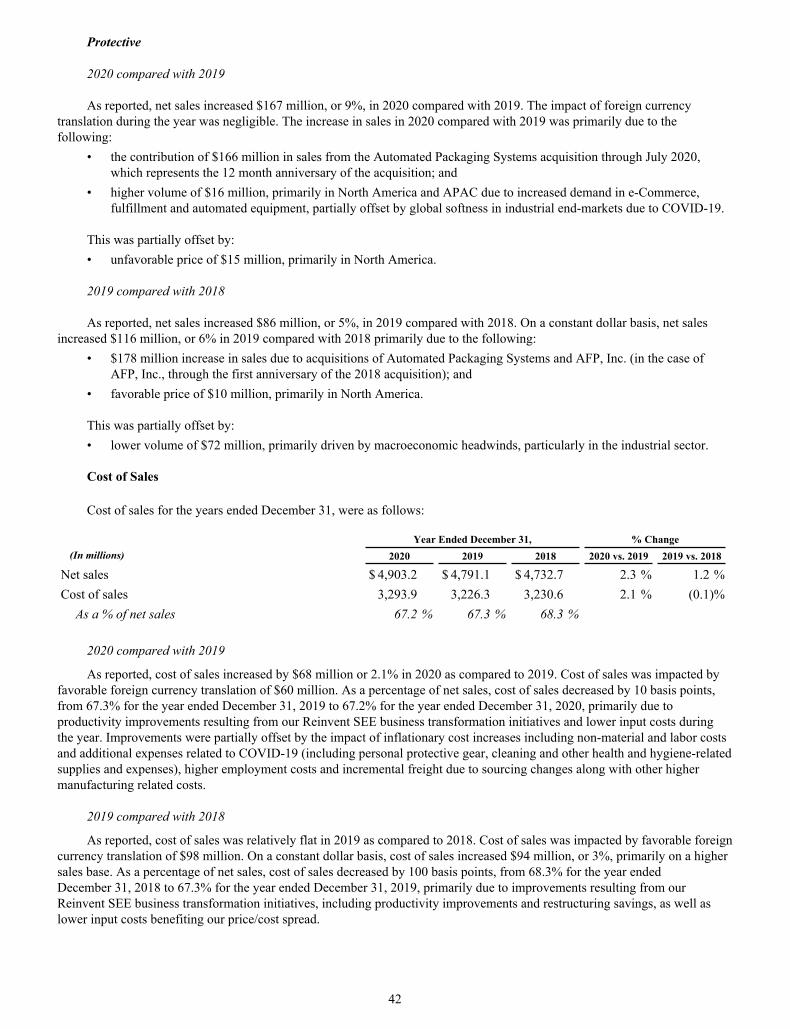
Protective
2020 compared with 2019
As reported, net sales increased $167 million, or 9%, in 2020 compared with 2019. The impact of foreign currency translation during the year was negligible. The increase in sales in 2020 compared with 2019 was primarily due to the following:
• the contribution of $166 million in sales from the Automated Packaging Systems acquisition through July 2020, which represents the 12 month anniversary of the acquisition; and
• higher volume of $16 million, primarily in North America and APAC due to increased demand in e-Commerce, fulfillment and automated equipment, partially offset by global softness in industrial end-markets due to COVID-19.
This was partially offset by:• unfavorable price of $15 million, primarily in North America.
2019 compared with 2018
As reported, net sales increased $86 million, or 5%, in 2019 compared with 2018. On a constant dollar basis, net sales increased $116 million, or 6% in 2019 compared with 2018 primarily due to the following:
• $178 million increase in sales due to acquisitions of Automated Packaging Systems and AFP, Inc. (in the case of AFP, Inc., through the first anniversary of the 2018 acquisition); and
• favorable price of $10 million, primarily in North America.
This was partially offset by:• lower volume of $72 million, primarily driven by macroeconomic headwinds, particularly in the industrial sector.
Cost of Sales
Cost of sales for the years ended December 31, were as follows:
Year Ended December 31, % Change
(In millions) 2020 2019 2018 2020 vs. 2019 2019 vs. 2018
Net sales $ 4,903.2 $ 4,791.1 $ 4,732.7 2.3 % 1.2 %Cost of sales 3,293.9 3,226.3 3,230.6 2.1 % (0.1) %
As a % of net sales 67.2 % 67.3 % 68.3 %
2020 compared with 2019
As reported, cost of sales increased by $68 million or 2.1% in 2020 as compared to 2019. Cost of sales was impacted by favorable foreign currency translation of $60 million. As a percentage of net sales, cost of sales decreased by 10 basis points, from 67.3% for the year ended December 31, 2019 to 67.2% for the year ended December 31, 2020, primarily due to productivity improvements resulting from our Reinvent SEE business transformation initiatives and lower input costs during the year. Improvements were partially offset by the impact of inflationary cost increases including non-material and labor costs and additional expenses related to COVID-19 (including personal protective gear, cleaning and other health and hygiene-related supplies and expenses), higher employment costs and incremental freight due to sourcing changes along with other higher manufacturing related costs.
2019 compared with 2018
As reported, cost of sales was relatively flat in 2019 as compared to 2018. Cost of sales was impacted by favorable foreign currency translation of $98 million. On a constant dollar basis, cost of sales increased $94 million, or 3%, primarily on a higher sales base. As a percentage of net sales, cost of sales decreased by 100 basis points, from 68.3% for the year ended December 31, 2018 to 67.3% for the year ended December 31, 2019, primarily due to improvements resulting from our Reinvent SEE business transformation initiatives, including productivity improvements and restructuring savings, as well as lower input costs benefiting our price/cost spread.
42

Selling, General and Administrative Expenses
Selling, general and administrative (“SG&A”) expenses for the years ended December 31, are included in the table below.
Year Ended December 31, % Change(In millions) 2020 2019 2018 2020 vs. 2019 2019 vs. 2018
Selling, general and administrative expenses $ 772.7 $ 915.5 $ 782.3 (15.6) % 17.0 %As a % of net sales 15.8 % 19.1 % 16.5 %
2020 compared with 2019
As reported, SG&A expenses decreased $143 million, or 16%, in 2020 as compared to 2019. SG&A expenses were impacted by favorable foreign currency translation of $6 million. On a constant dollar basis, SG&A expenses decreased approximately $137 million, or 15%. The decrease was primarily driven by a $59 million charge related to a settlement agreement with Novipax in 2019 (See Note 20, “Commitments and Contingencies,” for additional details regarding the Novipax settlement) as well as lower restructuring associated costs and lower professional service fees, including legal fees, associated with Special Items. Travel and entertainment related expenses within SG&A were $19 million lower in 2020 compared to the prior year, primarily resulting from COVID-19 stay-at-home orders and travel restrictions. SG&A has also benefited from reductions driven by our Reinvent SEE business transformation, including restructuring associated savings. These improvements were partially offset by the impact of higher incentive compensation expense and labor cost inflation.
2019 compared with 2018
As reported, SG&A expenses increased $133 million, or 17%, in 2019 as compared to 2018. SG&A expenses were impacted by favorable foreign currency translation of $16 million. On a constant dollar basis, SG&A expenses increased approximately $150 million, or 19%. The increase in SG&A expenses is a result of $60 million in restructuring associated charges primarily related to our Reinvent SEE business transformation initiatives, the $59 million charge associated with the Novipax settlement, incremental SG&A expense from recent acquisitions, including Automated Packaging Systems and AFP, of $39 million and $11 million due to higher incentive compensation expense. Restructuring associated charges described above primarily relate to fees paid to third-party consultants in support of our Reinvent SEE business transformation and costs related to property consolidations resulting from Reinvent SEE. These expenses were partially offset by benefits attributable to our Reinvent SEE business transformation initiatives.
Amortization Expense of Intangible Assets Acquired
Amortization expense of intangible assets acquired for the years ended December 31, were as follows:
Year Ended December 31, % Change(In millions) 2020 2019 2018 2020 vs. 2019 2019 vs. 2018
Amortization expense of intangible assets acquired $ 37.5 $ 28.9 $ 15.7 29.8 % 84.1 %
As a % of net sales 0.8 % 0.6 % 0.3 %
The increase in amortization expense of intangibles for the year ended December 31, 2020 was primarily due to an increase in amortization for capitalized software and the full year impact of intangible amortization associated with the acquisition of Automated Packaging Systems in August 2019.
The increase in amortization expense of intangibles for the year ended December 31, 2019 was primarily related to the acquisition of Automated Packaging Systems. The most significant impact on year over year increase in amortization expense was backlog acquired in the Automated Packaging Systems purchase which was amortized over 5 months. The Company also acquired intangibles related to technology, trademarks and tradenames and customer relationships from Automated Packaging Systems.
See Note 5, “Acquisitions,” for additional details regarding the Company's recent acquisition activity.
43

Reinvent SEE Business Transformation and Restructuring Activities
See Note 12, “Restructuring Activities,” for additional details regarding the Company’s restructuring programs discussed below.
In December 2018 the Sealed Air Board of Directors approved a three-year restructuring program related to the Reinvent SEE business transformation.
Sealed Air has combined the program associated with the Reinvent SEE business transformation with its previously existing restructuring program (as combined, “Program”) that was largely related to the elimination of stranded costs following the sale of Diversey. For the year ended December 31, 2020, the Program generated incremental cost benefits of $118 million. Current year benefits include $104 million related to reductions in operating costs, $33 million of which is related to restructuring actions, and $14 million in benefits related to actions impacting price/cost spread. Since the inception of the Program in 2018, we expect the total cost benefits to approximate $355 million by the end of 2021, which implies additional expected cost benefits of approximately $65 million in 2021. We expect the Program spend for the full year 2021 to be in the range of $25 million and $45 million.
For the year ended December 31, 2020, we recorded restructuring expense of $11 million. This was primarily incurred during the second quarter of 2020. During the fourth quarter of 2020, the Company recorded net restructuring income of $1 million, which was primarily driven by the reversal of headcount-reduction accruals incurred earlier in the year. Throughout the year restructuring expense was highest in North America, which comprised $8 million of the full year expense. We also recorded $20 million in restructuring associated costs for the year ended December 31, 2020. Restructuring associated costs primarily relate to fees paid to third-party consultants in support of the Reinvent SEE business transformation.
The actual timing of future costs and cash payments related to the Program described above are subject to change due to a variety of factors that may cause a portion of the costs, spending and benefits to occur later than expected. In addition, changes in foreign exchange rates may impact future costs, spending, benefits and cost synergies.
Interest Expense, net
Interest expense, net includes the stated interest rate on our outstanding debt, as well as the net impact of capitalized interest, interest income, the effects of terminated interest rate swaps and the amortization of capitalized senior debt issuance costs and credit facility fees, bond discounts, and terminated treasury locks.
Interest expense, net for the years ended December 31, was as follows:
Year Ended December 31, Change(In millions) 2020 2019 2018 2020 vs. 2019 2019 vs. 2018
Interest expense on our various debt instruments: Term Loan A due August 2022(1) $ 8.8 $ 6.8 $ — $ 2.0 $ 6.8 Term Loan A due July 2023(2) 4.9
8.5 8.9
(3.6) (0.4)
Revolving credit facility due July 2023(2) 1.4 1.4 1.9
— (0.5)
6.50% Senior Notes due December 2020(3) — 25.4 28.1
(25.4) (2.7)
4.875% Senior Notes due December 2022 21.6 21.5 21.5 0.1 —
5.25% Senior Notes due April 2023 23.2 23.1 23.1
0.1 —
4.50% Senior Notes due September 2023 21.2 20.7 21.8 0.5 (1.1)
5.125% Senior Notes due December 2024 22.4 22.4 22.4 — —
5.50% Senior Notes due September 2025 22.4 22.4 22.4 — —
4.00% Senior Notes due December 2027(3) 17.5 1.7 — 15.8 1.7 6.875% Senior Notes due July 2033 31.3
31.1 31.0
0.2 0.1
Other interest expense 15.5 19.4 18.2
(3.9) 1.2
Less: capitalized interest (5.6) (8.4) (6.3) 2.8 (2.1)
Less: interest income (10.2) (11.9) (15.1) 1.7 3.2 Total $ 174.4
$ 184.1 $ 177.9
$ (9.7) $ 6.2
44

(1) On August 1, 2019, Sealed Air Corporation, on behalf of itself and certain of its subsidiaries, and Sealed Air Corporation (US) entered into an amendment to its existing senior secured credit facility with Bank of America, N.A., as agent, and the other financial institutions party thereto. The amendment provided for a new incremental term facility in an aggregate principal amount of up to $475 million, to be used, in part, to finance the acquisition of Automated Packaging Systems. See Note 14, "Debt and Credit Facilities," for further details.
(2) On July 12, 2018, the Company and certain of its subsidiaries entered into a third amended and restated credit agreement with respect to its existing senior secured credit facility. See Note 14, “Debt and Credit Facilities,” for further details.
(3) In November 2019, the Company issued $425 million of 4.00% Senior Notes due 2027 and used the proceeds to retire the existing $425 million of 6.50% Senior Notes due 2020. See Note 14, "Debt and Credit Facilities," for further details.
Other Income (Expense), net
Equity investments
We hold strategic investments in other companies. These investments are accounted for under the measurement alternative, described in ASC 321, for equity investments that do not have readily determinable fair values. These investments are measured at cost, less impairment, if any, plus or minus changes resulting from observable price changes in orderly transactions for identical or similar investments of the same issuer. We do not exercise significant influence over these companies. For the year ended December 31, 2020, we recorded an increase in the fair value of these investments of $15 million. The increase in fair value was directly related to an additional round of equity issuance from one investee, issued during the fourth quarter 2020. We concluded this was an observable price change in an orderly transaction for a similar investment of the same issuer. See Note 16, "Fair Value Measurements, Equity Investments and Other Financial Instruments," for further details.
Brazil Tax Credits
Cryovac Brasil Ltda., a Sealed Air subsidiary, received a final decision from the Brazilian court regarding a claim in which Sealed Air contended that certain indirect taxes paid were calculated on an incorrect amount. During the second quarter of 2019, the Company filed a return claim for the tax years of 2015 through 2018; as such, the Company has recorded a $4.8 million gain within other income (expense), net on the Consolidated Statements of Operations in the year ended December 31, 2019. As a result of this case, the Company has been utilizing credits on indirect tax payments since the claim was filed. Pending future and final judicial decisions to be made by the Brazilian Supreme Court, the Company may be able to claim an overpayment of indirect taxes paid prior to 2015, including for the tax years 2010 - 2014 for which the Company has prepared documentation.
Loss on debt redemption
In November 2019, Sealed Air issued $425 million of 4.00% Senior Notes due December 2027. The proceeds were used to repurchase $425 million 6.50% Senior Notes due December 2020. We recognized a $16 million pre-tax loss on the transaction. The loss was primarily driven by the breakage fee on the bond redemption. See Note 14, "Debt and Credit Facilities," for further details.
See Note 23, “Other Income (Expense), net,” for the components of other income (expense), net.
Income Taxes
The table below shows our effective income tax rate (“ETR”).
Year Ended Effective Tax Rate
2020 22.7 %2019 20.7 %2018 67.2 %
45

Our effective income tax rate for the year ended December 31, 2020 was 22.7%. The difference between the Company's effective income tax rate and the U.S. statutory rate of 21% related primarily to state income tax expense and foreign earnings subject to higher tax rates, offset by the benefit from global intangible low-taxed income (“GILTI”) regulations issued by the IRS in 2020, research credits, and a reduction in valuation allowance due to increased profitability in EMEA.
Our effective income tax rate for the year ended December 31, 2019 was 20.7%. The difference between the Company's effective income tax rate and the U.S statutory rate of 21% related primarily to benefits related to tax optimization initiatives associated with the Reinvent SEE business transformation and restructuring activities, prior year research credits and a reduction in valuation allowance, offset by expense related to unrecognized tax benefits and the GILTI provisions.
Our effective income tax rate for the year ended December 31, 2018 was 67.2%. The 2018 effective tax rate includes the benefit of a lower U.S. corporate income tax rate of 21% and also reflects $222 million of expense for tax related to the one-time mandatory tax on previously deferred foreign earnings of U.S. subsidiaries under TCJA (“Transition Tax”). The difference between the Company’s effective income tax rate and the U.S. statutory rate of 21% related primarily to the Transition Tax associated with TCJA, the GILTI provisions enacted as part of TCJA, state income taxes, and foreign earnings subject to higher tax rates, offset by tax benefit for reduction in valuation allowance related to tax initiatives.
Our effective income tax rate depends upon the realization of our net deferred tax assets. We have deferred tax assets related to accruals not yet deductible for tax purposes, state and foreign net operating loss carryforwards, tax credits, employee benefit items, intangibles and other items.
The IRS completed its field examination of our U.S. federal income tax returns for the years 2011 through 2014 in the third quarter of 2020. As previously disclosed, the IRS has proposed to disallow for the 2014 taxable year the entirety of the deduction of the approximately $1.49 billion in settlement payments made pursuant to the Settlement agreement (as defined in Note 20, “Commitments and Contingencies”) and the resulting reduction of our U.S. federal tax liability by approximately $525 million. We continue to believe that we have meritorious defenses to the proposed disallowance and have filed a protest with the IRS. Although, we expected to enter the IRS administrative appeals process in late 2020 or early 2021, upon receipt of our protest, the IRS determined that it needed additional information before transferring the matter to the IRS administrative appeals process. We are currently responding to requests for further information from the IRS and, at this time, cannot predict when we will enter the IRS administrative appeals process, when such process will conclude, or the outcome of such process. It is possible that future developments in this matter could have a material impact on the uncertain tax position balances and results of operations, including cash flows, within the next twelve months.
We have established valuation allowances to reduce our deferred tax assets to an amount that is more likely than not to be realized. Our ability to utilize our deferred tax assets depends in part upon our ability to carryback any losses created by the deduction of these temporary differences, the future income from existing temporary differences, and the ability to generate future taxable income within the respective jurisdictions during the periods in which these temporary differences reverse. If we are unable to generate sufficient future taxable income in the U.S. and certain foreign jurisdictions, or if there is a significant change in the time period within which the underlying temporary differences become taxable or deductible, we could be required to increase our valuation allowances against our deferred tax assets. Conversely, if we have sufficient future taxable income in jurisdictions where we have valuation allowances, we may be able to reduce those valuation allowances. We reported a net increase in our valuation allowance for the year ended December 31, 2020 of $10 million, primarily related to foreign net operating losses. See Note 19, “Income Taxes,” for additional information.
We reported a net benefit for unrecognized tax benefits in the year ended December 31, 2020 of $1 million, primarily related to North America tax positions. Interest and penalties on tax assessments are included in income tax expense.
Net Earnings from Continuing Operations
Net earnings from continuing operations for the years ended December 31, are included in the table below.
Year Ended December 31, % Change(In millions) 2020 2019 2018 2020 vs. 2019 2019 vs. 2018
Net earnings from continuing operations $ 484.1 $ 293.7 $ 150.3 64.8 % 95.4 %
For 2020, net earnings were unfavorably impacted by $14 million of Special Items after tax, which were primarily the result of restructuring and other restructuring associated costs primarily related to our Reinvent SEE business transformation of $31 million ($23 million net of taxes) and charges related to acquisition integrations and divestiture activities of $7
46

million ($5 million net of taxes), partially offset by an increase in the fair value of equity investments of $15 million ($11 million net of taxes). Tax Special Items included the benefit of $12 million, primarily due to benefits from audit settlements and retroactive application of new global intangible low-taxed income (“GILTI”) regulations.
For 2019, net earnings were unfavorably impacted by $145 million of Special Items after tax, which were primarily the result of restructuring and other restructuring associated costs primarily related to our Reinvent SEE business transformation of $102 million ($76 million net of taxes), a $59 million ($44 million net of taxes) charge related to the Novipax settlement, loss on debt redemption and refinancing activities of $16 million ($12 million net of taxes) and charges related to acquisition integrations and divestiture activities of $15 million ($11 million net of taxes).
For 2018, net earnings were unfavorably impacted by $251 million of Special Items. Special Items primarily related to Tax Special Items including $222 million of expense for the one-time Transition Tax, partially offset by the release of valuation allowances associated with tax initiatives. In addition, net earnings were unfavorably impacted by Special Items expenses primarily related to restructuring and other restructuring associated costs of $64 million ($50 million net of taxes), charges related to the sale of Diversey of $21 million ($14 million net of taxes) and charges related to acquisition integrations and divestiture activities of $13 million ($10 million net of taxes), partially offset by gain on class-action litigation proceeds of $15 million ($12 million net of taxes).
Gain (Loss) on Sale of Discontinued Operations, net of tax
Gain (loss) on sale of discontinued operations, net of tax for the years ended December 31, are included in the table below.
Year Ended December 31,(In millions) 2020 2019 2018
Gain (Loss) on sale of discontinued operations, net of tax $ 18.8 $ (30.7) $ 42.8
During 2020, we recorded a net gain of $19 million on the sale of discontinued operations. The gain primarily relates to changes in balance sheet positions associated with the settlement and release reached with Diversey related to a clawback claim connected with the sale of the business. See Note 20, “Commitments and Contingencies,” for additional information.
During 2019, we recorded a net loss of $31 million on sale of discontinued operations. The loss relates primarily to changes in balance sheet positions associated with the sale of Diversey including tax-related indemnification reserves and other receivable or payable positions arising from the sale.
During 2018, we recorded an additional net gain on the sale of Diversey of $43 million, which was related to the final net working capital settlement as well as the release of tax indemnity reserves upon expiration of the statute of limitations.
Adjusted EBITDA by Segment
The Company evaluates performance of the reportable segments based on the results of each segment. The performance metric used by the Company's chief operating decision maker to evaluate performance of our reportable segments is Adjusted EBITDA. We allocate and disclose depreciation and amortization expense to our segments, although depreciation and amortization are not included in the segment performance metric Adjusted EBITDA. We also allocate and disclose restructuring and other charges and impairment of goodwill and other intangible assets by segment, although it is not included in the segment performance metric Adjusted EBITDA since restructuring and other charges and impairment of goodwill and other intangible assets are categorized as Special Items. The accounting policies of the reportable segments and Corporate are the same as those applied to the Consolidated Financial Statements.
See “Non-U.S. GAAP Information” for a reconciliation of U.S. GAAP net earnings from continuing operations to non-U.S. GAAP Total Company Adjusted EBITDA from continuing operations.
47
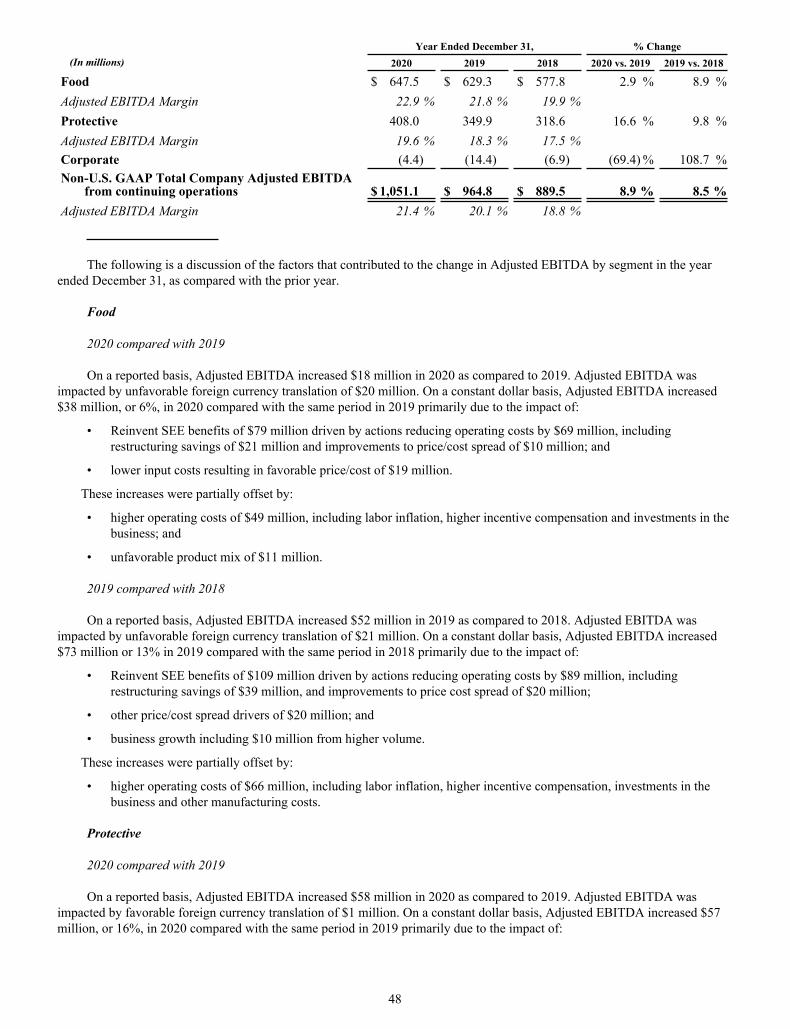
Year Ended December 31, % Change(In millions) 2020 2019 2018 2020 vs. 2019 2019 vs. 2018
Food $ 647.5 $ 629.3 $ 577.8 2.9 % 8.9 %Adjusted EBITDA Margin 22.9 % 21.8 % 19.9 %Protective 408.0 349.9 318.6 16.6 % 9.8 %Adjusted EBITDA Margin 19.6 % 18.3 % 17.5 %Corporate (4.4) (14.4) (6.9) (69.4) % 108.7 %Non-U.S. GAAP Total Company Adjusted EBITDA
from continuing operations $ 1,051.1 $ 964.8 $ 889.5 8.9 % 8.5 %Adjusted EBITDA Margin 21.4 % 20.1 % 18.8 %
The following is a discussion of the factors that contributed to the change in Adjusted EBITDA by segment in the year ended December 31, as compared with the prior year.
Food
2020 compared with 2019
On a reported basis, Adjusted EBITDA increased $18 million in 2020 as compared to 2019. Adjusted EBITDA was impacted by unfavorable foreign currency translation of $20 million. On a constant dollar basis, Adjusted EBITDA increased $38 million, or 6%, in 2020 compared with the same period in 2019 primarily due to the impact of:
• Reinvent SEE benefits of $79 million driven by actions reducing operating costs by $69 million, including restructuring savings of $21 million and improvements to price/cost spread of $10 million; and
• lower input costs resulting in favorable price/cost of $19 million.
These increases were partially offset by:
• higher operating costs of $49 million, including labor inflation, higher incentive compensation and investments in the business; and
• unfavorable product mix of $11 million.
2019 compared with 2018
On a reported basis, Adjusted EBITDA increased $52 million in 2019 as compared to 2018. Adjusted EBITDA was impacted by unfavorable foreign currency translation of $21 million. On a constant dollar basis, Adjusted EBITDA increased $73 million or 13% in 2019 compared with the same period in 2018 primarily due to the impact of:
• Reinvent SEE benefits of $109 million driven by actions reducing operating costs by $89 million, including restructuring savings of $39 million, and improvements to price cost spread of $20 million;
• other price/cost spread drivers of $20 million; and
• business growth including $10 million from higher volume.
These increases were partially offset by:
• higher operating costs of $66 million, including labor inflation, higher incentive compensation, investments in the business and other manufacturing costs.
Protective
2020 compared with 2019
On a reported basis, Adjusted EBITDA increased $58 million in 2020 as compared to 2019. Adjusted EBITDA was impacted by favorable foreign currency translation of $1 million. On a constant dollar basis, Adjusted EBITDA increased $57 million, or 16%, in 2020 compared with the same period in 2019 primarily due to the impact of:
48

• Reinvent SEE benefits of $39 million driven by actions reducing operating costs of $34 million, including restructuring savings of $12 million and improvements to price cost spread of $5 million;
• contributions of $31 million from seven months of incremental Adjusted EBITDA from the Automated Packaging Systems acquisition; and
• the prior year impact of a $7 million non-cash inventory step-up charge associated with the Automated Packaging Systems acquisition.
These increases were partially offset by:
• higher operating costs of $12 million, including labor inflation, higher incentive compensation expense and investments in the business;
• unfavorable price/cost spread of $5 million; and
• unfavorable product mix of $3 million.
2019 compared with 2018
On a reported basis, Adjusted EBITDA increased $31 million in 2019 as compared to 2018. Adjusted EBITDA was impacted by unfavorable foreign currency translation of $6 million. On a constant dollar basis, Adjusted EBITDA increased $37 million, or 12%, in 2019 compared with the same period in 2018 primarily due to the impact of:
• Reinvent SEE benefits of $59 million driven by actions reducing operating costs of $42 million, including restructuring savings of $28 million, and improvements to price cost spread of $17 million;
• other price cost spread drivers of $26 million; and
• contributions from recent acquisitions of $14 million, which is net of the $7 million one-time non-cash inventory step-up charge associated with the Automated Packaging Systems acquisition.
These increases were partially offset by:
• higher operating costs of approximately $34 million, including labor inflation, higher incentive compensation expense, other manufacturing costs and investment in the business; and
• lower volume of $28 million, primarily driven by macroeconomic headwinds, particularly in the industrial sector.
Corporate
2020 compared with 2019
Corporate expenses decreased by $10 million on an as reported basis and $7 million on a constant dollar basis as compared with the same period in 2019, primarily driven by currency transaction gains in 2020 compared to currency transaction losses in 2019.
2019 compared with 2018
Corporate expenses increased by $8 million on an as reported basis and $9 million on a constant dollar basis as compared with the same period in 2018, primarily driven by currency transaction losses associated with emerging market currencies strengthening against the U.S. dollar.
Liquidity and Capital Resources
Principal Sources of Liquidity
Our primary sources of cash are the collection of trade receivables generated from the sales of our products and services to our customers and amounts available under our existing lines of credit, including our senior secured credit facility, and our accounts receivable securitization programs. Our primary uses of cash are payments for operating expenses, investments in working capital, capital expenditures, interest, taxes, stock repurchases, dividends, debt obligations, restructuring expenses and other long-term liabilities. We believe that our current liquidity position and future cash flows from operations will enable us to fund our operations, including all of the items mentioned above, in the next twelve months.
49

As of December 31, 2020, we had cash and cash equivalents of $549 million, of which approximately $304 million, or 55%, was located outside of the U.S. As of December 31, 2020, we had an immaterial amount of cash trapped outside of the U.S. We believe our U.S. cash balances and committed liquidity facilities available to U.S. borrowers are sufficient to fund our U.S. operating requirements and capital expenditures, current debt obligations and dividends. The Company does not expect that in the near term cash located outside of the U.S. will be needed to satisfy its obligations, dividends and other demands for cash in the U.S.
Material Commitments and Contingencies
Settlement Agreement Tax Deduction
The information set forth in Note 20, “Commitments and Contingencies,” under the caption “Settlement Agreement Tax Deduction” is incorporated herein by reference.
Contractual Obligations
The following table summarizes our principal contractual obligations and sets forth the amounts of required or contingently required cash outlays in 2021 and future years:
Payments Due by Years(In millions) 2021 2022-2023 2024-2025 Thereafter Total
Contractual Obligations
Short-term borrowings $ 7.2 $ — $ — $ — $ 7.2 Current portion of long-term debt(1)(3) 23.7 — — — 23.7 Long-term debt(1) — 2,039.6 829.0 887.8 3,756.4 Total debt $ 30.9 $ 2,039.6 $ 829.0 $ 887.8 $ 3,787.3 Interest payments due on long-term debt(2) 165.9 275.9 153.4 265.9 861.1 Operating leases(3) 27.2 33.6 14.7 10.9 86.4 First quarter 2021 quarterly cash dividend declared 24.8 — — — 24.8 Other principal contractual obligations 52.3 44.6 31.3 — 128.2 Total contractual cash obligations(4) $ 301.1 $ 2,393.7 $ 1,028.4 $ 1,164.6 $ 4,887.8
(1) Current portion of long-term debt is exclusive of present value discounting for finance lease obligations of $1.4
million. Long-term debt is inclusive of capitalized lender fees of $18.1 million and debt discounts of $1.9 million, and exclusive of present value discounting for finance lease obligations of $5.0 million.
(2) Includes interest payments required under our senior notes issuances and Amended Credit Facility only. The interest payments included above for our Term Loan A were calculated using the following assumptions:
• interest rates based on stated LIBOR rates as of December 31, 2020; and• all non-U.S. dollar balances are converted using exchange rates as of December 31, 2020.
(3) Refer to Note 4, “Leases,” of the Notes for detail related to contractual obligations related to finance and operating leases.
(4) Obligations related to defined benefit pension plans and other post-employment benefit plans have been excluded from the table above, due to factors such as the retirement of employees, the performance of plan assets and economic and actuarial assumptions, as it is not reasonably possible to estimate when these obligations will become due. Refer to Note 17, “Profit Sharing, Retirement Savings Plans and Defined Benefit Pension Plans,” and Note 18, “Other Post-Employment Benefits and Other Employee Benefit Plans,” for additional information related to these plans.
Other Principal Contractual Obligations
Sealed Air has other principal contractual obligations which include agreements to purchase an estimated amount of goods, including raw materials, or services, including energy, assumed in the normal course of business. These obligations are enforceable and legally binding and specify all significant terms, including fixed or minimum quantities to be purchased, minimum or variable price provisions and the approximate timing of the purchase. We may purchase additional goods or services above the minimum requirements of these obligations and, as a result use additional cash. The amounts included in the
50

table above represent estimates of the minimum amounts we are obligated to pay, or reasonably likely to pay under these agreements. See Note 20, “Commitments and Contingencies,” of the Notes for additional information.
Liability for Unrecognized Tax Benefits
At December 31, 2020, we had liabilities for unrecognized tax benefits and related interest of $381 million. Given the inherent uncertainty regarding the timing of future cash outflows associated with some of our liabilities for unrecognized tax benefits, we are not able to make reasonable estimates of the period of cash settlement with the respective taxing authority. See Note 19, “Income Taxes,” of the Notes for further discussion.
Off-Balance Sheet Arrangements
We have reviewed our off-balance sheet arrangements and have determined that none of those arrangements has a material current effect or is reasonably likely to have a material future effect on our Consolidated Financial Statements, liquidity, capital expenditures or capital resources.
Income Tax Payments
We expect tax payments to be approximately $111 million in 2021. Future payments are uncertain and dependent on a number of factors including the amount of future taxable income and the results of on-going audits by various taxing authorities, including the IRS.
Contributions to Defined Benefit Pension Plans
We maintain defined benefit pension plans for some of our U.S. and our non-U.S. employees. We currently expect our contributions to these plans to be approximately $18 million in 2021. Additionally, we expect benefits related to our defined benefit pension plan paid directly by the Company to be $4 million in 2021. Future contributions are uncertain and rely on a number of factors including performance of underlying assets, future cash out flows of the plans, actuarial assumptions and funding discussions with boards charged with governance for some of our international plans. Refer to Note 17, “Profit Sharing, Retirement Savings Plans and Defined Benefit Pension Plans,” for additional information related to these plans.
Environmental Matters
We are subject to loss contingencies resulting from environmental laws and regulations, and we accrue for anticipated costs associated with investigatory and remediation efforts when an assessment has indicated that a loss is probable and can be reasonably estimated. These accruals do not take into account any discounting for the time value of money and are not reduced by potential insurance recoveries, if any. We do not believe that it is reasonably possible that the liability in excess of the amounts that we have accrued for environmental matters will be material to our consolidated financial position and results of operations. We reassess environmental liabilities whenever circumstances become better defined or we can better estimate remediation efforts and their costs. We evaluate these liabilities periodically based on available information, including the progress of remedial investigations at each site, the current status of discussions with regulatory authorities regarding the methods and extent of remediation and the apportionment of costs among potentially responsible parties. As some of these issues are decided (the outcomes of which are subject to uncertainties) or new sites are assessed and costs can be reasonably estimated, we adjust the recorded accruals, as necessary. We believe that these exposures are not material to our consolidated financial condition and results of operations. We believe that we have adequately reserved for all probable and estimable environmental exposures.
Cash and Cash Equivalents
The following table summarizes our accumulated cash and cash equivalents:
December 31,(In millions) 2020 2019
Cash and cash equivalents $ 548.7 $ 262.4
See “Analysis of Historical Cash Flow” below.
51

Accounts Receivable Securitization Programs
At December 31, 2020, we had $146 million available to us and no outstanding borrowings under our U.S. and European accounts receivable securitization programs. At December 31, 2019, we had $127 million available to us and no outstanding borrowings under the such programs.
Our trade receivable securitization programs represent borrowings secured by outstanding customer receivables. Therefore, the use and repayment of borrowings under such programs are classified as a financing activities in our Consolidated Statements of Cash Flows. We do not recognize the cash flow within operating activities until the underlying invoices have been paid by our customer. The trade receivables that served as collateral for these borrowings are reclassified from trade receivables, net to prepaid expenses and other current assets on the Consolidated Balance Sheets. See Note 10, “Accounts Receivable Securitization Programs” for further details.
Accounts Receivable Factoring Agreements
We account for our participation in our customers' supply chain financing arrangements and our trade receivable factoring program in accordance with ASC 860 which allows the ownership transfer of accounts receivable to qualify for sale treatment when the appropriate criteria are met. As such, the Company excludes the balances sold under such programs from Trade receivables, net on the Consolidated Balance Sheets. We recognize cash flow from operating activities at the point the receivables are sold under such programs. See Note 11, “Accounts Receivable Factoring Agreements” for further details.
Gross amounts received under these programs for the year ended December 31, 2020 were $466 million, of which $157 million was received in the fourth quarter. Gross amounts received under these programs for the year ended December 31, 2019 were $351 million, of which $105 million was received in the fourth quarter. If these programs had not been in effect for the year ended December 31, 2020, we would have been required to collect the invoice amounts directly from the relevant customers in accordance with the agreed payment terms. Approximately $114 million in incremental trade receivables would have been outstanding at December 31, 2020 if collection on such invoice amounts were made directly from our customers on the invoice due date and not through our customers' supply chain financing arrangements or our factoring program.
The increase in gross amounts factored under these programs from 2019 to 2020 primarily relates to usage of our trade receivable factoring program, which was implemented late in 2019 and utilized throughout 2020. During the fourth quarter 2020, we increased the maximum amount available to be sold under that factoring program from $20 million per month to $35 million per month.
Payments received through customers' supply chain financing arrangements tend to be higher in the fourth quarter. The increased use of our trade receivable factoring program had a favorable impact on cash provided by operating activities during the year.
Lines of Credit
At December 31, 2020 and 2019, we had a $1 billion revolving credit facility. We had no outstanding borrowings under the facility at December 31, 2020 and $89 million of outstanding borrowings under the facility at December 31, 2019. At December 31, 2020 and 2019, we had $7 million and $10 million, respectively, available under various lines of credit extended to our subsidiaries. See Note 14, “Debt and Credit Facilities,” for further details.
LIBOR Phase Out
In July 2017, the United Kingdom's Financial Conduct Authority, which regulates LIBOR, announced that it intends to phase out LIBOR by the end of 2021. An alternative to LIBOR has been contemplated in many of our LIBOR-linked instruments and other financial obligations, including our senior secured credit facility. We do not expect the phase-out of LIBOR to have a material disruption or impact on our financing or liquidity. In March 2020, the FASB issued ASU 2020-04 to ease the potential burden in accounting for reference rate reform; however, neither the LIBOR phase out or the recently issued ASU is expected to have a material impact on the Company.
Covenants
At December 31, 2020, we were in compliance with our financial covenants and limitations, as discussed in “Covenants” within Note 14, “Debt and Credit Facilities”. As a result of our acquisition of Automated Packaging Systems, the maximum covenant leverage ratio of debt to EBITDA under our senior secured credit facility was temporarily increased to 5.00 to 1.00 through September 30, 2020. The maximum covenant leverage ratio has returned to 4.50 to 1.00 after September 30, 2020. At
52

December 31, 2020, our leverage ratio of debt to EBITDA, as calculated under the covenant, was 2.80 to 1.00. We expect to be in continued compliance with our debt covenants including the covenant leverage ratio over the next 12 months.
See “Covenants” in Note 14, “Debt and Credit Facilities,” for further details.
Supply Chain Financing Programs
As part of our ongoing efforts to manage our working capital and improve our cash flow, we work with suppliers to optimize our purchasing terms and conditions, including extending payment terms. We also facilitate a voluntary supply chain financing program to provide some of our suppliers with the opportunity to sell receivables due from us (our accounts payables) to participating financial institutions at the sole discretion of both the suppliers and the financial institutions. These programs are administered by participating financial institutions. Should the supplier choose to participate in the program, it will receive payment from the financial institution in advance of agreed payment terms; our responsibility is limited to making payments to the respective financial institutions on the terms originally negotiated with our supplier. The range of payment terms is consistent regardless of a vendor's participation in the program. We monitor our days payable outstanding relative to our peers and industry trends in order to assess our conclusion that these programs continue to be trade payable programs and not indicative of borrowing arrangements. The liabilities continue to be presented as trade payables in our consolidated balance sheets until they are paid, and they are reflected as cash flows from operating activities when settled.
As of December 31, 2020, our accounts payable balance included $149 million related to invoices from suppliers participating in the programs. As of December 31, 2019, our accounts payable balance included $157 million related to invoices from suppliers participating in the programs. The cumulative amounts settled through the supply chain financing programs for the year ended December 31, 2020 were $423 million. These programs did not significantly improve our cash provided by operating activities or free cash flow for the year ended December 31, 2020 as compared to the year ended December 31, 2019.
Debt Ratings
Our cost of capital and ability to obtain external financing may be affected by our debt ratings, which the credit rating agencies review periodically. Below is a table that details our credit ratings by the various types of debt by rating agency.
Moody’s Investor
Services Standard& Poor’s
Corporate Rating Ba2 BB+Senior Unsecured Rating Ba3 BB+Senior Secured Credit Facility Rating Baa3 BBB-Outlook Stable Stable
These credit ratings are considered to be below investment grade (with the exception of the Baa3 and BBB- Senior
Secured Credit Facility Rating from Moody’s Investor Services and Standard & Poor’s, respectively, which are classified as investment grade). If our credit ratings are downgraded, there could be a negative impact on our ability to access capital markets and borrowing costs could increase. A credit rating is not a recommendation to buy, sell or hold securities and may be subject to revision or withdrawal at any time by the rating organization. Each rating should be evaluated independently of any other rating.
Outstanding Indebtedness
At December 31, 2020 and 2019, our total debt outstanding consisted of the amounts set forth in the following table.
December 31,(In millions) 2020 2019
Short-term borrowings $ 7.2 $ 98.9 Current portion of long-term debt 22.3 16.7 Total current debt 29.5 115.6 Total long-term debt, less current portion(1) 3,731.4 3,698.6 Total debt 3,760.9 3,814.2 Less: Cash and cash equivalents (548.7) (262.4) Net debt $ 3,212.2 $ 3,551.8
53

(1) Amounts are net of unamortized discounts and debt issuance costs of $20 million and $25 million as of December 31, 2020 and 2019, respectively.
See Note 14, “Debt and Credit Facilities,” for further details.
Analysis of Historical Cash Flow
The following table shows the changes in our Consolidated Statements of Cash Flows in the years ended December 31, 2020, 2019 and 2018.
Year Ended December 31, Change(In millions) 2020 2019 2018 2020 vs. 2019 2019 vs. 2018
Net cash provided by operating activities $ 737.0 $ 511.1 $ 428.0 $ 225.9 $ 83.1 Net cash used in investing activities (159.8) (665.6) (266.7) 505.8 (398.9) Net cash (used in) provided by financing activities (261.7) 139.9 (478.3) (401.6) 618.2 Effect of foreign currency exchange rate changes on cash and cash equivalents (29.2) 5.3 (5.3) (34.5) 10.6
In addition to net cash provided by operating activities, we use free cash flow as a useful measure of performance and as an indication of the strength and ability of our operations to generate cash. We define free cash flow as cash provided by operating activities less capital expenditures (which is classified as an investing activity). Free cash flow is not defined under U.S. GAAP. Therefore, free cash flow should not be considered a substitute for net income or cash flow data prepared in accordance with U.S. GAAP and may not be comparable to similarly titled measures used by other companies. Free cash flow does not represent residual cash available for discretionary expenditures, including certain debt servicing requirements or non-discretionary expenditures that are not deducted from this measure. We historically have generated the majority of our annual free cash flow in the second half of the year. Below are the details of free cash flow for the years ended December 31, 2020, 2019 and 2018.
Year Ended December 31, Change(In millions) 2020 2019 2018 2020 vs. 2019 2019 vs. 2018
Cash flow provided by operating activities $ 737.0 $ 511.1 $ 428.0 $ 225.9 $ 83.1 Capital expenditures (181.1) (189.7) (168.6) 8.6 (21.1) Free cash flow(1) $ 555.9 $ 321.4 $ 259.4 $ 234.5 $ 62.0
(1) Free cash flow was $311 million in 2018 excluding the payment of charges related to the sale of Diversey of $52 million.
Operating Activities
2020 vs. 2019
Net cash provided by operating activities improved by $226 million in the current year. This was primarily the result of stronger net earnings including non-cash add backs in 2020 compared to 2019.
Net earnings were $503 million for the year ended December 31, 2020 compared to $263 million for the year ended December 31, 2019.
Non-cash add backs to reconcile net earnings to net cash provided by operating activities were $307 million in 2020 compared to $221 million in 2019. The increase in non-cash add backs was primarily driven by the change in deferred tax balances generating $137 million, year over year. Depreciation and amortization increased $23 million in 2020 compared to 2019, due to amortization of intangibles for capitalized software and the full year impact of intangible amortization from our acquisition of Automated Packaging Systems. These non-cash add-backs were partially offset by the non-cash gain on sale of businesses which was $19 million in 2020 compared to a loss of $31 million in 2019, representing a change of $50 million. The increase in non-cash add backs in the current year were also partially offset by a gain on an equity investment of $15 million in 2020.
54

The year over year improvement in cash provided by operating activities was also due to decreased cash payments made for our Reinvent SEE business transformation including restructuring and restructuring associated payments, which were $74 million in 2020 compared to $91 million in 2019. Cash payments related to restructuring and restructuring associated activities are expected to continue to decline in 2021.
Working capital, which represents cash generated by trade receivables, inventories and accounts payable, represented a source of cash of $3 million in 2020 compared to $14 million in 2019. Cash generation from working capital in 2020 declined primarily due to an increase in cash used for inventory, driven by a purposeful build in 2020 for contingency planning against the risk of raw material shortages or supply disruptions resulting from the COVID-19 pandemic. Cash generated from trade receivables benefited from improved days sales outstanding, resulting partially from the increased use of our trade receivable factoring program. The year over year changes in accounts payable were largely due to the timing of payments to suppliers. Cash generated from customer advance payments increased $8 million, as the Company increased automation and equipment sales.
As of December 31, 2020, we had repaid the vast majority of U.S. payroll taxes deferred earlier in 2020 under the Coronavirus Aid, Relief and Economic Security Act (“CARES Act”), with only $0.3 million yet to be remitted at year-end.
2019 vs. 2018
Net cash provided by operating activities improved by $83 million in 2019 compared to 2018. This was primarily the result of stronger net earnings including non-cash add backs, improved cash provided by working capital, and lower cash tax payments in 2019 compared to 2018.
Net earnings were $263 million for the year ended December 31, 2019 compared to $193 million for the year ended December 31, 2018. Non-cash add backs to reconcile net earnings to net cash provided by operating activities were $221 million in 2019 compared to $182 million in 2018. The increase was primarily driven by $20 million of higher depreciation and amortization, due to amortization of intangibles acquired from Automated Packaging Systems, as well as a non-cash loss recorded from the sale of discontinued operations of $31 million.
Working capital represented a source of cash of $14 million in 2019 compared to a use of cash of $20 million in 2018. Cash generation from working capital in 2019 was driven by improvements in accounts receivables, primarily on strengthened collections, and cash generated from organic inventory reduction, which excludes the change in balance resulting from the opening balance sheet acquired in acquisitions made this year. These improvements were slightly offset by a use of cash in accounts payable in 2019 of $37 million which compares to a source of cash of $43 million in 2018. The change in cash provided by/used in accounts payable primarily represents timing of payments as well as the benefits received in prior years of improvements to working capital.
Cash tax payments in 2019 were $95 million compared to $155 million in 2018. The improvement was partially the result of one-time items benefiting cash taxes paid in the year including the Novipax settlement and benefits from the purchase of Automated Packaging Systems.
The year over year improvements were partially offset by cash payments made for our Reinvent SEE business transformation including restructuring and restructuring associated payments of $91 million in 2019 compared to $12 million in 2018. The one-time cash outflow in 2019 related to the Novipax settlement payment was largely offset by a one-time payment in lieu of certain future royalty payments for patents made in 2018.
Investing Activities
2020 vs. 2019
Net cash used in investing activities was $160 million in 2020, compared to net cash used in investing activities of $666 million in 2019. The change in net cash used in investing activities was primarily due to prior year business acquisitions activity of $454 million, predominately related to the Automated Packaging Systems acquisition. A favorable purchase price adjustment of $4 million was received during the first quarter 2020 related to the Automated Packaging Systems acquisition.
In 2019, the Company invested in cash deposits with maturities greater than 90 days (marketable securities) which matured in 2020 and then converted back into a cash equivalent, generating a net favorable impact to investing activities of $26 million in 2020 compared to 2019.
55

Proceeds related to the sale of businesses and property increased $15 million compared to 2019, resulting from the sale of two discrete properties in EMEA generating $6 million cash inflow during 2020 as well as the impact of recoveries of tax refund amounts related to Diversey entities which were owed to us.
During 2020, we made a total investment of $8 million in an equity holding. This is classified as an investing cash flow activity based on our strategic investment thesis of anticipated partnership in increasing plastic circularity. See Note 16 “Fair Value Measurements, Equity Investments and Other Financial Instruments,” for more information on our equity investments.
2019 vs. 2018
Net cash used in investing activities was $666 million in 2019, compared to net cash used in investing activities of $267 million in 2018. The change in net cash used in investing activities was primarily due to an increase in business acquisitions activity of $384 million, primarily due to the acquisition of Automated Packaging Systems, offset by the cash outflow for the purchase of AFP in 2018; and an increase in capital expenditures of $21 million, driven by increased investment to drive growth and improve cost productivity.
Financing Activities
2020 vs. 2019
Net cash used in financing activities was $262 million in 2020, compared to net cash provided by financing activities of $140 million in 2019. The change in net cash (used in) provided by financing activities was primarily due to borrowing activity in 2019. Specifically, in 2019 we received the proceeds from the issuance of long-term debt of $895 million, including the $475 million on the Term Loan A due 2022 and the issuance of $425 million of 4.00% of senior notes, which were partially offset by the $425 million repurchase of the 6.50% senior notes. Lower repayments of short-term borrowings of $29 million were primarily due to higher payments on our revolving credit facility in 2019 compared to 2020. At December 31, 2020, we had no amounts outstanding on our revolving credit facility.
Cash outlay for share repurchases were $33 million in 2020 compared to $67 million in 2019.
We continue to evaluate our capital allocation strategy to determine the best use of cash, including decisions regarding share repurchases, investments in growth and operational efficiency, acquisitions and maintaining our debt-leverage ratio.
2019 vs. 2018
Net cash provided by financing activities was $140 million in 2019, compared to net cash used in financing activities of $478 million in 2018. The change in net cash provided by (used in) in financing activities was primarily due to borrowing activity in 2019. Specifically, we received the proceeds from the issuance of long-term debt of $895 million, including the Term Loan A due 2022 of $475 million to fund the purchase of Automated Packaging Systems and the issuance of $425 million of 4.00% of senior notes due 2027, which was partially offset by the $425 million repurchase of the 6.50% senior notes due 2020. Short-term borrowings was a use of cash in 2019 compared to a source of cash in 2018 representing a net change $352 million year over year. This was driven by decrease in borrowings under the European Accounts Receivable Securitization program and our revolving credit facility in 2019 compared to an increase of facility use in 2018. Additionally, share repurchases were $515 million lower in 2019 compared to 2018.
Changes in Working Capital
December 31, (In millions) 2020 2019 Change
Working capital (current assets less current liabilities) $ 514.1 $ 127.8
$ 386.3
Current ratio (current assets divided by current liabilities) 1.4 x 1.1 x
Quick ratio (current assets, less inventories divided by current liabilities) 0.9 x 0.7 x
The $386 million, or 302%, increase in working capital was primarily due to an increase in cash and cash equivalents of $286 million and repayment of short-term borrowings, primarily the revolving credit facility, of $92 million.
Net working capital balances of trade receivables plus inventory less accounts payable were relatively consistent with the prior year. The increase in inventory of $26 million was primarily due to a purposeful inventory build in the second quarter 2020 for contingency planning against the risk of raw material shortages or supply disruptions. This build was partially offset
56
by a higher accounts payable balance at year-end. Overall, given the consistency of the working capital balances of trade receivables, inventory and accounts payable, coupled with the increase in sales and cost of goods sold compared to 2019, our cash conversion cycle (days inventory outstanding plus days sales outstanding less days payable outstanding) improved in 2020 relative to 2019.
Changes in Stockholders’ Equity (Deficit)
The $369 million increase in stockholders’ equity in 2020 compared with 2019 was due to:
• net earnings of $503 million;
• the effect of share-based incentive compensation of $31 million, which includes the impact of our share-based compensation expense as well as the impact of shares netting to cover the employee tax withholding amounts;
• stock issued for profit sharing contribution paid in stock of $24 million; and
• cumulative translation adjustment of $7 million.
These increases were partially offset by:
• dividends paid on our common stock and dividend equivalent accruals related to unvested equity awards of $101 million;
• a net increase in shares held in treasury of $35 million due to the repurchases of common stock;
• unrealized losses on derivative instruments of $35 million; and
• a net increase in accumulated other comprehensive loss of $26 million on unrecognized pension items due primarily to market conditions impacting actuarial assumptions as of our annual pension valuation.
We repurchased approximately 0.9 million shares of our common stock during the year ended December 31, 2020 for $35 million. See Note 21, “Stockholders’ Equity (Deficit),” for further details.
Derivative Financial Instruments
Interest Rate Swaps
The information set forth in Note 15, “Derivatives and Hedging Activities,” under the caption “Interest Rate Swaps” is incorporated herein by reference.
Net Investment Hedge
The information set forth in Note 15, “Derivatives and Hedging Activities,” under the caption “Net Investment Hedge” is incorporated herein by reference.
Other Derivative Instruments
The information set forth in Note 15, “Derivatives and Hedging Activities,” under the caption “Other Derivative Instruments” is incorporated herein by reference.
Foreign Currency Forward Contracts
At December 31, 2020, we were party to foreign currency forward contracts, which did not have a significant impact on our liquidity.
The information set forth in Note 15, “Derivatives and Hedging Activities,” under the caption “Foreign Currency Forward Contracts Designated as Cash Flow Hedges” and “Foreign Currency Forward Contracts Not Designated as Hedges” is incorporated herein by reference.
For further discussion about these contracts and other financial instruments, see Item 7A, “Quantitative and Qualitative Disclosures About Market Risk.”
57

Recently Issued Statements of Financial Accounting Standards, Accounting Guidance and Disclosure Requirements
We are subject to numerous recently issued statements of financial accounting standards, accounting guidance and disclosure requirements. Note 2, “Summary of Significant Accounting Policies and Recently Issued Accounting Standards,” which is contained in the Notes to Consolidated Financial Statements, describes these new accounting standards and is incorporated herein by reference.
Critical Accounting Policies and Estimates
Our discussion and analysis of our consolidated financial condition and results of operations are based upon our Consolidated Financial Statements, which are prepared in accordance with U.S. GAAP. The preparation of Consolidated Financial Statements in conformity with U.S. GAAP requires management to make estimates and assumptions that affect the reported amounts of assets, liabilities, revenues and expenses and the disclosure of contingent assets and liabilities.
Our estimates and assumptions are evaluated on an ongoing basis and are based on all available evidence, including historical experience and other factors believed to be reasonable under the circumstances. To derive these estimates and assumptions, management draws from those available sources that can best contribute to its efforts. These sources include our officers and other employees, outside consultants and legal counsel, third-party experts and actuaries. In addition, we use internally generated reports and statistics, such as aging of trade receivables, as well as outside sources such as government statistics, industry reports and third-party research studies. The results of these estimates and assumptions may form the basis of the carrying value of assets and liabilities and may not be readily apparent from other sources. Actual results may differ from estimates under conditions and circumstances different from those assumed, and any such differences may be material to our Consolidated Financial Statements.
We believe the following accounting policies are critical to understanding our consolidated results of operations and affect the more significant judgments and estimates used in the preparation of our Consolidated Financial Statements. The critical accounting policies discussed below should be read together with our significant accounting policies set forth in Note 2, “Summary of Significant Accounting Policies and Recently Issued Accounting Standards”.
Commitments and Contingencies — Litigation
On an ongoing basis, we assess the potential liabilities and costs related to any lawsuits or claims brought against us. We accrue a liability when we believe a loss is probable and when the amount of loss can be reasonably estimated. Litigation proceedings are evaluated on a case-by-case basis considering the available information, including that received from internal and outside legal counsel, to assess potential outcomes. While it is typically very difficult to determine the timing and ultimate outcome of these actions, we use our best judgment to determine if it is probable that we will incur an expense related to the settlement or final adjudication of these matters and whether a reasonable estimation of the probable loss, if any, can be made. In assessing probable losses, we consider insurance recoveries, if any. We expense legal costs, including those legal costs expected to be incurred in connection with a loss contingency, as incurred. We have historically adjusted existing accruals as proceedings have continued, been settled or for which additional information has been provided on which to review the probability and measurability of outcomes, and will continue to do so in future periods. Due to the inherent uncertainties related to the eventual outcome of litigation and potential insurance recovery, it is possible that disputed matters may be resolved for amounts materially different from any provisions or disclosures that we have previously made.
Impairment of Long-Lived Assets
For finite-lived intangible assets, such as customer relationships, contracts, and intellectual property, and for other long-lived assets, such as property, plant and equipment, whenever impairment indicators are present, we perform a review for impairment. The impairment model is a two step test under which we first calculate the recoverability of the carrying value by comparing the undiscounted value of the projected cash flows associated with the asset or asset group, including its estimated residual value, to the carrying amount. If the cash flows associated with the asset or asset group are less than the carrying value, we would perform a fair value assessment of the asset, or asset group. If the carrying amount is found to be greater than the fair value, we record an impairment loss for the excess of book value over the fair value. In addition, in all cases of an impairment review, we re-evaluate the remaining useful lives of the assets and modify them, as appropriate.
During the fourth quarter of 2020, we identified a triggering event related to our foam fabrication producing asset group within our Protective segment. This asset group generates cash flows which were identified for the purpose of the impairment test at the lowest level based on the interdependency of revenue and shared cost structure, in accordance with ASC 360. The
58
asset group's primary asset was determined to be the intangible asset of Customer Relationships, which has a remaining useful life of approximately 12 years. The triggering event was related to the finalization of the upcoming year's financial projections and budget which indicated short-term deterioration in the profitability of the specific asset group's North American operations. The short-term deterioration is driven in part by a decrease in expected sales of a particular customer within the region. The decline in expected performance identified as a triggering event is not expected to be material to the overall segment or total Company. We performed a quantitative analysis of the recoverability of the net asset group and determined that the assets were not impaired. The estimated future cash flows, including the residual value of the asset group, were 29% greater than the carrying value of net assets. The asset group tested for impairment had a net carrying value of $120 million as of the date of testing, of which $48 million was attributable to intangible assets. Key assumptions used to estimate the recoverable amount of the asset group were expected future sales performance and efficiency and cost improvements resulting in cash flow growth over the remaining useful life of the primary asset. We believe the assumptions utilized in the projections are appropriate and in-line with industry and GDP growth estimates. As part of our analysis, we performed a sensitivity analysis on the sales and future cash flow assumptions. The sensitivities led us to the same conclusion that the carrying value of the asset group was recoverable.
For indefinite–lived intangible assets, such as trademarks and trade names, each year and whenever impairment indicators are present, we determine the fair value of the asset and record an impairment loss for the excess of book value over fair value, if any. In addition, in all cases of an impairment review we re-evaluate whether continuing to characterize the asset as indefinite–lived is appropriate. We recorded no impairment to indefinite lived assets in the current year.
Goodwill
Goodwill is reviewed for possible impairment at least annually on a reporting unit level during the fourth quarter of each year. A review of goodwill may be initiated before or after conducting the annual analysis if events or changes in circumstances indicate the carrying value of goodwill may no longer be recoverable.
A reporting unit is the operating segment unless, at businesses one level below that operating segment - the “component” level - discrete financial information is prepared and regularly reviewed by management, and the component has economic characteristics that are different from the economic characteristics of the other components of the operating segment, in which case the component is the reporting unit.
In our annual impairment review, we may elect to first assess qualitative factors to determine whether it is more likely than not that the fair value of a reporting unit is less than its carrying amount. In a qualitative assessment, we would consider the macroeconomic conditions, including any deterioration of general economic conditions, industry and market conditions, including any deterioration in the environment where the reporting unit operates, increased competition, changes in the products/services and regulatory and political developments; cost of doing business; overall financial performance, including any declining cash flows and performance in relation to planned revenues and earnings in past periods; other relevant reporting unit specific facts, such as changes in management or key personnel or pending litigation; and events affecting the reporting unit, including changes in the carrying value of net assets.
If the results of our qualitative assessment indicate it is more likely than not that the fair value of a reporting unit is less than its carrying amount, we are required to perform a quantitative assessment to determine the fair value of the reporting unit.
Alternatively, if an optional qualitative goodwill impairment assessment is not performed, we may perform a quantitative assessment. Under the quantitative assessment, we compare the fair value of each reporting unit to its carrying value, including the goodwill allocated to the reporting unit. If the fair value of the reporting unit exceeded its carrying value, there would be no indication of impairment. If the fair value of the reporting unit were less than the carrying value, an impairment charge would be recognized for the difference.
Under the quantitative assessment, we derive an estimate of fair values for each of our reporting units using a combination of an income approach and appropriate market approaches. Absent an indication of fair value from a potential buyer or similar specific transactions, we believe that the use of these methods provides a reasonable estimate of a reporting unit’s fair value. Fair value computed by these models is arrived at using a number of factors and inputs. There are inherent uncertainties, however, related to fair value models, the inputs and our judgment in applying them to this analysis. Nonetheless, we believe that the combination of these methods provides a reasonable approach to estimate the fair value of our reporting units.
We believe the most significant inputs in our quantitative assessment include:
• Forecasted future operating results: On an annual basis, the Company prepares annual and medium-term financial projections. These projections are based on input from the Company's leadership, strategy, commercial leadership and finance teams and presented to our Board of Directors annually. Influences on this year's forecasted financial information and the fair value model include: the impact of planned strategic initiatives, the continued integration of recent acquisitions, including Automated Packaging Systems,
59

continuous improvement derived from Reinvent SEE business transformation initiatives and overall market conditions.
• Discount rate: Our third-party valuation specialists provide inputs into management's determination of the discount rate. The rate is dependent on a number of underlying assumptions, the most impactful of which are the risk-free rate, tax rate, equity risk premium, debt to equity ratio and pre-tax cost of debt.
• Long-term growth rate: Long-term growth rates are applied to the terminal year of our cash flow valuation approach. The long-term growth rates are tied to growth rates we expect to achieve beyond the years for which we have forecasted operating results. We also consider external benchmarks, including forecasted long-term GDP growth and other data points which we believe are applicable to our industry and the composition of our global operations.
The Company performed a quantitative assessment of the goodwill by reporting unit as of October 1, 2020. We believe it is appropriate to periodically perform the quantitative assessment for our annual impairment test, even if qualitative considerations do not indicate the fair value of a reporting unit is less than its carrying value. The periodic and timely calculation of the quantitative assessment provides better support for our qualitative assessments. Other factors that contributed to our decision to perform a quantitative test included the market volatility resulting from the COVID-19 pandemic, the indicators of impairment identified with respect to a specific subset of our other long-lived assets, as described above, and our continued integration of recent acquisitions, including Automated Packaging Systems, which is contained within our Protective reporting unit.
Based on our quantitative assessment, we believe the fair value of each of our reporting units sufficiently exceed the carrying values. As part of our analysis, we performed a sensitivity analysis on the discount rate and long-term growth rate assumptions. The sensitivities led us to the same conclusion that no impairment exists.
The Company also assesses its goodwill for impairment from time to time when warranted by the facts and circumstances surrounding individual reporting units. Subsequent to our annual reporting period, we continued to assess whether there were changes in facts or circumstances that would lead us to believe goodwill may be impaired. No indication of goodwill impairment has been identified subsequent to our annual testing date.
In the fourth quarter of 2019, we also performed a quantitative assessment for our annual impairment test. In the fourth quarter of 2018, we performed a qualitative assessment. No indication of goodwill impairment was identified in either 2019 or 2018.
See Note 9, “Goodwill and Identifiable Intangible Assets, net,” for details of our goodwill balances as of 2020, 2019 and 2018 and additional information related to the quantitative assessment performed in 2020.
Pensions
For a number of our current and former U.S. and international employees, we maintain defined benefit pension plans. Under current accounting standards, we are required to make assumptions regarding the valuation of projected benefit obligations and the performance of plan assets for our defined benefit pension plans.
The projected benefit obligation and the net periodic benefit cost are based on third-party actuarial assumptions and estimates that are reviewed and approved by management on a plan-by-plan basis each fiscal year. We believe the most significant assumptions are the discount rate used to measure the projected benefit obligation and the expected future rate of return on plan assets. We revise these assumptions based on an annual evaluation of long-term trends and market conditions that may have an impact on the cost of providing retirement benefits.
In determining the discount rate, we utilize market conditions and other data sources management considers reasonable based upon the profile of the remaining service life or expected life of eligible employees. The expected long-term rate of return on plan assets is determined by taking into consideration the weighted-average expected return on our asset allocation, asset return data, historical return data, and the economic environment. We believe these considerations provide the basis for reasonable assumptions of the expected long-term rate of return on plan assets. The measurement date used to determine the benefit obligation and plan assets is December 31.
At December 31, 2020, the total projected benefit obligation for our U.S. pension plan was $202 million, and the total benefit income for the year ended December 31, 2020 was $2 million. At December 31, 2020, the total projected benefit obligation for our international pension plans was $783 million, and the total benefit cost for the year ended December 31, 2020 was $3 million. The employer service cost of our pension plans is charged to Cost of sales and Selling, general and administrative expenses. All other components of benefits expense are recorded to other income (expense), net.
60

Material changes to the principal assumptions could have a material impact on the costs and liabilities recognized on our Consolidated Financial Statements. A 25 basis point change in the assumed discount rate and a 100 basis point change in the expected long-term rate of return on plan assets would have resulted in the following increases (decreases) in the projected benefit obligation at December 31, 2020 and the expected net periodic benefit cost for the year ending December 31, 2021:
United States25 Basis Point Increase
(in millions)25 Basis Point Decrease
(in millions)
Discount Rate Effect on 2020 projected benefit obligation $ (5.4) $ 5.6 Effect on 2021 expected net periodic benefit cost 0.1 (0.1)
100 Basis Point Increase
(in millions)100 Basis Point Decrease
(in millions)
Return on Assets Effect on 2021 expected net periodic benefit cost $ (1.4) $ 1.4
International25 Basis Point Increase
(in millions)25 Basis Point Decrease
(in millions)
Discount Rate Effect on 2020 projected benefit obligation $ (29.3) $ 31.1 Effect on 2021 expected net periodic benefit cost — 0.3
100 Basis Point Increase
(in millions)100 Basis Point Decrease
(in millions)
Return on Assets Effect on 2021 expected net periodic benefit cost $ (6.7) $ 6.7
Income Taxes
Estimates and judgments are required in the calculation of tax liabilities and in the determination of the recoverability of our deferred tax assets. Our deferred tax assets arise from net deductible temporary differences, tax benefit carryforwards and tax credits. We evaluate whether our taxable earnings, during the periods when the temporary differences giving rise to deferred tax assets become deductible or when tax benefit carryforwards may be utilized, should be sufficient to realize the related future income tax benefits. For those jurisdictions where the expiration dates of tax benefit carryforwards or the projected taxable earnings indicate that realization is not likely, we provide a valuation allowance.
In assessing the need for a valuation allowance, we estimate future taxable earnings, with consideration for the feasibility of ongoing planning strategies and the realizability of tax benefit carryforwards and past operating results, to determine which deferred tax assets are more likely than not to be realized in the future. Changes to tax laws, statutory tax rates and future taxable earnings can have an impact on valuation allowances related to deferred tax assets. In the event that actual results differ from these estimates in future periods, we may need to adjust the valuation allowance, which could have a material impact on our consolidated financial position and results of operations.
In calculating our worldwide provision for income taxes, we also evaluate our tax positions for years where the statutes of limitations have not expired. Based on this review, we may establish reserves for additional taxes and interest that could be assessed upon examination by relevant tax authorities. We adjust these reserves to take into account changing facts and circumstances, including the results of tax audits and changes in tax law. If the payment of additional taxes and interest ultimately proves unnecessary or less than the amount of the reserve, the reversal of the reserves would result in tax benefits being recognized in the period when we determine the reserves are no longer necessary. If an estimate of tax reserves proves to be less than the ultimate assessment, a further charge to income tax provision would result. These adjustments to reserves and related expenses could materially affect our consolidated financial position and results of operations.
We recognize the tax benefit from an uncertain tax position only if it is more likely than not that the tax position will be sustained on examination by the taxing authorities, based on the technical merits of the position. The tax benefits recognized on the Consolidated Financial Statements from such positions are measured based on the largest benefit that has a greater than fifty percent likelihood of being realized upon settlement with tax authorities. See Note 19, “Income Taxes,” for further discussion.
61

Item 7A. Quantitative and Qualitative Disclosures About Market Risk
We are exposed to market risk from changes in the conditions in the global financial markets, interest rates, foreign currency exchange rates and commodity prices and the creditworthiness of our customers and suppliers, which may adversely affect our consolidated financial condition and results of operations. We seek to minimize these risks through regular operating and financing activities and, when deemed appropriate, through the use of derivative financial instruments. We do not purchase, hold or sell derivative financial instruments for trading purposes.
Interest Rates
From time to time, we may use interest rate swaps, collars or options to manage our exposure to fluctuations in interest rates. At December 31, 2020, we had no outstanding interest rate swaps, collars or options.
The information set forth in Note 15, “Derivatives and Hedging Activities,” under the caption “Interest Rate Swaps,” is incorporated herein by reference.
See Note 16, “Fair Value Measurements, Equity Investments and Other Financial Instruments,” for details of the methodology and inputs used to determine the fair value of our fixed rate debt. The fair value of our fixed rate debt varies with changes in interest rates. Generally, the fair value of fixed rate debt will increase as interest rates fall and decrease as interest rates rise. A hypothetical 10% increase in interest rates would result in a decrease of $42 million in the fair value of the total debt balance at December 31, 2020. These changes in the fair value of our fixed rate debt do not alter our obligations to repay the outstanding principal amount or any related interest of such debt.
Foreign Exchange Rates
Operations
As a large global organization, we face exposure to changes in foreign currency exchange rates. These exposures may change over time as business practices evolve and could materially impact our consolidated financial condition and results of operations in the future. See Item 7, “Management’s Discussion and Analysis of Financial Condition and Results of Operations,” above for the impacts foreign currency translation had on our operations.
Argentina
Economic events in Argentina, including the default on some of its international debt obligations, which have subsequently been renegotiated, exposed us to heightened levels of foreign currency exchange risks. Despite some recent debt restructuring, fluctuations in foreign exchange rates on the Argentine Peso continue to impact our financial results. As of July 1, 2018, Argentina was designated as a highly inflationary economy. For the years ended December 31, 2020 and 2019, we recognized $5 million of net foreign currency exchange losses in Foreign currency exchange loss due to highly inflationary economies on the Consolidated Statements of Operations, related to the designation of Argentina as a highly inflationary economy under U.S. GAAP. See Note 2, “Summary of Significant Accounting Policies and Recently Issued Accounting Standards,” for additional information. As of December 31, 2020, 1% of our consolidated net sales were derived from our products sold in Argentina and net assets include $10 million of cash and cash equivalents domiciled in Argentina. Also, as of December 31, 2020, our Argentina subsidiaries had cumulative translation losses of $24 million.
Russia
The U.S. and the European Union (EU) have imposed sanctions on various sectors of the Russian economy and on transactions with certain Russian nationals and entities. Russia has also announced economic sanctions against the U.S. and other nations that include a ban on imports of certain products. These sanctions are not expected to have a material impact on our business as much of the operations in Russia support local production; however, they may limit the amount of future business the Company does with customers involved in activities in Russia. As of December 31, 2020, we do not anticipate these events will have a material impact to our 2021 results of operations. As of December 31, 2020, 2% of our consolidated net sales were derived from products sold into Russia and net assets include $10 million of cash and cash equivalents domiciled in Russia. Also, as of December 31, 2020, our Russia subsidiaries had cumulative translation losses of $39 million.
62

Brazil
Recent economic events in Brazil, including changes in the benchmark interest rate set by the Brazilian Central Bank, have exposed us to heightened levels of foreign currency exchange risks. However, as of December 31, 2020, we do not anticipate these events will have a material impact on our 2021 results of operations. As of December 31, 2020, 2% of our consolidated net sales were derived from products sold into Brazil and net assets include $22 million of cash and cash equivalents. Also, as of December 31, 2020, our Brazil subsidiaries had cumulative translation losses of $58 million.
United Kingdom
On January 31, 2020, the United Kingdom (UK) exited the European Union (referred to as "Brexit"). The UK agreed to abide by EU rules during a transition period through December 31, 2020. Prior to the end of the transition period, the UK and the European Union reached a deal related to future trade, customs, and mobility, among other topics. The deal generally provided continued free trade between the two parties, though increased checks and custom declarations. The final Brexit deal may create additional effort related to our supply chain and shipping goods from the UK. Over the last two years, we have deployed a cross-functional team to develop and implement changes to our operating model and legal entity structure to efficiently address challenges that may arise from Brexit.
As of December 31, 2020, 3% of our consolidated net sales were derived from products sold into the UK, which is consistent with the prior year. Net assets in the UK include $4 million of cash and cash equivalents and $15 million in inventory. Also, as of December 31, 2020, our UK subsidiaries had cumulative translation adjustment gains of $9 million.
Impact of Inflation and Currency Fluctuation
Economic and political events in certain countries have exposed us to heightened levels of inflation and foreign currency exchange risks. The effects of these could adversely impact our financial condition and results of operations. See Note 2, “Summary of Significant Accounting Policies and Recently Issued Accounting Standards,” for details regarding the impact of inflation and currency fluctuation. Also, for a discussion of our risk factors, please refer to Part I, Item 1A, “Risk Factors.”
Foreign Currency Forward Contracts
We use foreign currency forward contracts to fix the amounts payable or receivable on some transactions denominated in foreign currencies. A hypothetical 10% adverse change in foreign exchange rates at December 31, 2020 would have caused us to pay approximately $30 million to terminate these contracts. Based on our overall foreign exchange exposure, we estimate this change would not materially affect our financial position and liquidity. The effect on our results of operations would be substantially offset by the impact of the hedged items.
Our foreign currency forward contracts are described in Note 15, “Derivatives and Hedging Activities,” which is incorporated herein by reference.
Net Investment Hedge
The €400 million 4.50% notes issued in June 2015 are designated as a net investment hedge, hedging a portion of our net investment in a certain European subsidiary against fluctuations in foreign exchange rates. The increase in the translated value of the debt was $32 million net of tax as of December 31, 2020, and is reflected in long-term debt on our Consolidated Balance Sheets.
For derivative instruments that are designated and qualify as hedges of net investments in foreign operations, settlements and changes in fair values of the derivative instruments are recognized in unrealized net gains or loss on derivative instruments for net investment hedge, a component of accumulated other comprehensive loss, net of taxes, to offset the changes in the values of the net investments being hedged. Any portion of the net investment hedge that is determined to be ineffective is recorded in other income (expense), net on the Consolidated Statements of Operations.
Other Derivative Instruments
We may use other derivative instruments from time to time to manage exposure to foreign exchange rates and to access to international financing transactions. These instruments can potentially limit foreign exchange exposure by swapping borrowings denominated in one currency for borrowings denominated in another currency.
63

Outstanding Debt
Our outstanding debt is generally denominated in the functional currency of the borrower or in euros as is the case with the issuance of €400 million of 4.50% senior notes due 2023. We believe that this enables us to better match operating cash flows with debt service requirements and to better match the currency of assets and liabilities. The U.S. dollar equivalent amount of outstanding debt denominated in a functional currency other than the U.S. dollar was $541 million and $500 million at December 31, 2020 and 2019, respectively.
Customer Credit
Effective January 1, 2020, the Company adopted ASU 2016-13, which requires us to measure all expected credit losses for trade receivables held at the reporting date based on an expected loss model which includes historical experience, current conditions, and reasonable and supportable forecasts.
We are exposed to credit risk from our customers. In the normal course of business, we extend credit to our customers if they satisfy pre-defined credit criteria. We maintain an allowance for credit losses on trade receivables for estimated losses resulting from the failure of our customers to make required payments. An additional allowance may be required if the financial condition of our customers deteriorates. Our customers may default on their obligations to us due to bankruptcy, lack of liquidity, operational failure or other reasons. See Note 2, "Summary of Significant Accounting Policies and Recently Issued Accounting Standards," for further details. The impact of our adoption of ASU 2016-13 was not material to 2020 results of operation or financial position as of December 31, 2020.
Pensions
Many of our U.S. and International defined benefit pension plans are invested in assets which will be used to cover future benefit payments. Assets may include investments in mutual funds, collective investment trusts, index-funds, corporate bonds, government-backed bonds and insurance contracts or annuity "buy-ins." The assets include both return seeking assets and liability-hedging assets. As the population of the plan participants age and future cash flows become more certain, we undertake asset de-risking initiatives, including the purchase of buy-in contracts, particularly in the United Kingdom. These investments provide a stream of income equal to future benefit payments for pre-defined groups of participants; however, the Company maintains the primary liability for the projected benefit obligation related to these groups. As of December 31, 2020 and 2019, buy-in contracts represented $131 million, or 16%, and $120 million, or 16%, of the Company's total plan assets, respectively. Additionally, our plan assets may, from time to time, be invested in assets designed to diversify the investment portfolio and protect against equity market movements. Some of these assets may only be redeemed on a quarterly basis. As of December 31, 2020 and 2019, equity diversifying assets represented $86 million, or 10%, and $55 million, or 7%, of the Company's total plan assets, respectively. Other than the buy-in contracts and equity diversifiers noted above, we believe that our plan assets are highly liquid and may be readily redeemed to cover necessary plan payments. There is a high degree of predictability of payments made from our defined benefit plans.
Based upon the annual valuation of our defined benefit pension plans at December 31, 2020, we expect net periodic benefit income to be approximately $1 million in 2021. See Note 17, “Profit Sharing, Retirement Savings Plans and Defined Benefit Pension Plans,” for further details on our defined benefit pension plans.
Commodities
We use various commodity raw materials such as plastic resins and energy products such as electric power and natural gas in conjunction with our manufacturing processes. Generally, we acquire these components at market prices in the region in which they will be used and do not use financial instruments to hedge commodity prices. Moreover, we seek to maintain appropriate levels of commodity raw material inventories thus minimizing the expense and risks of carrying excess inventories. We do not typically purchase substantial quantities in advance of production requirements. As a result, we are exposed to market risks related to changes in commodity prices of these components.
64

Item 8. Financial Statements and Supplementary Data
The following Consolidated Financial Statements and notes are filed as part of this report.
Sealed Air Corporation
Page
Reports of Independent Registered Public Accounting FirmsFinancial Statements:
Consolidated Balance Sheets — December 31, 2020 and 2019 69 Consolidated Statements of Operations for the Three Years Ended December 31, 2020 70 Consolidated Statements of Comprehensive Income for the Three Years Ended December 31, 2020 71 Consolidated Statements of Stockholders’ Equity (Deficit) for the Three Years Ended December 31, 2020 72 Consolidated Statements of Cash Flows for the Three Years Ended December 31, 2020 73 Notes to Consolidated Financial Statements 75
Note 1 Organization and Nature of Operations 75 Note 2 Summary of Significant Accounting Policies and Recently Issued Accounting Standards 75 Note 3 Revenue Recognition, Contracts with Customers 83 Note 4 Leases 87 Note 5 Acquisitions 89 Note 6 Segments 92 Note 7 Inventories, net 95 Note 8 Property and Equipment, net 96 Note 9 Goodwill and Identifiable Intangible Assets, net 96 Note 10 Accounts Receivable Securitization Programs 98 Note 11 Accounts Receivable Factoring Agreements 99 Note 12 Restructuring Activities 100 Note 13 Other Current and Non-Current Liabilities 101 Note 14 Debt and Credit Facilities 102 Note 15 Derivatives and Hedging Activities 104 Note 16 Fair Value Measurements, Equity Investments and Other Financial Instruments 107 Note 17 Profit Sharing, Retirement Savings Plans and Defined Benefit Pension Plans 110 Note 18 Other Post-Employment Benefits and Other Employee Benefit Plans 114 Note 19 Income Taxes 116 Note 20 Commitments and Contingencies 120 Note 21 Stockholders’ Equity (Deficit) 123 Note 22 Accumulated Other Comprehensive Loss 133 Note 23 Other Income (Expense), net 134 Note 24 Net Earnings per Common Share 135
Financial Statement Schedule:II — Valuation and Qualifying Accounts and Reserves for the Three Years Ended December 31, 2020 144
65
Report of Independent Registered Public Accounting Firm
To the Board of Directors and Stockholders of Sealed Air Corporation
Opinions on the Financial Statements and Internal Control over Financial Reporting
We have audited the accompanying consolidated balance sheets of Sealed Air Corporation and its subsidiaries (the “Company”) as of December 31, 2020 and 2019, and the related consolidated statements of operations, comprehensive income, stockholders’ equity (deficit) and cash flows for the two years in the period ended December 31, 2020, including the related notes and financial statement schedules listed in the accompanying index (collectively referred to as the “consolidated financial statements”). We also have audited the Company's internal control over financial reporting as of December 31, 2020, based on criteria established in Internal Control - Integrated Framework (2013) issued by the Committee of Sponsoring Organizations of the Treadway Commission (COSO).
In our opinion, the consolidated financial statements referred to above present fairly, in all material respects, the financial position of the Company as of December 31, 2020 and 2019, and the results of its operations and its cash flows for the two years in the period ended December 31, 2020 in conformity with accounting principles generally accepted in the United States of America. Also in our opinion, the Company maintained, in all material respects, effective internal control over financial reporting as of December 31, 2020, based on criteria established in Internal Control - Integrated Framework (2013) issued by the COSO.
Basis for Opinions
The Company's management is responsible for these consolidated financial statements, for maintaining effective internal control over financial reporting, and for its assessment of the effectiveness of internal control over financial reporting, included in Management's Annual Report on Internal Control over Financial Reporting appearing under Item 9A. Our responsibility is to express opinions on the Company’s consolidated financial statements and on the Company's internal control over financial reporting based on our audits. We are a public accounting firm registered with the Public Company Accounting Oversight Board (United States) (PCAOB) and are required to be independent with respect to the Company in accordance with the U.S. federal securities laws and the applicable rules and regulations of the Securities and Exchange Commission and the PCAOB.
We conducted our audits in accordance with the standards of the PCAOB. Those standards require that we plan and perform the audits to obtain reasonable assurance about whether the consolidated financial statements are free of material misstatement, whether due to error or fraud, and whether effective internal control over financial reporting was maintained in all material respects.
Our audits of the consolidated financial statements included performing procedures to assess the risks of material misstatement of the consolidated financial statements, whether due to error or fraud, and performing procedures that respond to those risks. Such procedures included examining, on a test basis, evidence regarding the amounts and disclosures in the consolidated financial statements. Our audits also included evaluating the accounting principles used and significant estimates made by management, as well as evaluating the overall presentation of the consolidated financial statements. Our audit of internal control over financial reporting included obtaining an understanding of internal control over financial reporting, assessing the risk that a material weakness exists, and testing and evaluating the design and operating effectiveness of internal control based on the assessed risk. Our audits also included performing such other procedures as we considered necessary in the circumstances. We believe that our audits provide a reasonable basis for our opinions.
Definition and Limitations of Internal Control over Financial Reporting
A company’s internal control over financial reporting is a process designed to provide reasonable assurance regarding the reliability of financial reporting and the preparation of financial statements for external purposes in accordance with generally accepted accounting principles. A company’s internal control over financial reporting includes those policies and procedures that (i) pertain to the maintenance of records that, in reasonable detail, accurately and fairly reflect the transactions and dispositions of the assets of the company; (ii) provide reasonable assurance that transactions are recorded as necessary to permit preparation of financial statements in accordance with generally accepted accounting principles, and that receipts and expenditures of the company are being made only in accordance with authorizations of management and directors of the company; and (iii) provide reasonable assurance regarding prevention or timely detection of unauthorized acquisition, use, or disposition of the company’s assets that could have a material effect on the financial statements.
Because of its inherent limitations, internal control over financial reporting may not prevent or detect misstatements. Also, projections of any evaluation of effectiveness to future periods are subject to the risk that controls may become inadequate because of changes in conditions, or that the degree of compliance with the policies or procedures may deteriorate.
66

Critical Audit Matters
The critical audit matter communicated below is a matter arising from the current period audit of the consolidated financial statements that was communicated or required to be communicated to the audit committee and that (i) relates to accounts or disclosures that are material to the consolidated financial statements and (ii) involved our especially challenging, subjective, or complex judgments. The communication of critical audit matters does not alter in any way our opinion on the consolidated financial statements, taken as a whole, and we are not, by communicating the critical audit matter below, providing a separate opinion on the critical audit matter or on the accounts or disclosures to which it relates.
Unrecognized Tax Benefits from Uncertain Tax Positions
As described in Notes 2 and 19 to the consolidated financial statements, the Company has recorded unrecognized tax benefits from uncertain tax positions of $379.6 million as of December 31, 2020. The Company is subject to income taxes in the U.S. and in various foreign jurisdictions. Judgment is required by management in calculating the Company’s worldwide provision for income taxes. As disclosed by management, the Company recognizes the tax benefit from an uncertain tax position only if it is more likely than not that the tax position will be sustained on examination by the taxing authorities, based on the technical merits of the position. If the payment of additional taxes and interest ultimately proves unnecessary or less than the amount of the reserve, the reversal of the reserves would result in tax benefits being recognized in the period when management determines the reserves are no longer necessary. If an estimate of tax reserves proves to be less than the ultimate assessment, a further charge to the income tax provision would result.
The principal considerations for our determination that performing procedures relating to unrecognized tax benefits from uncertain tax positions is a critical audit matter are (i) the significant judgment by management in identifying and recognizing the tax benefits from uncertain tax positions, including determining whether it is more likely than not that the tax position will be sustained on examination by the taxing authorities, based on the technical merits of the position; (ii) a high degree of auditor judgment, subjectivity and effort in performing procedures and evaluating management's timely identification and accurate measurement of unrecognized tax benefits from uncertain tax positions; (iii) the evaluation of audit evidence available to support unrecognized tax benefits from uncertain tax positions is complex and resulted in significant auditor judgment as the nature of the evidence is often highly subjective; and (iv) the audit effort involved the use of professionals with specialized skill and knowledge.
Addressing the matter involved performing procedures and evaluating audit evidence in connection with forming our overall opinion on the consolidated financial statements. These procedures included testing the effectiveness of controls relating to the identification and recognition of unrecognized tax benefits from uncertain tax positions, controls addressing completeness of the unrecognized tax benefits from uncertain tax positions, as well as controls over measurement of the unrecognized tax benefit from uncertain tax positions. These procedures also included, among others, (i) testing the information used in the calculation of the unrecognized tax benefits from uncertain tax positions, including certain federal, foreign and state filing positions, and the related final tax returns; (ii) testing the calculation of the unrecognized tax benefits from uncertain tax positions by jurisdiction, including management’s assessment of the technical merits of tax positions and estimates of the amount of tax benefit expected to be sustained; (iii) testing the completeness of management’s assessment of both the identification of unrecognized tax benefits from uncertain tax positions and possible outcomes of each unrecognized tax benefit from an uncertain tax position; and (iv) evaluating the status and results of income tax audits with the relevant taxing authorities. Professionals with specialized skill and knowledge were used to assist in the evaluation of the completeness and measurement of the Company’s unrecognized tax benefits from uncertain tax positions, including evaluating the reasonableness of management’s assessment of whether tax positions are more-likely-than-not of being sustained and the amount of potential benefit to be realized, the application of relevant tax laws, and estimated interest and penalties.
/s/ PricewaterhouseCoopers LLP
Charlotte, North CarolinaFebruary 25, 2021
We have served as the Company's auditor since 2019.
67

Report of Independent Registered Public Accounting Firm
To the Board of Directors and Stockholders of Sealed Air Corporation
Opinion on the Financial StatementsWe have audited the accompanying consolidated statements of operations, comprehensive income, stockholders' equity (deficit) and cash flows of Sealed Air Corporation and subsidiaries (the Company) for the year ended December 31, 2018, and the related notes and financial statement schedule listed in the Index at Item 15(a)(2) for the year ended December 31, 2018 (collectively referred to as the “consolidated financial statements”). In our opinion, the 2018 consolidated financial statements present fairly, in all material respects, the results of the Company’s operations and its cash flows for the year ended December 31, 2018, in conformity with U.S. generally accepted accounting principles.
Basis for Opinion
These financial statements are the responsibility of the Company's management. Our responsibility is to express an opinion on the Company’s financial statements based on our audit. We are a public accounting firm registered with the PCAOB and are required to be independent with respect to the Company in accordance with the U.S. federal securities laws and the applicable rules and regulations of the Securities and Exchange Commission and the PCAOB.
We conducted our audit in accordance with the standards of the PCAOB. Those standards require that we plan and perform the audit to obtain reasonable assurance about whether the financial statements are free of material misstatement, whether due to error or fraud. Our audit included performing procedures to assess the risks of material misstatement of the financial statements, whether due to error or fraud, and performing procedures that respond to those risks. Such procedures included examining, on a test basis, evidence regarding the amounts and disclosures in the financial statements. Our audit also included evaluating the accounting principles used and significant estimates made by management, as well as evaluating the overall presentation of the financial statements. We believe that our audit provides a reasonable basis for our opinion.
/s/ Ernst & Young LLP
We served as the Company’s auditor from 2015 to 2019.
Charlotte, North CarolinaFebruary 19, 2019,except for Notes 3, 6, 17 and 18, as to which the date isMarch 2, 2020
68
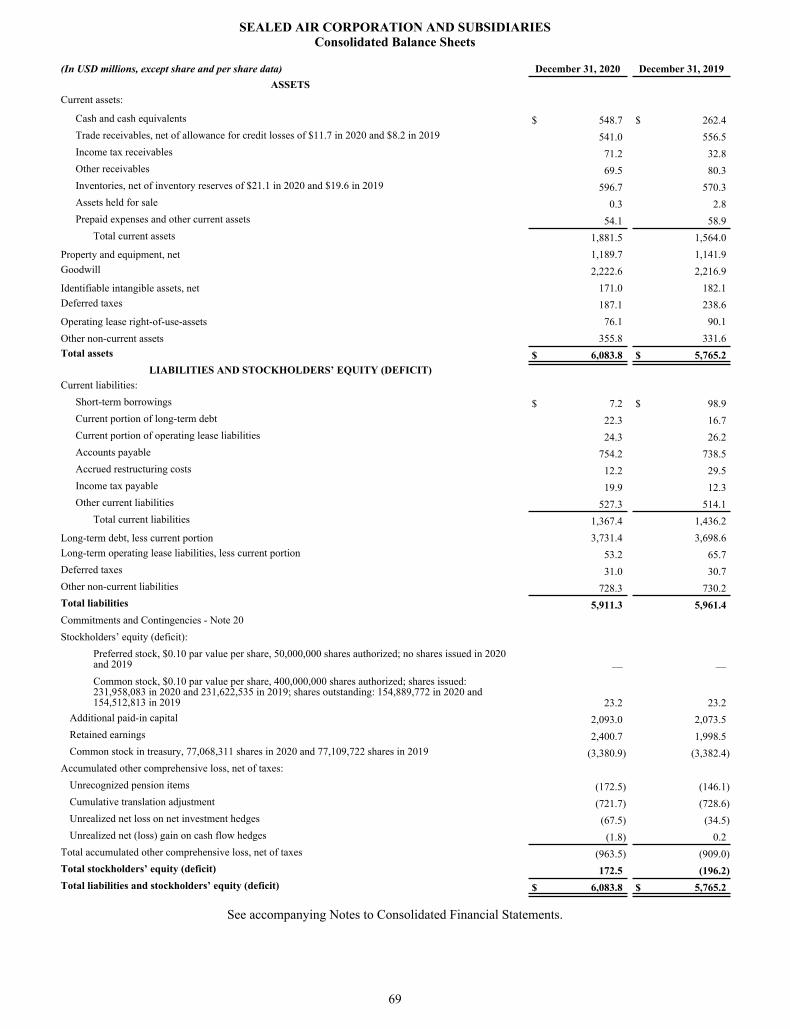
Consolidated Balance Sheets
(In USD millions, except share and per share data) December 31, 2020 December 31, 2019ASSETS
Current assets: Cash and cash equivalents $ 548.7 $ 262.4 Trade receivables, net of allowance for credit losses of $11.7 in 2020 and $8.2 in 2019 541.0 556.5 Income tax receivables 71.2 32.8 Other receivables 69.5 80.3 Inventories, net of inventory reserves of $21.1 in 2020 and $19.6 in 2019 596.7 570.3 Assets held for sale 0.3 2.8 Prepaid expenses and other current assets 54.1 58.9
Total current assets 1,881.5 1,564.0 Property and equipment, net 1,189.7 1,141.9 Goodwill 2,222.6 2,216.9 Identifiable intangible assets, net 171.0 182.1 Deferred taxes 187.1 238.6 Operating lease right-of-use-assets 76.1 90.1 Other non-current assets 355.8 331.6 Total assets $ 6,083.8 $ 5,765.2
LIABILITIES AND STOCKHOLDERS’ EQUITY (DEFICIT)Current liabilities:
Short-term borrowings $ 7.2 $ 98.9 Current portion of long-term debt 22.3 16.7 Current portion of operating lease liabilities 24.3 26.2 Accounts payable 754.2 738.5 Accrued restructuring costs 12.2 29.5 Income tax payable 19.9 12.3 Other current liabilities 527.3 514.1
Total current liabilities 1,367.4 1,436.2 Long-term debt, less current portion 3,731.4 3,698.6 Long-term operating lease liabilities, less current portion 53.2 65.7 Deferred taxes 31.0 30.7 Other non-current liabilities 728.3 730.2 Total liabilities 5,911.3 5,961.4 Commitments and Contingencies - Note 20Stockholders’ equity (deficit):
Preferred stock, $0.10 par value per share, 50,000,000 shares authorized; no shares issued in 2020 and 2019 — — Common stock, $0.10 par value per share, 400,000,000 shares authorized; shares issued: 231,958,083 in 2020 and 231,622,535 in 2019; shares outstanding: 154,889,772 in 2020 and 154,512,813 in 2019 23.2 23.2
Additional paid-in capital 2,093.0 2,073.5 Retained earnings 2,400.7 1,998.5 Common stock in treasury, 77,068,311 shares in 2020 and 77,109,722 shares in 2019 (3,380.9) (3,382.4)
Accumulated other comprehensive loss, net of taxes:Unrecognized pension items (172.5) (146.1) Cumulative translation adjustment (721.7) (728.6) Unrealized net loss on net investment hedges (67.5) (34.5) Unrealized net (loss) gain on cash flow hedges (1.8) 0.2
Total accumulated other comprehensive loss, net of taxes (963.5) (909.0) Total stockholders’ equity (deficit) 172.5 (196.2) Total liabilities and stockholders’ equity (deficit) $ 6,083.8 $ 5,765.2
See accompanying Notes to Consolidated Financial Statements.
SEALED AIR CORPORATION AND SUBSIDIARIES
69

Consolidated Statements of Operations Year Ended December 31,(In USD millions, except per share data) 2020 2019 2018Net sales $ 4,903.2 $ 4,791.1 $ 4,732.7 Cost of sales 3,293.9 3,226.3 3,230.6
Gross profit 1,609.3 1,564.8 1,502.1 Selling, general and administrative expenses 772.7 915.5 782.3 Amortization expense of intangible assets acquired 37.5 28.9 15.7 Restructuring charges 11.0 41.9 47.8
Operating profit 788.1 578.5 656.3 Interest expense, net (174.4) (184.1) (177.9) Foreign currency exchange loss due to highly inflationary economies (4.7) (4.6) (2.5) Other income (expense), net 17.2 (19.5) (18.1) Earnings before income tax provision 626.2 370.3 457.8 Income tax provision 142.1 76.6 307.5 Net earnings from continuing operations 484.1 293.7 150.3 Gain (Loss) on sale of discontinued operations, net of tax 18.8 (30.7) 42.8 Net earnings $ 502.9 $ 263.0 $ 193.1 Basic:Continuing operations $ 3.12 $ 1.90 0.94 Discontinued operations 0.12 (0.20) 0.27 Net earnings per common share - basic $ 3.24 $ 1.70 $ 1.21 Diluted:Continuing operations $ 3.10 $ 1.89 $ 0.94 Discontinued operations 0.12 (0.20) 0.26 Net earnings per common share - diluted $ 3.22 $ 1.69 $ 1.20 Weighted average number of common shares outstanding in millions:
Basic 155.2 154.3 159.4 Diluted 156.0 155.2 160.2
See accompanying Notes to Consolidated Financial Statements.
SEALED AIR CORPORATION AND SUBSIDIARIES
70
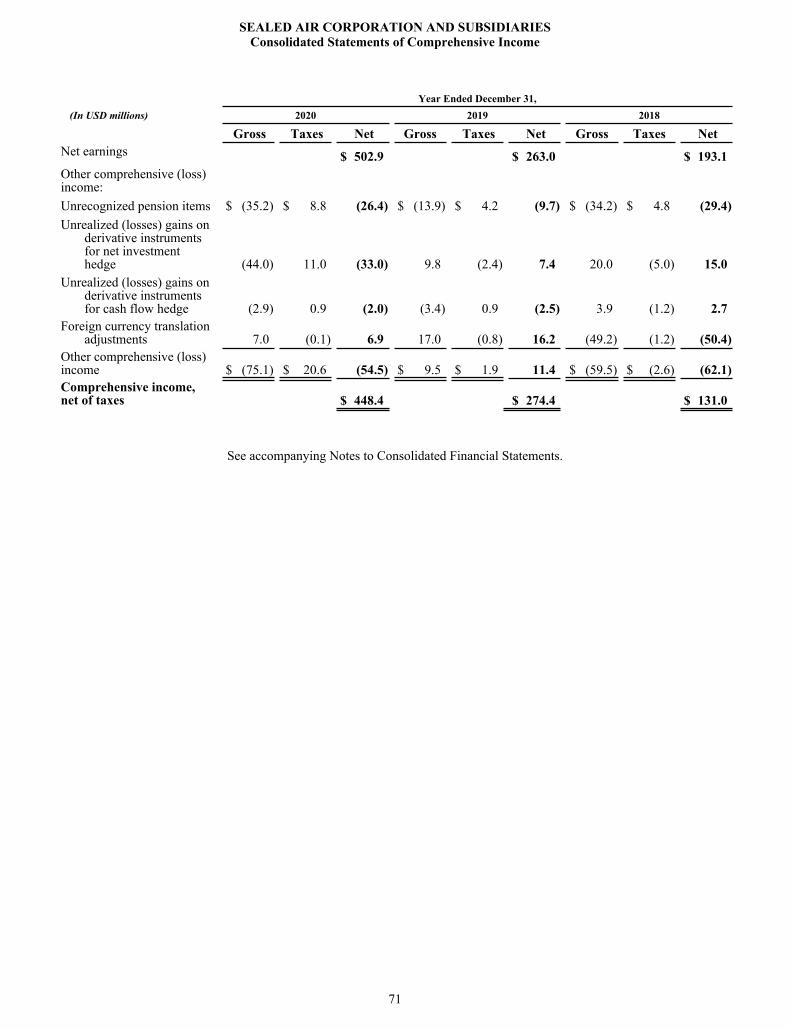
Consolidated Statements of Comprehensive Income
Year Ended December 31,(In USD millions) 2020 2019 2018
Gross Taxes Net Gross Taxes Net Gross Taxes NetNet earnings $ 502.9 $ 263.0 $ 193.1 Other comprehensive (loss) income: Unrecognized pension items $ (35.2) $ 8.8 (26.4) $ (13.9) $ 4.2 (9.7) $ (34.2) $ 4.8 (29.4) Unrealized (losses) gains on
derivative instruments for net investment hedge (44.0) 11.0 (33.0) 9.8 (2.4) 7.4 20.0 (5.0) 15.0
Unrealized (losses) gains on derivative instruments for cash flow hedge (2.9) 0.9 (2.0) (3.4) 0.9 (2.5) 3.9 (1.2) 2.7
Foreign currency translation adjustments 7.0 (0.1) 6.9 17.0 (0.8) 16.2 (49.2) (1.2) (50.4)
Other comprehensive (loss) income $ (75.1) $ 20.6 (54.5) $ 9.5 $ 1.9 11.4 $ (59.5) $ (2.6) (62.1) Comprehensive income, net of taxes $ 448.4 $ 274.4 $ 131.0
See accompanying Notes to Consolidated Financial Statements.
SEALED AIR CORPORATION AND SUBSIDIARIES
71

Consolidated Statements of Stockholders’ Equity (Deficit)
(In USD millions)Common
Stock
AdditionalPaid-inCapital
RetainedEarnings
CommonStock inTreasury
Accumulated Other
ComprehensiveLoss, Net of Taxes
TotalStockholders’
Equity (Deficit)
Balance at December 31, 2017 $ 23.0 $ 1,939.6 $ 1,735.2 $ (2,700.6) $ (844.9) $ 152.3 Effect of share-based incentive compensation 0.2 29.2 — (8.0) — 21.4 Stock issued for profit sharing contribution paid in stock — 0.8 — 23.8 — 24.6 Repurchases of common stock — 80.0 — (651.7) — (571.7) Unrecognized pension items, net of taxes — — — — (29.4) (29.4) Foreign currency translation — — — — (50.4) (50.4) Unrealized gain on derivative instruments, net of taxes — — — — 17.7 17.7 Net earnings — — 193.1 — — 193.1 Dividends on common stock ($0.64 per share) — — (102.8) — — (102.8) Impact of recently adopted accounting standards (1) — — 10.0 — (13.4) (3.4) Balance at December 31, 2018 $ 23.2 $ 2,049.6 $ 1,835.5 $ (3,336.5) $ (920.4) $ (348.6) Effect of share-based incentive compensation — 23.4 — — — 23.4 Stock issued for profit sharing contribution paid in stock — 0.5 — 21.4 — 21.9 Repurchases of common stock — — — (67.3) — (67.3) Unrecognized pension items, net of taxes — — — — (9.7) (9.7) Foreign currency translation — — — — 16.2 16.2 Unrealized gain on derivative instruments, net of taxes — — — — 4.9 4.9 Net earnings — — 263.0 — — 263.0 Dividends on common stock ($0.64 per share) — — (100.0) — — (100.0) Balance at December 31, 2019 $ 23.2 $ 2,073.5 $ 1,998.5 $ (3,382.4) $ (909.0) $ (196.2) Effect of share-based incentive compensation — 31.2 — — — 31.2 Stock issued for profit sharing contribution paid in stock — (11.7) — 36.1 — 24.4 Repurchases of common stock — — — (34.6) — (34.6) Unrecognized pension items, net of taxes — — — — (26.4) (26.4) Foreign currency translation adjustments, net of taxes — — — — 6.9 6.9 Unrealized loss on derivative instruments, net of taxes — — — — (35.0) (35.0) Net earnings — — 502.9 — — 502.9 Dividends on common stock ($0.64 per share) — — (100.7) — — (100.7) Balance at December 31, 2020 $ 23.2 $ 2,093.0 $ 2,400.7 $ (3,380.9) $ (963.5) $ 172.5
See accompanying Notes to Consolidated Financial Statements.
(1) Due to the adoption of ASU 2016-16, Income Taxes (Topic 740): Intra-Entity Transfers of Assets Other Than Inventory and ASU 2014-09, Revenue from Contracts with Customers (Topic 606) as of January 1, 2018, the Company recorded decreases to retained earnings of $1.0 million and $2.4 million, respectively. Additionally, due to the adoption of ASU 2018-02, Income Statement - Reporting Comprehensive Income (Topic 220): Reclassification of Certain Tax Effects from Accumulated Other Comprehensive Income as of October 1, 2018, the Company recorded an increase to retained earnings of $13.4 million from accumulated other comprehensive loss.
SEALED AIR CORPORATION AND SUBSIDIARIES
72
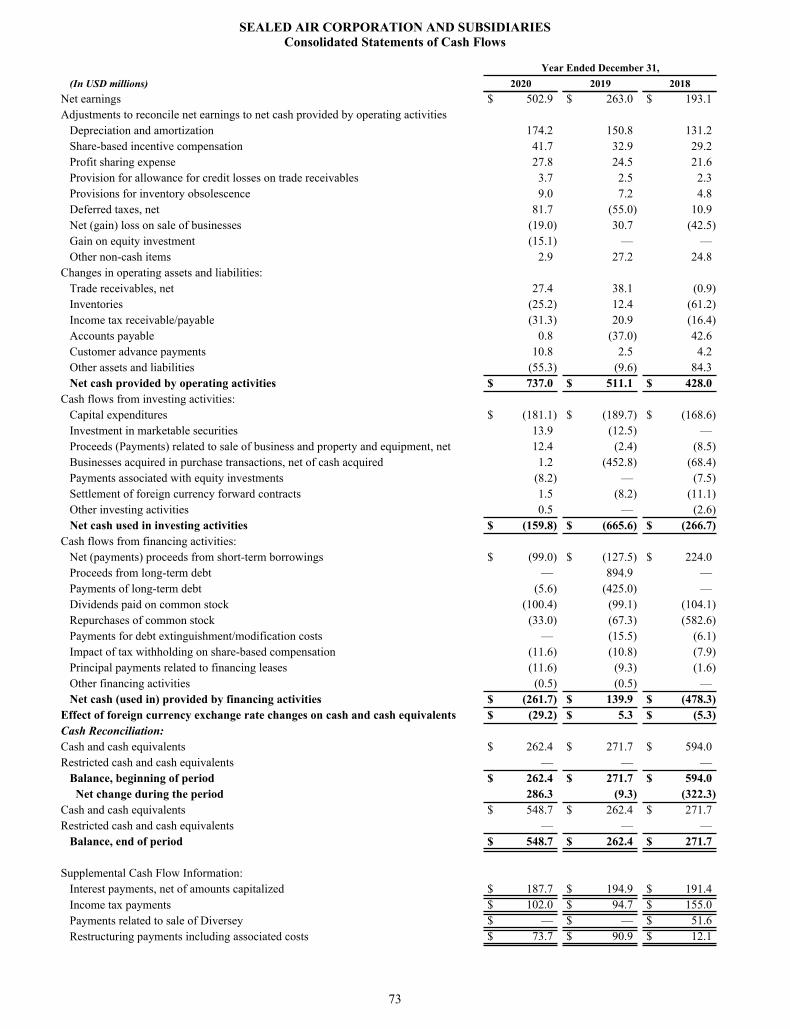
Consolidated Statements of Cash Flows
Year Ended December 31,(In USD millions) 2020 2019 2018
Net earnings $ 502.9 $ 263.0 $ 193.1 Adjustments to reconcile net earnings to net cash provided by operating activities
Depreciation and amortization 174.2 150.8 131.2 Share-based incentive compensation 41.7 32.9 29.2 Profit sharing expense 27.8 24.5 21.6 Provision for allowance for credit losses on trade receivables 3.7 2.5 2.3 Provisions for inventory obsolescence 9.0 7.2 4.8 Deferred taxes, net 81.7 (55.0) 10.9 Net (gain) loss on sale of businesses (19.0) 30.7 (42.5) Gain on equity investment (15.1) — — Other non-cash items 2.9 27.2 24.8
Changes in operating assets and liabilities:Trade receivables, net 27.4 38.1 (0.9) Inventories (25.2) 12.4 (61.2) Income tax receivable/payable (31.3) 20.9 (16.4) Accounts payable 0.8 (37.0) 42.6 Customer advance payments 10.8 2.5 4.2 Other assets and liabilities (55.3) (9.6) 84.3 Net cash provided by operating activities $ 737.0 $ 511.1 $ 428.0
Cash flows from investing activities:Capital expenditures $ (181.1) $ (189.7) $ (168.6) Investment in marketable securities 13.9 (12.5) — Proceeds (Payments) related to sale of business and property and equipment, net 12.4 (2.4) (8.5) Businesses acquired in purchase transactions, net of cash acquired 1.2 (452.8) (68.4) Payments associated with equity investments (8.2) — (7.5) Settlement of foreign currency forward contracts 1.5 (8.2) (11.1) Other investing activities 0.5 — (2.6) Net cash used in investing activities $ (159.8) $ (665.6) $ (266.7)
Cash flows from financing activities:Net (payments) proceeds from short-term borrowings $ (99.0) $ (127.5) $ 224.0 Proceeds from long-term debt — 894.9 — Payments of long-term debt (5.6) (425.0) — Dividends paid on common stock (100.4) (99.1) (104.1) Repurchases of common stock (33.0) (67.3) (582.6) Payments for debt extinguishment/modification costs — (15.5) (6.1) Impact of tax withholding on share-based compensation (11.6) (10.8) (7.9) Principal payments related to financing leases (11.6) (9.3) (1.6) Other financing activities (0.5) (0.5) — Net cash (used in) provided by financing activities $ (261.7) $ 139.9 $ (478.3)
Effect of foreign currency exchange rate changes on cash and cash equivalents $ (29.2) $ 5.3 $ (5.3) Cash Reconciliation:Cash and cash equivalents $ 262.4 $ 271.7 $ 594.0 Restricted cash and cash equivalents — — —
Balance, beginning of period $ 262.4 $ 271.7 $ 594.0 Net change during the period 286.3 (9.3) (322.3)
Cash and cash equivalents $ 548.7 $ 262.4 $ 271.7 Restricted cash and cash equivalents — — —
Balance, end of period $ 548.7 $ 262.4 $ 271.7
Supplemental Cash Flow Information:Interest payments, net of amounts capitalized $ 187.7 $ 194.9 $ 191.4 Income tax payments $ 102.0 $ 94.7 $ 155.0 Payments related to sale of Diversey $ — $ — $ 51.6 Restructuring payments including associated costs $ 73.7 $ 90.9 $ 12.1
SEALED AIR CORPORATION AND SUBSIDIARIES
73

Year Ended December 31,(In USD millions) 2020 2019 2018Non-cash items:Transfers of shares of common stock from treasury for profit-sharing plan
contributions $ 24.4 $ 21.9 $ 23.5
See accompanying Notes to Consolidated Financial Statements.
SEALED AIR CORPORATION AND SUBSIDIARIES
74

Notes to Consolidated Financial Statements
Note 1 Organization and Nature of Operations
We are a leading global provider of packaging solutions for the food, e-Commerce and industrial markets. Our portfolio of packaging solutions includes Cryovac® brand food packaging, Sealed Air® brand protective packaging, Autobag® brand automated packaging systems, and Bubble Wrap® brand packaging. We serve an array of end markets including food and beverage processing, food service, retail, and commercial and consumer applications. Sealed Air provides solutions integrating packaging materials, automated equipment, and services to provide essential protection for products and people which enable our customers to automate, reduce waste, simplify processes, and remove people from harm's way. We are investing in innovations that bring the industry toward a more sustainable future while providing food safety and security and product protection. We have established leading market positions through our differentiated materials, equipment and services, iconic brands, well-established customer relationships and global scale and market access.
We conduct substantially all of our business through two wholly-owned subsidiaries, Cryovac, LLC and Sealed Air Corporation (US). Throughout this report, when we refer to “Sealed Air,” the “Company,” “we,” “our,” or “us,” we are referring to Sealed Air Corporation and all of our subsidiaries, except where the context indicates otherwise.
Note 2 Summary of Significant Accounting Policies and Recently Issued Accounting Standards
Summary of Significant Accounting Policies
Basis of Presentation
Our Consolidated Financial Statements include all of the accounts of the Company and our subsidiaries. We have eliminated all significant intercompany transactions and balances in consolidation. All amounts are in U.S. dollar denominated in millions, except per share amounts and unless otherwise noted, and are approximate due to rounding.
Starting in the second quarter 2020, we renamed our reporting segments from Food Care to Food and from Product Care to Protective. This segment reporting name change aligns with our use internally and in the markets we serve. There has been no change in the composition of the segments and no impact on prior period results of our reporting segments.
When we cross reference to a “Note,” we are referring to our “Notes to Consolidated Financial Statements,” unless the context indicates otherwise.
Use of Estimates
The preparation of our Consolidated Financial Statements and related disclosures in conformity with U.S. GAAP requires our management to make estimates and assumptions that affect the reported amounts of assets and liabilities, the disclosure of contingent assets and liabilities at the date of the financial statements and revenue and expenses during the period reported. These estimates include, among other items, assessing the expected credit losses of receivables, asset retirement obligations, the use and recoverability of inventory, the estimation of fair value of financial instruments, assumptions used in the calculation of income taxes, useful lives and recoverability of tangible assets and goodwill and other intangible assets, assumptions used in our defined benefit pension plans and other post-employment benefit plans, estimates related to self-insurance such as the aggregate liability for uninsured claims using historical experience, insurance and actuarial estimates and estimated trends in claim values, fair value measurement of assets, costs for incentive compensation and accruals for commitments and contingencies. We review these estimates and assumptions periodically using historical experience and other factors and reflect the effects of any revisions in the Consolidated Financial Statements in the period we determine any revisions to be necessary. Actual results could differ from these estimates.
Financial Instruments
We may use financial instruments, such as cross-currency swaps, interest rate swaps, caps and collars, U.S. Treasury lock agreements and foreign currency exchange forward contracts and options related to our borrowing and trade activities. We may use these financial instruments from time to time to manage our exposure to fluctuations in interest rates and foreign currency exchange rates. We do not purchase, hold or sell derivative financial instruments for trading purposes. We face credit risk if the counterparties to these transactions are unable to perform their obligations. Our policy is to have counterparties to these contracts that have at least an investment grade rating.
SEALED AIR CORPORATION AND SUBSIDIARIES
75

We report derivative instruments at fair value and establish criteria for designation and effectiveness of transactions entered into for hedging purposes. Before entering into any derivative transaction, we identify our specific financial risk, the appropriate hedging instrument to use to reduce this risk, and the correlation between the financial risk and the hedging instrument. We use forecasts and historical data as the basis for determining the anticipated values of the transactions to be hedged. We do not enter into derivative transactions that do not have a high correlation with the underlying financial risk we are trying to reduce. We regularly review our hedge positions and the correlation between the transaction risks and the hedging instruments.
We account for derivative instruments as hedges of the related underlying risks if we designate these derivative instruments as hedges and the derivative instruments are effective as hedges of recognized assets or liabilities, forecasted transactions, unrecognized firm commitments or forecasted intercompany transactions.
We record gains and losses on derivatives qualifying as cash flow hedges in Accumulated other comprehensive loss (“AOCL”), to the extent that hedges are effective and until the underlying transactions are recognized on the Consolidated Statements of Operations, at which time we also recognize the gains or losses of the derivatives on the Consolidated Statements of Operations. We recognize gains and losses on qualifying fair value hedges and the related loss or gain on the hedged item attributable to the hedged risk on the Consolidated Statements of Operations.
Generally, our practice is to terminate derivative transactions if the underlying asset or liability matures or is sold or terminated, or if we determine the underlying forecasted transaction is no longer probable of occurring. Any deferred gains or losses associated with derivative instruments are recognized on the Consolidated Statements of Operations over the period in which the income or expense on the underlying hedged transaction is recognized.
See Note 15, “Derivatives and Hedging Activities,” for further details.
Foreign Currency Translation
In non-U.S. locations that are not considered highly inflationary, we translate the balance sheets at the end of period exchange rates with translation adjustments accumulated in stockholders’ equity (deficit) on our Consolidated Balance Sheets. We translate the statements of operations at the average exchange rates during the applicable period.
We translate assets and liabilities of our operations in countries with highly inflationary economies at the end of period exchange rates, except that nonmonetary asset and liability amounts are translated at historical exchange rates. In countries with highly inflationary economies, we translate items reflected in the statements of operations at average rates of exchange prevailing during the period, except that nonmonetary amounts are translated at historical exchange rates.
Impact of Inflation and Currency Fluctuation
Argentina - Economic and political events in Argentina have continued to expose us to heightened levels of foreign currency exchange risk. As of July 1, 2018, Argentina was designated as a highly inflationary economy under U.S. GAAP, and the U.S. dollar replaced the Argentine peso as the functional currency for our subsidiaries in Argentina. All Argentine peso-denominated monetary assets and liabilities were remeasured into U.S. dollars using the current exchange rate available to us, and any changes in the exchange rate are reflected in net foreign exchange transaction loss, within Foreign currency exchange loss due to highly inflationary economies on the Consolidated Statements of Operations. For the years ended December 31, 2020, 2019 and 2018, the Company recorded a $4.7 million, a $4.6 million, and a $2.4 million remeasurement loss, respectively. The exchange rate as of December 31, 2020, 2019 and 2018 was 84.1461, 59.8723 and 37.6679, respectively.
We will continue to evaluate each reporting period the appropriate exchange rate to remeasure our financial statements based on the facts and circumstances as applicable.
Commitments and Contingencies — Litigation
On an ongoing basis, we assess the potential liabilities related to any lawsuits or claims brought against us. While it is typically very difficult to determine the timing and ultimate outcome of these actions, we use our best judgment to determine if it is probable that we will incur an expense related to the settlement or final adjudication of these matters and whether a reasonable estimation of the probable loss, if any, can be made. In assessing probable losses, we make estimates of the amount of insurance recoveries, if any. We accrue a liability when we believe a loss is probable and the amount of loss can be reasonably estimated. Due to the inherent uncertainties related to the eventual outcome of litigation and potential insurance recovery, it is possible that disputed matters may be resolved for amounts materially different from any provisions or disclosures that we have previously made. We expense legal costs, including those legal costs expected to be incurred in connection with a loss contingency, as incurred.
76

Revenue Recognition
Revenue from contracts with customers is recognized using a five-step model consisting of the following: (1) identify the contract with a customer; (2) identify the performance obligations in the contract; (3) determine the transaction price; (4) allocate the transaction price to the performance obligations in the contract; and (5) recognize revenue when (or as) the Company satisfies a performance obligation. Performance obligations are satisfied when the Company transfers control of a good or service to a customer, which can occur over time or at a point in time. The amount of revenue recognized is based on the consideration to which the Company expects to be entitled in exchange for those goods or services, including the expected value of variable consideration. The customer’s ability and intent to pay the transaction price is assessed in determining whether a contract exists with the customer. If collectability of substantially all of the consideration in a contract is not probable, consideration received is not recognized as revenue unless the consideration is nonrefundable and the Company no longer has an obligation to transfer additional goods or services to the customer or collectability becomes probable.
Sales taxes collected from customers and remitted to governmental authorities are accounted for on a net basis and therefore are excluded from net sales on the Consolidated Statements of Operations.
Charges for rebates and other allowances are recognized as a deduction from revenue on an accrual basis in the period in which the associated revenue is recorded. When we estimate our rebate accruals, we consider customer-specific contractual commitments including stated rebate rates and history of actual rebates paid. Our rebate accruals are reviewed at each reporting period and adjusted to reflect data available at that time. We adjust the accruals to reflect any differences between estimated and actual amounts. These adjustments impact the amount of net sales recognized by us in the period of adjustment. Charges for rebates and other allowances were approximately 5% of sales in 2020, 4% of sales in 2019 and 5% of sales in 2018. Refer to Note 3, “Revenue Recognition, Contracts with Customers,” for further discussion of revenue.
Costs to obtain or fulfill a Contract and Shipping and Handling Costs
The Company recognizes incremental costs to obtain a contract as an expense when incurred if the amortization period of the asset that otherwise would have been recognized is one year or less. For example, the Company generally expenses sales commissions when incurred because the amortization period would have been one year or less. These costs are recorded within selling, general and administrative expenses on the Consolidated Statements of Operations.
Costs for shipping and handling activities performed after a customer obtains control of a good are accounted for as costs to fulfill a contract and are included in cost of goods sold.
Research and Development
We expense research and development costs as incurred. Research and development costs were $95.9 million in 2020, $77.3 million in 2019 and $80.8 million in 2018. In 2020, we brought our Packaging Application Centers and certain engineering teams under our overall Innovation, Research and Development organization to focus the centers and teams on innovation and product development. This move follows an operational change as well as a shift in organizational reporting and responsibility. As a result, approximately $12.6 million in expenses related to the centers and those engineering teams are now included in research and development expenses for 2020. Previously, these costs were primarily considered sales and marketing expenses within selling, general and administrative expenses on the Consolidated Statements of Operations.
Share-Based Incentive Compensation
At the 2014 Annual Meeting, the 2014 Omnibus Incentive Plan (the “Omnibus Plan”) was approved by our stockholders. Subsequently, the Board of Directors adopted, and at the 2018 Annual Stockholders' Meeting, our stockholders approved, an amendment and restatement to the 2014 Omnibus Incentive Plan. See Note 21, “Stockholders’ Equity (Deficit),” of the Notes for further information on this plan.
We record share-based compensation awards exchanged for employee services at fair value on the date of grant and record the expense for these awards in cost of sales and in selling, general and administrative expense, as applicable, on our Consolidated Statements of Operations over the requisite employee service period. Share-based incentive compensation expense includes an estimate for forfeitures and anticipated achievement levels and is generally recognized over the expected term of the award on a straight-line basis. The Company accelerates expense on performance-based awards using a graded vesting schedule for employees who meet retirement eligibility requirements prior to the end of the award’s service period. For performance-based awards, the Company reassesses at each reporting date whether achievement of the performance condition is probable and accrues compensation expense if and when achievement of the performance condition is probable. For performance awards with market-based conditions, the fair value of the award is determined at the grant date and is recognized at 100% over the performance period regardless of actual market condition performance.
77
Income Taxes
We file a consolidated U.S. federal income tax return and our non-U.S. subsidiaries file income tax returns in their respective local jurisdictions. We provide for income taxes on those portions of our foreign subsidiaries’ accumulated earnings that we believe are not reinvested indefinitely in our businesses.
We account for income taxes under the asset and liability method to provide for income taxes on all transactions recorded in the Consolidated Financial Statements. We recognize deferred tax assets and liabilities for the future tax consequences attributable to differences between the financial statement carrying amounts of existing assets and liabilities and their respective tax bases and tax benefit carryforwards. We determine deferred tax assets and liabilities at the end of each period using enacted tax rates.
In assessing the need for a valuation allowance, we estimate future reversals of existing temporary differences, future taxable earnings, with consideration for the feasibility of ongoing planning strategies, taxable income in carryback periods and past operating results to determine which deferred tax assets are more likely than not to be realized in the future. Changes to tax laws, statutory tax rates and future taxable earnings can have an impact on valuation allowances related to deferred tax assets.
We recognize the tax benefit from an uncertain tax position only if it is more likely than not that the tax position will be sustained on examination by the taxing authorities, based on the technical merits of the position. The tax benefits recognized in the financial statements from such positions are measured based on the largest amount of benefit that has a greater than fifty percent likelihood of being realized upon settlement with tax authorities. We recognize interest and penalties related to unrecognized tax benefits in income tax expense on our Consolidated Statements of Operations. See Note 19, “Income Taxes,” for further discussion.
Cash and Cash Equivalents
We consider highly liquid investments with original maturities of three months or less to be cash equivalents. Our policy is to invest cash in excess of short-term operating and debt service requirements in cash equivalents. Cash equivalents are stated at cost, which approximates fair value because of the short-term maturity of the instruments. Our policy is to transact with counterparties that are rated at least A- by Standard & Poor’s and A3 by Moody’s. Some of our operations are located in countries that are rated below A- or A3. In this case, we try to minimize our risk by holding cash and cash equivalents at financial institutions with which we have existing global relationships whenever possible, diversifying counterparty exposures and minimizing the amount held by each counterparty and within the country in total.
Time deposits or certificate of deposits with maturities greater than 90 days from the time of purchase are considered marketable securities and classified as other current assets in our Consolidated Balance Sheets. Any investments made in longer-term time deposits or maturities and conversion out of the longer-term time deposits during the current year are reflected as an investment in marketable securities on our Consolidated Statements of Cash Flows. As of December 31, 2020 and 2019, we had $0 and $13.2 million, respectively, deposited in time deposits with a maturity greater than 90 days.
Accounts Receivable Securitization Programs
We and a group of our U.S. operating subsidiaries maintain an accounts receivable securitization program under which they sell eligible U.S. accounts receivable to an indirectly wholly-owned subsidiary that was formed for the sole purpose of entering into this program. The wholly-owned subsidiary in turn may sell an undivided fractional ownership interest in these receivables with two banks and an issuer of commercial paper administered by these banks. The wholly-owned subsidiary retains the receivables it purchases from the operating subsidiaries. Any transfers of undivided fractional ownership interests of receivables under the U.S. receivables securitization program to the two banks and an issuer of commercial paper administered by these banks are considered secured borrowings with pledge of collateral and will be classified as short-term borrowings on our Consolidated Balance Sheets. The net trade receivables that served as collateral for these borrowings are reclassified from trade receivables, net to prepaid expenses and other current assets on the Consolidated Balance Sheets.
We have a European accounts receivable securitization and purchase program with a special purpose vehicle, or SPV, two banks and a group of our European subsidiaries. The European program is structured to be a securitization of certain trade receivables that are originated by certain of our European subsidiaries. The SPV borrows funds from the banks to fund its acquisition of the receivables and provides the banks with a first priority perfected security interest in the accounts receivable. We do not have an equity interest in the SPV. We concluded the SPV is a variable interest entity because its total equity investment at risk is not sufficient to permit the SPV to finance its activities without additional subordinated financial support from the bank via loans or via the collections from accounts receivable already purchased. Additionally, we are considered the primary beneficiary of the SPV since we control the activities of the SPV, and are exposed to the risk of uncollectable receivables held by the SPV. Therefore, the SPV is consolidated in our Consolidated Financial Statements. Any activity between the participating subsidiaries and the SPV is eliminated in consolidation. Loans from the banks to the SPV will be
78
classified as short-term borrowings on our Consolidated Balance Sheets. The net trade receivables that served as collateral for these borrowings are reclassified from trade receivables, net to prepaid expenses and other current assets on the Consolidated Balance Sheets. See Note 10, “Accounts Receivable Securitization Programs,” for further details.
Accounts Receivable Factoring Agreements
The Company has entered factoring agreements and customers' supply chain financing arrangements, to sell certain trade receivables to unrelated third-party financial institutions. We account for these transactions in accordance with Accounting Standards Codification (“ASC”) 860, “Transfers and Servicing” (“ASC 860”). ASC 860 allows for the ownership transfer of accounts receivable to qualify for sale treatment when the appropriate criteria is met, which permits the Company to present the balances sold under the program to be excluded from Trade receivables, net on the Consolidated Balance Sheets. Receivables are considered sold when (i) they are transferred beyond the reach of the Company and its creditors, (ii) the purchaser has the right to pledge or exchange the receivables, and (iii) the Company has no continuing involvement in the transferred receivables. In addition, the Company provides no other forms of continued financial support to the purchaser of the receivables once the receivables are sold. See Note 11, “Accounts Receivable Factoring Agreements,” for further details.
Trade Receivables, Net
In the normal course of business, we extend credit to customers that satisfy pre-defined credit criteria. Trade receivables, which are included on the Consolidated Balance Sheets, are stated at amounts due from our customers net of allowances for expected credit losses on trade receivables.
Allowance for Credit Losses
We are exposed to credit losses primarily through our sales of packaging solutions to third-party customers. Our customer's (the counterparty) ability to pay is assessed through our internal credit review processes. Based on the dollar value of credit extended, we assess our customers' credit by reviewing the total expected receivable exposure, expected timing of payments and the customers' established credit rating. In determining customer creditworthiness, we assess our customers' credit utilizing different resources including external credit validations and/or our own assessment through analysis of the customers' financial statements and review of trade/bank references. We also consider contract terms and conditions, country and political risk, and the customer's mix of products purchased (for example: equipment vs. materials) in our evaluation. A credit limit is established for each customer based on the outcome of this review. Credit limits are reviewed at least annually for existing customers.
We monitor our ongoing credit exposure through active review of counterparty balances against contract terms and due dates. Our activities are performed at both the country/entity level as well as the regional level. Monitoring and review activities include account reconciliations, analysis of aged receivables, resolution status review for disputed amounts, and identification and remediation of counter-parties experiencing payment issues. Our management reviews current credit exposure at least quarterly based on level of risk and amount of exposure.
When necessary, we utilize collection agencies and legal counsel to pursue recovery of defaulted receivables. Trade receivable balances are written off when deemed to be uncollectible and after collection efforts have been exhausted. Our annual historical credit losses have been approximately 0.1%, or less, of net trade sales over the last three years.
Our allowance for credit losses on trade receivables is assessed at the end of each quarter based on an analysis of historical losses and our assessment of future expected losses. For the years ended December 31, 2020, 2019 and 2018, $3.7 million, $2.5 million and $2.3 million, respectively, was charged to our allowance for credit losses related to our trade receivables.
Supply Chain Financing Arrangements
We facilitate a voluntary supply chain financing program to provide some of our suppliers with the opportunity to sell receivables due from us (our accounts payables) to participating financial institutions at the sole discretion of both the suppliers and the financial institutions. These programs are administered by participating financial institutions. Should the supplier choose to participate in the program, it will receive payment from the financial institution in advance of agreed payment terms; our responsibility is limited to making payments to the respective financial institutions on the terms originally negotiated with our supplier. The range of payment terms is consistent regardless of a vendor's participation in the program. We monitor our days payable outstanding relative to our peers and industry trends in order to assess our conclusion that these programs continue to be trade payable programs and not indicative of borrowing arrangements. The liabilities continue to be presented as trade
79

payables in our consolidated balance sheets until they are paid, and they are reflected as cash flows from operating activities when settled.
Equity Investments
We hold strategic investments in other companies. These investments are accounted for under the measurement alternative described in ASC 321 for equity investments that do not have readily determinable fair values. These investments are measured at cost, less impairment, if any, plus or minus changes resulting from observable price changes in orderly transactions for identical or similar investments of the same issuer. We do not exercise significant influence over these companies. These investments are carried on our Consolidated Balance Sheets within Other non-current assets. Changes in fair value based on impairment or resulting from observable price changes are recorded to net income and included within Other income (expense), net on the Consolidated Statements of Operations. See Note 16, “Fair Value Measurements, Equity Investments and Other Financial Instruments,” for further details.
Inventories, Net
Our inventories are determined using the FIFO method or a weighted average for some raw materials. We state inventories at the lower of cost or net realizable value. Costs related to inventories include raw materials, direct labor and manufacturing overhead which are included in cost of sales on the Consolidated Statements of Operations.
Property and Equipment, Net
We state property and equipment at cost, except for property and equipment that have been impaired, for which we reduce the carrying amount to the estimated fair value at the impairment date. We capitalize significant improvements and charge repairs and maintenance costs that do not extend the lives of the assets to expense as incurred. We remove the cost and accumulated depreciation of assets sold or otherwise disposed of from the accounts and recognize any resulting gain or loss upon the disposition of the assets.
We depreciate the cost of property and equipment over their estimated useful lives on a straight-line basis as follows: buildings, including leasehold improvements — 10 to 40 years; machinery and equipment — 5 to 10 years; and other property and equipment — 2 to 10 years.
Leases
Sealed Air is involved in leasing activity as both a lessee and a lessor. Sealed Air is the lessor primarily for equipment used by our customers to meet their packaging needs. Sealed Air is the lessee of property used for production and for sales and administrative functions, including real property, buildings, manufacturing and office equipment, offices and automobiles.
We recognize a right-of-use (“ROU”) asset and lease liability for all leases with terms of more than 12 months, in accordance with ASC 842. We utilize the short-term lease recognition exemption for all asset classes as part of our on-going accounting under ASC 842. This means, for those leases that qualify, we will not recognize ROU assets or lease liabilities. Recognition, measurement and presentation of expenses depends on classification as a finance or operating lease.
As a lessee, we utilize the reasonably certain threshold criteria in determining which options we will exercise. Furthermore, some of our lease payments are based on index rates with minimum annual increases. These represent fixed payments and are captured in the future minimum lease payments calculation. In determining the discount rate to use in calculating the present value of lease payments, we estimate the rate of interest we would pay on a collateralized loan with the same payment terms as the lease by utilizing our bond yields traded in the secondary market to determine the estimated cost of funds for the particular tenor. We update our assumptions and discount rates on a quarterly basis.
We have also elected the practical expedient to not separate lease and non-lease components for all asset classes, meaning all consideration that is fixed, or in-substance fixed, will be captured as part of our lease components for balance sheet purposes. Furthermore, all variable payments included in lease agreements will be disclosed as variable lease expense when incurred. Generally, variable lease payments are based on usage and common area maintenance. These payments will be included as variable lease expense when recognized.
Our contractual obligations for operating leases as a lessor can include termination and renewal options. Our contractual obligations for sales-type leases tend to have fixed terms and can include purchase options. We utilize the reasonably certain threshold criteria in determining which options our customers will exercise.
80

Goodwill and Identifiable Intangible Assets, Net
Goodwill represents the excess of the purchase price over the estimated fair value of the net assets acquired, including the amount assigned to identifiable intangible assets.
Identifiable intangible assets consist primarily of patents, licenses, trademarks, trade names, customer lists and relationships, non-compete agreements and technology-based intangibles and other contractual agreements. We amortize finite lived identifiable intangible assets over the shorter of their stated or statutory duration or their estimated useful lives, currently ranging from 2 to 28 years, on a straight-line basis to their estimated residual values and review them for impairment upon the identification of events or changes in circumstances that indicate the carrying amount of the asset may not be recoverable.
We use the acquisition method of accounting for all business combinations and do not amortize goodwill or intangible assets with indefinite useful lives. Goodwill and intangible assets with indefinite useful lives are tested for possible impairment annually during the fourth quarter of each fiscal year or more frequently if events or changes in circumstances indicate that the asset might be impaired. See Note 9, “Goodwill and Identifiable Intangible Assets, net,” for further details.
Impairment and Disposal of Long-Lived Assets
For finite-lived intangible assets, such as customer relationships, contracts, intellectual property, and for other long-lived assets, such as property, plant and equipment, whenever impairment indicators are present, we perform a review for impairment. The impairment model is a two step test under which we first calculate the recoverability of the carrying value by comparing the undiscounted value of the projected cash flows associated with the asset or asset group, including its estimated residual value, to the carrying amount. If the cash flows associated with the asset or asset group are less than the carrying value, we calculate the fair value of the asset, or asset group. If the carrying amount is found to be greater than the fair value, we record an impairment loss for the excess of carrying value over the fair value. In addition, in all cases of an impairment review, we re-evaluate the remaining useful lives of the assets and modify them, as appropriate.
Self-Insurance
We retain the obligation for specified claims and losses related to property, casualty, workers’ compensation and employee benefit claims. We accrue for outstanding reported claims and claims that have been incurred but not reported based upon management’s estimates of the aggregate liability for retained losses using historical experience, insurance company estimates and the estimated trends in claim values. Our estimates include management’s and independent insurance companies’ assumptions regarding economic conditions, the frequency and severity of claims and claim development patterns and settlement practices. These estimates and assumptions are monitored and evaluated on a periodic basis by management and are adjusted when warranted by changing circumstances. Although management believes it has the ability to adequately project and record estimated claim payments, actual results could differ significantly from the recorded liabilities.
Pensions
For a number of our U.S. and international employees, we maintain defined benefit pension plans. We are required to make assumptions regarding the valuation of projected benefit obligations and the performance of plan assets for our defined benefit pension plans.
We review and approve the assumptions made by our third-party actuaries regarding the valuation of benefit obligations and performance of plan assets. The most significant assumptions used to determine the benefit obligation and expense of the pension plans are the discount rate used to measure future obligations and the expected future rate of return on plan assets. The measurement date used to determine benefit obligations and plan assets is December 31. In general, changes to these assumptions could impact our consolidated financial condition or results of operation.
See Note 17, “Profit Sharing, Retirement Savings Plans and Defined Benefit Pension Plans,” for information about the Company’s benefit plans.
Net Earnings per Common Share
Basic earnings per common share is calculated by dividing net earnings available to common stockholders by the weighted average number of common shares outstanding for the period. Non-vested share-based payment awards that contain non-forfeitable rights to dividends are treated as participating securities and therefore included in computing earnings per common share using the “two-class method.” The two-class method is an earnings allocation formula that calculates basic and diluted net earnings per common share for each class of common stock separately based on dividends declared and participation rights in undistributed earnings. Non-vested restricted stock issued under our Omnibus Plan prior to January 1, 2018 are considered participating securities since these securities have non-forfeitable rights to dividends when we declare a dividend
81

during the contractual vesting period of the share-based payment award and are therefore included in our earnings allocation formula using the two-class method.
When calculating diluted net earnings per common share, the more dilutive effect of applying either of the following is presented: (a) the two-class method (described above) assuming that the participating security is not exercised or converted, or, (b) the treasury stock method for the participating security. Our diluted net earnings per common share for all periods presented was calculated using the two-class method since such method was more dilutive.
See Note 24, “Net Earnings Per Common Share,” for further discussion.
Recently Adopted Accounting Standards
In March 2020, the FASB issued Accounting Standards Update (“ASU”) 2020-04, Reference Rate Reform (Topic 848): Facilitation of the Effects of Reference Rate Reform on Financial Reporting (“ASU 2020-04”). ASU 2020-04 provides optional guidance for a limited time to ease the potential burden in accounting for reference rate reform by providing expedients and exceptions related to accounting for contracts, hedging relationships and other transactions affected by reference rate reform, if certain criteria are met. The amendments only apply to contracts and hedging relationships that reference LIBOR or another reference rate expected to be discontinued due to reference rate reform. These amendments are effective upon issuance and may be applied prospectively to contract modifications made and hedging relationships entered into or evaluated on or before December 31, 2022. This standard update did not have a material impact on the Company's Consolidated Financial Statements.
In April 2019, the FASB issued ASU 2019-04, Codification Improvements to Topic 326, Financial Instruments - Credit Losses, Topic 815, Derivatives and Hedging and Topic 825, Financial Instruments, (“ASU 2019-04”). ASU 2019-04 provides updates and amendments to previously issued ASUs. The amendments clarify the scope of the credit losses standard and address issues related to accrued interest receivable balances, recoveries, variable interest rates and prepayments. Codification Improvements to Topic 326, Financial Instruments - Credit Losses were adopted as part of our adoption of ASU 2016-13 as of January 1, 2020. These amendments did not have a material impact on the Company's Consolidated Financial Statements. The amendments related to Derivatives and Hedging address partial-term fair value hedges and fair value hedge basis adjustments. Codification Improvements to Topic 815, Derivatives and Hedging were effective for us beginning July 1, 2019 and did not have a material impact on the Company's Consolidated Financial Statements. Amendments on Topic 825, Financial Instruments mainly address the scope of the guidance, the requirement for remeasurement under ASC 820 when using the measurement alternative, certain disclosure requirements and which equity securities have to be remeasured at historical exchange rates. We adopted the amendments related to Topic 825, Financial Instruments as of January 1, 2020 with no material impact on the Company's Consolidated Financial Statements.
In August 2018, the FASB issued ASU 2018-15, Intangibles - Goodwill and Other - Internal-Use Software (Subtopic 350-40), Customer's Accounting for Implementation Costs Incurred in a Cloud Computing Arrangement That Is a Service Contract (“ASU 2018-15”). ASU 2018-15 amends Accounting Standards Codification (“ASC”) 350-40 and aligns the accounting for costs incurred to implement a cloud computing arrangement that is a service contract with the guidance on capitalizing costs associated with developing or obtaining internal-use software. The guidance is effective for fiscal years beginning after December 15, 2019, including interim periods within those fiscal years. The Company adopted ASU 2018-15 on January 1, 2020, using a prospective approach. The adoption did not have a material impact on the Company's Consolidated Financial Statements.
In August 2018, the FASB issued ASU 2018-14, Compensation - Retirement Benefits - Defined Benefit Plans - General (Subtopic 715-20), Disclosure Framework - Changes to the Disclosure Requirements for Defined Benefit Plans (“ASU 2018-14”). ASU 2018-14 eliminates, adds and clarifies certain disclosure requirements related to defined benefit plans and other postretirement plans. The guidance is effective for fiscal years ending after December 15, 2020. We have adopted ASU 2018-14 for the year ending December 31, 2020. See Note 17, “Profit Sharing, Retirement Savings Plans and Defined Benefit Pension Plans,” and Note 18, “Other Post-Employment Benefits and Other Employee Benefit Plans” for new disclosures related to the cash balance interest crediting rate and qualitative discussion of discount rates and drivers of actuarial losses in the current year.
In August 2018, the FASB issued ASU 2018-13, Fair Value Measurement (Topic 820), Disclosure Framework - Changes to the Disclosure Requirements for Fair Value Measurement (“ASU 2018-13”). ASU 2018-13 amends the fair value measurement disclosure requirements of ASC 820, including new, eliminated and modified disclosure requirements. The guidance is effective for fiscal years beginning after December 15, 2019, including interim periods therein. The Company adopted ASU 2018-13 on January 1, 2020. The adoption did not have an impact on the Company's Consolidated Financial Statements.
82

In June 2016, the FASB issued ASU 2016-13, Financial Instruments — Credit Losses (Topic 326), Measurement of Credit Losses on Financial Instruments (“ASU 2016-13”) and issued subsequent amendments to the initial guidance, collectively, Topic 326. ASU 2016-13 requires entities to measure all expected credit losses for most financial assets held at the reporting date based on an expected loss model which includes historical experience, current conditions, and reasonable and supportable forecasts. Entities will now use forward-looking information to better form their credit loss estimates. The ASU also requires enhanced disclosures to help financial statement users better understand significant estimates and judgments used in estimating credit losses, as well as the credit quality and underwriting standards of an entity’s portfolio. The Company adopted ASU 2016-13 on January 1, 2020. The Company adopted ASU 2016-13 using a modified retrospective approach which requires that the Company recognize the cumulative effect of the initial adoption, if any, as an adjustment to retained earnings. Cumulative gross-up or adjustments to our allowance for credit losses as a result of our adoption of ASU 2016-13 were not material. Based on financial instruments currently held by us, the adoption of ASU 2016-13 impacts our trade receivables, specifically our allowance for doubtful accounts (allowance for credit losses on trade receivables). As part of our adoption of ASU 2016-13, we have expanded our accounting policy disclosures related to credit losses. See above, “Allowance for Credit Losses,” for additional information.
Recently Issued Accounting Standards
In January 2020, the FASB issued ASU 2020-01, Investments - Equity Securities (Topic 321), Investments - Equity Method and Joint Ventures (Topic 323) and Derivatives and Hedging (Topic 815) - Clarifying the Interactions Between Topic 321, Topic 323, and Topic 815 (“ASU 2020-01”). ASU 2020-01 makes improvements related to accounting for certain equity securities when the equity method of accounting is applied or discontinued and provides scope considerations related to forward contracts and purchased options on certain securities. The guidance is effective for fiscal years beginning after December 15, 2021 and interim periods within those fiscal years. We do not expect ASU 2020-01 to have a material impact on the Company's consolidated financial results.
In December 2019, the FASB issued ASU 2019-12, Income Taxes (Topic 740), Simplifying the Accounting for Income Taxes (“ASU 2019-12”). ASU 2019-12 eliminates certain exceptions to the guidance in Topic 740 related to the approach for intra-period tax allocation, the methodology for calculating income taxes in an interim period and the recognition of deferred tax liabilities for outside basis differences. The new guidance also simplifies aspects of the accounting for franchise taxes, enacted change in tax laws or rates and clarifies the accounting transactions that result in a step-up in the tax basis of goodwill. The guidance is effective for fiscal years beginning after December 15, 2020 and interim periods within those fiscal years. We do not expect ASU 2019-12 to have a material impact on the Company's consolidated financial results.
Note 3 Revenue Recognition, Contracts with Customers
Description of Revenue Generating Activities
We employ sales, marketing and customer service personnel throughout the world who sell and market our systems, products and services to and/or through a large number of distributors, fabricators, converters, e-Commerce and mail order fulfillment firms, and contract packaging firms as well as directly to end-users such as food processors, food service businesses, supermarket retailers, pharmaceutical companies, healthcare facilities, medical device manufacturers, and other manufacturers.
As discussed in Note 6, “Segments,” our reporting segments are Food and Protective. Our Food applications are largely sold directly to end customers, while our Protective products are sold through business supply distributors and directly to the end customer.
Food:
Food largely serves perishable food processors in fresh red meat, smoked and processed meats, poultry, seafood, plant-based and dairy (solid and liquids) markets worldwide. Food offers integrated packaging materials and automated equipment solutions to increase food safety, extend shelf life, automate processes and optimize total cost. Its materials, automated equipment and service enables customers to reduce costs and enhance their brands in the marketplace. Food solutions are marketed under the Cryovac® trademark and other highly recognized trade names including Cryovac Grip & Tear®, Cryovac Darfresh®, Cryovac Mirabella®, Simple Steps® and OptiDure™.
Protective:
Protective packaging solutions are utilized across many global markets and are especially valuable to e-Commerce, consumer goods, pharmaceutical and medical devices and industrial manufacturing. Protective solutions are designed to
83

increase our customers' packaging velocity, minimize packaging waste, reduce labor dependencies and address dimensional weight challenges. Recent acquisitions in Protective include AFP, Inc. (“AFP”) in 2018 and Automated Packaging Systems, LLC in 2019.
Protective benefits from the continued expansion of e-Commerce, increasing freight costs, scarcity of labor, and increasing demand for automation and sustainable packaging solutions. Protective solutions are sold through a strategic network of distributors as well as directly to our customers, including, but not limited to, fabricators, original equipment manufacturers, contract manufacturers, logistics partners, and e-Commerce/fulfillment operations. Protective solutions are marketed under brands including Bubble Wrap® brand inflatable packaging, Sealed Air® brand performance shrink films and Autobag® brand bagging systems. Protective product families include additional tradenames such as Instapak® polyurethane foam packaging solutions and Korrvu® suspension and retention packaging. In addition, we provide temperature assurance packaging solutions under the KevothermalTM and TempGuardTM brands.
Identify Contract with Customer:
For Sealed Air, the determination of whether an arrangement meets the definition of a contract under ASC 606 (“Topic 606”) depends on whether it creates enforceable rights and obligations. While enforceability is a matter of law, we believe that enforceable rights and obligations in a contract must be substantive in order for the contract to be in scope of Topic 606. That is, the penalty for noncompliance must be significant relative to the minimum obligation. Fixed or minimum purchase obligations with penalties for noncompliance are the most common examples of substantive enforceable rights present in our contracts. We determined that the contract term is the period of enforceability outlined by the terms of the contract. This means that in many cases, the term stated in the contract is different than the period of enforceability. After the minimum purchase obligation is met, subsequent sales are treated as separate contracts on a purchase order by purchase order basis. If no minimum purchase obligation exists, the next level of enforceability is determined, which often represents the individual purchase orders and the agreed upon terms.
Performance Obligations:
The most common goods and services determined to be distinct performance obligations are materials, equipment sales, and maintenance. Free on loan and leased equipment is typically identified as a separate lease component within the scope of ASC 842. The other goods or services promised in the contract with the customer in most cases do not represent performance obligations because they are neither separate nor distinct, or they are not material in the context of the contract.
Transaction Price and Variable Consideration:
Sealed Air has many forms of variable consideration present in its contracts with customers, including rebates and other discounts. Sealed Air estimates variable consideration using either the expected value method or the most likely amount method as described in the standard. We include in the transaction price some or all of an amount of variable consideration estimated to the extent that it is probable that a significant reversal in the amount of cumulative revenue recognized will not occur when the uncertainty associated with the variable consideration is subsequently resolved.
For all contracts that contain a form of variable consideration, Sealed Air estimates at contract inception, and periodically throughout the term of the contract, what volume of goods and/or services the customer will purchase in a given period and determines how much consideration is payable to the customer or how much consideration Sealed Air would be able to recover from the customer based on the structure of the type of variable consideration. In most cases the variable consideration in contracts with customers results in amounts payable to the customer by Sealed Air. Sealed Air adjusts the contract transaction price based on any changes in estimates each reporting period and performs an inception to date cumulative adjustment to the amount of revenue previously recognized. When the contract with a customer contains a minimum purchase obligation, Sealed Air only has enforceable rights to the amount of consideration promised in the minimum purchase obligation through the enforceable term of the contract. This amount of consideration, plus any variable consideration, makes up the transaction price for the contract.
Charges for rebates and other allowances are recognized as a deduction from revenue on an accrual basis in the period in which the associated revenue is recorded. When we estimate our rebate accruals, we consider customer-specific contractual commitments including stated rebate rates and history of actual rebates paid. Our rebate accruals are reviewed at each reporting period and adjusted to reflect data available at that time. We adjust the accruals to reflect any differences between estimated and actual amounts. These adjustments of transaction price impact the amount of net sales recognized by us in the period of adjustment. Revenue recognized for the years ended December 31, 2020, 2019 and 2018 from performance obligations satisfied in previous reporting periods was $4.5 million, $5.0 million and $5.6 million, respectively.
84

The Company does not adjust consideration in contracts with customers for the effects of a significant financing component if the Company expects that the period between transfer of a good or service and payment for that good or service will be one year or less. This is expected to be the case for the majority of the Company's contracts.
Sales taxes collected from customers and remitted to governmental authorities are accounted for on a net basis and therefore are excluded from net sales on the Consolidated Statements of Operations.
Allocation of Transaction Price:
Sealed Air determines the standalone selling price for a performance obligation by first looking for observable selling prices of that performance obligation sold on a standalone basis. If an observable price is not available, we estimate the standalone selling price of the performance obligation using one of the three suggested methods in the following order of preference: adjusted market assessment approach, expected cost plus a margin approach, and residual approach.
Sealed Air often offers rebates to customers in their contracts that are related to the amount of materials purchased. We believe that this form of variable consideration should only be allocated to materials because the entire amount of variable consideration relates to the customer’s purchase of and Sealed Air’s efforts to provide materials. Additionally, Sealed Air has many contracts that have pricing tied to third-party indices. We believe that variability from index-based pricing should be allocated specifically to materials because the pricing formulas in these contracts are related to the cost to produce materials.
Transfer of Control:
Revenue is recognized upon transfer of control to the customer. Revenue for materials and equipment sales is recognized based on shipping terms, which is the point in time the customer obtains control of the promised goods. Maintenance revenue is recognized straight-line on the basis that the level of effort is consistent over the term of the contract. Lease components within contracts with customers are recognized in accordance with ASC 842.
Disaggregated Revenue
For the years ended December 31, 2020, 2019 and 2018, revenues from contracts with customers summarized by Segment and Geography were as follows:
Year Ended December 31, 2020(In millions) Food Protective Total
North America $ 1,587.3 $ 1,321.4 $ 2,908.7 EMEA 617.9 410.1 1,028.0 APAC 406.4 324.1 730.5 South America 192.1 14.7 206.8 Topic 606 Segment Revenue 2,803.7 2,070.3 4,874.0 Non-Topic 606 Revenue (Leasing: Sales-type and Operating) 21.8 7.4 29.2 Total $ 2,825.5 $ 2,077.7 $ 4,903.2
Year Ended December 31, 2019(In millions) Food Protective Total
North America $ 1,612.2 $ 1,197.9 $ 2,810.1 EMEA 617.1 388.2 1,005.3 APAC 413.7 299.0 712.7 South America 216.2 16.9 233.1 Topic 606 Segment Revenue 2,859.2 1,902.0 4,761.2 Non-Topic 606 Revenue (Leasing: Sales-type and Operating) 21.3 8.6 29.9 Total $ 2,880.5 $ 1,910.6 $ 4,791.1
85

Year Ended December 31, 2018
(In millions) Food Protective Total
North America $ 1,599.8 $ 1,115.7 $ 2,715.5 EMEA 653.1 381.2 1,034.3 APAC 424.1 300.8 724.9 South America 211.0 17.9 228.9 Topic 606 Segment Revenue 2,888.0 1,815.6 4,703.6 Non-Topic 606 Revenue (Leasing: Sales-type and Operating) 20.1 9.0 29.1 Total $ 2,908.1 $ 1,824.6 $ 4,732.7
Contract Balances
The time between when a performance obligation is satisfied and when billing and payment occur is closely aligned, with the exception of equipment accruals. An equipment accrual is a contract offering, whereby a customer is incentivized to use a portion of the materials transaction price for future equipment purchases. Long-term contracts that include an equipment accrual create a timing difference between when cash is collected and when the performance obligation is satisfied, resulting in a contract liability (unearned revenue). The following contract assets and liabilities were included in our Consolidated Balance Sheets as of December 31, 2020 and 2019:
December 31,(In millions) 2020 2019
Contract assets $ 1.4 $ — Contract liabilities $ 20.3 $ 16.7
The contract liability balances represent deferred revenue, primarily related to equipment accruals. Revenue recognized in the years ended December 31, 2020, 2019 and 2018, that was included in the contract liability balance at the beginning of the period was $14.0 million, $5.6 million, and $4.9 million, respectively. This revenue was driven primarily by equipment performance obligations being satisfied.
Remaining Performance Obligations
The following table summarizes the estimated transaction price from contracts with customers allocated to performance obligations or portions of performance obligations that have not yet been satisfied as of December 31, 2020 and 2019, as well as the expected timing of recognition of that transaction price.
December 31,(In millions) 2020 2019
Short-Term (12 months or less)(1) $ 7.3 $ 6.2 Long-Term 13.0 10.5 Total transaction price $ 20.3 $ 16.7
(1) Our enforceable contractual obligations tend to be short term in nature. The table above does not include the transaction price of any remaining performance obligations that are part of the contracts with expected durations of one year or less.
Assets recognized for the costs to obtain or fulfill a contract
The Company recognizes incremental costs to fulfill a contract as an asset if such incremental costs are expected to be recovered, relate directly to a contract or anticipated contract, and generate or enhance resources that will be used to satisfy performance obligations in the future.
The Company recognizes incremental costs to obtain a contract as an expense when incurred if the amortization period of the asset that otherwise would have been recognized is one year or less. For example, the Company generally expenses sales commissions when incurred because the amortization period would have been one year or less. These costs are recorded within selling, general and administrative expenses.
86

Costs for shipping and handling activities performed after a customer obtains control of a good are accounted for as costs to fulfill a contract and are included in cost of goods sold.
Note 4 Leases
Lessor
Sealed Air has contractual obligations as a lessor with respect to some of our automated and equipment solutions including 'free on loan' equipment and leased equipment, both sales-type and operating. The consideration in a contract that contains both lease and non-lease components is allocated based on the standalone selling price.
Our contractual obligations for operating leases can include termination and renewal options. Our contractual obligations for sales-type leases tend to have fixed terms and can include purchase options. We utilize the reasonably certain threshold criteria in determining which options our customers will exercise.
All lease payments are primarily fixed in nature and therefore captured in the lease receivable. Our lease receivable balances at December 31, 2020 and 2019 were as follows:
December 31,(in millions) 2020 2019
Short-Term (12 months or less) $ 5.4 $ 4.9 Long-Term 11.9 10.6 Total lease receivables (Sales-type and Operating) $ 17.3 $ 15.5
Lessee
Sealed Air has contractual obligations as a lessee with respect to warehouses, offices, and manufacturing facilities, IT equipment, automobiles, and material production equipment.
87

The following table details our lease obligations included in our Consolidated Balance Sheets.
December 31,(in millions) 2020 2019
Other non-current assets:Finance leases - ROU assets $ 58.2 $ 54.8 Finance leases - Accumulated depreciation (22.6) (15.0)
Operating lease right-of-use-assets:Operating leases - ROU assets 127.4 118.8 Operating leases - Accumulated depreciation (51.3) (28.7)
Total lease assets $ 111.7 $ 129.9 Current portion of long-term debt:
Finance leases $ (10.5) $ (10.4) Current portion of operating lease liabilities:
Operating leases (24.3) (26.2) Long-term debt, less current portion:
Finance leases (23.9) (28.7) Long-term operating lease liabilities, less current portion:
Operating leases (53.2) (65.7) Total lease liabilities $ (111.9) $ (131.0)
At December 31, 2020, estimated future minimum annual rental commitments under non-cancelable real and personal property leases were as follows:
(in millions) Finance leases Operating leases
2021 $ 11.9 $ 27.2 2022 8.9 19.9 2023 4.2 13.7 2024 2.2 8.7 2025 1.8 6.0 Thereafter 11.8 10.9 Total lease payments 40.8 86.4 Less: Interest (6.4) (8.9) Present value of lease liabilities $ 34.4 $ 77.5
The following lease cost is included in our Consolidated Statements of Operations:
December 31,(in millions) 2020 2019Lease cost(1)
Finance leasesAmortization of ROU assets $ 10.9 $ 9.1 Interest on lease liabilities 1.8 2.1
Operating leases 31.1 32.9 Short-term lease cost 3.7 5.9 Variable lease cost 5.8 5.2
Total lease cost $ 53.3 $ 55.2
88

(1) With the exception of Interest on lease liabilities, we record lease costs to Cost of sales or Selling, general and administrative expenses on the Consolidated Statements of Operations, depending on the use of the leased asset. Interest on lease liabilities is recorded to Interest expense, net on the Consolidated Statements of Operations.
December 31,(in millions) 2020 2019
Other information:Cash paid for amounts included in the measurement of lease liabilities:
Operating cash flows - finance leases $ 4.4 $ 5.1 Operating cash flows - operating leases $ 33.3 $ 34.7 Financing cash flows - finance leases $ 11.6 $ 9.3
ROU assets obtained in exchange for new finance lease liabilities $ 7.1 $ 21.3 ROU assets obtained in exchange for new operating lease liabilities $ 14.3 $ 34.7
December 31,2020 2019
Weighted average information:Finance leases
Remaining lease term (in years) 6.1 6.4Discount rate 4.7 % 4.9 %
Operating leasesRemaining lease term (in years) 4.5 4.9Discount rate 5.0 % 5.2 %
Note 5 Acquisitions
Acquisitions
Automated Packaging Systems, LLC
On August 1, 2019 the Company acquired 100% of the limited liability company interest in Automated Packaging Systems, LLC, formerly Automated Packaging Systems, Inc., a manufacturer of automated bagging systems. The acquisition is included in our Protective reporting segment. Automated Packaging Systems offers opportunities to expand the Company's automated solutions and into adjacent markets.
Cash paid for Automated Packaging Systems was $441.4 million in cash. The opening balance sheet included $58.2 million of assumed liabilities in connection with a deferred incentive compensation plan for Automated Packaging System's European employees. Of this amount $19.0 million and $19.7 million was paid during the years ended December 31, 2020 and 2019, respectively. Sealed Air is expected to make the remaining payment to the deferred incentive compensation plan participants in 2021.
The purchase price was primarily funded with proceeds from the incremental term facility provided for under an amendment to our Third Amended and Restated Credit Agreement, as described in Note 14, "Debt and Credit Facilities," of the Notes. For the years ended December 31, 2020 and 2019, transaction expenses recognized for the Automated Packaging Systems acquisition were $0.3 million and $3.3 million, respectively. These expenses are included within selling, general and administrative expenses in the Consolidated Statements of Operations.
The following table summarizes the consideration transferred to acquire Automated Packaging Systems and the allocation of the purchase price among the assets acquired and liabilities assumed, including measurement period adjustments recorded through the finalized purchase price allocation on August 1, 2020.
89

Revised Preliminary Allocation Measurement Period Final Allocation
(In millions) As of August 1, 2019 Adjustments As of September 30, 2020
Total consideration transferred $ 445.7 $ (4.3) $ 441.4
Assets:Cash and cash equivalents 16.0 (0.2) 15.8 Trade receivables, net 37.3 — 37.3 Other receivables 0.3 — 0.3 Inventories, net 40.7 (0.7) 40.0 Prepaid expenses and other current assets 2.3 — 2.3 Property and equipment, net(1) 76.9 8.7 85.6 Identifiable intangible assets, net(1) 81.1 (0.6) 80.5 Goodwill 261.3 (14.6) 246.7 Operating lease right-of-use-assets — 4.3 4.3 Other non-current assets 24.7 1.1 25.8 Total assets $ 540.6 $ (2.0) $ 538.6 Liabilities:Accounts payable 12.0 — 12.0 Current portion of long-term debt 2.6 (0.5) 2.1 Current portion of operating lease liabilities — 1.5 1.5 Other current liabilities 56.2 (3.3) 52.9 Long-term debt, less current portion 4.3 (0.3) 4.0 Long-term operating lease liabilities, less current portion — 2.8 2.8 Deferred taxes — 0.5 0.5 Other non-current liabilities 19.8 1.6 21.4 Total liabilities $ 94.9 $ 2.3 $ 97.2
(1) In the Preliminary Allocation as of August 1, 2019, $2.4 million of software was initially recorded as computer hardware within Property and equipment, net as disclosed in the 2019 Form 10-K. The asset represents software acquired and has been reclassified in identifiable intangible assets, net within Revised Preliminary Allocation in the table above.
Measurement period adjustments recorded in the year ended December 31, 2020 through finalization of the purchase price allocation on August 1, 2020 were primarily a result of a favorable net working capital and purchase price settlement with the seller of $4.3 million during the first quarter of 2020.
The following table summarizes the identifiable intangible assets, net and their useful lives.
Amount Useful life(in millions) (in years)
Customer relationships $ 28.9 13.0Trademarks and tradenames 15.6 9.1Capitalized software 2.4 3.0Technology 29.6 6.4Backlog 4.0 0.4Total intangible assets with definite lives $ 80.5
Goodwill is a result of the expected synergies and cross-selling opportunities that this acquisition is expected to provide for the Company, as well as the expected growth potential in acquired automated and sustainable solutions. Goodwill allocated to Automated Packaging System's U.S. entities is deductible for tax purposes. Goodwill allocated to Automated Packaging
90

Systems' foreign entities is not deductible for tax purposes. The goodwill balance has been recorded to the Protective reportable segment.
Other non-current assets at the opening balance sheet date includes the net overfunded position of a closed defined benefit pension plan in the United Kingdom. At December 31, 2020, the plan was in an underfunded position and is classified within other non-current liabilities on our Consolidated Balance Sheet. Refer to Note 17, "Profit Sharing, Retirement Savings Plans and Defined Benefit Pension Plans," for additional information on the Company's other defined benefit pension plans.
In conjunction with the acquisition and subsequent integration, the Company expects to incur restructuring charges. No restructuring accrual is included in our opening balance sheet as the liability did not exist at the time of acquisition. Refer to Note 12, "Restructuring Activities," for more detail on the Company's restructuring activity.
The inclusion of Automated Packaging Systems in our consolidated financial statements is not deemed material with respect to the requirement to provide pro forma results of operations in ASC 805. As such, pro forma information is not presented.
Other 2019 Acquisition Activity
During the second quarter of 2019, Food had acquisition activity resulting in a total purchase price paid of $23.4 million. The Company allocated the consideration transferred to the fair value of assets acquired and liabilities assumed, resulting in an allocation to goodwill of $6.0 million. The final purchase price adjustments resulting in an increase to goodwill of $0.3 million were recorded in the third quarter of 2019. Identifiable intangible assets acquired were not material.
Acquisition of AFP, Inc,
On August 1, 2018, the Company acquired AFP, Inc., a privately held fabricator of foam, corrugated, molded pulp and wood packaging solutions. The acquisition is included in our Protective reporting segment. This acquisition expands our protective packaging offerings in the electronic, transportation and industrial markets with custom engineered applications. We acquired 100% of AFP shares for an estimated consideration of $74.1 million, excluding $3.3 million of cash acquired.
The following table summarizes the consideration transferred to acquire AFP and the final allocation of the purchase price among the assets acquired and liabilities assumed.
Preliminary Allocation
Measurement Period Final Allocation
(In millions) As of August 1, 2018 Adjustments As of September 30, 2019Total consideration transferred $ 70.8 $ 3.3 $ 74.1
Assets:Cash and cash equivalents 2.9 0.4 3.3 Trade receivables, net 30.8 — 30.8 Inventories, net 7.1 — 7.1 Prepaid expenses and other current assets 0.7 — 0.7 Property and equipment, net 3.5 (0.4) 3.1 Identifiable intangible assets, net 18.6 0.7 19.3 Goodwill 21.6 1.0 22.6 Other non-current assets 0.7 (0.4) 0.3
Total assets $ 85.9 $ 1.3 $ 87.2 Liabilities:
Current portion of long-term debt — 0.1 0.1 Accounts payable 13.8 (2.2) 11.6 Other current liabilities 1.3 (0.1) 1.2 Long-term debt, less current portion — 0.2 0.2
Total liabilities $ 15.1 $ (2.0) $ 13.1
The following table summarizes the identifiable intangible assets, net and their useful lives
91

Amount Useful life(in millions) (in years)
Customer relationships $ 14.9 11Trademarks and tradenames 4.4 5Total intangible assets with definite lives $ 19.3
Goodwill associated with the AFP acquisition is deductible for tax purposes.
Note 6 Segments
The Company’s segment reporting structure consists of two reportable segments as follows and a Corporate category:
• Food; and
• Protective.
Starting in the second quarter of 2020, we renamed our reporting segments from Food Care to Food and from Product Care to Protective. This segment reporting name change aligns with our use internally and in the markets we serve. There has been no change in the composition of the segments and no impact on prior period results of our reportable segments.
The Company’s Food and Protective segments are considered reportable segments under FASB ASC Topic 280. Our reportable segments are aligned with similar groups of products. Corporate includes certain costs that are not allocated to the reportable segments. The Company evaluates performance of the reportable segments based on the results of each segment. The performance metric used by the Company's chief operating decision maker to evaluate performance of our reportable segments is Adjusted EBITDA. The Company allocates expense to each segment based on various factors including direct usage of resources, allocation of headcount, allocation of software licenses or, in cases where costs are not clearly delineated, costs may be allocated on portion of either net trade sales or an expense factor such as cost of goods sold.
We allocate and disclose depreciation and amortization expense to our segments, although depreciation and amortization are not included in the segment performance metric, Adjusted EBITDA. We also allocate and disclose restructuring charges and impairment of goodwill and other intangible assets by segment, although they are not included in the segment performance metric Adjusted EBITDA since restructuring charges and impairment of goodwill and other intangible assets are categorized as Special Items (as identified below). The accounting policies of the reportable segments and Corporate are the same as those applied to the Consolidated Financial Statements.
The following tables show Net Sales and Adjusted EBITDA by reportable segment:
92

Year Ended December 31,(In millions) 2020 2019 2018
Net Sales Food $ 2,825.5 $ 2,880.5 $ 2,908.1 As a % of Total Company net sales 57.6 % 60.1 % 61.4 %Protective 2,077.7 1,910.6 1,824.6 As a % of Total Company net sales 42.4 % 39.9 % 38.6 %Total Company Net Sales $ 4,903.2 $ 4,791.1 $ 4,732.7
Year Ended December 31,(In millions) 2020 2019 2018
Adjusted EBITDA from continuing operations Food $ 647.5 $ 629.3 $ 577.8 Adjusted EBITDA Margin 22.9 % 21.8 % 19.9 %Protective 408.0 349.9 318.6 Adjusted EBITDA Margin 19.6 % 18.3 % 17.5 %Corporate (4.4) (14.4) (6.9)
Total Company Adjusted EBITDA from continuing operations $ 1,051.1 $ 964.8 $ 889.5 Adjusted EBITDA Margin 21.4 % 20.1 % 18.8 %
The following table shows a reconciliation of net earnings before income tax provision to Total Company Adjusted EBITDA from continuing operations:
Year Ended December 31,(In millions) 2020 2019 2018
Earnings before income tax provision $ 626.2 $ 370.3 $ 457.8 Interest expense, net 174.4 184.1 177.9 Depreciation and amortization, net of adjustments(1) 216.5 184.5 159.0 Special Items:
Restructuring charges(2) 11.0 41.9 47.8 Other restructuring associated costs(3) 19.5 60.3 15.8 Foreign currency exchange loss due to highly inflationary economies 4.7 4.6 2.5 Loss on debt redemption and refinancing activities — 16.1 1.9 Increase in fair value of equity investment (15.1) — — Charges related to acquisition and divestiture activity 7.1 14.9 34.2 Charges related to the Novipax settlement agreement — 59.0 — Gain from class-action litigation settlement — — (14.9) Other Special Items(4) 6.8 29.1 7.5
Pre-tax impact of Special Items 34.0 225.9 94.8 Total Company Adjusted EBITDA from continuing operations $ 1,051.1 $ 964.8 $ 889.5
(1) Depreciation and amortization by segment were as follows:
93
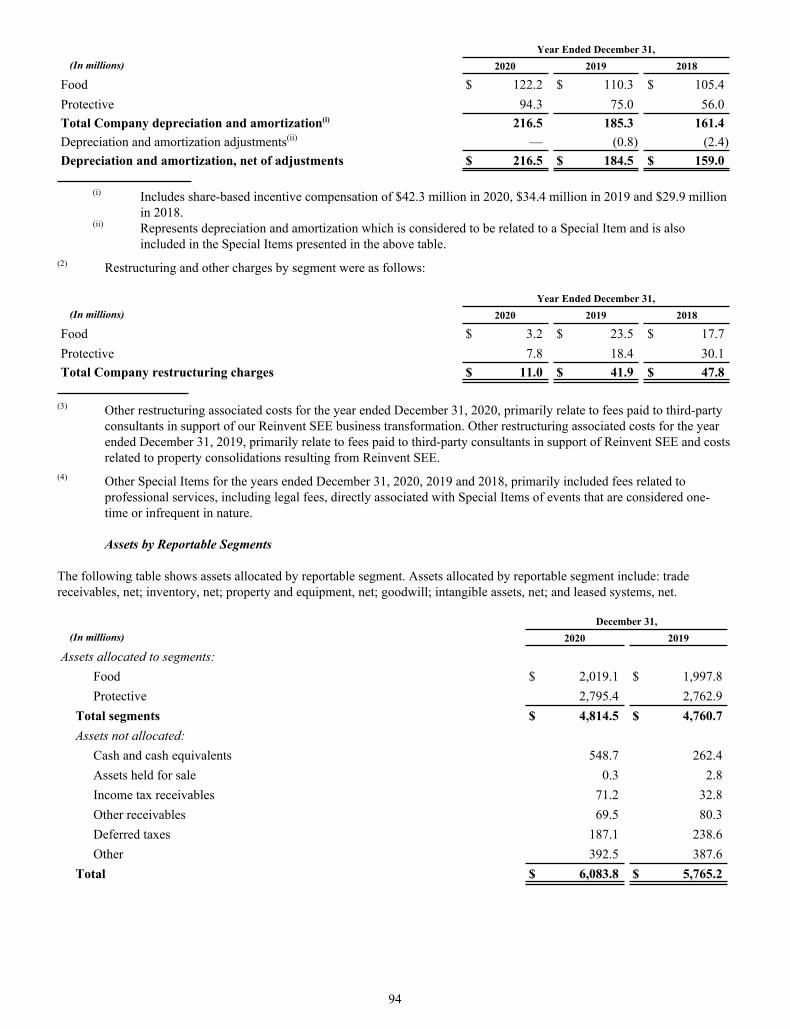
Year Ended December 31,(In millions) 2020 2019 2018
Food $ 122.2 $ 110.3 $ 105.4 Protective 94.3 75.0 56.0 Total Company depreciation and amortization(i) 216.5 185.3 161.4 Depreciation and amortization adjustments(ii) — (0.8) (2.4) Depreciation and amortization, net of adjustments $ 216.5 $ 184.5 $ 159.0
(i) Includes share-based incentive compensation of $42.3 million in 2020, $34.4 million in 2019 and $29.9 million in 2018.
(ii) Represents depreciation and amortization which is considered to be related to a Special Item and is also included in the Special Items presented in the above table.
(2) Restructuring and other charges by segment were as follows:
Year Ended December 31,(In millions) 2020 2019 2018
Food $ 3.2 $ 23.5 $ 17.7 Protective 7.8 18.4 30.1 Total Company restructuring charges $ 11.0 $ 41.9 $ 47.8
(3) Other restructuring associated costs for the year ended December 31, 2020, primarily relate to fees paid to third-party
consultants in support of our Reinvent SEE business transformation. Other restructuring associated costs for the year ended December 31, 2019, primarily relate to fees paid to third-party consultants in support of Reinvent SEE and costs related to property consolidations resulting from Reinvent SEE.
(4) Other Special Items for the years ended December 31, 2020, 2019 and 2018, primarily included fees related to professional services, including legal fees, directly associated with Special Items of events that are considered one-time or infrequent in nature.
Assets by Reportable Segments
The following table shows assets allocated by reportable segment. Assets allocated by reportable segment include: trade receivables, net; inventory, net; property and equipment, net; goodwill; intangible assets, net; and leased systems, net.
December 31,(In millions) 2020 2019
Assets allocated to segments: Food $ 2,019.1 $ 1,997.8 Protective 2,795.4 2,762.9
Total segments $ 4,814.5 $ 4,760.7 Assets not allocated:
Cash and cash equivalents 548.7 262.4 Assets held for sale 0.3 2.8 Income tax receivables 71.2 32.8 Other receivables 69.5 80.3 Deferred taxes 187.1 238.6 Other 392.5 387.6
Total $ 6,083.8 $ 5,765.2
94

Geographic Information
The following table shows net sales and total long-lived assets allocated by geography. Sales are attributed to the country/geography in which they originate.
Year Ended December 31,(In millions) 2020 2019 2018
Net sales(1):
North America(1) $ 2,928.1 $ 2,828.1 $ 2,734.9 EMEA 1,031.6 1,010.4 1,038.5 APAC 736.0 718.8 729.8 South America 207.5 233.8 229.5 Total $ 4,903.2 $ 4,791.1 $ 4,732.7
Total long-lived assets(2)(3):North America(2) $ 948.4 $ 919.3 EMEA 386.0 345.8 APAC 247.4 248.3 South America 39.8 50.2
Total $ 1,621.6 $ 1,563.6
(1) Net sales to external customers within the U.S. were $2,607.3 million, $2,501.6 million and $2,402.3 million for the years ended December 31, 2020, 2019 and 2018, respectively. No non-U.S. country accounted for net sales in excess of 10% of consolidated net sales for the years ended December 31, 2020, 2019 or 2018.
(2) Total long-lived assets in the U.S. were $921.4 million and $893.8 million at December 31, 2020 and 2019, respectively. No non-U.S. country had long-lived assets in excess of 10% of consolidated long-lived assets at December 31, 2020 or 2019.
(3) Total long-lived assets represent total assets excluding total current assets, deferred tax assets, goodwill, and intangible assets.
Note 7 Inventories, net
The following table details our inventories, net:
December 31,(In millions) 2020 2019
Raw materials $ 113.8 $ 99.2 Work in process 139.7 136.2 Finished goods 343.2 334.9
Total $ 596.7 $ 570.3
95

Note 8 Property and Equipment, net
The following table details our property and equipment, net.
December 31,(In millions) 2020 2019
Land and improvements $ 50.8 $ 50.7 Buildings 786.5 747.0 Machinery and equipment 2,543.5 2,453.2 Other property and equipment 133.5 141.3 Construction-in-progress 150.1 127.9
Property and equipment, gross 3,664.4 3,520.1 Accumulated depreciation and amortization (2,474.7) (2,378.2)
Property and equipment, net $ 1,189.7 $ 1,141.9
The following table details our interest cost capitalized and depreciation and amortization expense for property and equipment.
Year Ended December 31,(In millions) 2020 2019 2018
Interest cost capitalized $ 5.6 $ 8.4 $ 6.3 Depreciation and amortization expense for property and equipment $ 136.6 $ 122.0 $ 115.9
Note 9 Goodwill and Identifiable Intangible Assets, net
Goodwill
The following table shows our goodwill balances by reportable segment. We review goodwill for impairment on a reporting unit basis annually during the fourth quarter of each year and whenever events or changes in circumstances indicate the carrying value of goodwill may not be recoverable. For our 2020 annual review, the Company elected to bypass the optional qualitative assessment and performed a quantitative assessment by reporting unit as of October 1, 2020. Based on the results of the quantitative assessment, which indicated a fair value in excess of carrying amount for each of the Company's designated reporting units, we concluded there was no impairment of goodwill. There have been no significant events or circumstances affecting the valuation of goodwill subsequent to the quantitative assessment performed as of October 1, 2020. As part of our assessment of goodwill impairment considerations, the Company considered the impact that COVID-19 has had on the overall economic environment, more specifically on the markets in which our products are sold. The Company does not believe the COVID-19 pandemic has had a material negative impact on our business to date.
96

Allocation of Goodwill to Reporting Segment
The following table shows our goodwill balances by reportable segment:
(In millions) Food Protective Total
Gross Carrying Value at December 31, 2018 $ 568.9 $ 1,568.9 $ 2,137.8 Accumulated impairment (49.2) (141.0) (190.2)
Carrying Value at December 31, 2018 $ 519.7 $ 1,427.9 $ 1,947.6 Acquisition, purchase price and other adjustments 6.3 257.0 263.3 Currency translation 2.0 4.1 6.1
Gross Carrying Value at December 31, 2019 $ 577.2 $ 1,830.0 $ 2,407.2 Accumulated impairment (49.3) (141.0) (190.3)
Carrying Value at December 31, 2019 $ 527.9 $ 1,689.0 $ 2,216.9 Acquisition, purchase price and other adjustments — (5.3) (5.3) Currency translation 2.5 8.9 11.4
Gross Carrying Value at December 31, 2020 $ 579.7 $ 1,833.6 $ 2,413.3 Accumulated impairment(1) (49.5) (141.2) (190.7)
Carrying Value at December 31, 2020 $ 530.2 $ 1,692.4 $ 2,222.6
(1) The change in accumulated impairment from December 31, 2019 to December 31, 2020 is due to the impact of foreign currency translation.
As noted above, it was determined under a quantitative assessment that there was no impairment of goodwill. However, if we become aware of indicators of impairment in future periods, we may be required to perform an interim assessment for some or all of our reporting units before the next annual assessment. Examples of such indicators may include a decrease in expected net earnings, adverse equity market conditions, a decline in current market multiples, a decline in our common stock price, a significant adverse change in legal factors or business climates, an adverse action or assessment by a regulator, unanticipated competition, strategic decisions made in response to economic or competitive conditions, or a more likely than not expectation that a reporting unit or a significant portion of a reporting unit will be sold or disposed of. In the event of significant adverse changes of the nature described above, we may have to recognize a non-cash impairment of goodwill, which could have a material adverse effect on our consolidated financial condition and results of operations.
Identifiable Intangible Assets, net
The following tables summarize our identifiable intangible assets, net with definite and indefinite useful lives:
December 31, 2020 December 31, 2019
(In millions)
GrossCarrying
ValueAccumulatedAmortization Net
GrossCarrying
ValueAccumulatedAmortization Net
Customer relationships $ 105.2 $ (37.2) $ 68.0 $ 102.0 $ (30.5) $ 71.5 Trademarks and tradenames 31.3 (8.5) 22.8 31.1 (4.3) 26.8 Software 104.7 (69.7) 35.0 95.3 (62.8) 32.5 Technology 66.7 (33.0) 33.7 66.8 (27.2) 39.6 Contracts 13.6 (11.0) 2.6 13.2 (10.4) 2.8
Total intangible assets with definite lives 321.5 (159.4) 162.1 308.4 (135.2) 173.2 Trademarks and tradenames with indefinite lives 8.9 — 8.9 8.9 — 8.9 Total identifiable intangible assets, net $ 330.4 $ (159.4) $ 171.0 $ 317.3 $ (135.2) $ 182.1
97

The following table shows the estimated future amortization expense at December 31, 2020.
YearAmount
(in millions)
2021 $ 35.4 2022 26.1 2023 19.8 2024 14.3 2025 14.1 Thereafter 52.4 Total $ 162.1
Amortization expense was $37.5 million in 2020, $28.9 million in 2019 and $15.7 million in 2018.
The following table shows the remaining weighted average useful life of our definite lived intangible assets as of December 31, 2020.
Remaining weighted average useful lives
Customer relationships 11.7Trademarks and trade names 9.1Technology 4.1Contracts 6.4Total identifiable intangible assets, net with definite lives 8.0
Expected future cash flows associated with the Company's intangible assets are not expected to be materially affected by the Company's intent or ability to renew or extend the arrangements. Based on our experience with similar agreements, we expect to continue to renew contracts held as intangibles through the end of the remaining useful lives.
During the fourth quarter of 2020, we identified a triggering event related to our foam fabrication producing asset group within our Protective segment. The asset group's primary asset was determined to be the intangible asset of Customer Relationships, which has a remaining useful life of approximately 12 years. The triggering event was related to the finalization of the upcoming year's financial projections and budget which indicated short-term deterioration in the profitability of the specific asset group's North American operations. The short-term deterioration is driven, in part, by a decrease in expected sales of a particular customer within the region. The decline in expected performance identified as a triggering event is not expected to be material to the overall segment or total Company. We performed a quantitative analysis of the recoverability of the net asset group and determined that the assets were not impaired, as the expected cash flows, including the residual value of the net asset group exceeded the carrying value. Key assumptions used to estimate the recoverable amount of the asset group were expected future sales performance and efficiency and cost improvements resulting in cash flow growth over the remaining useful life of the primary asset. The asset group tested for impairment had a net carrying value of $120.5 million as of the date of testing, of which $47.6 million was attributable to intangible assets.
Note 10 Accounts Receivable Securitization Programs
U.S. Accounts Receivable Securitization Program
We and a group of our U.S. operating subsidiaries maintain an accounts receivable securitization program under which they sell eligible U.S. accounts receivable to an indirectly wholly-owned subsidiary that was formed for the sole purpose of entering into this program. The wholly-owned subsidiary in turn may sell an undivided fractional ownership interest in these receivables with two banks and issuers of commercial paper administered by these banks. The wholly-owned subsidiary retains the receivables it purchases from the operating subsidiaries. Any transfers of fractional ownership interests of receivables under the U.S. receivables securitization program to the two banks and issuers of commercial paper administered by these banks are considered secured borrowings with pledge of collateral and will be classified as short-term borrowings on our Consolidated Balance Sheets. These banks do not have any recourse against the general credit of the Company. The net trade receivables that served as collateral for these borrowings are reclassified from trade receivables, net to prepaid expenses and other current assets on the Consolidated Balance Sheets.
98
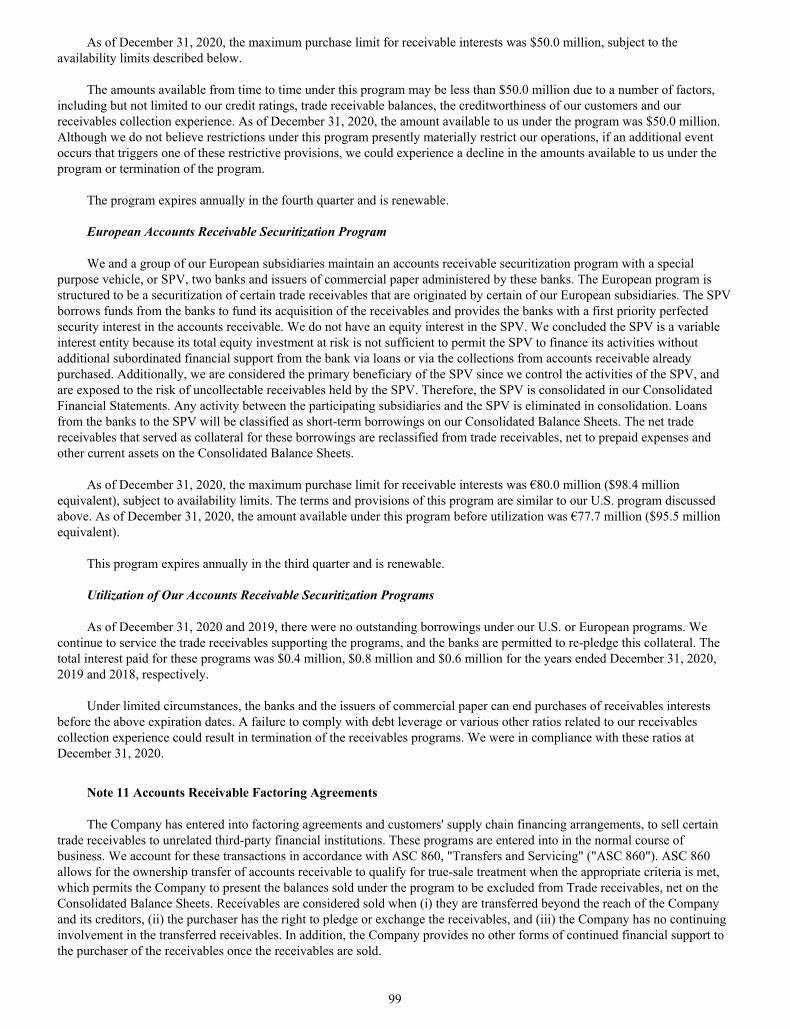
As of December 31, 2020, the maximum purchase limit for receivable interests was $50.0 million, subject to the availability limits described below.
The amounts available from time to time under this program may be less than $50.0 million due to a number of factors, including but not limited to our credit ratings, trade receivable balances, the creditworthiness of our customers and our receivables collection experience. As of December 31, 2020, the amount available to us under the program was $50.0 million. Although we do not believe restrictions under this program presently materially restrict our operations, if an additional event occurs that triggers one of these restrictive provisions, we could experience a decline in the amounts available to us under the program or termination of the program.
The program expires annually in the fourth quarter and is renewable.
European Accounts Receivable Securitization Program
We and a group of our European subsidiaries maintain an accounts receivable securitization program with a special purpose vehicle, or SPV, two banks and issuers of commercial paper administered by these banks. The European program is structured to be a securitization of certain trade receivables that are originated by certain of our European subsidiaries. The SPV borrows funds from the banks to fund its acquisition of the receivables and provides the banks with a first priority perfected security interest in the accounts receivable. We do not have an equity interest in the SPV. We concluded the SPV is a variable interest entity because its total equity investment at risk is not sufficient to permit the SPV to finance its activities without additional subordinated financial support from the bank via loans or via the collections from accounts receivable already purchased. Additionally, we are considered the primary beneficiary of the SPV since we control the activities of the SPV, and are exposed to the risk of uncollectable receivables held by the SPV. Therefore, the SPV is consolidated in our Consolidated Financial Statements. Any activity between the participating subsidiaries and the SPV is eliminated in consolidation. Loans from the banks to the SPV will be classified as short-term borrowings on our Consolidated Balance Sheets. The net trade receivables that served as collateral for these borrowings are reclassified from trade receivables, net to prepaid expenses and other current assets on the Consolidated Balance Sheets.
As of December 31, 2020, the maximum purchase limit for receivable interests was €80.0 million ($98.4 million equivalent), subject to availability limits. The terms and provisions of this program are similar to our U.S. program discussed above. As of December 31, 2020, the amount available under this program before utilization was €77.7 million ($95.5 million equivalent).
This program expires annually in the third quarter and is renewable.
Utilization of Our Accounts Receivable Securitization Programs
As of December 31, 2020 and 2019, there were no outstanding borrowings under our U.S. or European programs. We continue to service the trade receivables supporting the programs, and the banks are permitted to re-pledge this collateral. The total interest paid for these programs was $0.4 million, $0.8 million and $0.6 million for the years ended December 31, 2020, 2019 and 2018, respectively.
Under limited circumstances, the banks and the issuers of commercial paper can end purchases of receivables interests before the above expiration dates. A failure to comply with debt leverage or various other ratios related to our receivables collection experience could result in termination of the receivables programs. We were in compliance with these ratios at December 31, 2020.
Note 11 Accounts Receivable Factoring Agreements
The Company has entered into factoring agreements and customers' supply chain financing arrangements, to sell certain trade receivables to unrelated third-party financial institutions. These programs are entered into in the normal course of business. We account for these transactions in accordance with ASC 860, "Transfers and Servicing" ("ASC 860"). ASC 860 allows for the ownership transfer of accounts receivable to qualify for true-sale treatment when the appropriate criteria is met, which permits the Company to present the balances sold under the program to be excluded from Trade receivables, net on the Consolidated Balance Sheets. Receivables are considered sold when (i) they are transferred beyond the reach of the Company and its creditors, (ii) the purchaser has the right to pledge or exchange the receivables, and (iii) the Company has no continuing involvement in the transferred receivables. In addition, the Company provides no other forms of continued financial support to the purchaser of the receivables once the receivables are sold.
99

Gross amounts factored under this program for the year ended December 31, 2020 and 2019 were $465.6 million and $351.3 million, respectively. The fees associated with transfer of receivables for all programs were approximately $2.2 million, $3.5 million and $2.0 million for the years ended December 31, 2020, 2019 and 2018, respectively.
Note 12 Restructuring Activities
For the year ended December 31, 2020, the Company incurred $11.0 million of restructuring charges and $19.6 million of other related costs for our restructuring programs. These charges were primarily a result of restructuring and associated costs incurred in connection with the Company’s Reinvent SEE business transformation.
Our primary restructuring program (“Program”) is defined as the initiatives associated with our Reinvent SEE business transformation in addition to the conclusion of our previously existing restructuring programs at the time of Reinvent SEE's approval. The Reinvent SEE business transformation is a three-year program approved by the Board of Directors in December 2018. The expected spend in the previously existing program at the time of Reinvent SEE's approval was primarily related to the elimination of stranded costs following the sale of our Diversey segment and Hygiene Solutions business to Diamond (BC) B.V. in 2017. The Company expects restructuring activities associated with the Program to be completed by the end of 2021.
The Board of Directors has approved cumulative restructuring spend of $840 to $885 million for the Program. Restructuring spend is estimated to be incurred as follows:
(in millions)Total Restructuring
Program RangeLess Cumulative
Spend to DateRemaining Restructuring
Spend(2)
Low High Low HighCosts of reduction in headcount as a result of reorganization $ 340 $ 355 $ (334) $ 6 $ 21 Other expenses associated with the Program 255 270 (220) 35 50
Total expense 595 625 (554) 41 71 Capital expenditures 245 260 (239) 6 21
Total estimated cash cost(1) $ 840 $ 885 $ (793) $ 47 $ 92
(1) Total estimated cash cost excludes the impact of proceeds expected from the sale of property and equipment and
foreign currency impact.(2) Remaining restructuring spend primarily consists of restructuring costs associated with the Program.
The Company also has a restructuring program related to recent acquisitions. We incurred approximately $1.7 million and $2.3 million in restructuring charges related to this activity during the years ended December 31, 2020 and 2019, respectively. See Note 5, "Acquisitions," of the Notes for additional information related to our acquisitions.
The following table details our aggregate restructuring activities as reflected in the Consolidated Statements of Operations for the years ended December 31, 2020, 2019 and 2018:
Year Ended December 31,(In millions) 2020 2019 2018
Other associated costs(1) $ 19.6 $ 60.3 $ 13.9 Restructuring charges 11.0 41.9 47.8 Total charges $ 30.6 $ 102.2 $ 61.7 Capital expenditures $ 0.4 $ 3.4 $ 1.0
(1) Other associated costs excludes non-cash cost of $1.9 million for the year ended December 31, 2018 related to share-
based compensation expense.
100

The aggregate restructuring accrual, spending and other activity for the years ended December 31, 2020, 2019 and 2018 and the accrual balance remaining at those year-ends were as follows:
(In millions)
Restructuring accrual at December 31, 2017 $ 16.1 Accrual and accrual adjustments 47.8 Cash payments during 2018 (25.0) Effects of changes in foreign currency exchange rates (1.4) Restructuring accrual at December 31, 2018 $ 37.5 Accrual and accrual adjustments 41.9 Cash payments during 2019 (47.6) Effects of changes in foreign currency exchange rates (0.3) Restructuring accrual at December 31, 2019 $ 31.5 Accrual and accrual adjustments 11.0 Cash payments during 2020 (28.0) Effect of changes in foreign currency exchange rates (0.2) Restructuring accrual at December 31, 2020 $ 14.3
We expect to pay $12.2 million of the accrual balance remaining at December 31, 2020 within the next twelve months. This amount is included in accrued restructuring costs on the Consolidated Balance Sheets at December 31, 2020. The remaining accrual of $2.1 million, primarily related to restructuring for recent acquisitions, is expected to be paid in periods including, and beyond, 2022. These amounts are included in other non-current liabilities on our Consolidated Balance Sheets at December 31, 2020.
One of the components of the Reinvent SEE business transformation was to enhance the operational efficiency of the Company by acting as "One SEE". The program was approved by our Board of Directors as a consolidated program benefiting both Food and Protective, and accordingly the expected program spend by reporting segment is not available. However, of the restructuring accrual of $14.3 million as of December 31, 2020, $6.5 million was attributable to Food and $7.8 million was attributable to Protective.
Note 13 Other Current and Non-Current Liabilities
The following tables detail our other current liabilities and other non-current liabilities at December 31, 2020 and 2019:
December 31,(In millions) 2020 2019
Other current liabilities: Accrued salaries, wages and related costs $ 209.2 $ 191.5 Accrued operating expenses 192.1 197.2 Accrued customer volume rebates 83.3 78.3 Accrued interest 37.8 41.6 Accrued employee benefit liability 4.9 5.5 Total $ 527.3 $ 514.1
101

December 31,(In millions) 2020 2019
Other non-current liabilities: Accrued employee benefit liability $ 201.0 $ 178.5 Other postretirement liability 38.3 38.2 Uncertain tax position liability 381.4 384.0 Other various liabilities 107.6 129.5 Total $ 728.3 $ 730.2
Note 14 Debt and Credit Facilities
Our total debt outstanding consisted of the amounts set forth on the following table:
December 31,(In millions) Interest rate 2020 2019
Short-term borrowings (1) $ 7.2 $ 98.9 Current portion of long-term debt(2) 22.3 16.7 Total current debt 29.5 115.6
Term Loan A due August 2022 474.7 474.6 Term Loan A due July 2023 208.6 218.2 Senior Notes due December 2022 4.875 % 423.3 421.9 Senior Notes due April 2023 5.250 % 422.9 422.0 Senior Notes due September 2023 4.500 % 490.2 445.6 Senior Notes due December 2024 5.125 % 422.1 421.9 Senior Notes due September 2025 5.500 % 397.8 397.4 Senior Notes due December 2027 4.000 % 420.9 420.4 Senior Notes due July 2033 6.875 % 446.0 445.7 Other(2) 24.9 30.9
Total long-term debt, less current portion(3) 3,731.4 3,698.6 Total debt(4) $ 3,760.9 $ 3,814.2
(1) Short-term borrowings at December 31, 2020 were comprised of $7.2 million in short-term borrowings from various
lines of credit. Short-term borrowings at December 31, 2019 were comprised of $89.0 million under our revolving credit facility and $9.9 million of short-term borrowings from various lines of credit.
(2) The Current portion of long-term debt includes finance lease liabilities of $10.5 million and $10.4 million as of December 31, 2020 and 2019, respectively. The Other debt balance includes $23.9 million and $28.7 million for long-term liabilities associated with our finance leases as of December 31, 2020 and 2019, respectively. See Note 4, “Leases,” of the Notes for additional information on finance and operating lease liabilities.
(3) Amounts are net of unamortized discounts and issuance costs of $20.1 million and $24.6 million as of December 31, 2020 and 2019, respectively.
(4) As of December 31, 2020, our weighted average interest rate on our short-term borrowings outstanding was 2.2% and on our long-term debt outstanding was 4.4%. As of December 31, 2019, our weighted average interest rate on our short-term borrowings outstanding was 5.0% and on our long-term debt outstanding was 4.8%.
Debt Maturities
The following table summarizes the scheduled annual maturities for the next five years and thereafter of our long-term debt, including the current portion of long-term debt and finance leases. This schedule represents the principal portion amount outstanding of our debt, and therefore excludes debt discounts, effect of present value discounting for capital lease obligations, interest rate swaps and lender and finance fees.
102
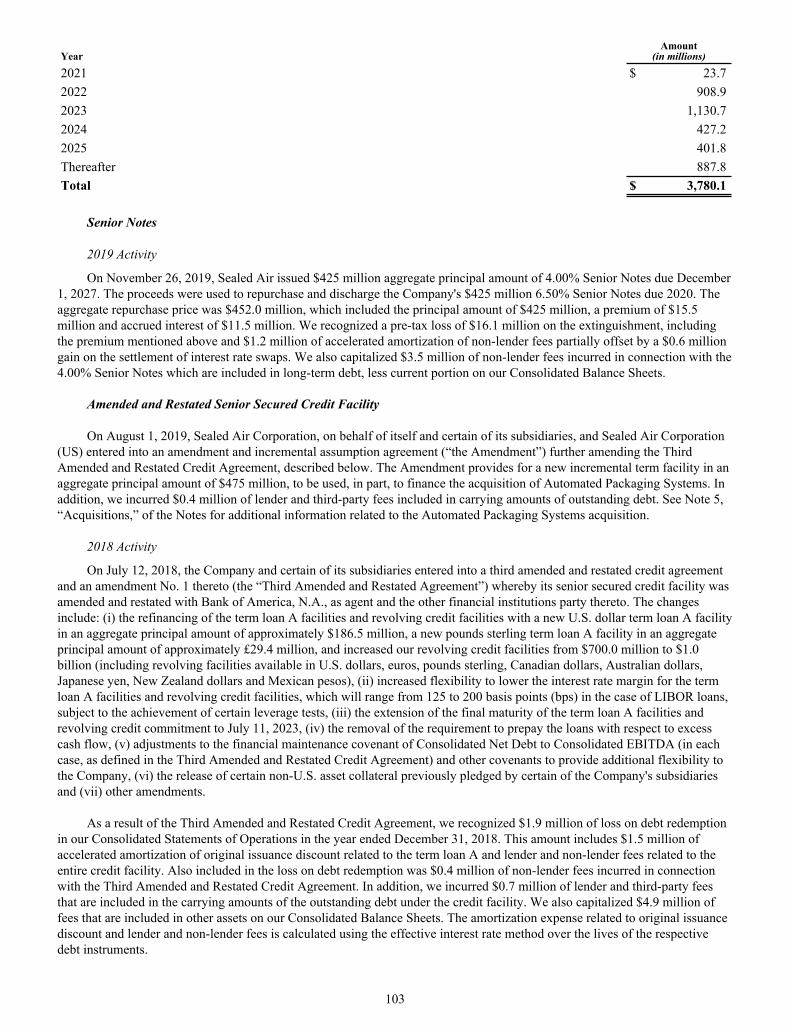
YearAmount
(in millions)
2021 $ 23.7 2022 908.9 2023 1,130.7 2024 427.2 2025 401.8 Thereafter 887.8 Total $ 3,780.1
Senior Notes
2019 Activity
On November 26, 2019, Sealed Air issued $425 million aggregate principal amount of 4.00% Senior Notes due December 1, 2027. The proceeds were used to repurchase and discharge the Company's $425 million 6.50% Senior Notes due 2020. The aggregate repurchase price was $452.0 million, which included the principal amount of $425 million, a premium of $15.5 million and accrued interest of $11.5 million. We recognized a pre-tax loss of $16.1 million on the extinguishment, including the premium mentioned above and $1.2 million of accelerated amortization of non-lender fees partially offset by a $0.6 million gain on the settlement of interest rate swaps. We also capitalized $3.5 million of non-lender fees incurred in connection with the 4.00% Senior Notes which are included in long-term debt, less current portion on our Consolidated Balance Sheets.
Amended and Restated Senior Secured Credit Facility
On August 1, 2019, Sealed Air Corporation, on behalf of itself and certain of its subsidiaries, and Sealed Air Corporation (US) entered into an amendment and incremental assumption agreement (“the Amendment”) further amending the Third Amended and Restated Credit Agreement, described below. The Amendment provides for a new incremental term facility in an aggregate principal amount of $475 million, to be used, in part, to finance the acquisition of Automated Packaging Systems. In addition, we incurred $0.4 million of lender and third-party fees included in carrying amounts of outstanding debt. See Note 5, “Acquisitions,” of the Notes for additional information related to the Automated Packaging Systems acquisition.
2018 Activity
On July 12, 2018, the Company and certain of its subsidiaries entered into a third amended and restated credit agreement and an amendment No. 1 thereto (the “Third Amended and Restated Agreement”) whereby its senior secured credit facility was amended and restated with Bank of America, N.A., as agent and the other financial institutions party thereto. The changes include: (i) the refinancing of the term loan A facilities and revolving credit facilities with a new U.S. dollar term loan A facility in an aggregate principal amount of approximately $186.5 million, a new pounds sterling term loan A facility in an aggregate principal amount of approximately £29.4 million, and increased our revolving credit facilities from $700.0 million to $1.0 billion (including revolving facilities available in U.S. dollars, euros, pounds sterling, Canadian dollars, Australian dollars, Japanese yen, New Zealand dollars and Mexican pesos), (ii) increased flexibility to lower the interest rate margin for the term loan A facilities and revolving credit facilities, which will range from 125 to 200 basis points (bps) in the case of LIBOR loans, subject to the achievement of certain leverage tests, (iii) the extension of the final maturity of the term loan A facilities and revolving credit commitment to July 11, 2023, (iv) the removal of the requirement to prepay the loans with respect to excess cash flow, (v) adjustments to the financial maintenance covenant of Consolidated Net Debt to Consolidated EBITDA (in each case, as defined in the Third Amended and Restated Credit Agreement) and other covenants to provide additional flexibility to the Company, (vi) the release of certain non-U.S. asset collateral previously pledged by certain of the Company's subsidiaries and (vii) other amendments.
As a result of the Third Amended and Restated Credit Agreement, we recognized $1.9 million of loss on debt redemption in our Consolidated Statements of Operations in the year ended December 31, 2018. This amount includes $1.5 million of accelerated amortization of original issuance discount related to the term loan A and lender and non-lender fees related to the entire credit facility. Also included in the loss on debt redemption was $0.4 million of non-lender fees incurred in connection with the Third Amended and Restated Credit Agreement. In addition, we incurred $0.7 million of lender and third-party fees that are included in the carrying amounts of the outstanding debt under the credit facility. We also capitalized $4.9 million of fees that are included in other assets on our Consolidated Balance Sheets. The amortization expense related to original issuance discount and lender and non-lender fees is calculated using the effective interest rate method over the lives of the respective debt instruments.
103

Total amortization expense related to the senior secured credit facility was $2.0 million, $1.8 million and $3.2 million for the years ended December 31, 2020, 2019 and 2018, respectively, and is included in interest expense, net in our Consolidated Statements of Operations.
Lines of Credit
The following table summarizes our available lines of credit and committed and uncommitted lines of credit, including the revolving credit facility discussed above, and the amounts available under our accounts receivable securitization programs.
December 31,(In millions) 2020 2019
Used lines of credit(1) $ 7.2 $ 98.9 Unused lines of credit 1,312.0 1,245.2 Total available lines of credit(2) $ 1,319.2 $ 1,344.1
(1) Includes total borrowings under the accounts receivable securitization programs, the revolving credit facility and
borrowings under lines of credit available to several subsidiaries.(2) Of the total available lines of credit, $1,145.5 million were committed as of December 31, 2020.
Covenants
Each issue of our outstanding senior notes imposes limitations on our operations and those of specified subsidiaries. Our Credit Facility contains customary affirmative and negative covenants for credit facilities of this type, including limitations on our indebtedness, liens, investments, restricted payments, mergers and acquisitions, dispositions of assets, transactions with affiliates, amendment of documents and sale leasebacks, and a covenant specifying a maximum leverage ratio to EBITDA. We were in compliance with the above financial covenants and limitations at December 31, 2020 and 2019.
Note 15 Derivatives and Hedging Activities
We report all derivative instruments on our Consolidated Balance Sheets at fair value and establish criteria for designation and effectiveness of transactions entered into for hedging purposes.
As a global organization, we face exposure to market risks, such as fluctuations in foreign currency exchange rates and interest rates. To manage the volatility relating to these exposures, we enter into various derivative instruments from time to time under our risk management policies. We designate derivative instruments as hedges on a transaction basis to support hedge accounting. The changes in fair value of these hedging instruments offset in part or in whole corresponding changes in the fair value or cash flows of the underlying exposures being hedged. We assess the initial and ongoing effectiveness of our hedging relationships in accordance with our policy. We do not purchase, hold or sell derivative financial instruments for trading purposes. Our practice is to terminate derivative transactions if the underlying asset or liability matures or is sold or terminated, or if we determine the underlying forecasted transaction is no longer probable of occurring.
We record the fair value positions of all derivative financial instruments on a net basis by counterparty for which a master netting arrangement is utilized.
Foreign Currency Forward Contracts Designated as Cash Flow Hedges
The primary purpose of our cash flow hedging activities is to manage the potential changes in value associated with the amounts receivable or payable on equipment and raw material purchases that are denominated in foreign currencies in order to minimize the impact of the changes in foreign currencies. We record gains and losses on foreign currency forward contracts qualifying as cash flow hedges in AOCL to the extent that these hedges are effective and until we recognize the underlying transactions in net earnings, at which time we recognize these gains and losses in cost of sales on our Consolidated Statements of Operations. Cash flows from derivative financial instruments designated as cash flow hedges are classified as cash flows from operating activities in the Consolidated Statements of Cash Flows. These contracts generally have original maturities of less than 12 months.
104
Net unrealized after-tax gains/losses related to cash flow hedging activities included in AOCL were a $1.6 million loss, a $2.8 million loss and a $2.9 million gain for the years ended December 31, 2020, 2019 and 2018, respectively. The unrealized amount in AOCL will fluctuate based on changes in the fair value of open contracts during each reporting period.
We estimate that $2.9 million of net unrealized losses related to cash flow hedging activities included in AOCL will be reclassified into earnings within the next twelve months.
Foreign Currency Forward Contracts Not Designated as Hedges
Our subsidiaries have foreign currency exchange exposure from buying and selling in currencies other than their functional currencies. The primary purposes of our foreign currency hedging activities are to manage the potential changes in value associated with the amounts receivable or payable on transactions denominated in foreign currencies and to minimize the impact of the changes in foreign currencies related to foreign currency-denominated interest-bearing intercompany loans and receivables and payables. The changes in fair value of these derivative contracts are recognized in other income (expense), net, on our Consolidated Statements of Operations and are largely offset by the remeasurement of the underlying foreign currency-denominated items indicated above. Cash flows from derivative financial instruments are classified as cash flows from investing activities in the Consolidated Statements of Cash Flows. These contracts generally have original maturities of less than 12 months.
Interest Rate Swaps
From time to time, we may use interest rate swaps to manage our fixed and floating interest rates on our outstanding indebtedness. At December 31, 2020 and 2019, we had no outstanding interest rate swaps.
Net Investment Hedge
The €400.0 million 4.50% notes issued in June 2015 are designated as a net investment hedge, hedging a portion of our net investment in a certain European subsidiary against fluctuations in foreign exchange rates. The increase in the translated value of the debt was $42.0 million ($31.5 million net of tax) as of December 31, 2020, and is reflected in AOCL on our Consolidated Balance Sheets.
For derivative instruments that are designated and qualify as hedges of net investments in foreign operations, changes in fair values of the derivative instruments are recognized in unrealized net gains or loss on derivative instruments for net investment hedge, a component of AOCL, net of taxes, to offset the changes in the values of the net investments being hedged. Any portion of the net investment hedge that is determined to be ineffective is recorded in other (expense) income, net on the Consolidated Statements of Operations.
Other Derivative Instruments
We may use other derivative instruments from time to time to manage exposure to foreign exchange rates and to access international financing transactions. These instruments can potentially limit foreign exchange exposure by swapping borrowings denominated in one currency for borrowings denominated in another currency.
Fair Value of Derivative Instruments
See Note 16, “Fair Value Measurements, Equity Investments and Other Financial Instruments,” of the Notes for a discussion of the inputs and valuation techniques used to determine the fair value of our outstanding derivative instruments.
The following table details the fair value of our derivative instruments included on our Consolidated Balance Sheets.
105

Cash Flow HedgeNon-Designated as Hedging
Instruments Total December 31, December 31, December 31,
(In millions) 2020 2019 2020 2019 2020 2019Derivative Assets Foreign currency forward contracts and options $ — $ 0.2 $ 7.3 $ 2.6 $ 7.3 $ 2.8
Total Derivative Assets $ — $ 0.2 $ 7.3 $ 2.6 $ 7.3 $ 2.8 Derivative Liabilities Foreign currency forward contracts $ (2.8) $ (2.0) $ (4.2) $ (2.0) $ (7.0) $ (4.0) Total Derivative Liabilities(1) $ (2.8) $ (2.0) $ (4.2) $ (2.0) $ (7.0) $ (4.0) Net Derivatives (2) $ (2.8) $ (1.8) $ 3.1 $ 0.6 $ 0.3 $ (1.2)
(1) Excludes €400.0 million of euro-denominated debt ($490.2 million equivalent at December 31, 2020 and $445.6
million equivalent at December 31, 2019), which is designated as a net investment hedge.(2) The following table reconciles gross positions without the impact of master netting agreements to the balance sheet
classification:
Other Current Assets Other Current Liabilities December 31, December 31,
(In millions) 2020 2019 2020 2019Gross position $ 7.3 $ 2.8 $ (7.0) $ (4.0) Impact of master netting agreements (2.3) (1.1) 2.3 1.1 Net amounts recognized on the Consolidated Balance Sheets $ 5.0 $ 1.7 $ (4.7) $ (2.9)
The following table details the effect of our derivative instruments on our Consolidated Statements of Operations.
Location of Gain (Loss) Recognized onAmount of Gain (Loss) Recognized in
Earnings on Derivatives Consolidated Statements of Operations Year Ended December 31,
(In millions) 2020 2019 2018
Derivatives designated as hedging instruments: Cash Flow Hedges: Foreign currency forward contracts Cost of sales $ (0.8) $ 1.6 $ 0.2 Treasury locks Interest expense, net 0.1 0.1 0.1
Sub-total cash flow hedges (0.7) 1.7 0.3 Fair Value Hedges: Interest rate swaps Interest expense, net — 0.6 0.5 Derivatives not designated as hedging instruments: Foreign currency forward contracts and options Other income (expense), net 4.1 (6.6) (12.3) Total $ 3.4 $ (4.3) $ (11.5)
106
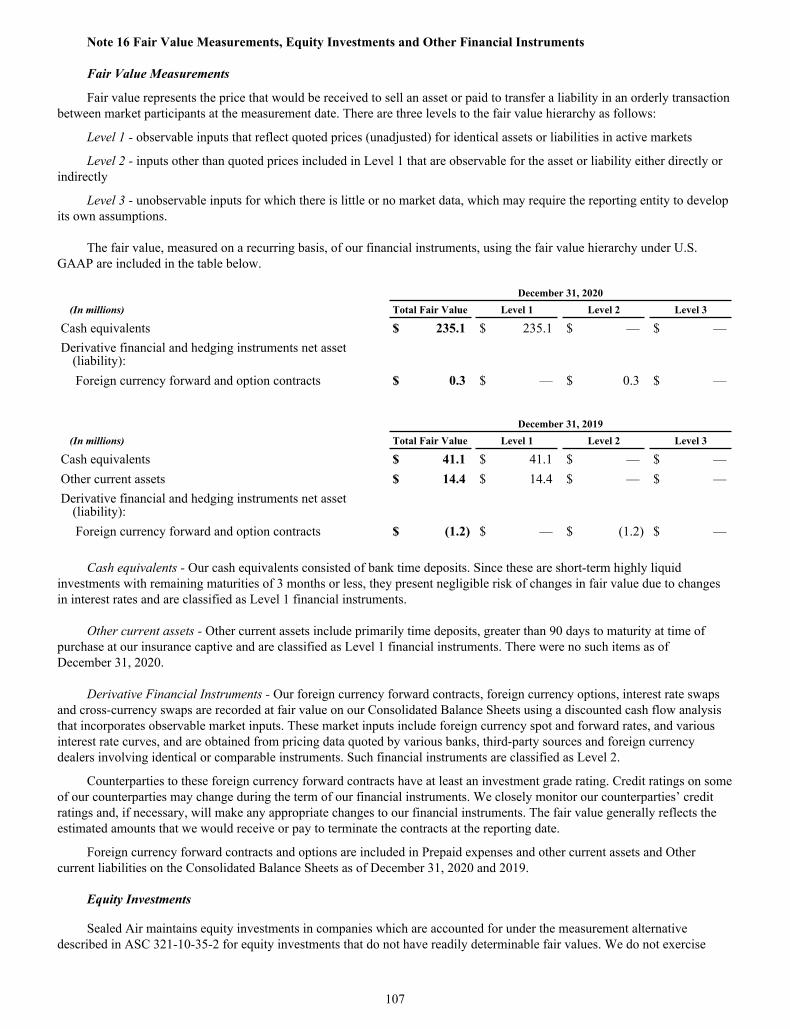
Note 16 Fair Value Measurements, Equity Investments and Other Financial Instruments
Fair Value Measurements
Fair value represents the price that would be received to sell an asset or paid to transfer a liability in an orderly transaction between market participants at the measurement date. There are three levels to the fair value hierarchy as follows:
Level 1 - observable inputs that reflect quoted prices (unadjusted) for identical assets or liabilities in active markets
Level 2 - inputs other than quoted prices included in Level 1 that are observable for the asset or liability either directly or indirectly
Level 3 - unobservable inputs for which there is little or no market data, which may require the reporting entity to develop its own assumptions.
The fair value, measured on a recurring basis, of our financial instruments, using the fair value hierarchy under U.S. GAAP are included in the table below.
December 31, 2020(In millions) Total Fair Value Level 1 Level 2 Level 3
Cash equivalents $ 235.1 $ 235.1 $ — $ — Derivative financial and hedging instruments net asset
(liability): Foreign currency forward and option contracts $ 0.3 $ — $ 0.3 $ —
December 31, 2019(In millions) Total Fair Value Level 1 Level 2 Level 3
Cash equivalents $ 41.1 $ 41.1 $ — $ — Other current assets $ 14.4 $ 14.4 $ — $ — Derivative financial and hedging instruments net asset
(liability): Foreign currency forward and option contracts $ (1.2) $ — $ (1.2) $ —
Cash equivalents - Our cash equivalents consisted of bank time deposits. Since these are short-term highly liquid investments with remaining maturities of 3 months or less, they present negligible risk of changes in fair value due to changes in interest rates and are classified as Level 1 financial instruments.
Other current assets - Other current assets include primarily time deposits, greater than 90 days to maturity at time of purchase at our insurance captive and are classified as Level 1 financial instruments. There were no such items as of December 31, 2020.
Derivative Financial Instruments - Our foreign currency forward contracts, foreign currency options, interest rate swaps and cross-currency swaps are recorded at fair value on our Consolidated Balance Sheets using a discounted cash flow analysis that incorporates observable market inputs. These market inputs include foreign currency spot and forward rates, and various interest rate curves, and are obtained from pricing data quoted by various banks, third-party sources and foreign currency dealers involving identical or comparable instruments. Such financial instruments are classified as Level 2.
Counterparties to these foreign currency forward contracts have at least an investment grade rating. Credit ratings on some of our counterparties may change during the term of our financial instruments. We closely monitor our counterparties’ credit ratings and, if necessary, will make any appropriate changes to our financial instruments. The fair value generally reflects the estimated amounts that we would receive or pay to terminate the contracts at the reporting date.
Foreign currency forward contracts and options are included in Prepaid expenses and other current assets and Other current liabilities on the Consolidated Balance Sheets as of December 31, 2020 and 2019.
Equity Investments
Sealed Air maintains equity investments in companies which are accounted for under the measurement alternative described in ASC 321-10-35-2 for equity investments that do not have readily determinable fair values. We do not exercise
107

significant influence over these companies. The carrying value of these investments are included in the table below. December 31,
(In millions) 2020 2019 2018
Carrying amount at the beginning of period $ 7.5 $ 7.5 $ — Purchases 2.6 — 7.5 Impairments or downward adjustments — — — Upward adjustments 15.1 — — Currency translation on investments 0.2 — — Carrying amount at the end of period $ 25.4 $ 7.5 $ 7.5
There have been no cumulative impairments or downward adjustments on any of the equity investments above, as of December 31, 2020. The cumulative upward adjustments of the equity investments above, as of December 31, 2020, is $15.1 million. The upward fair value adjustment was recorded in the fourth quarter 2020, based on the valuation of additional equity issued by the investee which was deemed to be an observable transaction of a similar investment under ASC 321. The gain was recorded within Other income (expense), net on the Consolidated Statements of Operations.
During the fourth quarter of 2020, Sealed Air made an additional investment in one of our investees of $5.7 million. The equity issuance is subject to customary regulatory and statutory approval which we expect to receive in early 2021. Upon receipt of approval, this investment will convert to equity and be held as an equity investment valued under the measurement alternative in ASC 321.
Our equity investments described above are maintained on the Consolidated Balance Sheets within Other non-current assets.
Other Financial Instruments
The following financial instruments are recorded at fair value or at amounts that approximate fair value: (1) trade receivables, net, (2) certain other current assets, (3) accounts payable and (4) other current liabilities. The carrying amounts reported on our Consolidated Balance Sheets for the above financial instruments closely approximate their fair value due to the short-term nature of these assets and liabilities.
Other liabilities that are recorded at carrying value on our Consolidated Balance Sheets include our credit facilities and senior notes. We utilize a market approach to calculate the fair value of our senior notes. Due to their limited investor base and the face value of some of our senior notes, they may not be actively traded on the date we calculate their fair value. Therefore, we may utilize prices and other relevant information generated by market transactions involving similar securities, reflecting U.S. Treasury yields to calculate the yield to maturity and the price on some of our senior notes. These inputs are provided by an independent third party and are considered to be Level 2 inputs.
We derive our fair value estimates of our various other debt instruments by evaluating the nature and terms of each instrument, considering prevailing economic and market conditions, and examining the cost of similar debt offered at the balance sheet date. We also incorporated our credit default swap rates and currency specific swap rates in the valuation of each debt instrument, as applicable.
These estimates are subjective and involve uncertainties and matters of significant judgment, and therefore we cannot determine them with precision. Changes in assumptions could significantly affect our estimates.
The table below shows the carrying amounts and estimated fair values of our debt, excluding our lease liabilities:
108
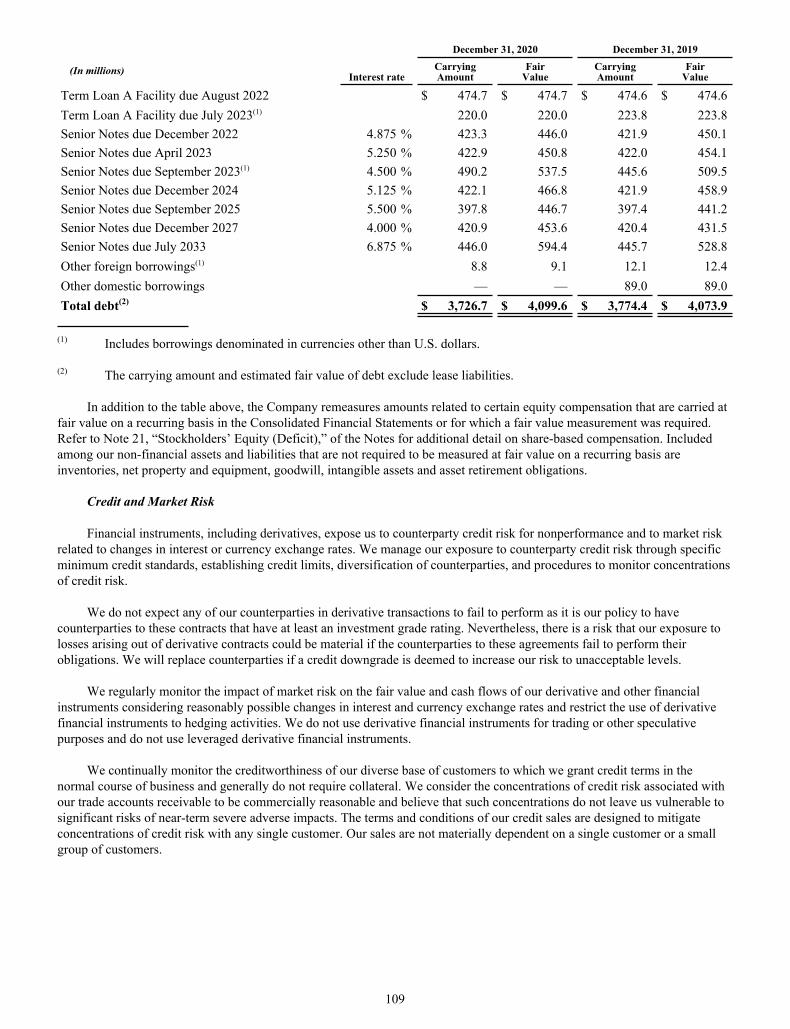
December 31, 2020 December 31, 2019
(In millions) Interest rateCarryingAmount
FairValue
CarryingAmount
FairValue
Term Loan A Facility due August 2022 $ 474.7 $ 474.7 $ 474.6 $ 474.6 Term Loan A Facility due July 2023(1) 220.0 220.0 223.8 223.8 Senior Notes due December 2022 4.875 % 423.3 446.0 421.9 450.1 Senior Notes due April 2023 5.250 % 422.9 450.8 422.0 454.1 Senior Notes due September 2023(1) 4.500 % 490.2 537.5 445.6 509.5 Senior Notes due December 2024 5.125 % 422.1 466.8 421.9 458.9 Senior Notes due September 2025 5.500 % 397.8 446.7 397.4 441.2 Senior Notes due December 2027 4.000 % 420.9 453.6 420.4 431.5 Senior Notes due July 2033 6.875 % 446.0 594.4 445.7 528.8 Other foreign borrowings(1) 8.8 9.1 12.1 12.4 Other domestic borrowings — — 89.0 89.0 Total debt(2) $ 3,726.7 $ 4,099.6 $ 3,774.4 $ 4,073.9
(1) Includes borrowings denominated in currencies other than U.S. dollars.
(2) The carrying amount and estimated fair value of debt exclude lease liabilities.
In addition to the table above, the Company remeasures amounts related to certain equity compensation that are carried at fair value on a recurring basis in the Consolidated Financial Statements or for which a fair value measurement was required. Refer to Note 21, “Stockholders’ Equity (Deficit),” of the Notes for additional detail on share-based compensation. Included among our non-financial assets and liabilities that are not required to be measured at fair value on a recurring basis are inventories, net property and equipment, goodwill, intangible assets and asset retirement obligations.
Credit and Market Risk
Financial instruments, including derivatives, expose us to counterparty credit risk for nonperformance and to market risk related to changes in interest or currency exchange rates. We manage our exposure to counterparty credit risk through specific minimum credit standards, establishing credit limits, diversification of counterparties, and procedures to monitor concentrations of credit risk.
We do not expect any of our counterparties in derivative transactions to fail to perform as it is our policy to have counterparties to these contracts that have at least an investment grade rating. Nevertheless, there is a risk that our exposure to losses arising out of derivative contracts could be material if the counterparties to these agreements fail to perform their obligations. We will replace counterparties if a credit downgrade is deemed to increase our risk to unacceptable levels.
We regularly monitor the impact of market risk on the fair value and cash flows of our derivative and other financial instruments considering reasonably possible changes in interest and currency exchange rates and restrict the use of derivative financial instruments to hedging activities. We do not use derivative financial instruments for trading or other speculative purposes and do not use leveraged derivative financial instruments.
We continually monitor the creditworthiness of our diverse base of customers to which we grant credit terms in the normal course of business and generally do not require collateral. We consider the concentrations of credit risk associated with our trade accounts receivable to be commercially reasonable and believe that such concentrations do not leave us vulnerable to significant risks of near-term severe adverse impacts. The terms and conditions of our credit sales are designed to mitigate concentrations of credit risk with any single customer. Our sales are not materially dependent on a single customer or a small group of customers.
109

Note 17 Profit Sharing, Retirement Savings Plans and Defined Benefit Pension Plans
Profit Sharing and Retirement Savings Plans
We have a qualified non-contributory profit sharing plan covering most of our U.S. employees. Contributions to this plan, which are made at the discretion of our Board of Directors, may be made in cash, shares of our common stock, or in a combination of cash and shares of our common stock. We also maintain a qualified contributory retirement savings plan in which most of our U.S. employees are eligible to participate. The qualified contributory retirement savings plans generally provide for our contributions in cash based upon the amount contributed to the plans by the participants.
Our contributions to our profit sharing plan accrual and retirement savings plans are charged to operations and amounted to $46.3 million in 2020, $39.3 million in 2019 and $36.3 million in 2018. In 2020, 823,567 shares were contributed as part of our contribution to the profit sharing plan related to 2019; in 2019, 487,108 shares were contributed as part of our contribution to the profit sharing plan related to 2018, and in 2018, 538,524 shares were contributed as part of our contribution to the profit sharing plan related to 2017. These shares were issued out of treasury stock.
We have various international defined contribution benefit plans which cover certain employees. We have expanded use of these plans in select countries where they have been used to supplement or replace defined benefit plans.
Defined Benefit Pension Plans
We recognize the funded status of each defined pension benefit plan as the difference between the fair value of plan assets and the projected benefit obligation of the employee benefit plans in the Consolidated Balance Sheets, with a corresponding adjustment to accumulated other comprehensive loss, net of taxes. Each overfunded plan is recognized as an asset and each underfunded plan is recognized as a liability on our Consolidated Balance Sheets. Subsequent changes in the funded status are reflected on the Consolidated Balance Sheets in unrecognized pension items, a component of AOCL, which are included in total stockholders’ equity (deficit). The amount of unamortized pension items is recorded net of tax.
We amortize actuarial gains or losses over the average future working lifetime (or remaining lifetime of inactive participants if there are no active participants). We use the corridor method, where the corridor is the greater of ten percent of the projected benefit obligation or fair value of assets at year end. If actuarial gains or losses do not exceed the corridor, then there is no amortization of gain or loss.
The following table shows the components of our net periodic benefit cost (income) and cost of special events for the three years ended December 31, for our pension plans charged to operations:
Year Ended December 31,(In millions) 2020 2019 2018
Net periodic benefit cost (income):
U.S. and international net periodic benefit cost included in cost of sales(1) $ 1.2 $ 1.1 $ 0.8 U.S. and international net periodic benefit cost included in selling, general
and administrative expenses 3.4 2.8 3.5 U.S. and international net periodic benefit (income) and cost of special
events included in other (income) expense (3.8) (4.4) (8.4) Total benefit cost (income) $ 0.8 $ (0.5) $ (4.1)
(1) The amount recorded in inventory for the years ended December 31, 2020, 2019 and 2018 was not material.
A number of our U.S. employees, including some employees who are covered by collective bargaining agreements, participate in defined benefit pension plans. Some of our international employees participate in defined benefit pension plans in their respective countries. The following table presents our funded status for 2020 and 2019 for our U.S. and international pension plans. The measurement date used to determine benefit obligations and plan assets is December 31 for all material plans.
110
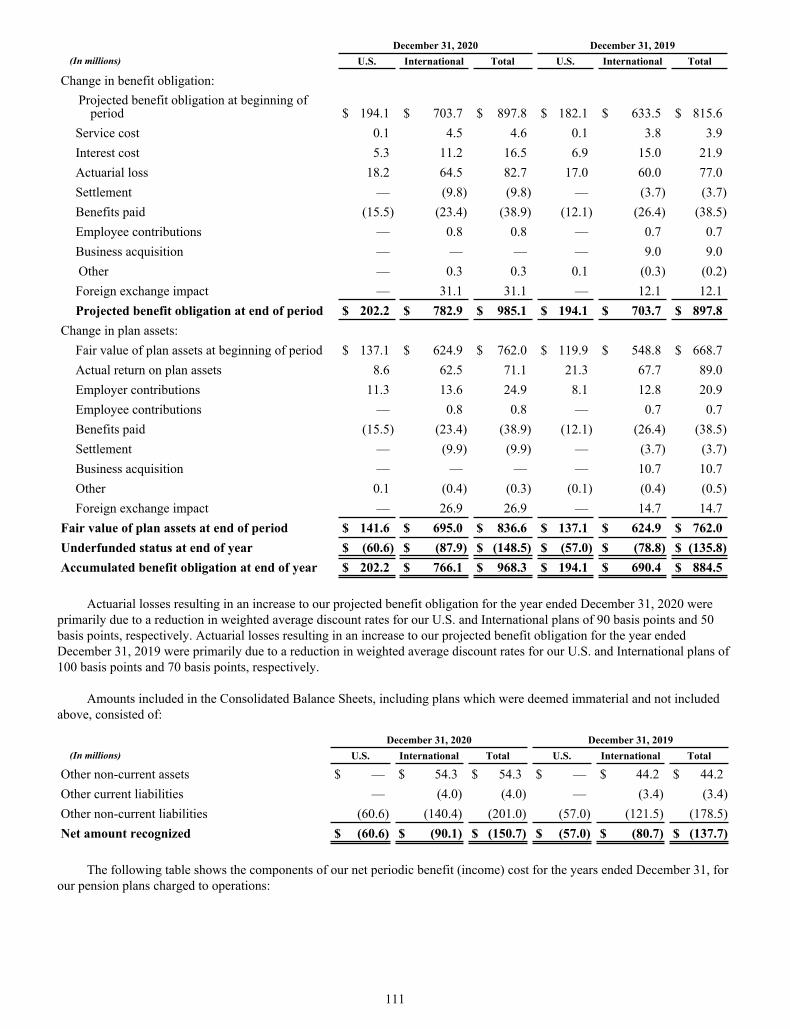
December 31, 2020 December 31, 2019(In millions) U.S. International Total U.S. International Total
Change in benefit obligation: Projected benefit obligation at beginning of
period $ 194.1 $ 703.7 $ 897.8 $ 182.1 $ 633.5 $ 815.6 Service cost 0.1 4.5 4.6 0.1 3.8 3.9 Interest cost 5.3 11.2 16.5 6.9 15.0 21.9 Actuarial loss 18.2 64.5 82.7 17.0 60.0 77.0 Settlement — (9.8) (9.8) — (3.7) (3.7) Benefits paid (15.5) (23.4) (38.9) (12.1) (26.4) (38.5) Employee contributions — 0.8 0.8 — 0.7 0.7 Business acquisition — — — — 9.0 9.0 Other — 0.3 0.3 0.1 (0.3) (0.2) Foreign exchange impact — 31.1 31.1 — 12.1 12.1 Projected benefit obligation at end of period $ 202.2 $ 782.9 $ 985.1 $ 194.1 $ 703.7 $ 897.8
Change in plan assets: Fair value of plan assets at beginning of period $ 137.1 $ 624.9 $ 762.0 $ 119.9 $ 548.8 $ 668.7 Actual return on plan assets 8.6 62.5 71.1 21.3 67.7 89.0 Employer contributions 11.3 13.6 24.9 8.1 12.8 20.9 Employee contributions — 0.8 0.8 — 0.7 0.7 Benefits paid (15.5) (23.4) (38.9) (12.1) (26.4) (38.5) Settlement — (9.9) (9.9) — (3.7) (3.7) Business acquisition — — — — 10.7 10.7 Other 0.1 (0.4) (0.3) (0.1) (0.4) (0.5) Foreign exchange impact — 26.9 26.9 — 14.7 14.7
Fair value of plan assets at end of period $ 141.6 $ 695.0 $ 836.6 $ 137.1 $ 624.9 $ 762.0 Underfunded status at end of year $ (60.6) $ (87.9) $ (148.5) $ (57.0) $ (78.8) $ (135.8) Accumulated benefit obligation at end of year $ 202.2 $ 766.1 $ 968.3 $ 194.1 $ 690.4 $ 884.5
Actuarial losses resulting in an increase to our projected benefit obligation for the year ended December 31, 2020 were primarily due to a reduction in weighted average discount rates for our U.S. and International plans of 90 basis points and 50 basis points, respectively. Actuarial losses resulting in an increase to our projected benefit obligation for the year ended December 31, 2019 were primarily due to a reduction in weighted average discount rates for our U.S. and International plans of 100 basis points and 70 basis points, respectively.
Amounts included in the Consolidated Balance Sheets, including plans which were deemed immaterial and not included above, consisted of:
December 31, 2020 December 31, 2019(In millions) U.S. International Total U.S. International Total
Other non-current assets $ — $ 54.3 $ 54.3 $ — $ 44.2 $ 44.2 Other current liabilities — (4.0) (4.0) — (3.4) (3.4) Other non-current liabilities (60.6) (140.4) (201.0) (57.0) (121.5) (178.5) Net amount recognized $ (60.6) $ (90.1) $ (150.7) $ (57.0) $ (80.7) $ (137.7)
The following table shows the components of our net periodic benefit (income) cost for the years ended December 31, for our pension plans charged to operations:
111

December 31, 2020 December 31, 2019 December 31, 2018(In millions) U.S. International Total U.S. International Total U.S. International Total
Components of net periodic benefit (income) cost:
Service cost $ 0.1 $ 4.5 $ 4.6 $ 0.1 $ 3.8 $ 3.9 $ 0.1 $ 4.2 $ 4.3 Interest cost 5.3 11.2 16.5 6.9 15.0 21.9 6.5 15.2 21.7 Expected return on plan
assets (9.0) (19.4) (28.4) (7.3) (24.7) (32.0) (8.7) (29.2) (37.9) Other adjustments — — — — — — 0.1 — 0.1 Amortization of net prior
service cost — 0.2 0.2 — 0.2 0.2 — — — Amortization of net
actuarial loss 1.5 4.6 6.1 1.4 3.7 5.1 0.9 2.4 3.3 Net periodic benefit
(income) cost (2.1) 1.1 (1.0) 1.1 (2.0) (0.9) (1.1) (7.4) (8.5) Cost of settlement — 1.8 1.8 — 0.4 0.4 1.6 2.8 4.4 Total benefit cost (income) $ (2.1) $ 2.9 $ 0.8 $ 1.1 $ (1.6) $ (0.5) $ 0.5 $ (4.6) $ (4.1)
The amounts included in AOCL that have not yet been recognized as components of net periodic benefit cost at December 31, 2020 and 2019 are:
December 31, 2020 December 31, 2019(In millions) U.S. International Total U.S. International Total
Unrecognized net prior service costs $ 0.2 $ 5.2 $ 5.4 $ 0.2 $ 4.5 $ 4.7 Unrecognized net actuarial loss 66.0 158.8 224.8 48.9 143.6 192.5 Total $ 66.2 $ 164.0 $ 230.2 $ 49.1 $ 148.1 $ 197.2
Changes in plan assets and benefit obligations recognized in AOCL for the year ended December 31, 2020 and 2019 were as follows:
December 31, 2020 December 31, 2019(In millions) U.S. International Total U.S. International Total
Current year actuarial loss $ 18.6 $ 21.4 $ 40.0 $ 3.0 $ 16.9 $ 19.9 Prior year service cost occurring during the year — 0.8 0.8 0.1 — 0.1 Amortization of actuarial loss (1.5) (4.6) (6.1) (1.4) (3.7) (5.1) Amortization of prior service cost — (0.2) (0.2) — (0.2) (0.2) Settlement — (1.8) (1.8) — (0.4) (0.4)
Total $ 17.1 $ 15.6 $ 32.7 $ 1.7 $ 12.6 $ 14.3
Information for plans with accumulated benefit obligations and projected benefit obligations in excess of plan assets as of December 31, 2020 and 2019 are as follows:
December 31, 2020 December 31, 2019(In millions) U.S. International Total U.S. International Total
Projected benefit obligation $ 202.2 $ 526.4 $ 728.6 $ 194.1 $ 467.5 $ 661.6 Accumulated benefit obligation 202.2 510.3 712.5 194.1 454.7 648.8 Fair value of plan assets 141.6 384.0 525.6 137.1 344.6 481.7
Actuarial Assumptions
Weighted average assumptions used to determine benefit obligations at December 31, 2020 and 2019 were as follows:
112

December 31, 2020 December 31, 2019(In millions) U.S. International U.S. International
Benefit obligations Discount rate 2.4 % 1.4 % 3.3 % 1.9 %Rate of compensation increase N/A 2.3 % N/A 2.3 %Cash balance interest credit rate 1.2 % 1.1 % 2.0 % 1.1 %
Weighted average assumptions used to determine net periodic benefit cost for the years ended December 31, were as follows:
December 31, 2020 December 31, 2019 December 31, 2018(In millions) U.S. International U.S. International U.S. International
Net periodic benefit cost Discount rate 3.3 % 1.9 % 4.3 % 2.6 % 3.6 % 2.5 %Expected long-term rate of return 6.5 % 3.3 % 6.2 % 4.7 % 6.2 % 4.9 %Rate of compensation increase N/A 2.3 % N/A 2.3 % N/A 2.3 %Cash balance interest credit rate 2.0 % 1.1 % 3.0 % 1.4 % 2.3 % 1.1 %
Estimated Future Benefit Payments
We expect the following estimated future benefit payments, which reflect expected future service as appropriate, to be paid in the years indicated:
Amount
(in millions)Year U.S. International Total
2021 $ 11.8 $ 30.2 $ 42.0 2022 11.7 28.3 40.0 2023 11.7 28.2 39.9 2024 11.7 30.6 42.3 2025 11.2 30.8 42.0 2026 to 2030 (combined) 54.9 171.6 226.5 Total $ 113.0 $ 319.7 $ 432.7
Plan Assets
We review the expected long-term rate of return on plan assets annually, taking into consideration our asset allocation, historical returns, and the current economic environment. The expected return on plan assets is calculated based on the fair value of plan assets at year end. To determine the expected return on plan assets, expected cash flows have been taken into account.
Our long-term objectives for plan investments are to ensure that (a) there is an adequate level of assets to support benefit obligations to participants over the life of the plans, (b) there is sufficient liquidity in plan assets to cover current benefit obligations, and (c) there is a high level of investment return consistent with a prudent level of investment risk. The investment strategy is focused on a long-term total return in excess of a pure fixed income strategy with short-term volatility less than that of a pure equity strategy. To accomplish these objectives, in many instances the plan assets are invested on a glide-path which reduces the exposure to return-seeking assets as the plan's funded status increases. Overall, we invest assets primarily in a diversified mix of equity and fixed income investments. For our U.S. plan, the target asset allocation includes 65%-75% in return seeking assets, which are primarily comprised of global equities. The remainder of the assets in the U.S. plan are comprised of liability hedging assets which are primarily fixed income investments.
In some of our international pension plans, we have purchased bulk annuity contracts (buy-ins). These annuity contracts provide cash flows that match the future benefit payments for a specific group of pensioners. These contacts are issued by third party insurance companies with no affiliation to Sealed Air. Insurance companies from which we purchase the annuity contracts are assessed as credit worthy. As of December 31, 2020 and 2019, buy-ins represented $131.2 million and $119.5 million of
113

total plan assets, respectively. The value of these assets is actuarially determined based on the present value of the underlying liabilities.
We currently expect our contributions to the pension plans to be approximately $18.1 million in 2021. Additionally, we expect benefits paid directly by the Company related to our defined benefit pension plans to be $4.0 million in 2021.
The fair values of our U.S. and international pension plan assets, by asset category and by the level of fair values are as follows:
December 31, 2020 December 31, 2019
Total Total
(In millions)Fair
Value Level 1 Level 2 Level 3 NAV(5)Fair
Value Level 1 Level 2 Level 3 NAV(5)
Cash and cash equivalents(1) $ 11.0 $ 2.1 $ 8.9 $ — $ — $ 43.4 $ 1.9 $ 41.5 $ — $ — Fixed income funds(2) 417.3 — 281.5 — 135.8 323.8 — 210.2 — 113.6 Equity funds(3) 122.3 — 48.0 — 74.3 146.9 — 61.5 — 85.4 Other(4) 286.0 — 9.1 206.4 70.5 247.9 — 9.9 180.2 57.8 Total $ 836.6 $ 2.1 $ 347.5 $ 206.4 $ 280.6 $ 762.0 $ 1.9 $ 323.1 $ 180.2 $ 256.8
(1) Short-term investment fund that invests in a collective trust that holds short-term highly liquid investments with
principal preservation and daily liquidity as its primary objectives. Investments are primarily comprised of certificates of deposit, government securities, commercial paper, and time deposits.
(2) Fixed income funds that invest in a diversified portfolio primarily consisting of publicly traded government bonds and corporate bonds. There are no restrictions on these investments, and they are valued at the net asset value of shares held at year end.
(3) Equity funds that invest in a diversified portfolio of publicly traded domestic and international common stock. There are no restrictions on these investments, and they are valued at the net asset value of units held at year end.
(4) The largest component of other assets are bulk annuity contracts (buy-ins). These annuity contracts provide cash flows that match the future benefit payments for a specific group of pensioners. The other assets also include real estate and other alternative investments.
(5) These assets are measured at Net Asset Value (NAV) as a practical expedient under ASC 820.
The following table shows the activity of our U.S. and international plan assets, which are measured at fair value using Level 3 inputs.
December 31,(In millions) 2020 2019
Balance at beginning of period $ 180.2 $ 150.1 Gain on assets still held at end of year 15.4 16.8 Purchases, sales, issuance, and settlements 2.4 8.3 Foreign exchange gain 8.4 5.0
Balance at end of period $ 206.4 $ 180.2
Note 18 Other Post-Employment Benefits and Other Employee Benefit Plans
In addition to providing pension benefits, we maintain two Other Post-Employment Benefit Plans which provide a portion of healthcare, dental, vision and life insurance benefits for certain retired legacy employees. These plans are in the U.S. and Canada. Covered employees who retired on or after attaining age 55 and who had rendered at least 10 years of service were entitled to post-retirement healthcare, dental and life insurance benefits. These benefits are subject to deductibles, co-payment provisions and other limitations. The information below relates to these two plans.
Contributions made by us, net of Medicare Part D subsidies received in the U.S., are reported below as benefits paid. We may change the benefits at any time. The status of these plans, including a reconciliation of benefit obligations, a reconciliation of plan assets and the funded status of the plans, follows:
114

December 31,
(In millions) 2020 2019
Change in benefit obligations: Benefit obligation at beginning of period $ 43.5 $ 46.4 Interest cost 1.0 1.6 Actuarial loss (gain) 2.4 (1.2) Benefits paid, net (3.5) (3.3) Benefit obligation at end of period $ 43.4 $ 43.5 Change in plan assets: Fair value of plan assets at beginning of period $ — $ — Employer contribution 3.5 3.3 Benefits paid, net (3.5) (3.3) Fair value of plan assets at end of period $ — $ — Net amount recognized: Underfunded status $ (43.4) $ (43.5) Accumulated benefit obligation at end of year $ 43.4 $ 43.5 Net amount recognized in consolidated balance sheets consists of:
Current liability $ (5.1) $ (5.3) Non-current liability (38.3) (38.2)
Net amount recognized $ (43.4) $ (43.5) Amounts recognized in accumulated other comprehensive loss consist of:
Net actuarial loss (gain) $ 1.9 $ (0.6) Prior service credit (2.3) (2.6)
Total $ (0.4) $ (3.2)
Actuarial losses resulting in an increase to our projected benefit obligation for the year ended December 31, 2020 were primarily due to a reduction in the weighted average discount rate of 90 basis points. The accumulated post-retirement benefit obligations were determined using a weighted-average discount rate of 2.2% at December 31, 2020 and 3.1% at December 31, 2019.
The components of net periodic benefit cost were as follows:
Year Ended December 31,(In millions) 2020 2019 2018
Components of net periodic benefit cost: Service cost $ — $ — $ 0.1 Interest cost 1.0 1.6 1.4 Amortization of net gain (0.2) (0.2) (0.2) Amortization of prior service credit (0.3) (0.3) (0.3)
Net periodic benefit cost $ 0.5 $ 1.1 $ 1.0 Impact of settlement/curtailment — — —
Total benefit cost for fiscal year $ 0.5 $ 1.1 $ 1.0
The amortization of any prior service cost is determined using a straight-line amortization of the cost over the average remaining service period of employees expected to receive benefits under the plan. Changes in benefit obligations that were recognized in AOCL for the years ended December 31, 2020 and December 31, 2019 were as follows:
115

December 31, 2020 December 31, 2019(In millions) U.S. International Total U.S. International Total
Current year actuarial loss (gain) $ 2.4 $ — $ 2.4 $ (1.0) $ (0.2) $ (1.2) Amortization of actuarial gain — 0.2 0.2 — 0.2 0.2 Amortization of prior service credit 0.3 — 0.3 0.3 — 0.3
Total $ 2.7 $ 0.2 $ 2.9 $ (0.7) $ — $ (0.7)
Healthcare Cost Trend Rates
The assumed healthcare cost trend rates have an effect on the amounts recognized in our Consolidated Statements of Operations for the healthcare plans. For the year ended December 31, 2020, healthcare cost trend rates were assumed to be 6.3% for the U.S. plan and 5.0% for the Canada plan. The trend rates assumed for 2021 are 6.5% and 5.0% for the U.S. and Canada plan, respectively. Rates are expected to decrease to 5.0% by 2028 for the U.S. plan, and remain unchanged in future years for the Canada plan.
Expected post-retirement benefits (net of Medicare Part D subsidies) for each of the next five years and succeeding five years are as follows:
YearAmount
(in millions)
2021 $ 5.1 2022 4.6 2023 4.2 2024 3.8 2025 3.3 2026 to 2030 (combined) 11.4 Total $ 32.4
Note 19 Income Taxes
In 2020, 2019 and 2018, we recorded tax provisions of $142.1 million, $76.6 million and $307.5 million, respectively. Cash tax payments, net of refunds were $102.0 million, $94.7 million and $155.0 million for 2020, 2019 and 2018, respectively.
Tax Cuts and Jobs Act
On December 22, 2017, the President of the United States signed into law the Tax Cuts and Jobs Act (“TCJA”). The legislation significantly changed U.S. tax law by, among other things, lowering the corporate income tax rate, implementing a territorial tax system and imposing a repatriation tax on deemed repatriated earnings of foreign subsidiaries (“Transition Tax”). The TCJA permanently reduced the U.S. corporate income tax rate from a maximum of 35% to 21%, effective January 1, 2018.
While the TCJA provides for a territorial tax system, beginning in 2018, it includes the global intangible low-taxed income (“GILTI”) provision. The Company has elected to account for GILTI tax in the period in which it is incurred. The GILTI provisions require the Company to include in its U.S. income tax return foreign subsidiary earnings in excess of an allowable return on the foreign subsidiary’s tangible assets.
Provisional Tax Impacts
On December 22, 2017, the SEC staff issued Staff Accounting Bulletin No. 118 (“SAB 118”) to address the application of U.S. GAAP in situations when a registrant does not have the necessary information available, prepared, or analyzed (including computations) in reasonable detail to complete the accounting for certain income tax effects of the TCJA. SAB 118 provided that where reasonable estimates can be made, the provisional accounting should be based on such estimates and when no reasonable estimate can be made, the provisional accounting may be based on the tax law in effect before the TCJA.
116
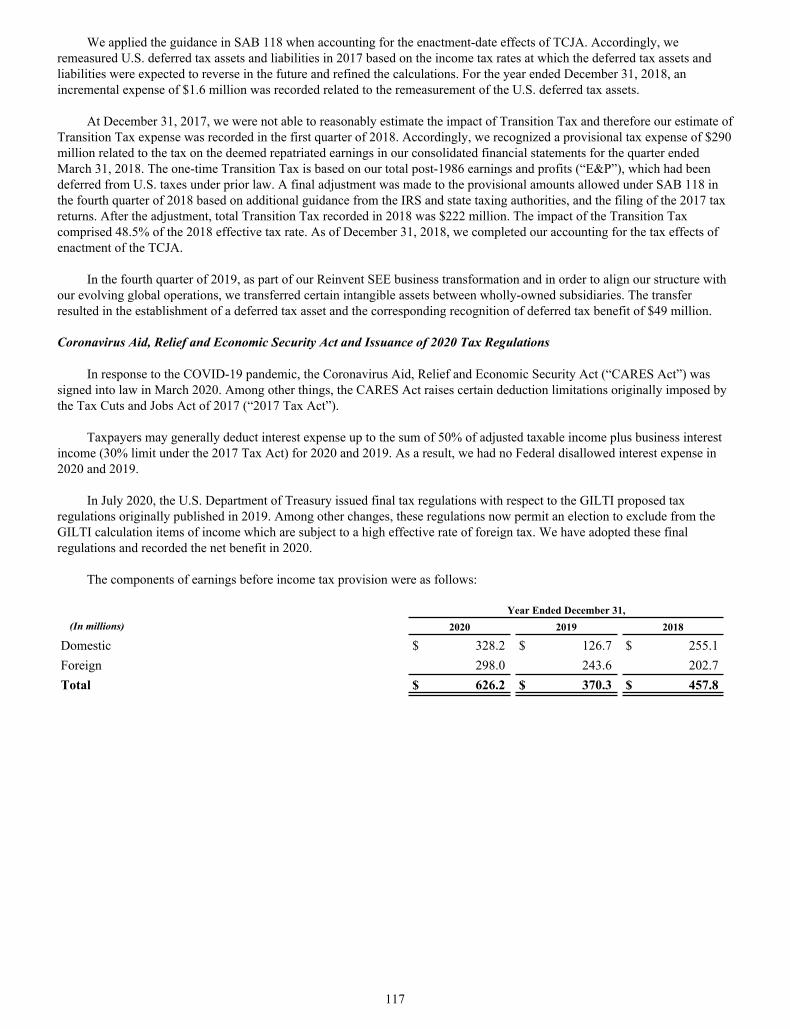
We applied the guidance in SAB 118 when accounting for the enactment-date effects of TCJA. Accordingly, we remeasured U.S. deferred tax assets and liabilities in 2017 based on the income tax rates at which the deferred tax assets and liabilities were expected to reverse in the future and refined the calculations. For the year ended December 31, 2018, an incremental expense of $1.6 million was recorded related to the remeasurement of the U.S. deferred tax assets.
At December 31, 2017, we were not able to reasonably estimate the impact of Transition Tax and therefore our estimate of Transition Tax expense was recorded in the first quarter of 2018. Accordingly, we recognized a provisional tax expense of $290 million related to the tax on the deemed repatriated earnings in our consolidated financial statements for the quarter ended March 31, 2018. The one-time Transition Tax is based on our total post-1986 earnings and profits (“E&P”), which had been deferred from U.S. taxes under prior law. A final adjustment was made to the provisional amounts allowed under SAB 118 in the fourth quarter of 2018 based on additional guidance from the IRS and state taxing authorities, and the filing of the 2017 tax returns. After the adjustment, total Transition Tax recorded in 2018 was $222 million. The impact of the Transition Tax comprised 48.5% of the 2018 effective tax rate. As of December 31, 2018, we completed our accounting for the tax effects of enactment of the TCJA.
In the fourth quarter of 2019, as part of our Reinvent SEE business transformation and in order to align our structure with our evolving global operations, we transferred certain intangible assets between wholly-owned subsidiaries. The transfer resulted in the establishment of a deferred tax asset and the corresponding recognition of deferred tax benefit of $49 million.
Coronavirus Aid, Relief and Economic Security Act and Issuance of 2020 Tax Regulations
In response to the COVID-19 pandemic, the Coronavirus Aid, Relief and Economic Security Act (“CARES Act”) was signed into law in March 2020. Among other things, the CARES Act raises certain deduction limitations originally imposed by the Tax Cuts and Jobs Act of 2017 (“2017 Tax Act”).
Taxpayers may generally deduct interest expense up to the sum of 50% of adjusted taxable income plus business interest income (30% limit under the 2017 Tax Act) for 2020 and 2019. As a result, we had no Federal disallowed interest expense in 2020 and 2019.
In July 2020, the U.S. Department of Treasury issued final tax regulations with respect to the GILTI proposed tax regulations originally published in 2019. Among other changes, these regulations now permit an election to exclude from the GILTI calculation items of income which are subject to a high effective rate of foreign tax. We have adopted these final regulations and recorded the net benefit in 2020.
The components of earnings before income tax provision were as follows:
Year Ended December 31,(In millions) 2020 2019 2018
Domestic $ 328.2 $ 126.7 $ 255.1 Foreign 298.0 243.6 202.7 Total $ 626.2 $ 370.3 $ 457.8
117

The components of our income tax provision were as follows:
Year Ended December 31,(In millions) 2020 2019 2018
Current tax expense:
Federal $ (14.2) $ 62.3 $ 228.2 State and local 5.6 4.6 9.8 Foreign 69.9 64.1 59.8 Total current expense $ 61.3 $ 131.0 $ 297.8 Deferred tax expense (benefit): Federal $ 59.4 $ (19.0) $ 56.8 State and local 11.8 4.0 (21.2) Foreign 9.6 (39.4) (25.9) Total deferred tax expense (benefit) 80.8 (54.4) 9.7 Total income tax provision $ 142.1 $ 76.6 $ 307.5
Deferred tax assets (liabilities) consist of the following:
December 31,
(In millions) 2020 2019
Accruals not yet deductible for tax purposes $ 16.0 $ 17.4 Net operating loss carryforwards 252.1 245.9 Foreign, federal and state credits 6.5 8.4 Employee benefit items 78.7 79.5 Capitalized expenses 6.2 32.2 Intangibles 24.9 21.8 Derivatives and other 59.8 47.7
Sub-total deferred tax assets 444.2 452.9 Valuation allowance (207.1) (197.6) Total deferred tax assets $ 237.1 $ 255.3
Depreciation and amortization $ (66.0) $ (37.0) Unremitted foreign earnings (11.0) (10.0) Intangible assets — — Other (4.0) (0.4)
Total deferred tax liabilities (81.0) (47.4) Net deferred tax assets $ 156.1 $ 207.9
A valuation allowance has been provided based on the uncertainty of utilizing the tax benefits, primarily related to the following deferred tax assets:
• $195.1 million of foreign items, primarily net operating losses; and • $6.0 million of state tax credits.
For the year ended December 31, 2020, the valuation allowance increased by $9.5 million. The change is primarily driven by an increase related to currency revaluation, offset by a net decrease attributable to increased profitability in EMEA.
As of December 31, 2020, we have foreign net operating loss carryforwards of $930.6 million expiring in years beginning in 2021 with the large majority of losses having an unlimited carryover. The state net operating loss carryforwards totaling $506.3 million expire in various amounts over 1 to 19 years.
As of December 31, 2020, we have $0.4 million of foreign and federal tax credit carryforwards and $7.8 million of state credit carryovers expiring in 2021 – 2028. Most of the credit carryovers have a valuation allowance.
118
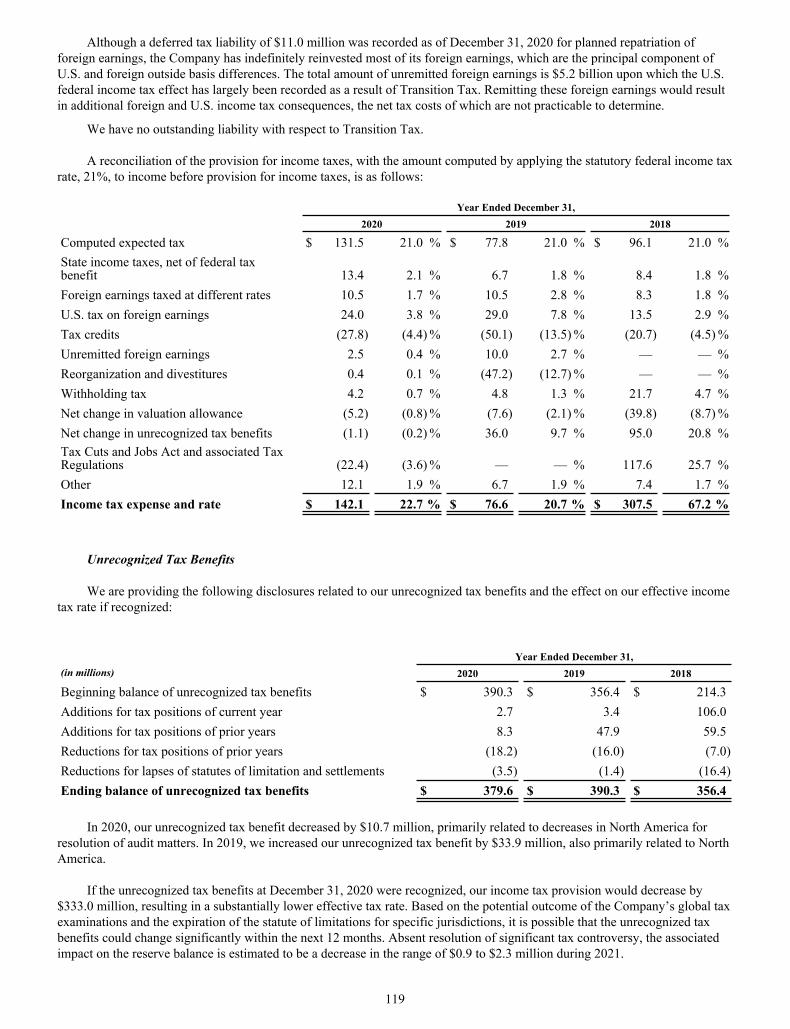
Although a deferred tax liability of $11.0 million was recorded as of December 31, 2020 for planned repatriation of foreign earnings, the Company has indefinitely reinvested most of its foreign earnings, which are the principal component of U.S. and foreign outside basis differences. The total amount of unremitted foreign earnings is $5.2 billion upon which the U.S. federal income tax effect has largely been recorded as a result of Transition Tax. Remitting these foreign earnings would result in additional foreign and U.S. income tax consequences, the net tax costs of which are not practicable to determine.
We have no outstanding liability with respect to Transition Tax.
A reconciliation of the provision for income taxes, with the amount computed by applying the statutory federal income tax rate, 21%, to income before provision for income taxes, is as follows:
Year Ended December 31, 2020 2019 2018
Computed expected tax $ 131.5 21.0 % $ 77.8 21.0 % $ 96.1 21.0 %State income taxes, net of federal tax benefit 13.4 2.1 % 6.7 1.8 % 8.4 1.8 %Foreign earnings taxed at different rates 10.5 1.7 % 10.5 2.8 % 8.3 1.8 %U.S. tax on foreign earnings 24.0 3.8 % 29.0 7.8 % 13.5 2.9 %Tax credits (27.8) (4.4) % (50.1) (13.5) % (20.7) (4.5) %Unremitted foreign earnings 2.5 0.4 % 10.0 2.7 % — — %Reorganization and divestitures 0.4 0.1 % (47.2) (12.7) % — — %Withholding tax 4.2 0.7 % 4.8 1.3 % 21.7 4.7 %Net change in valuation allowance (5.2) (0.8) % (7.6) (2.1) % (39.8) (8.7) %Net change in unrecognized tax benefits (1.1) (0.2) % 36.0 9.7 % 95.0 20.8 %Tax Cuts and Jobs Act and associated Tax Regulations (22.4) (3.6) % — — % 117.6 25.7 %Other 12.1 1.9 % 6.7 1.9 % 7.4 1.7 %Income tax expense and rate $ 142.1 22.7 % $ 76.6 20.7 % $ 307.5 67.2 %
Unrecognized Tax Benefits
We are providing the following disclosures related to our unrecognized tax benefits and the effect on our effective income tax rate if recognized:
Year Ended December 31,
(in millions) 2020 2019 2018
Beginning balance of unrecognized tax benefits $ 390.3 $ 356.4 $ 214.3 Additions for tax positions of current year 2.7 3.4 106.0 Additions for tax positions of prior years 8.3 47.9 59.5 Reductions for tax positions of prior years (18.2) (16.0) (7.0) Reductions for lapses of statutes of limitation and settlements (3.5) (1.4) (16.4) Ending balance of unrecognized tax benefits $ 379.6 $ 390.3 $ 356.4
In 2020, our unrecognized tax benefit decreased by $10.7 million, primarily related to decreases in North America for resolution of audit matters. In 2019, we increased our unrecognized tax benefit by $33.9 million, also primarily related to North America.
If the unrecognized tax benefits at December 31, 2020 were recognized, our income tax provision would decrease by $333.0 million, resulting in a substantially lower effective tax rate. Based on the potential outcome of the Company’s global tax examinations and the expiration of the statute of limitations for specific jurisdictions, it is possible that the unrecognized tax benefits could change significantly within the next 12 months. Absent resolution of significant tax controversy, the associated impact on the reserve balance is estimated to be a decrease in the range of $0.9 to $2.3 million during 2021.
119

We recognize interest and penalties associated with unrecognized tax benefits in our income tax provision in the Consolidated Statements of Operations. Interest and penalties recorded were $5.6 million, $13.1 million and negligible, respectively in 2020, 2019 and 2018. We had gross liabilities, for interest and penalties, of $65.3 million at December 31, 2020, $56.2 million at December 31, 2019 and $18.2 million at December 31, 2018. The increase in the gross liability related to interest and penalties from 2018 to 2019 was primarily due to a reclass within other non-current liabilities from unrecognized tax benefits to interest and penalties which had no impact on the overall Consolidated Balance Sheets or Consolidated Statements of Operations.
Most of the unrecognized tax benefit amount of $379.6 million relates to North America.
Income Tax Returns
The IRS completed its field examination of the U.S federal income tax returns for the years 2011-2014 in the third quarter of 2020. As previously disclosed, the IRS has proposed to disallow, for the 2014 taxable year, the entirety of the deduction of the approximately $1.49 billion settlement payment made pursuant to the Settlement agreement (as defined in Note 20, “Commitments and Contingencies”) and the resulting reduction of our U.S. federal tax liability by approximately $525 million. We continue to believe that we have meritorious defenses to the proposed disallowance and have filed a protest with the IRS. Although we expected to enter the IRS administrative appeals process in late 2020, or early 2021, upon receipt of our protest, the IRS determined that it needed additional information before transferring the matter to the IRS administrative appeals process. We are currently responding to requests for further information from the IRS and at this time, cannot predict when we will enter the IRS administrative appeals process, when such process will conclude, or the outcome of such process. It is possible that future developments in this matter could have a material impact to the uncertain tax position balances and results of operations, including cash flow, within the next twelve months.
State income tax returns are generally subject to examination for a period of 3 to 5 years after their filing date. We have various state income tax returns in the process of examination and are generally open to examination for periods after 2015.
Our foreign income tax returns are under examination in various jurisdictions in which we conduct business. Income tax returns in foreign jurisdictions have statutes of limitations generally ranging from 3 to 5 years after their filing date. We have various foreign returns in the process of examination but have largely concluded all other income tax matters for the years prior to 2015.
Management believes that an adequate provision has been made for any adjustments that may result from tax examinations. However, the outcome of tax audits cannot be predicted with certainty. If any of the issues addressed in the Company’s tax audits are resolved in a manner that is inconsistent with management’s expectations, the Company could be required to adjust its provision for income taxes in the period such resolution occurs and could be required to make significant payments as a result.
Note 20 Commitments and Contingencies
Diversey Sale Clawback Agreement and Receivables
As part of our 2017 sale of Diversey to Diamond (BC) B.V. (the “Buyer”), Sealed Air and the Buyer entered into that certain Letter Agreement (the “Clawback Agreement”), under which Sealed Air could be required to return a portion of the proceeds we received in the sale, if, and to the extent, Diversey failed to achieve a specified minimum gross margin arising from sales of certain products during the one year period following a successful renewal of certain commercial contracts. In 2019, the Buyer submitted a claim to us under the Clawback Agreement seeking such a refund. On April 29, 2020, Sealed Air and the Buyer entered into a Stipulation and Agreement of Settlement and Release (the “Diversey Settlement Agreement”), whereby, among other things, the Buyer released us from any and all claims under the Clawback Agreement, and the parties terminated the Clawback Agreement.
Pursuant to the Diversey Settlement Agreement, the parties settled their disputes relating to certain other Tax Receivables and other receivables arising out of the Diversey sale, including fees owed to Sealed Air from the Buyer pursuant to the Transition Service Agreement entered into in connection with the sale (“TSA”) and cash held by Diversey in certain non-U.S. jurisdictions as of the sale closing date that Buyer was required to cooperate to deliver to Sealed Air when and as permitted, subject to certain limitations (“Trapped Cash”). Under the Diversey Settlement Agreement, Sealed Air relinquished all of its rights to receive any of the Trapped Cash, and the parties further agreed to release each other from any and all claims arising under or with respect to the TSA, the Trapped Cash, and the Clawback Agreement and such other matters as expressly agreed
120

upon in the Diversey Settlement Agreement (provided, that, except for those specific matters released, the terms of the Purchase Agreement otherwise remain in effect in accordance with their terms).
Novipax Complaint
On March 31, 2017, a complaint was filed in the Superior Court of the State of Delaware against Sealed Air Corporation, Cryovac Inc., Sealed Air Corporation (US) and Sealed Air (Canada) Co./Cie. (individually and collectively the “Company”) styled Novipax Holdings LLC (“Novipax”) v. Sealed Air Corporation, Cryovac Inc., Sealed Air Corporation (US) and Sealed Air (Canada) Co. / Cie. (the “Complaint”). To cover the estimated costs of settlement, including a one-time cash payment as well as accrual of expenses relating to a proposed supply agreement under which the Company would continue to purchase materials from Novipax for a specified period for use in the manufacturing of the Company’s products, the Company recorded a charge of $59.0 million during the second quarter of 2019, which is included in Selling, general and administrative expenses in the Company’s Consolidated Statements of Operations for the year ended December 31, 2019. On July 10, 2019 the settlement agreement was finalized and executed, and the parties agreed to the release and dismissal of the litigation claims.
Settlement Agreement Tax Deduction
On March 31, 1998, the Company completed a multi-step transaction (the “Cryovac transaction”) involving W.R. Grace & Co. (“Grace”) which brought the Cryovac packaging business and the former Sealed Air’s business under the common ownership of the Company. As part of that transaction, Grace and its subsidiaries retained all liabilities arising out of their operations before the Cryovac transaction (including asbestos-related liabilities), other than liabilities relating to Cryovac’s operations, and agreed to indemnify the Company with respect to such retained liabilities. Beginning in 2000, we were served with a number of lawsuits alleging that the Cryovac transaction was a fraudulent transfer or gave rise to successor liability or both, and that, as a result, we were responsible for alleged asbestos liabilities of Grace and its subsidiaries. On April 2, 2001, Grace and a number of its subsidiaries filed petitions for reorganization under Chapter 11 of the U.S. Bankruptcy Code in the U.S. Bankruptcy Court for the District of Delaware (the “Bankruptcy Court”). In connection with Grace’s Chapter 11 case, the Bankruptcy Court granted the official committees appointed to represent asbestos claimants in Grace’s Chapter 11 case (the “Committees”) permission to pursue against the Company and its subsidiary Cryovac, Inc. fraudulent transfer, successor liability, and other claims based upon the Cryovac transaction. In November 2002, we reached an agreement in principle with the Committees to resolve all current and future asbestos-related claims made against us and our affiliates, as well as indemnification claims by Fresenius Medical Care Holdings, Inc. and affiliated companies, in each case, in connection with the Cryovac transaction. A definitive settlement agreement was entered into in 2003 and approved by the Bankruptcy Court in 2005 (such agreement, the "Settlement agreement"). The Settlement agreement was subsequently incorporated into the plan of reorganization for Grace (the "Plan") and the Plan was confirmed by the Bankruptcy Court in 2011 and the United States District Court in 2012.
On February 3, 2014 (the “Effective Date”), the Plan implementing the Settlement agreement became effective with W. R. Grace & Co., or Grace, emerging from bankruptcy and the injunctions and releases provided by the Plan becoming effective. On the Effective Date, the Company’s subsidiary, Cryovac, Inc., made the payments contemplated by the Settlement agreement, consisting of aggregate cash payments in the amount of $929.7 million to the WRG Asbestos PI Trust (the “PI Trust”) and the WRG Asbestos PD Trust (the “PD Trust”) and the transfer of 18 million shares of Sealed Air common stock (the “Settlement Shares”) to the PI Trust, in each case, reflecting adjustments made in accordance with the Settlement agreement.
The IRS completed its field examination of our U.S. federal income tax returns for the years 2011 through 2014 in the third quarter of 2020. As previously disclosed, the IRS has proposed to disallow for the 2014 taxable year the entirety of the deduction of the approximately $1.49 billion settlement payments made pursuant to the Settlement agreement and the resulting reduction of our U.S. federal tax liability by approximately $525 million. We continue to believe that we have meritorious defenses to the proposed disallowance and have filed a protest with the IRS. Although we expected to enter the IRS administrative appeals process in late 2020 or early 2021, upon receipt of our protest, the IRS determined that it needed additional information before transferring the matter to the IRS administrative appeals process. We are currently responding to requests for further information from the IRS and, at this time, cannot predict when we will enter the IRS administrative appeals process, when such process will conclude, or the outcome of such process. It is possible that future developments in this matter could have a material impact on the uncertain tax position balances and results of operations, including cash flows, within the next 12 months.
121

Environmental Matters
We are subject to loss contingencies resulting from environmental laws and regulations, and we accrue for anticipated costs associated with investigatory and remediation efforts when an assessment has indicated that a loss is probable and can be reasonably estimated. These accruals are not reduced by potential insurance recoveries, if any. We do not believe that it is reasonably possible that our liability in excess of the amounts that we have accrued for environmental matters will be material to our Consolidated Balance Sheets or Statements of Operations. Environmental liabilities are reassessed whenever circumstances become better defined or remediation efforts and their costs can be better estimated.
We evaluate these liabilities periodically based on available information, including the progress of remedial investigations at each site, the current status of discussions with regulatory authorities regarding the methods and extent of remediation and the apportionment of costs among potentially responsible parties. As some of these issues are decided (the outcomes of which are subject to uncertainties) or new sites are assessed and costs can be reasonably estimated, we adjust the recorded accruals, as necessary. We believe that these exposures are not material to our Consolidated Balance Sheets or Statements of Operations. We believe that we have adequately reserved for all probable and estimable environmental exposures.
Guarantees and Indemnification Obligations
We are a party to many contracts containing guarantees and indemnification obligations. These contracts primarily consist of:
• indemnities in connection with the sale of businesses, primarily related to the sale of Diversey. Our indemnity obligations under the relevant agreements may be limited in terms of time, amount or scope. As it relates to certain income tax related liabilities, the relevant agreements may not provide any cap for such liabilities, and the period in which we would be liable would lapse upon expiration of the statute of limitation for assessment of the underlying taxes. Because of the conditional nature of these obligations and the unique facts and circumstances involved in each particular agreement, we are unable to reasonably estimate the potential maximum exposure associated with these items;
• product warranties with respect to certain products sold to customers in the ordinary course of business. These warranties typically provide that products will conform to specifications. We generally do not establish a liability for product warranty based on a percentage of sales or other formula. We accrue a warranty liability on a transaction-specific basis depending on the individual facts and circumstances related to each sale. Both the liability and annual expense related to product warranties are immaterial to our consolidated financial position and results of operations; and
• licenses of intellectual property by us to third parties in which we have agreed to indemnify the licensee against third-party infringement claims.
As of December 31, 2020, the Company has no reason to believe a loss exceeding amounts already recognized would be incurred.
Other Matters
We are also involved in various other legal actions incidental to our business. We believe, after consulting with counsel, that the disposition of these other legal proceedings and matters will not have a material effect on our consolidated financial condition or results of operations including potential impact to cash flows.
Other Principal Contractual Obligations
At December 31, 2020, we had other principal contractual obligations, which included agreements to purchase an estimated amount of goods, including raw materials, or services in the normal course of business, aggregating to approximately $128.2 million. The estimated future cash outlays are as follows:
122
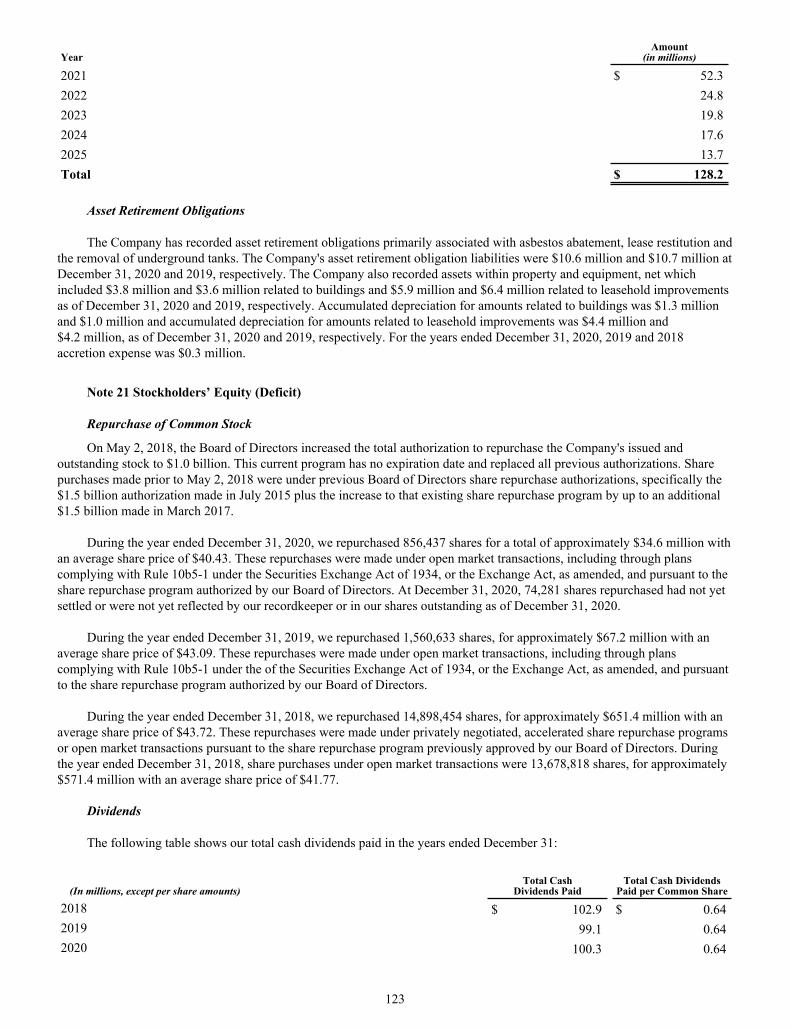
YearAmount
(in millions)
2021 $ 52.3 2022 24.8 2023 19.8 2024 17.6 2025 13.7 Total $ 128.2
Asset Retirement Obligations
The Company has recorded asset retirement obligations primarily associated with asbestos abatement, lease restitution and the removal of underground tanks. The Company's asset retirement obligation liabilities were $10.6 million and $10.7 million at December 31, 2020 and 2019, respectively. The Company also recorded assets within property and equipment, net which included $3.8 million and $3.6 million related to buildings and $5.9 million and $6.4 million related to leasehold improvements as of December 31, 2020 and 2019, respectively. Accumulated depreciation for amounts related to buildings was $1.3 million and $1.0 million and accumulated depreciation for amounts related to leasehold improvements was $4.4 million and $4.2 million, as of December 31, 2020 and 2019, respectively. For the years ended December 31, 2020, 2019 and 2018 accretion expense was $0.3 million.
Note 21 Stockholders’ Equity (Deficit)
Repurchase of Common Stock
On May 2, 2018, the Board of Directors increased the total authorization to repurchase the Company's issued and outstanding stock to $1.0 billion. This current program has no expiration date and replaced all previous authorizations. Share purchases made prior to May 2, 2018 were under previous Board of Directors share repurchase authorizations, specifically the $1.5 billion authorization made in July 2015 plus the increase to that existing share repurchase program by up to an additional $1.5 billion made in March 2017.
During the year ended December 31, 2020, we repurchased 856,437 shares for a total of approximately $34.6 million with an average share price of $40.43. These repurchases were made under open market transactions, including through plans complying with Rule 10b5-1 under the Securities Exchange Act of 1934, or the Exchange Act, as amended, and pursuant to the share repurchase program authorized by our Board of Directors. At December 31, 2020, 74,281 shares repurchased had not yet settled or were not yet reflected by our recordkeeper or in our shares outstanding as of December 31, 2020.
During the year ended December 31, 2019, we repurchased 1,560,633 shares, for approximately $67.2 million with an average share price of $43.09. These repurchases were made under open market transactions, including through plans complying with Rule 10b5-1 under the of the Securities Exchange Act of 1934, or the Exchange Act, as amended, and pursuant to the share repurchase program authorized by our Board of Directors.
During the year ended December 31, 2018, we repurchased 14,898,454 shares, for approximately $651.4 million with an average share price of $43.72. These repurchases were made under privately negotiated, accelerated share repurchase programs or open market transactions pursuant to the share repurchase program previously approved by our Board of Directors. During the year ended December 31, 2018, share purchases under open market transactions were 13,678,818 shares, for approximately $571.4 million with an average share price of $41.77.
Dividends
The following table shows our total cash dividends paid in the years ended December 31:
(In millions, except per share amounts)Total Cash
Dividends PaidTotal Cash Dividends
Paid per Common Share
2018 $ 102.9 $ 0.64 2019 99.1 0.64 2020 100.3 0.64
123
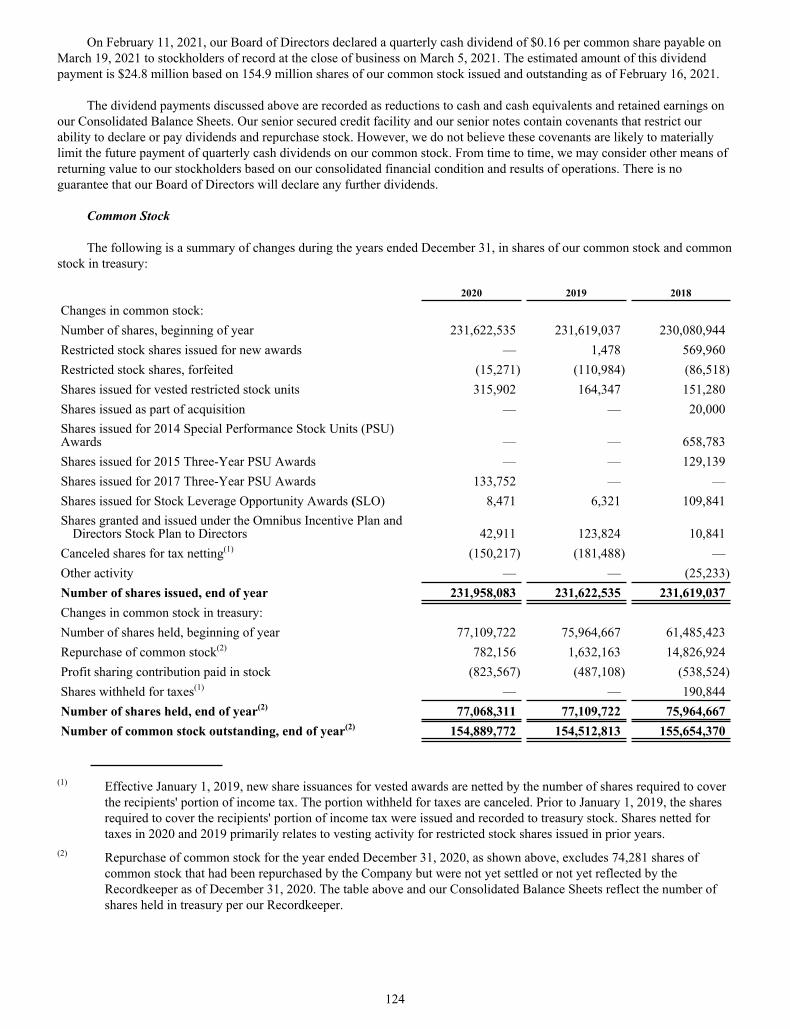
On February 11, 2021, our Board of Directors declared a quarterly cash dividend of $0.16 per common share payable on March 19, 2021 to stockholders of record at the close of business on March 5, 2021. The estimated amount of this dividend payment is $24.8 million based on 154.9 million shares of our common stock issued and outstanding as of February 16, 2021.
The dividend payments discussed above are recorded as reductions to cash and cash equivalents and retained earnings on our Consolidated Balance Sheets. Our senior secured credit facility and our senior notes contain covenants that restrict our ability to declare or pay dividends and repurchase stock. However, we do not believe these covenants are likely to materially limit the future payment of quarterly cash dividends on our common stock. From time to time, we may consider other means of returning value to our stockholders based on our consolidated financial condition and results of operations. There is no guarantee that our Board of Directors will declare any further dividends.
Common Stock
The following is a summary of changes during the years ended December 31, in shares of our common stock and common stock in treasury:
2020 2019 2018
Changes in common stock:
Number of shares, beginning of year 231,622,535 231,619,037 230,080,944 Restricted stock shares issued for new awards — 1,478 569,960 Restricted stock shares, forfeited (15,271) (110,984) (86,518) Shares issued for vested restricted stock units 315,902 164,347 151,280 Shares issued as part of acquisition — — 20,000 Shares issued for 2014 Special Performance Stock Units (PSU) Awards — — 658,783 Shares issued for 2015 Three-Year PSU Awards — — 129,139 Shares issued for 2017 Three-Year PSU Awards 133,752 — — Shares issued for Stock Leverage Opportunity Awards (SLO) 8,471 6,321 109,841 Shares granted and issued under the Omnibus Incentive Plan and
Directors Stock Plan to Directors 42,911 123,824 10,841 Canceled shares for tax netting(1) (150,217) (181,488) — Other activity — — (25,233) Number of shares issued, end of year 231,958,083 231,622,535 231,619,037 Changes in common stock in treasury: Number of shares held, beginning of year 77,109,722 75,964,667 61,485,423 Repurchase of common stock(2) 782,156 1,632,163 14,826,924 Profit sharing contribution paid in stock (823,567) (487,108) (538,524) Shares withheld for taxes(1) — — 190,844 Number of shares held, end of year(2) 77,068,311 77,109,722 75,964,667 Number of common stock outstanding, end of year(2) 154,889,772 154,512,813 155,654,370
(1) Effective January 1, 2019, new share issuances for vested awards are netted by the number of shares required to cover the recipients' portion of income tax. The portion withheld for taxes are canceled. Prior to January 1, 2019, the shares required to cover the recipients' portion of income tax were issued and recorded to treasury stock. Shares netted for taxes in 2020 and 2019 primarily relates to vesting activity for restricted stock shares issued in prior years.
(2) Repurchase of common stock for the year ended December 31, 2020, as shown above, excludes 74,281 shares of common stock that had been repurchased by the Company but were not yet settled or not yet reflected by the Recordkeeper as of December 31, 2020. The table above and our Consolidated Balance Sheets reflect the number of shares held in treasury per our Recordkeeper.
124

Share-Based Compensation
In 2014, the Board of Directors adopted, and our stockholders approved, the 2014 Omnibus Incentive Plan (“Omnibus Incentive Plan”). Under the Omnibus Incentive Plan, the maximum number of shares of Common Stock authorized was 4,250,000, plus total shares available to be issued as of May 22, 2014 under the 2002 Directors Stock Plan and the 2005 Contingent Stock Plan (collectively, the “Predecessor Plans”). The Omnibus Incentive Plan replaced the Predecessor Plans and no further awards were granted under the Predecessor Plans. The Omnibus Incentive Plan provides for the grant of stock options, stock appreciation rights, restricted stock, restricted stock units, unrestricted stock, performance share units known as PSU awards, other stock awards and cash awards to officers, non-employee directors, key employees, consultants and advisors.
In 2018, the Board of Directors adopted, and stockholders approved an amendment and restatement to the Omnibus Incentive Plan. The amended plan adds 2,199,114 shares of common stock to the share pool previously available under the Omnibus Incentive Plan.
Prior to the Omnibus Incentive Plan, the 2005 Contingent Stock Plan represented our sole long-term equity compensation program for officers and employees. The 2005 Contingent Stock Plan provided for awards of equity-based compensation, including restricted stock, restricted stock units, PSU awards and cash awards measured by share price, to our executive officers and other key employees, as well as U.S.-based key consultants. Prior to the Omnibus Incentive Plan, the 2002 Directors Stock Plan provided for annual grants of shares to non-employee directors, and interim grants of shares to eligible directors elected at times other than at an annual meeting, as all or part of the annual or interim retainer fees for non-employee directors. During 2002, we adopted a plan that permitted non-employee directors to elect to defer all or part of their annual retainer until the non-employee director retires from the Board of Directors. The non-employee director could elect to defer the portion of the annual retainer payable in shares of stock, as well as the portion, if any, payable in cash. Cash dividends on deferred shares are reinvested into additional deferred units in each non-employee director’s account.
A summary of the changes in common shares available for awards under the Omnibus Incentive Plan and Predecessor Plans follows:
2020 2019 2018
Number of shares available, beginning of year 4,048,509 4,489,347 3,668,954 Newly approved Shares under Omnibus Incentive Plan — — 2,199,114 Restricted stock shares issued for new awards — — (571,438) Restricted stock shares forfeited 15,271 105,960 91,542 Restricted stock units awarded (1,014,667) (819,808) (219,923) Restricted stock units forfeited 105,832 96,534 64,122 Shares issued for 2014 Special PSU Awards — — (658,783) Shares issued for 2015 Three-Year PSU Awards — — (129,139) Shares issued for 2017 Three-Year PSU Awards (133,752) — — Restricted stock units awarded for SLO Awards (73,731) (46,195) (23,478) SLO units forfeited — 1,580 817 Director shares granted and issued (20,835) (22,015) (10,560) Director units granted and deferred(1) (22,826) (6,262) (16,505) Shares withheld for taxes(2) 279,509 249,368 94,624 Number of shares available, end of year(3) 3,183,310 4,048,509 4,489,347
(1) Director units granted and deferred include the impact of share-settled dividends earned and deferred on deferred
shares.(2) The Omnibus Incentive Plan and 2005 Contingent Stock Plan permit withholding of taxes and other charges that may
be required by law to be paid attributable to awards by withholding a portion of the shares attributable to such awards.(3) The above table excludes approximately 1.3 million contingently issuable shares under the PSU awards and SLO
awards, which represents the maximum number of shares that could be issued under those awards as of December 31, 2020.
125

We record share-based incentive compensation expense in selling, general and administrative expenses and cost of sales on our Consolidated Statements of Operations for both equity-classified awards and liability-classified awards. We record a corresponding credit to additional paid-in capital within stockholders’ equity (deficit) for equity-classified awards, and to either a current or non-current liability for liability-classified awards based on the fair value of the share-based incentive compensation awards at the date of grant. Total expense for the liability-classified awards continues to be remeasured to fair value at the end of each reporting period. We recognize an expense or credit reflecting the straight-line recognition, net of estimated forfeitures, of the expected cost of the share-based award. The number of PSUs earned may equal, exceed or be less than the targeted number of shares depending on whether the performance criteria are met, surpassed or not met.
The following table summarizes the Company’s pre-tax share-based incentive compensation expense and related income tax benefit for the years ended December 31, 2020, 2019 and 2018 related to the Company’s PSU awards, SLO awards and restricted stock awards.
(In millions) 2020 2019 2018
2020 Three-year PSU Awards $ 5.3 $ — $ — 2019 Three-year PSU Awards 3.5 4.3 — 2018 Three-year PSU Awards 1.9 0.2 2.7 2017 Three-year PSU Awards(1) — — 3.7 2017 COO and Chief Executive Officer-Designate New Hire
Equity Awards(2) 0.2 0.2 0.2 2016 Three-year PSU Awards(1) — — (3.0) SLO Awards 2.2 3.2 1.6 Other long-term share-based incentive compensation programs(3)(4) 29.2 26.5 24.7 Total share-based incentive compensation expense(5) $ 42.3 $ 34.4 $ 29.9 Associated tax benefits recognized $ 7.1 $ 5.8 $ 4.9
(1) On May 18, 2017, the Organization and Compensation Committee of our Board of Directors (“O&C Committee”) approved a change in the vesting policy regarding the existing 2017 Three-year PSU Awards and 2016 Three-year PSU Awards for Ilham Kadri. The approved change resulted in a pro-rata share of vesting calculated on the close date of the sale of Diversey. Dr. Kadri’s awards were still subject to the performance metrics stipulated in the plan documents and paid out in accordance with the original planned timing.
(2) For the year ended December 31, 2020, this amount includes expense associated with award modifications as described under the section titled “Chief Operating Officer (COO) and Chief Executive Officer-Designate 2017 New Hire Equity Awards and 2020 Award Modifications.”
(3) The amount includes the expenses associated with the restricted stock awards consisting of restricted stock shares, restricted stock units and cash-settled restricted stock unit awards.
(4) In December 2018, the Equity Award Committee approved a change in the vesting condition for certain individuals who would be leaving the Company under a restructuring phase of our Reinvent SEE business transformation. For these modifications, we recorded the cumulative expense of the higher fair value of the impacted awards at modification approval.
(5) The amounts do not include the expense related to our U.S. profit sharing contributions made in the form of our common stock as these contributions are not considered share-based incentive compensation.
Restricted Stock, Restricted Stock Units and Cash-Settled Restricted Stock Unit Awards
Restricted stock, restricted stock units and cash-settled restricted stock unit awards (cash payment in an amount equal to the value of the shares on the vesting date) provide for a vesting period. Awards vest earlier in the event of the participant’s death or disability. If a participant terminates employment prior to vesting, then the award of restricted stock, restricted stock units or cash-settled restricted stock unit awards is forfeited, except for certain circumstances following a change in control. The O&C Committee may waive the forfeiture of all or a portion of an award. Generally, restricted stock (but not restricted stock units or cash-settled restricted stock unit awards) granted before January 1, 2018 pay dividends on the same basis as other stockholders entitled to receive dividends. Generally, restricted stock, restricted stock units, and cash-settled stock unit awards granted after January 1, 2018 pay dividend equivalents upon vesting.
126
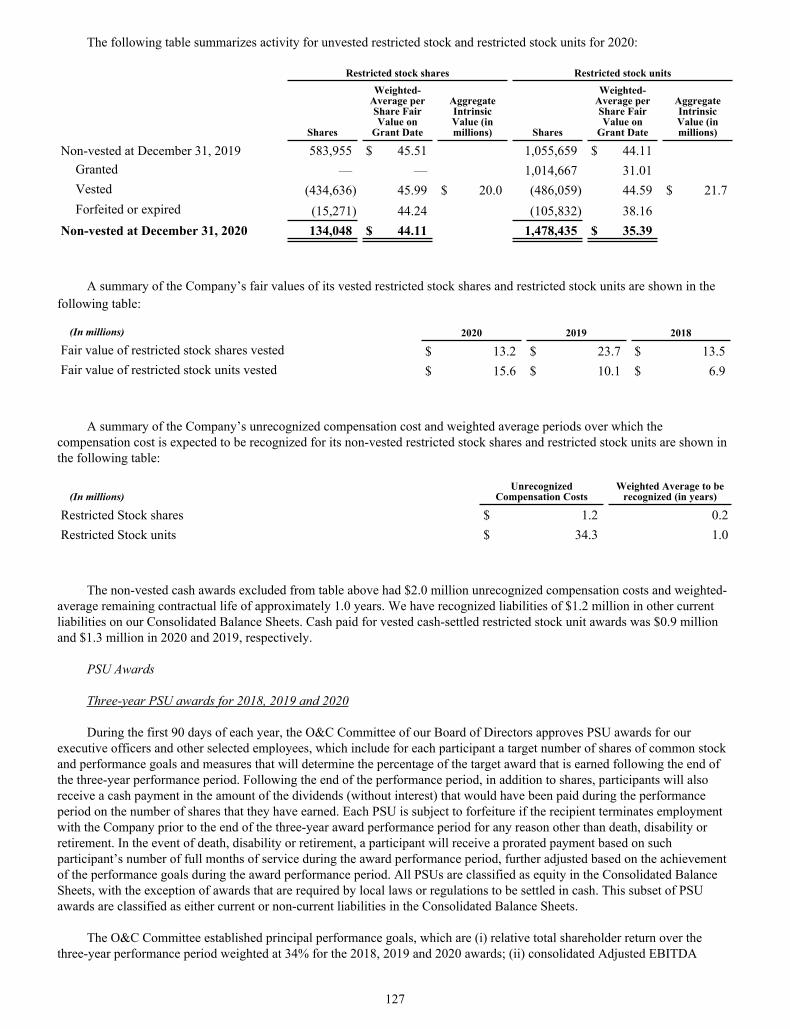
The following table summarizes activity for unvested restricted stock and restricted stock units for 2020:
Restricted stock shares Restricted stock units
Shares
Weighted-Average per Share Fair Value on
Grant Date
AggregateIntrinsicValue (in millions) Shares
Weighted-Average per Share Fair Value on
Grant Date
AggregateIntrinsicValue (in millions)
Non-vested at December 31, 2019 583,955 $ 45.51 1,055,659 $ 44.11 Granted — — 1,014,667 31.01 Vested (434,636) 45.99 $ 20.0 (486,059) 44.59 $ 21.7 Forfeited or expired (15,271) 44.24 (105,832) 38.16
Non-vested at December 31, 2020 134,048 $ 44.11 1,478,435 $ 35.39
A summary of the Company’s fair values of its vested restricted stock shares and restricted stock units are shown in the following table:
(In millions) 2020 2019 2018
Fair value of restricted stock shares vested $ 13.2 $ 23.7 $ 13.5 Fair value of restricted stock units vested $ 15.6 $ 10.1 $ 6.9
A summary of the Company’s unrecognized compensation cost and weighted average periods over which the compensation cost is expected to be recognized for its non-vested restricted stock shares and restricted stock units are shown in the following table:
(In millions)Unrecognized
Compensation CostsWeighted Average to be
recognized (in years)
Restricted Stock shares $ 1.2 0.2Restricted Stock units $ 34.3 1.0
The non-vested cash awards excluded from table above had $2.0 million unrecognized compensation costs and weighted-average remaining contractual life of approximately 1.0 years. We have recognized liabilities of $1.2 million in other current liabilities on our Consolidated Balance Sheets. Cash paid for vested cash-settled restricted stock unit awards was $0.9 million and $1.3 million in 2020 and 2019, respectively.
PSU Awards
Three-year PSU awards for 2018, 2019 and 2020
During the first 90 days of each year, the O&C Committee of our Board of Directors approves PSU awards for our executive officers and other selected employees, which include for each participant a target number of shares of common stock and performance goals and measures that will determine the percentage of the target award that is earned following the end of the three-year performance period. Following the end of the performance period, in addition to shares, participants will also receive a cash payment in the amount of the dividends (without interest) that would have been paid during the performance period on the number of shares that they have earned. Each PSU is subject to forfeiture if the recipient terminates employment with the Company prior to the end of the three-year award performance period for any reason other than death, disability or retirement. In the event of death, disability or retirement, a participant will receive a prorated payment based on such participant’s number of full months of service during the award performance period, further adjusted based on the achievement of the performance goals during the award performance period. All PSUs are classified as equity in the Consolidated Balance Sheets, with the exception of awards that are required by local laws or regulations to be settled in cash. This subset of PSU awards are classified as either current or non-current liabilities in the Consolidated Balance Sheets.
The O&C Committee established principal performance goals, which are (i) relative total shareholder return over the three-year performance period weighted at 34% for the 2018, 2019 and 2020 awards; (ii) consolidated Adjusted EBITDA
127

margin measured in the final year of the award weighted at 33% for the 2018 and 2019 awards; or Adjusted EBITDA compound annual growth rate (“CAGR”) in the case of the 2020 awards; and (iii) return on invested capital for the 2019 and 2020 awards weighted at 33%; or three-year net trade sales CAGR in the case of the 2018 awards. The total number of shares to be issued for these awards can range from zero to 200% of the target number of shares.
In the third quarter of 2019, the O&C Committee approved PSU awards for an additional pool of individuals in connection with our Reinvent SEE business transformation. The established performance goals are identical to those approved for awards granted to our executive officers and other selected key executives in the first quarter of 2019.
PSUs – Relative Total Shareholder Return (Relative TSR)
The PSUs granted based on Relative TSR are contingently awarded and will be payable in shares of the Company’s common stock upon the expiration of a three-year award performance period based on the Company’s TSR ranking relative to a peer group of companies. The fair value of the PSUs was estimated on the grant date using a Monte Carlo Simulation. Other assumptions include the expected volatility of all companies included in the Relative TSR, the historical share price returns analysis of all companies included in the Relative TSR and assumes dividends are reinvested. The expected volatility was based on the historical volatility for a period of time that approximates the duration between the valuation date and the end of the performance period. The risk-free interest rate is based on the Zero-Coupon Treasury STRIP yield curve matching the term from the valuation date to the end of the performance period. Compensation expense for the PSUs based on Relative TSR (which is considered a market condition) is a fixed amount determined at the grant date fair value and is recognized 100% over the three-year award performance period regardless of whether the performance condition is satisfied.
The number of PSUs granted based on Relative TSR and the assumptions used to calculate the grant date fair value are shown in the following table:
Number of units granted
Fair value on grant date
Expected price volatility
Risk-free interest rate
2020:March 1, 2020 grant date 31,064 $ 29.85 23.70 % 0.90 %February 13, 2020 grant date 44,206 $ 34.08 23.70 % 1.40 %February 12, 2020 grant date 33,335 $ 38.87 23.70 % 1.40 %
2019:July 11, 2019 grant date 20,724 $ 55.82 23.00 % 1.86 %February 14, 2019 grant date 24,905 $ 57.34 22.80 % 2.51 %February 13, 2019 grant date 24,914 $ 59.15 22.80 % 2.55 %
2018:February 13, 2018 grant date 56,829 $ 43.40 22.00 % 2.00 %
PSUs – Adjusted EBITDA Margin
The PSUs granted based on Adjusted EBITDA margin are contingently awarded and will be payable in shares of the Company’s common stock based on the Company’s Adjusted EBITDA margin at the end of the performance period compared to a target set at the time of the grant by the O&C Committee. The fair value of the PSUs is based on grant date fair value which is equivalent to the closing price of one share of the Company’s common stock on the date of grant. The number of PSUs earned based on Adjusted EBITDA margin varies according to the outcome of the performance condition. The Company reassesses at each reporting date whether achievement of the performance condition is probable and accrues compensation expense if and when achievement of the performance condition is probable.
The number of PSUs granted based on Adjusted EBITDA margin and the grant date fair value are shown in the following table:
128

Number of units granted
Fair value on grant date
2019:July 11, 2019 grant date 25,997 $ 43.22 February 14, 2019 grant date 32,922 $ 42.10 February 13, 2019 grant date 33,885 $ 42.21 2018:February 13, 2018 grant date 57,378 $ 41.72
PSUs – Net Trade Sales Compound Annual Growth Rate
The PSUs granted based on Net Trade Sales CAGR are contingently awarded and will be payable in shares of the Company’s common stock based on the Company’s Net Trade Sales CAGR over a three-year award performance period compared to a target set at the time of the grant by the O&C Committee. The fair value of the PSUs is based on grant date fair value which is equivalent to the closing price of one share of the Company’s common stock on the date of grant. The number of PSUs earned based on Net Trade Sales CAGR varies based on the probable outcome of the performance condition. The Company reassesses at each reporting date whether achievement of the performance condition is probable and accrues compensation expense if and when achievement of the performance condition is probable.
The number of PSUs granted based on Net Trade Sales Growth CAGR and the grant date fair value are shown in the following table:
Number of units granted
Fair value on grant date
2018:February 13, 2018 grant date 57,378 $ 41.72
PSUs - Return on Invested Capital
The PSUs granted based on Return on Invested Capital (ROIC) are contingently awarded and will be payable in shares of the Company’s common stock based on the Company’s ROIC over a three-year award performance period compared to a target set at the time of the grant by the O&C Committee. The fair value of the PSUs is based on grant date fair value which is equivalent to the closing price of one share of the Company’s common stock on the date of grant. The number of PSUs earned based on ROIC varies based on the probable outcome of the performance condition. The Company reassesses at each reporting date whether achievement of the performance condition is probable and accrues compensation expense if and when achievement of the performance condition is probable.
The number of PSUs granted based on ROIC and the grant date fair value are shown in the following table:
Number of units granted
Fair value on grant date
2020:March 1, 2020 grant date 29,690 $ 30.31 February 13, 2020 grant date 42,507 $ 34.40 February 12, 2020 grant date 35,068 $ 35.86 2019:July 11, 2019 grant date 25,997 $ 43.22 February 14, 2019 grant date 32,922 $ 42.10 February 13, 2019 grant date 33,885 $ 42.21
PSUs - Adjusted EBITDA Compound Annual Growth Rate
The PSUs granted based on Adjusted EBITDA CAGR are contingently awarded and will be payable in shares of the Company’s common stock based on the Company’s Adjusted EBITDA CAGR over a three-year performance period compared to a target set at the time of the grant by the O&C Committee. The fair value of the PSUs is based on grant date fair value which is equivalent to the closing price of one share of the Company’s common stock on the date of grant. The number of PSUs earned based on Adjusted EBITDA CAGR varies based on the probable outcome of the performance condition. The Company
129

reassesses at each reporting date whether achievement of the performance condition is probable and accrues compensation expense if and when achievement of the performance condition is probable.
The number of PSUs granted based on Adjusted EBITDA CAGR and the grant date fair value are shown in the following table:
Number of units granted
Fair value on grant date
2020:March 1, 2020 grant date 29,690 $ 30.31 February 13, 2020 grant date 42,507 $ 34.40 February 12, 2020 grant date 35,068 $ 35.86
The following table includes additional information related to estimated earned payout based on the probable outcome of the performance conditions and market condition as of December 31, 2020:
Estimated Payout %
Return on Invested Capital
Net Trade Sales CAGR
Adjusted EBITDA Margin
Adjusted EBITDA CAGR Relative TSR(1) Combined
2020 Three-year PSU Awards 100 % N/A N/A 100 % 63 % 87 %2019 Three-year PSU Awards 150 % N/A 60 % N/A 63 % 91 %2018 Three-year PSU Awards N/A — % 121 % N/A 44 % 55 %
(1) Relative Total Shareholder Return is a market-based condition. Accordingly, we make no assumptions related to future performance. The percentages above represent actual rankings as of December 31, 2020. Any portion of outstanding awards based on the achievement of market-based conditions are accrued at 100% of fair value over the performance period in accordance with ASC 718.
The following table summarizes activity for outstanding three-year PSU awards for 2020:
Shares
Aggregate Intrinsic Value (in millions)
Outstanding at December 31, 2019 629,504 Granted(1) 323,135 Converted (216,581) $ 9.8 Forfeited or expired (38,971)
Outstanding at December 31, 2020 697,087 Fully vested at December 31, 2020 209,631 $ 8.9
(1) This represents the target number of performance units granted. Actual number of PSUs earned, if any, is dependent
upon performance and may range from 0% to 200% percent of the target.
The following table summarizes activity for non-vested three-year PSU awards for 2020:
SharesWeighted-Average per Share
Fair Value on Grant Date
Non-vested at December 31, 2019 370,703 $ 45.08 Granted 323,135 36.33 Vested (189,445) 42.07 Forfeited or expired (16,937) 42.64
Non-vested at December 31, 2020 487,456 $ 40.41
A summary of the Company’s fair value for its vested three-year PSU awards is shown in the following table:
130

(In millions) 2020 2019 2018
Fair value of three-year PSU awards vested $ 9.6 $ 10.3 $ 14.9
A summary of the Company’s unrecognized compensation cost for three-year PSU awards at the current estimated earned payout based on the probable outcome of the performance condition and weighted average periods over which the compensation cost is expected to be recognized as shown in the following table:
(In millions) Unrecognized Compensation Costs
Weighted Average to be recognized (in years)
2020 Three-year PSU Awards $ 5.9 22019 Three-year PSU Awards 3.0 12018 Three-year PSU Awards — 0
Chief Operating Officer (COO) and Chief Executive Officer-Designate 2017 New Hire Equity Awards and 2020 Award Modifications
On September 5, 2017, the Board elected Edward L. Doheny II, Chief Operating Officer and CEO-Designate and elected him as a Director of the Company effective September 18, 2017. Mr. Doheny worked on transitioning with Jerome Peribere until December 31, 2017 and then assumed the role and title of President and Chief Executive Officer effective as of January 1, 2018. Additionally, on September 5, 2017, the Company entered into an offer letter agreement, effective September 18, 2017, with Mr. Doheny. The Letter Agreement provided that Mr. Doheny would be granted on his start date two new-hire equity awards, one that was time-vesting and the other that was performance-vesting (the “New Hire Awards”).
The time-vesting New Hire Award, for 30,000 shares, required Mr. Doheny to remain in service with the Company through December 31, 2020. The grant date fair value for this award was $42.89 per share. The award vested fully on December 31, 2020.
The performance-vesting New Hire Award, for 70,000 shares, in addition to the time-vesting requirement noted above, required that either (i) the Company’s cumulative total stockholder return for 2018-2020 be in the top 33% of its peers (using the same peers and methodology under the Company’s performance stock unit (PSU) awards) and the Company’s stock price as of December 31, 2020 equaled at least $60.00 per share, or (ii) the Company’s stock price as of December 31, 2020 equaled at least $75.00 per share. The Letter Agreement provided that the stock price as of December 31, 2020 for this purpose would be determined using a 30-day arithmetic mean of closing prices.
On December 10, 2020, Mr. Doheny entered into a subsequent Letter Agreement with the Company, which modifies the terms of the performance-vesting New Hire Award. This Letter Agreement converts one half of the award, or 35,000 shares, to an award of time-vesting restricted stock units, which requires Mr. Doheny to remain in service with the Company through September 18, 2022. The grant date fair value of this award was $45.40 per share.
The remaining half of the award, or 35,000 shares, remains performance-vesting, subject to the original performance conditions, but measured as of September 18, 2022. The grant date fair value for this award was determined using a Monte Carlo Simulation model that incorporates predictive modeling techniques using Geometric Brownian Motion and Crystal Ball’s random number generation. Other assumptions include the expected volatility of all companies included in the relative total shareholder return, valuation modeling of vesting payoff determination featuring both performance goals as noted above, the historical share price returns analysis of all companies included in the relative total shareholder return and assumes dividends are reinvested. The expected volatility was based on the historical volatility of peer companies for a period of time that approximates the duration between the beginning and the end of the performance period. The risk-free interest rate was based on the Zero-Coupon Treasury STRIP yield curve matching the term from the valuation date to the end of the performance period. Compensation expense for the performance-vesting award is a fixed amount determined at the grant date and is recognized 100% from the time of the award to the end of the performance period regardless of whether the performance conditions are satisfied.
The assumptions used to calculate the grant date fair value of the performance-vesting award are shown in the following table:
131
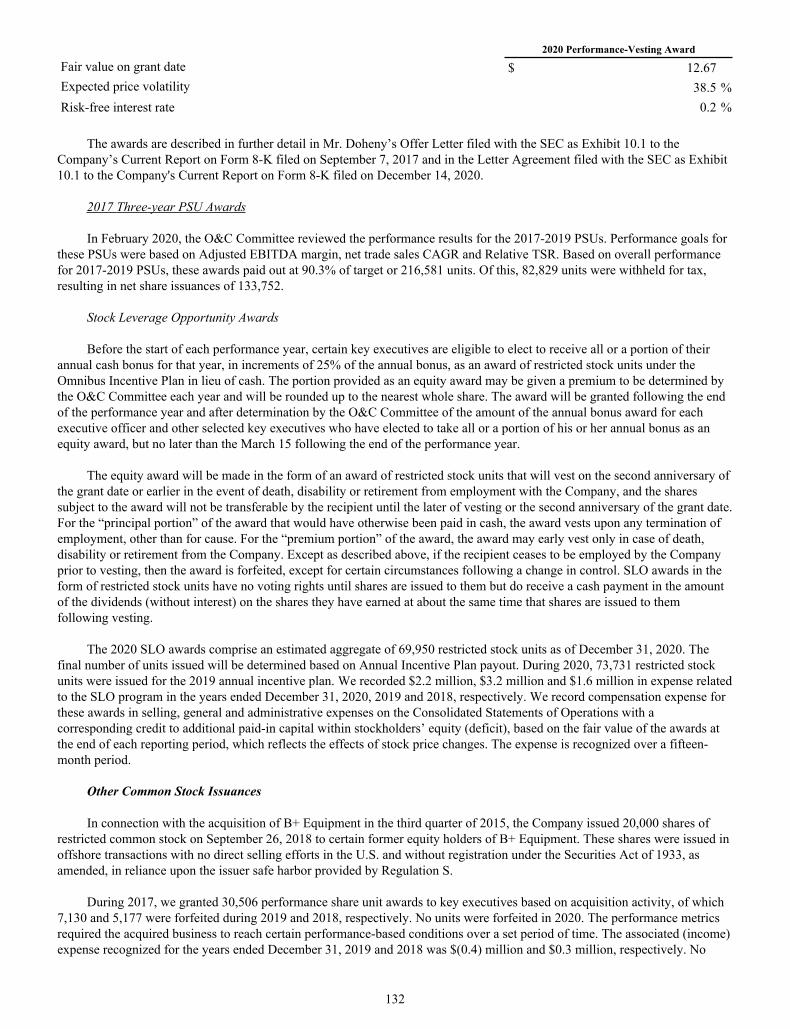
2020 Performance-Vesting Award
Fair value on grant date $ 12.67 Expected price volatility 38.5 %Risk-free interest rate 0.2 %
The awards are described in further detail in Mr. Doheny’s Offer Letter filed with the SEC as Exhibit 10.1 to the Company’s Current Report on Form 8-K filed on September 7, 2017 and in the Letter Agreement filed with the SEC as Exhibit 10.1 to the Company's Current Report on Form 8-K filed on December 14, 2020.
2017 Three-year PSU Awards
In February 2020, the O&C Committee reviewed the performance results for the 2017-2019 PSUs. Performance goals for these PSUs were based on Adjusted EBITDA margin, net trade sales CAGR and Relative TSR. Based on overall performance for 2017-2019 PSUs, these awards paid out at 90.3% of target or 216,581 units. Of this, 82,829 units were withheld for tax, resulting in net share issuances of 133,752.
Stock Leverage Opportunity Awards
Before the start of each performance year, certain key executives are eligible to elect to receive all or a portion of their annual cash bonus for that year, in increments of 25% of the annual bonus, as an award of restricted stock units under the Omnibus Incentive Plan in lieu of cash. The portion provided as an equity award may be given a premium to be determined by the O&C Committee each year and will be rounded up to the nearest whole share. The award will be granted following the end of the performance year and after determination by the O&C Committee of the amount of the annual bonus award for each executive officer and other selected key executives who have elected to take all or a portion of his or her annual bonus as an equity award, but no later than the March 15 following the end of the performance year.
The equity award will be made in the form of an award of restricted stock units that will vest on the second anniversary of the grant date or earlier in the event of death, disability or retirement from employment with the Company, and the shares subject to the award will not be transferable by the recipient until the later of vesting or the second anniversary of the grant date. For the “principal portion” of the award that would have otherwise been paid in cash, the award vests upon any termination of employment, other than for cause. For the “premium portion” of the award, the award may early vest only in case of death, disability or retirement from the Company. Except as described above, if the recipient ceases to be employed by the Company prior to vesting, then the award is forfeited, except for certain circumstances following a change in control. SLO awards in the form of restricted stock units have no voting rights until shares are issued to them but do receive a cash payment in the amount of the dividends (without interest) on the shares they have earned at about the same time that shares are issued to them following vesting.
The 2020 SLO awards comprise an estimated aggregate of 69,950 restricted stock units as of December 31, 2020. The final number of units issued will be determined based on Annual Incentive Plan payout. During 2020, 73,731 restricted stock units were issued for the 2019 annual incentive plan. We recorded $2.2 million, $3.2 million and $1.6 million in expense related to the SLO program in the years ended December 31, 2020, 2019 and 2018, respectively. We record compensation expense for these awards in selling, general and administrative expenses on the Consolidated Statements of Operations with a corresponding credit to additional paid-in capital within stockholders’ equity (deficit), based on the fair value of the awards at the end of each reporting period, which reflects the effects of stock price changes. The expense is recognized over a fifteen-month period.
Other Common Stock Issuances
In connection with the acquisition of B+ Equipment in the third quarter of 2015, the Company issued 20,000 shares of restricted common stock on September 26, 2018 to certain former equity holders of B+ Equipment. These shares were issued in offshore transactions with no direct selling efforts in the U.S. and without registration under the Securities Act of 1933, as amended, in reliance upon the issuer safe harbor provided by Regulation S.
During 2017, we granted 30,506 performance share unit awards to key executives based on acquisition activity, of which 7,130 and 5,177 were forfeited during 2019 and 2018, respectively. No units were forfeited in 2020. The performance metrics required the acquired business to reach certain performance-based conditions over a set period of time. The associated (income) expense recognized for the years ended December 31, 2019 and 2018 was $(0.4) million and $0.3 million, respectively. No
132
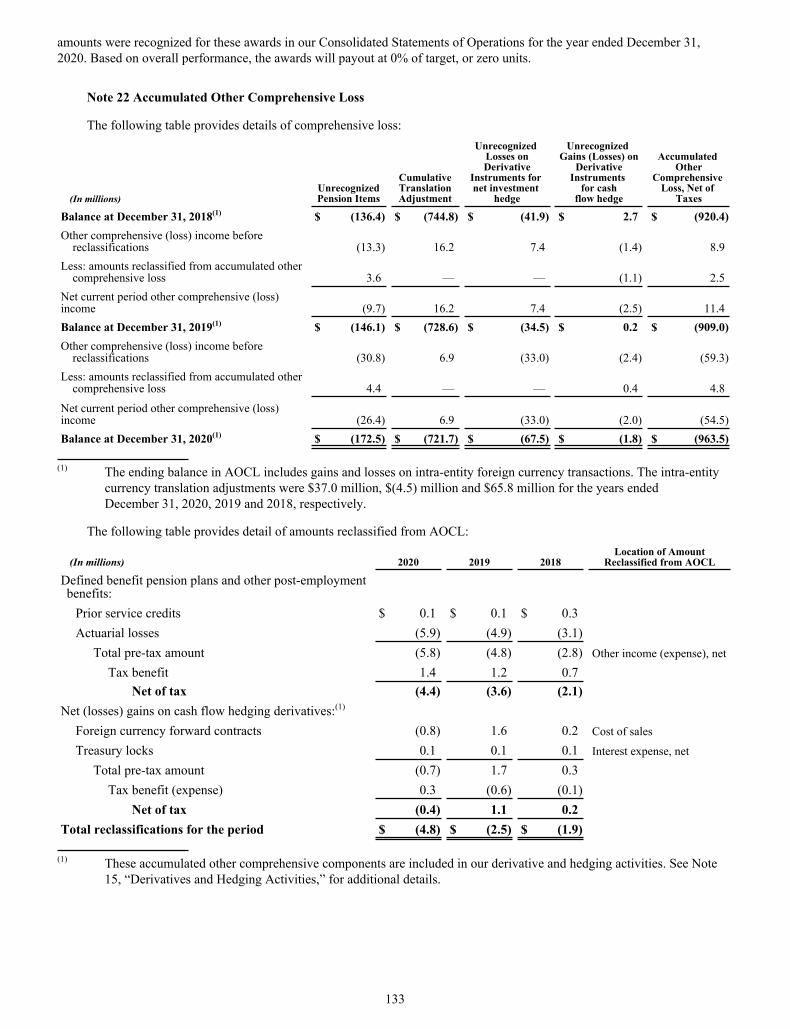
amounts were recognized for these awards in our Consolidated Statements of Operations for the year ended December 31, 2020. Based on overall performance, the awards will payout at 0% of target, or zero units.
Note 22 Accumulated Other Comprehensive Loss
The following table provides details of comprehensive loss:
(In millions)UnrecognizedPension Items
CumulativeTranslationAdjustment
Unrecognized Losses on Derivative
Instruments for net investment
hedge
Unrecognized Gains (Losses) on
Derivative Instruments
for cash flow hedge
Accumulated Other
Comprehensive Loss, Net of
Taxes
Balance at December 31, 2018(1) $ (136.4) $ (744.8) $ (41.9) $ 2.7 $ (920.4) Other comprehensive (loss) income before
reclassifications (13.3) 16.2 7.4 (1.4) 8.9 Less: amounts reclassified from accumulated other
comprehensive loss 3.6 — — (1.1) 2.5 Net current period other comprehensive (loss) income (9.7) 16.2 7.4 (2.5) 11.4 Balance at December 31, 2019(1) $ (146.1) $ (728.6) $ (34.5) $ 0.2 $ (909.0) Other comprehensive (loss) income before
reclassifications (30.8) 6.9 (33.0) (2.4) (59.3) Less: amounts reclassified from accumulated other
comprehensive loss 4.4 — — 0.4 4.8
Net current period other comprehensive (loss) income (26.4) 6.9 (33.0) (2.0) (54.5) Balance at December 31, 2020(1) $ (172.5) $ (721.7) $ (67.5) $ (1.8) $ (963.5)
(1) The ending balance in AOCL includes gains and losses on intra-entity foreign currency transactions. The intra-entity
currency translation adjustments were $37.0 million, $(4.5) million and $65.8 million for the years ended December 31, 2020, 2019 and 2018, respectively.
The following table provides detail of amounts reclassified from AOCL:
(In millions) 2020 2019 2018Location of Amount
Reclassified from AOCL
Defined benefit pension plans and other post-employment benefits:
Prior service credits $ 0.1 $ 0.1 $ 0.3 Actuarial losses (5.9) (4.9) (3.1)
Total pre-tax amount (5.8) (4.8) (2.8) Other income (expense), net
Tax benefit 1.4 1.2 0.7
Net of tax (4.4) (3.6) (2.1)
Net (losses) gains on cash flow hedging derivatives:(1)
Foreign currency forward contracts (0.8) 1.6 0.2 Cost of sales
Treasury locks 0.1 0.1 0.1 Interest expense, net
Total pre-tax amount (0.7) 1.7 0.3
Tax benefit (expense) 0.3 (0.6) (0.1) Net of tax (0.4) 1.1 0.2
Total reclassifications for the period $ (4.8) $ (2.5) $ (1.9)
(1) These accumulated other comprehensive components are included in our derivative and hedging activities. See Note 15, “Derivatives and Hedging Activities,” for additional details.
133

Note 23 Other Income (Expense), net
The following table provides details of other income (expense), net:
Year Ended December 31,(In millions) 2020 2019 2018
Net foreign exchange transaction gain (loss) $ 1.7 $ (7.7) $ (16.7) Bank fee expense (6.3) (5.0) (4.4) Pension income other than service costs 0.9 1.0 3.9 Increase in fair value of equity investments 15.1 — — Loss on debt redemption and refinancing activities — (16.1) (1.9) Other, net 5.8 8.3 1.0 Other income (expense), net $ 17.2 $ (19.5) $ (18.1)
134
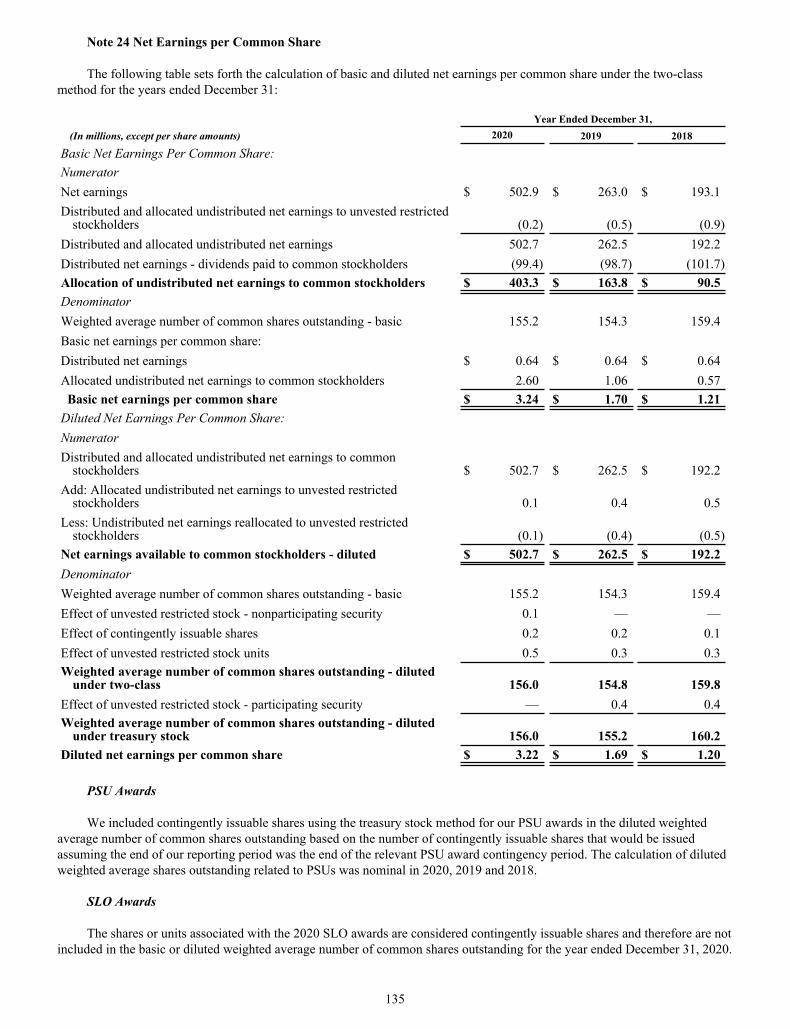
Note 24 Net Earnings per Common Share
The following table sets forth the calculation of basic and diluted net earnings per common share under the two-class method for the years ended December 31:
Year Ended December 31,(In millions, except per share amounts) 2020 2019 2018
Basic Net Earnings Per Common Share:
Numerator
Net earnings $ 502.9 $ 263.0 $ 193.1 Distributed and allocated undistributed net earnings to unvested restricted
stockholders (0.2) (0.5) (0.9) Distributed and allocated undistributed net earnings 502.7 262.5 192.2 Distributed net earnings - dividends paid to common stockholders (99.4) (98.7) (101.7) Allocation of undistributed net earnings to common stockholders $ 403.3 $ 163.8 $ 90.5 Denominator Weighted average number of common shares outstanding - basic 155.2 154.3 159.4 Basic net earnings per common share: Distributed net earnings $ 0.64 $ 0.64 $ 0.64 Allocated undistributed net earnings to common stockholders 2.60 1.06 0.57 Basic net earnings per common share $ 3.24 $ 1.70 $ 1.21 Diluted Net Earnings Per Common Share: Numerator Distributed and allocated undistributed net earnings to common
stockholders $ 502.7 $ 262.5 $ 192.2 Add: Allocated undistributed net earnings to unvested restricted
stockholders 0.1 0.4 0.5 Less: Undistributed net earnings reallocated to unvested restricted
stockholders (0.1) (0.4) (0.5) Net earnings available to common stockholders - diluted $ 502.7 $ 262.5 $ 192.2 Denominator Weighted average number of common shares outstanding - basic 155.2 154.3 159.4 Effect of unvested restricted stock - nonparticipating security 0.1 — — Effect of contingently issuable shares 0.2 0.2 0.1 Effect of unvested restricted stock units 0.5 0.3 0.3 Weighted average number of common shares outstanding - diluted
under two-class 156.0 154.8 159.8 Effect of unvested restricted stock - participating security — 0.4 0.4 Weighted average number of common shares outstanding - diluted
under treasury stock 156.0 155.2 160.2 Diluted net earnings per common share $ 3.22 $ 1.69 $ 1.20
PSU Awards
We included contingently issuable shares using the treasury stock method for our PSU awards in the diluted weighted average number of common shares outstanding based on the number of contingently issuable shares that would be issued assuming the end of our reporting period was the end of the relevant PSU award contingency period. The calculation of diluted weighted average shares outstanding related to PSUs was nominal in 2020, 2019 and 2018.
SLO Awards
The shares or units associated with the 2020 SLO awards are considered contingently issuable shares and therefore are not included in the basic or diluted weighted average number of common shares outstanding for the year ended December 31, 2020.
135

These shares or units will not be included in the common shares outstanding until the final determination of the amount of annual incentive compensation is made in the first quarter of 2021. Once this determination is made, the shares or units will be included in diluted weighted average number of common shares outstanding if the impact to diluted net earnings per common share is dilutive. The numbers of shares or units associated with SLO awards for 2020, 2019 and 2018 were nominal.
136

Item 9. Changes in and Disagreements with Accountants on Accounting and Financial Disclosure
None.
Item 9A. Controls and Procedures
Disclosure Controls and Procedures
We maintain disclosure controls and procedures, as defined in Rule 13a-15 under the Securities Exchange Act of 1934, as amended, or the Exchange Act, that are designed to ensure that information required to be disclosed in our reports that we file or submit under the Exchange Act is recorded, processed, summarized and reported within the time periods specified in the SEC’s rules and forms and that our employees accumulate this information and communicate it to our management, including our Chief Executive Officer (our principal executive officer) and our Chief Financial Officer (our principal financial officer), as appropriate, to allow timely decisions regarding the required disclosure. In designing and evaluating the disclosure controls and procedures, our management recognizes that any controls and procedures, no matter how well designed and operated, can provide only “reasonable assurance” of achieving the desired control objectives, and management necessarily must apply its judgment in evaluating the cost-benefit relationship of possible controls and procedures.
Evaluation of Disclosure Controls and Procedures
As of the end of the period covered by this report, we carried out an evaluation of the effectiveness of the design and operation of our disclosure controls and procedures under Rule 13a-15. Our management, including our Chief Executive Officer and Chief Financial Officer, supervised and participated in this evaluation. Based upon that evaluation, our Chief Executive Officer and Chief Financial Officer concluded that our disclosure controls and procedures were effective at the “reasonable assurance” level.
Changes in Internal Control over Financial Reporting
There have been no changes in our internal control over financial reporting during the quarter ended December 31, 2020 that have materially affected, or are reasonably likely to materially affect, our internal control over financial reporting.
Management’s Annual Report on Internal Control over Financial ReportingOur management is responsible for establishing and maintaining adequate internal control over financial reporting as such
term is defined in Rules 13a-15(f) and 15d-15(f) under the Exchange Act. Management evaluated, with the participation of our Chief Executive Officer and Chief Financial Officer, the effectiveness, as of December 31, 2020, of our internal control over financial reporting. The suitable recognized control framework on which management’s evaluation of our internal control over financial reporting is based is the Internal Control — Integrated Framework (2013) issued by the Committee of Sponsoring Organizations of the Treadway Commission. Based upon that evaluation under the COSO framework, our management concluded that our internal control over financial reporting as of December 31, 2020 was effective.
Our internal control over financial reporting as of December 31, 2020 has been audited by PricewaterhouseCoopers LLP, an independent registered public accounting firm, which also audited our Consolidated Financial Statements for the year ended December 31, 2020, as stated in their report included in this Annual Report on Form 10-K, which expresses an unqualified opinion on the effectiveness of our internal control over financial reporting as of December 31, 2020.
Item 9B. Other Information
None.
137

PART III
Item 10. Directors, Executive Officers and Corporate Governance
Part of the information required in response to this Item is set forth in Part I of this Annual Report on Form 10-K under the caption “Information about our Executive Officers,” and the balance will be included in our Proxy Statement for our 2021 Annual Meeting of Stockholders under the captions “Corporate Governance,” “Election of Directors — Information Concerning Nominees” and “Election of Directors -Nominees for Election as Director”, except as set forth below. All such information is incorporated herein by reference.
We have adopted a Code of Conduct applicable to all of our directors, officers and employees and those of our subsidiaries and a supplemental Code of Ethics for Senior Financial Executives applicable to our Chief Executive Officer, Chief Financial Officer, Controller, Treasurer, and all other employees performing similar functions for us. The Code of Conduct and the Code of Ethics for Senior Financial Executives are posted on our website at www.sealedair.com. We will post any amendments to the Code of Conduct and the Code of Ethics for Senior Financial Executives on our website. We will also post on our website any waivers applicable to any of our directors or officers, including the senior financial officers listed above, from provisions of the Code of Conduct or the Code of Ethics for Senior Financial Executives.
Item 11. Executive Compensation
The information required in response to this Item will be set forth in our Proxy Statement for our 2021 Annual Meeting of Stockholders under the captions “Director Compensation,” “Executive Compensation,” and “Corporate Governance - Board Meetings, Committee Membership and Attendance.” Such information is incorporated herein by reference.
Item 12. Security Ownership of Certain Beneficial Owners and Management and Related Stockholder Matters
The information required in response to this Item will be set forth in our Proxy Statement for our 2021 Annual Meeting of Stockholders under the captions “Beneficial Ownership Table” and “Equity Compensation Plan Information.” Such information is incorporated herein by reference.
Item 13. Certain Relationships and Related Transactions, and Director Independence
The information required in response to this Item will be set forth in our Proxy Statement for our 2021 Annual Meeting of Stockholders under the captions “Corporate Governance - Board of Directors Overview - Independence of Directors” and “Certain Relationships and Related Person Transactions.” Such information is incorporated herein by reference.
Item 14. Principal Accounting Fees and Services
The information required in response to this Item will be included in our Proxy Statement for our 2021 Annual Meeting of Stockholders under the captions “Principal Independent Auditor Fees” and “Audit Committee Pre-Approval Policies and Procedures.” Such information is incorporated herein by reference.
138
PART IV
Item 15. Exhibits and Financial Statement Schedules
(a) Documents filed as a part of this Annual Report on Form 10-K:
(1) Financial Statements
See Index to Consolidated Financial Statements and Schedule of this Annual Report on Form 10-K in Part II Item 8.
(2) Financial Statement Schedule
See Schedule II — Valuation and Qualifying Accounts and Reserves — Years Ended December 31, 2020, 2019 and 2018 of this Annual Report on Form 10-K. The other schedules are omitted as they are not applicable or the amounts involved are not material.
139

(3) Exhibits
ExhibitNumber
Description
2.1
Distribution Agreement dated as of March 30, 1998 among the Company, W. R. Grace & Co. — Conn., and W. R. Grace & Co. (Exhibit 2.2 to the Company’s Current Report on Form 8-K, Date of Report March 31, 1998, File No. 1-12139, is incorporated herein by reference.)
2.2 Purchase Agreement, dated as of March 25, 2017, by and between the Company and Diamond (BC) B.V. (Exhibit 2.1 to the Company's Quarterly Report on Form 10-Q for the quarter ended March 31, 2017, File No. 1-12139, in incorporated herein by reference.)
3.1
Unofficial Composite Amended and Restated Certificate of Incorporation of the Company as currently in effect. (Exhibit 3.1 to the Company’s Registration Statement on Form S-3, Registration No. 333-108544, is incorporated herein by reference.)
3.2
Amended and Restated By-Laws of the Company as currently in effect. (Exhibit 3.1 to the Company’s Current Report on Form 8-K, Date of Report February 12, 2020, File No. 1-12139, is incorporated herein by reference.)
4.1
Indenture, dated as of March 21, 2013, by and among Sealed Air Corporation, Guarantors party thereto and U.S. Bank National Association. (Exhibit 4.1 to the Company’s Current Report on Form 8-K, Date of Report March 21, 2013, File No. 1-12139, is incorporated herein by reference.)
4.2
Form of 5.25% Senior Note due 2023. (Exhibit 4.1 to the Company’s Current Report on Form 8-K, Date of Report March 21, 2013, File No. 1-12139, is incorporated herein by reference.)
4.3
Indenture, dated as of November 24, 2014, by and among Sealed Air Corporation, Guarantors party thereto and Branch Banking and Trust Company. (Exhibit 4.1 to the Company’s Current Report on Form 8-K, Date of Report November 24, 2014, File No. 1-12139, is incorporated herein by reference.)
4.4
Form of 4.875% Senior Note due 2022. (Exhibit 4.2 to the Company’s Current Report on Form 8-K, Date of Report November 24, 2014, File No. 1-12139, is incorporated herein by reference.)
4.5
Form of 5.125% Senior Note due 2024 (Exhibit 4.3 to the Company’s Current Report on Form 8-K, Date of Report November 24, 2014, File No. 1-12139, is incorporated herein by reference.)
4.6
Indenture, dated as of June 16, 2015, by and among Sealed Air Corporation, the Guarantors party thereto, U.S. Bank National Association, Elavon Financial Services Limited and Elavon Financial Services Limited, UK Branch. (Exhibit 4.1 to the Company’s Current Report on Form 8-K, Date of Report June 11, 2015, File No. 1-12139, is incorporated herein by reference.)
4.7
Form of 5.500% Senior Note due 2025. (Exhibit 4.2 to the Company’s Current Report on Form 8-K, Date of Report June 11, 2015, File No. 1-12139, is incorporated herein by reference.)
4.8
Form of 4.500% Senior Note due 2023. (Exhibit 4.3 to the Company’s Current Report on Form 8-K, Date of Report June 11, 2015, File No. 1-12139, is incorporated herein by reference.)
4.9
Indenture, dated as of July 1, 2003, by and among Sealed Air Corporation and SunTrust Bank. (Exhibit 4.1 to the Company's Quarterly Report on Form 10-Q for the quarter ended June 30, 2003, File No. 1-12139, is incorporated herein by reference.)
4.10
Form of 6.875% Senior Note due 2033. (Sections 204 and 205 to the Company's Indenture, dated as of July 1, 2003, Exhibit 4.1 to the Company's Quarterly Report on Form 10-Q for the quarter ended June 30, 2003, File No. 1-12139, is incorporated herein by reference.)
4.11Indenture, dated as of November 26, 2019, by and among Sealed Air Corporation, Guarantors party thereto, and U.S. Bank National Association. (Exhibit 4.1 to the Company's Current Report on Form 8-K, Date of Report November 21, 2019, File No. 1-12139, is incorporated herein by reference.)
4.12 Form of 4.000% senior note due 2027. (Exhibit 4.2 to the Company's Current Report on Form 8-K, Date of Report November 21, 2019, File No. 1-12139, is incorporated herein by reference.)
4.13 Description of Securities. (Exhibit 4.15 to the Company’s Annual Report on Form 10-K for the year ended December 31, 2019, File No. 1-12139, is incorporated herein by reference.)
10.1 Tax Sharing Agreement dated as of March 30, 1998 by and among the Company, W. R. Grace & Co. — Conn. and W. R. Grace & Co. (Exhibit 10.2 to the Company’s Current Report on Form 8-K, Date of Report March 31, 1998, File No. 1-12139, is incorporated herein by reference.)
140
ExhibitNumber
Description
10.2 Agreement in Principle, dated November 27, 2002, by and among the Official Committee of Asbestos Personal Injury Claimants, the Official Committee of Asbestos Property Damage Claimants, the Company, and the Company’s subsidiary, Cryovac, Inc. (Exhibit 10.22 to the Company’s Annual Report on Form 10-K for the year ended December 31, 2002, File No. 1-12139, is incorporated herein by reference.)
10.3 Settlement Agreement and Release, dated November 10, 2003, by and among the Official Committee of Asbestos Personal Injury Claimants, the Official Committee of Asbestos Property Damage Claimants, the Company, and the Company’s subsidiary, Cryovac, Inc. (Exhibit 10.1 to the Company’s Amendment No. 3 to its Registration Statement on Form S-3, Registration No. 333-108544, is incorporated herein by reference.)
10.4 Sealed Air Corporation 2002 Stock Plan for Non-Employee Directors, as amended April 13, 2010. (Exhibit 10.7 to the Company’s Quarterly Report on Form 10-Q for the quarter ended March 31, 2010, File No. 1-12139, is incorporated herein by reference.)*
10.5
Sealed Air Corporation Deferred Compensation Plan for Directors. (Exhibit 10.8 to the Company’s Quarterly Report on Form 10-Q for the quarter ended March 31, 2010, File No. 1-12139, is incorporated herein by reference.)*
10.6
Amendment to the Sealed Air Corporation Deferred Compensation Plan for Directors. (Exhibit 10.7 to the Company’s Annual Report on Form 10-K for the year ended December 31, 2014, File No. 1-12139, is incorporated herein by reference.)*
10.7 Sealed Air Corporation Executive Severance Plan, as amended and restated effective February 13, 2018. (Exhibit 10.1 to the Company’s Current Report on Form 8-K, Date of Report February 13, 2018, File No. 1-12139, is incorporated herein by reference.)*
10.8 Fees to be paid to the Company's Non-Employee Directors — 2021.*
10.9Fees to be paid to the Company's Non-Employee Directors - 2020. (Exhibit 10.10 to the Company's Annual Report on Form 10-K for the year ended December 31, 2019, File No. 1-12139, is incorporated herein by reference.)*
10.10Sealed Air Corporation Annual Incentive Plan, as amended and restated on October 4, 2017 (Exhibit 10.15 to the Company’s Annual Report on Form 10-K for the year ended December 31, 2017, File No. 1-12139, is incorporated herein by reference.)*
10.11 Sealed Air Corporation Deferred Compensation Plan for Key Employees (Exhibit 10.1 to the Company’s Current Report on Form 8-K, Date of Report June 25, 2013, file No. 1-12139, is incorporated herein by reference.)*
10.12 Sealed Air Corporation Policy on Recoupment of Incentive Compensation from Executives in the Event of Certain Restatements, as amended February 18, 2010. (Exhibit 10.2 to the Company’s Current Report on Form 8-K, Date of Report February 18, 2010, File No. 1-12139, is incorporated herein by reference.)*
10.13Offer Letter Agreement, dated September 5, 2017, between Edward L. Doheny II and the Company. (Exhibit 10.1 to the Company's Current Report on Form 8-K, Date of Report September 2, 2017, File No. 1-12139, is incorporated herein by reference.)*
10.14Letter Agreement, dated December 10, 2020, between Edward L. Doheny II and the Company. (Exhibit 10.1 to the Company’s Current Report on Form 8-K, Date of Report December 10, 2020, File No. 1-12139, is incorporated herein by reference.)*
10.15 2014 Omnibus Incentive Plan (Exhibit 10.1 to the Company’s Current Report on Form 8-K, Date of Report May 22, 2014, File No. 1-12139, is incorporated herein by reference.)*
10.162014 Omnibus Incentive Plan (as amended and restated effective May 17, 2018) (Exhibit 10.1 to the Company’s Current Report on Form 8-K, Date of Report May 17, 2018, File No. 1-12139, is incorporated herein by reference.)*
10.17 Third Amended and Restated Syndicated Facility Agreement, dated as of July 12, 2018, by and among Sealed Air Corporation and certain of its subsidiaries party thereto, Bank of America, N.A., as agent, and the other financial institutions party thereto, and Amendment No. 1 thereto (Exhibit 10.1 to the Company’s Current Report on Form 8-K, Date of Report July 12, 2018, File No. 1-12139, is incorporated herein by reference.)
10.18
Amendment No. 2 to Third Amended and Restated Syndicated Facility Agreement and Incremental Assumption Agreement, dated as of August 1, 2019, by and among Sealed Air Corporation, on behalf of itself and certain of its subsidiaries, and Sealed Air Corporation (US), Bank of America, N.A., as agent and the other financial institutions party thereto. (Exhibit 10.1 to the Company’s Quarterly Report on Form 10-Q for the quarter ended September 30, 2019, File No. 1-12139, is incorporated herein by reference.)
141

ExhibitNumber
Description
10.19Equity Purchase Agreement, dated as of April 30, 2019, by and between the Company, Automated Packaging Systems, Inc. and the Seller Parties named therein. (Exhibit 10.1 to the Company’s Quarterly Report on Form 10-Q for the quarter ended June 30, 2019, File No. 1-12139, is incorporated herein by reference.)
10.20Offer Letter Agreement, dated June 20, 2019, between James M. Sullivan and Sealed Air Corporation. (Exhibit 10.1 to the Company’s Current Report on Form 8-K, Date of Report June 19, 2019, File No. 1-12139, is incorporated herein by reference.)*
10.21Extension Letter, dated November 23, 2020, between James M. Sullivan and the Company. (Exhibit 10.1 to the Company’s Current Report on Form 8-K, Date of Report November 23, 2020, File No. 1-12139, is incorporated herein by reference.)*
10.22Offer Letter, dated November 23, 2020, between Christopher J. Stephens, Jr. and the Company (Exhibit 10.2 to the Company’s Current Report on Form 8-K, Date of Report November 23, 2020, File No. 1-12139, is incorporated herein by reference.)*
10.23Form of Notice of Grant of Restricted Stock Unit Award (Time-Vesting) under the Sealed Air Corporation 2014 Omnibus Incentive Plan, approved February 13, 2018 (Exhibit 10.40 to the Company’s Annual Report on Form 10-K for the year ended December 31, 2017, File No. 1-12139, is incorporated herein by reference.)*
10.24 Form of Notice of Grant of Restricted Stock Unit Award (Time-Vesting) under the Sealed Air Corporation 2014 Omnibus Incentive Plan, approved February 16, 2015. (Exhibit 10.44 to the Company’s Annual Report on Form 10-K for the year ended December 31, 2014, File No. 1-12139, is incorporated herein by reference.)*
10.25Form of Notice of Grant of Restricted Stock Unit Award (Performance-Vesting) under the Sealed Air Corporation 2014 Omnibus Incentive Plan, approved February 13, 2018 (Exhibit 10.42 to the Company’s Annual Report on Form 10-K for the year ended December 31, 2017, File No. 1-12139, is incorporated herein by reference.)*
10.26 Form of Notice of Grant of Restricted Stock Unit Award (Performance-Vesting) under the Sealed Air Corporation 2014 Omnibus Incentive Plan, approved February 16, 2015. (Exhibit 10.45 to the Company’s Annual Report on Form10-K for the year ended December 31, 2014, File No. 1-12139, is incorporated herein by reference.)*
10.27Form of Notice of Grant of Restricted Stock Unit Award (Stock Leverage Opportunity) under the Sealed Air Corporation 2014 Omnibus Incentive Plan, approved February 13, 2018 (Exhibit 10.44 to the Company’s Annual Report on Form 10-K for the year ended December 31, 2017, File No. 1-12139, is incorporated herein by reference.)*
10.28 Form of Notice of Grant of Restricted Stock Unit Award (Stock Leverage Opportunity) under the Sealed Air Corporation 2014 Omnibus Incentive Plan, approved February 16, 2015. (Exhibit 10.46 to the Company’s Annual Report on Form10-K for the year ended December 31, 2014, File No. 1-12139, is incorporated herein by reference.)*
10.29Form of Notice of Grant of Restricted Stock Award (Time-Vesting) under the Sealed Air Corporation 2014 Omnibus Incentive Plan, approved February 13, 2018 (Exhibit 10.46 to the Company’s Annual Report on Form 10-K for the year ended December 31, 2017, File No. 1-12139, is incorporated herein by reference.)*
10.30 Form of Notice of Grant of Restricted Stock Award (Time-Vesting) under the Sealed Air Corporation 2014 Omnibus Incentive Plan, approved February 16, 2015. (Exhibit 10.47 to the Company’s Annual Report on Form10-K for the year ended December 31, 2014, File No. 1-12139, is incorporated herein by reference.)*
21 Subsidiaries of the Company.
23.1 Consent of PricewaterhouseCoopers LLP.
23.2 Consent of Ernst & Young LLP.
31.1 Certification of Edward L. Doheny II, President and Chief Executive Officer of the Company, pursuant to Rule 13a-14(a), dated February 25, 2021.
31.2 Certification of James M. Sullivan, Senior Vice President and Chief Financial Officer of the Company, pursuant to Rule 13a-14(a), dated February 25, 2021.
32 Certification of Edward L. Doheny II, President and Chief Executive Officer of the Company, and James M. Sullivan, Senior Vice President and Chief Financial Officer of the Company, pursuant to 18 U.S.C. § 1350, dated February 25, 2021.
142

ExhibitNumber
Description
101.INS Inline XBRL Instance Document - the Instance document does not appear in the Interactive Data File because its XBRL tags are embedded within the Inline XBRL document.
101.SCH Inline XBRL Taxonomy Extension Schema
101.CAL Inline XBRL Taxonomy Extension Calculation Linkbase
101.LAB Inline XBRL Taxonomy Extension Label Linkbase
101.PRE Inline XBRL Taxonomy Extension Presentation Linkbase
101.DEF Inline XBRL Taxonomy Extension Definition Linkbase
104 Cover Page Interactive Data File (formatted as Inline XBRL and contained within Exhibit 101).
* Compensatory plan or arrangement of management required to be filed as an exhibit to this report on Form 10-K.
In accordance with Rule 406T of Regulation S-T, the XBRL related information in Exhibit 101 shall not be deemed to be “filed” for purposes of Section 18 of the Exchange Act, or otherwise subject to the liability of that section, and shall not be deemed to be “filed” or part of any registration statement or other document filed for purposes of Sections 11 or 12 of the Securities Act or the Exchange Act, except as shall be expressly set forth by specific reference in such filing.
In lieu of filing certain instruments with respect to long-term debt of the kind described in Item 601(b)(4)(iii) of Regulation S-K, the Company agrees to furnish a copy of such instruments to the SEC upon request.
143
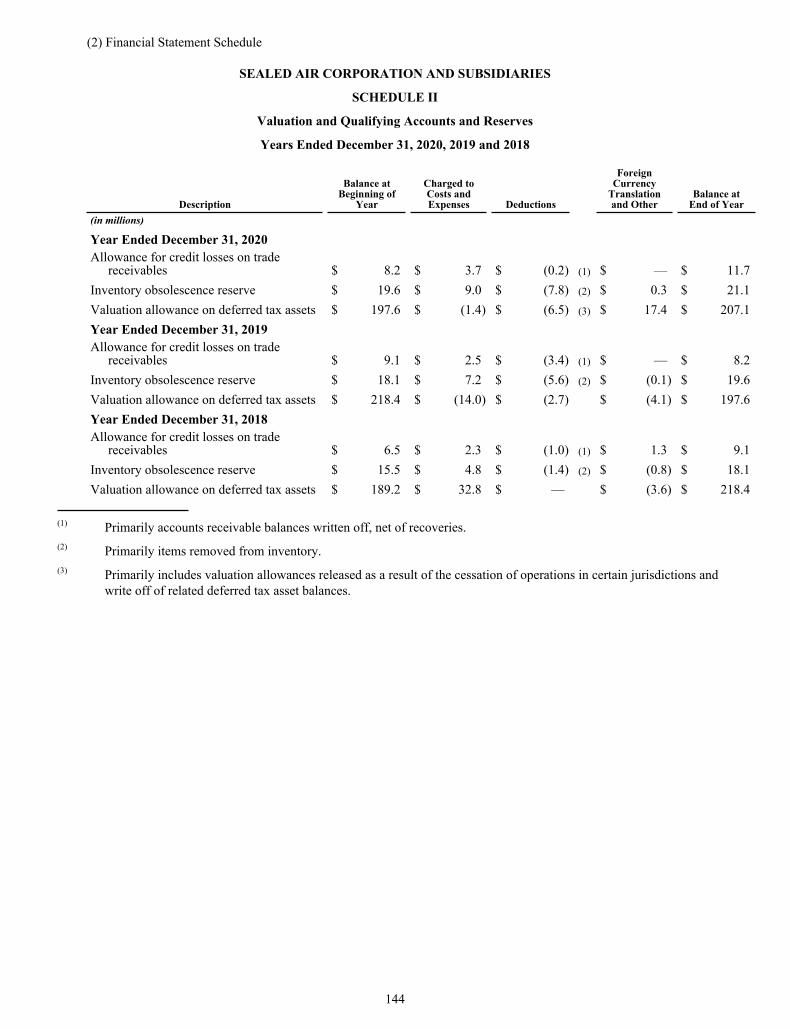
(2) Financial Statement Schedule
SEALED AIR CORPORATION AND SUBSIDIARIES
SCHEDULE II
Valuation and Qualifying Accounts and Reserves
Years Ended December 31, 2020, 2019 and 2018
Description
Balance at Beginning of
Year
Charged to Costs and Expenses Deductions
Foreign Currency
Translation and Other
Balance at End of Year
(in millions)
Year Ended December 31, 2020 Allowance for credit losses on trade
receivables $ 8.2 $ 3.7 $ (0.2) (1) $ — $ 11.7 Inventory obsolescence reserve $ 19.6 $ 9.0 $ (7.8) (2) $ 0.3 $ 21.1 Valuation allowance on deferred tax assets $ 197.6 $ (1.4) $ (6.5) (3) $ 17.4 $ 207.1 Year Ended December 31, 2019 Allowance for credit losses on trade
receivables $ 9.1 $ 2.5 $ (3.4) (1) $ — $ 8.2 Inventory obsolescence reserve $ 18.1 $ 7.2 $ (5.6) (2) $ (0.1) $ 19.6 Valuation allowance on deferred tax assets $ 218.4 $ (14.0) $ (2.7) $ (4.1) $ 197.6 Year Ended December 31, 2018 Allowance for credit losses on trade
receivables $ 6.5 $ 2.3 $ (1.0) (1) $ 1.3 $ 9.1 Inventory obsolescence reserve $ 15.5 $ 4.8 $ (1.4) (2) $ (0.8) $ 18.1 Valuation allowance on deferred tax assets $ 189.2 $ 32.8 $ — $ (3.6) $ 218.4
(1) Primarily accounts receivable balances written off, net of recoveries.(2) Primarily items removed from inventory.(3) Primarily includes valuation allowances released as a result of the cessation of operations in certain jurisdictions and
write off of related deferred tax asset balances.
144

Item 16. Form 10-K Summary
Not applicable.
145

SIGNATURES
Pursuant to the requirements of Section 13 or 15(d) of the Securities Exchange Act of 1934, the registrant has duly caused this report to be signed on its behalf by the undersigned, thereunto duly authorized.
SEALED AIR CORPORATION(Registrant)
By: /S/ EDWARD L. DOHENY II Edward L. Doheny II President and Chief Executive Officer
Date: February 25, 2021
Pursuant to the requirements of the Securities Exchange Act of 1934, this report has been signed below by the following persons on behalf of the registrant and in the capacities and on the dates indicated:
Signature Title Date
By: /S/ EDWARD L. DOHENY II President, Chief Executive Officer and Director (Principal Executive Officer)
February 25, 2021
Edward L. Doheny II
By: /S/ JAMES M. SULLIVAN Senior Vice President and Chief Financial Officer(Principal Financial Officer)
February 25, 2021
James M. Sullivan
By: /S/ MICHAEL A. LEON Chief Accounting Officer and Controller(Principal Accounting Officer)
February 25, 2021
Michael A. Leon
By: /S/ ZUBAID AHMAD Director February 25, 2021
Zubaid Ahmad
By: /S/ FRANÇOISE COLPRON Director February 25, 2021
Françoise Colpron
By: /S/ MICHAEL P. DOSS Director February 25, 2021
Michael P. Doss
By: /S/ HENRY R. KEIZER Director February 25, 2021
Henry R. Keizer
By: /S/ JACQUELINE B. KOSECOFF Director February 25, 2021
Jacqueline B. Kosecoff
By: /S/ HARRY A. LAWTON III Director February 25, 2021
Harry A. Lawton III
By: /S/ NEIL LUSTIG Director February 25, 2021
Neil Lustig
By: /S/ SUZANNE B. ROWLAND Director February 25, 2021
Suzanne B. Rowland
By: /S/ JERRY R. WHITAKER Director February 25, 2021
Jerry R. Whitaker
146