
Passive Insights - DeutscheAM Insights... · db X-trackers ETF Team Winchester House ... asset...
48
Marketing Material Sector Rotation: a multi-factor perspective | January 2017 1 Passive Insights March 2017 Marketing Material. Confidential. For non- individual Professional Clients (MiFID Directive 2004/39/EC Annex II) only. For Qualified Investors (Art. 10 Para. 3 of the Swiss Federal Collective Investment Schemes Act (CISA). For institutional investors only. Further distribution of this material is strictly prohibited. Sector Rotation: a multi-factor perspective Deutsche Bank AG Deutsche Asset Management db X-trackers ETF Team Winchester House 1 Great Winchester Street London EC2N 2DB United Kingdom [email protected] etf.deutscheam.com Authors Vincent Denoiseux [email protected] Pierre Debru [email protected] Verity Worsfold [email protected] Bhavesh Warlyani [email protected] Vivek Dinni [email protected] Tanuj Dora [email protected] Roopal Pareek [email protected] Contents 1. Executive Summary 1 2. Sectors: ideal building blocks for portfolios 2 3. Factor Identification and Statistical Testing 5 4. The sector assessment framework: Monthly insights on sector investing 31 “Buy low and sell high. It's pretty simple. The problem is knowing what's low and what's high.” Jim Rogers This marketing document has been produced for information purposes only by a Structuring function of Deutsche AM and contains opinions developed by the Passive Asset Management team. This does not constitute investment advice or independent research. This paper is intended for professional investors only who understand the strategies and views introduced in this paper and can form an independent view of them. Please refer to the risk factors and disclaimers at the end of this document. Executive Summary Historically, asset allocation within global equity portfolios has primarily been built around country allocations. As a consequence of the increasing convergence of global economies, there is mounting evidence that a portfolio would benefit from an industry-based approach (Baca, Sean P., Brian L. Garbe, and Richard A. Weiss. 2000). Markets are traditionally understood to evolve through cycles, and sectors demonstrate different behaviours through these cycles. Professional investors have utilized this behaviour to build sector rotation strategies, which entail taking a short, medium or long term view on the prospects of specific industry sectors, such as financials, industrials, energy etc.. The proliferation of sector-based exchange-traded funds (ETFs) has made accessing specific sector exposures very straight forward. In this paper, we examine the efficiency of different investment styles to approach the investment theme of sector rotation. We find that: Sectors have two very interesting features: on one hand, each sector represents a diversified set of equities, on the other each demonstrates differentiated behaviour across market cycles, compared to other sectors. Our research shows five bases for sector rotation strategies that have delivered historically high probabilities of outperformance: the
Transcript of Passive Insights - DeutscheAM Insights... · db X-trackers ETF Team Winchester House ... asset...

Marketing Material Sector Rotation: a multi-factor perspective | January 2017 1
Passive Insights March 2017 Marketing Material. Confidential. For non-
individual Professional Clients (MiFID
Directive 2004/39/EC Annex II) only. For
Qualified Investors (Art. 10 Para. 3 of the
Swiss Federal Collective Investment
Schemes Act (CISA). For institutional
investors only. Further distribution of this
material is strictly prohibited.
Sector Rotation: a multi-factor perspective
Deutsche Bank AG Deutsche Asset Management db X-trackers ETF Team Winchester House 1 Great Winchester Street London EC2N 2DB United Kingdom [email protected] etf.deutscheam.com Authors Vincent Denoiseux [email protected]
Pierre Debru [email protected]
Verity Worsfold [email protected]
Bhavesh Warlyani [email protected] Vivek Dinni [email protected] Tanuj Dora [email protected] Roopal Pareek [email protected]
Contents 1. Executive Summary 1 2. Sectors: ideal building blocks for
portfolios 2 3. Factor Identification and
Statistical Testing 5 4. The sector assessment
framework: Monthly insights on sector investing 31
“Buy low and sell high. It's pretty simple. The problem is knowing what's low and what's high.”
Jim Rogers
This marketing document has been produced for information purposes only
by a Structuring function of Deutsche AM and contains opinions developed
by the Passive Asset Management team. This does not constitute investment
advice or independent research. This paper is intended for professional
investors only who understand the strategies and views introduced in this
paper and can form an independent view of them. Please refer to the risk
factors and disclaimers at the end of this document.
Executive Summary
Historically, asset allocation within global equity portfolios has primarily been
built around country allocations. As a consequence of the increasing
convergence of global economies, there is mounting evidence that a portfolio
would benefit from an industry-based approach (Baca, Sean P., Brian L.
Garbe, and Richard A. Weiss. 2000).
Markets are traditionally understood to evolve through cycles, and sectors
demonstrate different behaviours through these cycles. Professional
investors have utilized this behaviour to build sector rotation strategies, which
entail taking a short, medium or long term view on the prospects of specific
industry sectors, such as financials, industrials, energy etc.. The proliferation
of sector-based exchange-traded funds (ETFs) has made accessing specific
sector exposures very straight forward.
In this paper, we examine the efficiency of different investment styles to
approach the investment theme of sector rotation. We find that:
Sectors have two very interesting features: on one hand, each sector
represents a diversified set of equities, on the other each
demonstrates differentiated behaviour across market cycles,
compared to other sectors.
Our research shows five bases for sector rotation strategies that
have delivered historically high probabilities of outperformance: the
Sector Rotation: a multi-factor perspective
Marketing Material Sector Rotation: a multi-factor perspective | January 2017 2
Sectors represent well-diversified sets of equities and as such reduce company specific risk
macro economy, valuation, fundamentals, momentum and
sentiment.
By examining factors such as valuations or momentum, investors in
Sector may take advantage of different performance patterns to add
value in different market environments.
With this publication we also take the opportunity to introduce our monthly
Sector Assessment Framework which aims to gather, filter and combine all
the data required to assess and implement each of the five investment
strategies mentioned above (Macro Economy, Valuation, Fundamental,
Momentum and Sentiment).
------------
Sectors: ideal building blocks for portfolios
Sectors (or ‘industries’) are defined by classifying companies within a given
investment universe (e.g. a regional index, local equity exchange, etc.) into a
limited number of groups with common characteristics - typically in terms of
their business model.
Each company is unique for example each demonstrates distinct business
strategies and client base. Nonetheless by combining firms according to their
main business purposes, sectors essentially provide useful groupings of
companies. From an investor’s point of view this offers two unique features:
Each sector is well diversified across firms (see Figure 1) and to that
extent it significantly mitigates company specific risk.
Each sector delivers a performance that relates to a particular
business activity. According to Figure 2-5sectors tend to exhibit very
different performance characteristics.
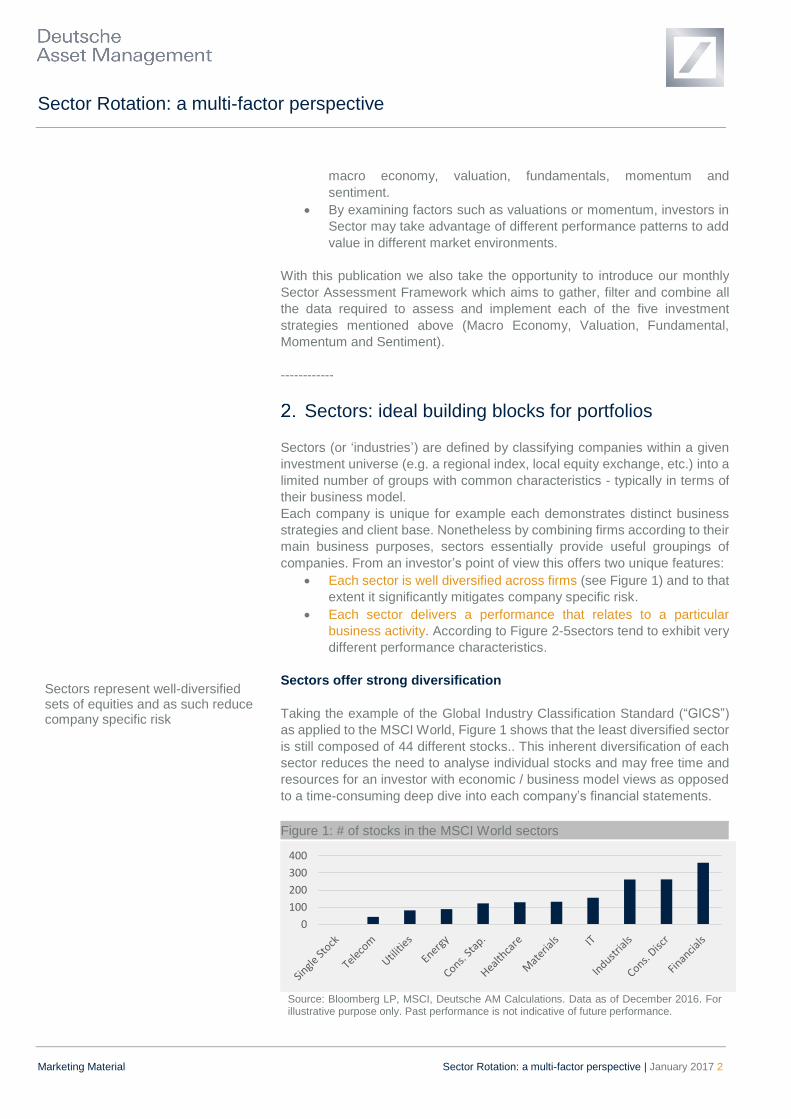
Sectors offer strong diversification
Taking the example of the Global Industry Classification Standard (“GICS”)
as applied to the MSCI World, Figure 1 shows that the least diversified sector
is still composed of 44 different stocks.. This inherent diversification of each
sector reduces the need to analyse individual stocks and may free time and
resources for an investor with economic / business model views as opposed
to a time-consuming deep dive into each company’s financial statements.
Figure 1: # of stocks in the MSCI World sectors
Source: Bloomberg LP, MSCI, Deutsche AM Calculations. Data as of December 2016. For illustrative purpose only. Past performance is not indicative of future performance.
0
100
200
300
400

Sector Rotation: a multi-factor perspective
Marketing Material Sector Rotation: a multi-factor perspective | January 2017 3
Sectors offer a high level of diversification. Sectors exhibit identifiable and varying behaviours across business cycles.
More importantly, this high level of diversification (sometimes referred to as
(low) intra-correlation) within each sector comes with a high level of
diversification between the sectors themselves (sometimes referred to as
(low) cross-index correlation). Figure 2 shows the correlations of excess
returns of the 10 historical GICS World sectors. Such low correlations
demonstrate that sectors can offer both diversified and targeted exposures.
Figure 2: Correlation between the excess returns of sector indices
Ma
teria
ls
Cons. S
tap.
Fin
ancia
ls
IT
Healthcare
Industr
ials
Energ
y
Te
lecom
Utilit
ies
Cons. Stap. -17%
Financials 3% -36%
IT -35% -43% -24%
Healthcare -30% 59% -35% -31%
Industrials 30% -12% 6% -10% -22%
Energy 30% -6% -12% -33% -7% -15%
Telecom -16% 15% -19% -4% 6% -24% -17%
Utilities -1% 57% -31% -41% 36% -14% 13% 19%
Cons. Discr -10% -1% -9% 12% -13% 24% -39% -7% -18%
Source: Bloomberg , MSCI, Deutsche AM Calculations. Data from July 2000 to November 2016 using MSCI World sectors. Correlations are calculated on the basis of daily returns. Past performance is not indicative of future performance.
Furthermore, as illustrated by Baca, Sean P., Brian L. Garbe, and Richard A.
Weiss 2000), the relative importance of geographical and economic
influences on stock returns has shifted in favour of sectors. The factor
contribution of sector in global equity performance is as high as 30%,making
them prime candidates to be used in strategic and tactical allocation.
Direct exposure to economic cycles
Figure 3 shows historical performances of the 10 MSCI World sectors . We
make three observations
There is rotation in annual sector performances: every year, the best
and worst performing sector has varied significantly. E.g. whilst
Financials was the worst performer in 2008, it was the third best in
2009.
Sector rotation has materialized with a large level of cross-sectional
dispersion. The magnitude of the differences in annual performances
are very large. E.g. there was 30% difference between the best and
worst performing sectors in 2015.
Some sectors demonstrated similar behaviour. E.g. Healthcare and
Utilities performed relatively well in 2008 and 2014 when MSCI World
performance was poor, but underperformed in 2009-10 during market
recovery.

Sector Rotation: a multi-factor perspective
Marketing Material Sector Rotation: a multi-factor perspective | January 2017 4
Sectors can be split in specific families depending on those behaviours: Cyclical/Defensive.
It is common practice to group sectors in two main families: cyclical and
defensive, with cyclical sectors performing better in ‘risk on’ environments
and defensive sectors performing better in ‘risk off’ environments.
Figure 3: Annual Performance of MSCI World Sectors
Source: Bloomberg . Deutsche AM Calculations. Data from December 2007 to December 2061. For illustrative purposes only. Past performance is not indicative of future performance.
Whilst the cyclical and defensive sectors show differing performances
through different market trends, we also observe similar groupings based on
their respective risk. Some sectors indeed exhibit more or less volatility and
cyclical sectors (as defined by the GICS classification) tend to have higher
volatility as highlighted by the clustering in Figure 4.
Figure 4: Volatility of returns
Defensive Sectors
Cyclical Sectors
Source: Bloomberg , MSCI, Deutsche AM Calculations. Data from July 2000 to November 2016. Volatility is calculated on the basis of daily returns. Past performance is not indicative of future performance.
Similarly to volatility, looking at the Beta versus their benchmark, Figure 5
exhibits an even stronger clustering than Figure 4 with four cyclical sectors
showing an above 100% beta and four defensive sectors a below 100% beta.
10% 15% 20% 25%
Cons. Stap.
Healthcare
Utilities
MSCI World
Cons. Discr
Industrials
Telecom
Materials
Financials
IT
Energy

Sector Rotation: a multi-factor perspective
Marketing Material Sector Rotation: a multi-factor perspective | January 2017 5
We investigate in the below factor based approaches to sector rotation that would benefits from the diversification and cyclical behaviour of sectors.
Of course this distinction may sound a bit arbitrary as demonstrated by the
positionning of Energy in Figure 4 and Figure 5. Despite being classified a
defensive sector, it displays high volatility and high beta. However, it is still
an interesting and useful framework to assess sector performance.
Figure 5: Sectors Beta of returns
Defensive Sectors
Cyclical Sectors
Source: Bloomberg , MSCI, Deutsche AM Calculations. Data from July 2000 to November 2016. Volatility is calculated on the basis of daily returns. Past performance is not indicative of future performance.
All of the above illustrations illustrates why sectors are a very efficient tool to
develop dynamic investment strategies.
Factor Identification and Statistical Testing
Five factors utilized for Sector rotation
The first section illustrates several interesting features of equity sectors:
Sectors represent large groupings of stocks and as such
demonstrate low levels of idiosyncratic risk.
The behaviour of certain sectors during specific macro-economic
conditions can be associated with the broad sector’s business model
characteristics. As such, getting insights on future macro-economic
conditions may represent a source of outperformance.
We can generally classify sectors as being either cyclical or
defensive, representing its likelihood to outperform (resp.
underperform) during different part of the cycle and vice versa.
Sectors demonstrate a high level of cross-sectional dispersion which
in concrete terms means that a sector rotation strategy may yield
strong positive or negative performance depending on the quality of
the investment signals.
In this section we investigate five different investment styles – increasingly
referred to as ‘factors’ – that can be utilised to implement sector rotation.
0% 20% 40% 60% 80% 100% 120% 140%
Cons. Stap.
Utilities
Healthcare
Telecom
Cons. Discr
MSCI World
Industrials
Materials
Energy
IT
Financials

Sector Rotation: a multi-factor perspective
Marketing Material Sector Rotation: a multi-factor perspective | January 2017 6
We assess the predictive power of different factor descriptors across 5 factors.
At the heart of a sector rotation strategy is the process of selecting the
appropriate sector to invest at a given time. In the below, we investigate five
factor-based approaches:
Momentum: identification of the recent absolute and relative
performances of each sector.
Valuation: identification of relative cheapness/richness of each
sector based on recognized valuation approaches (e.g. Price to
Earning Ratio).
Sentiment: positioning according to the overall change in Analyst
Forecasts for each sector as illustrated by upward and downward
revisions.
Fundamental: identification of the particular strengths of each
sector as measured by the growth in fundamental metrics (e.g.
Earning Growth).
Macro-Economic: identification of the current macro-economic
environment, based on assumed relationships between Sectors
and the Business Cycle.
A deep dive into the predictive power of each factor
For each factor approach, the predictive power of different factor descriptors,
(’sub-factors’) is tested and evaluated.
Figure 6: A comprehensive suite of recognized factors
Source: Deutsche AM. Illustrative Only
The framework for this study is a solid
dataset and comprehensive
statisitical analyses
Based on the suite of sub-factors shown in Figure 6 we develop a Sector
Assessment Framework that will compile relevant data points in a concise
format to help investors form an assessment of current market opportunities
looking at sectors from 5 different angles.
To develop this framework, we followed a three step process:
Compilation of datasets: using recognized data sources such as
Bloomberg, Datastream, IBES Aggregates.
Comprehensive Statistical Analysis: Each sub-factor is tested to
evaluate its ‘predictive power’. In what follows, we define the success
of a particular sub-factor as per its ability to correctly predict the
performance of a particular sector either on an absolute basis or
compared to its benchmark. We use ‘hit ratios’ to do this, i.e. the
proportion of correctly forecasted market evolutions (either relative or
absolute).
Sector Rotation: a multi-factor perspective
Marketing Material Sector Rotation: a multi-factor perspective | January 2017 7
Momentum is a pervasive equity
factor.
Investment Strategies: For each sub-factor that demonstrates a
sufficiently high hit ratio, a sector picking strategy is tested across the
available historical dataset.
For the sub-factors where data is sector specific (i.e. everything but Macro-
Economic data), an important consideration when running the statistical
analysis is to decide whether to assess the factor on its current value, against
its history, or the relative positioning of against other sectors.
This could for example be expressed as the decision to go long a sector
based on a) it being cheap in absolute terms, b) it being cheap compared to
its own historical averags, or c) a comparison of its valuation metrics to others
to identify relative cheapness. We respectively call these comparison,
‘Absolute’, ‘Historical’ and ‘Cross-sectional’ assessments, and we test all
three where possible when it makes statistical and fundamental sense.
With reference to macroeconomic factors, the sub-factors are common to all
sectors and as such the objective will be to assess if each sub-factor is more
favourable for defensive or cyclical sectors.
We focus on 3 distinct geographical universes:
Developed market equities using the sectors of the MSCI World
Emerging market equities using the sectors of the MSCI Emerging
Market
European equities using the sectors of the Europe STOXX 600
Momentum, a straightforward and resilient approach
In their seminal research papers, Jegadeesh, N., 1990 and Jegadeesh, N.,
and S. Titman, 1993 highlighted the pervasiveness of momentum as a
contributor to the performance of equities.
In their paper “Momentum of Sector ETFs”, Denoiseux, V. and DEBRU, P.
2014, studied such momentum at sector level The analysis showed:
Momentum-driven global sector rotation strategies exhibit a higher
risk adjusted return compared to global market cap weighted stock
indices, on the basis of simulated results.
A momentum-driven emerging market sector rotation portfolio would
have demonstrated, on a simulated basis, a higher Sharpe Ratio
than the MSCI Emerging Market Index
The first step is to run a hit ratio analysis. We start with the absolute value
assessment - as usually implemented in the literature - i.e. the signal used is
the 11 Month Momentum 1 month removed:
𝑀𝑜𝑚𝑒𝑛𝑡𝑢𝑚 𝑆𝑐𝑜𝑟𝑒 =𝑃𝑡−1𝑚
𝑃𝑡−12𝑚
− 1
For each sector, at the end of each month, the momentum score and the
performance over the next 3 months are calculated. The hit ratio is then the
ratio between the number of month end historical observations where the
performance of the sector over the next 3 months is in line with expectations,
divided by the total number of observations. A high Momentum Score is
expected to signal a sector with a good tailwind and therefore likely to
translate into positive performance. Similarly, a low Momentum Score is
expected to translate into a negative performance.

Sector Rotation: a multi-factor perspective
Marketing Material Sector Rotation: a multi-factor perspective | January 2017 8
Figure 7 illustrates the hit ratio. In this graph each data point represents a
historical observation with the Momentum Score at the time of observation on
thex-axis, and the performance of the sector over the following 3 months on
the y-axis. Each data point in a green zone is considered to be a positive
result, while each data point in the red zone is considered to be negative.
The hit ratio is the ratio of dots in the green zone to the total number of dots.
Overall a hit ratio above 50% indicates a positive relationship between the
factor and the resulting relative performance.
Figure 7: Momentum Absolute Hit Ratio Calculation
Source: Bloomberg LP, MSCI, Deutsche AM Calculations. Data from July 2000 to November 2016. 10 MSCI World Sectors are used for this analysis. Past performance is not indicative of future performance.
Looking at the results sector-by-sector over the past 15 years, Momentum
exhibits very strong hit ratios across the board for MSCI World Sectors.
Figure 9 shows that all sectors exhibit high fifties to low sixties hit ratios
highlighting good predictive power.
Figure 8: Momentum absolute hit ratios for MSCI World sectors
Source: Bloomberg LP, MSCI, Deutsche AM Calculations. Data from July 2000 to November 2016. 10 MSCI World Sectors are used for this analysis. Past performance is not indicative of future performance.
Looking at the same for European Sectors (Europe STOXX 600) and
Emerging Market Sectors (MSCI Emerging Markets), it is clear that
-50%-40%-30%-20%-10%
0%10%20%30%40%50%
-50% -30% -10% 10% 30% 50%
Forw
ard
3M
Pe
rfo
rman
ce
Momentum Score
53%63% 57% 62% 66% 62% 57% 57% 57% 60% 59%
0%
20%
40%
60%
80%
100%
Mo
men
tum
Hit
Rat
io

Sector Rotation: a multi-factor perspective
Marketing Material Sector Rotation: a multi-factor perspective | January 2017 9
Absolute Momentum exhibits very
strong hit ratios across the board for
MSCI World Sectors.
Absolute Momentum also exhibits
strong and consistent predictive
power over the short to medium term
for Emerging Market and european
equities.
Momentum exhibits strong and consistent predictive power over the short to
medium term.
Figure 9: Momentum absolute hit ratios for Europe (left) and EM (right)
Source: Bloomberg LP, MSCI, STOXX, Deutsche AM Calculations. Data from December 2000 to November 2016 for MSCI EM and July 2000 to November 2016 for Europe STOXX 600 Sectors (except Consumer Services and Consumer Goods where the data starts in September 2004). MSCI EM Sectors are used for EM Sectors and Europe STOXX 600 Sectors are used for Europe. Past performance is not indicative of future performance.
We also run hit-ratio analysis on a cross sectional basis- instead of looking
at the sign of the Momentum Score, the analysis looks at the strength of the
Momentum Score, for each sector compared to the score of all the other
sectors at a given point in time. The underlying assumption being that the
sectors with the strongest Momentum Score will exhibit higher performance
than the sectors with the lowest Momentum Score over the next 3 months.
Each month, sectors are ranked according to their Momentum Scores, and
the average performance over the next 3 months of the 3 highest ranked
sectors and the 3 lowest ranked sectors is calculated. An occurrence where
the high Momentum Score sectors outperform the low Momentum Score
sectors is considered as a positive result. The Hit ratio is then calculated by
dividing the number of positive observations by the total number of
observations.
Figure 10 shows the average cross sectional hit ratio of the 10 sectors in each
of the 3 universes considered. We observe that momentum also exhibits
strong predictive power from a cross sectional perspective
51
% 66
%5
9%
55
% 64
%6
0%
49
% 58
%6
3%
61
%5
9%
0%
20%
40%
60%
80%
100%
Bas
ic M
ater
ials
Co
nsu
mer
Go
od
s
Fin
anci
als
Tech
no
logy
Hea
lth
care
Ind
ust
rial
s
Oil&
Gas
Tele
com
Uti
litie
s
Co
nsu
mer
Ser
vice
s
STO
XX
Eu
rop
e 6
00…
Mo
men
tum
Hit
Rat
io
54
%5
9%
50
%4
9%
54
%5
0%
52
%5
5%
54
%5
4%
53
%
0%
20%
40%
60%
80%
100%
Mat
eria
ls
Co
nsu
mer
Sta
ple
s
Fin
anci
als IT
Hea
lth
care
Ind
ust
rial
s
Ener
gy
Tele
com
mu
nic
atio
ns
Uti
litie
s
Co
nsu
mer
Dis
cre
tio
nn
ary
MSC
I EM
Sec
tors
Mo
men
tum
Hit
Rat
io

Sector Rotation: a multi-factor perspective
Marketing Material Sector Rotation: a multi-factor perspective | January 2017 10
Momentum also exhibits strong
predictive power from a cross
sectional perspective.
Figure 10: Momentum Cross Sectional hit ratios
Source: Bloomberg LP, STOXX, MSCI, Deutsche AM Calculations. Data from December 2000 to November 2016 for MSCI EM and July 2000 to November 2016 for Europe STOXX 600 Sectors (except Consumer Services and Consumer Goods where the data starts in September 2004). Past performance is not indicative of future performance.
Having assessed the strength of momentum as a predictive signal for future
sector performance, we put together a straightforward potential investment
strategy using this signal to allocate capital. To this end, we define a potential
strategy that invests on a quarterly basis an equal amount in the 3 sectors
demonstrating the 3 highest Momentum (Figure 11).
Figure 11: Momentum driven potential investment strategy
Illustrative Only
Due to the relatively large available timespan for the price time series, we
were able to test the potential strategy on each the 3 universes (US, EM and
Europe) over periods of more than 15 years. As illustrated in Figure 12,
overall each of the 3 strategies yielded a positive excess return over the entire
observation period.
Since the hit ratios and potential strategy performance for momentum were
sufficiently high to be considered significant, we consider this factor relevant
as a possible approach to sector investing.
57% 62% 60%
0%
20%
40%
60%
80%
100%
Mo
men
tum
Hit
Rat
io
Portfolio Rebalancing
Quarterly
Portfolio Construction
Equal Weight Basket of 3 Sectors with highest Momentum Score
Momentum Score and Ranking
Rank the sectors by Momentum Score
Investment Universe
Sector Indices In MSCI World (resp MSCI EM and EuroSTOXX 600)

Sector Rotation: a multi-factor perspective
Marketing Material Sector Rotation: a multi-factor perspective | January 2017 11
From a backtesting perspective,
Momentum also exhibits strong
results across investment universes.
Overall Momentum proved
successful across all our statistical
tests.
Value is a very pervasive equity factor
and we analyse it through the prism
of six sub-factors.
Figure 12: Momentum Strategies on the 3 universes
Momentum Strategy MSCI World
Annual growth 5.46% 5.13%
Annualized volatility 17.1% 16.8%
Sharpe Ratio 0.2 0.2
Max. drawdown -56.4% -57.8%
Momentum Strategy MSCI EM
Annual growth 12.43% 9.53%
Annualized volatility 18.8% 20.1%
Sharpe Ratio 0.6 0.4
Max. drawdown -63.5% -65.2%
Momentum Strategy Europe STOXX 600
Annual growth 5.31% 3.29%
Annualized volatility 21.2% 20.4%
Sharpe Ratio 0.2 0.1
Max. drawdown -56.8% -58.7% Source: Bloomberg LP, STOXX, MSCI, Deutsche AM Calculations. Data from July 2001 to November 2016 for World and Europe and December 2001 to November 2016 for Europe. The performance data is shown for illustrative purpose only and is based on the retrospective simulation of the strategies. The performance has been calculated on the basis of historical performances of each sector index net total return in USD (EUR for Europe). The performance is calculated gross of any replication costs but net of 20bps transaction costs excluding any applicable tax. Risk arising from assets being traded in foreign currencies is not hedged here. Past performance is not indicative of future performance.
Valuation and sentiment: Does buying cheap work in practice?
Value strategies i.e. buying cheap equities are one of the most famous and
most popular investment philosophies among the investment community.
Academic research, including by Fama E.F, French K.R. 1992 posits that
‘cheap’ equities - based on market prices relative to accounting values -
outperform ‘expensive’ equities over the long-term.
50
100
150
200
250
Jul 01 Jul 03 Jul 05 Jul 07 Jul 09 Jul 11 Jul 13 Jul 15
Momentum Strategy MSCI World Index
0100200300400500600700
Dec 01 Dec 03 Dec 05 Dec 07 Dec 09 Dec 11 Dec 13 Dec 15Momentum Strategy MSCI Emerging Markets
50
100
150
200
250
Jul 01 Jul 03 Jul 05 Jul 07 Jul 09 Jul 11 Jul 13 Jul 15Momentum Strategy STOXX Europe 600 Index

Sector Rotation: a multi-factor perspective
Marketing Material Sector Rotation: a multi-factor perspective | January 2017 12
Cross-Sectional hit ratios for
valuation sub-factors are uneven,
with Dividend and P/E exhibiting
relatively strong results, while other
sub-factors show weaker results than
may have been expected
Following a few years of poor performance and limited interest, value stocks
and value strategies saw a large pick up of interest in the last quarter of 2016.
In fact, Value Factor ETFs worlwide raised over 10.7bn EUR in the last 3
months of 2016. In this section, we assess valuation indicators as predictors
of future performance for sectors.
For the sake of completeness we also bring the Sentiment factor into this
analysis framework, even if is not a value sub-factor sensu stricto.
We consider the 6 following sub-factors with data sourced from Thomson
Financial DataStream - I/B/E/S Global Aggregates:
Price to Earnings ratio - weighted average price/earnings per share
ratio based on 12-month-forward Earnings per share (P/E)
Price to Book ratio - weighted average price/book value per share
ratio based on 12-month-forward Book Value per share (P/B)
Price to Cash Flows ratio -. Weighted average price/CPS ratio based
on 12-month-forward Cash Flow per share (P/CF)
Price to EBIT raio - Weighted average price/EBIT per share ratio
based on 12-month-forward EBIT per share (P/EBIT)
Dividend Yield - Weighted average dividend yield based on the
indicated annual dividend
Sentiment - the 12-month-forward pro-rata number of Earning Per
shares estimates up since last month for all companies within the
sectors minus the numbers of estimates down divided by the total
number of estimates.
We begin by performing a hit ratio assessment for each sub-factor, on a cross
sectional basis. As we did for momentum, we rank sectors according to the
absolute value of the sub-factors and then compare the performance of the 3
highest and the 3 lowest ranked sectors over the next 12 months.
Commonly accepted expectations are for the lowest ranked sector according
to P/E, P/B, P/EBIT, P/CF and the highest ranked according to Dividend Yield
and Sentiment to exhibit the highest performance in the future
Figure 13: Valuations Cross Sectional hit ratios
Source: Bloomberg LP I/B/E/S Global Aggregates, MSCI, Deutsche AM Calculations. See Annex for a detailed description of the data used. Past performance is not indicative of future performance.
56
%
39
%
43
%
36
%
57
%
56
%
53
%
42
%
38
%
41
% 52
%
67
%
44
%
37
% 41
%
41
%
54
%
56
%
0%
20%
40%
60%
80%
100%
Val
uat
ion
s H
it R
atio
MSCI World Sectors MSCI EM Sectors STOXX Europe 600 Sectors

Sector Rotation: a multi-factor perspective
Marketing Material Sector Rotation: a multi-factor perspective | January 2017 13
We introduce a different type of hit
ratio: the Historical hit ratio. The
objective is to assess for each sector
whether it is currently cheap or
expensive compared to its own
history.
Figure 13 shows the average Cross Sectional hit ratios across all the sectors
for all universes and all sub-factors. Results for valuations of sub-factors are
uneven with Dividend and P/E exhibiting relatively strong results while the
other sub-factors exhibited weaker results than expected. This is partly due
to the fact that some sectors are structurally cheaper than others. For
example, the long term average value of the P/E of MSCI World Utilities is 14
compared to 22 for MSCI World IT,meaning that a direct comparison is likely
to generate many wrong signals.
On the other hand, the Cross Sectional hit ratios for Sentiment yield the
strongest results. In general, the “Sentiment Index”, defined as the ratio of the
number of investment advisers who are bearish divided by the total number
of advisors, has been considered as a contrarian signal (or no signal at all)
(see Solt, Michael E., and Meir Statman. 1988) but here we are considering
stock level expectation of changes in earnings per share which is a very
different measure and may explain this new result.
In an attempt to improve the results of the cross sectional hit ratio for
valuation, we introduce a different type of hit ratio: the Historical hit ratio. The
objective being to assess for each sector if it is currently low or high compared
to its own history.
As shown in Figure 14, the sentiment score for a given sector tends to
oscillate around a long term average. Our objective here is to assess how far
from this average the sector currently stands, and in which direction.
Figure 14: Illustration of Historical Sentiment Score
Source: For illustrative purpose only
Mathematically, we do this by calculating a 5Y historical Z-Score as defined
below.
𝐻𝑖𝑠𝑡𝑜𝑟𝑖𝑐𝑎𝑙 𝑍𝑆𝑐𝑜𝑟𝑒 = 𝐶𝑢𝑟𝑟𝑒𝑛𝑡 𝑉𝑎𝑙𝑢𝑒 − 5𝑌 𝐴𝑣𝑒𝑟𝑎𝑔𝑒(𝑉𝑎𝑙𝑢𝑒)
5𝑌 𝑆𝑡𝑎𝑛𝑑𝑎𝑟𝑑 𝐷𝑒𝑣 (𝑉𝑎𝑙𝑢𝑒)
-25
-20
-15
-10
-5
0
5
10
15
Dec 07 Dec 08 Dec 09 Dec 10 Dec 11 Dec 12 Dec 13 Dec 14
Score
Sentiment Average
Short Term deviationfrom long term average

Sector Rotation: a multi-factor perspective
Marketing Material Sector Rotation: a multi-factor perspective | January 2017 14
We define the hit ratio as for the absolute hit ratio - i.e for each sector at the
end of each month, the Z Score is compared to the performance over the next
12 months.
As previously, the hit ratio is calculated as the ratio between the number of
month-end historical observations where the performance of the sector over
the following 12 months is in line with expectations, and the total number of
observations. Taking the example of P/E, a high historical Z-Score is
expected to signal a sector which is expensive and therefore to translate into
a negative future performance. Similarly a low Z-Score is expected to
translate into a positive future performance.
Overall a hit ratio above 50% indicates a significant relationship between the
factor and the resulting performance.
Figure 15: Historical hit ratio calculations for Sentiment
Source: Illustrative Only
Looking at the results sector-by-sector over the past 15 years for MSCI World
sectors, Sentiment exhibits relatively good historical hit ratios across sub-
factors. Figure 16 shows that most sectors exhibit high fifties to low sixties hit
ratios.
-50%
-40%
-30%
-20%
-10%
0%
10%
20%
30%
40%
50%
-300% -200% -100% 0% 100% 200% 300%
Forw
ard
12
M P
erf
orm
ance
Historical ZScore Sentiment

Sector Rotation: a multi-factor perspective
Marketing Material Sector Rotation: a multi-factor perspective | January 2017 15
Sentiment exhibits relatively good
historical hit ratios across sub-factors.
P/B performed relatively poorly on a
Cross Sectional basis, however
showa much stronger results for
Historical hit ratios- with 8 sectors out
of 10 showing hit ratios above 50%,
and as high as 70% for Developed
Equities.
Figure 16: Sentiment Historical Hit Ratios on MSCI World Sectors
Source: Bloomberg LP, I/B/E/S Global Aggregates, MSCI, Deutsche AM Calculations. Data from December 1995 to November 2016. Past performance is not indicative of future performance.
For P/B which performed relatively poorly on a Cross Sectional basis, the
results are a lot stronger on a Historical hit ratio basis - with 8 sectors out of
10 showing hit ratios above 50%, with some as high as 70% for Developed
Equities.
This is also true for European and Emerging Market equity universes.
Figure 17: P/B Historical hit ratios forMSCI World sectors
Source: Bloomberg LP, I/B/E/S Global Aggregates, MSCI, Deutsche AM Calculations. Data from January 2004 to November 2016. Past performance is not indicative of future performance.
Figure 18: P/B Historical hit ratios for Europe (left) and EM (right)
Source: Bloomberg LP, I/B/E/S Global Aggregates,STOXX , MSCI, Deutsche AM Calculations. Data from January 2004 to November 2016. For Europe Consumer Services and Consumer Goods Sector data is from October 2004 to November 2016. Past performance is not indicative of future performance.
56% 48%67%
57%42%
58%47%
60% 62% 55% 55%
0%20%40%60%80%
100%
Sen
tiem
ent
Hit
Rat
io
72%
43% 50%60% 52% 55%
70%56% 56%
48%56%
0%20%40%60%80%
100%
P/B
PS
Hit
Rat
io
61
%5
2%
47
%4
5%
50
% 58
%5
6% 62
% 68
%5
0%
55
%
0%
20%
40%
60%
80%
100%
Bas
ic M
ater
ials
Co
nsu
mer
Go
od
s
Fin
anci
als
Tech
no
logy
Hea
lth
care
Ind
ust
rial
s
Oil&
Gas
Tele
com
Uti
litie
s
Co
nsu
mer
Ser
vice
s
STO
XX
Eu
rop
e 6
00…
P/B
PS
Hit
Rat
io
44
% 52
% 64
%6
2%
56
%6
0%
44
%7
9%
65
%5
5%
56
%
0%
20%
40%
60%
80%
100%
Mat
eria
ls
Co
nsu
mer
Sta
ple
s
Fin
anci
als IT
Hea
lth
care
Ind
ust
rial
s
Ener
gy
Tele
com
mu
nic
atio
ns
Uti
litie
s
Co
nsu
mer
…
MSC
I EM
Sec
tors
P/B
PS
Hit
Rat
io

Sector Rotation: a multi-factor perspective
Marketing Material Sector Rotation: a multi-factor perspective | January 2017 16
Taking an aggregated view of all universes and sub-factors, the Historical hit
ratios exhibit stronger and more consistent results on the 5 Valuation sub-
factors than cross sectional hit ratios.
Figure 19: Valuation and Sentiment Historical hit ratios
Source: Bloomberg LP, I/B/E/S Global Aggregates, MSCI, Deutsche AM Calculations. See Annex for a detailed description of the data used. Past performance is not indicative of future performance.
Having established a reliable signal, we now turn to constructing a
straightforward potential investment strategy using this signal to allocate
capital. To this end, we define two strategies:
A Valuation-based strategy
A Sentiment-based strategy
The Valuation based strategy uses cross-sectional scores equal weighting
the score of the 5 following sub-factors: P/E, P/BPS, P/CF, P/EBIT and Div
Yield. The strategy invests in an equally weighted basket of the 3 cheapest
sectors.
Figure 20: Valuation based potential investment strategy
The potential strategy relies on the predictive power of the 5 sub-factors but
also on robustness coming from using multiple different signals. As illustrated
in Figure 21, the strategy outperforms the benchmark over the long term in
the 3 sector universes we test. This outperformance comes with slightly
60
%
56
%
53
%
56
%
60
%
55
%
58
%
52
% 58
%
58
%
51
%
54
%
47
%
50
%
53
%
55
%
52
%
49
%
0%
20%
40%
60%
80%
100%
Val
uat
ion
s H
it R
atio
MSCI World Sectors MSCI EM Sectors STOXX Europe 600 Sectors
Portfolio Rebalancing
Quarterly
Portfolio Construction
Equal Weight Basket of 3 Sectors with Lowest Valuation Score
Valuation Score and Ranking
Rank the sectors by the equal weight of the 5 sub factor cross sectional Z Score
Investment Universe
Sector Indices In MSCI World (resp MSCI EM and EuroSTOXX 600)

Sector Rotation: a multi-factor perspective
Marketing Material Sector Rotation: a multi-factor perspective | January 2017 17
The strategy outperforms the
benchmark over the long term in the
3 sector universes. This
outperformance comes with slightly
increased volatility, in line with the
academic comprehension of value as
a very cyclical factor.
increased volatility, in line with the academic comprehension of value as a
cyclical factor.
Figure 21: Valuation based potential investment strategy on the 3 universes
Valuation Strategy MSCI World
Annual growth 5.29% 3.46%
Annualized volatility 17.3% 16.8%
Sharpe Ratio 0.2 0.1
Max. drawdown -59.4% -57.8%
Valuation Strategy MSCI EM
Annual growth 10.89% 8.72%
Annualized volatility 20.9% 20.1%
Sharpe Ratio 0.4 0.3
Max. drawdown -62.6% -65.2%
Valuation Strategy Europe STOXX 600
Annual growth 7.19% 6.79%
Annualized volatility 21.2% 19.5%
Sharpe Ratio 0.3 0.3
Max. drawdown -56.3% -58.7% Source: Bloomberg LP, I/B/E/S Global Aggregates, STOXX, MSCI, Deutsche AM Calculations. Data from July 2000 to November 2016 for World, December 2000 to November 2016 for EM and December 2002 to November 2016 for Europe. For Europe Consumer Services and Consumer Goods Sector data is from October 2004 to November 2016. So effectively the Europe Strategy runs on 8 sectors in the first 2 years. The performance data is shown for illustrative purpose only and is based on the retrospective simulation of the strategies. The performance has been calculated on the basis of historical performances of each sector index net total return in USD (EUR for Europe). The performance is calculated gross of any replication costs but net of 20bps transaction costs excluding any applicable tax. Risk arising from assets being traded in foreign currencies is not hedged here. Past performance is not indicative of future performance.
50
100
150
200
250
Jul 00 Jul 02 Jul 04 Jul 06 Jul 08 Jul 10 Jul 12 Jul 14 Jul 16Cross Sectional Valuation Strategy MSCI World Index
0100200300400500600700800
Dec 00 Dec 02 Dec 04 Dec 06 Dec 08 Dec 10 Dec 12 Dec 14
Cross Sectional Valuation Strategy MSCI Emerging Market
50
100
150
200
250
300
350
Dec 02 Dec 04 Dec 06 Dec 08 Dec 10 Dec 12 Dec 14Cross Sectional Valuation Strategy STOXX Europe 600 Index

Sector Rotation: a multi-factor perspective
Marketing Material Sector Rotation: a multi-factor perspective | January 2017 18
The strategy also exhibits
performance patterns similar to single
stock based value strategies a very
difficult period post financial crisis and
a recent pick up in performance.
If we consider the performance of this strategy over shorter horizons (such
as 2Y rolling, seeFigure 22), we observe that the strategy goes through
periods of out- performance and under-performance. It also exhibits
performance patterns similar to single stock based value strategies, showing
negative performance post the 2008 financial crisis and a recent pick up in
performance.
Figure 22: 2 year rolling performance for the Valuation based potential
investment strategy on MSCI World
Source: Bloomberg LP, I/B/E/S Global Aggregates, MSCI, Deutsche AM Calculations. Data from July 2000 to November 2016 for World. The performance data is shown for illustrative purpose only and is based on the retrospective simulation of the strategies. The performance has been calculated on the basis of historical performances of each sector index net total return in USD (EUR for Europe). The performance is calculated gross of any replication costs but net of 20bps transaction costs excluding any applicable tax. Risk arising from assets being traded in foreign currencies is not hedged here. Past performance is not indicative of future performance.
The Sentiment based potential strategy uses cross sectional Sentiment
scores. The strategy invests in an equally weighted basket of the 3 sectors
with the highest sentiment score.
Figure 23: Sentiment based potential investment strategy
Source: For illustrative Purpose Only
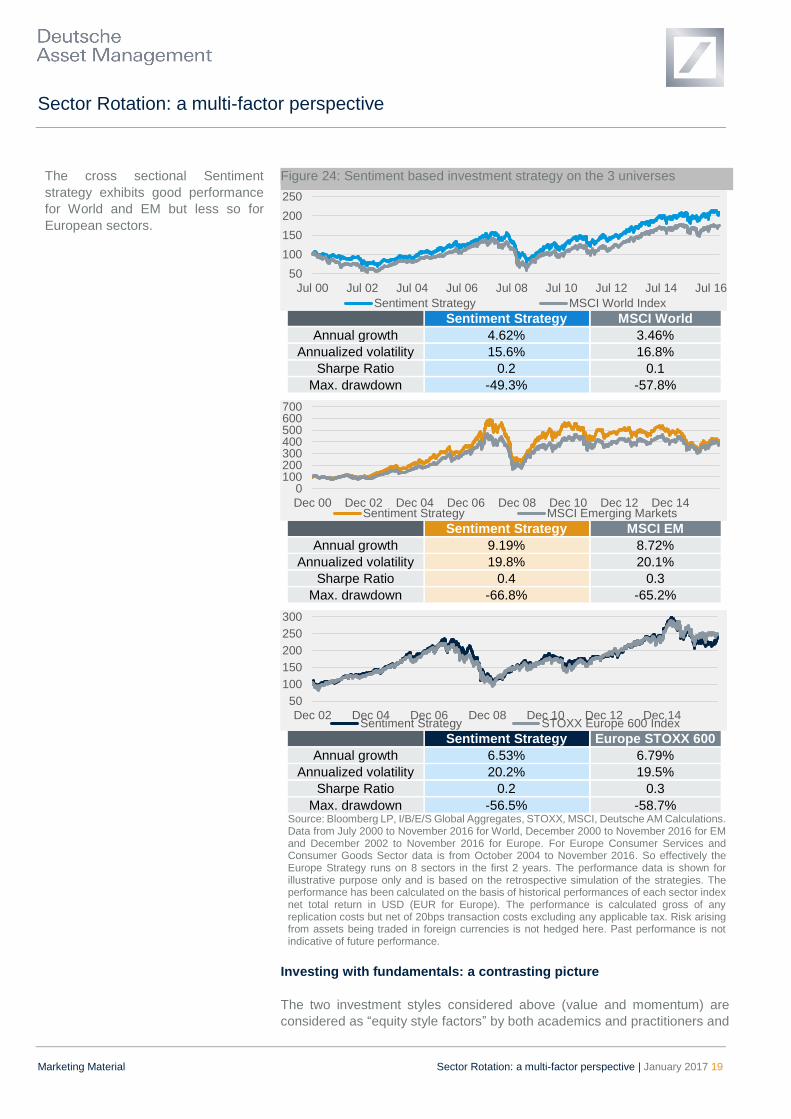
The strategy exhibits good performance for World and EM but less so for
European sectors.
-30%
-20%
-10%
0%
10%
20%
30%
40%
Jul 02 Jul 04 Jul 06 Jul 08 Jul 10 Jul 12 Jul 14 Jul 16
Portfolio Rebalancing
Quarterly
Portfolio Construction
Equal Weight Basket of 3 Sectors with highest Sentiment Score
Valuation Score and Ranking
Rank the sectors by the Sentiment cross sectional Z Score
Investment Universe
Sector Indices In MSCI World (resp MSCI EM and EuroSTOXX 600)
Sector Rotation: a multi-factor perspective
Marketing Material Sector Rotation: a multi-factor perspective | January 2017 19
The cross sectional Sentiment
strategy exhibits good performance
for World and EM but less so for
European sectors.
Figure 24: Sentiment based investment strategy on the 3 universes
Sentiment Strategy MSCI World
Annual growth 4.62% 3.46%
Annualized volatility 15.6% 16.8%
Sharpe Ratio 0.2 0.1
Max. drawdown -49.3% -57.8%
Sentiment Strategy MSCI EM
Annual growth 9.19% 8.72%
Annualized volatility 19.8% 20.1%
Sharpe Ratio 0.4 0.3
Max. drawdown -66.8% -65.2%
Sentiment Strategy Europe STOXX 600
Annual growth 6.53% 6.79%
Annualized volatility 20.2% 19.5%
Sharpe Ratio 0.2 0.3
Max. drawdown -56.5% -58.7% Source: Bloomberg LP, I/B/E/S Global Aggregates, STOXX, MSCI, Deutsche AM Calculations. Data from July 2000 to November 2016 for World, December 2000 to November 2016 for EM and December 2002 to November 2016 for Europe. For Europe Consumer Services and Consumer Goods Sector data is from October 2004 to November 2016. So effectively the Europe Strategy runs on 8 sectors in the first 2 years. The performance data is shown for illustrative purpose only and is based on the retrospective simulation of the strategies. The performance has been calculated on the basis of historical performances of each sector index net total return in USD (EUR for Europe). The performance is calculated gross of any replication costs but net of 20bps transaction costs excluding any applicable tax. Risk arising from assets being traded in foreign currencies is not hedged here. Past performance is not indicative of future performance.
Investing with fundamentals: a contrasting picture
The two investment styles considered above (value and momentum) are
considered as “equity style factors” by both academics and practitioners and
50
100
150
200
250
Jul 00 Jul 02 Jul 04 Jul 06 Jul 08 Jul 10 Jul 12 Jul 14 Jul 16
Sentiment Strategy MSCI World Index
0100200300400500600700
Dec 00 Dec 02 Dec 04 Dec 06 Dec 08 Dec 10 Dec 12 Dec 14Sentiment Strategy MSCI Emerging Markets
50
100
150
200
250
300
Dec 02 Dec 04 Dec 06 Dec 08 Dec 10 Dec 12 Dec 14Sentiment Strategy STOXX Europe 600 Index

Sector Rotation: a multi-factor perspective
Marketing Material Sector Rotation: a multi-factor perspective | January 2017 20
Fundamental Factors offer a
contrasting picture looking at
statistical results.
Cross Sectional hit ratios results are
quite poor
there is broad consensus on their expected long term outperformance against
traditional market cap strategies.
This, however, is not the case for the sub-factors we consider below. Growth
can be used as a factor to explain the performance of stocks but it has not
demonstrated that it carries an expectation of outperformance over the long
term at stock level. We now assess whether these fundamental economic
sub-factors are also good predictors of the sectors future performance.
We begin by conductinga hit ratio assessment on a cross sectional basis. As
with momentum and valuation, we rank sectors according to the level of the
different sub-factors listed below, and compare the performance of the 3
highest and the 3 lowest ranked sectors over the next 12 months.
Growth in Book Value per Share - Weighted 12-month-forward
growth in Book Value per Share (BPS Growth)
Growth in Earnings per Share - Weighted 12-month-forward growth
in Earnings per Share (EPS Growth)
Growth in Sales - Weighted 12-month-forward growth in Sales (Sales
Growth)
Growth in Cash Flows - Weighted 12-month-forward growth in Cash
Flows (Cash Flows Growth)
A commonly accepted expectation would be for the highest ranked sectors
(those exhibiting the highest growth) to realise the best performance in the
future.
Cross Sectional hit ratios (Figure 25) show only 2 of the 12 universe/sub-
factor pairs with hit ratios above 50%. Valuations could be explained by the
long term tendency for some sectors to have a higher growth rate than
others. Again to account for this, we move to Historical hit ratios.
Figure 25: Fundamental Cross Sectional Hit Ratios
Source: Bloomberg LP, I/B/E/S Global Aggregates, MSCI, Deutsche AM Calculations. See Annex for a detailed description of the data used. Past performance is not indicative of future performance.
The results of this last analysis are the least expected. We find that this
fundamental data may exhibit strong Historical hit ratios - but only when
looking at the expectations on a contrarian basis, i.e. by inversing
expectations. In other words, the hit ratios are calculated on the basis that
high growth is a signal of future under performance - a kind of ‘overbought’
signal.
56%
34%44%
35%
60%50% 48%
37%44%29%
36% 35%
0%
20%
40%
60%
80%
100%
Fun
dam
enta
l H
it R
atio
MSCI World Sectors MSCI EM Sectors STOXX Europe 600 Sectors

Sector Rotation: a multi-factor perspective
Marketing Material Sector Rotation: a multi-factor perspective | January 2017 21
Fundamental data exhibits strong
contrarian Historical hit ratios -by
inversing expectations
As an example, using EPS Growth for MSCI World sectors, on a contrarian
basis, 9 out of 10 historical hit ratios are above 50%
Figure 26: EPS Growth Historical Hit Ratios
Source: Bloomberg LP, I/B/E/S Global Aggregates, MSCI, Deutsche AM Calculations. Data from December 1995 to November 2016. Past performance is not indicative of future performance.
Still on a contrarian basis, we find very strong results for fundamental data.
On average across all universes and across all sub-factors, all hit ratios are
above 50%.
Figure 27: Fundamental Historical Hit Ratios
Source: Bloomberg LP, STOXX, I/B/E/S Global Aggregates, MSCI, Deutsche AM Calculations. See Annex for a detailed description of the data used. Past performance is not indicative of future performance.
Using Contrarian Fundamental signals, we construct an investment strategy
to test the viability of the signals. The idea is to buy the 3 sectors showing the
lowest growth across the 4 sub factors on a quarterly basis.
Figure 28: Fundamental potential Investment Strategy
Source: For illustrative purpose only
58% 64%49%
63% 63%51% 51% 51% 43%
55% 55%
0%20%40%60%80%
100%
EPS
Gro
wth
Hit
Rat
io
61
%
67
%
58
%
55
%
56
%
54
%
50
%
57
%
51
%
54
%
61
%
56
%
0%20%40%60%80%
100%
Fun
dam
enta
ls H
it
Rat
io
MSCI World Universe MSCI EM Sectors STOXX Europe 600 Sectors
Portfolio Rebalancing
Quarterly
Portfolio Construction
Equal Weight Basket of 3 Sectors with Lowest Fundamental Score
Fundamental Score and Ranking
Rank the sectors by the equal weight of the Historical ZScore of the 4 sub factors
Investment Universe
Sector Indices In MSCI World (resp MSCI EM and EuroSTOXX 600)

Sector Rotation: a multi-factor perspective
Marketing Material Sector Rotation: a multi-factor perspective | January 2017 22
On a contrarian basis, results for
Fundamental factors are excellent for
EM and Europe and fine for
developed equities.
The results in Figure 29 are excellent for EM and Europe with outperformance
of 3.94% and 2.99% per annum respectively and are quite good for World.
Max drawdowns are also down across the board compared to the benchmark.
Figure 29: Fundamental Strategies on the 3 universes
Fundamental Strategy MSCI World
Annual growth 4.36% 4.02%
Annualized volatility 16.8% 16.9%
Sharpe Ratio 0.2 0.1
Max. drawdown -56.8% -57.8%
Fundamental Strategy MSCI EM
Annual growth 12.66% 8.72%
Annualized volatility 18.4% 20.1%
Sharpe Ratio 0.6 0.3
Max. drawdown -49.9% -65.2%
Fundamental Strategy Europe STOXX 600
Annual growth 6.17% 3.18%
Annualized volatility 22.1% 20.7%
Sharpe Ratio 0.2 0.1
Max. drawdown -48.6% -58.7% Source: Bloomberg LP, I/B/E/S Global Aggregates, STOXX, MSCI, Deutsche AM Calculations. Data from July 2000 to November 2016 for World, December 2000 to November 2016 for EM and December 2002 to November 2016 for Europe. For Europe Consumer Services and Consumer Goods Sector data is from October 2004 to November 2016. So effectively the Europe Strategy runs on 8 sectors in the first 2 years. The performance data is shown for illustrative purpose only and is based on the retrospective simulation of the strategies. The performance has been calculated on the basis of historical performances of each sector index net total return in USD (EUR for Europe). The performance is calculated gross of any replication costs but net of 20bps transaction costs excluding any applicable tax. Risk arising from assets being traded in foreign currencies is not hedged here. Past performance is not indicative of future performance.
50
100
150
200
250
Jan 01 Jan 03 Jan 05 Jan 07 Jan 09 Jan 11 Jan 13 Jan 15
Fundamental Strategy MSCI World Index
0100200300400500600700800900
Dec 00 Dec 02 Dec 04 Dec 06 Dec 08 Dec 10 Dec 12 Dec 14Fundamental Strategy MSCI Emerging Markets
50
100
150
200
250
Mar 06 Mar 08 Mar 10 Mar 12 Mar 14 Mar 16Fundamental Strategy STOXX Europe 600 Index
Sector Rotation: a multi-factor perspective
Marketing Material Sector Rotation: a multi-factor perspective | January 2017 23
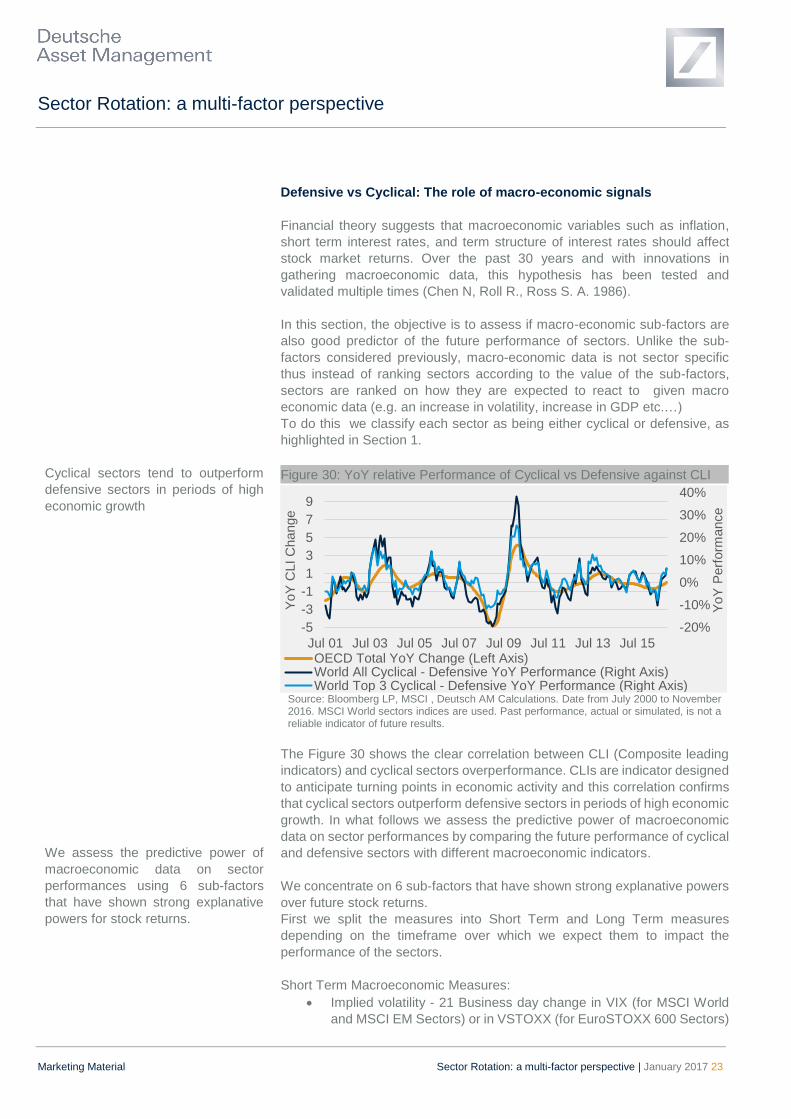
Cyclical sectors tend to outperform
defensive sectors in periods of high
economic growth
We assess the predictive power of
macroeconomic data on sector
performances using 6 sub-factors
that have shown strong explanative
powers for stock returns.
Defensive vs Cyclical: The role of macro-economic signals
Financial theory suggests that macroeconomic variables such as inflation,
short term interest rates, and term structure of interest rates should affect
stock market returns. Over the past 30 years and with innovations in
gathering macroeconomic data, this hypothesis has been tested and
validated multiple times (Chen N, Roll R., Ross S. A. 1986).
In this section, the objective is to assess if macro-economic sub-factors are
also good predictor of the future performance of sectors. Unlike the sub-
factors considered previously, macro-economic data is not sector specific
thus instead of ranking sectors according to the value of the sub-factors,
sectors are ranked on how they are expected to react to given macro
economic data (e.g. an increase in volatility, increase in GDP etc.…)
To do this we classify each sector as being either cyclical or defensive, as
highlighted in Section 1.
Figure 30: YoY relative Performance of Cyclical vs Defensive against CLI
Source: Bloomberg LP, MSCI , Deutsch AM Calculations. Date from July 2000 to November 2016. MSCI World sectors indices are used. Past performance, actual or simulated, is not a reliable indicator of future results.
The Figure 30 shows the clear correlation between CLI (Composite leading
indicators) and cyclical sectors overperformance. CLIs are indicator designed
to anticipate turning points in economic activity and this correlation confirms
that cyclical sectors outperform defensive sectors in periods of high economic
growth. In what follows we assess the predictive power of macroeconomic
data on sector performances by comparing the future performance of cyclical
and defensive sectors with different macroeconomic indicators.
We concentrate on 6 sub-factors that have shown strong explanative powers
over future stock returns.
First we split the measures into Short Term and Long Term measures
depending on the timeframe over which we expect them to impact the
performance of the sectors.
Short Term Macroeconomic Measures:
Implied volatility - 21 Business day change in VIX (for MSCI World
and MSCI EM Sectors) or in VSTOXX (for EuroSTOXX 600 Sectors)
-20%
-10%
0%
10%
20%
30%
40%
-5
-3
-1
1
3
5
7
9
Jul 01 Jul 03 Jul 05 Jul 07 Jul 09 Jul 11 Jul 13 Jul 15
YoY
Perf
orm
ance
YoY
CLI C
hange
OECD Total YoY Change (Left Axis)World All Cyclical - Defensive YoY Performance (Right Axis)World Top 3 Cyclical - Defensive YoY Performance (Right Axis)

Sector Rotation: a multi-factor perspective
Marketing Material Sector Rotation: a multi-factor perspective | January 2017 24
Credit Default Swap levels - 21 Business day change in an Equal
Weight Basket of 125 CDS defined as the Markit CDX North America
Investment Grade Index (for MSCI World and MSCI EM Sectors) and
in an Equal Weight Basket of 125 CDS defined as the Markit iTraxx
Europe Investment Grade Index (for EuroSTOXX 600 Sectors)
Term Structure - 21 Business day change in the difference between
the 10Y and 2Y government bond rate in USD (for MSCI World and
MSCI EM Sectors) and in EUR (for EuroSTOXX 600 Sectors)
Long Term Macroeconomic Sub-Factors:
GDP - the US Gross Domestic Product Seasonality Adjusted Quarter
on Quarter Change published by the Bureau of Economic Analysis
(for MSCI World and MSCI EM Sectors) and Euro Area Gross
Domestic Product Chained 2010 Prices QoQ published by Eurostat
(for EuroSTOXX 600 Sectors)
Inflation - the monthly change in US CPI urban consumer non
Seasonability adjusted (for MSCI World and MSCI EM Sectors) and
the Euro Area Harmonized index of consumer prices (for
EuroSTOXX 600 Sectors)
Leading Short Term Interest Rates -. changes in Fed Funds Target
Rate (for MSCI World and MSCI EM Sectors) and the short term
EUR rate (for EuroSTOXX 600 Sectors)
Considering the Short Term Macroeconomic Sub-Factors first, we calculate
a Historical Hit Ratio as defined previously. For each sub-factor, we calculate
the historical Z Score over the last 5 years (1Y for CDS due to a lack of
historical data). For each sector at the end of each month, the Z Score is
compared to the performance over the next 1 month (12 months for Term
Structure). Our expectation is that for cyclical sectors, a strong positive
change in VIX would be a negative signal (similarly for CDS and Term
Structure) and a positive signal for defensive sectors. Z scores between -0.5
and 0.5 are not considered in order to remove from the dataset low
significance macroeconomic events i.e. where the measure is not considered
to move enough.
The hit ratio is the ratio between the number of month-end historical
observations where the performance of the actual sector over the following 1
month (12 months for Term Structure) is in line with expectations, and the
total number of observations.
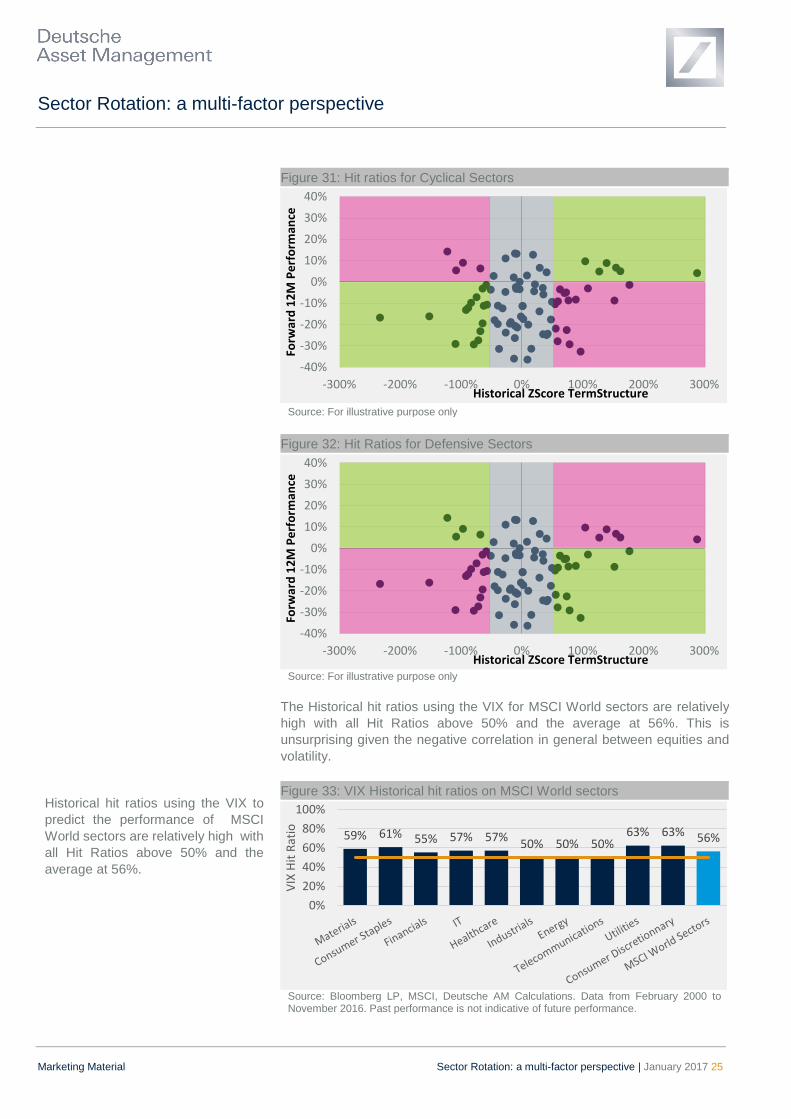
Figure 31 illustrates the hit ratio.
We consider that a hit ratio above 50% indicates a significant relationship
between the factor and the resulting relative performance.
Sector Rotation: a multi-factor perspective
Marketing Material Sector Rotation: a multi-factor perspective | January 2017 25
Historical hit ratios using the VIX to
predict the performance of MSCI
World sectors are relatively high with
all Hit Ratios above 50% and the
average at 56%.
Figure 31: Hit ratios for Cyclical Sectors
Source: For illustrative purpose only
Figure 32: Hit Ratios for Defensive Sectors
Source: For illustrative purpose only
The Historical hit ratios using the VIX for MSCI World sectors are relatively
high with all Hit Ratios above 50% and the average at 56%. This is
unsurprising given the negative correlation in general between equities and
volatility.
Figure 33: VIX Historical hit ratios on MSCI World sectors
Source: Bloomberg LP, MSCI, Deutsche AM Calculations. Data from February 2000 to November 2016. Past performance is not indicative of future performance.
-40%
-30%
-20%
-10%
0%
10%
20%
30%
40%
-300% -200% -100% 0% 100% 200% 300%
Forw
ard
12
M P
erf
orm
ance
Historical ZScore TermStructure
-40%
-30%
-20%
-10%
0%
10%
20%
30%
40%
-300% -200% -100% 0% 100% 200% 300%
Forw
ard
12
M P
erf
orm
ance
Historical ZScore TermStructure
59% 61% 55% 57% 57%50% 50% 50%
63% 63% 56%
0%
20%
40%
60%
80%
100%
VIX
Hit
Rat
io
Sector Rotation: a multi-factor perspective
Marketing Material Sector Rotation: a multi-factor perspective | January 2017 26
Results are reasonablystrong across
the board for Short Term Macro
Economic sub -factors
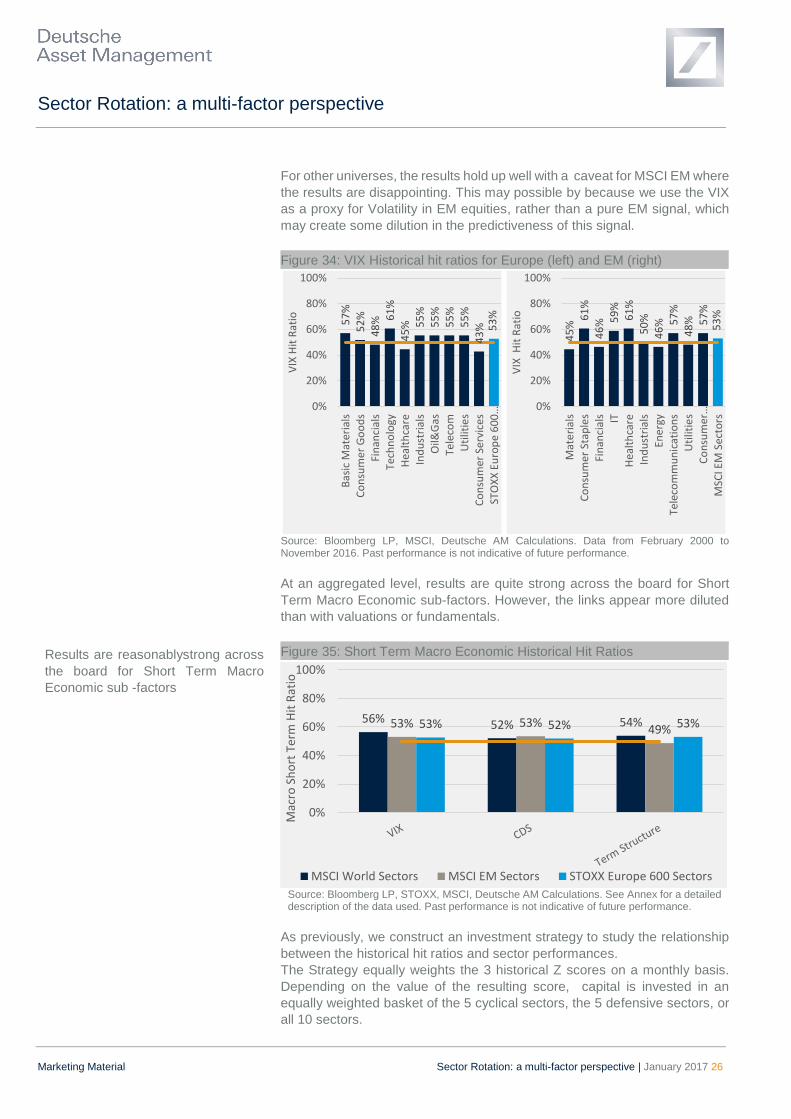
For other universes, the results hold up well with a caveat for MSCI EM where
the results are disappointing. This may possible by because we use the VIX
as a proxy for Volatility in EM equities, rather than a pure EM signal, which
may create some dilution in the predictiveness of this signal.
Figure 34: VIX Historical hit ratios for Europe (left) and EM (right)
Source: Bloomberg LP, MSCI, Deutsche AM Calculations. Data from February 2000 to November 2016. Past performance is not indicative of future performance.
At an aggregated level, results are quite strong across the board for Short
Term Macro Economic sub-factors. However, the links appear more diluted
than with valuations or fundamentals.
Figure 35: Short Term Macro Economic Historical Hit Ratios
Source: Bloomberg LP, STOXX, MSCI, Deutsche AM Calculations. See Annex for a detailed description of the data used. Past performance is not indicative of future performance.
As previously, we construct an investment strategy to study the relationship
between the historical hit ratios and sector performances.
The Strategy equally weights the 3 historical Z scores on a monthly basis.
Depending on the value of the resulting score, capital is invested in an
equally weighted basket of the 5 cyclical sectors, the 5 defensive sectors, or
all 10 sectors.
57
%5
2%
48
% 61
%4
5% 5
5%
55
%5
5%
55
%4
3% 5
3%
0%
20%
40%
60%
80%
100%
Bas
ic M
ater
ials
Co
nsu
mer
Go
od
sFi
nan
cial
sTe
chn
olo
gyH
ealt
hca
reIn
du
stri
als
Oil&
Gas
Tele
com
Uti
litie
sC
on
sum
er S
ervi
ces
STO
XX
Eu
rop
e 6
00
…
VIX
Hit
Rat
io
45
%6
1%
46
% 59
%6
1%
50
%4
6% 5
7%
48
% 57
%5
3%
0%
20%
40%
60%
80%
100%
Mat
eri
als
Co
nsu
mer
Sta
ple
sFi
nan
cial
s ITH
ealt
hca
reIn
du
stri
als
Ener
gyTe
leco
mm
un
icat
ion
sU
tilit
ies
Co
nsu
mer
…M
SCI E
M S
ecto
rs
VIX
Hit
Rat
io
56% 52% 54%53% 53%49%53% 52% 53%
0%
20%
40%
60%
80%
100%
Mac
ro S
ho
rt T
erm
Hit
Rat
io
MSCI World Sectors MSCI EM Sectors STOXX Europe 600 Sectors
Sector Rotation: a multi-factor perspective
Marketing Material Sector Rotation: a multi-factor perspective | January 2017 27
The strategy based on Short Term
Macroeconomic Factors has
delivered positive outperformance
over the period.
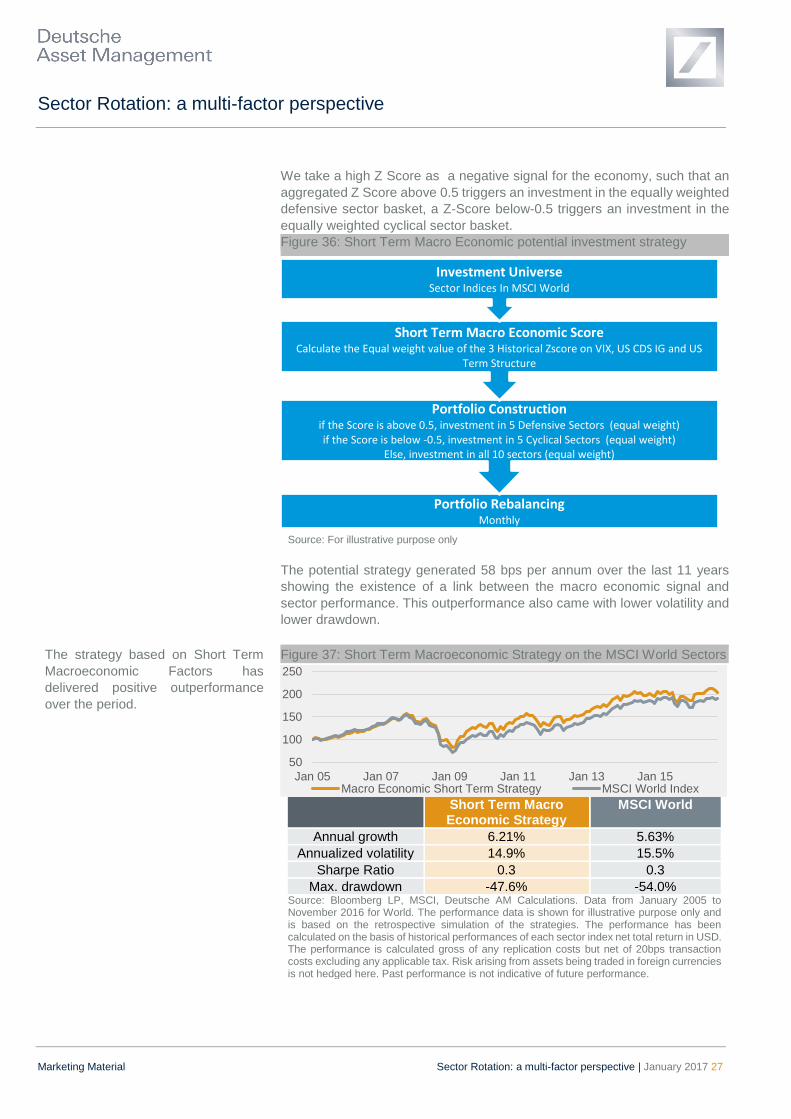
We take a high Z Score as a negative signal for the economy, such that an
aggregated Z Score above 0.5 triggers an investment in the equally weighted
defensive sector basket, a Z-Score below-0.5 triggers an investment in the
equally weighted cyclical sector basket.
Figure 36: Short Term Macro Economic potential investment strategy
Source: For illustrative purpose only
The potential strategy generated 58 bps per annum over the last 11 years
showing the existence of a link between the macro economic signal and
sector performance. This outperformance also came with lower volatility and
lower drawdown.
Figure 37: Short Term Macroeconomic Strategy on the MSCI World Sectors
Short Term Macro
Economic Strategy MSCI World
Annual growth 6.21% 5.63%
Annualized volatility 14.9% 15.5%
Sharpe Ratio 0.3 0.3
Max. drawdown -47.6% -54.0% Source: Bloomberg LP, MSCI, Deutsche AM Calculations. Data from January 2005 to November 2016 for World. The performance data is shown for illustrative purpose only and is based on the retrospective simulation of the strategies. The performance has been calculated on the basis of historical performances of each sector index net total return in USD. The performance is calculated gross of any replication costs but net of 20bps transaction costs excluding any applicable tax. Risk arising from assets being traded in foreign currencies is not hedged here. Past performance is not indicative of future performance.
Portfolio RebalancingMonthly
Portfolio Constructionif the Score is above 0.5, investment in 5 Defensive Sectors (equal weight)if the Score is below -0.5, investment in 5 Cyclical Sectors (equal weight)
Else, investment in all 10 sectors (equal weight)
Short Term Macro Economic ScoreCalculate the Equal weight value of the 3 Historical Zscore on VIX, US CDS IG and US
Term Structure
Investment UniverseSector Indices In MSCI World
50
100
150
200
250
Jan 05 Jan 07 Jan 09 Jan 11 Jan 13 Jan 15Macro Economic Short Term Strategy MSCI World Index

Sector Rotation: a multi-factor perspective
Marketing Material Sector Rotation: a multi-factor perspective | January 2017 28
For the Long Term Macroeconomic Sub-Factors, we calculate an absolute
Hit Ratio for GDP and Leading Short Term Interest Rates. For Inflation, we
use a 5 year Historical Hit Ratio (with a 0.5/-0.5 threshold) similar to the one
used for the VIX and Term Structures.
For each sector, at the end of each month, the Score (absolute or historical)
is compared to the performance of the sector over the next 18 months. The
Hit ratio is again the ratio between the number of month-end historical
observations where the performance of the sector over the next 18 months is
in line with expectations, divided by the total number of observations.
For Cyclical Sectors, intuitively, positive GDP changes are positive signals for
future performance.
As illustrated in Figure 38, interest rate hike are detrimental to the
performance of defensive sectors. Figure 38 shows the average excess
return duration – defined as the price return of the sector minus the price
return of the universe, divided by the change in the 5y swap rate - for MSCI
World sectors. The average is taken over periods which experienced EUR
rate hikes, from July 2000 to December 2016.
Figure 38 : Average excess return duration of MSCI World sectors
‘Excess return duration’ is calculated as the price return of the sector minus the price return of the MSCI World over the period, divided by the change in the EUR 5y swap rate over the period. The bar chart shows the average excess return duration over the 14 periods of interest rate increases from Jul 2000 – Dec 2016. Source: Bloomberg, Deutsche Bank Asset Management Calculations. Data: July 2000 to December 2016. Past performance, actual or simulated, is not a reliable indicator of future results..
Inflation is a slightly different animal. One might expect that cyclical stocks
and inflation would be positively related. However, multiples empirical studies
(Jaffe and Mandelker (1976), Fama and Schwert (1977), Schwert (1981), and
Boudoukh and Richardson (1993)) suggest that the relationship is in fact
negative.
In what follows, for Cyclical Sectors an increase in inflation is considered to
be a negative signal.
-6
-4
-2
0
2
4
6
8
Ave
rag
e
Exce
ss R
etu
rn D
ura
tio
n*

Sector Rotation: a multi-factor perspective
Marketing Material Sector Rotation: a multi-factor perspective | January 2017 29
Results for interest rates and Inflation
are quite strong. However the results
on GDP are average.
Figure 39: Long Term Macro Economic hit ratios
Source: Bloomberg LP, STOXX, MSCI, Deutsche AM Calculations. See Annex for a detailed description of the data used. Past performance is not indicative of future performance.
Results for inflation are quite strong. However the results using GDP or short
term interest rates are pretty average.
Finally, we create 3 investment strategies (one per measure) using 5Y
Historical Z Scores . Depending on this score the portfolio invests in defensive
only, cyclical only, or all sectors. For GDP and short term interest rate,
positive signals translate into investment in cyclical sectors. For inflation on
the other hand, such signal translates into investment in defensive sectors.
Figure 40: GDP based potential investment strategy
Source: For illustrative purpose only
The performance of the GDP based potential investment strategy for MSCI
World sectors is quite strong generating 53bps per annum of outperformance
over MSCI World over the last 15 years.
52% 51%60%
43%50% 54%
39%47%
53%
0%
20%
40%
60%
80%
100%
Mac
ro L
on
g Te
rm H
it R
atio
MSCI World Sectors MSCI EM Sectors STOXX Europe 600 Sectors
Portfolio RebalancingQuaterly
Portfolio Constructionif the Score is above 0.5, investment in 5 Cyclical Sectors (equal weight)
if the Score is below -0.5, investment in 5 Defensive Sectors (equal weight)Else, investment in all 10 sectors (equal weight)
Inflation ScoreHistorical Z-Score of GDP QoQ
Investment UniverseSector Indices In MSCI World

Sector Rotation: a multi-factor perspective
Marketing Material Sector Rotation: a multi-factor perspective | January 2017 30
The performance of the GDP based
investment strategy for MSCI World
sectors is strong
The performance of the Short Term
Interest Rate strategy is very strong
Figure 41: GDP Strategy on the MSCI World Sectors
GDP Strategy MSCI World
Annual growth 5.54% 5.01%
Annualized volatility 16.0% 16.3%
Sharpe Ratio 0.2 0.2
Max. drawdown -56.2% -57.8% Source: Bloomberg LP, MSCI, Deutsche AM Calculations. Data from June 2001 to November 2016 for World. The performance data is shown for illustrative purpose only and is based on the retrospective simulation of the strategies. The performance has been calculated on the basis of historical performances of each sector index net total return in USD. The performance is calculated gross of any replication costs but net of 20bps transaction costs excluding any applicable tax. Risk arising from assets being traded in foreign currencies is not hedged here. Past performance is not indicative of future performance.
The performance of the potential Short Term Interest Rate strategy is very
strong (and the strongest of all the macro economic strategies) with an
excess return of 2.23% per annum combined with very strong reductions in
volatility and Max drawdown. This potential strategy benefits from the strong
link between monetary policy and the economy.
Figure 42: Interest Rate Strategy on the MSCI World Sectors
Interest Rate Strategy MSCI World
Annual growth 7.01% 5.01%
Annualized volatility 15.4% 16.3%
Sharpe Ratio 0.3 0.2
Max. drawdown -44.0% -57.8% Source: Bloomberg LP, MSCI, Deutsche AM Calculations. Data from June 2001 to November 2016 for World. The performance data is shown for illustrative purpose only and is based on the retrospective simulation of the strategies. The performance has been calculated on the basis of historical performances of each sector index net total return in USD. The performance is calculated gross of any replication costs but net of 20bps transaction costs excluding any applicable tax. Risk arising from assets being traded in foreign currencies is not hedged here. Past performance is not indicative of future performance.
The performance of the inflation-based strategy is less strong. As previously,
there is disagreement over the link between equity performance and changes
in inflation, and that materialises in the below graph.
50
100
150
200
250
Jun 01 Jun 03 Jun 05 Jun 07 Jun 09 Jun 11 Jun 13 Jun 15GDP Strategy MSCI World Index
50
100
150
200
250
300
Jun 01 Jun 03 Jun 05 Jun 07 Jun 09 Jun 11 Jun 13 Jun 15Interest Rate Strategy MSCI World Index

Sector Rotation: a multi-factor perspective
Marketing Material Sector Rotation: a multi-factor perspective | January 2017 31
The performance of the inflation
based strategy is not insightful
Figure 43: Inflation on the MSCI World Sectors
Inflation Strategy MSCI World
Annual growth 5.28% 5.01%
Annualized volatility 16.0% 16.2%
Sharpe Ratio 0.2 0.2
Max. drawdown -47.5% -57.8% Source: Bloomberg LP, MSCI, Deutsche AM Calculations. Data from June 2001 to November 2016 for World. The performance data is shown for illustrative purpose only and is based on the retrospective simulation of the strategies. The performance has been calculated on the basis of historical performances of each sector index net total return in USD. The performance is calculated gross of any replication costs but net of 20bps transaction costs excluding any applicable tax. Risk arising from assets being traded in foreign currencies is not hedged here. Past performance is not indicative of future performance.
Overall, most of the measures considered have exhibited decent to good
predictive powers regarding future sector performances and can therefore be
considered as inputs into a framework for evaluating sector rotation.
The sector assessment framework: Monthly
insights on sector investing
Following the extensive statistical analysis above, we introduce a report that
aims to provide insights into Sector Investing and rotation, and will be
updated on a monthly basis.
For each universe considered (World equities, EM equities, etc.) the report
comprises a Cross Sectional Page summarising information on a cross
sector view, and 10 Sector-focused one pagers that will detail all relevant
data for each sector individually.
The Cross Sectional Page will contain:
Scorecard
Risk/Return – Short and Long Term performance figures and Risk
Statistics
Macro-Economic Overview – Summary of current valuations for the
6 macro economic measures and their standings compared to their
historical values
Valuations – Cross Sector comparison of P/E and Dividend Yield
Fundamental – Cross Sector comparison of Sales and Cash Flow
Growth
Momentum - Cross Sector comparison of Momentum Scores
Sentiment - Cross Sector comparison of Sentiment Scores
50
100
150
200
250
Jun 01 Jun 03 Jun 05 Jun 07 Jun 09 Jun 11 Jun 13 Jun 15Inflation Strategy MSCI World Index

Sector Rotation: a multi-factor perspective
Marketing Material Sector Rotation: a multi-factor perspective | January 2017 32
Figure 44: Valuation and Fundamentals in the Cross Sectional Report
The Sector-specific one pagers are split into 6 sections:
Scorecard – A summary of the strength of the signal for each sector
and each category of sub-factors.Risk/Returns/Holdings – Short and
Long Term Performance numbers and Risk Statistics as well as main
holdings
Valuations – 5 valuation measurements and historical comparison
on an absolute basis but also relative versus the benchmark
Fundamental – 4 fundamental sub-factors values and historical
comparison on an absolute basis but also relative versus the
benchmark
Momentum
Sentiment
Figure 45: Valuation in the Sector Specific one pager
The scorecard also aims to summarize how the sectors ares positioned
according to each of the 6 factors
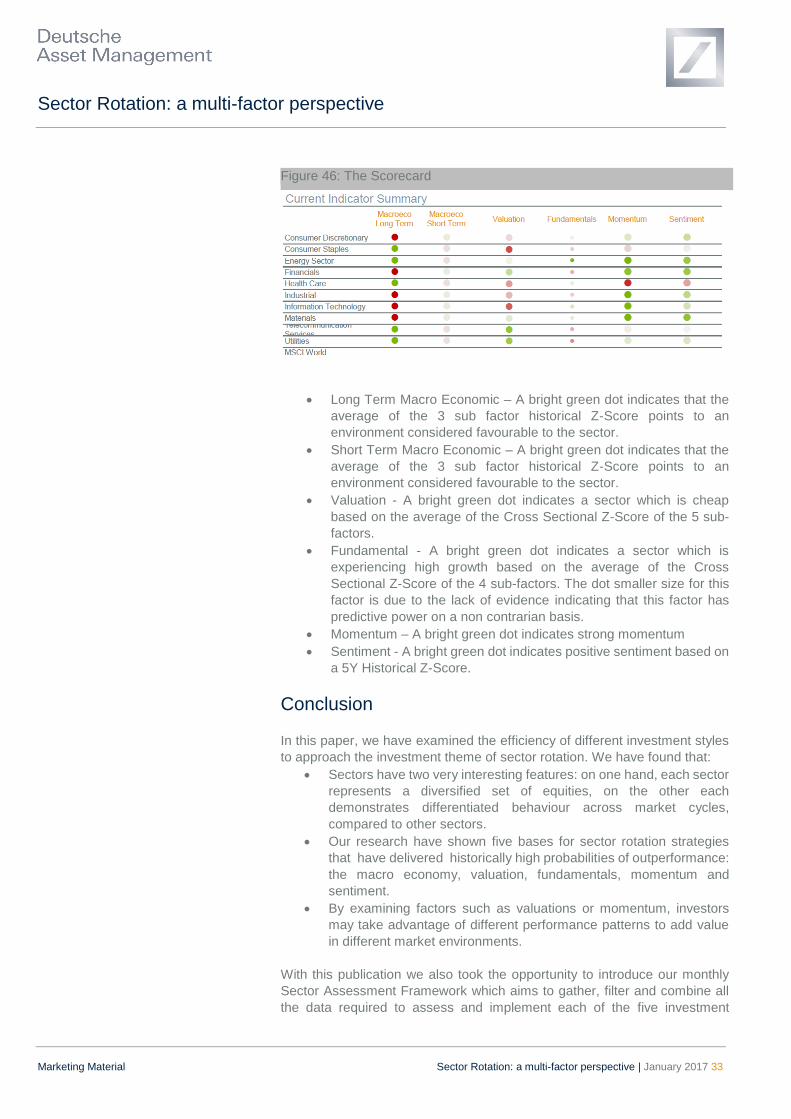
Sector Rotation: a multi-factor perspective
Marketing Material Sector Rotation: a multi-factor perspective | January 2017 33
Figure 46: The Scorecard
Long Term Macro Economic – A bright green dot indicates that the
average of the 3 sub factor historical Z-Score points to an
environment considered favourable to the sector.
Short Term Macro Economic – A bright green dot indicates that the
average of the 3 sub factor historical Z-Score points to an
environment considered favourable to the sector.
Valuation - A bright green dot indicates a sector which is cheap
based on the average of the Cross Sectional Z-Score of the 5 sub-
factors.
Fundamental - A bright green dot indicates a sector which is
experiencing high growth based on the average of the Cross
Sectional Z-Score of the 4 sub-factors. The dot smaller size for this
factor is due to the lack of evidence indicating that this factor has
predictive power on a non contrarian basis.
Momentum – A bright green dot indicates strong momentum
Sentiment - A bright green dot indicates positive sentiment based on
a 5Y Historical Z-Score.
Conclusion
In this paper, we have examined the efficiency of different investment styles
to approach the investment theme of sector rotation. We have found that:
Sectors have two very interesting features: on one hand, each sector
represents a diversified set of equities, on the other each
demonstrates differentiated behaviour across market cycles,
compared to other sectors.
Our research have shown five bases for sector rotation strategies
that have delivered historically high probabilities of outperformance:
the macro economy, valuation, fundamentals, momentum and
sentiment.
By examining factors such as valuations or momentum, investors
may take advantage of different performance patterns to add value
in different market environments.
With this publication we also took the opportunity to introduce our monthly
Sector Assessment Framework which aims to gather, filter and combine all
the data required to assess and implement each of the five investment

Sector Rotation: a multi-factor perspective
Marketing Material Sector Rotation: a multi-factor perspective | January 2017 34
strategies mentioned above (Macro Economy, Valuation, Fundamental,
Momentum and Sentiment).
Sector Rotation: a multi-factor perspective
Marketing Material Sector Rotation: a multi-factor perspective | January 2017 35
Appendix
Detailed description of all hit ratios
Momentum
Absolute Hit Ratio
o Data Source: Bloomberg
o Field: PX Last
o Score: 11 Months Performance 1 Month Removed
o Forward Performance Period: 3M
o Hit Ratio Success Determination: Positive (negative) Score should indicate positive (negative) future performance
o World Data Observation Period: Jul 2000 to Nov 2016
o EM Data Observation Period: Dec 2000 to Nov 2016
o Europe Data Observation Period: Jul 2000 to Nov 2016
(Sept 2004 for Consumer Goods and Consumer Services)
Cross Sectional Hit Ratio
o Data Source: Bloomberg
o Field: PX Last
o Score: Cross Sectional Z Score of 11 Months Performance
1 Month Removed
o Forward Performance Period: 3M
o Hit Ratio Success Determination: High (low) Score should
indicate positive (negative) future performance
o World Data Observation Period: Jul 2000 to Nov 2016
o EM Data Observation Period: Dec 2000 to Nov 2016
o Europe Data Observation Period: Jul 2000 to Nov 2016
(Sept 2004 for Consumer Goods and Consumer Services)
Sentiment
Cross Sectional Hit Ratio
o Data Source: I/B/E/S Aggregates, Bloomberg LP
o Field: A12UPE, A12DNE, A12NE
o Score: Cross Sectional Z-Score of (A12UPE –
A12DNE)/A12NE
o Forward Performance Period: 12M
o Hit Ratio Success Determination: High Score should
indicate positive future performance
o World Data Observation Period: Dec 2000 to Nov 2016
o EM Data Observation Period: Dec 2000 to Nov 2016
o Europe Data Observation Period: Dec 2002 to Nov 2016
(Oct 2004 for Consumer Goods and Consumer Services)
Historical Hit Ratio
o Data Source: I/B/E/S Aggregates, Bloomberg LP
o Field: A12UPE, A12DNE, A12NE
o Score: 5Y Historical Z-Score of (A12UPE –
A12DNE)/A12NE
o Forward Performance Period: 12M
o Hit Ratio Success Determination: High Score should
indicate positive future performance
o World Data Observation Period: Dec1995 to Nov 2016

Sector Rotation: a multi-factor perspective
Marketing Material Sector Rotation: a multi-factor perspective | January 2017 36
o EM Data Observation Period: Dec1995 to Nov 2016
o Europe Data Observation Period: Nov 2002 to Nov 2016
(Oct 2004 for Consumer Goods and Consumer Services)
Valuation
P/E Cross Sectional Hit Ratio
o Data Source: I/B/E/S Aggregates, Bloomberg LP
o Field: A12PE
o Score: Cross Sectional Z-Score
o Forward Performance Period: 12M
o Hit Ratio Success Determination: Low Score should
indicate positive future performance
o World Data Observation Period: Dec 2000 to Nov 2016
o EM Data Observation Period: Dec2000 to Nov 2016
o Europe Data Observation Period: Dec 2002 to Nov 2016
(Nov, 2003 for Telecom, Oct 2004 for Consumer Goods and
Consumer Services)
P/E Historical Hit Ratio
o Data Source: I/B/E/S Aggregates, Bloomberg LP
o Field: A12PE
o Score: 5Y Historical Z-Score
o Forward Performance Period: 12M
o Hit Ratio Success Determination: Low Score should
indicate positive future performance
o World Data Observation Period: Dec1995 to Nov 2016
o EM Data Observation Period: Dec1995 to Nov 2016
o Europe Data Observation Period: Nov 2002 to Nov 2016
(Nov, 2003 for Telecom, Oct 2004 for Consumer Goods and
Consumer Services)
P/B Cross Sectional Hit Ratio
o Data Source: I/B/E/S Aggregates, Bloomberg LP
o Field: AB12PB
o Score: Cross Sectional Z-Score
o Forward Performance Period: 12M
o Hit Ratio Success Determination: Low Score should
indicate positive future performance
o World Data Observation Period: Jan 2004 to Nov 2016
o EM Data Observation Period: Jan 2004 to Nov 2016
o Europe Data Observation Period: Jan 2004 to Nov 2016
(Oct 2004 for Consumer Goods and Consumer Services)
P/B Historical Hit Ratio
o Data Source: I/B/E/S Aggregates, Bloomberg LP
o Field: AB12PB
o Score: 5Y Historical Z-Score
o Forward Performance Period: 12M
o Hit Ratio Success Determination: Low Score should
indicate positive future performance
o World Data Observation Period: Jan 2004 to Nov 2016
o EM Data Observation Period: Jan 2004 to Nov 2016
o Europe Data Observation Period: Jan 2004 to Nov 2016
(Oct 2004 for Consumer Goods and Consumer Services)
P/CF Cross Sectional Hit Ratio

Sector Rotation: a multi-factor perspective
Marketing Material Sector Rotation: a multi-factor perspective | January 2017 37
o Data Source: I/B/E/S Aggregates, Bloomberg LP
o Field: AB12PC
o Score: Cross Sectional Z-Score
o Forward Performance Period: 12M
o Hit Ratio Success Determination: Low Score should
indicate positive future performance
o World Data Observation Period: Jan 2004 to Nov 2016
o EM Data Observation Period: Jan 2004 to Nov 2016
o Europe Data Observation Period: Jan 2004 to Nov 2016
(Oct 2004 for Consumer Goods and Consumer Services)
P/CF Historical Hit Ratio
o Data Source: I/B/E/S Aggregates, Bloomberg LP
o Field: AB12PC
o Score: 5Y Historical Z-Score
o Forward Performance Period: 12M
o Hit Ratio Success Determination: Low Score should
indicate positive future performance
o World Data Observation Period: Jan 2004 to Nov 2016
o EM Data Observation Period: Jan 2004 to Nov 2016
o Europe Data Observation Period: Jan 2004 to Nov 2016
(Oct 2004 for Consumer Goods and Consumer Services)
P/EBIT Cross Sectional Hit Ratio
o Data Source: I/B/E/S Aggregates, Bloomberg LP
o Field: AT12PT
o Score: Cross Sectional Z-Score
o Forward Performance Period: 12M
o Hit Ratio Success Determination: Low Score should
indicate positive future performance
o World Data Observation Period: Jan 2004 to Nov 2016
o EM Data Observation Period: Jan 2004 to Nov 2016
o Europe Data Observation Period: Jan 2004 to Nov 2016
(Oct 2004 for Consumer Goods and Consumer Services)
P/EBIT Historical Hit Ratio
o Data Source: I/B/E/S Aggregates, Bloomberg LP
o Field: AT12PT
o Score: 5Y Historical Z-Score
o Forward Performance Period: 12M
o Hit Ratio Success Determination: Low Score should
indicate positive future performance
o World Data Observation Period: Jan 2004 to Nov 2016
o EM Data Observation Period: Jan 2004 to Nov 2016
o Europe Data Observation Period: Jan 2004 to Nov 2016
(Oct 2004 for Consumer Goods and Consumer Services)
Dividend Yield Cross Sectional Hit Ratio
o Data Source: I/B/E/S Aggregates, Bloomberg LP
o Field: ADVYLD
o Score: Cross Sectional Z-Score
o Forward Performance Period: 12M
o Hit Ratio Success Determination: High Score should
indicate positive future performance
o World Data Observation Period: Dec 2000 to Nov 2016
o EM Data Observation Period: Dec 2000 to Nov 2016

Sector Rotation: a multi-factor perspective
Marketing Material Sector Rotation: a multi-factor perspective | January 2017 38
o Europe Data Observation Period: Nov 2002 to Nov 2016
(Oct 2004 for Consumer Goods and Consumer Services)
Dividend Yield Historical Hit Ratio
o Data Source: I/B/E/S Aggregates, Bloomberg LP
o Field: ADVYLD
o Score: 5Y Historical Z-Score
o Forward Performance Period: 12M
o Hit Ratio Success Determination: High Score should
indicate positive future performance
o World Data Observation Period: Dec 1995 to Nov 2016
o EM Data Observation Period: Dec 1995 to Nov 2016
o Europe Data Observation Period: Nov 2002 to Nov 2016
(Oct 2004 for Consumer Goods and Consumer Services)
Fundamental
EPS Growth Cross Sectional Hit Ratio
o Data Source: I/B/E/S Aggregates, Bloomberg LP
o Field: A12GRO
o Score: Cross Sectional Z-Score
o Forward Performance Period: 12M
o Hit Ratio Success Determination: High Score should
indicate positive future performance
o World Data Observation Period: Dec 2000 to Nov 2016
o EM Data Observation Period: Dec2000 to Nov 2016
o Europe Data Observation Period: Dec 2002 to Nov 2016
(Sept 2004 for Telecom, Oct 2004 for Consumer Goods and
Consumer Services)
EPS Growth Historical Hit Ratio
o Data Source: I/B/E/S Aggregates, Bloomberg LP
o Field: A12GRO
o Score: 5Y Historical Z-Score
o Forward Performance Period: 12M
o Hit Ratio Success Determination: Low Score should
indicate positive future performance
o World Data Observation Period: Dec1995 to Nov 2016
o EM Data Observation Period: Dec1995 to Nov 2016
o Europe Data Observation Period: Nov 2002 to Nov 2016
(Sept 2004 for Telecom, Oct 2004 for Consumer Goods and
Consumer Services)
BPS Growth Cross Sectional Hit Ratio
o Data Source: I/B/E/S Aggregates, Bloomberg LP
o Field: AB12GR
o Score: Cross Sectional Z-Score
o Forward Performance Period: 12M
o Hit Ratio Success Determination: High Score should
indicate positive future performance
o World Data Observation Period: Jan 2004 to Nov 2016
o EM Data Observation Period: Jan 2004 to Nov 2016
o Europe Data Observation Period: Jan 2004 to Nov 2016
(2004 for Consumer Goods and Consumer Services)
BPS Growth Historical Hit Ratio
o Data Source: I/B/E/S Aggregates, Bloomberg LP

Sector Rotation: a multi-factor perspective
Marketing Material Sector Rotation: a multi-factor perspective | January 2017 39
o Field: AB12GR
o Score: 5Y Historical Z-Score
o Forward Performance Period: 12M
o Hit Ratio Success Determination: Low Score should
indicate positive future performance
o World Data Observation Period: Jan 2004 to Nov 2016
o EM Data Observation Period: Jan 2004 to Nov 2016
o Europe Data Observation Period: Jan 2004 to Nov 2016
(2004 for Consumer Goods and Consumer Services)
CPS Growth Cross Sectional Hit Ratio
o Data Source: I/B/E/S Aggregates, Bloomberg LP
o Field: AC12GR
o Score: Cross Sectional Z-Score
o Forward Performance Period: 12M
o Hit Ratio Success Determination: High Score should
indicate positive future performance
o World Data Observation Period: Jan 2004 to Nov 2016
o EM Data Observation Period: Jan 2004 to Nov 2016
o Europe Data Observation Period: Jan 2004 to Nov 2016
(2004 for Consumer Goods and Consumer Services)
CPS Growth Historical Hit Ratio
o Data Source: I/B/E/S Aggregates, Bloomberg LP
o Field: AC12GR
o Score: 5Y Historical Z-Score
o Forward Performance Period: 12M
o Hit Ratio Success Determination: Low Score should
indicate positive future performance
o World Data Observation Period: Jan 2004 to Nov 2016
o EM Data Observation Period: Jan 2004 to Nov 2016
o Europe Data Observation Period: Jan 2004 to Nov 2016
(Oct 2004 for Consumer Goods and Consumer Services)
Sales Growth Cross Sectional Hit Ratio
o Data Source: I/B/E/S Aggregates, Bloomberg LP
o Field: AS12GR
o Score: Cross Sectional Z-Score
o Forward Performance Period: 12M
o Hit Ratio Success Determination: High Score should
indicate positive future performance
o World Data Observation Period: Jan 2004 to Nov 2016
o EM Data Observation Period: Jan 2004 to Nov 2016
o Europe Data Observation Period: Jan 2004 to Nov 2016
(Oct 2004 for Consumer Goods and Consumer Services)
Sales Growth Historical Hit Ratio
o Data Source: I/B/E/S Aggregates, Bloomberg LP
o Field: AS12GR
o Score: 5Y Historical Z-Score
o Forward Performance Period: 12M
o Hit Ratio Success Determination: Low Score should
indicate positive future performance
o World Data Observation Period: Jan 2004 to Nov 2016
o EM Data Observation Period: Jan 2004 to Nov 2016

Sector Rotation: a multi-factor perspective
Marketing Material Sector Rotation: a multi-factor perspective | January 2017 40
o Europe Data Observation Period: Jan 2004 to Nov 2016
(Oct 2004 for Consumer Goods and Consumer Services)
Short Term Macro Economic
VIX Historical Hit Ratio
o Data Source: Bloomberg LP
o Field: VIX Index (World, EM) and V2X Index (Europe)
o Score: 5Y Historical Z-Score of 21 Business Days Change
o Forward Performance Period: 1M
o Hit Ratio Success Determination: Z-Score below -0.5
should indicate positive future performance. Z-Score above
0.5 should indicate negative future performance (For cyclical
sectors )
o World/EM Data Observation Period: February 2000 to Nov
2016
o Europe Data Observation Period: Jan 2000 to Nov 2016
CDS Historical Hit Ratio
o Data Source: Bloomberg LP
o Field: CDX IG CDSI GEN 5Y Index (World, EM) and ITRX
EUR CDSI GEN 5Y Index (Europe)
o Score: 1Y Historical Z-Score of 21 Business Days Change
o Forward Performance Period: 1M
o Hit Ratio Success Determination: Z-Score below -0.5
should indicate positive future performance. Z-Score above
0.5 should indicate negative future performance (For cyclical
sectors )
o World/EM Data Observation Period: Jan 2000 to Nov 2016
o Europe Data Observation Period: Jul 2000 to Nov 2016
Term Structure Historical Hit Ratio
o Data Source: Bloomberg LP
o Field: GECU10YR Index/GECU2YR Index (World, EM) and
USGG10YR Index/ USGG10YR Index (Europe)
o Score: 5Y Historical Z-Score of 21 Business Days Change
o Forward Performance Period: 12M
o Hit Ratio Success Determination: Z-Score below -0.5
should indicate positive future performance. Z-Score above
0.5 should indicate negative future performance (For cyclical
sectors )
o World/EM Data Observation Period: Dec 1999 to Nov 2016
o Europe Data Observation Period: Nov 1999 to Nov 2016
Long Term Macro Economic
GDP Absolute Hit Ratio
o Data Source: Bloomberg LP
o Field: GDP CQOQ Index (World, EM) and EUGNEMUQ
Index (Europe)
o Score: 3M change in GDP
o Forward Performance Period: 18M
o Hit Ratio Success Determination: High Score is
considered postive for cyclical sectors
o World/EM Data Observation Period: Sept 2000 to Nov 2016
o Europe Data Observation Period: Nov 2001 to Nov 2016

Sector Rotation: a multi-factor perspective
Marketing Material Sector Rotation: a multi-factor perspective | January 2017 41
Short Term Interest Rate Absolute Hit Ratio
o Data Source: Bloomberg LP
o Field: FDTRFTRL Index, FDTR Index (World, EM) and
EURR002W Index (Europe)
o Score: 1M Change in IR
o Forward Performance Period: 18M
o Hit Ratio Success Determination: High Score is
considered positive for cyclical sectors
o World/EM Data Observation Period: Aug 2000 to Nov 2016
o Europe Data Observation Period: Feb 2000 to Nov 2016
Inflation Historical Hit Ratio
o Data Source: Bloomberg LP
o Field: CPI YOY Index (World, EM) and ECCPEMUY Index
(Europe)
o Score: 5Y Historical Z Score of 1M Changes
o Forward Performance Period: 18M
o Hit Ratio Success Determination: Low Score is
considered postive for cyclical sectors
o World/EM Data Observation Period: Oct 2002 to Nov 2016
o Europe Data Observation Period: April 1999 to Nov 2016
Detailed description of all investment strategies

Sector Rotation: a multi-factor perspective
Marketing Material Sector Rotation: a multi-factor perspective | January 2017 42
Bibliography
Baca, Sean P., Brian L. Garbe, and Richard A. Weiss. 2000. “The Rise of
Sector Effects in Major Equity Markets” Financial Analysts Journal
Block, Frank E. 1995. “A Study of the Price to Book Relationship.” Financial
Analysts Journal
Boudoukh J., Richardson M. 1993. “Stock Returns and Inflation: A Long
Horizon Perspective” American Economic Review
Chan, Louis K. C., Narasimhan Jegadesh, and Josef Lakonishok. 1996.
“Momentum Strategies”. The Journal of Finance
Chen N, Roll R., Ross S. A. 1986. “Economic Forces and the Stock Market”.
The Journal of Business
Denoiseux, Vincent, Pierre Debru et al. 2014. “Momentum investing with
Sector ETFs”. Deutsche Asset Management
Erdugan Riza 2012. “The Effect of Economic Factors on the Performance of
the Australian Stock Market”
Fama E.F, French K.R. 1992 “The Cross-section of Expected Stock Returns”
Fama E.F., Schwert G.W. 1973 “Risk, Return, and Equilibrium: Empirical
Tests“ Journal of Finance
Fisher, Kenneth L., and Meir Statman. 2000. “Investor Sentiment and Stock
Returns” Financial Analysts Journal
Jaffe J.F., Mandelker G. 1976. „The Fisher Effect for Risky Assets: An
Empirical Investigation“ of Finance
Jegadeesh, N., 1990, “Evidence of Predictable Behavior of Security Return,”
Journal of Finance
Jegadeesh, N., and S. Titman, 1993, “returns to Buying Winners and Selling
Losers: Implications for Stocck Market Efficiency”, Journal of Finance
Liu, Jing, Doron Nissim, and Jacob Thomas. 2007. “Is Cash Flow King in
Valuations?” Financial Analysts Journal
Raedler, Sebastian, Wolf von Rotberg, and Andreas Bruckner. 2015.
“European Equity Strategy, 2016 Sector Allocation” Deutsche Bank
Schwert G.W. 1981 “The Adjustment of Stock Prices to Information about
Inflation” Journal of Finance
Solt, Michael E., and Meir Statman. 1988. “How Useful is the Sentiment
Index?” Financial Analysts Journal

Sector Rotation: a multi-factor perspective
Marketing Material Sector Rotation: a multi-factor perspective | January 2017 43
Notes

Sector Rotation: a multi-factor perspective
Marketing Material Sector Rotation: a multi-factor perspective | January 2017 44
Notes

Sector Rotation: a multi-factor perspective
Marketing Material Sector Rotation: a multi-factor perspective | January 2017 45
Notes

Sector Rotation: a multi-factor perspective
Marketing Material Sector Rotation: a multi-factor perspective | January 2017 46
Disclaimer
Important information
This document has been issued and approved by Deutsche Bank AG London Branch. Deutsche Bank AG is authorised under German Banking Law (competent authority: European Central Bank) and, in the United Kingdom, by the Prudential Regulation Authority. It is subject to supervision by the European Central Bank and by BaFin, Germany’s Federal Financial Supervisory Authority, and is subject to limited regulation in the United Kingdom by the Prudential Regulation Authority and Financial Conduct Authority. Deutsche Bank AG is a joint stock corporation with limited liability incorporated in the Federal Republic of Germany, Local Court of Frankfurt am Main, HRB No. 30 000; Branch Registration in England and Wales BR000005 and Registered Address: Winchester House, 1 Great Winchester Street, London EC2N 2DB. This document is a “non-retail communication” within the meaning of the FCA's Rules and is directed only at persons satisfying the FCA’s client categorisation criteria for an eligible counterparty or a professional client. This document is not intended for and should not be relied upon by a retail client. Deutsche Asset & Wealth Management is the brand name for the asset and wealth management arm of Deutsche Bank AG. This document is intended for discussion purposes only and does not create any legally binding obligations on the part of Deutsche Bank AG and/or its affiliates (“DB”).This material was not produced, reviewed or edited by the Research Department, except where specific documents produced by the Research Department have been referenced and reproduced above. Without limitation, this document does not constitute an offer, an invitation to offer or a recommendation to enter into any transaction. When making an investment decision, you should rely solely on the final documentation relating to the transaction and not the summary contained herein. DB is not acting as your financial adviser or in any other fiduciary capacity in relation to this Paper. The transaction(s) or products(s) mentioned herein may not be appropriate for all investors and before entering into any transaction you should take steps to ensure that you fully understand the transaction and have made an independent assessment of the appropriateness of the transaction in the light of your own objectives and circumstances, including the possible risks and benefits of entering into such transaction. For general information regarding the nature and risks of the proposed transaction and types of financial instruments please go to https://www.db.com/en/content/Risk-Disclosures.htm. You should also consider seeking advice from your own advisers in making this assessment. If you decide to enter into a transaction with DB, you do so in reliance on your own judgment. The information contained in this document is based on material we believe to be reliable; however, we do not represent that it is accurate, current, complete, or error free. Assumptions, estimates and opinions contained in this document constitute our judgment as of the date of the document and are subject to change without notice. Any projections are based on a number of assumptions as to market conditions and there can be no guarantee that any projected results will be achieved. Past performance is not a guarantee of future results. Any opinions expressed herein may differ from the opinions expressed by other DB departments including the Research Department. DB may engage in transactions in a manner inconsistent with the views discussed herein. DB trades or may trade as principal in the instruments (or related derivatives), and may have proprietary positions in the instruments (or related derivatives) discussed herein. DB may make a market in the instruments (or related derivatives) discussed herein. You may not distribute this document, in whole or in part, without our express written permission. DB SPECIFICALLY DISCLAIMS ALL LIABILITY FOR ANY DIRECT, INDIRECT, CONSEQUENTIAL OR OTHER LOSSES OR DAMAGES INCLUDING LOSS OF PROFITS INCURRED BY YOU OR ANY THIRD PARTY THAT MAY ARISE FROM ANY RELIANCE ON THIS DOCUMENT OR FOR THE RELIABILITY, ACCURACY, COMPLETENESS OR TIMELINESS THEREOF. Deutsche Asset Management (Deutsche AM) represents the asset management activities conducted by Deutsche Bank AG or any of its subsidiaries. Clients will be provided Deutsche Asset Management products or services by one or more legal entities that will be identified to clients pursuant to the contracts, agreements, offering materials or other documentation relevant to such products or services. Deutsche Asset Management, through Deutsche Bank AG, its affiliated companies and its officers and employees (collectively “Deutsche Bank”) are communicating this document in good faith and on the following basis. This document has been prepared without consideration of the investment needs, objectives or financial circumstances of any investor. Before making an investment decision, investors need to consider, with or without the assistance of an investment adviser, whether the investments and strategies described or provided by Deutsche Bank, are appropriate, in light of their particular investment needs, objectives and financial circumstances. Furthermore, this document is for information/discussion purposes only and does not constitute an offer, recommendation or solicitation to conclude a transaction and should not be treated as giving investment advice. Deutsche Bank does not give tax or legal advice. Investors should seek advice from their own tax experts and lawyers, in considering investments and strategies suggested by Deutsche Bank. Investments with Deutsche Bank are not guaranteed, unless specified. Unless notified to the contrary in a particular case, investment instruments are not insured by the Federal Deposit Insurance Corporation (“FDIC”) or any other governmental entity, and are not guaranteed by or obligations of Deutsche Bank AG or its affiliates. Although information in this document has been obtained from sources believed to be reliable, we do not guarantee its accuracy, completeness or fairness, and it should not be relied upon as such. All opinions and estimates herein, including forecast returns,

Sector Rotation: a multi-factor perspective
Marketing Material Sector Rotation: a multi-factor perspective | January 2017 47
reflect our judgment on the date of this report and are subject to change without notice and involve a number of assumptions which may not prove valid. Investments are subject to various risks, including market fluctuations, regulatory change, counterparty risk, possible delays in repayment and loss of income and principal invested. The value of investments can fall as well as rise and you may not recover the amount originally invested at any point in time. Furthermore, substantial fluctuations of the value of the investment are possible even over short periods of time. This publication contains forward looking statements. Forward looking statements include, but are not limited to assumptions, estimates, projections, opinions, models and hypothetical performance analysis. The forward looking statements expressed constitute the author’s judgment as of the date of this material. Forward looking statements involve significant elements of subjective judgments and analyses and changes thereto and/or consideration of different or additional factors could have a material impact on the results indicated. Therefore, actual results may vary, perhaps materially, from the results contained herein. No representation or warranty is made by Deutsche Bank as to the reasonableness or completeness of such forward looking statements or to any other financial information contained herein. The terms of any investment will be exclusively subject to the detailed provisions, including risk considerations, contained in the Offering Documents. When making an investment decision, you should rely on the final documentation relating to the transaction and not the summary contained herein. This document may not be reproduced or circulated without our written authority. The manner of circulation and distribution of this document may be restricted by law or regulation in certain countries, including the United States. This document is not directed to, or intended for distribution to or use by, any person or entity who is a citizen or resident of or located in any locality, state, country or other jurisdiction, including the United States, where such distribution, publication, availability or use would be contrary to law or regulation or which would subject Deutsche Bank to any registration or licensing requirement within such jurisdiction not currently met within such jurisdiction. Persons into whose possession this document may come are required to inform themselves of, and to observe, such restrictions. Past performance is no guarantee of future results; nothing contained herein shall constitute any representation or warranty as to future performance. Further information is available upon investor’s request. This Document may not be distributed in Canada, Japan, the United States of America, or to any U.S. person. For investors in Switzerland: This material is intended for information purposes only and does not constitute investment advice or a personal recommendation. This document should not be construed as an offer to sell any investment or service. Furthermore, this document does not constitute the solicitation of an offer to purchase or subscribe for any investment or service in any jurisdiction where, or from any person in respect of whom, such a solicitation of an offer is unlawful. Neither Deutsche Bank AG nor any of its affiliates, gives any warranty as to the accuracy, reliability or completeness of information which is contained in this document. Past performance or any prediction or forecast is not indicative of future results. The views expressed in this document constitute Deutsche Bank AG or its affiliates’ judgment at the time of issue and are subject to change. Deutsche Bank has no obligation to update, modify or amend this letter or to otherwise notify a reader thereof in the event that any matter stated herein, or any opinion, projection, forecast or estimate set forth herein, changes or subsequently becomes inaccurate, or if research on the subject company is withdrawn. Prices and availability of financial instruments also are subject to change without notice. The information provided in this document is addressed solely to Qualified Investors pursuant to Article 10 paragraph 3 of the Swiss Federal Act on Collective Investment Schemes (CISA) and Article 6 of the Ordinance on Collective Investment Schemes. This document is not a prospectus within the meaning of Articles 1156 and 652a of the Swiss Code of Obligations and may not comply with the information standards required thereunder. This document may not be copied, reproduced, distributed or passed on to others without the prior written consent of Deutsche Bank AG or its affiliates’. Where distributed by Deutsche Bank AG, Stockholm branch: Deutsche Bank AG is authorised under German Banking Law
(competent authority: European Central Bank and the BaFin, Germany’s Federal Financial Supervisory Authority). Deutsche Bank AG Stockholm branch ("DBS", Bolagsverket nr. 516401-9985) is authorised by BaFIN and regulated by Finansinspektionen for the conduct of licensed activities in Sweden, Denmark, Norway and Finland. Deutsche Bank branches operate within the EEA on the back of the legal entity (Deutsche Bank AG) EU Passports within the European Economic Area (“EEA”). Reference is made to European Union Regulatory Background and Corporate and Regulatory Disclosures at https://www.db.com/en/content/eu_disclosures_uk.htm. Details about the extent of our authorisation and regulation by BaFIN and respective Nordic Region Financial Supervisory Authority are available from us on request. Without limitation, this document and any attachment does not constitute an offer or a recommendation to enter into any transaction with DBS. This material and attachments is for information purposes only and is not intended to be an offer or an advice or recommendation or solicitation, or the basis for any contract to purchase or sell any security, or other instrument, or for DBS to enter into or arrange any type of transaction as a consequence of any information contained herein. The implicit or explicit views and recommendations expressed in marketing or other financial presentation material as well as any financial proposals are solely those of the issuer of such material, and forwarded to you on behalf of the contracting party. The views set out in this presentation are those of the author and may not necessarily the views of any other division within Deutsche Bank, including the Sales and Trading functions of the Corporate and Investment Bank or the Global Client Group of Deutsche Asset and Wealth Management: all services provided by these the Sales and Trading functions of the Corporate and Investment Bank are purely on a non-advised, execution-only basis. DB may engage in transactions in a manner inconsistent with the views discussed herein. DB trades or may trade as principal in the instruments (or related derivatives), and may have proprietary positions in the instruments (or related derivatives) discussed herein. DB may make a market in the instruments (or

related derivatives) discussed herein. Sales and Trading personnel are compensated in part based on the volume of transactions effected by them. You may not distribute this document, in whole or in part, without our express written permission. DBS is solely acting in an agency/agency similar capacity (“the agent”) for and on behalf of Deutsche Bank AG and/or any of its affiliates. Potential investors should be aware that if they decide to enter into a transaction with Deutsche Bank AG or any of its affiliates acting in their capacity as principal to the transaction (“contracting party”), any and all agreements will be entered into with that contracting party (unless re-negotiated) and pursuant to the financial laws and regulations of the country where the contracting party is licensed. Unless DBS is entering into a separate and explicit contractual relationship with you for the provision of investment services, it is neither obliged to categorise you in accordance with MiFID nor perform MiFID suitability and/or appropriateness assessment (as enacted into Swedish laws and regulations). The investments or services mentioned in this material or an attachment thereto may not be appropriate for all investors and before entering into a transaction you should take steps to ensure that you fully understand the transaction and have made an independent assessment of the appropriateness of the transaction in the light of your own objectives and circumstances, including the possible risks and benefits of entering into such transaction. You should also consider seeking advice from your own advisers in making this assessment. If you decide to enter into a transaction with a contracting party you do so in reliance on your own judgment. For general information regarding the nature and risks and types of financial instruments please go to www.globalmarkets.db.com/riskdisclosures. Past performance is not a suitable indicator of future results.