
db x-trackers II
143
* This is a synthetic ETF. db x-trackers II * Société d’investissement à capital variable R.C.S. Luxembourg N° B-124.284 Annual Report and Audited Financial Statements For the year ended 31 December 2011 No subscription can be accepted on the basis of the financial reports. Subscriptions are only valid if they are made on the basis of the latest published Prospectus accompanied by the latest annual report and the most recent semi-annual report, if published thereafter.
Transcript of db x-trackers II
* This is a synthetic ETF.
db x-trackers II*
Société d’investissement à capital variable R.C.S. Luxembourg N° B-124.284
Annual Report and Audited Financial Statements For the year ended 31 December 2011
No subscription can be accepted on the basis of the financial reports. Subscriptions are only valid if they are made on the basis of the latest published Prospectus accompanied by the latest annual report and the most recent semi-annual report, if published thereafter.
db x-trackers II*
* This is a synthetic ETF
Table of contents
UPage Organisation 4 Directors’ Report 6
Independent Auditor’s Report 12 Information for Hong Kong Residents 14 Statistics 15 Statement of Net Assets as at 31 December 2011 29 Statement of Operations and Changes in Net Assets for the year ended 31 December 2011 44 Statement of Changes in Shares Issued for the year ended 31 December 2011 59 Statement of Investments as at 31 December 2011 63 db x-trackers II IBOXX € SOVEREIGNS EUROZONE TOTAL RETURN INDEX ETF* 63 db x-trackers II IBOXX € SOVEREIGNS EUROZONE 1-3 TOTAL RETURN INDEX ETF* 65 db x-trackers II IBOXX € SOVEREIGNS EUROZONE 3-5 TOTAL RETURN INDEX ETF* 67 db x-trackers II IBOXX € SOVEREIGNS EUROZONE 5-7 TOTAL RETURN INDEX ETF* 68 db x-trackers II IBOXX € SOVEREIGNS EUROZONE 7-10 TOTAL RETURN INDEX ETF* 69 db x-trackers II IBOXX € SOVEREIGNS EUROZONE 10-15 TOTAL RETURN INDEX ETF* 70 db x-trackers II IBOXX € SOVEREIGNS EUROZONE 15+ TOTAL RETURN INDEX ETF* 71 db x-trackers II IBOXX € SOVEREIGNS EUROZONE 25+ TOTAL RETURN INDEX ETF* 72 db x-trackers II IBOXX GLOBAL INFLATION-LINKED TOTAL RETURN INDEX HEDGED ETF* 73 db x-trackers II IBOXX EURO INFLATION-LINKED TOTAL RETURN INDEX ETF* 77 db x-trackers II EONIA TOTAL RETURN INDEX ETF* 78 db x-trackers II ITRAXX® EUROPE 5-YEAR TOTAL RETURN INDEX ETF* 81 db x-trackers II ITRAXX® HIVOL 5-YEAR TOTAL RETURN INDEX ETF* 82 db x-trackers II ITRAXX® CROSSOVER 5-YEAR TOTAL RETURN INDEX ETF* 83 db x-trackers II ITRAXX® EUROPE 5-YEAR SHORT DAILY TOTAL RETURN INDEX ETF* 84 db x-trackers II ITRAXX® HIVOL 5-YEAR SHORT DAILY TOTAL RETURN INDEX ETF* 85 db x-trackers II ITRAXX® CROSSOVER 5-YEAR SHORT DAILY TOTAL RETURN INDEX ETF* 86 db x-trackers II EMERGING MARKETS LIQUID EUROBOND INDEX ETF* 87 db x-trackers II SHORT IBOXX € SOVEREIGNS EUROZONE DAILY TOTAL RETURN INDEX ETF* 89 db x-trackers II IBOXX € GERMANY COVERED TOTAL RETURN INDEX ETF* 91 db x-trackers II IBOXX £ GILTS TOTAL RETURN INDEX ETF* 92 db x-trackers II IBOXX UK GILT INFLATION-LINKED TOTAL RETURN INDEX ETF* 93 db x-trackers II FED FUNDS EFFECTIVE RATE TOTAL RETURN INDEX ETF* 94 db x-trackers II STERLING CASH ETF* 96 db x-trackers II GLOBAL SOVEREIGN INDEX ETF* 97 db x-trackers II MARKIT IBOXX ABF SINGAPORE GOVERNMENT INDEX ETF* 99 db x-trackers II EURO INTEREST RATES VOLATILITY TOTAL RETURN INDEX ETF* 100 db x-trackers II EURO INTEREST RATES VOLATILITY SHORT TOTAL RETURN INDEX ETF* 101 db x-trackers II ITRAXX® EUROPE SENIOR FINANCIALS 5-YEAR TOTAL RETURN INDEX ETF* 102 db x-trackers II ITRAXX® EUROPE SUBORDINATED FINANCIALS 5-YEAR TOTAL RETURN INDEX ETF*
103
db x-trackers II ITRAXX® EUROPE SENIOR FINANCIALS 5-YEAR SHORT DAILY TOTAL RETURN INDEX ETF*
104
db x-trackers II ITRAXX® EUROPE SUBORDINATED FINANCIALS 5-YEAR SHORT DAILY TOTAL RETURN INDEX ETF*
105
db x-trackers II SINGAPORE DOLLAR CASH ETF* 106 db x-trackers II SWISS FRANC CASH ETF* 107 db x-trackers II EURO INFLATION SWAP 5 YEAR TOTAL RETURN INDEX ETF* 108 db x-trackers II IBOXX £ GILTS 5+ TOTAL RETURN INDEX ETF* 109 db x-trackers II IBOXX $ TREASURIES TOTAL RETURN INDEX ETF* 110 db x-trackers II UK GILTS SHORT DAILY ETF* 111 db x-trackers II USD IG INFLATION LINKED TREASURIES TOTAL RETURN INDEX ETF* 112 db x-trackers II US TREASURIES SHORT DAILY ETF* 113 db x-trackers II IBOXX $ TREASURIES 1-3 TOTAL RETURN INDEX ETF* 114 db x-trackers II IBOXX EUR LIQUID CORPORATE 100 TOTAL RETURN INDEX ETF* 115 db x-trackers II IBOXX € GERMANY TOTAL RETURN INDEX ETF* 116 db x-trackers II IBOXX € GERMANY 1-3 TOTAL RETURN INDEX ETF* 117 db x-trackers II MARKIT IBOXX ABF KOREA GOVERNMENT INDEX ETF* 118 db x-trackers II IBOXX EUR LIQUID CORPORATE 100 FINANCIALS SUB-INDEX TOTAL RETURN ETF* 119 db x-trackers II IBOXX EUR LIQUID CORPORATE 100 NON-FINANCIALS SUB-INDEX TOTAL RETURN ETF* 120 db x-trackers II IBOXX € SOVEREIGNS EUROZONE AAA TOTAL RETURN INDEX ETF* 121 db x-trackers II IBOXX € SOVEREIGNS EUROZONE YIELD PLUS INDEX ETF* 122 db x-trackers II AUSTRALIAN DOLLAR CASH ETF* 123 db x-trackers II AUSTRALIA SSA BONDS TOTAL RETURN INDEX ETF* 124 db x-trackers II IBOXX € GERMANY COVERED 1-3 TOTAL RETURN INDEX ETF* 125 db x-trackers II ITRAXX® EUROPE 5-YEAR 2X DAILY TOTAL RETURN INDEX ETF* 126
2
db x-trackers II*
* This is a synthetic ETF
Table of contents (continued)
db x-trackers II ITRAXX® CROSSOVER 5-YEAR 2X DAILY TOTAL RETURN INDEX ETF* 127 db x-trackers II ITRAXX® EUROPE 5-YEAR 2X SHORT DAILY TOTAL RETURN INDEX ETF* 128 db x-trackers II ITRAXX® CROSSOVER 5-YEAR 2X SHORT DAILY TOTAL RETURN INDEX ETF* 129 Notes to the Financial Statements 130 Information for Shareholders 143
3
db x-trackers II*
* This is a synthetic ETF.
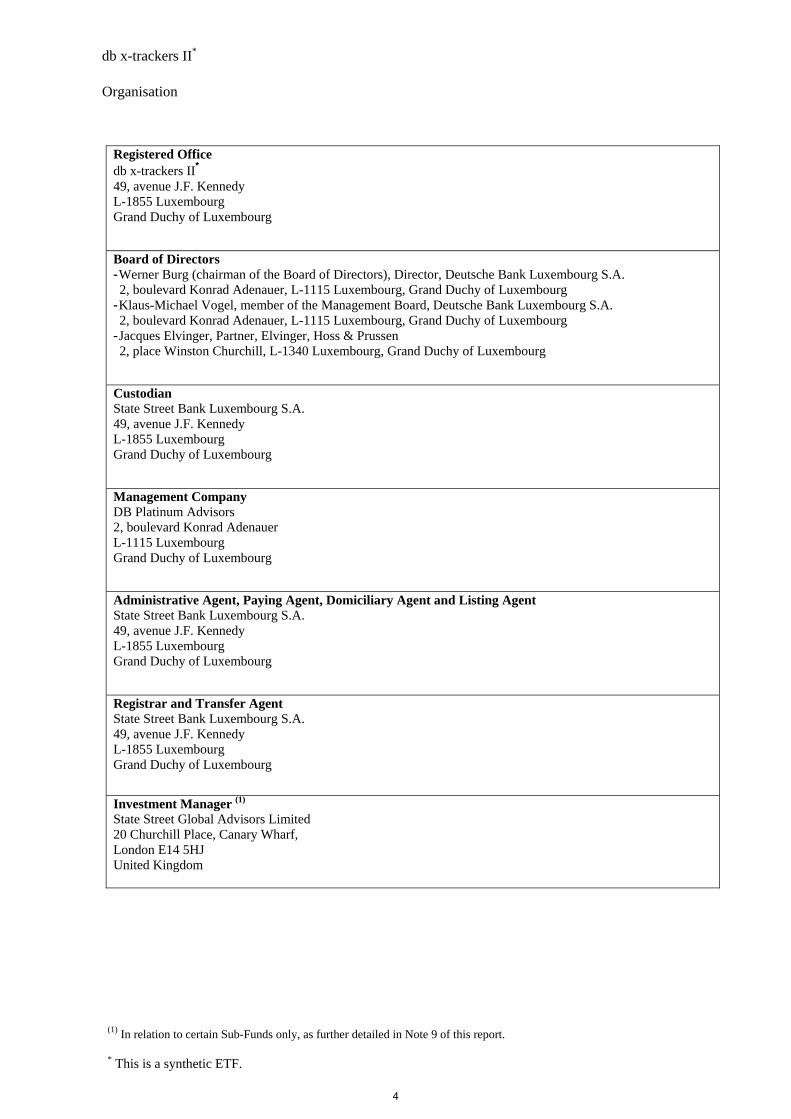
Organisation
Registered Office db x-trackers II* 49, avenue J.F. Kennedy L-1855 Luxembourg Grand Duchy of Luxembourg
Board of Directors - Werner Burg (chairman of the Board of Directors), Director, Deutsche Bank Luxembourg S.A. 2, boulevard Konrad Adenauer, L-1115 Luxembourg, Grand Duchy of Luxembourg
- Klaus-Michael Vogel, member of the Management Board, Deutsche Bank Luxembourg S.A. 2, boulevard Konrad Adenauer, L-1115 Luxembourg, Grand Duchy of Luxembourg
- Jacques Elvinger, Partner, Elvinger, Hoss & Prussen 2, place Winston Churchill, L-1340 Luxembourg, Grand Duchy of Luxembourg
Custodian State Street Bank Luxembourg S.A. 49, avenue J.F. Kennedy L-1855 Luxembourg Grand Duchy of Luxembourg
Management Company DB Platinum Advisors 2, boulevard Konrad Adenauer L-1115 Luxembourg Grand Duchy of Luxembourg
Administrative Agent, Paying Agent, Domiciliary Agent and Listing Agent State Street Bank Luxembourg S.A. 49, avenue J.F. Kennedy L-1855 Luxembourg Grand Duchy of Luxembourg
Registrar and Transfer Agent State Street Bank Luxembourg S.A. 49, avenue J.F. Kennedy L-1855 Luxembourg Grand Duchy of Luxembourg
Investment Manager (1) State Street Global Advisors Limited 20 Churchill Place, Canary Wharf, London E14 5HJ United Kingdom
(1) In relation to certain Sub-Funds only, as further detailed in Note 9 of this report.
4
db x-trackers II*
* This is a synthetic ETF.
Organisation (continued)
Independent Auditor Ernst & Young S.A. 7, rue Gabriel Lippmann Parc d’Activité Syrdall 2 L-5365 Münsbach Grand Duchy of Luxembourg Legal Adviser Elvinger, Hoss & Prussen 2, place Winston Churchill L-1340 Luxembourg Grand Duchy of Luxembourg Hong Kong Representative RBC Dexia Trust Services Hong Kong Limited 51st floor, Central Plaza 18 Harbour Road Wanchai, Hong Kong Capitalised Terms used herein shall have the same meaning as in the current Prospectus.
5
db x-trackers II*
* This is a synthetic ETF.
Directors’ Report
During the year ending 31 December 2011, db x-trackers II* (the “Company”) has successfully launched thirteen new Sub-Funds and/or Share Classes offering Shareholders a variety of investment strategies. All Sub-Funds are passively managed (i.e. without any active management decision) and have replicated the respective investment strategies outlined below with a minimal tracking error resulting mainly from the Sub-Fund fees. The following thirteen Sub-Funds and/or Share Classes of the indicated investment strategies have been launched during the financial year ending 31 December 2011:
Cash strategies: LU0506212785 db x-trackers II AUSTRALIAN DOLLAR CASH ETF*1 - 4C
Sovereign and covered bonds strategies: LU0548059699 db x-trackers II IBOXX € GERMANY COVERED 1-3 TOTAL RETURN INDEX ETF* - 1C LU0643975161 db x-trackers II IBOXX € GERMANY TOTAL RETURN INDEX ETF* - 4% - D LU0643975591 db x-trackers II IBOXX € SOVEREIGNS EUROZONE TOTAL RETURN INDEX ETF* - 4% - D LU0614173549 db x-trackers II IBOXX € SOVEREIGNS EUROZONE 1-3 TOTAL RETURN INDEX ETF* - 1D LU0614173895 db x-trackers II IBOXX € SOVEREIGNS EUROZONE 3-5 TOTAL RETURN INDEX ETF* - 1D LU0641006290 db x-trackers II GLOBAL SOVEREIGN INDEX ETF*2 - 2C (GBP HEDGED) LU0690964092 db x-trackers II GLOBAL SOVEREIGN INDEX ETF* - 1D (EUR HEDGED)
Inflation-linked strategies: LU0641007264 db x-trackers II IBOXX GLOBAL INFLATION-LINKED TOTAL RETURN INDEX HEDGED ETF* - 3C
(GBP HEDGED)
Credit strategies: LU0613541316 db x-trackers II ITRAXX® EUROPE 5-YEAR 2X DAILY TOTAL RETURN INDEX ETF* - 1C LU0613541589 db x-trackers II ITRAXX® EUROPE 5-YEAR 2X SHORT DAILY TOTAL RETURN INDEX ETF* - 1C LU0613541407 db x-trackers II ITRAXX® CROSSOVER 5-YEAR 2X DAILY TOTAL RETURN INDEX ETF* - 1C LU0613541662 db x-trackers II ITRAXX® CROSSOVER 5-YEAR 2X SHORT DAILY TOTAL RETURN INDEX ETF* - 1C
Here follows an overview of the investment strategies of the Sub-Funds and their different share classes opened at year-end:
Cash strategies: LU0335044896 db x-trackers II EONIA TOTAL RETURN INDEX ETF* - 1D LU0335651435 db x-trackers II EONIA TOTAL RETURN INDEX ETF* - maxblue Cash ETF3 LU0378820202 db x-trackers II EONIA TOTAL RETURN INDEX ETF* - 2C LU0290358497 db x-trackers II EONIA TOTAL RETURN INDEX ETF* - 1C LU0321465469 db x-trackers II FED FUNDS EFFECTIVE RATE TOTAL RETURN INDEX ETF* - 1C LU0321464652 db x-trackers II STERLING CASH ETF*4 - 1D LU0378820038 db x-trackers II SWISS FRANC CASH ETF*5 - 1C LU0378819964 db x-trackers II SINGAPORE DOLLAR CASH ETF*6 - 1C LU0482518031 db x-trackers II AUSTRALIAN DOLLAR CASH ETF* - 1C LU0482521092 db x-trackers II AUSTRALIAN DOLLAR CASH ETF* - 2C LU0482522900 db x-trackers II AUSTRALIAN DOLLAR CASH ETF* - 3C LU0506212785 db x-trackers II AUSTRALIAN DOLLAR CASH ETF* - 4C
Sovereign and covered bonds strategies: LU0290355717 db x-trackers II IBOXX € SOVEREIGNS EUROZONE TOTAL RETURN INDEX ETF* - 1C LU0643975591 db x-trackers II IBOXX € SOVEREIGNS EUROZONE TOTAL RETURN INDEX ETF* - 4% - D LU0290356871 db x-trackers II IBOXX € SOVEREIGNS EUROZONE 1-3 TOTAL RETURN INDEX ETF* - 1C LU0614173549 db x-trackers II IBOXX € SOVEREIGNS EUROZONE 1-3 TOTAL RETURN INDEX ETF* - 1D LU0290356954 db x-trackers II IBOXX € SOVEREIGNS EUROZONE 3-5 TOTAL RETURN INDEX ETF* - 1C LU0614173895 db x-trackers II IBOXX € SOVEREIGNS EUROZONE 3-5 TOTAL RETURN INDEX ETF* - 1D LU0290357176 db x-trackers II IBOXX € SOVEREIGNS EUROZONE 5-7 TOTAL RETURN INDEX ETF* - 1C
1 As from 5 December 2011, this sub-fund has been renamed from db x-trackers II AUSTRALIA MONEY MARKET ETF* to db x-trackers II AUSTRALIAN DOLLAR CASH ETF*. 2 As from 26 July 2011, this sub-fund has been renamed from db x-trackers II GLOBAL SOVEREIGN EUR HEDGED INDEX ETF* to db x-trackers II GLOBAL SOVEREIGN INDEX ETF*. 3 As from 5 December 2011, this Share Class has been renamed from maxblue Money Market ETF* to maxblue Cash ETF*. 4 As from 5 December 2011, this sub-fund has been renamed from db x-trackers II SONIA TOTAL RETURN INDEX ETF* to db x-trackers II STERLING CASH ETF*. 5 As from 5 December 2011, this sub-fund has been renamed from db x-trackers II SWISS OVERNIGHT MONEY MARKET ETF* to db x-trackers II SWISS FRANC CASH ETF*. 6 As from 5 December 2011, this sub-fund has been renamed from db x-trackers II SINGAPORE MONEY MARKET ETF* to db x-trackers II SINGAPORE DOLLAR CASH ETF*.
6
db x-trackers II*
* This is a synthetic ETF.
Directors’ Report (continued) Sovereign and covered bonds strategies (continued): LU0290357259 db x-trackers II IBOXX € SOVEREIGNS EUROZONE 7-10 TOTAL RETURN INDEX ETF* - 1C LU0290357333 db x-trackers II IBOXX € SOVEREIGNS EUROZONE 10-15 TOTAL RETURN INDEX ETF* - 1C LU0290357507 db x-trackers II IBOXX € SOVEREIGNS EUROZONE 15+ TOTAL RETURN INDEX ETF* - 1C LU0290357846 db x-trackers II IBOXX € SOVEREIGNS EUROZONE 25+ TOTAL RETURN INDEX ETF* - 1C LU0321462953 db x-trackers II EMERGING MARKETS LIQUID EUROBOND INDEX ETF* - 1C LU0321463258 db x-trackers II SHORT IBOXX € SOVEREIGNS EUROZONE DAILY TOTAL RETURN INDEX ETF* - 1CLU0321463506 db x-trackers II IBOXX € GERMANY COVERED TOTAL RETURN INDEX ETF* - 1C LU0548059699 db x-trackers II IBOXX € GERMANY COVERED 1-3 TOTAL RETURN INDEX ETF* - 1C LU0321464066 db x-trackers II IBOXX £ GILTS TOTAL RETURN INDEX ETF* - 1D LU0378818131 db x-trackers II GLOBAL SOVEREIGN INDEX ETF* - 1C LU0641006290 db x-trackers II GLOBAL SOVEREIGN INDEX ETF* - 2C (GBP HEDGED) LU0690964092 db x-trackers II GLOBAL SOVEREIGN INDEX ETF* - 1D (EUR HEDGED) LU0429459356 db x-trackers II IBOXX $ TREASURIES TOTAL RETURN INDEX ETF* - 1C LU0429458895 db x-trackers II IBOXX $ TREASURIES 1-3 TOTAL RETURN INDEX ETF* - 1C LU0429458978 db x-trackers II IBOXX £ GILTS 5+ TOTAL RETURN INDEX ETF*7 - 1D LU0429459430 db x-trackers II UK GILTS SHORT DAILY ETF* - 1C LU0429458622 db x-trackers II US TREASURIES SHORT DAILY ETF* - 1C LU0468896575 db x-trackers II IBOXX € GERMANY TOTAL RETURN INDEX ETF* - 1D LU0643975161 db x-trackers II IBOXX € GERMANY TOTAL RETURN INDEX ETF* - 4% - D LU0468897110 db x-trackers II IBOXX € GERMANY 1-3 TOTAL RETURN INDEX ETF* - 1D LU0484969463 db x-trackers II IBOXX € SOVEREIGNS EUROZONE AAA TOTAL RETURN INDEX ETF* - 1C LU0524480265 db x-trackers II IBOXX € SOVEREIGNS EUROZONE YIELD PLUS INDEX ETF* - 1C LU0378818560 db x-trackers II MARKIT IBOXX ABF SINGAPORE GOVERNMENT INDEX ETF* - 1C LU0480088441 db x-trackers II MARKIT IBOXX ABF KOREA GOVERNMENT INDEX ETF* - 1C LU0494592974 db x-trackers II AUSTRALIA SSA BONDS TOTAL RETURN INDEX ETF* - 1C
Inflation-linked strategies: LU0290357929 db x-trackers II IBOXX GLOBAL INFLATION-LINKED TOTAL RETURN INDEX HEDGED ETF* - 1C LU0641007264 db x-trackers II IBOXX GLOBAL INFLATION-LINKED TOTAL RETURN INDEX HEDGED ETF* - 3C
(GBP HEDGED) LU0290358224 db x-trackers II IBOXX EURO INFLATION-LINKED TOTAL RETURN INDEX ETF* - 1C LU0321464223 db x-trackers II IBOXX UK GILT INFLATION-LINKED TOTAL RETURN INDEX ETF* - 1D LU0429459513 db x-trackers II USD IG INFLATION LINKED TREASURIES TOTAL RETURN INDEX ETF* - 1C LU0426245436 db x-trackers II EURO INFLATION SWAP 5 YEAR TOTAL RETURN INDEX ETF* - 1C
Corporate bond strategies: LU0478205379 db x-trackers II IBOXX EUR LIQUID CORPORATE 100 TOTAL RETURN INDEX ETF* - 1C LU0484968812 db x-trackers II IBOXX EUR LIQUID CORPORATE 100 FINANCIALS SUB-INDEX TOTAL RETURN
ETF* - 1C LU0484968655 db x-trackers II IBOXX EUR LIQUID CORPORATE 100 NON-FINANCIALS SUB-INDEX TOTAL
RETURN ETF* - 1C
Credit strategies: LU0290358653 db x-trackers II ITRAXX® EUROPE 5-YEAR TOTAL RETURN INDEX ETF* - 1C LU0290358737 db x-trackers II ITRAXX® HIVOL 5-YEAR TOTAL RETURN INDEX ETF* - 1C LU0290359032 db x-trackers II ITRAXX® CROSSOVER 5-YEAR TOTAL RETURN INDEX ETF* - 1C LU0321462102 db x-trackers II ITRAXX® EUROPE 5-YEAR SHORT DAILY TOTAL RETURN INDEX ETF* - 1C LU0321462441 db x-trackers II ITRAXX® HIVOL 5-YEAR SHORT DAILY TOTAL RETURN INDEX ETF* - 1C LU0321462870 db x-trackers II ITRAXX® CROSSOVER 5-YEAR SHORT DAILY TOTAL RETURN INDEX ETF* - 1C LU0378819295 db x-trackers II ITRAXX® EUROPE SENIOR FINANCIALS 5-YEAR TOTAL RETURN INDEX ETF* - 1C LU0378819378 db x-trackers II ITRAXX® EUROPE SUBORDINATED FINANCIALS 5-YEAR TOTAL RETURN INDEX
ETF* - 1C LU0378819709 db x-trackers II ITRAXX® EUROPE SENIOR FINANCIALS 5-YEAR SHORT DAILY TOTAL RETURN
INDEX ETF* - 1C LU0378819881 db x-trackers II ITRAXX® EUROPE SUBORDINATED FINANCIALS 5-YEAR SHORT DAILY TOTAL
RETURN INDEX ETF* - 1C LU0613541316 db x-trackers II ITRAXX® EUROPE 5-YEAR 2X DAILY TOTAL RETURN INDEX ETF* - 1C LU0613541589 db x-trackers II ITRAXX® EUROPE 5-YEAR 2X SHORT DAILY TOTAL RETURN INDEX ETF* - 1C LU0613541407 db x-trackers II ITRAXX® CROSSOVER 5-YEAR 2X DAILY TOTAL RETURN INDEX ETF* - 1C LU0613541662 db x-trackers II ITRAXX® CROSSOVER 5-YEAR 2X SHORT DAILY TOTAL RETURN INDEX ETF* - 1C
7 As from 12 January 2012, this sub-fund will be renamed from db x-trackers II IBOXX £ GILTS 5+ TOTAL RETURN INDEX ETF* into db x-trackers II IBOXX £ GILTS 1-5 TOTAL RETURN INDEX ETF*.
7
db x-trackers II*
* This is a synthetic ETF.
Directors’ Report (continued)
Volatility strategies: LU0378818644 db x-trackers II EURO INTEREST RATES VOLATILITY TOTAL RETURN INDEX ETF* - 1C LU0378818727 db x-trackers II EURO INTEREST RATES VOLATILITY SHORT TOTAL RETURN INDEX ETF* - 1C
Depending on the Sub-Fund’s strategy, the performance has been impacted by, inter-alia, the following factors:
- Cash strategies: interest rates on historically low levels led to a relatively low performance across all
currencies. The exception was the robust Australian overnight rate, which has led to a fund performance in excess of +4.5% for the year 2011. General market concerns have led to increased investor interest in Sub-Funds with cash strategies, especially the EUR denominated db x-trackers II EONIA TOTAL RETURN INDEX ETF*, which finished the year 2011 with assets under management in excess of EUR 2.2 billion.
- Sovereign and covered bonds strategies: 2011 showed mixed performances in the bond space, especially for the Eurozone. Continuing concerns around the state of public debt and related rating downgrades dragged heavily on some bond performances. The db x-trackers II IBOXX € SOVEREIGNS EUROZONE YIELD PLUS INDEX ETF*, which reflects the performance of the five highest yielding investment grade Eurozone sovereign bonds had a negative performance in 2011, finishing around -1.9% down. On the other hand, the db x-trackers II IBOXX € SOVEREIGNS EUROZONE AAA TOTAL RETURN INDEX ETF*, which reflects the performance of only AAA rated Eurozone sovereign bonds had a strong 2011 performance of around +7% with Germany being among the stronger performers: the db x-trackers II IBOXX € GERMANY TOTAL RETURN INDEX ETF* posted a return of +9.6% in 2011 as many investors continued their search for EUR denominated “safe-haven” investments. This search for “safe-haven” investments materialised especially in the performance of government bonds outside the Eurozone with UK sovereign bonds represented by the db x-trackers II IBOXX £ GILTS TOTAL RETURN INDEX ETF* posting an outstanding 2011 performance in excess of +16%.
- Inflation-linked strategies: over the year, 5-year EUR breakeven inflation rates rose by around 20 bps to about 2%. Unfortunately, the above mentioned concerns around the creditworthiness of some issuers proved to also be a drag for inflation-linked bonds issued by Eurozone governments. The performance of inflation-linked bonds globally was good with the db x-trackers II IBOXX GLOBAL INFLATION-LINKED TOTAL RETURN INDEX HEDGED ETF* returning almost +12% over 2011. Inflation-linked bonds issued by the UK government proved to be among the best choices for investors with a 2011 performance of around +20%.
- Corporate bond strategies: corporate credit spreads had a mixed 2011: they remained relatively flat during the first half and widened relatively significantly during the second half of the year. This proved to be a difficult environment for bonds of financial issuers: the db x-trackers II IBOXX EUR LIQUID CORPORATE 100 FINANCIALS SUB-INDEX TOTAL RETURN ETF* posted a return of only +1.7%, compared to a relatively strong performance of the bonds of non-financial issuers represented by the db x-trackers II IBOXX EUR LIQUID CORPORATE 100 NON-FINANCIALS SUB-INDEX TOTAL RETURN ETF*, which returned +4% during 2011.
- Credit strategies: as mentioned above, corporate credit spreads widened relatively significantly during the second half of the year - investment grade credit spreads widened by +68 bps, sub-investment grade credit spreads by +370 bps and senior financial investment grade credit spreads by +125 bps. Overall, this proved to be a better environment for the ETFs reflecting a credit protection buyer position, with the db x-trackers II ITRAXX® HIVOL 5-YEAR SHORT DAILY TOTAL RETURN INDEX ETF* having the strongest positive performance of around +4%.
- Volatility strategies: implied interest rate volatilities increased over 2011, peaking around the beginning
of September. At the end of the year, the long volatility strategy had a slight positive performance, with the short volatility strategy having a slight negative performance.
8
db x-trackers II*
* This is a synthetic ETF.
Directors’ Report (continued)
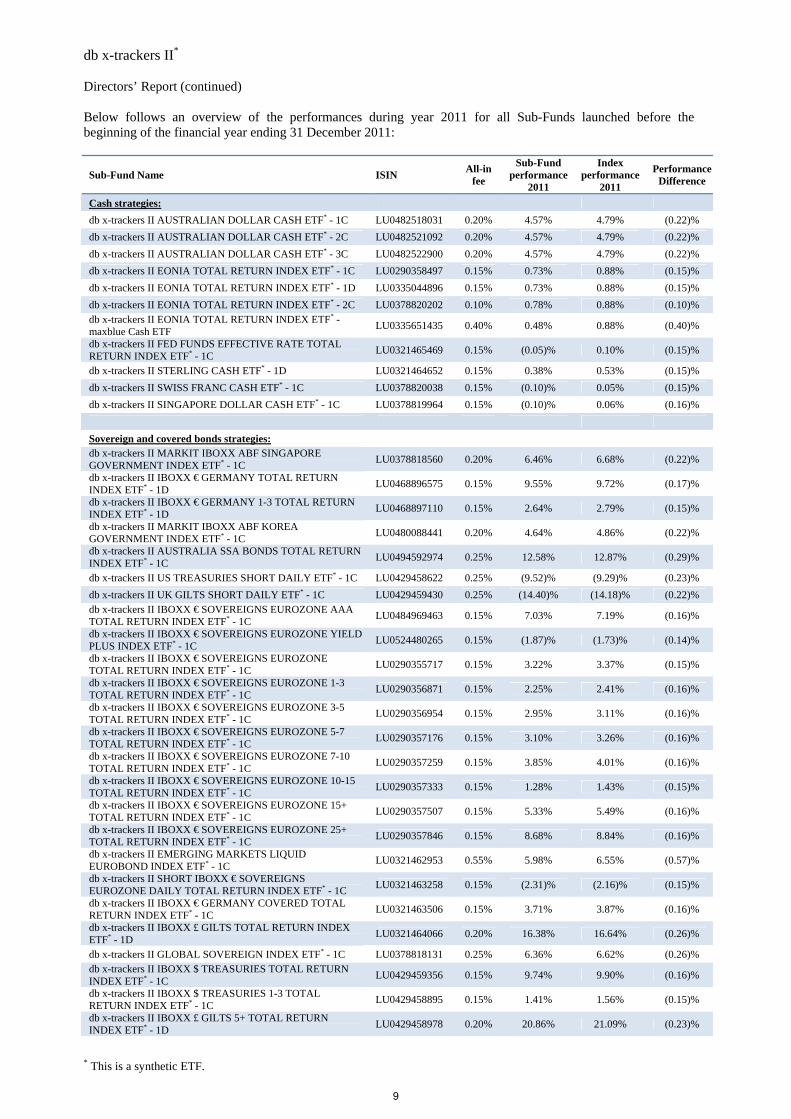
Below follows an overview of the performances during year 2011 for all Sub-Funds launched before the beginning of the financial year ending 31 December 2011:
Sub-Fund Name ISIN All-in
fee
Sub-Fund performance
2011
Index performance
2011
Performance Difference
Cash strategies:
db x-trackers II AUSTRALIAN DOLLAR CASH ETF* - 1C LU0482518031 0.20% 4.57% 4.79% (0.22)%
db x-trackers II AUSTRALIAN DOLLAR CASH ETF* - 2C LU0482521092 0.20% 4.57% 4.79% (0.22)%
db x-trackers II AUSTRALIAN DOLLAR CASH ETF* - 3C LU0482522900 0.20% 4.57% 4.79% (0.22)%
db x-trackers II EONIA TOTAL RETURN INDEX ETF* - 1C LU0290358497 0.15% 0.73% 0.88% (0.15)%
db x-trackers II EONIA TOTAL RETURN INDEX ETF* - 1D LU0335044896 0.15% 0.73% 0.88% (0.15)%
db x-trackers II EONIA TOTAL RETURN INDEX ETF* - 2C LU0378820202 0.10% 0.78% 0.88% (0.10)% db x-trackers II EONIA TOTAL RETURN INDEX ETF* - maxblue Cash ETF
LU0335651435 0.40% 0.48% 0.88% (0.40)%
db x-trackers II FED FUNDS EFFECTIVE RATE TOTAL RETURN INDEX ETF* - 1C
LU0321465469 0.15% (0.05)% 0.10% (0.15)%
db x-trackers II STERLING CASH ETF* - 1D LU0321464652 0.15% 0.38% 0.53% (0.15)%
db x-trackers II SWISS FRANC CASH ETF* - 1C LU0378820038 0.15% (0.10)% 0.05% (0.15)%
db x-trackers II SINGAPORE DOLLAR CASH ETF* - 1C LU0378819964 0.15% (0.10)% 0.06% (0.16)%
Sovereign and covered bonds strategies: db x-trackers II MARKIT IBOXX ABF SINGAPORE GOVERNMENT INDEX ETF* - 1C
LU0378818560 0.20% 6.46% 6.68% (0.22)%
db x-trackers II IBOXX € GERMANY TOTAL RETURN INDEX ETF* - 1D
LU0468896575 0.15% 9.55% 9.72% (0.17)%
db x-trackers II IBOXX € GERMANY 1-3 TOTAL RETURN INDEX ETF* - 1D
LU0468897110 0.15% 2.64% 2.79% (0.15)%
db x-trackers II MARKIT IBOXX ABF KOREA GOVERNMENT INDEX ETF* - 1C
LU0480088441 0.20% 4.64% 4.86% (0.22)%
db x-trackers II AUSTRALIA SSA BONDS TOTAL RETURN INDEX ETF* - 1C
LU0494592974 0.25% 12.58% 12.87% (0.29)%
db x-trackers II US TREASURIES SHORT DAILY ETF* - 1C LU0429458622 0.25% (9.52)% (9.29)% (0.23)%
db x-trackers II UK GILTS SHORT DAILY ETF* - 1C LU0429459430 0.25% (14.40)% (14.18)% (0.22)% db x-trackers II IBOXX € SOVEREIGNS EUROZONE AAA TOTAL RETURN INDEX ETF* - 1C
LU0484969463 0.15% 7.03% 7.19% (0.16)%
db x-trackers II IBOXX € SOVEREIGNS EUROZONE YIELD PLUS INDEX ETF* - 1C
LU0524480265 0.15% (1.87)% (1.73)% (0.14)%
db x-trackers II IBOXX € SOVEREIGNS EUROZONE TOTAL RETURN INDEX ETF* - 1C
LU0290355717 0.15% 3.22% 3.37% (0.15)%
db x-trackers II IBOXX € SOVEREIGNS EUROZONE 1-3 TOTAL RETURN INDEX ETF* - 1C
LU0290356871 0.15% 2.25% 2.41% (0.16)%
db x-trackers II IBOXX € SOVEREIGNS EUROZONE 3-5 TOTAL RETURN INDEX ETF* - 1C
LU0290356954 0.15% 2.95% 3.11% (0.16)%
db x-trackers II IBOXX € SOVEREIGNS EUROZONE 5-7 TOTAL RETURN INDEX ETF* - 1C
LU0290357176 0.15% 3.10% 3.26% (0.16)%
db x-trackers II IBOXX € SOVEREIGNS EUROZONE 7-10 TOTAL RETURN INDEX ETF* - 1C
LU0290357259 0.15% 3.85% 4.01% (0.16)%
db x-trackers II IBOXX € SOVEREIGNS EUROZONE 10-15 TOTAL RETURN INDEX ETF* - 1C
LU0290357333 0.15% 1.28% 1.43% (0.15)%
db x-trackers II IBOXX € SOVEREIGNS EUROZONE 15+ TOTAL RETURN INDEX ETF* - 1C
LU0290357507 0.15% 5.33% 5.49% (0.16)%
db x-trackers II IBOXX € SOVEREIGNS EUROZONE 25+ TOTAL RETURN INDEX ETF* - 1C
LU0290357846 0.15% 8.68% 8.84% (0.16)%
db x-trackers II EMERGING MARKETS LIQUID EUROBOND INDEX ETF* - 1C
LU0321462953 0.55% 5.98% 6.55% (0.57)%
db x-trackers II SHORT IBOXX € SOVEREIGNS EUROZONE DAILY TOTAL RETURN INDEX ETF* - 1C
LU0321463258 0.15% (2.31)% (2.16)% (0.15)%
db x-trackers II IBOXX € GERMANY COVERED TOTAL RETURN INDEX ETF* - 1C
LU0321463506 0.15% 3.71% 3.87% (0.16)%
db x-trackers II IBOXX £ GILTS TOTAL RETURN INDEX ETF* - 1D
LU0321464066 0.20% 16.38% 16.64% (0.26)%
db x-trackers II GLOBAL SOVEREIGN INDEX ETF* - 1C LU0378818131 0.25% 6.36% 6.62% (0.26)% db x-trackers II IBOXX $ TREASURIES TOTAL RETURN INDEX ETF* - 1C
LU0429459356 0.15% 9.74% 9.90% (0.16)%
db x-trackers II IBOXX $ TREASURIES 1-3 TOTAL RETURN INDEX ETF* - 1C
LU0429458895 0.15% 1.41% 1.56% (0.15)%
db x-trackers II IBOXX £ GILTS 5+ TOTAL RETURN INDEX ETF* - 1D
LU0429458978 0.20% 20.86% 21.09% (0.23)%
9
db x-trackers II*
* This is a synthetic ETF.
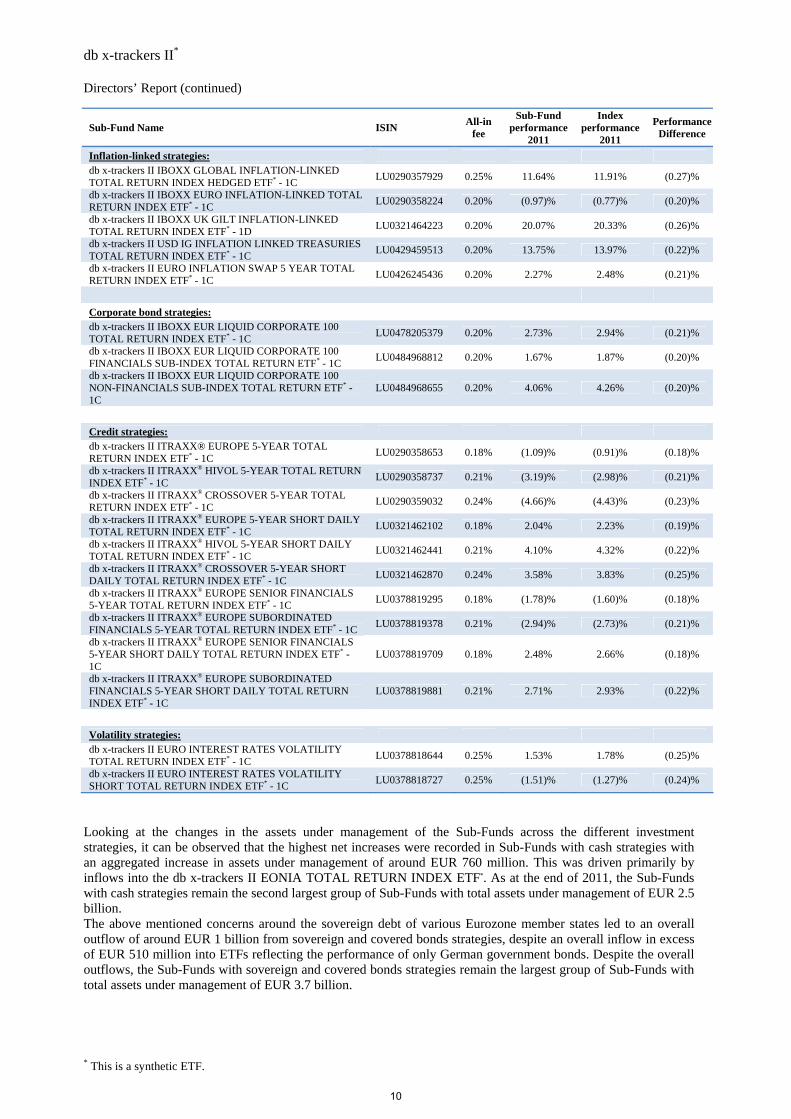
Directors’ Report (continued)
Sub-Fund Name ISIN All-in
fee
Sub-Fund performance
2011
Index performance
2011
Performance Difference
Inflation-linked strategies: db x-trackers II IBOXX GLOBAL INFLATION-LINKED TOTAL RETURN INDEX HEDGED ETF* - 1C
LU0290357929 0.25% 11.64% 11.91% (0.27)%
db x-trackers II IBOXX EURO INFLATION-LINKED TOTAL RETURN INDEX ETF* - 1C
LU0290358224 0.20% (0.97)% (0.77)% (0.20)%
db x-trackers II IBOXX UK GILT INFLATION-LINKED TOTAL RETURN INDEX ETF* - 1D
LU0321464223 0.20% 20.07% 20.33% (0.26)%
db x-trackers II USD IG INFLATION LINKED TREASURIES TOTAL RETURN INDEX ETF* - 1C
LU0429459513 0.20% 13.75% 13.97% (0.22)%
db x-trackers II EURO INFLATION SWAP 5 YEAR TOTAL RETURN INDEX ETF* - 1C
LU0426245436 0.20% 2.27% 2.48% (0.21)%
Corporate bond strategies: db x-trackers II IBOXX EUR LIQUID CORPORATE 100 TOTAL RETURN INDEX ETF* - 1C
LU0478205379 0.20% 2.73% 2.94% (0.21)%
db x-trackers II IBOXX EUR LIQUID CORPORATE 100 FINANCIALS SUB-INDEX TOTAL RETURN ETF* - 1C
LU0484968812 0.20% 1.67% 1.87% (0.20)%
db x-trackers II IBOXX EUR LIQUID CORPORATE 100 NON-FINANCIALS SUB-INDEX TOTAL RETURN ETF* - 1C
LU0484968655 0.20% 4.06% 4.26% (0.20)%
Credit strategies: db x-trackers II ITRAXX® EUROPE 5-YEAR TOTAL RETURN INDEX ETF* - 1C
LU0290358653 0.18% (1.09)% (0.91)% (0.18)%
db x-trackers II ITRAXX® HIVOL 5-YEAR TOTAL RETURN INDEX ETF* - 1C
LU0290358737 0.21% (3.19)% (2.98)% (0.21)%
db x-trackers II ITRAXX® CROSSOVER 5-YEAR TOTAL RETURN INDEX ETF* - 1C
LU0290359032 0.24% (4.66)% (4.43)% (0.23)%
db x-trackers II ITRAXX® EUROPE 5-YEAR SHORT DAILY TOTAL RETURN INDEX ETF* - 1C
LU0321462102 0.18% 2.04% 2.23% (0.19)%
db x-trackers II ITRAXX® HIVOL 5-YEAR SHORT DAILY TOTAL RETURN INDEX ETF* - 1C
LU0321462441 0.21% 4.10% 4.32% (0.22)%
db x-trackers II ITRAXX® CROSSOVER 5-YEAR SHORT DAILY TOTAL RETURN INDEX ETF* - 1C
LU0321462870 0.24% 3.58% 3.83% (0.25)%
db x-trackers II ITRAXX® EUROPE SENIOR FINANCIALS 5-YEAR TOTAL RETURN INDEX ETF* - 1C
LU0378819295 0.18% (1.78)% (1.60)% (0.18)%
db x-trackers II ITRAXX® EUROPE SUBORDINATED FINANCIALS 5-YEAR TOTAL RETURN INDEX ETF* - 1C
LU0378819378 0.21% (2.94)% (2.73)% (0.21)%
db x-trackers II ITRAXX® EUROPE SENIOR FINANCIALS 5-YEAR SHORT DAILY TOTAL RETURN INDEX ETF* - 1C
LU0378819709 0.18% 2.48% 2.66% (0.18)%
db x-trackers II ITRAXX® EUROPE SUBORDINATED FINANCIALS 5-YEAR SHORT DAILY TOTAL RETURN INDEX ETF* - 1C
LU0378819881 0.21% 2.71% 2.93% (0.22)%
Volatility strategies: db x-trackers II EURO INTEREST RATES VOLATILITY TOTAL RETURN INDEX ETF* - 1C
LU0378818644 0.25% 1.53% 1.78% (0.25)%
db x-trackers II EURO INTEREST RATES VOLATILITY SHORT TOTAL RETURN INDEX ETF* - 1C
LU0378818727 0.25% (1.51)% (1.27)% (0.24)%
Looking at the changes in the assets under management of the Sub-Funds across the different investment strategies, it can be observed that the highest net increases were recorded in Sub-Funds with cash strategies with an aggregated increase in assets under management of around EUR 760 million. This was driven primarily by inflows into the db x-trackers II EONIA TOTAL RETURN INDEX ETF*. As at the end of 2011, the Sub-Funds with cash strategies remain the second largest group of Sub-Funds with total assets under management of EUR 2.5 billion. The above mentioned concerns around the sovereign debt of various Eurozone member states led to an overall outflow of around EUR 1 billion from sovereign and covered bonds strategies, despite an overall inflow in excess of EUR 510 million into ETFs reflecting the performance of only German government bonds. Despite the overall outflows, the Sub-Funds with sovereign and covered bonds strategies remain the largest group of Sub-Funds with total assets under management of EUR 3.7 billion.
10
db x-trackers II*
* This is a synthetic ETF.
Directors’ Report (continued) The above mentioned positive performance of inflation-linked strategies led to a relatively stable increase in assets under management of Sub-Funds in this category of EUR 125 million. The Sub-Funds with inflation-linked strategies remain the third largest group of Sub-Funds with total assets under management of EUR 730 million.
The Board of Directors of the Company expects to continue expanding its product range in 2012 to enable investors to diversify further their asset allocation and allow them to access specific market segments using Sub-Funds of the Company. Amongst others, two focus areas are expected to be: 1) Further granular exposures to government bond markets of individual governments, and 2) Leveraged strategies to provide investors with efficient short term trading tools to position their portfolios and at the same time allow them to reduce invested capital.
Luxembourg, 8 March 2012 While every effort is made to ensure the accuracy of this report, should there be any material differences with the data expressed in the Prospectus and/or Product Annexes, the latter will prevail. Past performance is no indication for future returns.
11
III
!IERr44STsYo1Jr44’G tme7, rue Gabriel LippmannParc dActivité Syrdall 2L-5365 MunsbachB.P. 780L-2017 Luxembourg
Tel: +352 42 124 1Fax: ±352 42 124 5555www.ey.com/luxembourg
R.C.S. Luxembourg B 47771TVA LU 16063074
Independent Auditor’s Report
To the Shareholders of db x-trackers 11*,
49, avenue J.F. KennedyL- 1855 Luxembourg
Following our appointment by the Annual General Meeting of the Shareholders of 25 March 2011, we have audited theaccompanying financial statements of db x-trackers 11* (the “SICAV”) and of each of its Sub-Funds, which comprisethe Statement of Net Assets and the Statement of Investments as at 31 December 2011 and the Statement of Operationsand Changes in Net Assets for the year then ended, and a summary of significant accounting policies and otherexplanatory notes to the financial statements.
Responsibility of the Board ofDirectors of the SICA Vfor thefinancial statements
The Board of Directors of the SICAV is responsible for the preparation and fair presentation of these financialstatements in accordance with Luxembourg legal and regulatory requirements relating to the preparation andpresentation of the financial statements and for such internal control as the Board of Directors of the SICAV determinesis necessary to enable the preparation and presentation of financial statements that are free from material misstatement,whether due to fraud or error.
Responsibility of the “réviseur d’entreprises agréé”
Our responsibility is to express an opinion on these financial statements based on our audit. We conducted our audit inaccordance with International Standards on Auditing as adopted for Luxembourg by the “Commission de Surveillancedu Secteur Financier”. Those standards require that we comply with ethical requirements and plan and perform theaudit to obtain reasonable assurance about whether the financial statements are free from material misstatement.
An audit involves performing procedures to obtain audit evidence about the amounts and disclosures in the financialstatements. The procedures selected depend on the judgement of the “réviseur d’entreprises agréé”, including theassessment of the risks of material misstatement of the financial statements, whether due to fraud or error. In makingthose risk assessments, the “réviseur d’entreprises agréé” considers internal control relevant to the entity’s preparationand fair presentation of the financial statements in order to design audit procedures that are appropriate in thecircumstances, but not for the purpose of expressing an opinion on the effectiveness of the entity’s internal control. Anaudit also includes evaluating the appropriateness of accounting policies used and the reasonableness of accountingestimates made by the Board of Directors of the SICAV, as well as evaluating the overall presentation of the financialstatements.
We believe that the audit evidence we have obtained is sufficient and appropriate to provide a basis for our auditopinion.
* This is a synthetic ETF.
12A member firm of Ernst & Young Global Limited
It H IIl”
Opinion
iI ERNST& YOUNG
In our opinion, the financial statements give a tnie and fair view of the financial position of db x-trackers 11° and ofeach of its Sub-Funds as of 31 December 2011, and of the results of their operations and changes in their net assets forthe year then ended in accordance with Luxembourg legal and regulatory requirements relating to the preparation andpresentation of the financial statements.
Other matter
Supplementary information included in the annual report has been reviewed in the context of our mandate but has notbeen subject to specific audit procedures carried out in accordance with the standards described above. Consequently,we express no opinion on such information. However, we have no observation to make concerning such information inthe context of the financial statements taken as a whole.
Luxembourg, 8 March 2012
* This is a synthetic ETF.
ERNST & YOIJNGSociété Anonyme
Cabinet de réviion agréé
Bernard LHOEST
13A member firm or Lrnst & Young GIobI Limited
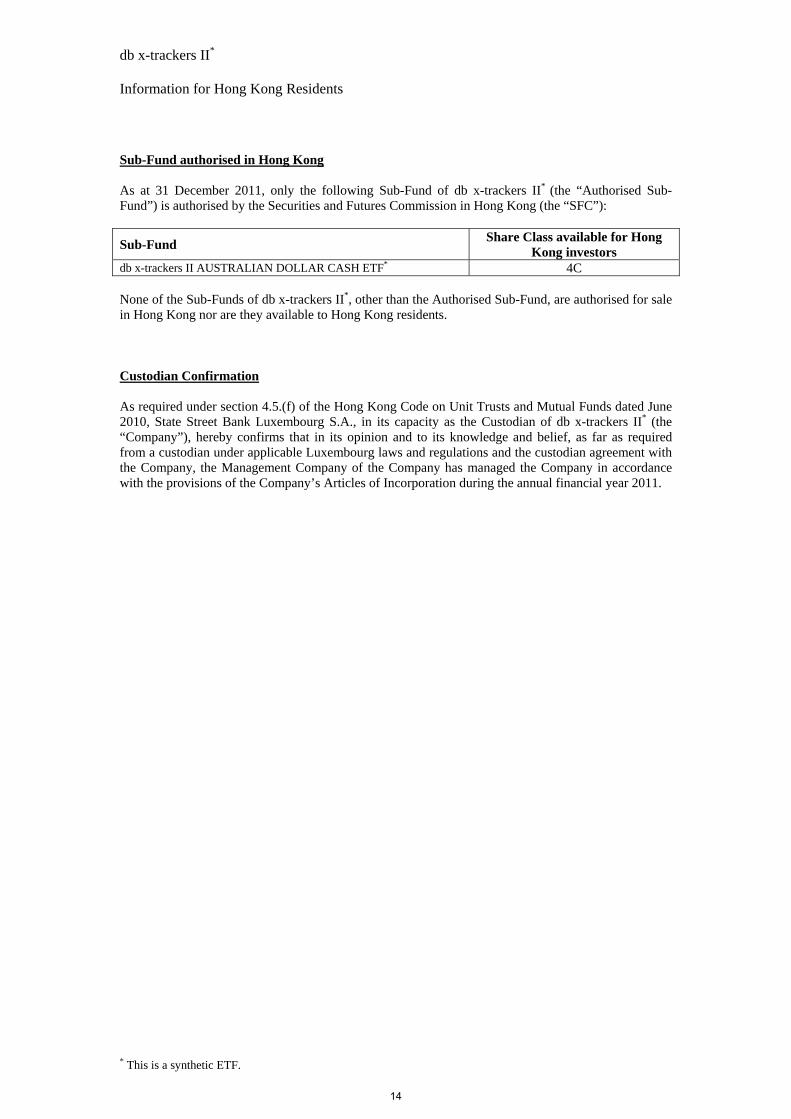
db x-trackers II* Information for Hong Kong Residents Sub-Fund authorised in Hong Kong As at 31 December 2011, only the following Sub-Fund of db x-trackers II* (the “Authorised Sub-Fund”) is authorised by the Securities and Futures Commission in Hong Kong (the “SFC”):
Sub-Fund Share Class available for Hong
Kong investors db x-trackers II AUSTRALIAN DOLLAR CASH ETF* 4C None of the Sub-Funds of db x-trackers II*, other than the Authorised Sub-Fund, are authorised for sale in Hong Kong nor are they available to Hong Kong residents. Custodian Confirmation As required under section 4.5.(f) of the Hong Kong Code on Unit Trusts and Mutual Funds dated June 2010, State Street Bank Luxembourg S.A., in its capacity as the Custodian of db x-trackers II* (the “Company”), hereby confirms that in its opinion and to its knowledge and belief, as far as required from a custodian under applicable Luxembourg laws and regulations and the custodian agreement with the Company, the Management Company of the Company has managed the Company in accordance with the provisions of the Company’s Articles of Incorporation during the annual financial year 2011.
* This is a synthetic ETF.
14
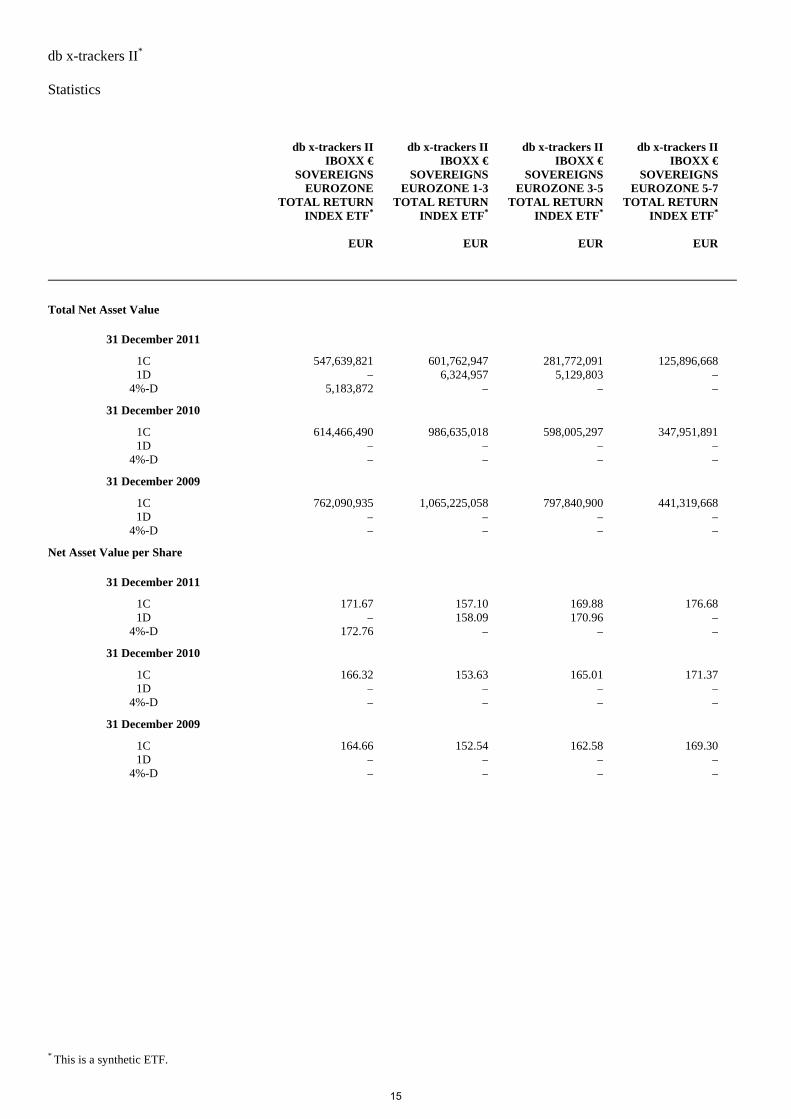
db x-trackers II* Statistics
* This is a synthetic ETF.
db x-trackers IIIBOXX €
SOVEREIGNSEUROZONE
TOTAL RETURNINDEX ETF*
db x-trackers II IBOXX €
SOVEREIGNS EUROZONE 1-3
TOTAL RETURN INDEX ETF*
db x-trackers II IBOXX €
SOVEREIGNS EUROZONE 3-5
TOTAL RETURN INDEX ETF*
db x-trackers II IBOXX €
SOVEREIGNS EUROZONE 5-7
TOTAL RETURN INDEX ETF*
EUR EUR EUR EUR
Total Net Asset Value
31 December 2011
1C 547,639,821 601,762,947 281,772,091 125,896,668 1D – 6,324,957 5,129,803 –
4%-D 5,183,872 – – –
31 December 2010
1C 614,466,490 986,635,018 598,005,297 347,951,891 1D – – – –
4%-D – – – –
31 December 2009
1C 762,090,935 1,065,225,058 797,840,900 441,319,668 1D – – – –
4%-D – – – –
Net Asset Value per Share
31 December 2011
1C 171.67 157.10 169.88 176.68 1D – 158.09 170.96 –
4%-D 172.76 – – –
31 December 2010
1C 166.32 153.63 165.01 171.37 1D – – – –
4%-D – – – –
31 December 2009
1C 164.66 152.54 162.58 169.30 1D – – – –
4%-D – – – –
15

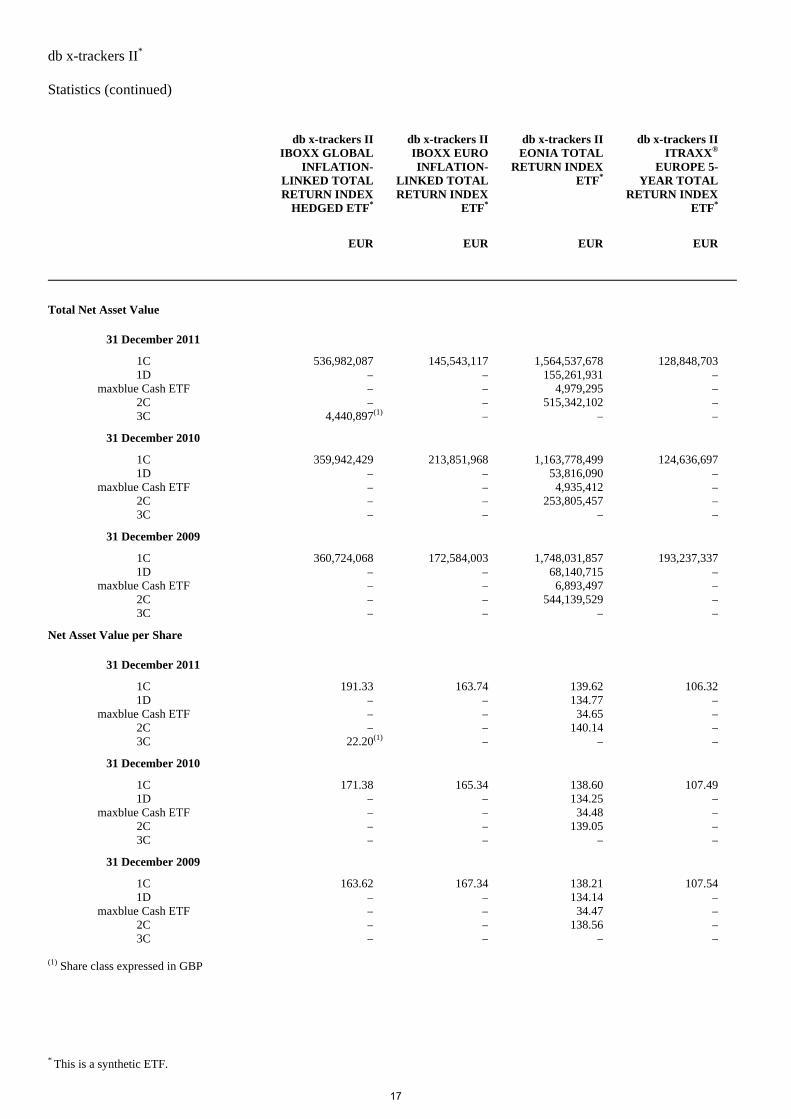
db x-trackers II* Statistics (continued)
* This is a synthetic ETF.
db x-trackers II
IBOXX € SOVEREIGNS
EUROZONE 7-10 TOTAL RETURN
INDEX ETF*
db x-trackers II IBOXX €
SOVEREIGNS EUROZONE 10-
15 TOTAL RETURN INDEX
ETF*
db x-trackers II IBOXX €
SOVEREIGNS EUROZONE 15+
TOTAL RETURN INDEX ETF*
db x-trackers II IBOXX €
SOVEREIGNS EUROZONE 25+
TOTAL RETURN INDEX ETF*
EUR EUR EUR EUR
Total Net Asset Value
31 December 2011
1C 82,161,520 20,850,206 17,212,887 20,517,016
31 December 2010
1C 89,230,565 30,629,934 30,513,295 58,307,405
31 December 2009
1C 260,626,997 75,559,427 17,177,247 18,204,236
Net Asset Value per Share
31 December 2011
1C 177.78 170.06 191.20 195.10
31 December 2010
1C 171.19 167.91 181.52 179.51
31 December 2009
1C 171.53 171.00 175.48 174.03
16
db x-trackers II* Statistics (continued)
* This is a synthetic ETF.
db x-trackers II
IBOXX GLOBALINFLATION-
LINKED TOTALRETURN INDEX
HEDGED ETF*
db x-trackers II IBOXX EURO INFLATION-
LINKED TOTAL RETURN INDEX
ETF*
db x-trackers II EONIA TOTAL
RETURN INDEX ETF*
db x-trackers II ITRAXX®
EUROPE 5-YEAR TOTAL
RETURN INDEX ETF*
EUR EUR EUR EUR
Total Net Asset Value
31 December 2011
1C 536,982,087 145,543,117 1,564,537,678 128,848,703 1D – – 155,261,931 –
maxblue Cash ETF – – 4,979,295 – 2C – – 515,342,102 – 3C 4,440,897(1) – – –
31 December 2010
1C 359,942,429 213,851,968 1,163,778,499 124,636,697 1D – – 53,816,090 –
maxblue Cash ETF – – 4,935,412 – 2C – – 253,805,457 – 3C – – – –
31 December 2009
1C 360,724,068 172,584,003 1,748,031,857 193,237,337 1D – – 68,140,715 –
maxblue Cash ETF – – 6,893,497 – 2C – – 544,139,529 – 3C – – – –
Net Asset Value per Share
31 December 2011
1C 191.33 163.74 139.62 106.32 1D – – 134.77 –
maxblue Cash ETF – – 34.65 – 2C – – 140.14 – 3C 22.20(1) – – –
31 December 2010
1C 171.38 165.34 138.60 107.49 1D – – 134.25 –
maxblue Cash ETF – – 34.48 – 2C – – 139.05 – 3C – – – –
31 December 2009
1C 163.62 167.34 138.21 107.54 1D – – 134.14 –
maxblue Cash ETF – – 34.47 – 2C – – 138.56 – 3C – – – –
(1) Share class expressed in GBP
17
db x-trackers II* Statistics (continued)
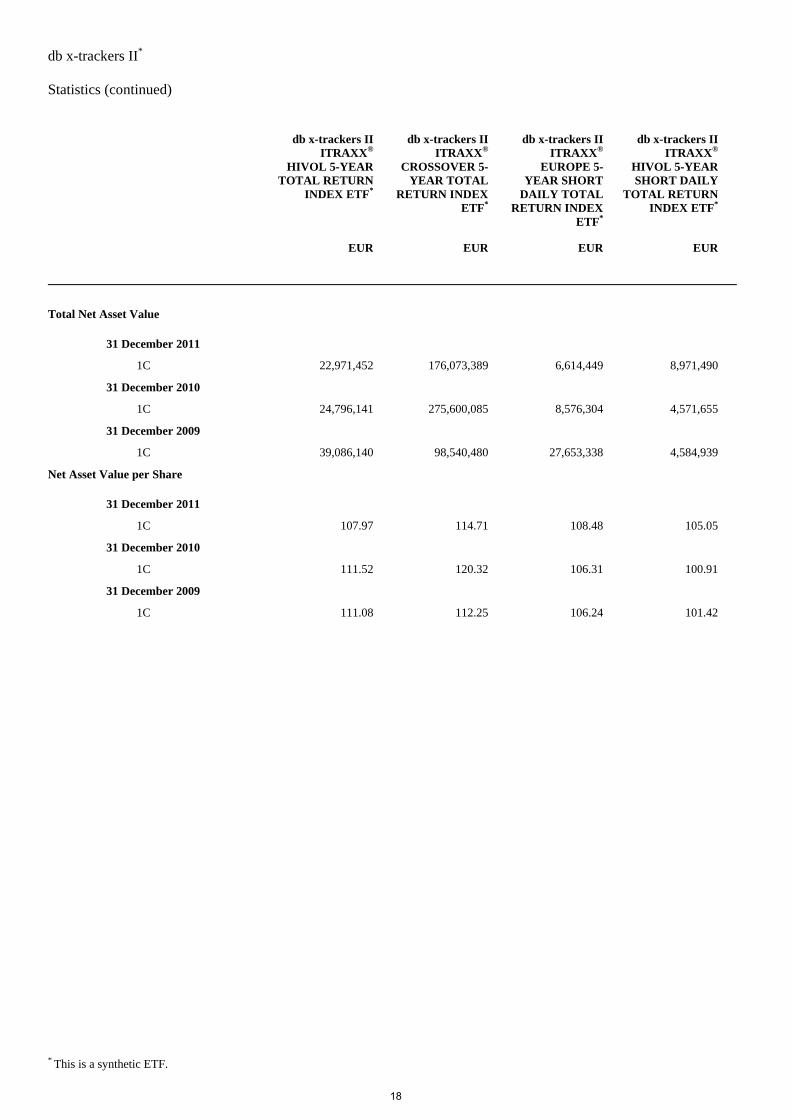
* This is a synthetic ETF.
db x-trackers II
ITRAXX®
HIVOL 5-YEAR TOTAL RETURN
INDEX ETF*
db x-trackers II ITRAXX®
CROSSOVER 5-YEAR TOTAL
RETURN INDEX ETF*
db x-trackers II ITRAXX®
EUROPE 5-YEAR SHORT
DAILY TOTAL RETURN INDEX
ETF*
db x-trackers II ITRAXX®
HIVOL 5-YEAR SHORT DAILY
TOTAL RETURN INDEX ETF*
EUR EUR EUR EUR
Total Net Asset Value
31 December 2011
1C 22,971,452 176,073,389 6,614,449 8,971,490
31 December 2010
1C 24,796,141 275,600,085 8,576,304 4,571,655
31 December 2009
1C 39,086,140 98,540,480 27,653,338 4,584,939
Net Asset Value per Share
31 December 2011
1C 107.97 114.71 108.48 105.05
31 December 2010
1C 111.52 120.32 106.31 100.91
31 December 2009
1C 111.08 112.25 106.24 101.42
18

db x-trackers II* Statistics (continued)
* This is a synthetic ETF.
db x-trackers II
ITRAXX®
CROSSOVER 5-YEAR SHORT
DAILY TOTAL RETURN INDEX
ETF*
db x-trackers II EMERGING
MARKETS LIQUID
EUROBOND INDEX ETF*
db x-trackers II SHORT IBOXX €
SOVEREIGNS EUROZONE
DAILY TOTAL RETURN INDEX
ETF*
db x-trackers II IBOXX €
GERMANY COVERED
TOTAL RETURN INDEX ETF*
EUR EUR EUR EUR
Total Net Asset Value
31 December 2011
1C 52,850,165 310,081,277 252,304,156 279,136,919
31 December 2010
1C 38,192,226 340,141,782 817,243,603 362,840,319
31 December 2009
1C 41,933,260 78,749,081 510,867,963 319,856,920
Net Asset Value per Share
31 December 2011
1C 87.44 249.54 109.66 174.22
31 December 2010
1C 84.42 235.47 112.25 167.99
31 December 2009
1C 92.93 218.27 113.23 162.62
19
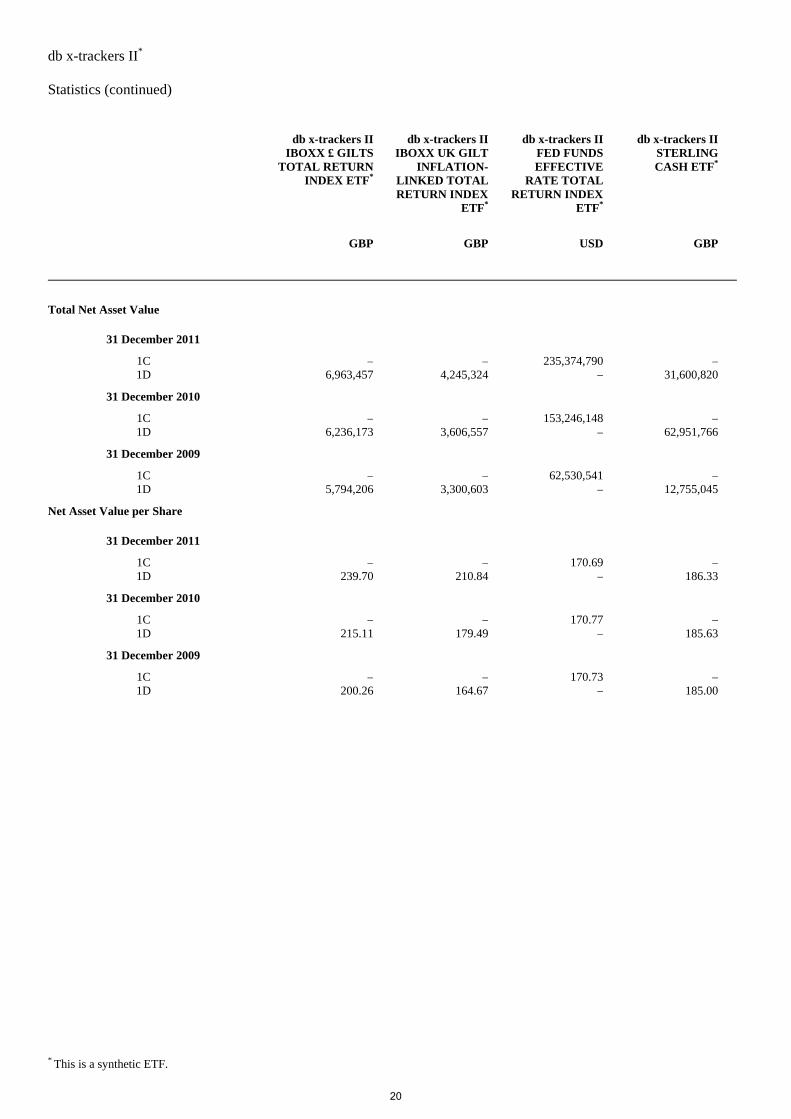
db x-trackers II* Statistics (continued)
* This is a synthetic ETF.
db x-trackers II
IBOXX £ GILTSTOTAL RETURN
INDEX ETF*
db x-trackers II IBOXX UK GILT
INFLATION-LINKED TOTAL RETURN INDEX
ETF*
db x-trackers II FED FUNDS EFFECTIVE
RATE TOTAL RETURN INDEX
ETF*
db x-trackers II STERLING CASH ETF*
GBP GBP USD GBP
Total Net Asset Value
31 December 2011
1C – – 235,374,790 – 1D 6,963,457 4,245,324 – 31,600,820
31 December 2010
1C – – 153,246,148 – 1D 6,236,173 3,606,557 – 62,951,766
31 December 2009
1C – – 62,530,541 – 1D 5,794,206 3,300,603 – 12,755,045
Net Asset Value per Share
31 December 2011
1C – – 170.69 – 1D 239.70 210.84 – 186.33
31 December 2010
1C – – 170.77 – 1D 215.11 179.49 – 185.63
31 December 2009
1C – – 170.73 – 1D 200.26 164.67 – 185.00
20
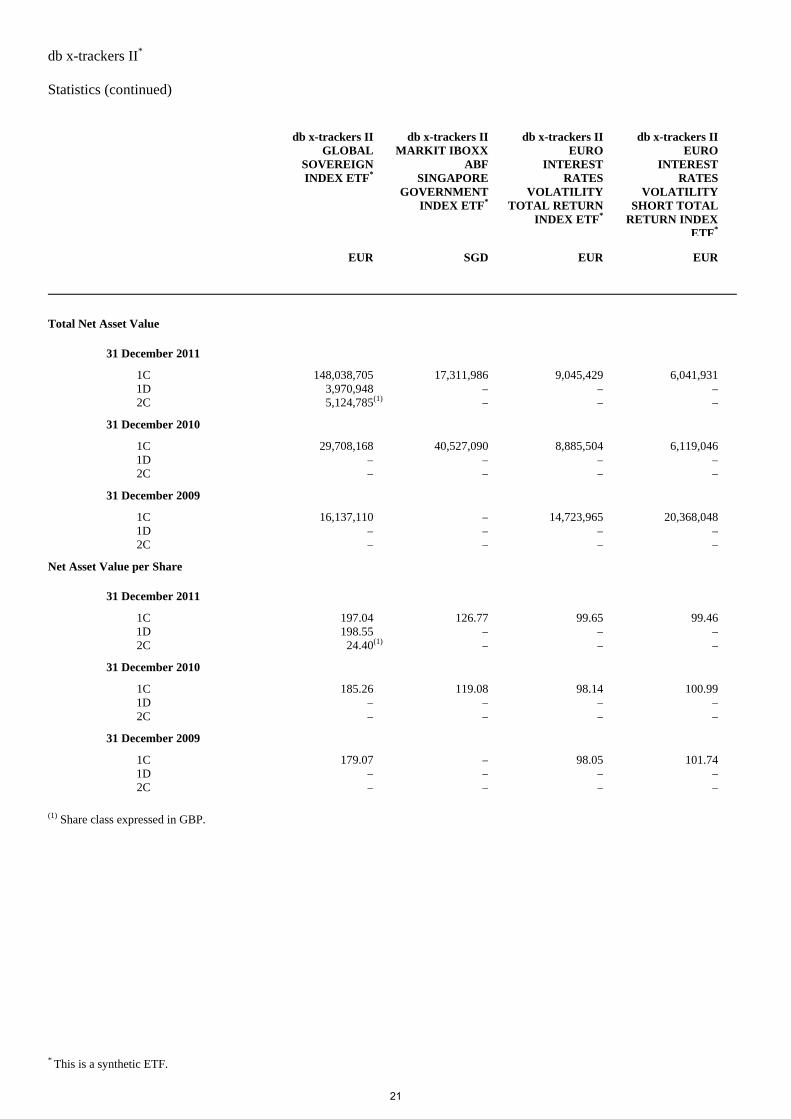
db x-trackers II* Statistics (continued)
* This is a synthetic ETF.
db x-trackers II
GLOBALSOVEREIGNINDEX ETF*
db x-trackers II MARKIT IBOXX
ABF SINGAPORE
GOVERNMENT INDEX ETF*
db x-trackers II EURO
INTEREST RATES
VOLATILITY TOTAL RETURN
INDEX ETF*
db x-trackers II EURO
INTEREST RATES
VOLATILITY SHORT TOTAL
RETURN INDEX ETF*
EUR SGD EUR EUR
Total Net Asset Value
31 December 2011
1C 148,038,705 17,311,986 9,045,429 6,041,931 1D 3,970,948 – – – 2C 5,124,785(1) – – –
31 December 2010
1C 29,708,168 40,527,090 8,885,504 6,119,046 1D – – – – 2C – – – –
31 December 2009
1C 16,137,110 – 14,723,965 20,368,048 1D – – – – 2C – – – –
Net Asset Value per Share
31 December 2011
1C 197.04 126.77 99.65 99.46 1D 198.55 – – – 2C 24.40(1) – – –
31 December 2010
1C 185.26 119.08 98.14 100.99 1D – – – – 2C – – – –
31 December 2009
1C 179.07 – 98.05 101.74 1D – – – – 2C – – – –
(1) Share class expressed in GBP.
21
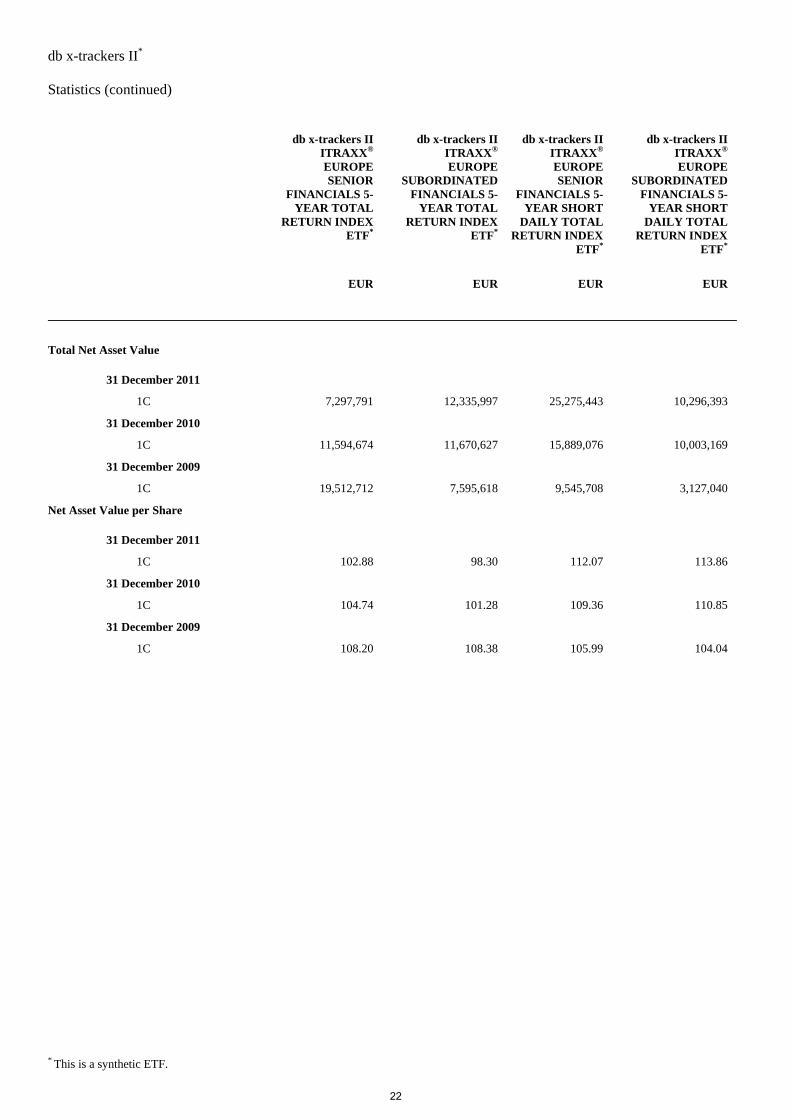
db x-trackers II* Statistics (continued)
* This is a synthetic ETF.
db x-trackers II
ITRAXX®
EUROPESENIOR
FINANCIALS 5-YEAR TOTAL
RETURN INDEXETF*
db x-trackers II ITRAXX®
EUROPE SUBORDINATED
FINANCIALS 5-YEAR TOTAL
RETURN INDEX ETF*
db x-trackers II ITRAXX®
EUROPE SENIOR
FINANCIALS 5-YEAR SHORT
DAILY TOTAL RETURN INDEX
ETF*
db x-trackers II ITRAXX®
EUROPE SUBORDINATED
FINANCIALS 5-YEAR SHORT
DAILY TOTAL RETURN INDEX
ETF*
EUR EUR EUR EUR
Total Net Asset Value
31 December 2011
1C 7,297,791 12,335,997 25,275,443 10,296,393
31 December 2010
1C 11,594,674 11,670,627 15,889,076 10,003,169
31 December 2009
1C 19,512,712 7,595,618 9,545,708 3,127,040
Net Asset Value per Share
31 December 2011
1C 102.88 98.30 112.07 113.86
31 December 2010
1C 104.74 101.28 109.36 110.85
31 December 2009
1C 108.20 108.38 105.99 104.04
22
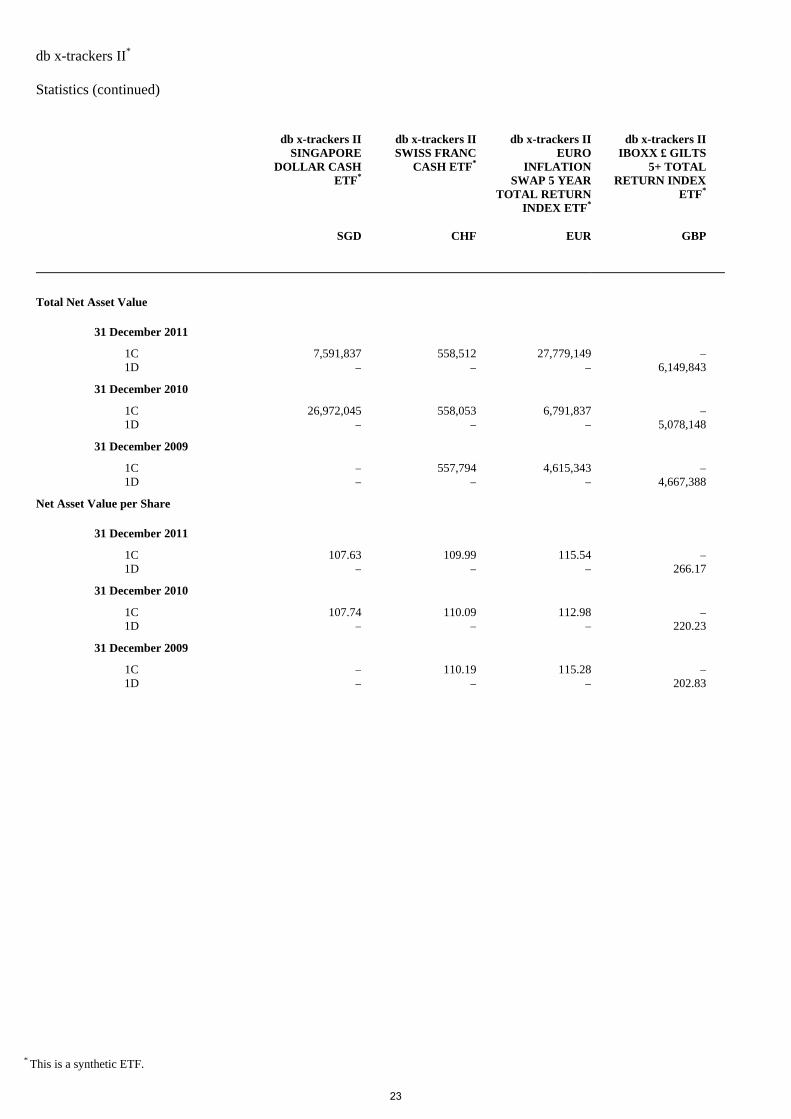
db x-trackers II* Statistics (continued)
* This is a synthetic ETF.
db x-trackers II
SINGAPOREDOLLAR CASH
ETF*
db x-trackers II SWISS FRANC
CASH ETF*
db x-trackers II EURO
INFLATION SWAP 5 YEAR
TOTAL RETURN INDEX ETF*
db x-trackers II IBOXX £ GILTS
5+ TOTAL RETURN INDEX
ETF*
SGD CHF EUR GBP
Total Net Asset Value
31 December 2011
1C 7,591,837 558,512 27,779,149 – 1D – – – 6,149,843
31 December 2010
1C 26,972,045 558,053 6,791,837 – 1D – – – 5,078,148
31 December 2009
1C – 557,794 4,615,343 – 1D – – – 4,667,388
Net Asset Value per Share
31 December 2011
1C 107.63 109.99 115.54 – 1D – – – 266.17
31 December 2010
1C 107.74 110.09 112.98 – 1D – – – 220.23
31 December 2009
1C – 110.19 115.28 – 1D – – – 202.83
23
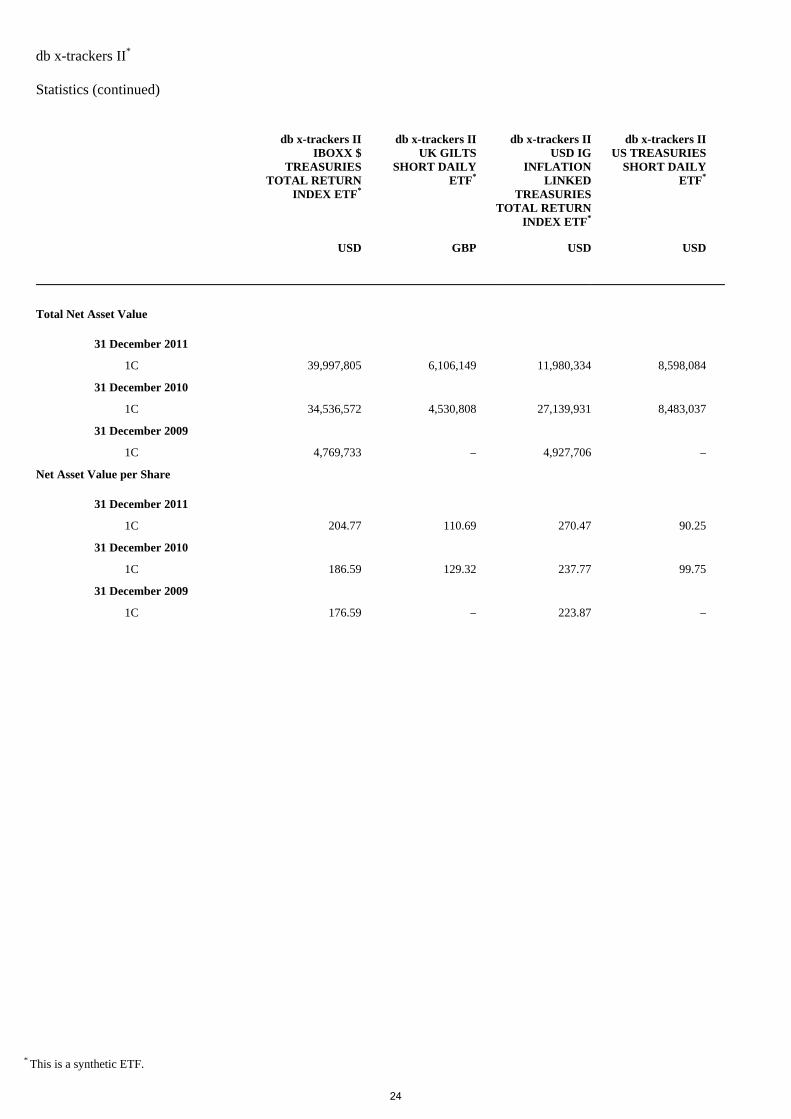
db x-trackers II* Statistics (continued)
* This is a synthetic ETF.
db x-trackers II
IBOXX $TREASURIES
TOTAL RETURNINDEX ETF*
db x-trackers II UK GILTS
SHORT DAILY ETF*
db x-trackers II USD IG
INFLATION LINKED
TREASURIES TOTAL RETURN
INDEX ETF*
db x-trackers II US TREASURIES
SHORT DAILY ETF*
USD GBP USD USD
Total Net Asset Value
31 December 2011
1C 39,997,805 6,106,149 11,980,334 8,598,084
31 December 2010
1C 34,536,572 4,530,808 27,139,931 8,483,037
31 December 2009
1C 4,769,733 – 4,927,706 –
Net Asset Value per Share
31 December 2011
1C 204.77 110.69 270.47 90.25
31 December 2010
1C 186.59 129.32 237.77 99.75
31 December 2009
1C 176.59 – 223.87 –
24
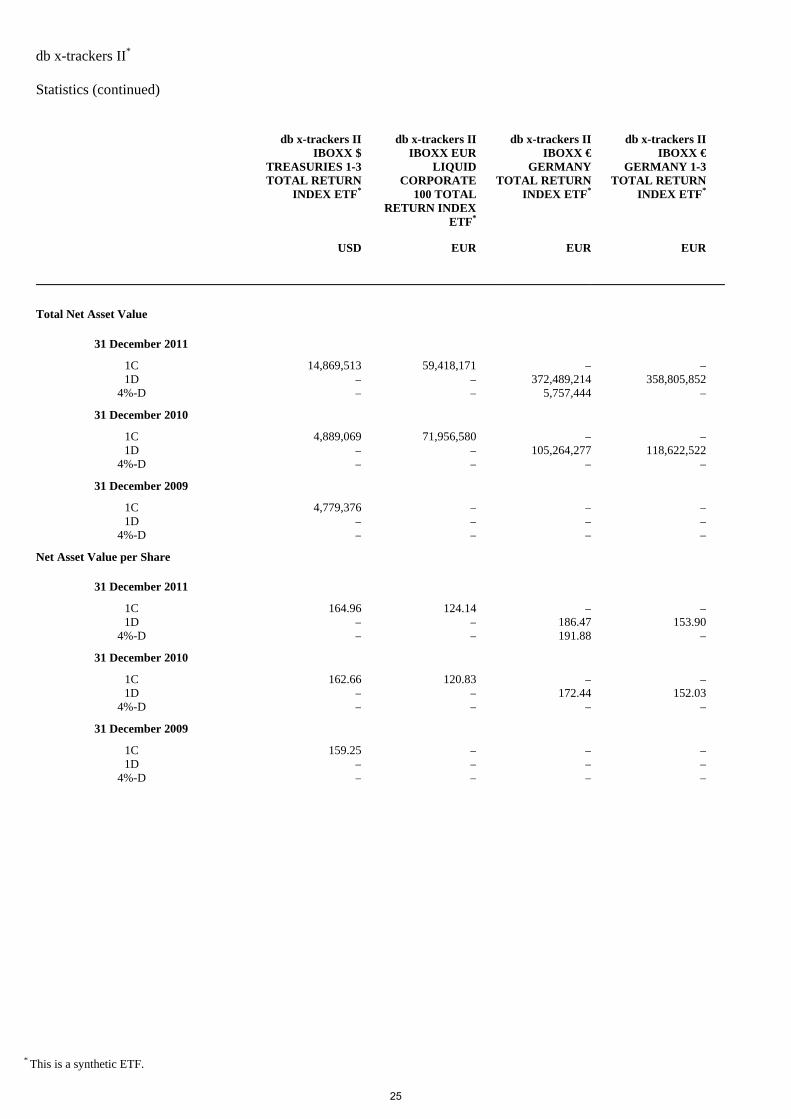
db x-trackers II* Statistics (continued)
* This is a synthetic ETF.
db x-trackers II
IBOXX $TREASURIES 1-3 TOTAL RETURN
INDEX ETF*
db x-trackers II IBOXX EUR
LIQUID CORPORATE
100 TOTAL RETURN INDEX
ETF*
db x-trackers II IBOXX €
GERMANY TOTAL RETURN
INDEX ETF*
db x-trackers II IBOXX €
GERMANY 1-3 TOTAL RETURN
INDEX ETF*
USD EUR EUR EUR
Total Net Asset Value
31 December 2011
1C 14,869,513 59,418,171 – – 1D – – 372,489,214 358,805,852
4%-D – – 5,757,444 –
31 December 2010
1C 4,889,069 71,956,580 – – 1D – – 105,264,277 118,622,522
4%-D – – – –
31 December 2009
1C 4,779,376 – – – 1D – – – –
4%-D – – – –
Net Asset Value per Share
31 December 2011
1C 164.96 124.14 – – 1D – – 186.47 153.90
4%-D – – 191.88 –
31 December 2010
1C 162.66 120.83 – – 1D – – 172.44 152.03
4%-D – – – –
31 December 2009
1C 159.25 – – – 1D – – – –
4%-D – – – –
25
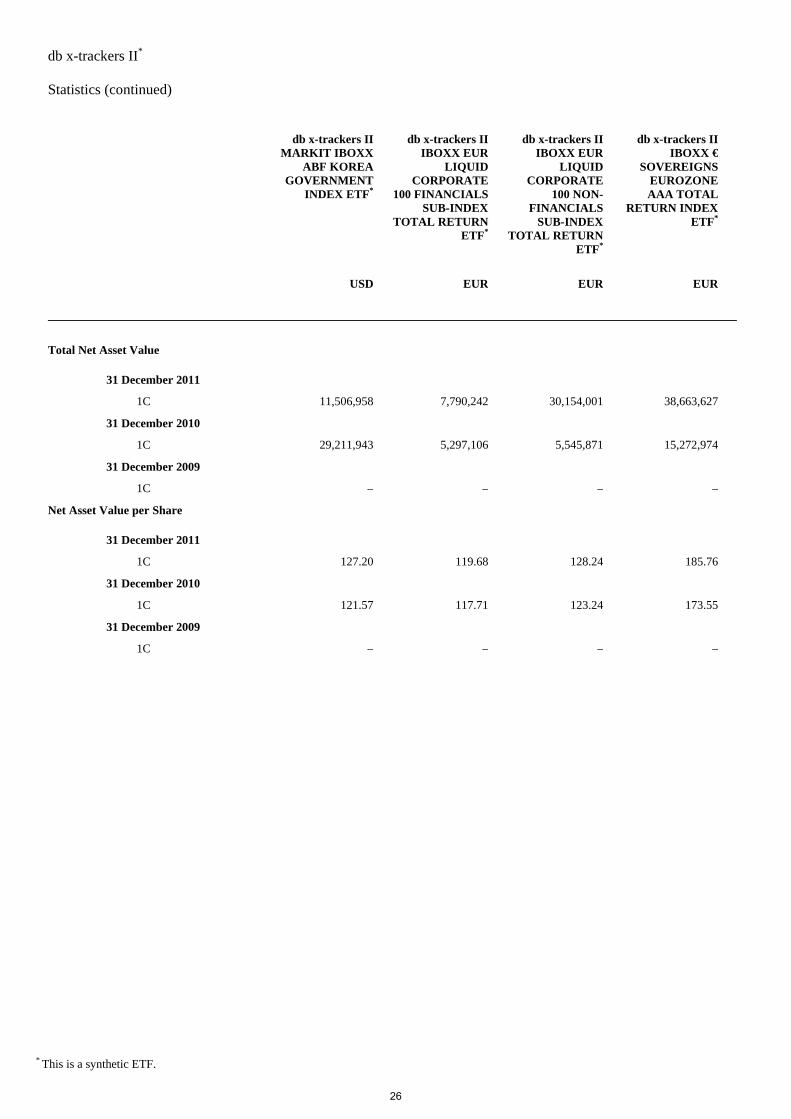
db x-trackers II* Statistics (continued)
* This is a synthetic ETF.
db x-trackers II
MARKIT IBOXXABF KOREA
GOVERNMENTINDEX ETF*
db x-trackers II IBOXX EUR
LIQUID CORPORATE
100 FINANCIALS SUB-INDEX
TOTAL RETURN ETF*
db x-trackers II IBOXX EUR
LIQUID CORPORATE
100 NON-FINANCIALS
SUB-INDEX TOTAL RETURN
ETF*
db x-trackers II IBOXX €
SOVEREIGNS EUROZONE AAA TOTAL
RETURN INDEX ETF*
USD EUR EUR EUR
Total Net Asset Value
31 December 2011
1C 11,506,958 7,790,242 30,154,001 38,663,627
31 December 2010
1C 29,211,943 5,297,106 5,545,871 15,272,974
31 December 2009
1C – – – –
Net Asset Value per Share
31 December 2011
1C 127.20 119.68 128.24 185.76
31 December 2010
1C 121.57 117.71 123.24 173.55
31 December 2009
1C – – – –
26
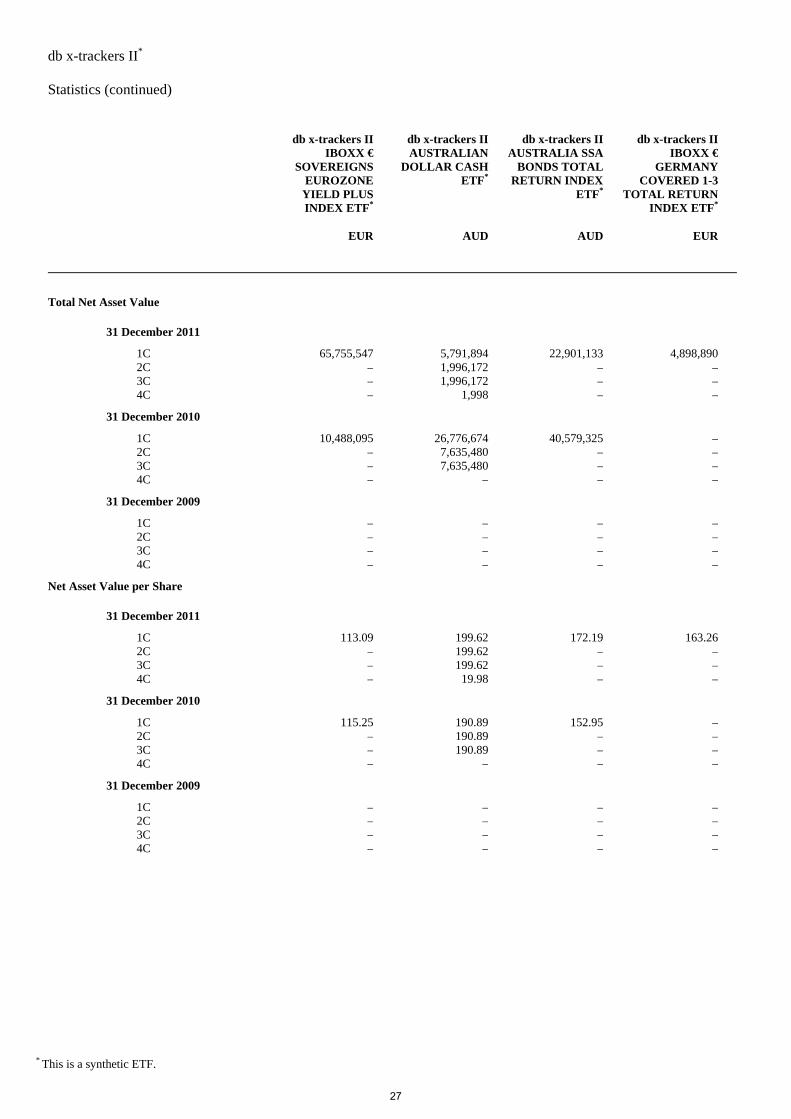
db x-trackers II* Statistics (continued)
* This is a synthetic ETF.
db x-trackers II
IBOXX € SOVEREIGNS
EUROZONEYIELD PLUSINDEX ETF*
db x-trackers II AUSTRALIAN
DOLLAR CASH ETF*
db x-trackers II AUSTRALIA SSA
BONDS TOTAL RETURN INDEX
ETF*
db x-trackers II IBOXX €
GERMANY COVERED 1-3
TOTAL RETURN INDEX ETF*
EUR AUD AUD EUR
Total Net Asset Value
31 December 2011
1C 65,755,547 5,791,894 22,901,133 4,898,890 2C – 1,996,172 – – 3C – 1,996,172 – – 4C – 1,998 – –
31 December 2010
1C 10,488,095 26,776,674 40,579,325 – 2C – 7,635,480 – – 3C – 7,635,480 – – 4C – – – –
31 December 2009
1C – – – – 2C – – – – 3C – – – – 4C – – – –
Net Asset Value per Share
31 December 2011
1C 113.09 199.62 172.19 163.26 2C – 199.62 – – 3C – 199.62 – – 4C – 19.98 – –
31 December 2010
1C 115.25 190.89 152.95 – 2C – 190.89 – – 3C – 190.89 – – 4C – – – –
31 December 2009
1C – – – – 2C – – – – 3C – – – – 4C – – – –
27
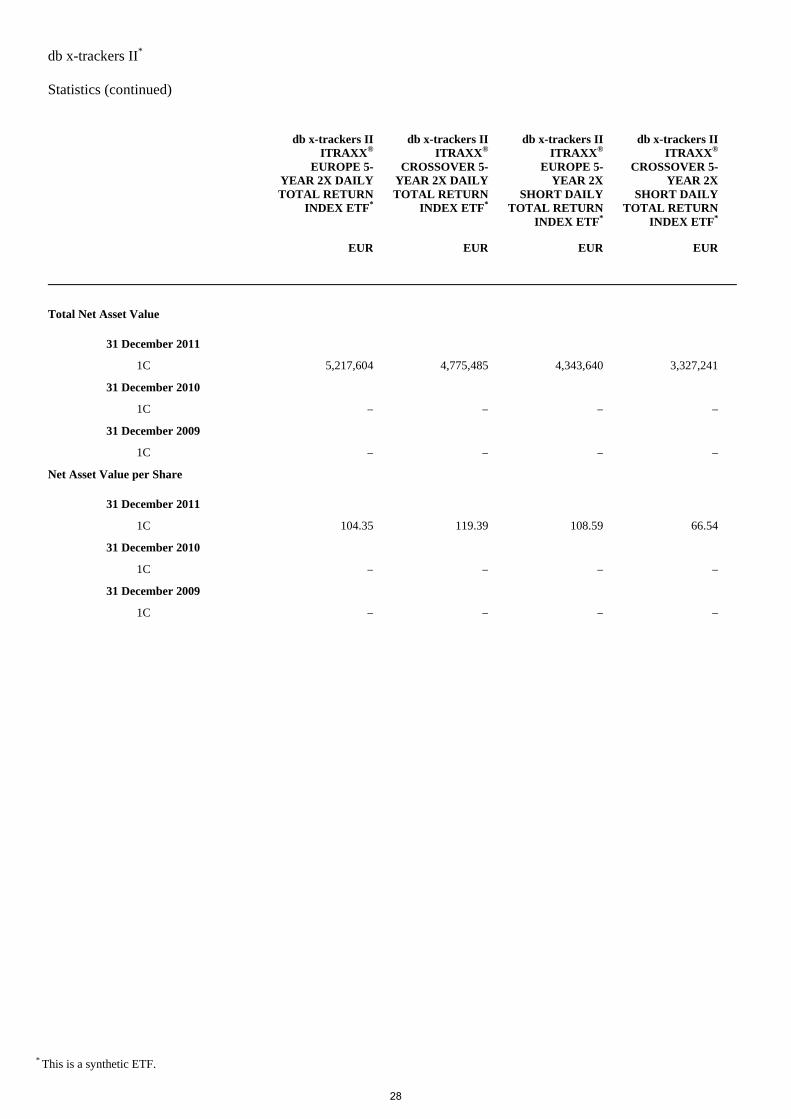
db x-trackers II* Statistics (continued)
* This is a synthetic ETF.
db x-trackers II
ITRAXX®
EUROPE 5-YEAR 2X DAILYTOTAL RETURN
INDEX ETF*
db x-trackers II ITRAXX®
CROSSOVER 5-YEAR 2X DAILY TOTAL RETURN
INDEX ETF*
db x-trackers II ITRAXX®
EUROPE 5-YEAR 2X
SHORT DAILY TOTAL RETURN
INDEX ETF*
db x-trackers II ITRAXX®
CROSSOVER 5-YEAR 2X
SHORT DAILY TOTAL RETURN
INDEX ETF*
EUR EUR EUR EUR
Total Net Asset Value
31 December 2011
1C 5,217,604 4,775,485 4,343,640 3,327,241
31 December 2010
1C – – – –
31 December 2009
1C – – – –
Net Asset Value per Share
31 December 2011
1C 104.35 119.39 108.59 66.54
31 December 2010
1C – – – –
31 December 2009
1C – – – –
28
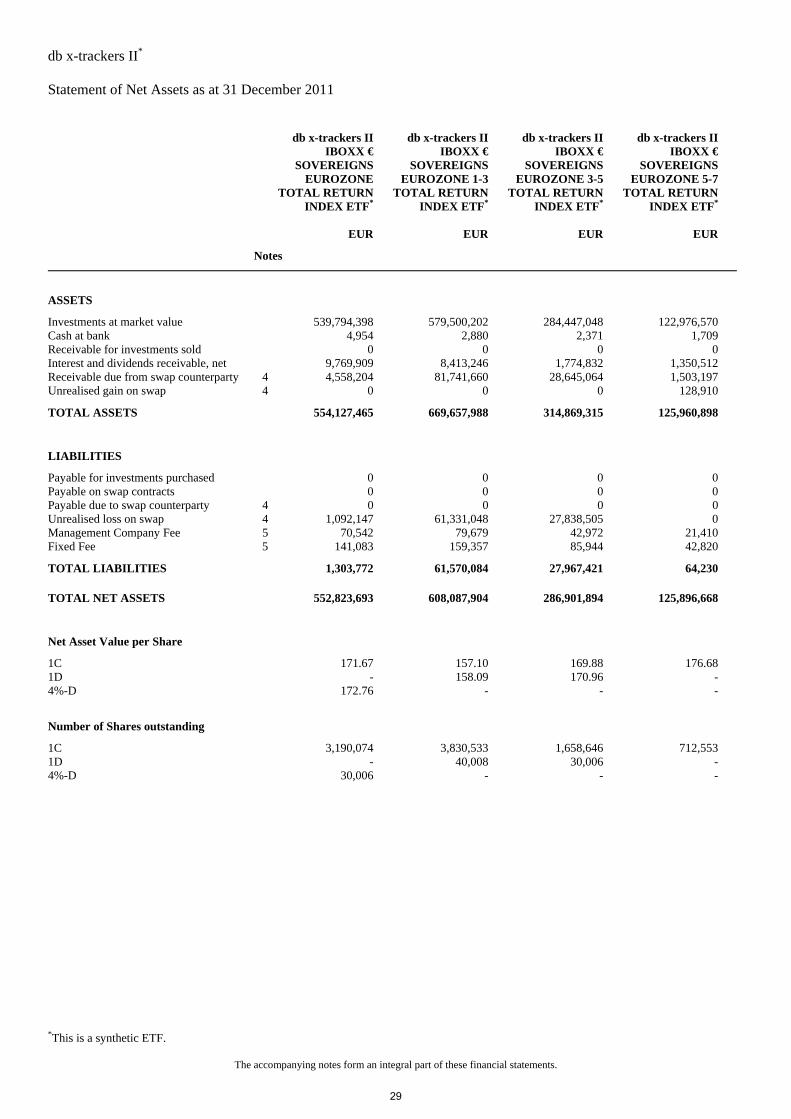
db x-trackers II* Statement of Net Assets as at 31 December 2011
*This is a synthetic ETF.
The accompanying notes form an integral part of these financial statements.
db x-trackers II
IBOXX € SOVEREIGNS
EUROZONETOTAL RETURN
INDEX ETF*
db x-trackers II IBOXX €
SOVEREIGNS EUROZONE 1-3
TOTAL RETURN INDEX ETF*
db x-trackers II IBOXX €
SOVEREIGNS EUROZONE 3-5
TOTAL RETURN INDEX ETF*
db x-trackers II IBOXX €
SOVEREIGNS EUROZONE 5-7
TOTAL RETURN INDEX ETF*
EUR EUR EUR EUR
Notes
ASSETS
Investments at market value 539,794,398 579,500,202 284,447,048 122,976,570 Cash at bank 4,954 2,880 2,371 1,709 Receivable for investments sold 0 0 0 0 Interest and dividends receivable, net 9,769,909 8,413,246 1,774,832 1,350,512 Receivable due from swap counterparty 4 4,558,204 81,741,660 28,645,064 1,503,197 Unrealised gain on swap 4 0 0 0 128,910
TOTAL ASSETS 554,127,465 669,657,988 314,869,315 125,960,898
LIABILITIES
Payable for investments purchased 0 0 0 0 Payable on swap contracts 0 0 0 0 Payable due to swap counterparty 4 0 0 0 0 Unrealised loss on swap 4 1,092,147 61,331,048 27,838,505 0 Management Company Fee 5 70,542 79,679 42,972 21,410 Fixed Fee 5 141,083 159,357 85,944 42,820
TOTAL LIABILITIES 1,303,772 61,570,084 27,967,421 64,230
TOTAL NET ASSETS 552,823,693 608,087,904 286,901,894 125,896,668
Net Asset Value per Share
1C 171.67 157.10 169.88 176.68 1D - 158.09 170.96 - 4%-D 172.76 - - -
Number of Shares outstanding
1C 3,190,074 3,830,533 1,658,646 712,553 1D - 40,008 30,006 - 4%-D 30,006 - - -
29
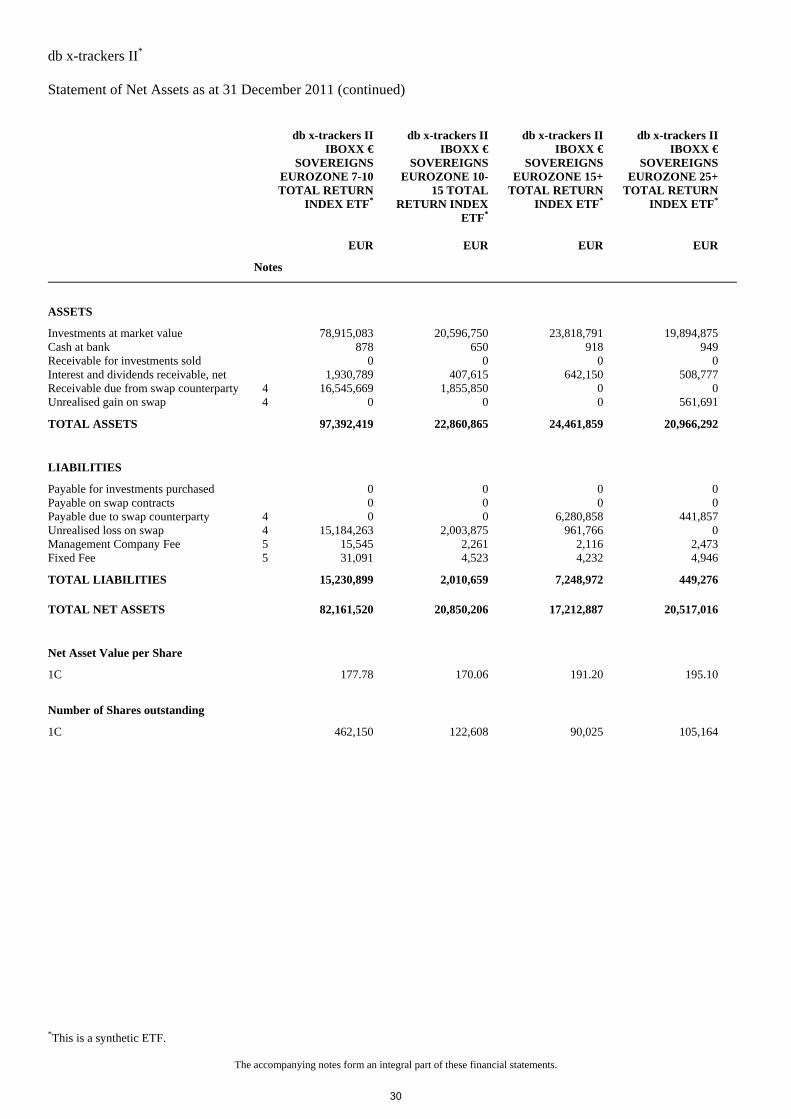
db x-trackers II* Statement of Net Assets as at 31 December 2011 (continued)
*This is a synthetic ETF.
The accompanying notes form an integral part of these financial statements.
db x-trackers II
IBOXX € SOVEREIGNS
EUROZONE 7-10 TOTAL RETURN
INDEX ETF*
db x-trackers II IBOXX €
SOVEREIGNS EUROZONE 10-
15 TOTAL RETURN INDEX
ETF*
db x-trackers II IBOXX €
SOVEREIGNS EUROZONE 15+
TOTAL RETURN INDEX ETF*
db x-trackers II IBOXX €
SOVEREIGNS EUROZONE 25+
TOTAL RETURN INDEX ETF*
EUR EUR EUR EUR
Notes
ASSETS
Investments at market value 78,915,083 20,596,750 23,818,791 19,894,875 Cash at bank 878 650 918 949 Receivable for investments sold 0 0 0 0 Interest and dividends receivable, net 1,930,789 407,615 642,150 508,777 Receivable due from swap counterparty 4 16,545,669 1,855,850 0 0 Unrealised gain on swap 4 0 0 0 561,691
TOTAL ASSETS 97,392,419 22,860,865 24,461,859 20,966,292
LIABILITIES
Payable for investments purchased 0 0 0 0 Payable on swap contracts 0 0 0 0 Payable due to swap counterparty 4 0 0 6,280,858 441,857 Unrealised loss on swap 4 15,184,263 2,003,875 961,766 0 Management Company Fee 5 15,545 2,261 2,116 2,473 Fixed Fee 5 31,091 4,523 4,232 4,946
TOTAL LIABILITIES 15,230,899 2,010,659 7,248,972 449,276
TOTAL NET ASSETS 82,161,520 20,850,206 17,212,887 20,517,016
Net Asset Value per Share
1C 177.78 170.06 191.20 195.10
Number of Shares outstanding
1C 462,150 122,608 90,025 105,164
30
db x-trackers II* Statement of Net Assets as at 31 December 2011 (continued)
*This is a synthetic ETF.
The accompanying notes form an integral part of these financial statements.
db x-trackers II
IBOXX GLOBALINFLATION-
LINKED TOTALRETURN INDEX
HEDGED ETF*
db x-trackers II IBOXX EURO INFLATION-
LINKED TOTAL RETURN INDEX
ETF*
db x-trackers II EONIA TOTAL
RETURN INDEX ETF*
db x-trackers II ITRAXX®
EUROPE 5-YEAR TOTAL
RETURN INDEX ETF*
EUR EUR EUR EUR
Notes
ASSETS
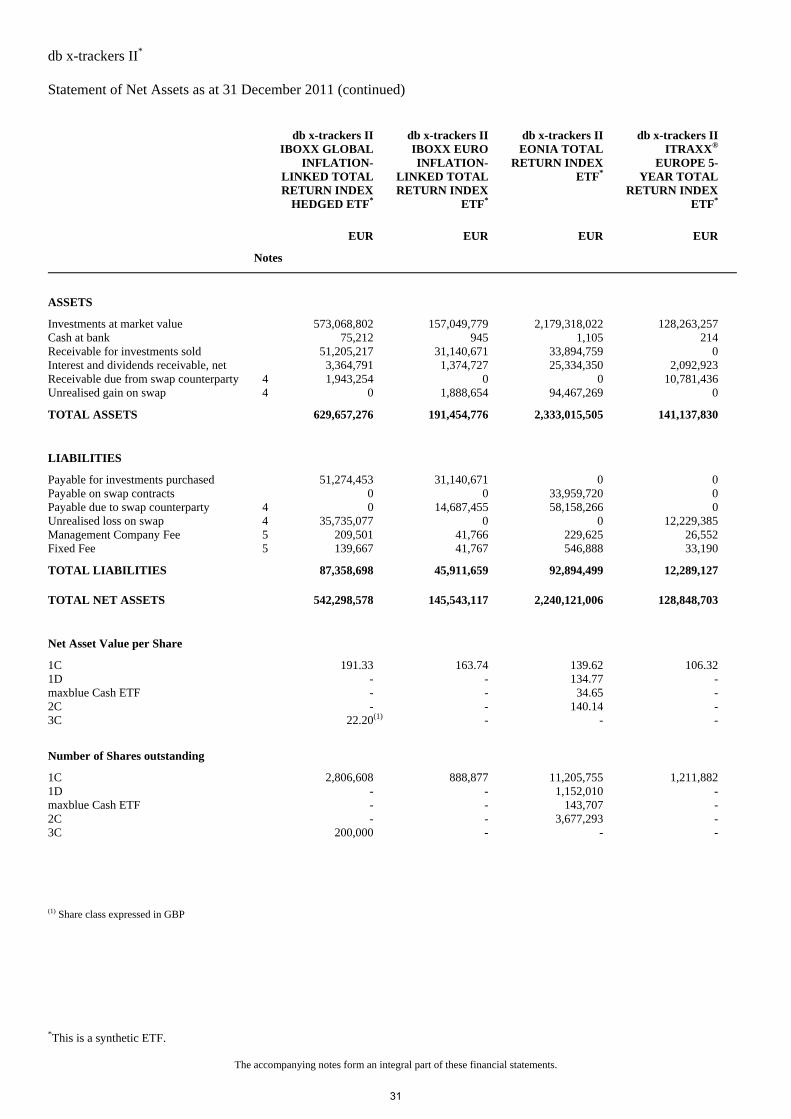
Investments at market value 573,068,802 157,049,779 2,179,318,022 128,263,257 Cash at bank 75,212 945 1,105 214 Receivable for investments sold 51,205,217 31,140,671 33,894,759 0 Interest and dividends receivable, net 3,364,791 1,374,727 25,334,350 2,092,923 Receivable due from swap counterparty 4 1,943,254 0 0 10,781,436 Unrealised gain on swap 4 0 1,888,654 94,467,269 0
TOTAL ASSETS 629,657,276 191,454,776 2,333,015,505 141,137,830
LIABILITIES
Payable for investments purchased 51,274,453 31,140,671 0 0 Payable on swap contracts 0 0 33,959,720 0 Payable due to swap counterparty 4 0 14,687,455 58,158,266 0 Unrealised loss on swap 4 35,735,077 0 0 12,229,385 Management Company Fee 5 209,501 41,766 229,625 26,552 Fixed Fee 5 139,667 41,767 546,888 33,190
TOTAL LIABILITIES 87,358,698 45,911,659 92,894,499 12,289,127
TOTAL NET ASSETS 542,298,578 145,543,117 2,240,121,006 128,848,703
Net Asset Value per Share
1C 191.33 163.74 139.62 106.32 1D - - 134.77 - maxblue Cash ETF - - 34.65 - 2C - - 140.14 - 3C 22.20(1) - - -
Number of Shares outstanding
1C 2,806,608 888,877 11,205,755 1,211,882 1D - - 1,152,010 - maxblue Cash ETF - - 143,707 - 2C - - 3,677,293 - 3C 200,000 - - - (1) Share class expressed in GBP
31
db x-trackers II* Statement of Net Assets as at 31 December 2011 (continued)
*This is a synthetic ETF.
The accompanying notes form an integral part of these financial statements.
db x-trackers IIITRAXX®
HIVOL 5-YEAR TOTAL RETURN
INDEX ETF*
db x-trackers II ITRAXX®
CROSSOVER 5-YEAR TOTAL
RETURN INDEX ETF*
db x-trackers II ITRAXX®
EUROPE 5-YEAR SHORT
DAILY TOTAL RETURN INDEX
ETF*
db x-trackers II ITRAXX®
HIVOL 5-YEAR SHORT DAILY
TOTAL RETURN INDEX ETF*
EUR EUR EUR EUR
Notes
ASSETS
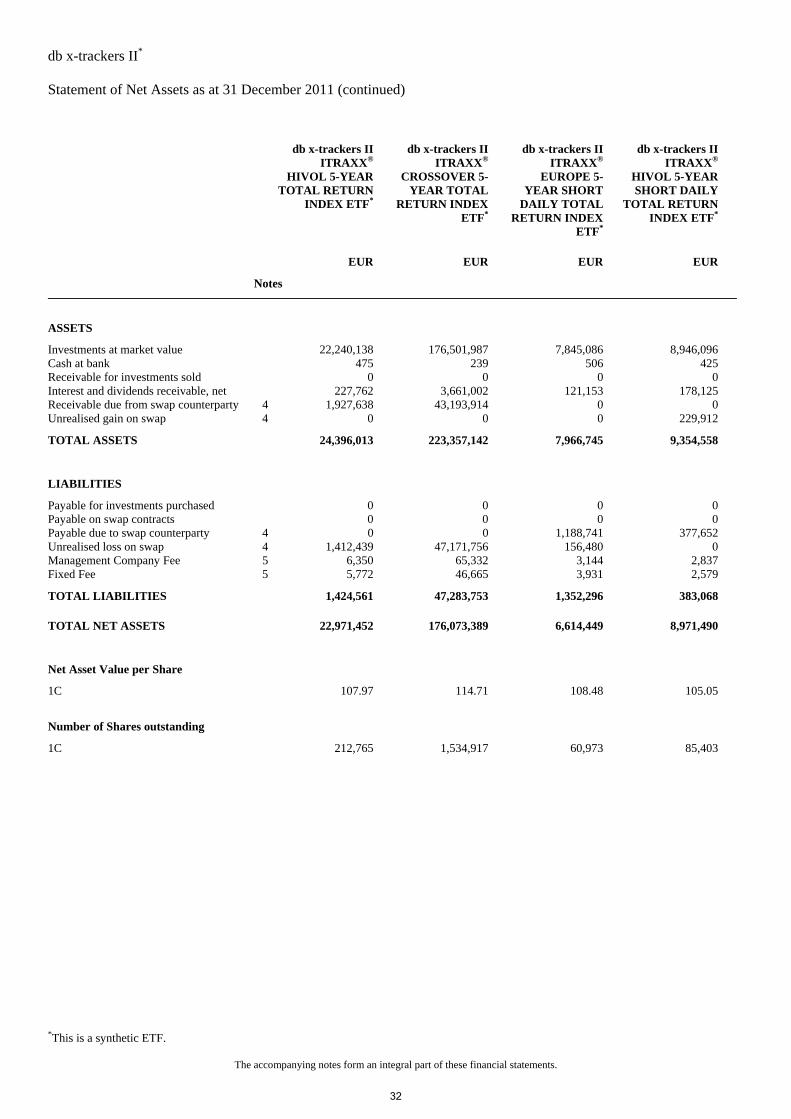
Investments at market value 22,240,138 176,501,987 7,845,086 8,946,096 Cash at bank 475 239 506 425 Receivable for investments sold 0 0 0 0 Interest and dividends receivable, net 227,762 3,661,002 121,153 178,125 Receivable due from swap counterparty 4 1,927,638 43,193,914 0 0 Unrealised gain on swap 4 0 0 0 229,912
TOTAL ASSETS 24,396,013 223,357,142 7,966,745 9,354,558
LIABILITIES
Payable for investments purchased 0 0 0 0 Payable on swap contracts 0 0 0 0 Payable due to swap counterparty 4 0 0 1,188,741 377,652 Unrealised loss on swap 4 1,412,439 47,171,756 156,480 0 Management Company Fee 5 6,350 65,332 3,144 2,837 Fixed Fee 5 5,772 46,665 3,931 2,579
TOTAL LIABILITIES 1,424,561 47,283,753 1,352,296 383,068
TOTAL NET ASSETS 22,971,452 176,073,389 6,614,449 8,971,490
Net Asset Value per Share
1C 107.97 114.71 108.48 105.05
Number of Shares outstanding
1C 212,765 1,534,917 60,973 85,403
32

db x-trackers II* Statement of Net Assets as at 31 December 2011 (continued)
*This is a synthetic ETF.
The accompanying notes form an integral part of these financial statements.
db x-trackers II
ITRAXX®
CROSSOVER 5-YEAR SHORT
DAILY TOTALRETURN INDEX
ETF*
db x-trackers II EMERGING
MARKETS LIQUID
EUROBOND INDEX ETF*
db x-trackers II SHORT IBOXX €
SOVEREIGNS EUROZONE
DAILY TOTAL RETURN INDEX
ETF*
db x-trackers II IBOXX €
GERMANY COVERED
TOTAL RETURN INDEX ETF*
EUR EUR EUR EUR
Notes
ASSETS
Investments at market value 57,904,687 308,915,916 254,496,111 276,403,347 Cash at bank 2,654 633 335 851 Receivable for investments sold 0 0 0 0 Interest and dividends receivable, net 991,812 5,979,608 5,338,984 4,265,513 Receivable due from swap counterparty 4 0 0 35,908,466 4,147,513 Unrealised gain on swap 4 642,313 14,628,580 0 0
TOTAL ASSETS 59,541,466 329,524,737 295,743,896 284,817,224
LIABILITIES
Payable for investments purchased 0 0 0 0 Payable on swap contracts 0 0 0 0 Payable due to swap counterparty 4 6,630,378 18,965,049 0 0 Unrealised loss on swap 4 0 0 43,245,409 5,577,406 Management Company Fee 5 35,538 391,427 64,777 34,300 Fixed Fee 5 25,385 86,984 129,554 68,599
TOTAL LIABILITIES 6,691,301 19,443,460 43,439,740 5,680,305
TOTAL NET ASSETS 52,850,165 310,081,277 252,304,156 279,136,919
Net Asset Value per Share
1C 87.44 249.54 109.66 174.22
Number of Shares outstanding
1C 604,417 1,242,633 2,300,862 1,602,189
33
db x-trackers II* Statement of Net Assets as at 31 December 2011 (continued)
*This is a synthetic ETF.
The accompanying notes form an integral part of these financial statements.
db x-trackers II
IBOXX £ GILTSTOTAL RETURN
INDEX ETF*
db x-trackers II IBOXX UK GILT
INFLATION-LINKED TOTAL RETURN INDEX
ETF*
db x-trackers II FED FUNDS EFFECTIVE
RATE TOTAL RETURN INDEX
ETF*
db x-trackers II STERLING CASH ETF*
GBP GBP USD GBP
Notes
ASSETS
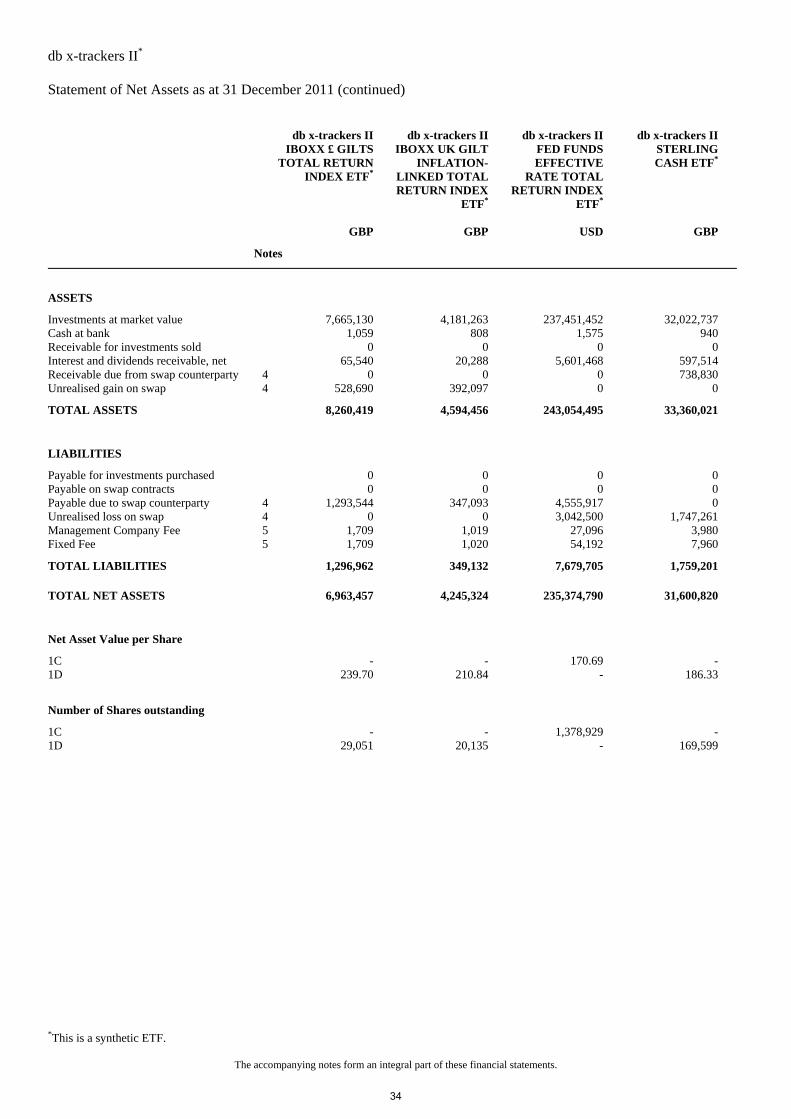
Investments at market value 7,665,130 4,181,263 237,451,452 32,022,737 Cash at bank 1,059 808 1,575 940 Receivable for investments sold 0 0 0 0 Interest and dividends receivable, net 65,540 20,288 5,601,468 597,514 Receivable due from swap counterparty 4 0 0 0 738,830 Unrealised gain on swap 4 528,690 392,097 0 0
TOTAL ASSETS 8,260,419 4,594,456 243,054,495 33,360,021
LIABILITIES
Payable for investments purchased 0 0 0 0 Payable on swap contracts 0 0 0 0 Payable due to swap counterparty 4 1,293,544 347,093 4,555,917 0 Unrealised loss on swap 4 0 0 3,042,500 1,747,261 Management Company Fee 5 1,709 1,019 27,096 3,980 Fixed Fee 5 1,709 1,020 54,192 7,960
TOTAL LIABILITIES 1,296,962 349,132 7,679,705 1,759,201
TOTAL NET ASSETS 6,963,457 4,245,324 235,374,790 31,600,820
Net Asset Value per Share
1C - - 170.69 - 1D 239.70 210.84 - 186.33
Number of Shares outstanding
1C - - 1,378,929 - 1D 29,051 20,135 - 169,599
34

db x-trackers II* Statement of Net Assets as at 31 December 2011 (continued)
*This is a synthetic ETF.
The accompanying notes form an integral part of these financial statements.
db x-trackers II
GLOBALSOVEREIGNINDEX ETF*
db x-trackers II MARKIT IBOXX
ABF SINGAPORE
GOVERNMENT INDEX ETF*
db x-trackers II EURO
INTEREST RATES
VOLATILITY TOTAL RETURN
INDEX ETF*
db x-trackers II EURO
INTEREST RATES
VOLATILITY SHORT TOTAL
RETURN INDEX ETF*
EUR SGD EUR EUR
Notes
ASSETS
Investments at market value 157,652,937 16,940,800 9,395,100 6,071,020 Cash at bank 1,781 21,518 481 481 Receivable for investments sold 0 0 0 0 Interest and dividends receivable, net 2,752,840 175,513 248,832 155,680 Receivable due from swap counterparty 4 563,617 0 0 0 Unrealised gain on swap 4 0 459,522 619,669 580,150
TOTAL ASSETS 160,971,175 17,597,353 10,264,082 6,807,331
LIABILITIES
Payable for investments purchased 0 0 0 0 Payable on swap contracts 0 0 0 0 Payable due to swap counterparty 4 0 276,635 1,212,851 761,657 Unrealised loss on swap 4 2,730,399 0 0 0 Management Company Fee 5 57,544 4,366 3,482 2,245 Fixed Fee 5 38,363 4,366 2,320 1,498
TOTAL LIABILITIES 2,826,306 285,367 1,218,653 765,400
TOTAL NET ASSETS 158,144,869 17,311,986 9,045,429 6,041,931
Net Asset Value per Share
1C 197.04 126.77 99.65 99.46 1D 198.55 - - - 2C 24.40(1) - - -
Number of Shares outstanding
1C 751,322 136,560 90,773 60,749 1D 20,000 - - - 2C 210,063 - - - (1) Share class expressed in GBP
35
db x-trackers II* Statement of Net Assets as at 31 December 2011 (continued)
*This is a synthetic ETF.
The accompanying notes form an integral part of these financial statements.
db x-trackers II
ITRAXX®
EUROPESENIOR
FINANCIALS 5-YEAR TOTAL
RETURN INDEXETF*
db x-trackers II ITRAXX®
EUROPE SUBORDINATED
FINANCIALS 5-YEAR TOTAL
RETURN INDEX ETF*
db x-trackers II ITRAXX®
EUROPE SENIOR
FINANCIALS 5-YEAR SHORT
DAILY TOTAL RETURN INDEX
ETF*
db x-trackers II ITRAXX®
EUROPE SUBORDINATED
FINANCIALS 5-YEAR SHORT
DAILY TOTAL RETURN INDEX
ETF*
EUR EUR EUR EUR
Notes
ASSETS
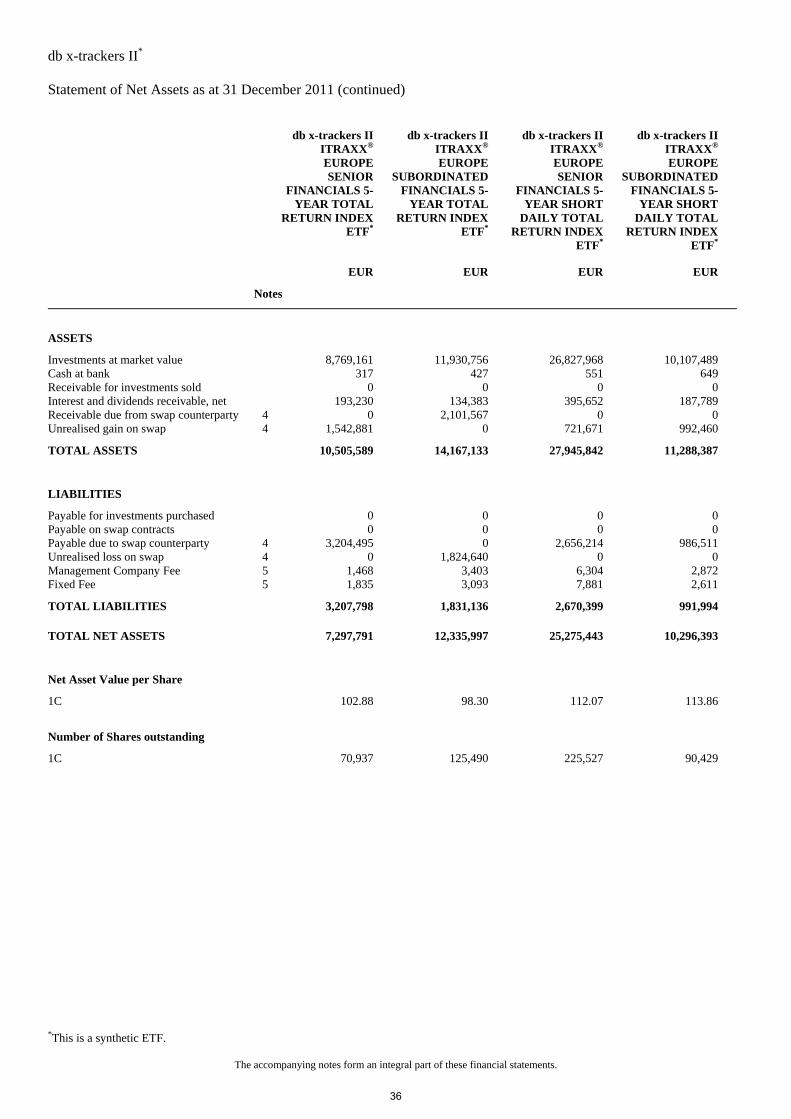
Investments at market value 8,769,161 11,930,756 26,827,968 10,107,489 Cash at bank 317 427 551 649 Receivable for investments sold 0 0 0 0 Interest and dividends receivable, net 193,230 134,383 395,652 187,789 Receivable due from swap counterparty 4 0 2,101,567 0 0 Unrealised gain on swap 4 1,542,881 0 721,671 992,460
TOTAL ASSETS 10,505,589 14,167,133 27,945,842 11,288,387
LIABILITIES
Payable for investments purchased 0 0 0 0 Payable on swap contracts 0 0 0 0 Payable due to swap counterparty 4 3,204,495 0 2,656,214 986,511 Unrealised loss on swap 4 0 1,824,640 0 0 Management Company Fee 5 1,468 3,403 6,304 2,872 Fixed Fee 5 1,835 3,093 7,881 2,611
TOTAL LIABILITIES 3,207,798 1,831,136 2,670,399 991,994
TOTAL NET ASSETS 7,297,791 12,335,997 25,275,443 10,296,393
Net Asset Value per Share
1C 102.88 98.30 112.07 113.86
Number of Shares outstanding
1C 70,937 125,490 225,527 90,429
36
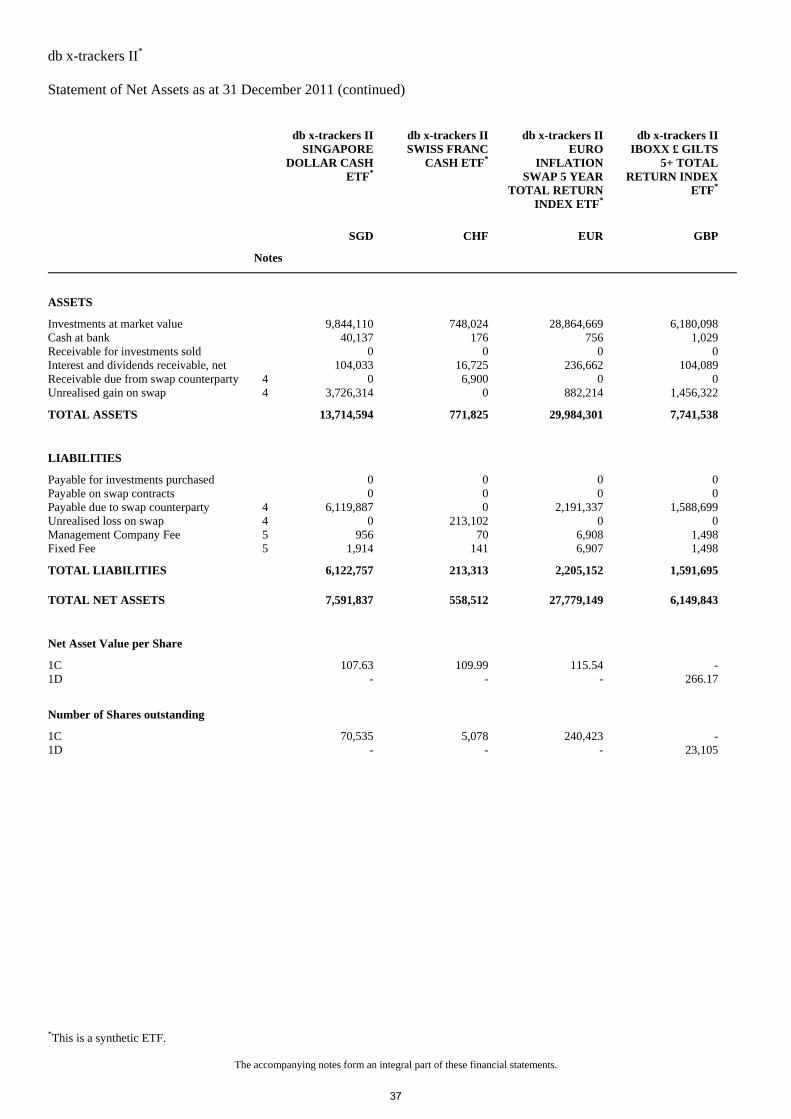
db x-trackers II* Statement of Net Assets as at 31 December 2011 (continued)
*This is a synthetic ETF.
The accompanying notes form an integral part of these financial statements.
db x-trackers II
SINGAPOREDOLLAR CASH
ETF*
db x-trackers II SWISS FRANC
CASH ETF*
db x-trackers II EURO
INFLATION SWAP 5 YEAR
TOTAL RETURN INDEX ETF*
db x-trackers II IBOXX £ GILTS
5+ TOTAL RETURN INDEX
ETF*
SGD CHF EUR GBP
Notes
ASSETS
Investments at market value 9,844,110 748,024 28,864,669 6,180,098 Cash at bank 40,137 176 756 1,029 Receivable for investments sold 0 0 0 0 Interest and dividends receivable, net 104,033 16,725 236,662 104,089 Receivable due from swap counterparty 4 0 6,900 0 0 Unrealised gain on swap 4 3,726,314 0 882,214 1,456,322
TOTAL ASSETS 13,714,594 771,825 29,984,301 7,741,538
LIABILITIES
Payable for investments purchased 0 0 0 0 Payable on swap contracts 0 0 0 0 Payable due to swap counterparty 4 6,119,887 0 2,191,337 1,588,699 Unrealised loss on swap 4 0 213,102 0 0 Management Company Fee 5 956 70 6,908 1,498 Fixed Fee 5 1,914 141 6,907 1,498
TOTAL LIABILITIES 6,122,757 213,313 2,205,152 1,591,695
TOTAL NET ASSETS 7,591,837 558,512 27,779,149 6,149,843
Net Asset Value per Share
1C 107.63 109.99 115.54 - 1D - - - 266.17
Number of Shares outstanding
1C 70,535 5,078 240,423 - 1D - - - 23,105
37
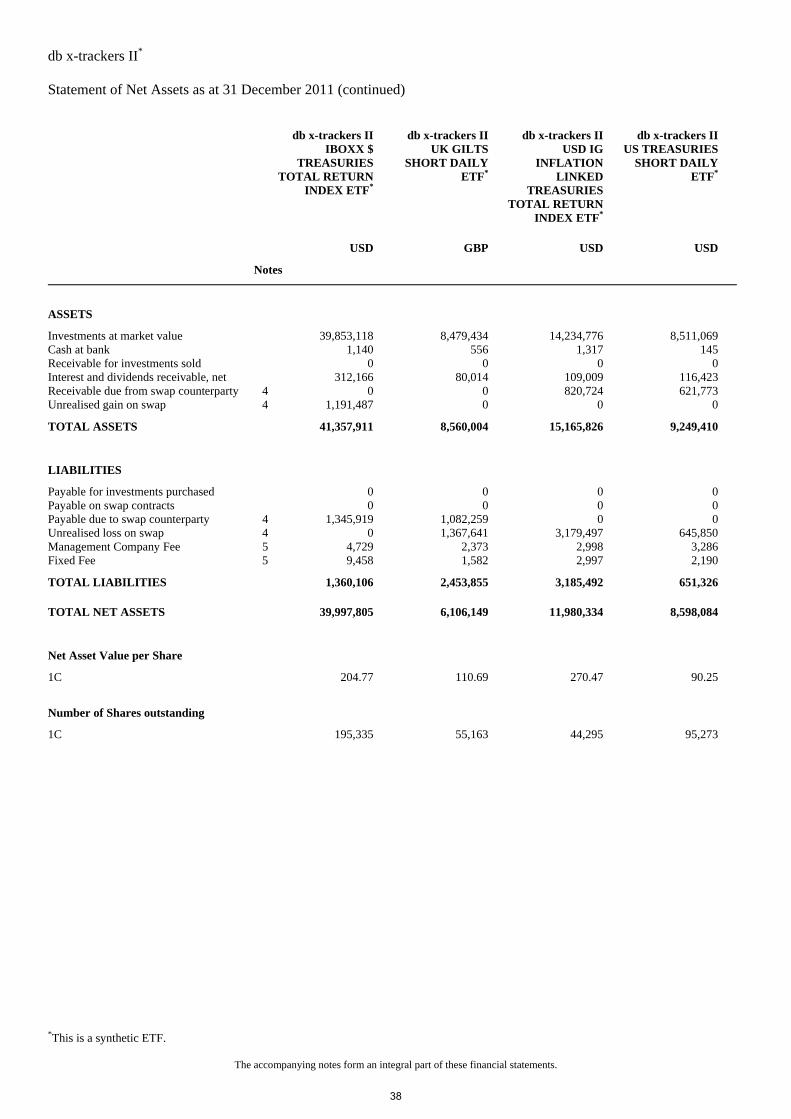
db x-trackers II* Statement of Net Assets as at 31 December 2011 (continued)
*This is a synthetic ETF.
The accompanying notes form an integral part of these financial statements.
db x-trackers II
IBOXX $ TREASURIES
TOTAL RETURNINDEX ETF*
db x-trackers II UK GILTS
SHORT DAILY ETF*
db x-trackers II USD IG
INFLATION LINKED
TREASURIES TOTAL RETURN
INDEX ETF*
db x-trackers II US TREASURIES
SHORT DAILY ETF*
USD GBP USD USD
Notes
ASSETS
Investments at market value 39,853,118 8,479,434 14,234,776 8,511,069 Cash at bank 1,140 556 1,317 145 Receivable for investments sold 0 0 0 0 Interest and dividends receivable, net 312,166 80,014 109,009 116,423 Receivable due from swap counterparty 4 0 0 820,724 621,773 Unrealised gain on swap 4 1,191,487 0 0 0
TOTAL ASSETS 41,357,911 8,560,004 15,165,826 9,249,410
LIABILITIES
Payable for investments purchased 0 0 0 0 Payable on swap contracts 0 0 0 0 Payable due to swap counterparty 4 1,345,919 1,082,259 0 0 Unrealised loss on swap 4 0 1,367,641 3,179,497 645,850 Management Company Fee 5 4,729 2,373 2,998 3,286 Fixed Fee 5 9,458 1,582 2,997 2,190
TOTAL LIABILITIES 1,360,106 2,453,855 3,185,492 651,326
TOTAL NET ASSETS 39,997,805 6,106,149 11,980,334 8,598,084
Net Asset Value per Share
1C 204.77 110.69 270.47 90.25
Number of Shares outstanding
1C 195,335 55,163 44,295 95,273
38
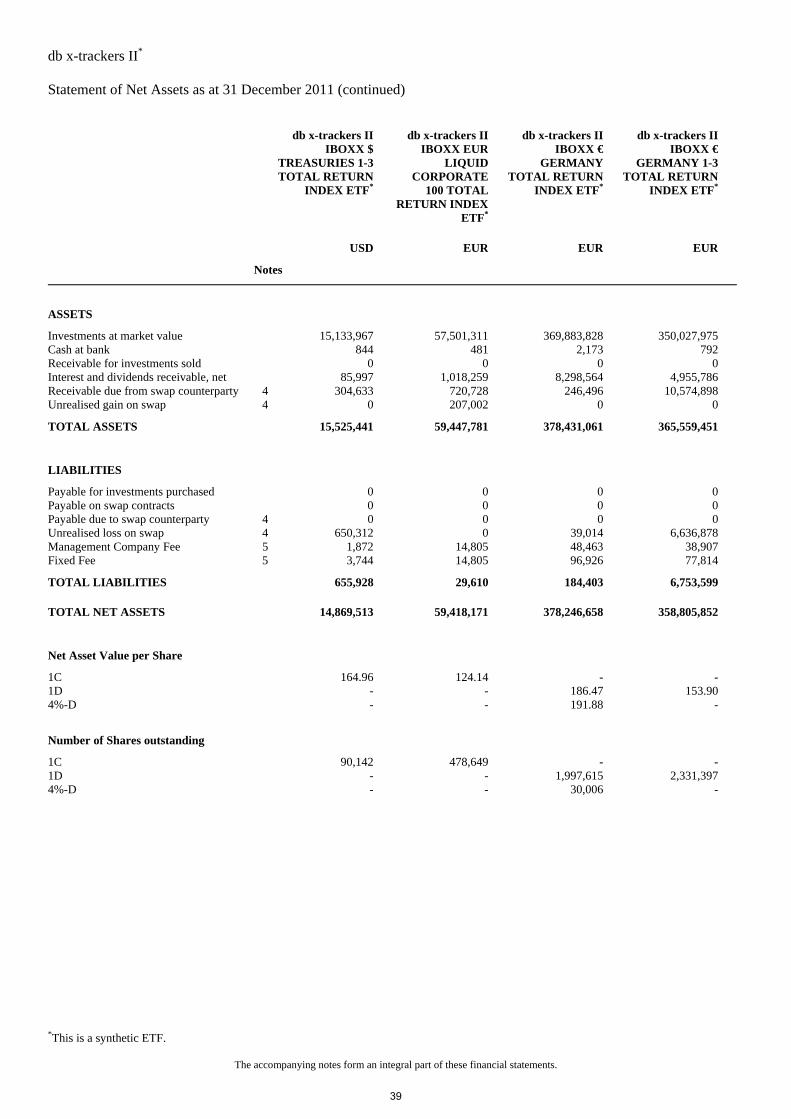
db x-trackers II* Statement of Net Assets as at 31 December 2011 (continued)
*This is a synthetic ETF.
The accompanying notes form an integral part of these financial statements.
db x-trackers II
IBOXX $TREASURIES 1-3 TOTAL RETURN
INDEX ETF*
db x-trackers II IBOXX EUR
LIQUID CORPORATE
100 TOTAL RETURN INDEX
ETF*
db x-trackers II IBOXX €
GERMANY TOTAL RETURN
INDEX ETF*
db x-trackers II IBOXX €
GERMANY 1-3 TOTAL RETURN
INDEX ETF*
USD EUR EUR EUR
Notes
ASSETS
Investments at market value 15,133,967 57,501,311 369,883,828 350,027,975 Cash at bank 844 481 2,173 792 Receivable for investments sold 0 0 0 0 Interest and dividends receivable, net 85,997 1,018,259 8,298,564 4,955,786 Receivable due from swap counterparty 4 304,633 720,728 246,496 10,574,898 Unrealised gain on swap 4 0 207,002 0 0
TOTAL ASSETS 15,525,441 59,447,781 378,431,061 365,559,451
LIABILITIES
Payable for investments purchased 0 0 0 0 Payable on swap contracts 0 0 0 0 Payable due to swap counterparty 4 0 0 0 0 Unrealised loss on swap 4 650,312 0 39,014 6,636,878 Management Company Fee 5 1,872 14,805 48,463 38,907 Fixed Fee 5 3,744 14,805 96,926 77,814
TOTAL LIABILITIES 655,928 29,610 184,403 6,753,599
TOTAL NET ASSETS 14,869,513 59,418,171 378,246,658 358,805,852
Net Asset Value per Share
1C 164.96 124.14 - - 1D - - 186.47 153.90 4%-D - - 191.88 -
Number of Shares outstanding
1C 90,142 478,649 - - 1D - - 1,997,615 2,331,397 4%-D - - 30,006 -
39
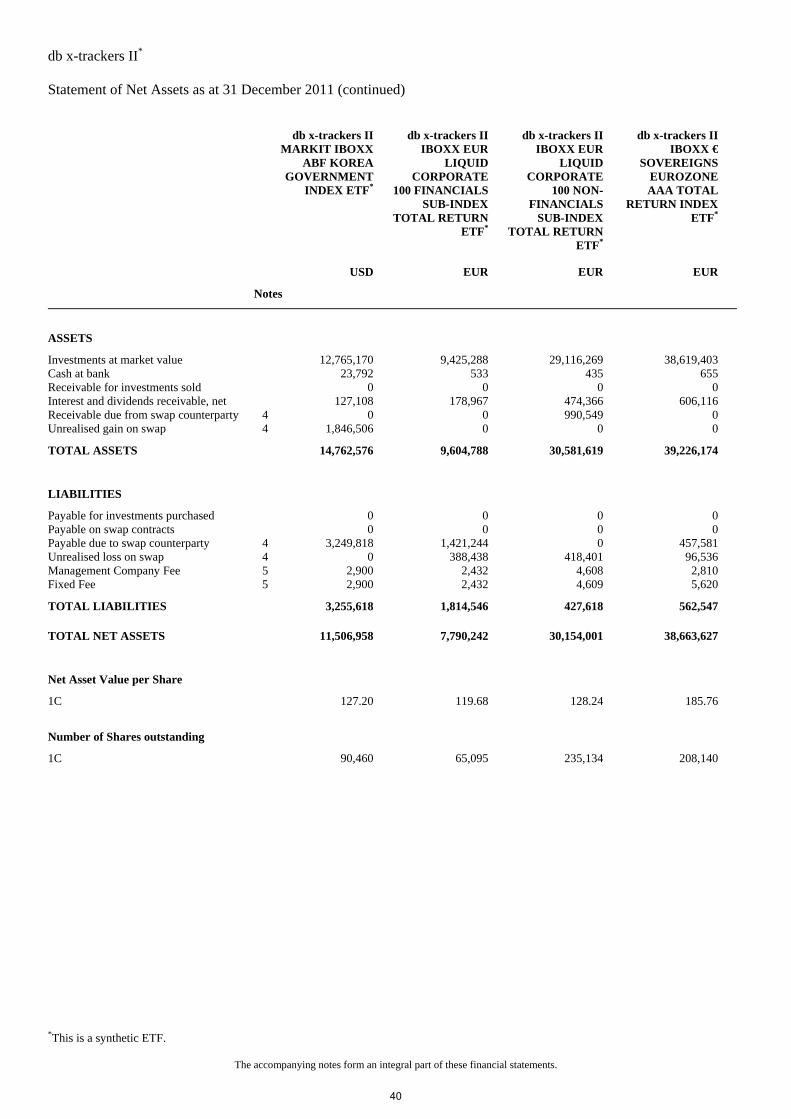
db x-trackers II* Statement of Net Assets as at 31 December 2011 (continued)
*This is a synthetic ETF.
The accompanying notes form an integral part of these financial statements.
db x-trackers II
MARKIT IBOXXABF KOREA
GOVERNMENTINDEX ETF*
db x-trackers II IBOXX EUR
LIQUID CORPORATE
100 FINANCIALS SUB-INDEX
TOTAL RETURN ETF*
db x-trackers II IBOXX EUR
LIQUID CORPORATE
100 NON-FINANCIALS
SUB-INDEX TOTAL RETURN
ETF*
db x-trackers II IBOXX €
SOVEREIGNS EUROZONE AAA TOTAL
RETURN INDEX ETF*
USD EUR EUR EUR
Notes
ASSETS
Investments at market value 12,765,170 9,425,288 29,116,269 38,619,403 Cash at bank 23,792 533 435 655 Receivable for investments sold 0 0 0 0 Interest and dividends receivable, net 127,108 178,967 474,366 606,116 Receivable due from swap counterparty 4 0 0 990,549 0 Unrealised gain on swap 4 1,846,506 0 0 0
TOTAL ASSETS 14,762,576 9,604,788 30,581,619 39,226,174
LIABILITIES
Payable for investments purchased 0 0 0 0 Payable on swap contracts 0 0 0 0 Payable due to swap counterparty 4 3,249,818 1,421,244 0 457,581 Unrealised loss on swap 4 0 388,438 418,401 96,536 Management Company Fee 5 2,900 2,432 4,608 2,810 Fixed Fee 5 2,900 2,432 4,609 5,620
TOTAL LIABILITIES 3,255,618 1,814,546 427,618 562,547
TOTAL NET ASSETS 11,506,958 7,790,242 30,154,001 38,663,627
Net Asset Value per Share
1C 127.20 119.68 128.24 185.76
Number of Shares outstanding
1C 90,460 65,095 235,134 208,140
40

db x-trackers II* Statement of Net Assets as at 31 December 2011 (continued)
*This is a synthetic ETF.
The accompanying notes form an integral part of these financial statements.
db x-trackers II
IBOXX € SOVEREIGNS
EUROZONEYIELD PLUSINDEX ETF*
db x-trackers II AUSTRALIAN
DOLLAR CASH ETF*
db x-trackers II AUSTRALIA SSA
BONDS TOTAL RETURN INDEX
ETF*
EUR AUD AUD
Notes
ASSETS
Investments at market value 62,470,760 9,764,232 21,500,037 Cash at bank 783 24,032 6,110 Receivable for investments sold 0 0 0 Interest and dividends receivable, net 1,192,575 92,340 297,802 Receivable due from swap counterparty 4 1,910,005 0 0 Unrealised gain on swap 4 204,929 2,632,858 2,241,657
TOTAL ASSETS 65,779,052 12,513,462 24,045,606
LIABILITIES
Payable for investments purchased 0 0 0 Payable on swap contracts 0 0 0 Payable due to swap counterparty 4 0 2,722,310 1,130,246 Unrealised loss on swap 4 0 0 0 Management Company Fee 5 7,835 2,462 8,536 Fixed Fee 5 15,670 2,454 5,691
TOTAL LIABILITIES 23,505 2,727,226 1,144,473
TOTAL NET ASSETS 65,755,547 9,786,236 22,901,133
Net Asset Value per Share
1C 113.09 199.62 172.19 2C - 199.62 - 3C - 199.62 - 4C - 19.98 -
Number of Shares outstanding
1C 581,431 29,015 133,000 2C - 10,000 - 3C - 10,000 - 4C - 100 -
41
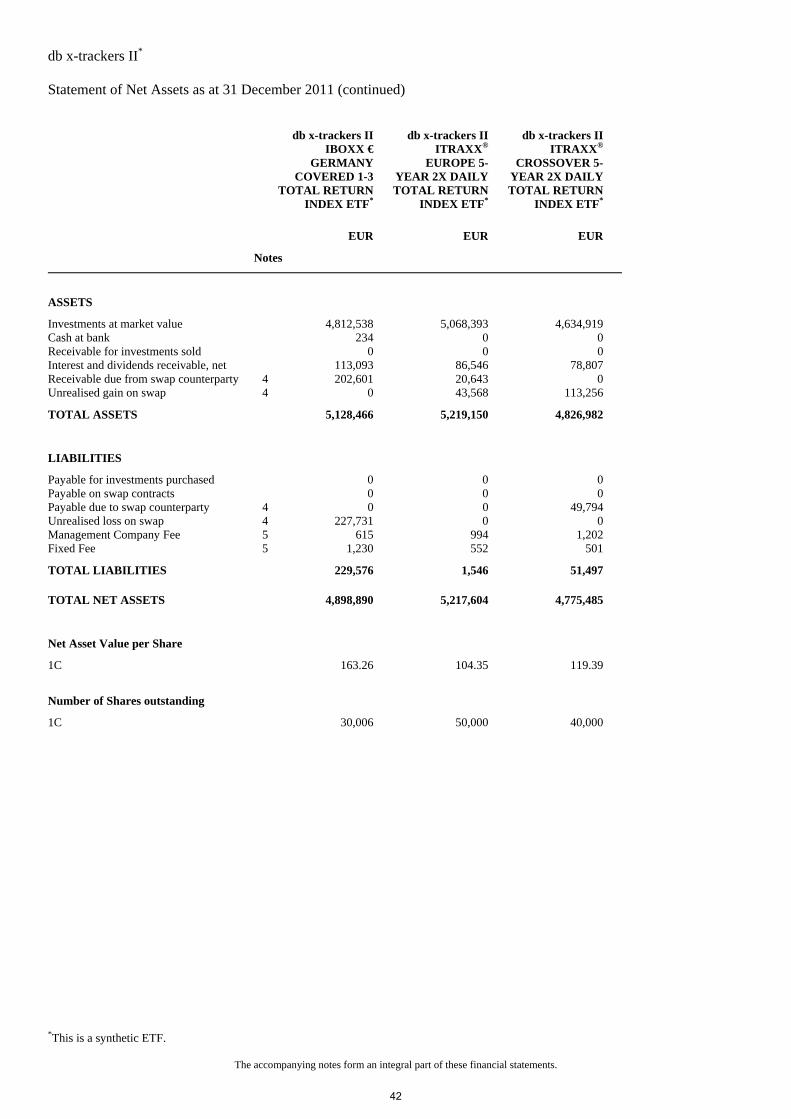
db x-trackers II* Statement of Net Assets as at 31 December 2011 (continued)
*This is a synthetic ETF.
The accompanying notes form an integral part of these financial statements.
db x-trackers II
IBOXX € GERMANY
COVERED 1-3 TOTAL RETURN
INDEX ETF*
db x-trackers II ITRAXX®
EUROPE 5-YEAR 2X DAILY TOTAL RETURN
INDEX ETF*
db x-trackers II ITRAXX®
CROSSOVER 5-YEAR 2X DAILY TOTAL RETURN
INDEX ETF*
EUR EUR EUR
Notes
ASSETS
Investments at market value 4,812,538 5,068,393 4,634,919 Cash at bank 234 0 0 Receivable for investments sold 0 0 0 Interest and dividends receivable, net 113,093 86,546 78,807 Receivable due from swap counterparty 4 202,601 20,643 0 Unrealised gain on swap 4 0 43,568 113,256
TOTAL ASSETS 5,128,466 5,219,150 4,826,982
LIABILITIES
Payable for investments purchased 0 0 0 Payable on swap contracts 0 0 0 Payable due to swap counterparty 4 0 0 49,794 Unrealised loss on swap 4 227,731 0 0 Management Company Fee 5 615 994 1,202 Fixed Fee 5 1,230 552 501
TOTAL LIABILITIES 229,576 1,546 51,497
TOTAL NET ASSETS 4,898,890 5,217,604 4,775,485
Net Asset Value per Share
1C 163.26 104.35 119.39
Number of Shares outstanding
1C 30,006 50,000 40,000
42
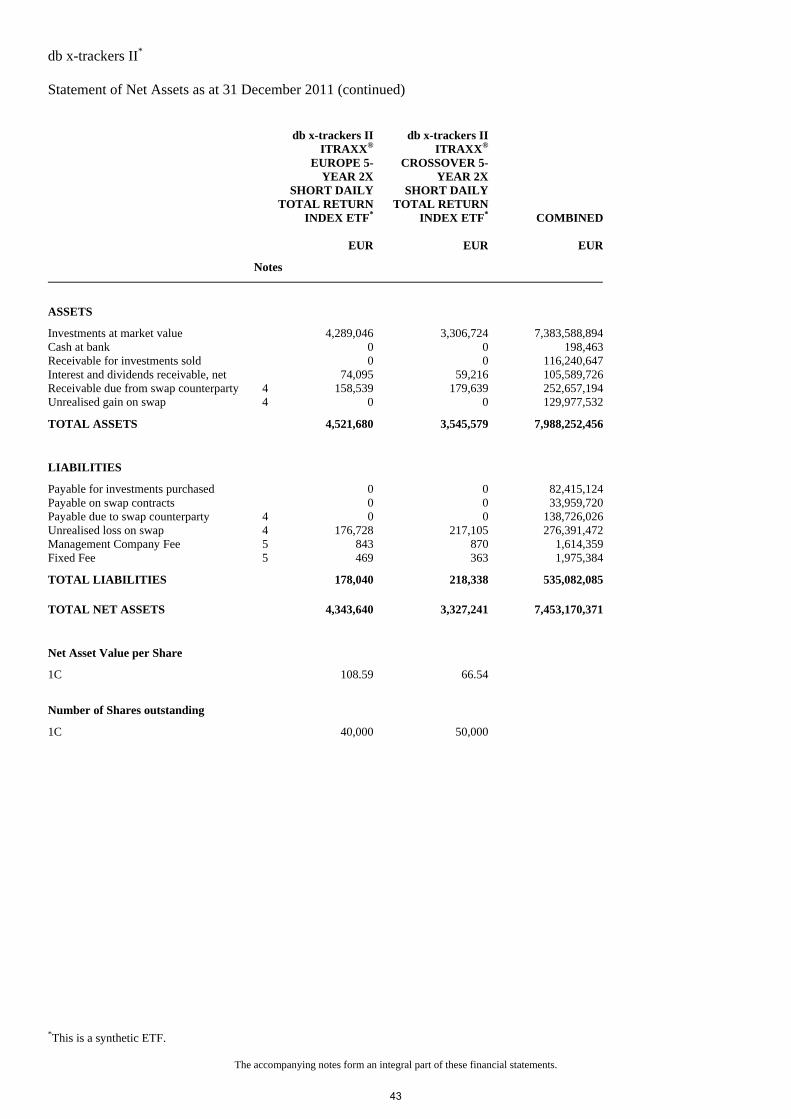
db x-trackers II* Statement of Net Assets as at 31 December 2011 (continued)
*This is a synthetic ETF.
The accompanying notes form an integral part of these financial statements.
db x-trackers II
ITRAXX®
EUROPE 5-YEAR 2X
SHORT DAILYTOTAL RETURN
INDEX ETF*
db x-trackers II ITRAXX®
CROSSOVER 5-YEAR 2X
SHORT DAILY TOTAL RETURN
INDEX ETF* COMBINED
EUR EUR EUR
Notes
ASSETS
Investments at market value 4,289,046 3,306,724 7,383,588,894Cash at bank 0 0 198,463Receivable for investments sold 0 0 116,240,647Interest and dividends receivable, net 74,095 59,216 105,589,726Receivable due from swap counterparty 4 158,539 179,639 252,657,194Unrealised gain on swap 4 0 0 129,977,532
TOTAL ASSETS 4,521,680 3,545,579 7,988,252,456
LIABILITIES
Payable for investments purchased 0 0 82,415,124Payable on swap contracts 0 0 33,959,720Payable due to swap counterparty 4 0 0 138,726,026Unrealised loss on swap 4 176,728 217,105 276,391,472Management Company Fee 5 843 870 1,614,359Fixed Fee 5 469 363 1,975,384
TOTAL LIABILITIES 178,040 218,338 535,082,085
TOTAL NET ASSETS 4,343,640 3,327,241 7,453,170,371
Net Asset Value per Share
1C 108.59 66.54
Number of Shares outstanding
1C 40,000 50,000
43
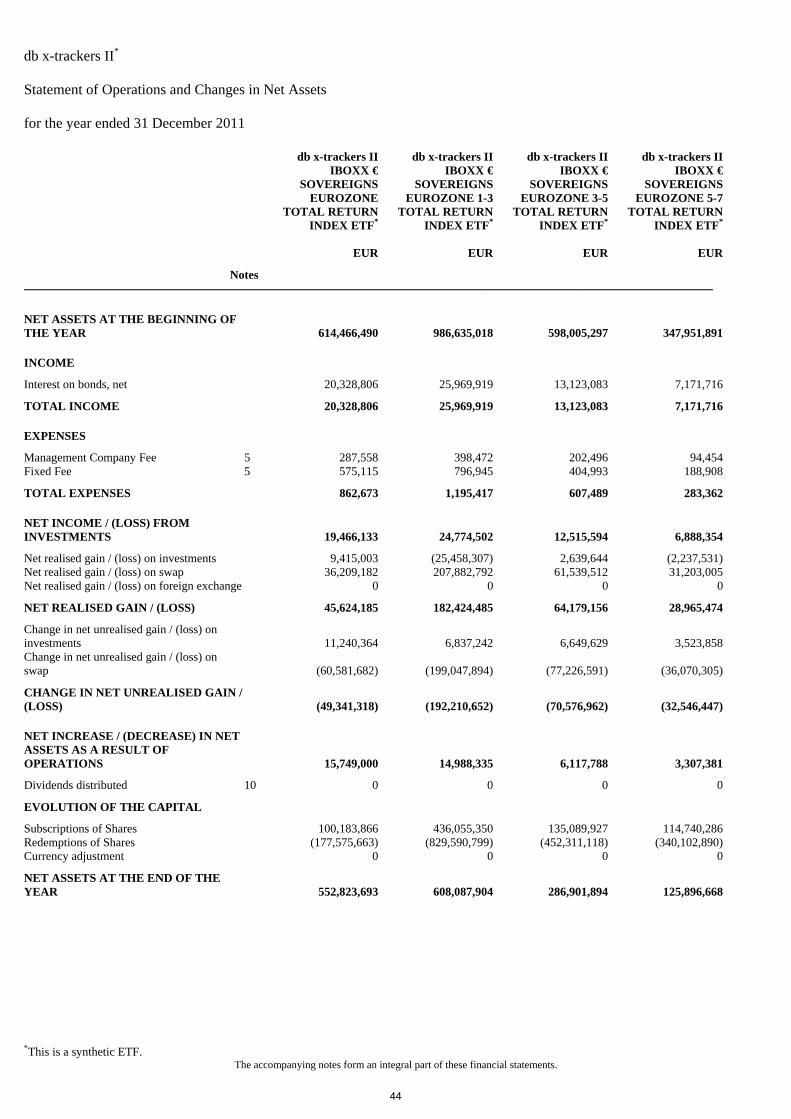
db x-trackers II* Statement of Operations and Changes in Net Assets for the year ended 31 December 2011
*This is a synthetic ETF. The accompanying notes form an integral part of these financial statements.
db x-trackers IIIBOXX €
SOVEREIGNSEUROZONE
TOTAL RETURNINDEX ETF*
db x-trackers II IBOXX €
SOVEREIGNS EUROZONE 1-3
TOTAL RETURN INDEX ETF*
db x-trackers II IBOXX €
SOVEREIGNS EUROZONE 3-5
TOTAL RETURN INDEX ETF*
db x-trackers II IBOXX €
SOVEREIGNS EUROZONE 5-7
TOTAL RETURN INDEX ETF*
EUR EUR EUR EUR
Notes
NET ASSETS AT THE BEGINNING OF THE YEAR 614,466,490 986,635,018 598,005,297 347,951,891
INCOME
Interest on bonds, net 20,328,806 25,969,919 13,123,083 7,171,716
TOTAL INCOME 20,328,806 25,969,919 13,123,083 7,171,716
EXPENSES
Management Company Fee 5 287,558 398,472 202,496 94,454 Fixed Fee 5 575,115 796,945 404,993 188,908
TOTAL EXPENSES 862,673 1,195,417 607,489 283,362
NET INCOME / (LOSS) FROM INVESTMENTS 19,466,133 24,774,502 12,515,594 6,888,354
Net realised gain / (loss) on investments 9,415,003 (25,458,307) 2,639,644 (2,237,531) Net realised gain / (loss) on swap 36,209,182 207,882,792 61,539,512 31,203,005 Net realised gain / (loss) on foreign exchange 0 0 0 0
NET REALISED GAIN / (LOSS) 45,624,185 182,424,485 64,179,156 28,965,474
Change in net unrealised gain / (loss) on investments
11,240,364 6,837,242 6,649,629 3,523,858
Change in net unrealised gain / (loss) on swap
(60,581,682) (199,047,894) (77,226,591) (36,070,305)
CHANGE IN NET UNREALISED GAIN / (LOSS) (49,341,318) (192,210,652) (70,576,962) (32,546,447)
NET INCREASE / (DECREASE) IN NET ASSETS AS A RESULT OF OPERATIONS 15,749,000 14,988,335 6,117,788 3,307,381
Dividends distributed 10 0 0 0 0
EVOLUTION OF THE CAPITAL
Subscriptions of Shares 100,183,866 436,055,350 135,089,927 114,740,286 Redemptions of Shares (177,575,663) (829,590,799) (452,311,118) (340,102,890) Currency adjustment 0 0 0 0
NET ASSETS AT THE END OF THE YEAR 552,823,693 608,087,904 286,901,894 125,896,668
44
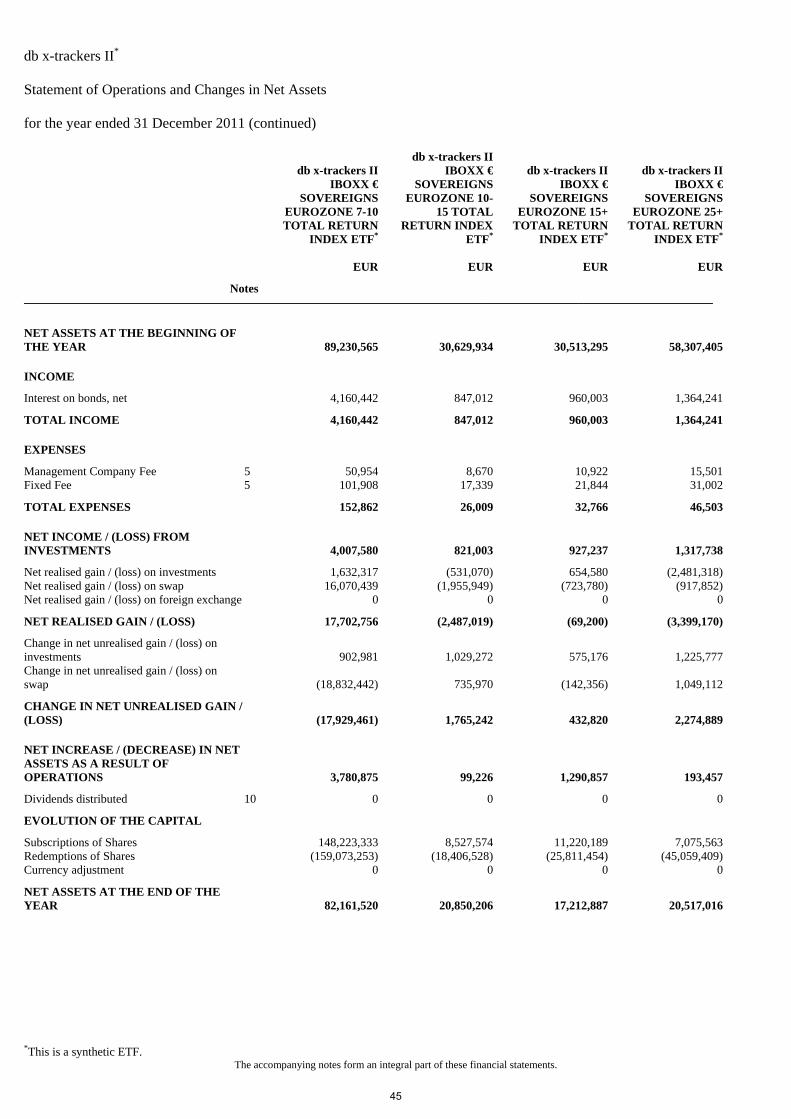
db x-trackers II* Statement of Operations and Changes in Net Assets for the year ended 31 December 2011 (continued)
*This is a synthetic ETF. The accompanying notes form an integral part of these financial statements.
db x-trackers II IBOXX €
SOVEREIGNSEUROZONE 7-10 TOTAL RETURN
INDEX ETF*
db x-trackers II IBOXX €
SOVEREIGNS EUROZONE 10-
15 TOTAL RETURN INDEX
ETF*
db x-trackers II IBOXX €
SOVEREIGNS EUROZONE 15+
TOTAL RETURN INDEX ETF*
db x-trackers II IBOXX €
SOVEREIGNS EUROZONE 25+
TOTAL RETURN INDEX ETF*
EUR EUR EUR EUR
Notes
NET ASSETS AT THE BEGINNING OF THE YEAR 89,230,565 30,629,934 30,513,295 58,307,405
INCOME
Interest on bonds, net 4,160,442 847,012 960,003 1,364,241
TOTAL INCOME 4,160,442 847,012 960,003 1,364,241
EXPENSES
Management Company Fee 5 50,954 8,670 10,922 15,501 Fixed Fee 5 101,908 17,339 21,844 31,002
TOTAL EXPENSES 152,862 26,009 32,766 46,503
NET INCOME / (LOSS) FROM INVESTMENTS 4,007,580 821,003 927,237 1,317,738
Net realised gain / (loss) on investments 1,632,317 (531,070) 654,580 (2,481,318) Net realised gain / (loss) on swap 16,070,439 (1,955,949) (723,780) (917,852) Net realised gain / (loss) on foreign exchange 0 0 0 0
NET REALISED GAIN / (LOSS) 17,702,756 (2,487,019) (69,200) (3,399,170)
Change in net unrealised gain / (loss) on investments
902,981 1,029,272 575,176 1,225,777
Change in net unrealised gain / (loss) on swap
(18,832,442) 735,970 (142,356) 1,049,112
CHANGE IN NET UNREALISED GAIN / (LOSS) (17,929,461) 1,765,242 432,820 2,274,889
NET INCREASE / (DECREASE) IN NET ASSETS AS A RESULT OF OPERATIONS 3,780,875 99,226 1,290,857 193,457
Dividends distributed 10 0 0 0 0
EVOLUTION OF THE CAPITAL
Subscriptions of Shares 148,223,333 8,527,574 11,220,189 7,075,563 Redemptions of Shares (159,073,253) (18,406,528) (25,811,454) (45,059,409) Currency adjustment 0 0 0 0
NET ASSETS AT THE END OF THE YEAR 82,161,520 20,850,206 17,212,887 20,517,016
45
db x-trackers II* Statement of Operations and Changes in Net Assets for the year ended 31 December 2011 (continued)
*This is a synthetic ETF. The accompanying notes form an integral part of these financial statements.
db x-trackers IIIBOXX GLOBAL
INFLATION-LINKED TOTALRETURN INDEX
HEDGED ETF*
db x-trackers II IBOXX EURO INFLATION-
LINKED TOTAL RETURN INDEX
ETF*
db x-trackers II EONIA TOTAL
RETURN INDEX ETF*
db x-trackers II ITRAXX®
EUROPE 5-YEAR TOTAL
RETURN INDEX ETF*
EUR EUR EUR EUR
Notes
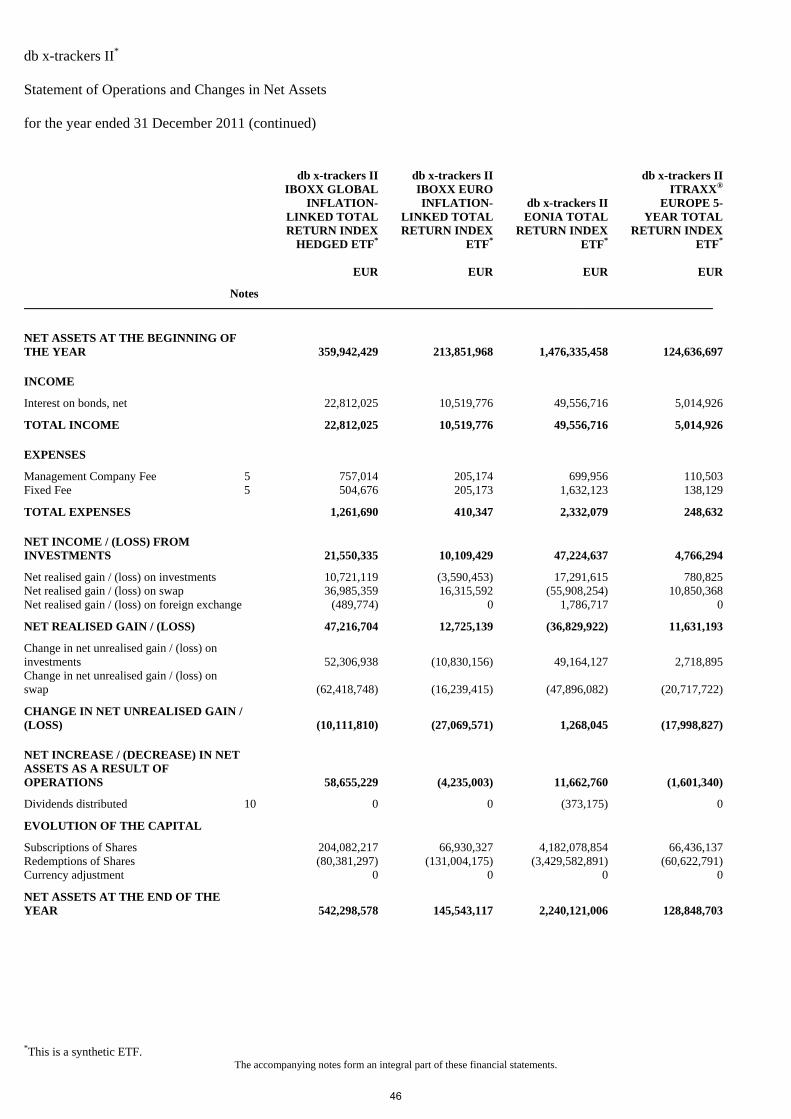
NET ASSETS AT THE BEGINNING OF THE YEAR 359,942,429 213,851,968 1,476,335,458 124,636,697
INCOME
Interest on bonds, net 22,812,025 10,519,776 49,556,716 5,014,926
TOTAL INCOME 22,812,025 10,519,776 49,556,716 5,014,926
EXPENSES
Management Company Fee 5 757,014 205,174 699,956 110,503 Fixed Fee 5 504,676 205,173 1,632,123 138,129
TOTAL EXPENSES 1,261,690 410,347 2,332,079 248,632
NET INCOME / (LOSS) FROM INVESTMENTS 21,550,335 10,109,429 47,224,637 4,766,294
Net realised gain / (loss) on investments 10,721,119 (3,590,453) 17,291,615 780,825 Net realised gain / (loss) on swap 36,985,359 16,315,592 (55,908,254) 10,850,368 Net realised gain / (loss) on foreign exchange (489,774) 0 1,786,717 0
NET REALISED GAIN / (LOSS) 47,216,704 12,725,139 (36,829,922) 11,631,193
Change in net unrealised gain / (loss) on investments
52,306,938 (10,830,156) 49,164,127 2,718,895
Change in net unrealised gain / (loss) on swap
(62,418,748) (16,239,415) (47,896,082) (20,717,722)
CHANGE IN NET UNREALISED GAIN / (LOSS) (10,111,810) (27,069,571) 1,268,045 (17,998,827)
NET INCREASE / (DECREASE) IN NET ASSETS AS A RESULT OF OPERATIONS 58,655,229 (4,235,003) 11,662,760 (1,601,340)
Dividends distributed 10 0 0 (373,175) 0
EVOLUTION OF THE CAPITAL
Subscriptions of Shares 204,082,217 66,930,327 4,182,078,854 66,436,137 Redemptions of Shares (80,381,297) (131,004,175) (3,429,582,891) (60,622,791) Currency adjustment 0 0 0 0
NET ASSETS AT THE END OF THE YEAR 542,298,578 145,543,117 2,240,121,006 128,848,703
46

db x-trackers II* Statement of Operations and Changes in Net Assets for the year ended 31 December 2011 (continued)
*This is a synthetic ETF. The accompanying notes form an integral part of these financial statements.
db x-trackers IIITRAXX®
HIVOL 5-YEAR TOTAL RETURN
INDEX ETF*
db x-trackers II ITRAXX®
CROSSOVER 5-YEAR TOTAL
RETURN INDEX ETF*
db x-trackers II ITRAXX®
EUROPE 5-YEAR SHORT
DAILY TOTAL RETURN INDEX
ETF*
db x-trackers II ITRAXX®
HIVOL 5-YEAR SHORT DAILY
TOTAL RETURN INDEX ETF*
EUR EUR EUR EUR
Notes
NET ASSETS AT THE BEGINNING OF THE YEAR 24,796,141 275,600,085 8,576,304 4,571,655
INCOME
Interest on bonds, net 1,085,411 9,013,921 729,124 237,997
TOTAL INCOME 1,085,411 9,013,921 729,124 237,997
EXPENSES
Management Company Fee 5 26,212 302,859 15,483 6,700 Fixed Fee 5 23,829 216,328 19,353 6,091
TOTAL EXPENSES 50,041 519,187 34,836 12,791
NET INCOME / (LOSS) FROM INVESTMENTS 1,035,370 8,494,734 694,288 225,206
Net realised gain / (loss) on investments 254,034 (1,678,002) 661,435 (214,438) Net realised gain / (loss) on swap 4,816,806 104,522,819 (523,886) (171,519) Net realised gain / (loss) on foreign exchange 0 0 0 0
NET REALISED GAIN / (LOSS) 5,070,840 102,844,817 137,549 (385,957)
Change in net unrealised gain / (loss) on investments
53,962 1,730,425 88,985 (137,777)
Change in net unrealised gain / (loss) on swap
(6,795,463) (119,423,283) (463,114) 402,675
CHANGE IN NET UNREALISED GAIN / (LOSS) (6,741,501) (117,692,858) (374,129) 264,898
NET INCREASE / (DECREASE) IN NET ASSETS AS A RESULT OF OPERATIONS (635,291) (6,353,307) 457,708 104,147
Dividends distributed 10 0 0 0 0
EVOLUTION OF THE CAPITAL
Subscriptions of Shares 3,290,890 238,151,568 109,951,578 10,589,118 Redemptions of Shares (4,480,288) (331,324,957) (112,371,141) (6,293,430) Currency adjustment 0 0 0 0
NET ASSETS AT THE END OF THE YEAR 22,971,452 176,073,389 6,614,449 8,971,490
47
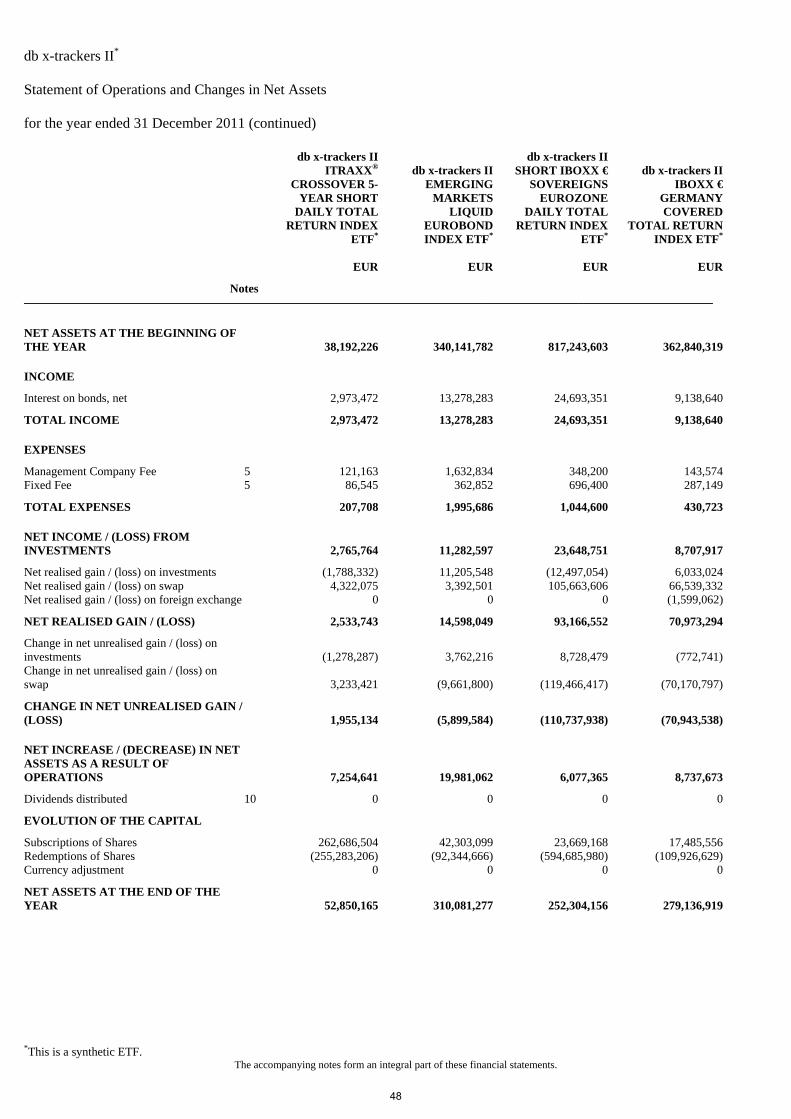
db x-trackers II* Statement of Operations and Changes in Net Assets for the year ended 31 December 2011 (continued)
*This is a synthetic ETF. The accompanying notes form an integral part of these financial statements.
db x-trackers IIITRAXX®
CROSSOVER 5-YEAR SHORT
DAILY TOTALRETURN INDEX
ETF*
db x-trackers II EMERGING
MARKETS LIQUID
EUROBOND INDEX ETF*
db x-trackers II SHORT IBOXX €
SOVEREIGNS EUROZONE
DAILY TOTAL RETURN INDEX
ETF*
db x-trackers II IBOXX €
GERMANY COVERED
TOTAL RETURN INDEX ETF*
EUR EUR EUR EUR
Notes
NET ASSETS AT THE BEGINNING OF THE YEAR 38,192,226 340,141,782 817,243,603 362,840,319
INCOME
Interest on bonds, net 2,973,472 13,278,283 24,693,351 9,138,640
TOTAL INCOME 2,973,472 13,278,283 24,693,351 9,138,640
EXPENSES
Management Company Fee 5 121,163 1,632,834 348,200 143,574 Fixed Fee 5 86,545 362,852 696,400 287,149
TOTAL EXPENSES 207,708 1,995,686 1,044,600 430,723
NET INCOME / (LOSS) FROM INVESTMENTS 2,765,764 11,282,597 23,648,751 8,707,917
Net realised gain / (loss) on investments (1,788,332) 11,205,548 (12,497,054) 6,033,024 Net realised gain / (loss) on swap 4,322,075 3,392,501 105,663,606 66,539,332 Net realised gain / (loss) on foreign exchange 0 0 0 (1,599,062)
NET REALISED GAIN / (LOSS) 2,533,743 14,598,049 93,166,552 70,973,294
Change in net unrealised gain / (loss) on investments
(1,278,287) 3,762,216 8,728,479 (772,741)
Change in net unrealised gain / (loss) on swap
3,233,421 (9,661,800) (119,466,417) (70,170,797)
CHANGE IN NET UNREALISED GAIN / (LOSS) 1,955,134 (5,899,584) (110,737,938) (70,943,538)
NET INCREASE / (DECREASE) IN NET ASSETS AS A RESULT OF OPERATIONS 7,254,641 19,981,062 6,077,365 8,737,673
Dividends distributed 10 0 0 0 0
EVOLUTION OF THE CAPITAL
Subscriptions of Shares 262,686,504 42,303,099 23,669,168 17,485,556 Redemptions of Shares (255,283,206) (92,344,666) (594,685,980) (109,926,629) Currency adjustment 0 0 0 0
NET ASSETS AT THE END OF THE YEAR 52,850,165 310,081,277 252,304,156 279,136,919
48
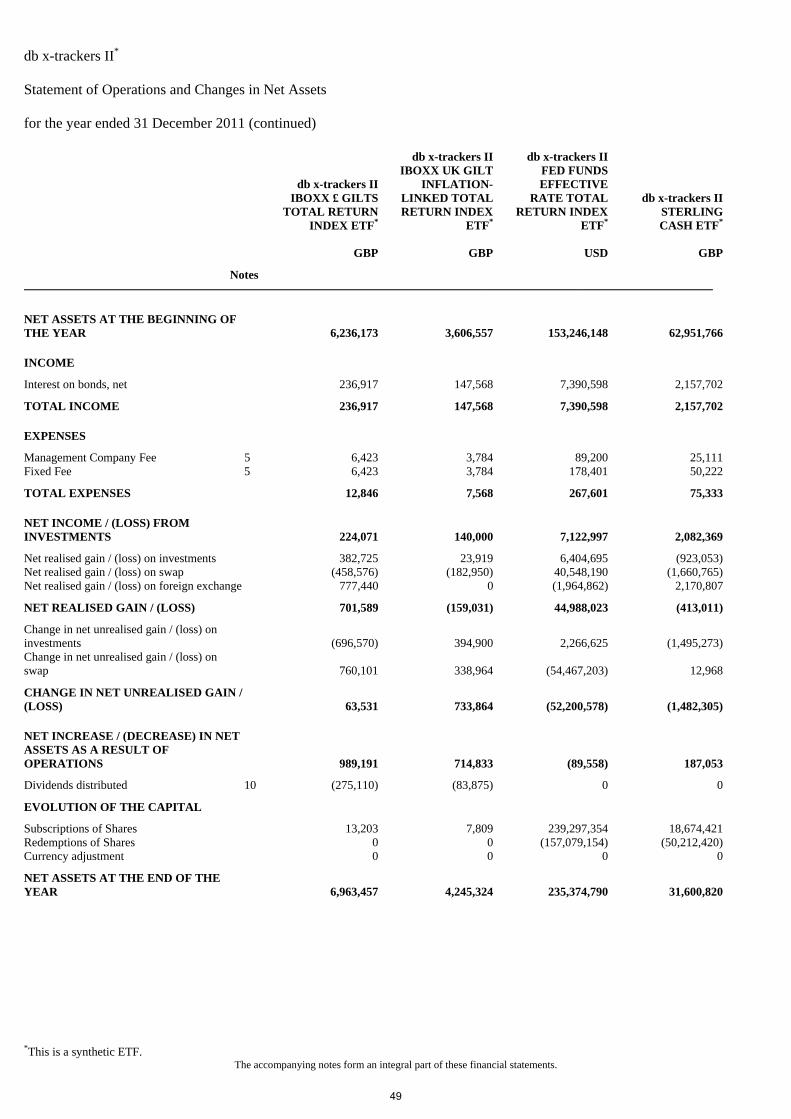
db x-trackers II* Statement of Operations and Changes in Net Assets for the year ended 31 December 2011 (continued)
*This is a synthetic ETF. The accompanying notes form an integral part of these financial statements.
db x-trackers IIIBOXX £ GILTS
TOTAL RETURNINDEX ETF*
db x-trackers II IBOXX UK GILT
INFLATION-LINKED TOTAL RETURN INDEX
ETF*
db x-trackers II FED FUNDS EFFECTIVE
RATE TOTAL RETURN INDEX
ETF*
db x-trackers II STERLING CASH ETF*
GBP GBP USD GBP
Notes
NET ASSETS AT THE BEGINNING OF THE YEAR 6,236,173 3,606,557 153,246,148 62,951,766
INCOME
Interest on bonds, net 236,917 147,568 7,390,598 2,157,702
TOTAL INCOME 236,917 147,568 7,390,598 2,157,702
EXPENSES
Management Company Fee 5 6,423 3,784 89,200 25,111 Fixed Fee 5 6,423 3,784 178,401 50,222
TOTAL EXPENSES 12,846 7,568 267,601 75,333
NET INCOME / (LOSS) FROM INVESTMENTS 224,071 140,000 7,122,997 2,082,369
Net realised gain / (loss) on investments 382,725 23,919 6,404,695 (923,053) Net realised gain / (loss) on swap (458,576) (182,950) 40,548,190 (1,660,765) Net realised gain / (loss) on foreign exchange 777,440 0 (1,964,862) 2,170,807
NET REALISED GAIN / (LOSS) 701,589 (159,031) 44,988,023 (413,011)
Change in net unrealised gain / (loss) on investments
(696,570) 394,900 2,266,625 (1,495,273)
Change in net unrealised gain / (loss) on swap
760,101 338,964 (54,467,203) 12,968
CHANGE IN NET UNREALISED GAIN / (LOSS) 63,531 733,864 (52,200,578) (1,482,305)
NET INCREASE / (DECREASE) IN NET ASSETS AS A RESULT OF OPERATIONS 989,191 714,833 (89,558) 187,053
Dividends distributed 10 (275,110) (83,875) 0 0
EVOLUTION OF THE CAPITAL
Subscriptions of Shares 13,203 7,809 239,297,354 18,674,421 Redemptions of Shares 0 0 (157,079,154) (50,212,420) Currency adjustment 0 0 0 0
NET ASSETS AT THE END OF THE YEAR 6,963,457 4,245,324 235,374,790 31,600,820
49

db x-trackers II* Statement of Operations and Changes in Net Assets for the year ended 31 December 2011 (continued)
*This is a synthetic ETF. The accompanying notes form an integral part of these financial statements.
db x-trackers IIGLOBAL
SOVEREIGNINDEX ETF*
db x-trackers II MARKIT IBOXX
ABF SINGAPORE
GOVERNMENT INDEX ETF*
db x-trackers II EURO
INTEREST RATES
VOLATILITY TOTAL RETURN
INDEX ETF*
db x-trackers II EURO
INTEREST RATES
VOLATILITY SHORT TOTAL
RETURN INDEX ETF*
EUR SGD EUR EUR
Notes
NET ASSETS AT THE BEGINNING OF THE YEAR 29,708,168 40,527,090 8,885,504 6,119,046
INCOME
Interest on bonds, net 3,067,431 619,612 345,625 246,848
TOTAL INCOME 3,067,431 619,612 345,625 246,848
EXPENSES
Management Company Fee 5 157,096 22,722 13,613 9,027 Fixed Fee 5 104,730 22,722 9,075 6,018
TOTAL EXPENSES 261,826 45,444 22,688 15,045
NET INCOME / (LOSS) FROM INVESTMENTS 2,805,605 574,168 322,937 231,803
Net realised gain / (loss) on investments 3,486,193 545,275 101,110 (1,000) Net realised gain / (loss) on swap (2,270,638) (484,208) (294,765) (159,652) Net realised gain / (loss) on foreign exchange 990,940 0 0 0
NET REALISED GAIN / (LOSS) 2,206,495 61,067 (193,655) (160,652)
Change in net unrealised gain / (loss) on investments
8,359,638 865,700 403,837 (151,046)
Change in net unrealised gain / (loss) on swap
(4,317,040) 55,701 (397,090) (12,627)
CHANGE IN NET UNREALISED GAIN / (LOSS) 4,042,598 921,401 6,747 (163,673)
NET INCREASE / (DECREASE) IN NET ASSETS AS A RESULT OF OPERATIONS 9,054,698 1,556,636 136,029 (92,522)
Dividends distributed 10 0 0 0 0
EVOLUTION OF THE CAPITAL
Subscriptions of Shares 218,106,724 26,378 23,896 15,407 Redemptions of Shares (98,724,721) (24,798,118) 0 0 Currency adjustment 0 0 0 0
NET ASSETS AT THE END OF THE YEAR 158,144,869 17,311,986 9,045,429 6,041,931
50
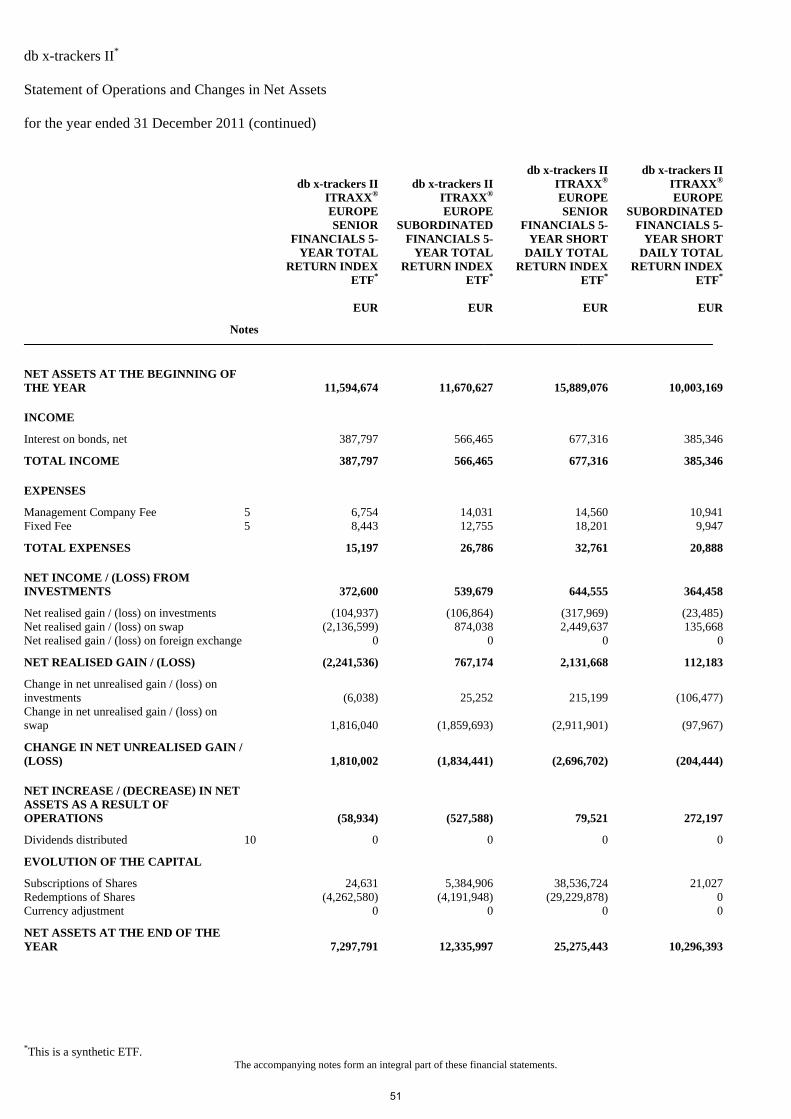
db x-trackers II* Statement of Operations and Changes in Net Assets for the year ended 31 December 2011 (continued)
*This is a synthetic ETF. The accompanying notes form an integral part of these financial statements.
db x-trackers IIITRAXX®
EUROPE SENIOR
FINANCIALS 5-YEAR TOTAL
RETURN INDEXETF*
db x-trackers II ITRAXX®
EUROPE SUBORDINATED
FINANCIALS 5-YEAR TOTAL
RETURN INDEX ETF*
db x-trackers II ITRAXX®
EUROPE SENIOR
FINANCIALS 5-YEAR SHORT
DAILY TOTAL RETURN INDEX
ETF*
db x-trackers II ITRAXX®
EUROPE SUBORDINATED
FINANCIALS 5-YEAR SHORT
DAILY TOTAL RETURN INDEX
ETF*
EUR EUR EUR EUR
Notes
NET ASSETS AT THE BEGINNING OF THE YEAR 11,594,674 11,670,627 15,889,076 10,003,169
INCOME
Interest on bonds, net 387,797 566,465 677,316 385,346
TOTAL INCOME 387,797 566,465 677,316 385,346
EXPENSES
Management Company Fee 5 6,754 14,031 14,560 10,941 Fixed Fee 5 8,443 12,755 18,201 9,947
TOTAL EXPENSES 15,197 26,786 32,761 20,888
NET INCOME / (LOSS) FROM INVESTMENTS 372,600 539,679 644,555 364,458
Net realised gain / (loss) on investments (104,937) (106,864) (317,969) (23,485) Net realised gain / (loss) on swap (2,136,599) 874,038 2,449,637 135,668 Net realised gain / (loss) on foreign exchange 0 0 0 0
NET REALISED GAIN / (LOSS) (2,241,536) 767,174 2,131,668 112,183
Change in net unrealised gain / (loss) on investments
(6,038) 25,252 215,199 (106,477)
Change in net unrealised gain / (loss) on swap
1,816,040 (1,859,693) (2,911,901) (97,967)
CHANGE IN NET UNREALISED GAIN / (LOSS) 1,810,002 (1,834,441) (2,696,702) (204,444)
NET INCREASE / (DECREASE) IN NET ASSETS AS A RESULT OF OPERATIONS (58,934) (527,588) 79,521 272,197
Dividends distributed 10 0 0 0 0
EVOLUTION OF THE CAPITAL
Subscriptions of Shares 24,631 5,384,906 38,536,724 21,027 Redemptions of Shares (4,262,580) (4,191,948) (29,229,878) 0 Currency adjustment 0 0 0 0
NET ASSETS AT THE END OF THE YEAR 7,297,791 12,335,997 25,275,443 10,296,393
51
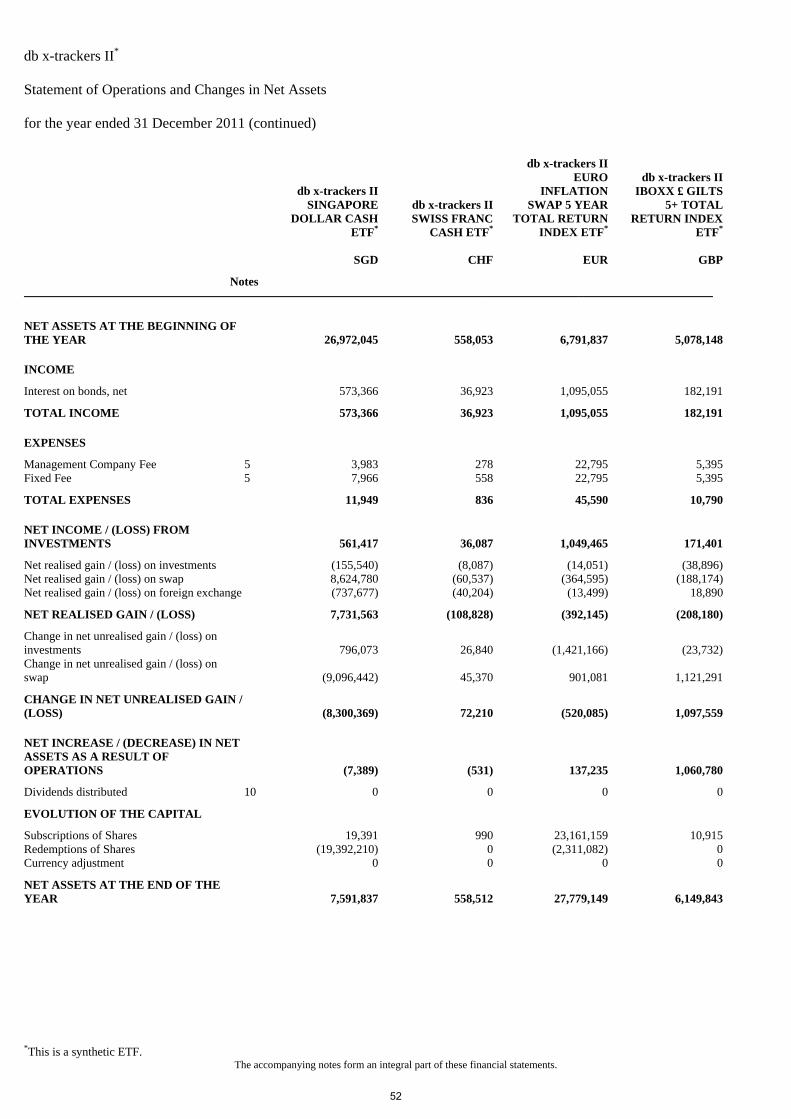
db x-trackers II* Statement of Operations and Changes in Net Assets for the year ended 31 December 2011 (continued)
*This is a synthetic ETF. The accompanying notes form an integral part of these financial statements.
db x-trackers IISINGAPORE
DOLLAR CASHETF*
db x-trackers II SWISS FRANC
CASH ETF*
db x-trackers II EURO
INFLATION SWAP 5 YEAR
TOTAL RETURN INDEX ETF*
db x-trackers II IBOXX £ GILTS
5+ TOTAL RETURN INDEX
ETF*
SGD CHF EUR GBP
Notes
NET ASSETS AT THE BEGINNING OF THE YEAR 26,972,045 558,053 6,791,837 5,078,148
INCOME
Interest on bonds, net 573,366 36,923 1,095,055 182,191
TOTAL INCOME 573,366 36,923 1,095,055 182,191
EXPENSES
Management Company Fee 5 3,983 278 22,795 5,395 Fixed Fee 5 7,966 558 22,795 5,395
TOTAL EXPENSES 11,949 836 45,590 10,790
NET INCOME / (LOSS) FROM INVESTMENTS 561,417 36,087 1,049,465 171,401
Net realised gain / (loss) on investments (155,540) (8,087) (14,051) (38,896) Net realised gain / (loss) on swap 8,624,780 (60,537) (364,595) (188,174) Net realised gain / (loss) on foreign exchange (737,677) (40,204) (13,499) 18,890
NET REALISED GAIN / (LOSS) 7,731,563 (108,828) (392,145) (208,180)
Change in net unrealised gain / (loss) on investments
796,073 26,840 (1,421,166) (23,732)
Change in net unrealised gain / (loss) on swap
(9,096,442) 45,370 901,081 1,121,291
CHANGE IN NET UNREALISED GAIN / (LOSS) (8,300,369) 72,210 (520,085) 1,097,559
NET INCREASE / (DECREASE) IN NET ASSETS AS A RESULT OF OPERATIONS (7,389) (531) 137,235 1,060,780
Dividends distributed 10 0 0 0 0
EVOLUTION OF THE CAPITAL
Subscriptions of Shares 19,391 990 23,161,159 10,915 Redemptions of Shares (19,392,210) 0 (2,311,082) 0 Currency adjustment 0 0 0 0
NET ASSETS AT THE END OF THE YEAR 7,591,837 558,512 27,779,149 6,149,843
52

db x-trackers II* Statement of Operations and Changes in Net Assets for the year ended 31 December 2011 (continued)
*This is a synthetic ETF. The accompanying notes form an integral part of these financial statements.
db x-trackers IIIBOXX $
TREASURIESTOTAL RETURN
INDEX ETF*
db x-trackers II UK GILTS
SHORT DAILY ETF*
db x-trackers II USD IG
INFLATION LINKED
TREASURIES TOTAL RETURN
INDEX ETF*
db x-trackers II US TREASURIES
SHORT DAILY ETF*
USD GBP USD USD
Notes
NET ASSETS AT THE BEGINNING OF THE YEAR 34,536,572 4,530,808 27,139,931 8,483,037
INCOME
Interest on bonds, net 1,448,232 248,472 689,680 352,565
TOTAL INCOME 1,448,232 248,472 689,680 352,565
EXPENSES
Management Company Fee 5 15,995 9,682 14,248 13,254 Fixed Fee 5 31,990 6,455 14,248 8,836
TOTAL EXPENSES 47,985 16,137 28,496 22,090
NET INCOME / (LOSS) FROM INVESTMENTS 1,400,247 232,335 661,184 330,475
Net realised gain / (loss) on investments (420,773) (149,042) (77,112) (356,056) Net realised gain / (loss) on swap (1,447,364) (220,254) 4,611,044 (923,647) Net realised gain / (loss) on foreign exchange 784,754 63,591 22,596 814,405
NET REALISED GAIN / (LOSS) (1,083,383) (305,705) 4,556,528 (465,298)
Change in net unrealised gain / (loss) on investments
1,601,707 205,976 560,795 398,043
Change in net unrealised gain / (loss) on swap
831,533 (1,232,133) (4,331,516) (996,531)
CHANGE IN NET UNREALISED GAIN / (LOSS) 2,433,240 (1,026,157) (3,770,721) (598,488)
NET INCREASE / (DECREASE) IN NET ASSETS AS A RESULT OF OPERATIONS 2,750,104 (1,099,527) 1,446,991 (733,311)
Dividends distributed 10 0 0 0 0
EVOLUTION OF THE CAPITAL
Subscriptions of Shares 14,061,683 2,674,868 5,010,015 15,689,845 Redemptions of Shares (11,350,554) 0 (21,616,603) (14,841,487) Currency adjustment 0 0 0 0
NET ASSETS AT THE END OF THE YEAR 39,997,805 6,106,149 11,980,334 8,598,084
53
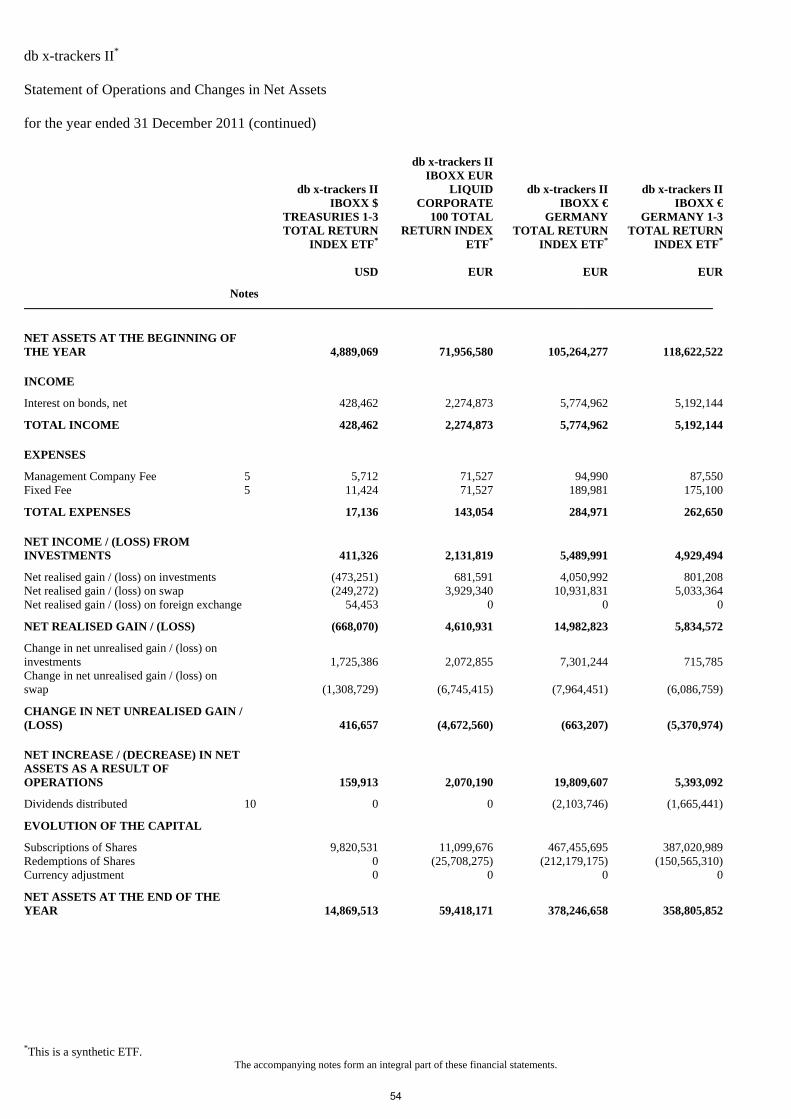
db x-trackers II* Statement of Operations and Changes in Net Assets for the year ended 31 December 2011 (continued)
*This is a synthetic ETF. The accompanying notes form an integral part of these financial statements.
db x-trackers IIIBOXX $
TREASURIES 1-3 TOTAL RETURN
INDEX ETF*
db x-trackers II IBOXX EUR
LIQUID CORPORATE
100 TOTAL RETURN INDEX
ETF*
db x-trackers II IBOXX €
GERMANY TOTAL RETURN
INDEX ETF*
db x-trackers II IBOXX €
GERMANY 1-3 TOTAL RETURN
INDEX ETF*
USD EUR EUR EUR
Notes
NET ASSETS AT THE BEGINNING OF THE YEAR 4,889,069 71,956,580 105,264,277 118,622,522
INCOME
Interest on bonds, net 428,462 2,274,873 5,774,962 5,192,144
TOTAL INCOME 428,462 2,274,873 5,774,962 5,192,144
EXPENSES
Management Company Fee 5 5,712 71,527 94,990 87,550 Fixed Fee 5 11,424 71,527 189,981 175,100
TOTAL EXPENSES 17,136 143,054 284,971 262,650
NET INCOME / (LOSS) FROM INVESTMENTS 411,326 2,131,819 5,489,991 4,929,494
Net realised gain / (loss) on investments (473,251) 681,591 4,050,992 801,208 Net realised gain / (loss) on swap (249,272) 3,929,340 10,931,831 5,033,364 Net realised gain / (loss) on foreign exchange 54,453 0 0 0
NET REALISED GAIN / (LOSS) (668,070) 4,610,931 14,982,823 5,834,572
Change in net unrealised gain / (loss) on investments
1,725,386 2,072,855 7,301,244 715,785
Change in net unrealised gain / (loss) on swap
(1,308,729) (6,745,415) (7,964,451) (6,086,759)
CHANGE IN NET UNREALISED GAIN / (LOSS) 416,657 (4,672,560) (663,207) (5,370,974)
NET INCREASE / (DECREASE) IN NET ASSETS AS A RESULT OF OPERATIONS 159,913 2,070,190 19,809,607 5,393,092
Dividends distributed 10 0 0 (2,103,746) (1,665,441)
EVOLUTION OF THE CAPITAL
Subscriptions of Shares 9,820,531 11,099,676 467,455,695 387,020,989 Redemptions of Shares 0 (25,708,275) (212,179,175) (150,565,310) Currency adjustment 0 0 0 0
NET ASSETS AT THE END OF THE YEAR 14,869,513 59,418,171 378,246,658 358,805,852
54
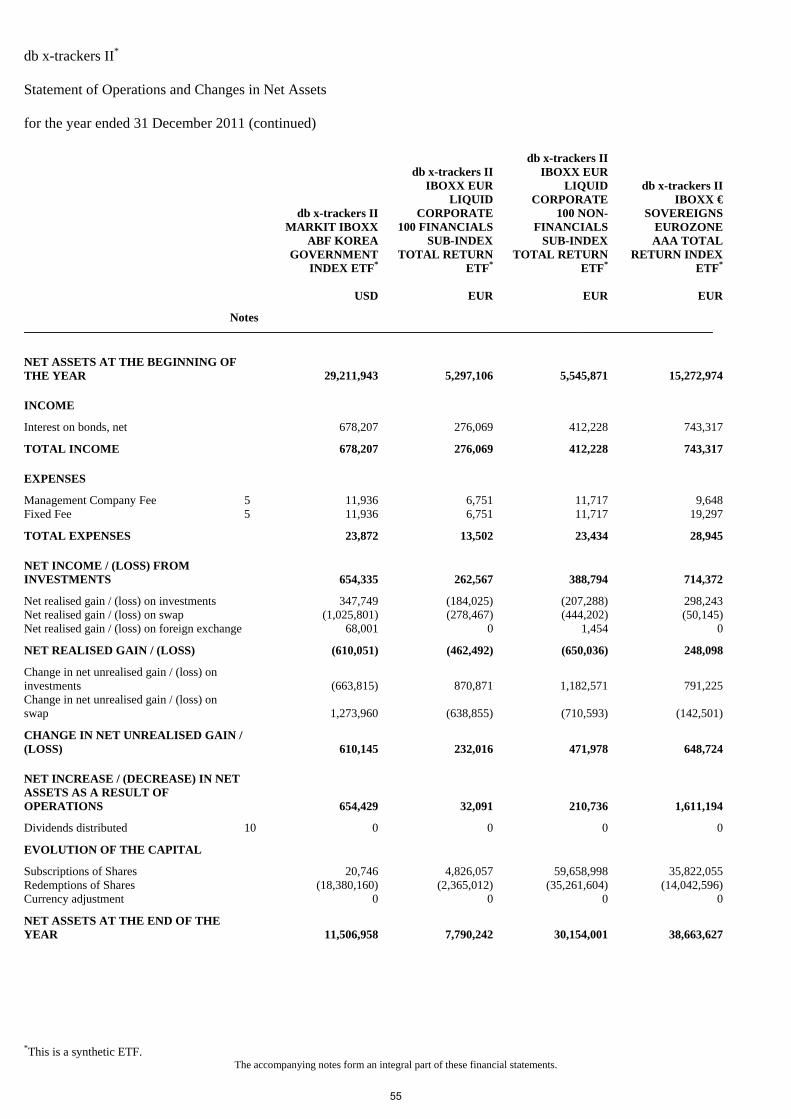
db x-trackers II* Statement of Operations and Changes in Net Assets for the year ended 31 December 2011 (continued)
*This is a synthetic ETF. The accompanying notes form an integral part of these financial statements.
db x-trackers II MARKIT IBOXX
ABF KOREAGOVERNMENT
INDEX ETF*
db x-trackers II IBOXX EUR
LIQUID CORPORATE
100 FINANCIALS SUB-INDEX
TOTAL RETURN ETF*
db x-trackers II IBOXX EUR
LIQUID CORPORATE
100 NON-FINANCIALS
SUB-INDEX TOTAL RETURN
ETF*
db x-trackers IIIBOXX €
SOVEREIGNS EUROZONE AAA TOTAL
RETURN INDEX ETF*
USD EUR EUR EUR
Notes
NET ASSETS AT THE BEGINNING OF THE YEAR 29,211,943 5,297,106 5,545,871 15,272,974
INCOME
Interest on bonds, net 678,207 276,069 412,228 743,317
TOTAL INCOME 678,207 276,069 412,228 743,317
EXPENSES
Management Company Fee 5 11,936 6,751 11,717 9,648 Fixed Fee 5 11,936 6,751 11,717 19,297
TOTAL EXPENSES 23,872 13,502 23,434 28,945
NET INCOME / (LOSS) FROM INVESTMENTS 654,335 262,567 388,794 714,372
Net realised gain / (loss) on investments 347,749 (184,025) (207,288) 298,243 Net realised gain / (loss) on swap (1,025,801) (278,467) (444,202) (50,145) Net realised gain / (loss) on foreign exchange 68,001 0 1,454 0
NET REALISED GAIN / (LOSS) (610,051) (462,492) (650,036) 248,098
Change in net unrealised gain / (loss) on investments
(663,815) 870,871 1,182,571 791,225
Change in net unrealised gain / (loss) on swap
1,273,960 (638,855) (710,593) (142,501)
CHANGE IN NET UNREALISED GAIN / (LOSS) 610,145 232,016 471,978 648,724
NET INCREASE / (DECREASE) IN NET ASSETS AS A RESULT OF OPERATIONS 654,429 32,091 210,736 1,611,194
Dividends distributed 10 0 0 0 0
EVOLUTION OF THE CAPITAL
Subscriptions of Shares 20,746 4,826,057 59,658,998 35,822,055 Redemptions of Shares (18,380,160) (2,365,012) (35,261,604) (14,042,596) Currency adjustment 0 0 0 0
NET ASSETS AT THE END OF THE YEAR 11,506,958 7,790,242 30,154,001 38,663,627
55

db x-trackers II* Statement of Operations and Changes in Net Assets for the year ended 31 December 2011 (continued)
*This is a synthetic ETF. The accompanying notes form an integral part of these financial statements.
db x-trackers IIIBOXX €
SOVEREIGNSEUROZONE
YIELD PLUSINDEX ETF*
db x-trackers II AUSTRALIAN
DOLLAR CASH ETF*
db x-trackers II AUSTRALIA SSA
BONDS TOTAL RETURN INDEX
ETF*
EUR AUD AUD
Notes
NET ASSETS AT THE BEGINNING OF THE YEAR 10,488,095 42,047,634 40,579,325
INCOME
Interest on bonds, net 1,651,757 823,832 1,484,951
TOTAL INCOME 1,651,757 823,832 1,484,951
EXPENSES
Management Company Fee 5 21,768 20,026 39,587 Fixed Fee 5 43,535 20,019 26,391
TOTAL EXPENSES 65,303 40,045 65,978
NET INCOME / (LOSS) FROM INVESTMENTS 1,586,454 783,787 1,418,973
Net realised gain / (loss) on investments (2,996,712) (101,359) (268,574) Net realised gain / (loss) on swap (1,209,629) 2,875,492 (361,830) Net realised gain / (loss) on foreign exchange 0 (2,804,497) 0
NET REALISED GAIN / (LOSS) (4,206,341) (30,364) (630,404)
Change in net unrealised gain / (loss) on investments
1,712,436 2,935,463 1,528,044
Change in net unrealised gain / (loss) on swap
(79,122) (2,789,114) 664,909
CHANGE IN NET UNREALISED GAIN / (LOSS) 1,633,314 146,349 2,192,953
NET INCREASE / (DECREASE) IN NET ASSETS AS A RESULT OF OPERATIONS (986,573) 899,772 2,981,522
Dividends distributed 10 0 0 0
EVOLUTION OF THE CAPITAL
Subscriptions of Shares 65,270,441 17,405,012 30,108 Redemptions of Shares (9,016,416) (50,566,182) (20,689,822) Currency adjustment 0 0 0
NET ASSETS AT THE END OF THE YEAR 65,755,547 9,786,236 22,901,133
56
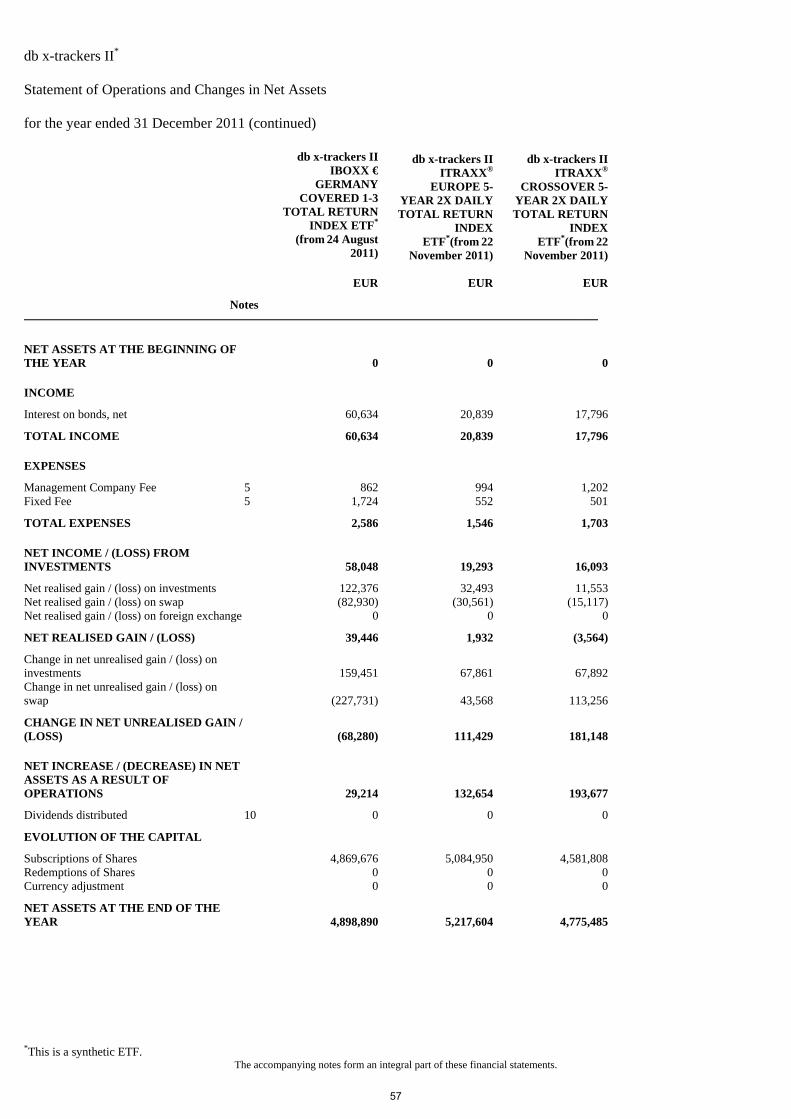
db x-trackers II* Statement of Operations and Changes in Net Assets for the year ended 31 December 2011 (continued)
*This is a synthetic ETF. The accompanying notes form an integral part of these financial statements.
db x-trackers IIIBOXX €
GERMANYCOVERED 1-3
TOTAL RETURNINDEX ETF*
(from 24 August2011)
db x-trackers II ITRAXX®
EUROPE 5-YEAR 2X DAILY TOTAL RETURN
INDEX ETF*(from 22
November 2011)
db x-trackers II ITRAXX®
CROSSOVER 5-YEAR 2X DAILY TOTAL RETURN
INDEX ETF*(from 22
November 2011)
EUR EUR EUR
Notes
NET ASSETS AT THE BEGINNING OF THE YEAR 0 0 0
INCOME
Interest on bonds, net 60,634 20,839 17,796
TOTAL INCOME 60,634 20,839 17,796
EXPENSES
Management Company Fee 5 862 994 1,202 Fixed Fee 5 1,724 552 501
TOTAL EXPENSES 2,586 1,546 1,703
NET INCOME / (LOSS) FROM INVESTMENTS 58,048 19,293 16,093
Net realised gain / (loss) on investments 122,376 32,493 11,553 Net realised gain / (loss) on swap (82,930) (30,561) (15,117) Net realised gain / (loss) on foreign exchange 0 0 0
NET REALISED GAIN / (LOSS) 39,446 1,932 (3,564)
Change in net unrealised gain / (loss) on investments
159,451 67,861 67,892
Change in net unrealised gain / (loss) on swap
(227,731) 43,568 113,256
CHANGE IN NET UNREALISED GAIN / (LOSS) (68,280) 111,429 181,148
NET INCREASE / (DECREASE) IN NET ASSETS AS A RESULT OF OPERATIONS 29,214 132,654 193,677
Dividends distributed 10 0 0 0
EVOLUTION OF THE CAPITAL
Subscriptions of Shares 4,869,676 5,084,950 4,581,808 Redemptions of Shares 0 0 0 Currency adjustment 0 0 0
NET ASSETS AT THE END OF THE YEAR 4,898,890 5,217,604 4,775,485
57
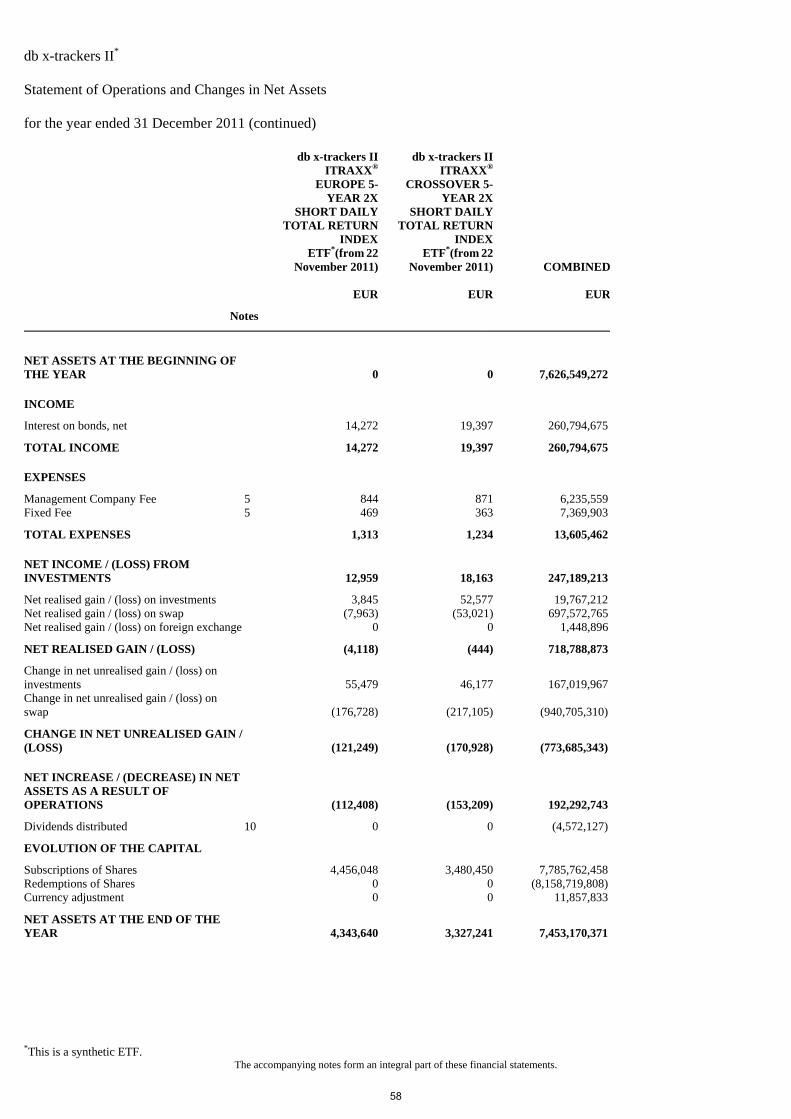
db x-trackers II* Statement of Operations and Changes in Net Assets for the year ended 31 December 2011 (continued)
*This is a synthetic ETF. The accompanying notes form an integral part of these financial statements.
db x-trackers IIITRAXX®
EUROPE 5-YEAR 2X
SHORT DAILYTOTAL RETURN
INDEX ETF*(from 22
November 2011)
db x-trackers II ITRAXX®
CROSSOVER 5-YEAR 2X
SHORT DAILY TOTAL RETURN
INDEX ETF*(from 22
November 2011) COMBINED
EUR EUR EUR
Notes
NET ASSETS AT THE BEGINNING OF THE YEAR 0 0 7,626,549,272
INCOME
Interest on bonds, net 14,272 19,397 260,794,675
TOTAL INCOME 14,272 19,397 260,794,675
EXPENSES
Management Company Fee 5 844 871 6,235,559Fixed Fee 5 469 363 7,369,903
TOTAL EXPENSES 1,313 1,234 13,605,462
NET INCOME / (LOSS) FROM INVESTMENTS 12,959 18,163 247,189,213
Net realised gain / (loss) on investments 3,845 52,577 19,767,212Net realised gain / (loss) on swap (7,963) (53,021) 697,572,765Net realised gain / (loss) on foreign exchange 0 0 1,448,896
NET REALISED GAIN / (LOSS) (4,118) (444) 718,788,873
Change in net unrealised gain / (loss) on investments
55,479 46,177 167,019,967
Change in net unrealised gain / (loss) on swap
(176,728) (217,105) (940,705,310)
CHANGE IN NET UNREALISED GAIN / (LOSS) (121,249) (170,928) (773,685,343)
NET INCREASE / (DECREASE) IN NET ASSETS AS A RESULT OF OPERATIONS (112,408) (153,209) 192,292,743
Dividends distributed 10 0 0 (4,572,127)
EVOLUTION OF THE CAPITAL
Subscriptions of Shares 4,456,048 3,480,450 7,785,762,458Redemptions of Shares 0 0 (8,158,719,808)Currency adjustment 0 0 11,857,833
NET ASSETS AT THE END OF THE YEAR 4,343,640 3,327,241 7,453,170,371
58
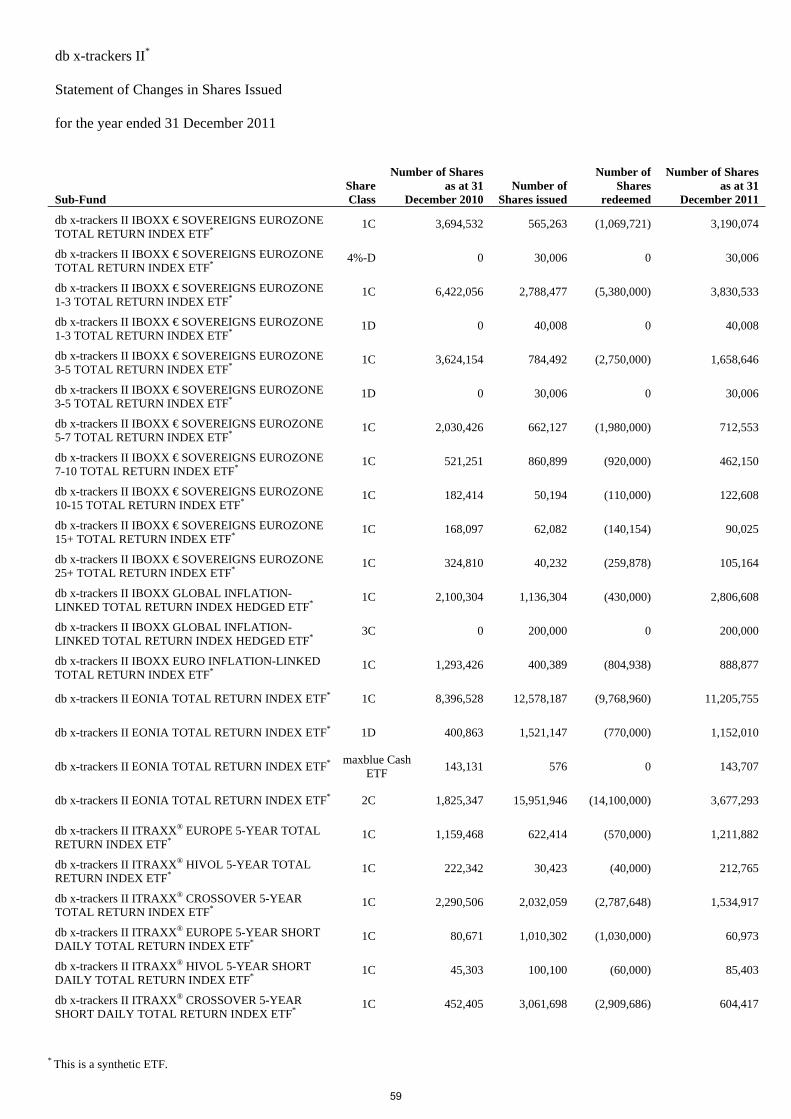
db x-trackers II*
Statement of Changes in Shares Issued
for the year ended 31 December 2011
Sub-Fund ShareClass
Number of Shares as at 31
December 2010 Number of
Shares issued
Number of Shares
redeemed
Number of Shares as at 31
December 2011
db x-trackers II IBOXX € SOVEREIGNS EUROZONE TOTAL RETURN INDEX ETF*
1C 3,694,532 565,263 (1,069,721) 3,190,074
db x-trackers II IBOXX € SOVEREIGNS EUROZONE TOTAL RETURN INDEX ETF*
4%-D 0 30,006 0 30,006
db x-trackers II IBOXX € SOVEREIGNS EUROZONE 1-3 TOTAL RETURN INDEX ETF*
1C 6,422,056 2,788,477 (5,380,000) 3,830,533
db x-trackers II IBOXX € SOVEREIGNS EUROZONE 1-3 TOTAL RETURN INDEX ETF*
1D 0 40,008 0 40,008
db x-trackers II IBOXX € SOVEREIGNS EUROZONE 3-5 TOTAL RETURN INDEX ETF*
1C 3,624,154 784,492 (2,750,000) 1,658,646
db x-trackers II IBOXX € SOVEREIGNS EUROZONE 3-5 TOTAL RETURN INDEX ETF*
1D 0 30,006 0 30,006
db x-trackers II IBOXX € SOVEREIGNS EUROZONE 5-7 TOTAL RETURN INDEX ETF*
1C 2,030,426 662,127 (1,980,000) 712,553
db x-trackers II IBOXX € SOVEREIGNS EUROZONE 7-10 TOTAL RETURN INDEX ETF*
1C 521,251 860,899 (920,000) 462,150
db x-trackers II IBOXX € SOVEREIGNS EUROZONE 10-15 TOTAL RETURN INDEX ETF*
1C 182,414 50,194 (110,000) 122,608
db x-trackers II IBOXX € SOVEREIGNS EUROZONE 15+ TOTAL RETURN INDEX ETF*
1C 168,097 62,082 (140,154) 90,025
db x-trackers II IBOXX € SOVEREIGNS EUROZONE 25+ TOTAL RETURN INDEX ETF*
1C 324,810 40,232 (259,878) 105,164
db x-trackers II IBOXX GLOBAL INFLATION-LINKED TOTAL RETURN INDEX HEDGED ETF*
1C 2,100,304 1,136,304 (430,000) 2,806,608
db x-trackers II IBOXX GLOBAL INFLATION-LINKED TOTAL RETURN INDEX HEDGED ETF*
3C 0 200,000 0 200,000
db x-trackers II IBOXX EURO INFLATION-LINKED TOTAL RETURN INDEX ETF*
1C 1,293,426 400,389 (804,938) 888,877
db x-trackers II EONIA TOTAL RETURN INDEX ETF* 1C 8,396,528 12,578,187 (9,768,960) 11,205,755
db x-trackers II EONIA TOTAL RETURN INDEX ETF* 1D 400,863 1,521,147 (770,000) 1,152,010
db x-trackers II EONIA TOTAL RETURN INDEX ETF* maxblue Cash ETF
143,131 576 0 143,707
db x-trackers II EONIA TOTAL RETURN INDEX ETF* 2C 1,825,347 15,951,946 (14,100,000) 3,677,293
db x-trackers II ITRAXX® EUROPE 5-YEAR TOTAL RETURN INDEX ETF*
1C 1,159,468 622,414 (570,000) 1,211,882
db x-trackers II ITRAXX® HIVOL 5-YEAR TOTAL RETURN INDEX ETF*
1C 222,342 30,423 (40,000) 212,765
db x-trackers II ITRAXX® CROSSOVER 5-YEAR TOTAL RETURN INDEX ETF*
1C 2,290,506 2,032,059 (2,787,648) 1,534,917
db x-trackers II ITRAXX® EUROPE 5-YEAR SHORT DAILY TOTAL RETURN INDEX ETF*
1C 80,671 1,010,302 (1,030,000) 60,973
db x-trackers II ITRAXX® HIVOL 5-YEAR SHORT DAILY TOTAL RETURN INDEX ETF*
1C 45,303 100,100 (60,000) 85,403
db x-trackers II ITRAXX® CROSSOVER 5-YEAR SHORT DAILY TOTAL RETURN INDEX ETF*
1C 452,405 3,061,698 (2,909,686) 604,417
* This is a synthetic ETF.
59
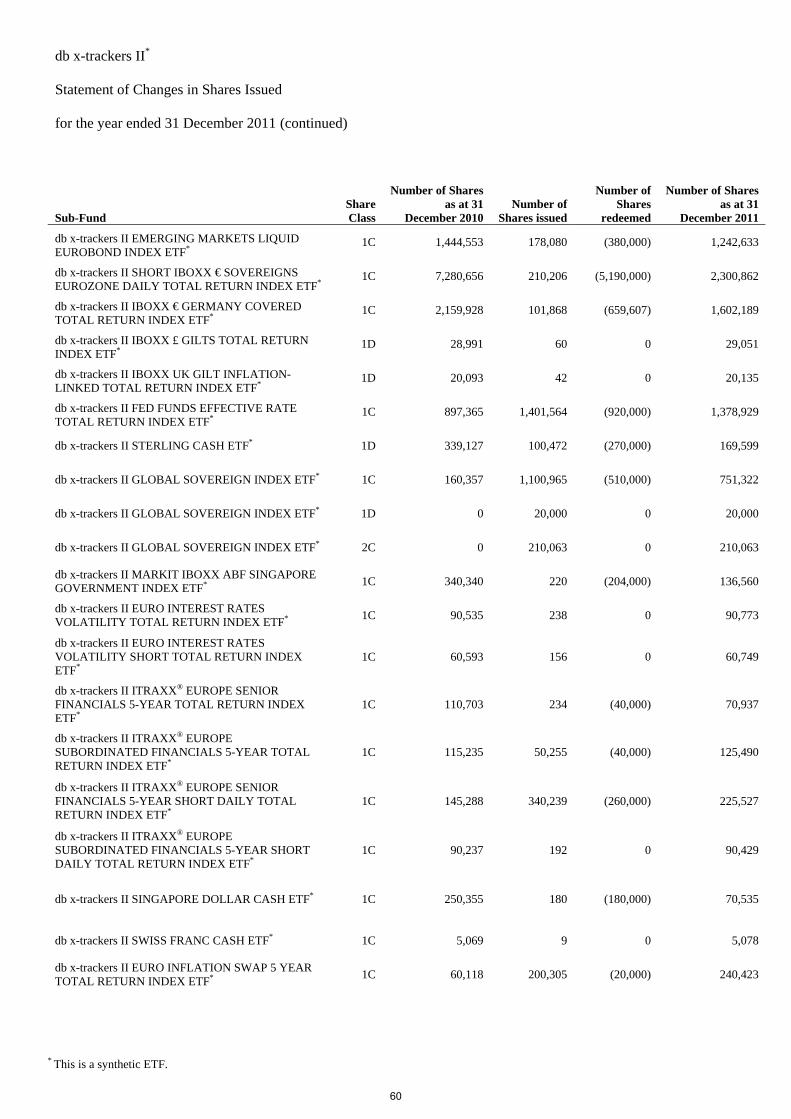
db x-trackers II*
Statement of Changes in Shares Issued
for the year ended 31 December 2011 (continued)
Sub-Fund Share Class
Number of Shares as at 31
December 2010 Number of
Shares issued
Number of Shares
redeemed
Number of Shares as at 31
December 2011
db x-trackers II EMERGING MARKETS LIQUID EUROBOND INDEX ETF*
1C 1,444,553 178,080 (380,000) 1,242,633
db x-trackers II SHORT IBOXX € SOVEREIGNS EUROZONE DAILY TOTAL RETURN INDEX ETF*
1C 7,280,656 210,206 (5,190,000) 2,300,862
db x-trackers II IBOXX € GERMANY COVERED TOTAL RETURN INDEX ETF*
1C 2,159,928 101,868 (659,607) 1,602,189
db x-trackers II IBOXX £ GILTS TOTAL RETURN INDEX ETF*
1D 28,991 60 0 29,051
db x-trackers II IBOXX UK GILT INFLATION-LINKED TOTAL RETURN INDEX ETF*
1D 20,093 42 0 20,135
db x-trackers II FED FUNDS EFFECTIVE RATE TOTAL RETURN INDEX ETF*
1C 897,365 1,401,564 (920,000) 1,378,929
db x-trackers II STERLING CASH ETF* 1D 339,127 100,472 (270,000) 169,599
db x-trackers II GLOBAL SOVEREIGN INDEX ETF* 1C 160,357 1,100,965 (510,000) 751,322
db x-trackers II GLOBAL SOVEREIGN INDEX ETF* 1D 0 20,000 0 20,000
db x-trackers II GLOBAL SOVEREIGN INDEX ETF* 2C 0 210,063 0 210,063
db x-trackers II MARKIT IBOXX ABF SINGAPORE GOVERNMENT INDEX ETF*
1C 340,340 220 (204,000) 136,560
db x-trackers II EURO INTEREST RATES VOLATILITY TOTAL RETURN INDEX ETF*
1C 90,535 238 0 90,773
db x-trackers II EURO INTEREST RATES VOLATILITY SHORT TOTAL RETURN INDEX ETF*
1C 60,593 156 0 60,749
db x-trackers II ITRAXX® EUROPE SENIOR FINANCIALS 5-YEAR TOTAL RETURN INDEX ETF*
1C 110,703 234 (40,000) 70,937
db x-trackers II ITRAXX® EUROPE SUBORDINATED FINANCIALS 5-YEAR TOTAL RETURN INDEX ETF*
1C 115,235 50,255 (40,000) 125,490
db x-trackers II ITRAXX® EUROPE SENIOR FINANCIALS 5-YEAR SHORT DAILY TOTAL RETURN INDEX ETF*
1C 145,288 340,239 (260,000) 225,527
db x-trackers II ITRAXX® EUROPE SUBORDINATED FINANCIALS 5-YEAR SHORT DAILY TOTAL RETURN INDEX ETF*
1C 90,237 192 0 90,429
db x-trackers II SINGAPORE DOLLAR CASH ETF* 1C 250,355 180 (180,000) 70,535
db x-trackers II SWISS FRANC CASH ETF* 1C 5,069 9 0 5,078
db x-trackers II EURO INFLATION SWAP 5 YEAR TOTAL RETURN INDEX ETF*
1C 60,118 200,305 (20,000) 240,423
* This is a synthetic ETF.
60
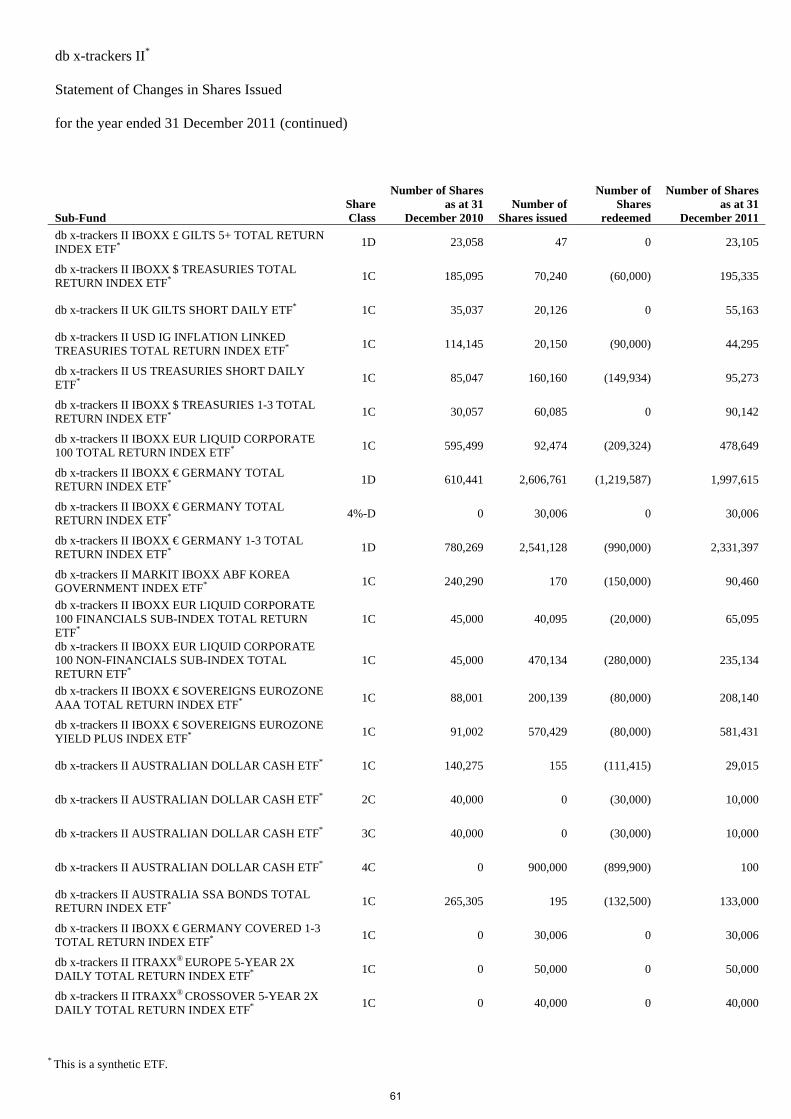
db x-trackers II*
Statement of Changes in Shares Issued
for the year ended 31 December 2011 (continued)
Sub-Fund Share Class
Number of Shares as at 31
December 2010 Number of
Shares issued
Number of Shares
redeemed
Number of Shares as at 31
December 2011
db x-trackers II IBOXX £ GILTS 5+ TOTAL RETURN INDEX ETF*
1D 23,058 47 0 23,105
db x-trackers II IBOXX $ TREASURIES TOTAL RETURN INDEX ETF*
1C 185,095 70,240 (60,000) 195,335
db x-trackers II UK GILTS SHORT DAILY ETF* 1C 35,037 20,126 0 55,163
db x-trackers II USD IG INFLATION LINKED TREASURIES TOTAL RETURN INDEX ETF*
1C 114,145 20,150 (90,000) 44,295
db x-trackers II US TREASURIES SHORT DAILY ETF*
1C 85,047 160,160 (149,934) 95,273
db x-trackers II IBOXX $ TREASURIES 1-3 TOTAL RETURN INDEX ETF*
1C 30,057 60,085 0 90,142
db x-trackers II IBOXX EUR LIQUID CORPORATE 100 TOTAL RETURN INDEX ETF*
1C 595,499 92,474 (209,324) 478,649
db x-trackers II IBOXX € GERMANY TOTAL RETURN INDEX ETF*
1D 610,441 2,606,761 (1,219,587) 1,997,615
db x-trackers II IBOXX € GERMANY TOTAL RETURN INDEX ETF*
4%-D 0 30,006 0 30,006
db x-trackers II IBOXX € GERMANY 1-3 TOTAL RETURN INDEX ETF*
1D 780,269 2,541,128 (990,000) 2,331,397
db x-trackers II MARKIT IBOXX ABF KOREA GOVERNMENT INDEX ETF*
1C 240,290 170 (150,000) 90,460
db x-trackers II IBOXX EUR LIQUID CORPORATE 100 FINANCIALS SUB-INDEX TOTAL RETURN ETF*
1C 45,000 40,095 (20,000) 65,095
db x-trackers II IBOXX EUR LIQUID CORPORATE 100 NON-FINANCIALS SUB-INDEX TOTAL RETURN ETF*
1C 45,000 470,134 (280,000) 235,134
db x-trackers II IBOXX € SOVEREIGNS EUROZONE AAA TOTAL RETURN INDEX ETF*
1C 88,001 200,139 (80,000) 208,140
db x-trackers II IBOXX € SOVEREIGNS EUROZONE YIELD PLUS INDEX ETF*
1C 91,002 570,429 (80,000) 581,431
db x-trackers II AUSTRALIAN DOLLAR CASH ETF* 1C 140,275 155 (111,415) 29,015
db x-trackers II AUSTRALIAN DOLLAR CASH ETF* 2C 40,000 0 (30,000) 10,000
db x-trackers II AUSTRALIAN DOLLAR CASH ETF* 3C 40,000 0 (30,000) 10,000
db x-trackers II AUSTRALIAN DOLLAR CASH ETF* 4C 0 900,000 (899,900) 100
db x-trackers II AUSTRALIA SSA BONDS TOTAL RETURN INDEX ETF*
1C 265,305 195 (132,500) 133,000
db x-trackers II IBOXX € GERMANY COVERED 1-3 TOTAL RETURN INDEX ETF*
1C 0 30,006 0 30,006
db x-trackers II ITRAXX® EUROPE 5-YEAR 2X DAILY TOTAL RETURN INDEX ETF*
1C 0 50,000 0 50,000
db x-trackers II ITRAXX® CROSSOVER 5-YEAR 2X DAILY TOTAL RETURN INDEX ETF*
1C 0 40,000 0 40,000
* This is a synthetic ETF.
61
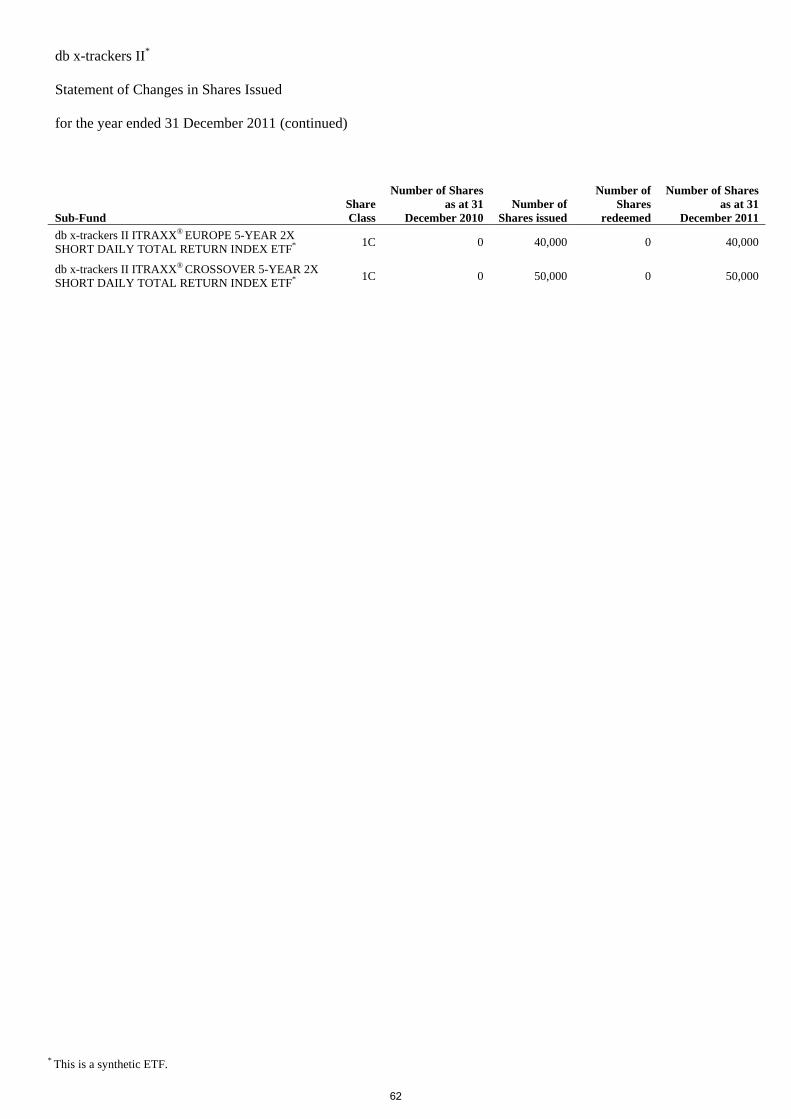
db x-trackers II*
Statement of Changes in Shares Issued
for the year ended 31 December 2011 (continued)
* This is a synthetic ETF.
Sub-Fund Share Class
Number of Shares as at 31
December 2010 Number of
Shares issued
Number of Shares
redeemed
Number of Shares as at 31
December 2011
db x-trackers II ITRAXX® EUROPE 5-YEAR 2X SHORT DAILY TOTAL RETURN INDEX ETF*
1C 0 40,000 0 40,000
db x-trackers II ITRAXX® CROSSOVER 5-YEAR 2X SHORT DAILY TOTAL RETURN INDEX ETF*
1C 0 50,000 0 50,000
62
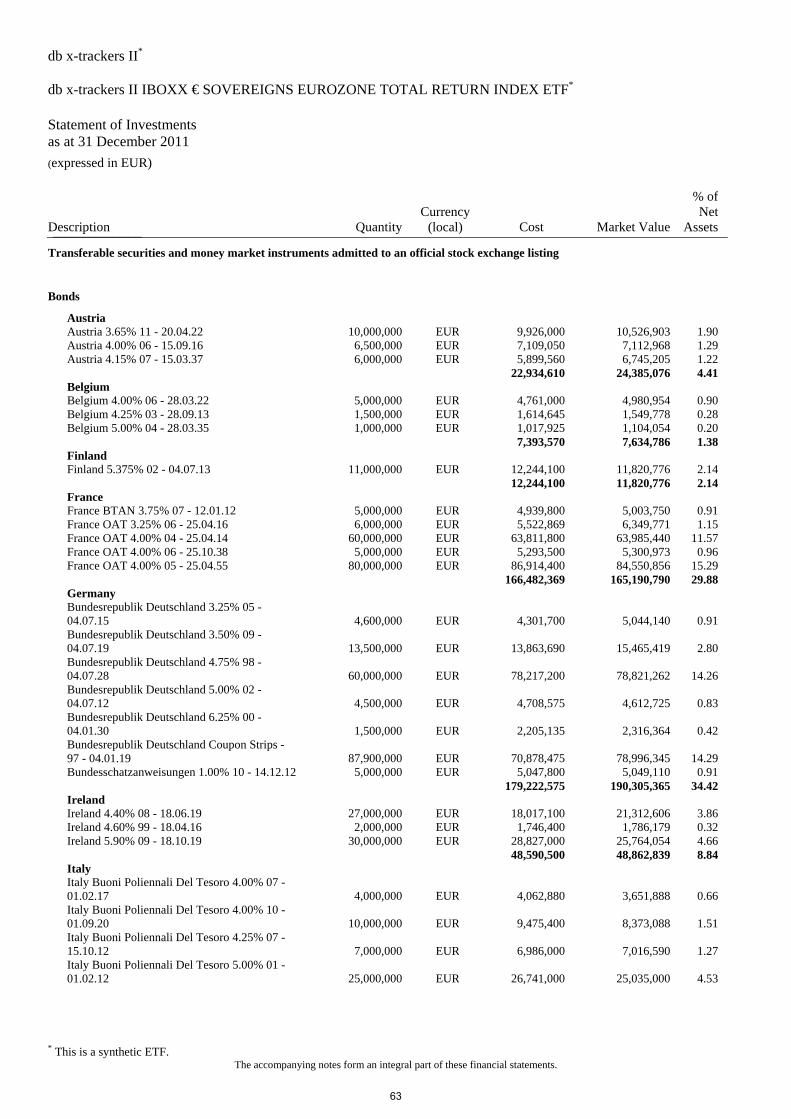
db x-trackers II* db x-trackers II IBOXX € SOVEREIGNS EUROZONE TOTAL RETURN INDEX ETF* Statement of Investments as at 31 December 2011 (expressed in EUR)
* This is a synthetic ETF. The accompanying notes form an integral part of these financial statements.
Description QuantityCurrency
(local) Cost Market Value
% of Net
Assets_______________
Transferable securities and money market instruments admitted to an official stock exchange listing
Bonds
Austria Austria 3.65% 11 - 20.04.22 10,000,000 EUR 9,926,000 10,526,903 1.90 Austria 4.00% 06 - 15.09.16 6,500,000 EUR 7,109,050 7,112,968 1.29 Austria 4.15% 07 - 15.03.37 6,000,000 EUR 5,899,560 6,745,205 1.22 22,934,610 24,385,076 4.41 Belgium Belgium 4.00% 06 - 28.03.22 5,000,000 EUR 4,761,000 4,980,954 0.90 Belgium 4.25% 03 - 28.09.13 1,500,000 EUR 1,614,645 1,549,778 0.28 Belgium 5.00% 04 - 28.03.35 1,000,000 EUR 1,017,925 1,104,054 0.20 7,393,570 7,634,786 1.38 Finland Finland 5.375% 02 - 04.07.13 11,000,000 EUR 12,244,100 11,820,776 2.14 12,244,100 11,820,776 2.14 France France BTAN 3.75% 07 - 12.01.12 5,000,000 EUR 4,939,800 5,003,750 0.91 France OAT 3.25% 06 - 25.04.16 6,000,000 EUR 5,522,869 6,349,771 1.15 France OAT 4.00% 04 - 25.04.14 60,000,000 EUR 63,811,800 63,985,440 11.57 France OAT 4.00% 06 - 25.10.38 5,000,000 EUR 5,293,500 5,300,973 0.96 France OAT 4.00% 05 - 25.04.55 80,000,000 EUR 86,914,400 84,550,856 15.29 166,482,369 165,190,790 29.88 Germany Bundesrepublik Deutschland 3.25% 05 -
04.07.15 4,600,000 EUR 4,301,700 5,044,140 0.91 Bundesrepublik Deutschland 3.50% 09 -
04.07.19 13,500,000 EUR 13,863,690 15,465,419 2.80 Bundesrepublik Deutschland 4.75% 98 -
04.07.28 60,000,000 EUR 78,217,200 78,821,262 14.26 Bundesrepublik Deutschland 5.00% 02 -
04.07.12 4,500,000 EUR 4,708,575 4,612,725 0.83 Bundesrepublik Deutschland 6.25% 00 -
04.01.30 1,500,000 EUR 2,205,135 2,316,364 0.42 Bundesrepublik Deutschland Coupon Strips -
97 - 04.01.19 87,900,000 EUR 70,878,475 78,996,345 14.29 Bundesschatzanweisungen 1.00% 10 - 14.12.12 5,000,000 EUR 5,047,800 5,049,110 0.91 179,222,575 190,305,365 34.42 Ireland Ireland 4.40% 08 - 18.06.19 27,000,000 EUR 18,017,100 21,312,606 3.86 Ireland 4.60% 99 - 18.04.16 2,000,000 EUR 1,746,400 1,786,179 0.32 Ireland 5.90% 09 - 18.10.19 30,000,000 EUR 28,827,000 25,764,054 4.66 48,590,500 48,862,839 8.84 Italy Italy Buoni Poliennali Del Tesoro 4.00% 07 -
01.02.17 4,000,000 EUR 4,062,880 3,651,888 0.66 Italy Buoni Poliennali Del Tesoro 4.00% 10 -
01.09.20 10,000,000 EUR 9,475,400 8,373,088 1.51 Italy Buoni Poliennali Del Tesoro 4.25% 07 -
15.10.12 7,000,000 EUR 6,986,000 7,016,590 1.27 Italy Buoni Poliennali Del Tesoro 5.00% 01 -
01.02.12 25,000,000 EUR 26,741,000 25,035,000 4.53
63
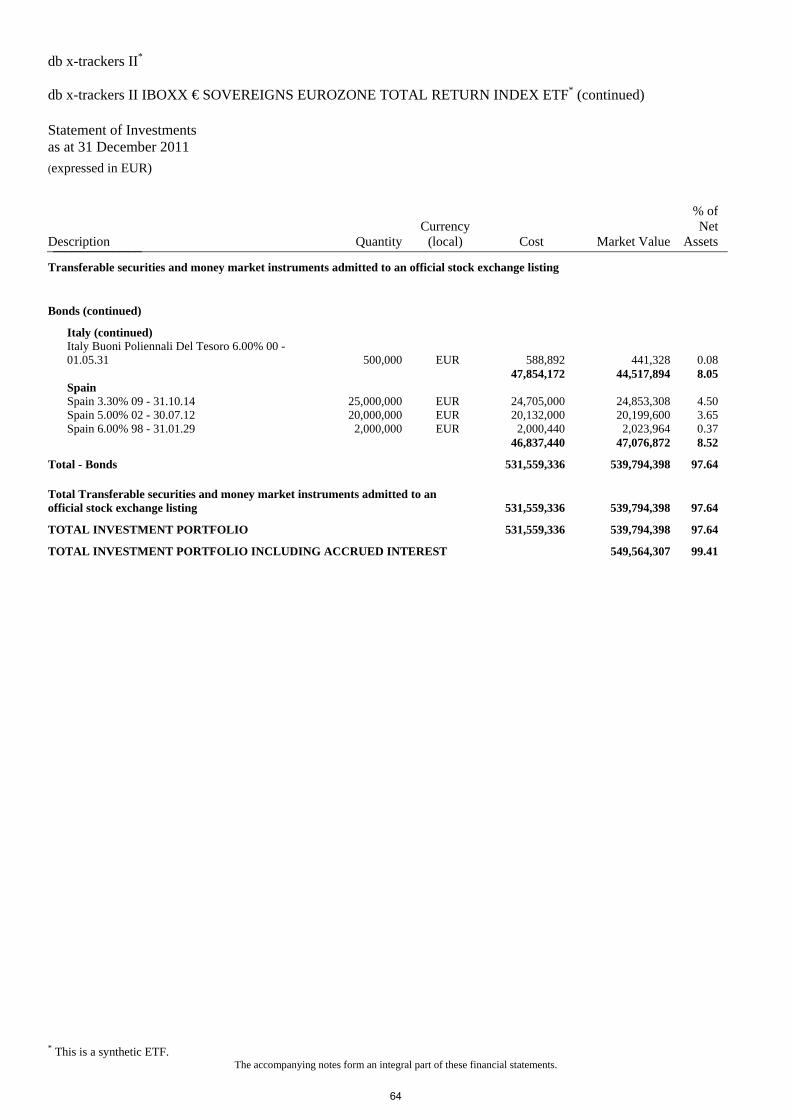
db x-trackers II* db x-trackers II IBOXX € SOVEREIGNS EUROZONE TOTAL RETURN INDEX ETF* (continued) Statement of Investments as at 31 December 2011 (expressed in EUR)
* This is a synthetic ETF. The accompanying notes form an integral part of these financial statements.
Description QuantityCurrency
(local) Cost Market Value
% of Net
Assets_______________
Transferable securities and money market instruments admitted to an official stock exchange listing
Bonds (continued)
Italy (continued) Italy Buoni Poliennali Del Tesoro 6.00% 00 -
01.05.31 500,000 EUR 588,892 441,328 0.08 47,854,172 44,517,894 8.05 Spain Spain 3.30% 09 - 31.10.14 25,000,000 EUR 24,705,000 24,853,308 4.50 Spain 5.00% 02 - 30.07.12 20,000,000 EUR 20,132,000 20,199,600 3.65 Spain 6.00% 98 - 31.01.29 2,000,000 EUR 2,000,440 2,023,964 0.37 46,837,440 47,076,872 8.52
Total - Bonds 531,559,336 539,794,398 97.64
Total Transferable securities and money market instruments admitted to an official stock exchange listing 531,559,336 539,794,398 97.64
TOTAL INVESTMENT PORTFOLIO 531,559,336 539,794,398 97.64
TOTAL INVESTMENT PORTFOLIO INCLUDING ACCRUED INTEREST 549,564,307 99.41
64
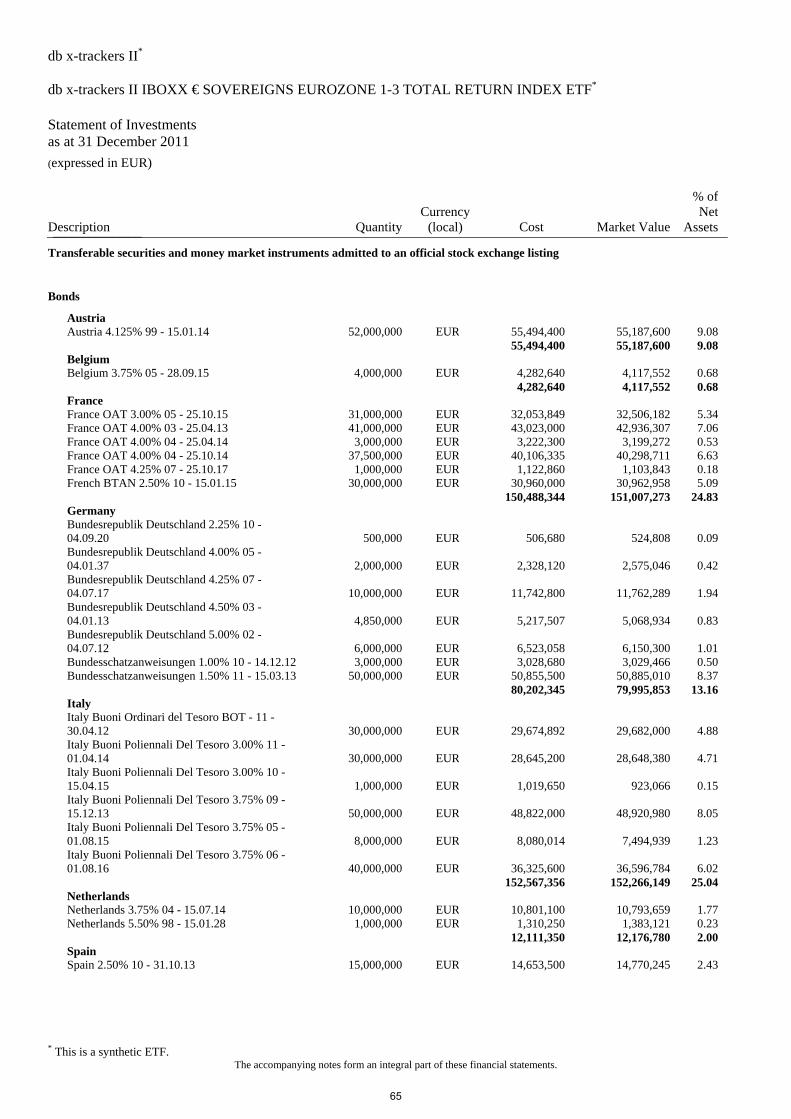
db x-trackers II* db x-trackers II IBOXX € SOVEREIGNS EUROZONE 1-3 TOTAL RETURN INDEX ETF* Statement of Investments as at 31 December 2011 (expressed in EUR)
* This is a synthetic ETF. The accompanying notes form an integral part of these financial statements.
Description QuantityCurrency
(local) Cost Market Value
% of Net
Assets_______________
Transferable securities and money market instruments admitted to an official stock exchange listing
Bonds
Austria Austria 4.125% 99 - 15.01.14 52,000,000 EUR 55,494,400 55,187,600 9.08 55,494,400 55,187,600 9.08 Belgium Belgium 3.75% 05 - 28.09.15 4,000,000 EUR 4,282,640 4,117,552 0.68 4,282,640 4,117,552 0.68 France France OAT 3.00% 05 - 25.10.15 31,000,000 EUR 32,053,849 32,506,182 5.34 France OAT 4.00% 03 - 25.04.13 41,000,000 EUR 43,023,000 42,936,307 7.06 France OAT 4.00% 04 - 25.04.14 3,000,000 EUR 3,222,300 3,199,272 0.53 France OAT 4.00% 04 - 25.10.14 37,500,000 EUR 40,106,335 40,298,711 6.63 France OAT 4.25% 07 - 25.10.17 1,000,000 EUR 1,122,860 1,103,843 0.18 French BTAN 2.50% 10 - 15.01.15 30,000,000 EUR 30,960,000 30,962,958 5.09 150,488,344 151,007,273 24.83 Germany Bundesrepublik Deutschland 2.25% 10 -
04.09.20 500,000 EUR 506,680 524,808 0.09 Bundesrepublik Deutschland 4.00% 05 -
04.01.37 2,000,000 EUR 2,328,120 2,575,046 0.42 Bundesrepublik Deutschland 4.25% 07 -
04.07.17 10,000,000 EUR 11,742,800 11,762,289 1.94 Bundesrepublik Deutschland 4.50% 03 -
04.01.13 4,850,000 EUR 5,217,507 5,068,934 0.83 Bundesrepublik Deutschland 5.00% 02 -
04.07.12 6,000,000 EUR 6,523,058 6,150,300 1.01 Bundesschatzanweisungen 1.00% 10 - 14.12.12 3,000,000 EUR 3,028,680 3,029,466 0.50 Bundesschatzanweisungen 1.50% 11 - 15.03.13 50,000,000 EUR 50,855,500 50,885,010 8.37 80,202,345 79,995,853 13.16 Italy Italy Buoni Ordinari del Tesoro BOT - 11 -
30.04.12 30,000,000 EUR 29,674,892 29,682,000 4.88 Italy Buoni Poliennali Del Tesoro 3.00% 11 -
01.04.14 30,000,000 EUR 28,645,200 28,648,380 4.71 Italy Buoni Poliennali Del Tesoro 3.00% 10 -
15.04.15 1,000,000 EUR 1,019,650 923,066 0.15 Italy Buoni Poliennali Del Tesoro 3.75% 09 -
15.12.13 50,000,000 EUR 48,822,000 48,920,980 8.05 Italy Buoni Poliennali Del Tesoro 3.75% 05 -
01.08.15 8,000,000 EUR 8,080,014 7,494,939 1.23 Italy Buoni Poliennali Del Tesoro 3.75% 06 -
01.08.16 40,000,000 EUR 36,325,600 36,596,784 6.02 152,567,356 152,266,149 25.04 Netherlands Netherlands 3.75% 04 - 15.07.14 10,000,000 EUR 10,801,100 10,793,659 1.77 Netherlands 5.50% 98 - 15.01.28 1,000,000 EUR 1,310,250 1,383,121 0.23 12,111,350 12,176,780 2.00 Spain Spain 2.50% 10 - 31.10.13 15,000,000 EUR 14,653,500 14,770,245 2.43
65
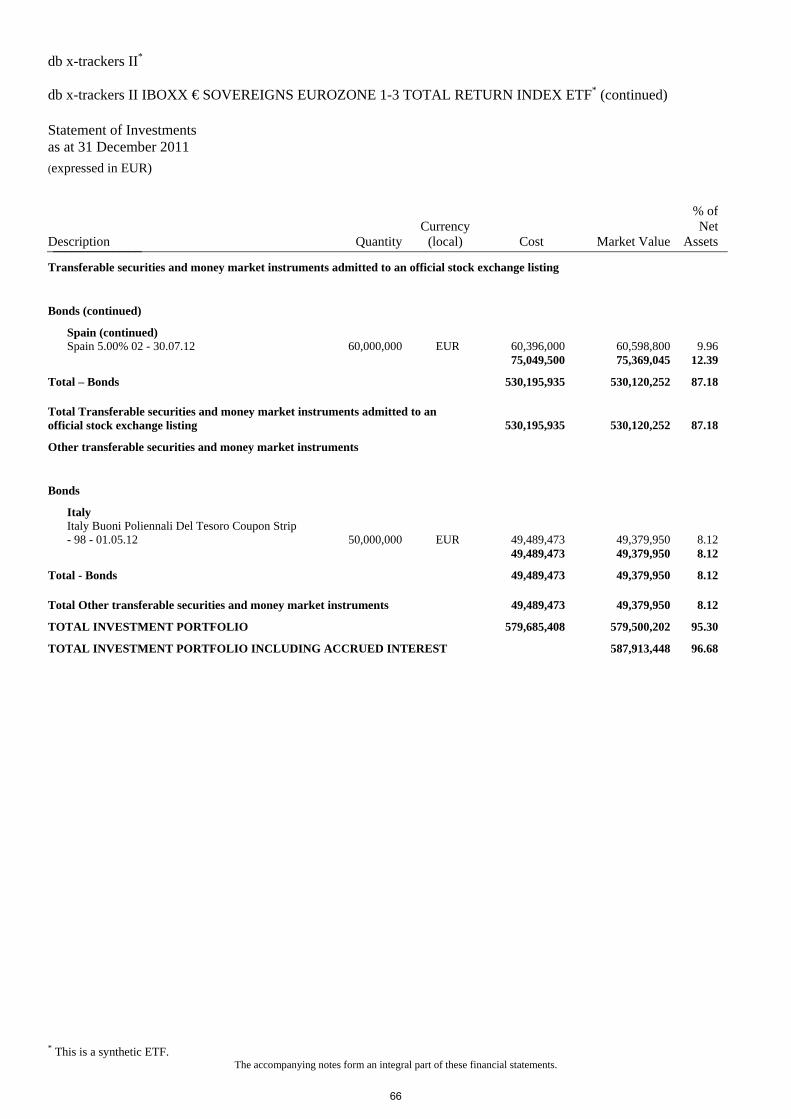
db x-trackers II* db x-trackers II IBOXX € SOVEREIGNS EUROZONE 1-3 TOTAL RETURN INDEX ETF* (continued) Statement of Investments as at 31 December 2011 (expressed in EUR)
* This is a synthetic ETF. The accompanying notes form an integral part of these financial statements.
Description QuantityCurrency
(local) Cost Market Value
% of Net
Assets_______________
Transferable securities and money market instruments admitted to an official stock exchange listing
Bonds (continued)
Spain (continued) Spain 5.00% 02 - 30.07.12 60,000,000 EUR 60,396,000 60,598,800 9.96 75,049,500 75,369,045 12.39
Total – Bonds 530,195,935 530,120,252 87.18
Total Transferable securities and money market instruments admitted to an official stock exchange listing 530,195,935 530,120,252 87.18
Other transferable securities and money market instruments
Bonds
Italy Italy Buoni Poliennali Del Tesoro Coupon Strip
- 98 - 01.05.12 50,000,000 EUR 49,489,473 49,379,950 8.12 49,489,473 49,379,950 8.12
Total - Bonds 49,489,473 49,379,950 8.12
Total Other transferable securities and money market instruments 49,489,473 49,379,950 8.12
TOTAL INVESTMENT PORTFOLIO 579,685,408 579,500,202 95.30
TOTAL INVESTMENT PORTFOLIO INCLUDING ACCRUED INTEREST 587,913,448 96.68
66
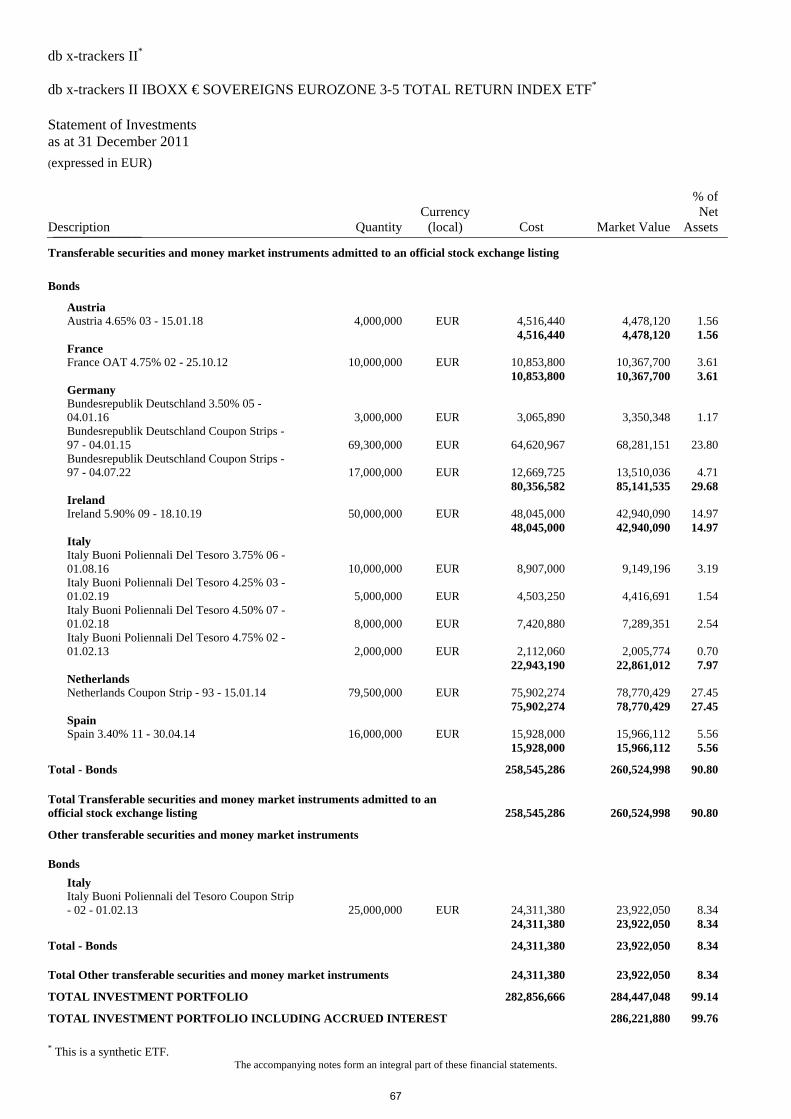
db x-trackers II* db x-trackers II IBOXX € SOVEREIGNS EUROZONE 3-5 TOTAL RETURN INDEX ETF* Statement of Investments as at 31 December 2011 (expressed in EUR)
* This is a synthetic ETF. The accompanying notes form an integral part of these financial statements.
Description QuantityCurrency
(local) Cost Market Value
% of Net
Assets_______________
Transferable securities and money market instruments admitted to an official stock exchange listing
Bonds
Austria Austria 4.65% 03 - 15.01.18 4,000,000 EUR 4,516,440 4,478,120 1.56 4,516,440 4,478,120 1.56 France France OAT 4.75% 02 - 25.10.12 10,000,000 EUR 10,853,800 10,367,700 3.61 10,853,800 10,367,700 3.61 Germany Bundesrepublik Deutschland 3.50% 05 -
04.01.16 3,000,000 EUR 3,065,890 3,350,348 1.17 Bundesrepublik Deutschland Coupon Strips -
97 - 04.01.15 69,300,000 EUR 64,620,967 68,281,151 23.80 Bundesrepublik Deutschland Coupon Strips -
97 - 04.07.22 17,000,000 EUR 12,669,725 13,510,036 4.71 80,356,582 85,141,535 29.68 Ireland Ireland 5.90% 09 - 18.10.19 50,000,000 EUR 48,045,000 42,940,090 14.97 48,045,000 42,940,090 14.97 Italy Italy Buoni Poliennali Del Tesoro 3.75% 06 -
01.08.16 10,000,000 EUR 8,907,000 9,149,196 3.19 Italy Buoni Poliennali Del Tesoro 4.25% 03 -
01.02.19 5,000,000 EUR 4,503,250 4,416,691 1.54 Italy Buoni Poliennali Del Tesoro 4.50% 07 -
01.02.18 8,000,000 EUR 7,420,880 7,289,351 2.54 Italy Buoni Poliennali Del Tesoro 4.75% 02 -
01.02.13 2,000,000 EUR 2,112,060 2,005,774 0.70 22,943,190 22,861,012 7.97 Netherlands Netherlands Coupon Strip - 93 - 15.01.14 79,500,000 EUR 75,902,274 78,770,429 27.45 75,902,274 78,770,429 27.45 Spain Spain 3.40% 11 - 30.04.14 16,000,000 EUR 15,928,000 15,966,112 5.56 15,928,000 15,966,112 5.56
Total - Bonds 258,545,286 260,524,998 90.80
Total Transferable securities and money market instruments admitted to an official stock exchange listing 258,545,286 260,524,998 90.80
Other transferable securities and money market instruments
Bonds Italy Italy Buoni Poliennali del Tesoro Coupon Strip
- 02 - 01.02.13 25,000,000 EUR 24,311,380 23,922,050 8.34 24,311,380 23,922,050 8.34
Total - Bonds 24,311,380 23,922,050 8.34
Total Other transferable securities and money market instruments 24,311,380 23,922,050 8.34
TOTAL INVESTMENT PORTFOLIO 282,856,666 284,447,048 99.14
TOTAL INVESTMENT PORTFOLIO INCLUDING ACCRUED INTEREST 286,221,880 99.76
67
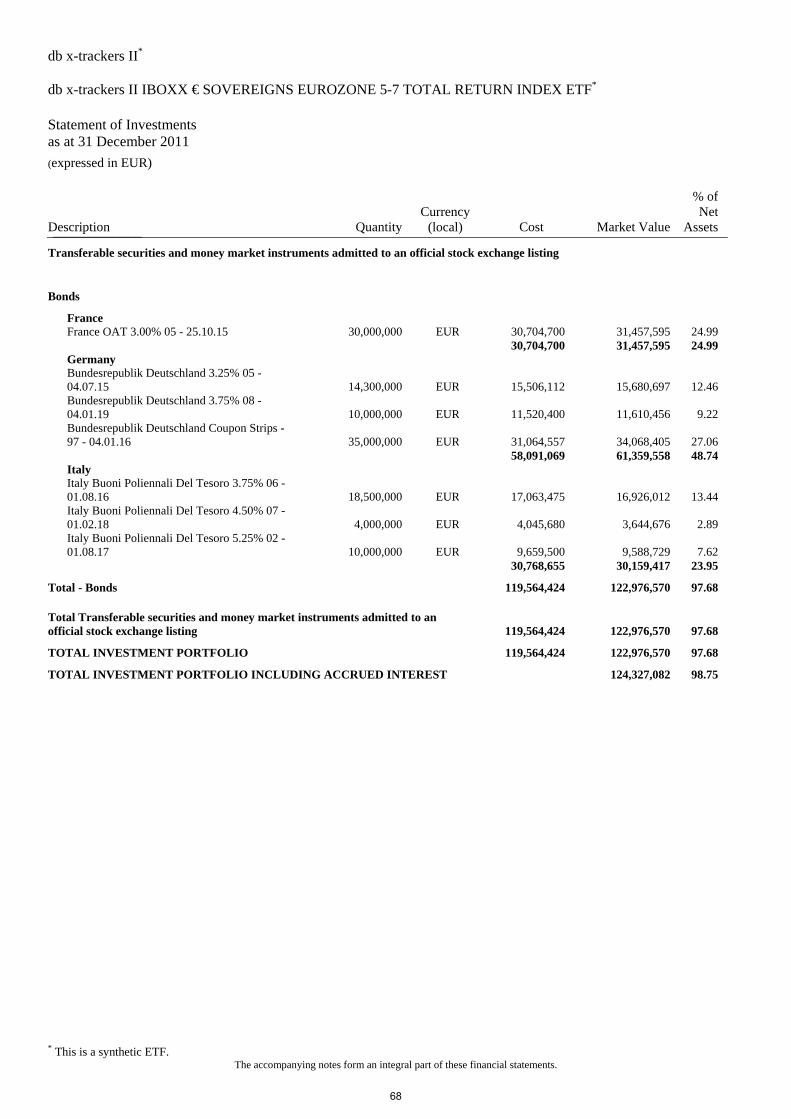
db x-trackers II* db x-trackers II IBOXX € SOVEREIGNS EUROZONE 5-7 TOTAL RETURN INDEX ETF* Statement of Investments as at 31 December 2011 (expressed in EUR)
* This is a synthetic ETF. The accompanying notes form an integral part of these financial statements.
Description QuantityCurrency
(local) Cost Market Value
% of Net
Assets_______________
Transferable securities and money market instruments admitted to an official stock exchange listing
Bonds
France France OAT 3.00% 05 - 25.10.15 30,000,000 EUR 30,704,700 31,457,595 24.99 30,704,700 31,457,595 24.99 Germany Bundesrepublik Deutschland 3.25% 05 -
04.07.15 14,300,000 EUR 15,506,112 15,680,697 12.46 Bundesrepublik Deutschland 3.75% 08 -
04.01.19 10,000,000 EUR 11,520,400 11,610,456 9.22 Bundesrepublik Deutschland Coupon Strips -
97 - 04.01.16 35,000,000 EUR 31,064,557 34,068,405 27.06 58,091,069 61,359,558 48.74 Italy Italy Buoni Poliennali Del Tesoro 3.75% 06 -
01.08.16 18,500,000 EUR 17,063,475 16,926,012 13.44 Italy Buoni Poliennali Del Tesoro 4.50% 07 -
01.02.18 4,000,000 EUR 4,045,680 3,644,676 2.89 Italy Buoni Poliennali Del Tesoro 5.25% 02 -
01.08.17 10,000,000 EUR 9,659,500 9,588,729 7.62 30,768,655 30,159,417 23.95
Total - Bonds 119,564,424 122,976,570 97.68
Total Transferable securities and money market instruments admitted to an official stock exchange listing 119,564,424 122,976,570 97.68
TOTAL INVESTMENT PORTFOLIO 119,564,424 122,976,570 97.68
TOTAL INVESTMENT PORTFOLIO INCLUDING ACCRUED INTEREST 124,327,082 98.75
68

db x-trackers II* db x-trackers II IBOXX € SOVEREIGNS EUROZONE 7-10 TOTAL RETURN INDEX ETF* Statement of Investments as at 31 December 2011 (expressed in EUR)
* This is a synthetic ETF. The accompanying notes form an integral part of these financial statements.
Description QuantityCurrency
(local) Cost Market Value
% of Net
Assets_______________
Transferable securities and money market instruments admitted to an official stock exchange listing
Bonds
Austria Austria 3.20% 10 - 20.02.17 10,000,000 EUR 10,379,000 10,465,097 12.74 Austria 3.65% 11 - 20.04.22 15,000,000 EUR 15,752,250 15,790,355 19.22 26,131,250 26,255,452 31.96 Belgium Belgium 4.00% 08 - 28.03.18 10,000,000 EUR 10,299,200 10,227,441 12.45 10,299,200 10,227,441 12.45 France France OAT 3.75% 05 - 25.04.21 12,000,000 EUR 12,657,600 12,584,156 15.32 France OAT 5.00% 01 - 25.10.16 3,000,000 EUR 3,516,120 3,412,380 4.15 16,173,720 15,996,536 19.47 Italy Italy Buoni Poliennali Del Tesoro 4.00% 07 -
01.02.17 5,000,000 EUR 5,220,700 4,564,859 5.56 Italy Buoni Poliennali Del Tesoro 4.25% 03 -
01.02.19 5,000,000 EUR 4,258,267 4,416,691 5.37 Italy Buoni Poliennali Del Tesoro 4.50% 07 -
01.02.18 1,000,000 EUR 1,070,110 911,169 1.11 10,549,077 9,892,719 12.04 Netherlands Netherlands 4.50% 07 - 15.07.17 14,330,000 EUR 16,610,476 16,542,935 20.13 16,610,476 16,542,935 20.13
Total - Bonds 79,763,723 78,915,083 96.05
Total Transferable securities and money market instruments admitted to an official stock exchange listing 79,763,723 78,915,083 96.05
TOTAL INVESTMENT PORTFOLIO 79,763,723 78,915,083 96.05
TOTAL INVESTMENT PORTFOLIO INCLUDING ACCRUED INTEREST 80,845,872 98.40
69
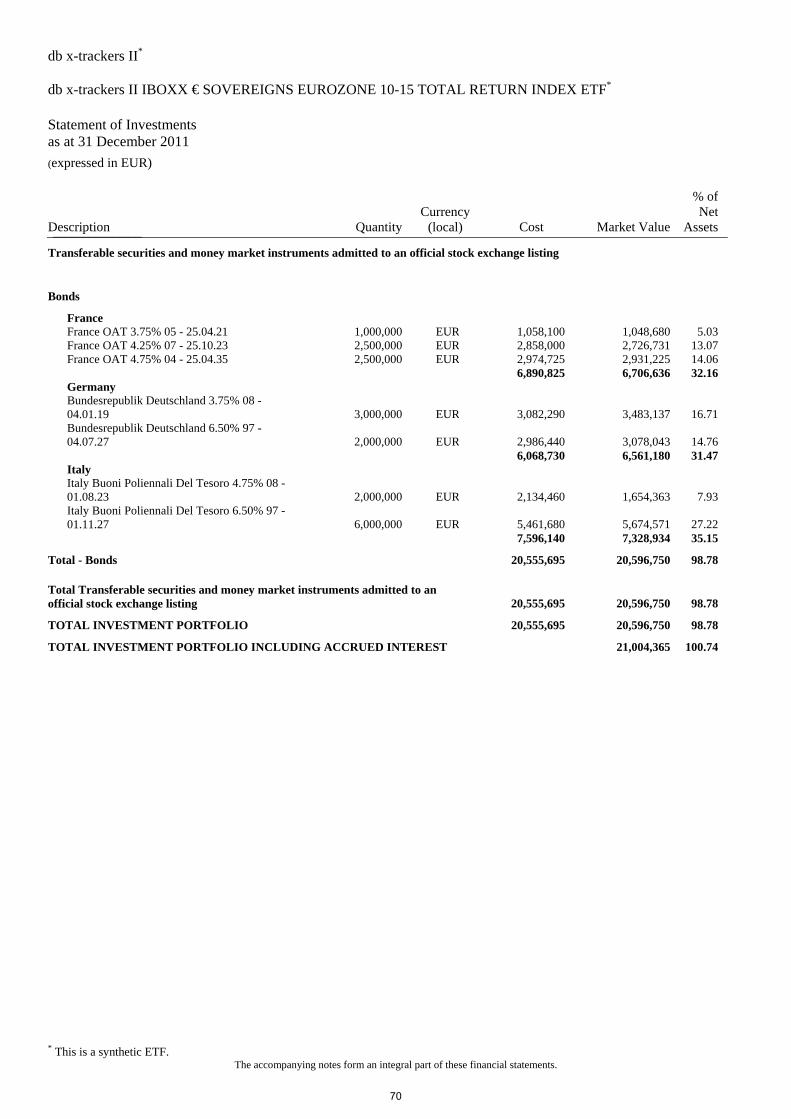
db x-trackers II* db x-trackers II IBOXX € SOVEREIGNS EUROZONE 10-15 TOTAL RETURN INDEX ETF* Statement of Investments as at 31 December 2011 (expressed in EUR)
* This is a synthetic ETF. The accompanying notes form an integral part of these financial statements.
Description QuantityCurrency
(local) Cost Market Value
% of Net
Assets_______________
Transferable securities and money market instruments admitted to an official stock exchange listing
Bonds
France France OAT 3.75% 05 - 25.04.21 1,000,000 EUR 1,058,100 1,048,680 5.03 France OAT 4.25% 07 - 25.10.23 2,500,000 EUR 2,858,000 2,726,731 13.07 France OAT 4.75% 04 - 25.04.35 2,500,000 EUR 2,974,725 2,931,225 14.06 6,890,825 6,706,636 32.16 Germany Bundesrepublik Deutschland 3.75% 08 -
04.01.19 3,000,000 EUR 3,082,290 3,483,137 16.71 Bundesrepublik Deutschland 6.50% 97 -
04.07.27 2,000,000 EUR 2,986,440 3,078,043 14.76 6,068,730 6,561,180 31.47 Italy Italy Buoni Poliennali Del Tesoro 4.75% 08 -
01.08.23 2,000,000 EUR 2,134,460 1,654,363 7.93 Italy Buoni Poliennali Del Tesoro 6.50% 97 -
01.11.27 6,000,000 EUR 5,461,680 5,674,571 27.22 7,596,140 7,328,934 35.15
Total - Bonds 20,555,695 20,596,750 98.78
Total Transferable securities and money market instruments admitted to an official stock exchange listing 20,555,695 20,596,750 98.78
TOTAL INVESTMENT PORTFOLIO 20,555,695 20,596,750 98.78
TOTAL INVESTMENT PORTFOLIO INCLUDING ACCRUED INTEREST 21,004,365 100.74
70
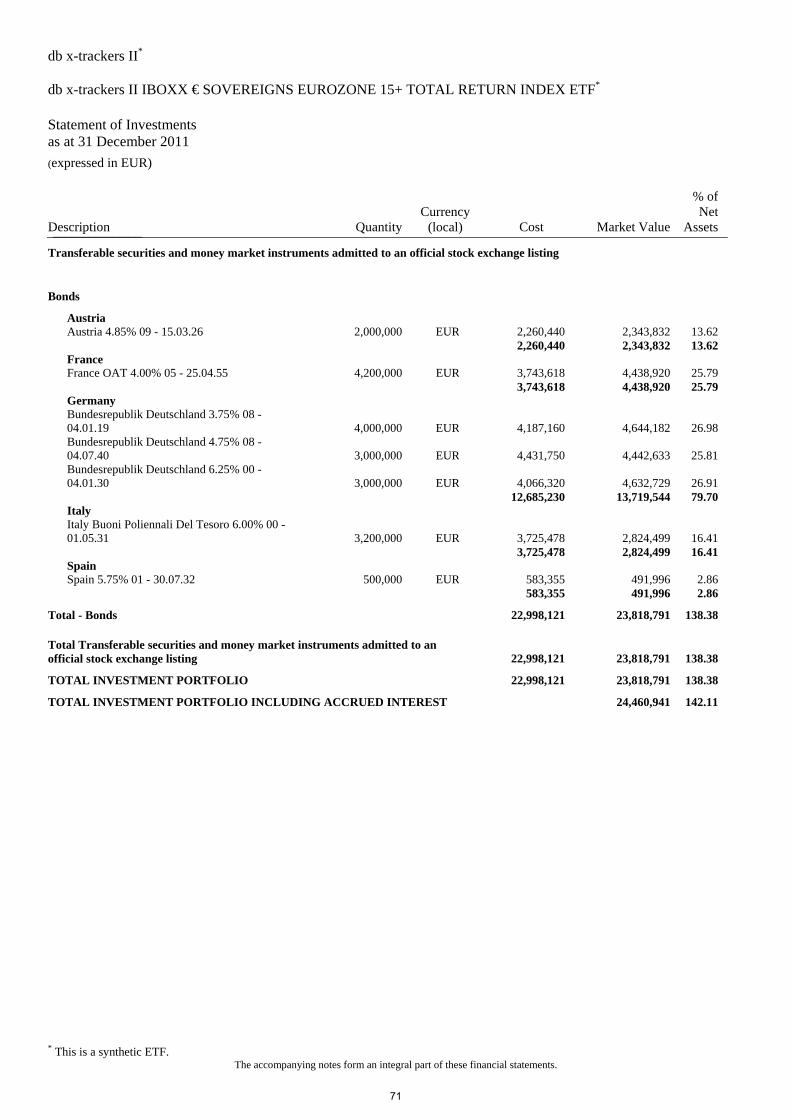
db x-trackers II* db x-trackers II IBOXX € SOVEREIGNS EUROZONE 15+ TOTAL RETURN INDEX ETF*
Statement of Investments as at 31 December 2011 (expressed in EUR)
* This is a synthetic ETF. The accompanying notes form an integral part of these financial statements.
Description QuantityCurrency
(local) Cost Market Value
% of Net
Assets_______________
Transferable securities and money market instruments admitted to an official stock exchange listing
Bonds
Austria Austria 4.85% 09 - 15.03.26 2,000,000 EUR 2,260,440 2,343,832 13.62 2,260,440 2,343,832 13.62 France France OAT 4.00% 05 - 25.04.55 4,200,000 EUR 3,743,618 4,438,920 25.79 3,743,618 4,438,920 25.79 Germany Bundesrepublik Deutschland 3.75% 08 -
04.01.19 4,000,000 EUR 4,187,160 4,644,182 26.98 Bundesrepublik Deutschland 4.75% 08 -
04.07.40 3,000,000 EUR 4,431,750 4,442,633 25.81 Bundesrepublik Deutschland 6.25% 00 -
04.01.30 3,000,000 EUR 4,066,320 4,632,729 26.91 12,685,230 13,719,544 79.70 Italy Italy Buoni Poliennali Del Tesoro 6.00% 00 -
01.05.31 3,200,000 EUR 3,725,478 2,824,499 16.41 3,725,478 2,824,499 16.41 Spain Spain 5.75% 01 - 30.07.32 500,000 EUR 583,355 491,996 2.86 583,355 491,996 2.86
Total - Bonds 22,998,121 23,818,791 138.38
Total Transferable securities and money market instruments admitted to an official stock exchange listing 22,998,121 23,818,791 138.38
TOTAL INVESTMENT PORTFOLIO 22,998,121 23,818,791 138.38
TOTAL INVESTMENT PORTFOLIO INCLUDING ACCRUED INTEREST 24,460,941 142.11
71
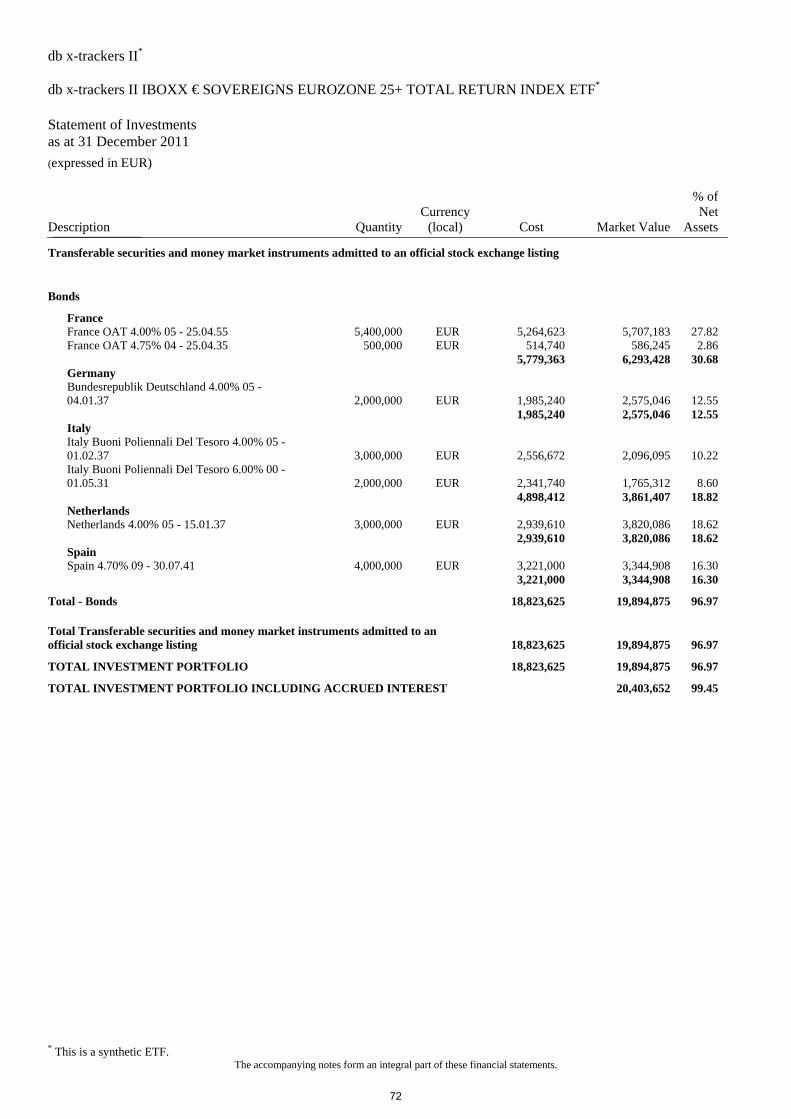
db x-trackers II* db x-trackers II IBOXX € SOVEREIGNS EUROZONE 25+ TOTAL RETURN INDEX ETF* Statement of Investments as at 31 December 2011 (expressed in EUR)
* This is a synthetic ETF. The accompanying notes form an integral part of these financial statements.
Description QuantityCurrency
(local) Cost Market Value
% of Net
Assets_______________
Transferable securities and money market instruments admitted to an official stock exchange listing
Bonds
France France OAT 4.00% 05 - 25.04.55 5,400,000 EUR 5,264,623 5,707,183 27.82 France OAT 4.75% 04 - 25.04.35 500,000 EUR 514,740 586,245 2.86 5,779,363 6,293,428 30.68 Germany Bundesrepublik Deutschland 4.00% 05 -
04.01.37 2,000,000 EUR 1,985,240 2,575,046 12.55 1,985,240 2,575,046 12.55 Italy Italy Buoni Poliennali Del Tesoro 4.00% 05 -
01.02.37 3,000,000 EUR 2,556,672 2,096,095 10.22 Italy Buoni Poliennali Del Tesoro 6.00% 00 -
01.05.31 2,000,000 EUR 2,341,740 1,765,312 8.60 4,898,412 3,861,407 18.82 Netherlands Netherlands 4.00% 05 - 15.01.37 3,000,000 EUR 2,939,610 3,820,086 18.62 2,939,610 3,820,086 18.62 Spain Spain 4.70% 09 - 30.07.41 4,000,000 EUR 3,221,000 3,344,908 16.30 3,221,000 3,344,908 16.30
Total - Bonds 18,823,625 19,894,875 96.97
Total Transferable securities and money market instruments admitted to an official stock exchange listing 18,823,625 19,894,875 96.97
TOTAL INVESTMENT PORTFOLIO 18,823,625 19,894,875 96.97
TOTAL INVESTMENT PORTFOLIO INCLUDING ACCRUED INTEREST 20,403,652 99.45
72
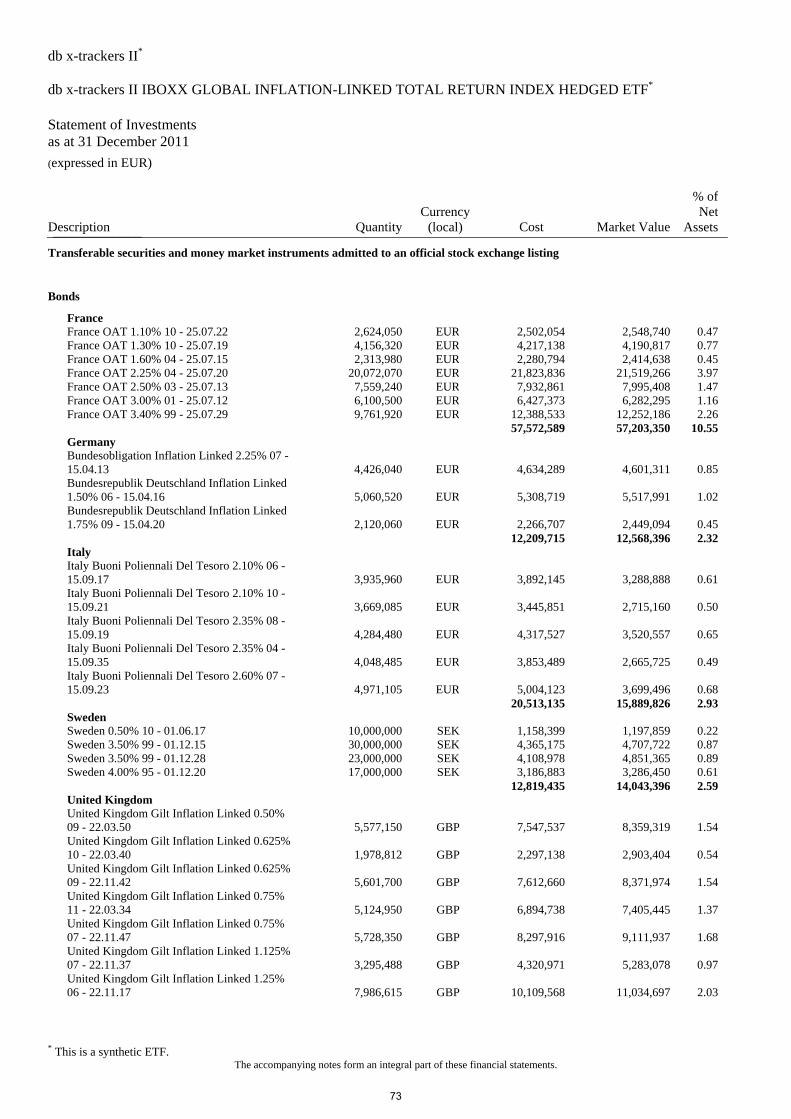
db x-trackers II*
*db x-trackers II IBOXX GLOBAL INFLATION-LINKED TOTAL RETURN INDEX HEDGED ETF Statement of Investments as at 31 December 2011 (expressed in EUR)
Description QuantityCurrency
(local) Cost Market Value
% of Net
Assets_______________
Transferable securities and money market instruments admitted to an official stock exchange listing
Bonds
France France OAT 1.10% 10 - 25.07.22 2,624,050 EUR 2,502,054 2,548,740 0.47 France OAT 1.30% 10 - 25.07.19 4,156,320 EUR 4,217,138 4,190,817 0.77 France OAT 1.60% 04 - 25.07.15 2,313,980 EUR 2,280,794 2,414,638 0.45 France OAT 2.25% 04 - 25.07.20 20,072,070 EUR 21,823,836 21,519,266 3.97 France OAT 2.50% 03 - 25.07.13 7,559,240 EUR 7,932,861 7,995,408 1.47 France OAT 3.00% 01 - 25.07.12 6,100,500 EUR 6,427,373 6,282,295 1.16 France OAT 3.40% 99 - 25.07.29 9,761,920 EUR 12,388,533 12,252,186 2.26 57,572,589 57,203,350 10.55 Germany Bundesobligation Inflation Linked 2.25% 07 -
15.04.13 4,426,040 EUR 4,634,289 4,601,311 0.85 Bundesrepublik Deutschland Inflation Linked
1.50% 06 - 15.04.16 5,060,520 EUR 5,308,719 5,517,991 1.02 Bundesrepublik Deutschland Inflation Linked
1.75% 09 - 15.04.20 2,120,060 EUR 2,266,707 2,449,094 0.45 12,209,715 12,568,396 2.32 Italy Italy Buoni Poliennali Del Tesoro 2.10% 06 -
15.09.17 3,935,960 EUR 3,892,145 3,288,888 0.61 Italy Buoni Poliennali Del Tesoro 2.10% 10 -
15.09.21 3,669,085 EUR 3,445,851 2,715,160 0.50 Italy Buoni Poliennali Del Tesoro 2.35% 08 -
15.09.19 4,284,480 EUR 4,317,527 3,520,557 0.65 Italy Buoni Poliennali Del Tesoro 2.35% 04 -
15.09.35 4,048,485 EUR 3,853,489 2,665,725 0.49 Italy Buoni Poliennali Del Tesoro 2.60% 07 -
15.09.23 4,971,105 EUR 5,004,123 3,699,496 0.68 20,513,135 15,889,826 2.93 Sweden Sweden 0.50% 10 - 01.06.17 10,000,000 SEK 1,158,399 1,197,859 0.22 Sweden 3.50% 99 - 01.12.15 30,000,000 SEK 4,365,175 4,707,722 0.87 Sweden 3.50% 99 - 01.12.28 23,000,000 SEK 4,108,978 4,851,365 0.89 Sweden 4.00% 95 - 01.12.20 17,000,000 SEK 3,186,883 3,286,450 0.61 12,819,435 14,043,396 2.59 United Kingdom United Kingdom Gilt Inflation Linked 0.50%
09 - 22.03.50 5,577,150 GBP 7,547,537 8,359,319 1.54 United Kingdom Gilt Inflation Linked 0.625%
10 - 22.03.40 1,978,812 GBP 2,297,138 2,903,404 0.54 United Kingdom Gilt Inflation Linked 0.625%
09 - 22.11.42 5,601,700 GBP 7,612,660 8,371,974 1.54 United Kingdom Gilt Inflation Linked 0.75%
11 - 22.03.34 5,124,950 GBP 6,894,738 7,405,445 1.37 United Kingdom Gilt Inflation Linked 0.75%
07 - 22.11.47 5,728,350 GBP 8,297,916 9,111,937 1.68 United Kingdom Gilt Inflation Linked 1.125%
07 - 22.11.37 3,295,488 GBP 4,320,971 5,283,078 0.97 United Kingdom Gilt Inflation Linked 1.25%
06 - 22.11.17 7,986,615 GBP 10,109,568 11,034,697 2.03
* This is a synthetic ETF. The accompanying notes form an integral part of these financial statements.
73
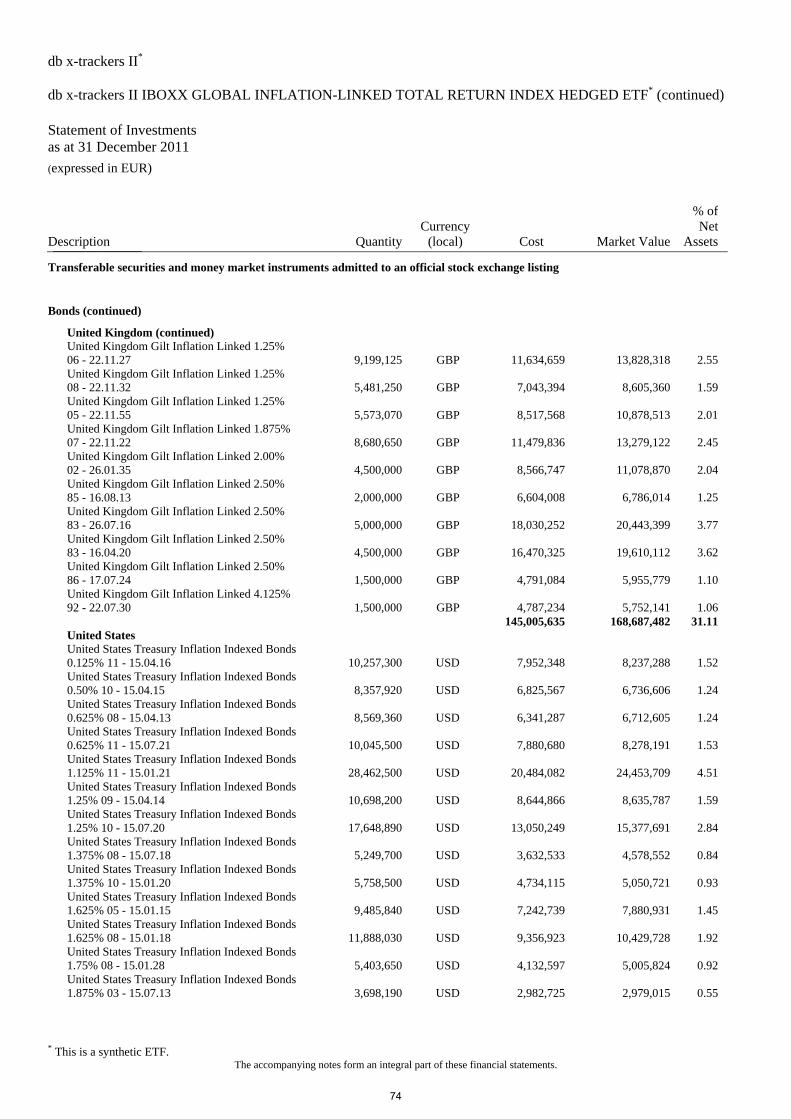
db x-trackers II* db x-trackers II IBOXX GLOBAL INFLATION-LINKED TOTAL RETURN INDEX HEDGED ETF* (continued) Statement of Investments as at 31 December 2011 (expressed in EUR)
Description QuantityCurrency
(local) Cost Market Value
% ofNet
Assets_______________
Transferable securities and money market instruments admitted to an official stock exchange listing
Bonds (continued)
United Kingdom (continued) United Kingdom Gilt Inflation Linked 1.25%
06 - 22.11.27 9,199,125 GBP 11,634,659 13,828,318 2.55 United Kingdom Gilt Inflation Linked 1.25%
08 - 22.11.32 5,481,250 GBP 7,043,394 8,605,360 1.59 United Kingdom Gilt Inflation Linked 1.25%
05 - 22.11.55 5,573,070 GBP 8,517,568 10,878,513 2.01 United Kingdom Gilt Inflation Linked 1.875%
07 - 22.11.22 8,680,650 GBP 11,479,836 13,279,122 2.45 United Kingdom Gilt Inflation Linked 2.00%
02 - 26.01.35 4,500,000 GBP 8,566,747 11,078,870 2.04 United Kingdom Gilt Inflation Linked 2.50%
85 - 16.08.13 2,000,000 GBP 6,604,008 6,786,014 1.25 United Kingdom Gilt Inflation Linked 2.50%
83 - 26.07.16 5,000,000 GBP 18,030,252 20,443,399 3.77 United Kingdom Gilt Inflation Linked 2.50%
83 - 16.04.20 4,500,000 GBP 16,470,325 19,610,112 3.62 United Kingdom Gilt Inflation Linked 2.50%
86 - 17.07.24 1,500,000 GBP 4,791,084 5,955,779 1.10 United Kingdom Gilt Inflation Linked 4.125%
92 - 22.07.30 1,500,000 GBP 4,787,234 5,752,141 1.06 145,005,635 168,687,482 31.11 United States United States Treasury Inflation Indexed Bonds
0.125% 11 - 15.04.16 10,257,300 USD 7,952,348 8,237,288 1.52 United States Treasury Inflation Indexed Bonds
0.50% 10 - 15.04.15 8,357,920 USD 6,825,567 6,736,606 1.24 United States Treasury Inflation Indexed Bonds
0.625% 08 - 15.04.13 8,569,360 USD 6,341,287 6,712,605 1.24 United States Treasury Inflation Indexed Bonds
0.625% 11 - 15.07.21 10,045,500 USD 7,880,680 8,278,191 1.53 United States Treasury Inflation Indexed Bonds
1.125% 11 - 15.01.21 28,462,500 USD 20,484,082 24,453,709 4.51 United States Treasury Inflation Indexed Bonds
1.25% 09 - 15.04.14 10,698,200 USD 8,644,866 8,635,787 1.59 United States Treasury Inflation Indexed Bonds
1.25% 10 - 15.07.20 17,648,890 USD 13,050,249 15,377,691 2.84 United States Treasury Inflation Indexed Bonds
1.375% 08 - 15.07.18 5,249,700 USD 3,632,533 4,578,552 0.84 United States Treasury Inflation Indexed Bonds
1.375% 10 - 15.01.20 5,758,500 USD 4,734,115 5,050,721 0.93 United States Treasury Inflation Indexed Bonds
1.625% 05 - 15.01.15 9,485,840 USD 7,242,739 7,880,931 1.45 United States Treasury Inflation Indexed Bonds
1.625% 08 - 15.01.18 11,888,030 USD 9,356,923 10,429,728 1.92 United States Treasury Inflation Indexed Bonds
1.75% 08 - 15.01.28 5,403,650 USD 4,132,597 5,005,824 0.92 United States Treasury Inflation Indexed Bonds
1.875% 03 - 15.07.13 3,698,190 USD 2,982,725 2,979,015 0.55
* This is a synthetic ETF. The accompanying notes form an integral part of these financial statements.
74
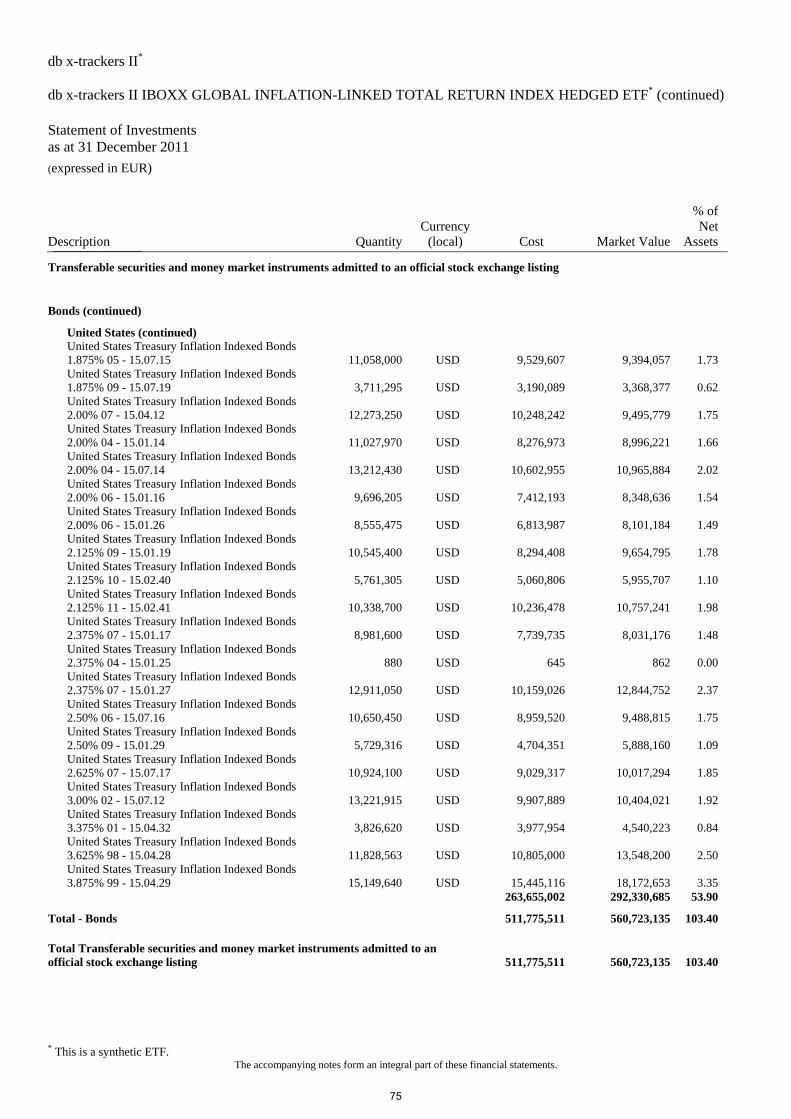
db x-trackers II* db x-trackers II IBOXX GLOBAL INFLATION-LINKED TOTAL RETURN INDEX HEDGED ETF* (continued) Statement of Investments as at 31 December 2011 (expressed in EUR)
Description QuantityCurrency
(local) Cost Market Value
% of Net
Assets_______________
Transferable securities and money market instruments admitted to an official stock exchange listing
Bonds (continued)
United States (continued) United States Treasury Inflation Indexed Bonds
1.875% 05 - 15.07.15 11,058,000 USD 9,529,607 9,394,057 1.73 United States Treasury Inflation Indexed Bonds
1.875% 09 - 15.07.19 3,711,295 USD 3,190,089 3,368,377 0.62 United States Treasury Inflation Indexed Bonds
2.00% 07 - 15.04.12 12,273,250 USD 10,248,242 9,495,779 1.75 United States Treasury Inflation Indexed Bonds
2.00% 04 - 15.01.14 11,027,970 USD 8,276,973 8,996,221 1.66 United States Treasury Inflation Indexed Bonds
2.00% 04 - 15.07.14 13,212,430 USD 10,602,955 10,965,884 2.02 United States Treasury Inflation Indexed Bonds
2.00% 06 - 15.01.16 9,696,205 USD 7,412,193 8,348,636 1.54 United States Treasury Inflation Indexed Bonds
2.00% 06 - 15.01.26 8,555,475 USD 6,813,987 8,101,184 1.49 United States Treasury Inflation Indexed Bonds
2.125% 09 - 15.01.19 10,545,400 USD 8,294,408 9,654,795 1.78 United States Treasury Inflation Indexed Bonds
2.125% 10 - 15.02.40 5,761,305 USD 5,060,806 5,955,707 1.10 United States Treasury Inflation Indexed Bonds
2.125% 11 - 15.02.41 10,338,700 USD 10,236,478 10,757,241 1.98 United States Treasury Inflation Indexed Bonds
2.375% 07 - 15.01.17 8,981,600 USD 7,739,735 8,031,176 1.48 United States Treasury Inflation Indexed Bonds
2.375% 04 - 15.01.25 880 USD 645 862 0.00 United States Treasury Inflation Indexed Bonds
2.375% 07 - 15.01.27 12,911,050 USD 10,159,026 12,844,752 2.37 United States Treasury Inflation Indexed Bonds
2.50% 06 - 15.07.16 10,650,450 USD 8,959,520 9,488,815 1.75 United States Treasury Inflation Indexed Bonds
2.50% 09 - 15.01.29 5,729,316 USD 4,704,351 5,888,160 1.09 United States Treasury Inflation Indexed Bonds
2.625% 07 - 15.07.17 10,924,100 USD 9,029,317 10,017,294 1.85 United States Treasury Inflation Indexed Bonds
3.00% 02 - 15.07.12 13,221,915 USD 9,907,889 10,404,021 1.92 United States Treasury Inflation Indexed Bonds
3.375% 01 - 15.04.32 3,826,620 USD 3,977,954 4,540,223 0.84 United States Treasury Inflation Indexed Bonds
3.625% 98 - 15.04.28 11,828,563 USD 10,805,000 13,548,200 2.50 United States Treasury Inflation Indexed Bonds
3.875% 99 - 15.04.29 15,149,640 USD 15,445,116 18,172,653 3.35 263,655,002 292,330,685 53.90
Total - Bonds 511,775,511 560,723,135 103.40
Total Transferable securities and money market instruments admitted to an official stock exchange listing 511,775,511 560,723,135 103.40
* This is a synthetic ETF. The accompanying notes form an integral part of these financial statements.
75
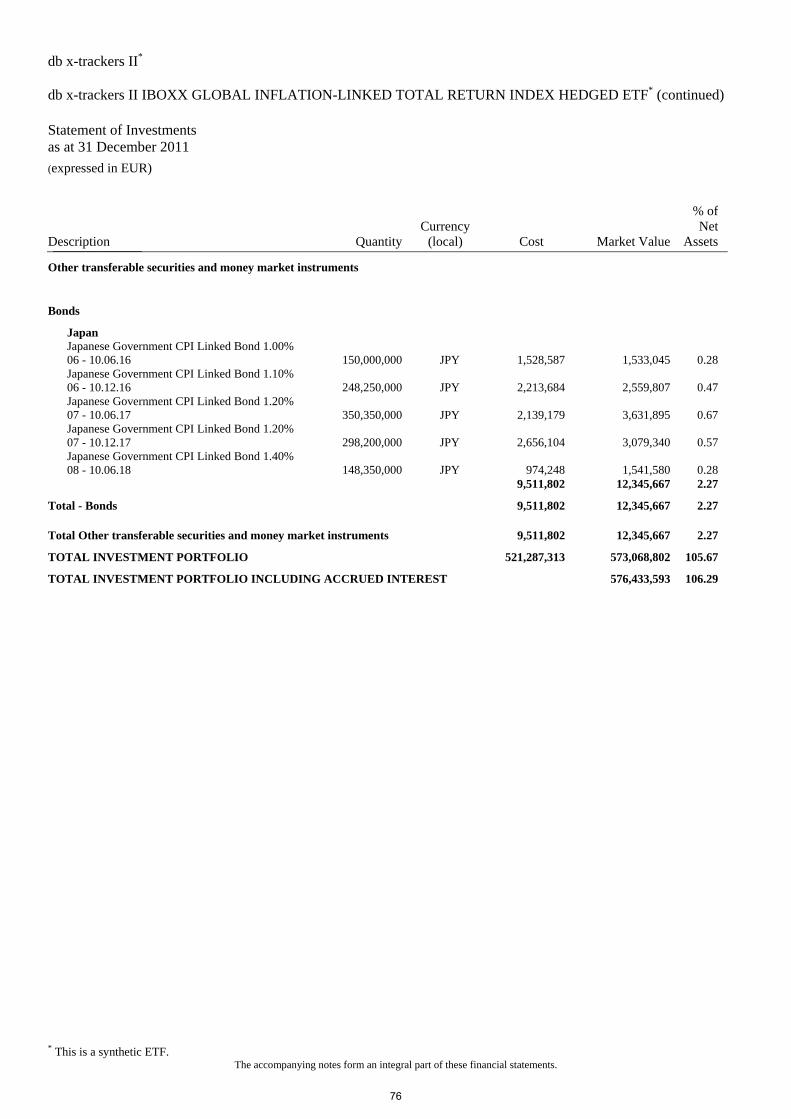
db x-trackers II*
db x-trackers II IBOXX GLOBAL INFLATION-LINKED TOTAL RETURN INDEX HEDGED ETF* (continued) Statement of Investments as at 31 December 2011 (expressed in EUR)
* This is a synthetic ETF. The accompanying notes form an integral part of these financial statements.
Description QuantityCurrency
(local) Cost Market Value
% of Net
Assets_______________
Other transferable securities and money market instruments
Bonds
Japan Japanese Government CPI Linked Bond 1.00%
06 - 10.06.16 150,000,000 JPY 1,528,587 1,533,045 0.28 Japanese Government CPI Linked Bond 1.10%
06 - 10.12.16 248,250,000 JPY 2,213,684 2,559,807 0.47 Japanese Government CPI Linked Bond 1.20%
07 - 10.06.17 350,350,000 JPY 2,139,179 3,631,895 0.67 Japanese Government CPI Linked Bond 1.20%
07 - 10.12.17 298,200,000 JPY 2,656,104 3,079,340 0.57 Japanese Government CPI Linked Bond 1.40%
08 - 10.06.18 148,350,000 JPY 974,248 1,541,580 0.28 9,511,802 12,345,667 2.27
Total - Bonds 9,511,802 12,345,667 2.27
Total Other transferable securities and money market instruments 9,511,802 12,345,667 2.27
TOTAL INVESTMENT PORTFOLIO 521,287,313 573,068,802 105.67
TOTAL INVESTMENT PORTFOLIO INCLUDING ACCRUED INTEREST 576,433,593 106.29
76
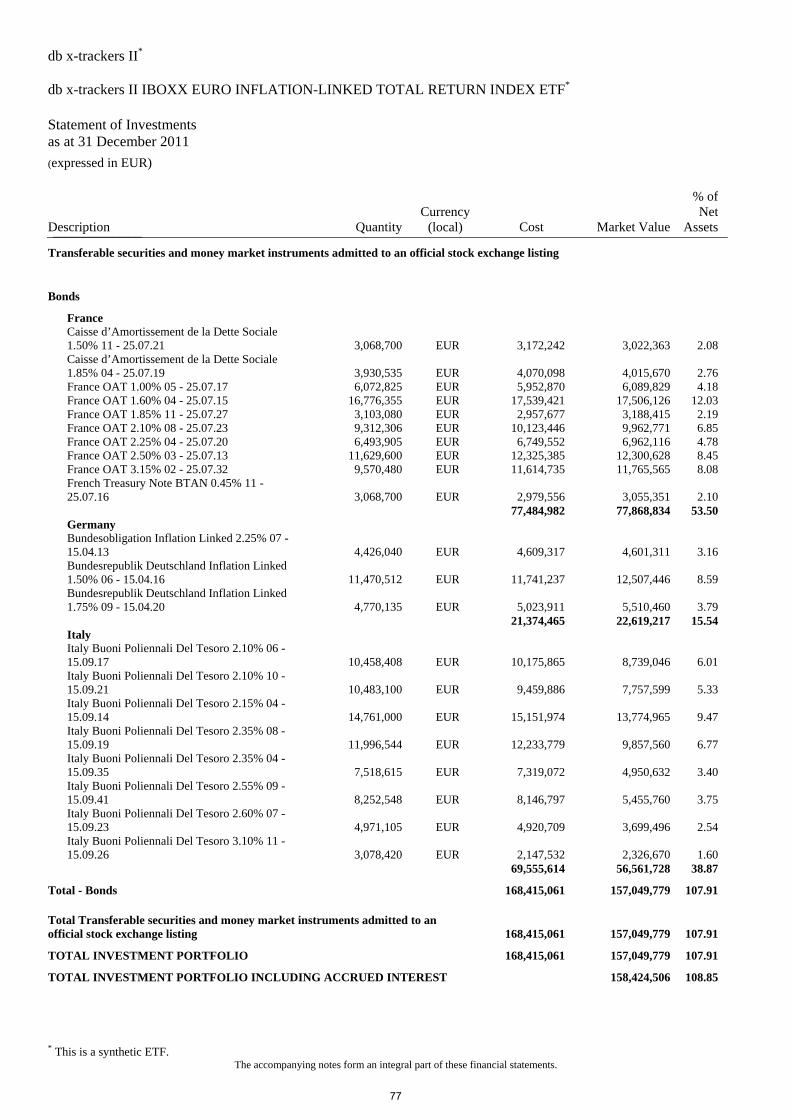
db x-trackers II*
*db x-trackers II IBOXX EURO INFLATION-LINKED TOTAL RETURN INDEX ETF Statement of Investments as at 31 December 2011 (expressed in EUR)
Description QuantityCurrency
(local) Cost Market Value
% of Net
Assets_______________
Transferable securities and money market instruments admitted to an official stock exchange listing
Bonds
France Caisse d’Amortissement de la Dette Sociale
1.50% 11 - 25.07.21 3,068,700 EUR 3,172,242 3,022,363 2.08 Caisse d’Amortissement de la Dette Sociale
1.85% 04 - 25.07.19 3,930,535 EUR 4,070,098 4,015,670 2.76 France OAT 1.00% 05 - 25.07.17 6,072,825 EUR 5,952,870 6,089,829 4.18 France OAT 1.60% 04 - 25.07.15 16,776,355 EUR 17,539,421 17,506,126 12.03 France OAT 1.85% 11 - 25.07.27 3,103,080 EUR 2,957,677 3,188,415 2.19 France OAT 2.10% 08 - 25.07.23 9,312,306 EUR 10,123,446 9,962,771 6.85 France OAT 2.25% 04 - 25.07.20 6,493,905 EUR 6,749,552 6,962,116 4.78 France OAT 2.50% 03 - 25.07.13 11,629,600 EUR 12,325,385 12,300,628 8.45 France OAT 3.15% 02 - 25.07.32 9,570,480 EUR 11,614,735 11,765,565 8.08 French Treasury Note BTAN 0.45% 11 -
25.07.16 3,068,700 EUR 2,979,556 3,055,351 2.10 77,484,982 77,868,834 53.50 Germany Bundesobligation Inflation Linked 2.25% 07 -
15.04.13 4,426,040 EUR 4,609,317 4,601,311 3.16 Bundesrepublik Deutschland Inflation Linked
1.50% 06 - 15.04.16 11,470,512 EUR 11,741,237 12,507,446 8.59 Bundesrepublik Deutschland Inflation Linked
1.75% 09 - 15.04.20 4,770,135 EUR 5,023,911 5,510,460 3.79 21,374,465 22,619,217 15.54 Italy Italy Buoni Poliennali Del Tesoro 2.10% 06 -
15.09.17 10,458,408 EUR 10,175,865 8,739,046 6.01 Italy Buoni Poliennali Del Tesoro 2.10% 10 -
15.09.21 10,483,100 EUR 9,459,886 7,757,599 5.33 Italy Buoni Poliennali Del Tesoro 2.15% 04 -
15.09.14 14,761,000 EUR 15,151,974 13,774,965 9.47 Italy Buoni Poliennali Del Tesoro 2.35% 08 -
15.09.19 11,996,544 EUR 12,233,779 9,857,560 6.77 Italy Buoni Poliennali Del Tesoro 2.35% 04 -
15.09.35 7,518,615 EUR 7,319,072 4,950,632 3.40 Italy Buoni Poliennali Del Tesoro 2.55% 09 -
15.09.41 8,252,548 EUR 8,146,797 5,455,760 3.75 Italy Buoni Poliennali Del Tesoro 2.60% 07 -
15.09.23 4,971,105 EUR 4,920,709 3,699,496 2.54 Italy Buoni Poliennali Del Tesoro 3.10% 11 -
15.09.26 3,078,420 EUR 2,147,532 2,326,670 1.60 69,555,614 56,561,728 38.87
Total - Bonds 168,415,061 157,049,779 107.91
Total Transferable securities and money market instruments admitted to an official stock exchange listing 168,415,061 157,049,779 107.91
TOTAL INVESTMENT PORTFOLIO 168,415,061 157,049,779 107.91
TOTAL INVESTMENT PORTFOLIO INCLUDING ACCRUED INTEREST 158,424,506 108.85
* This is a synthetic ETF. The accompanying notes form an integral part of these financial statements.
77
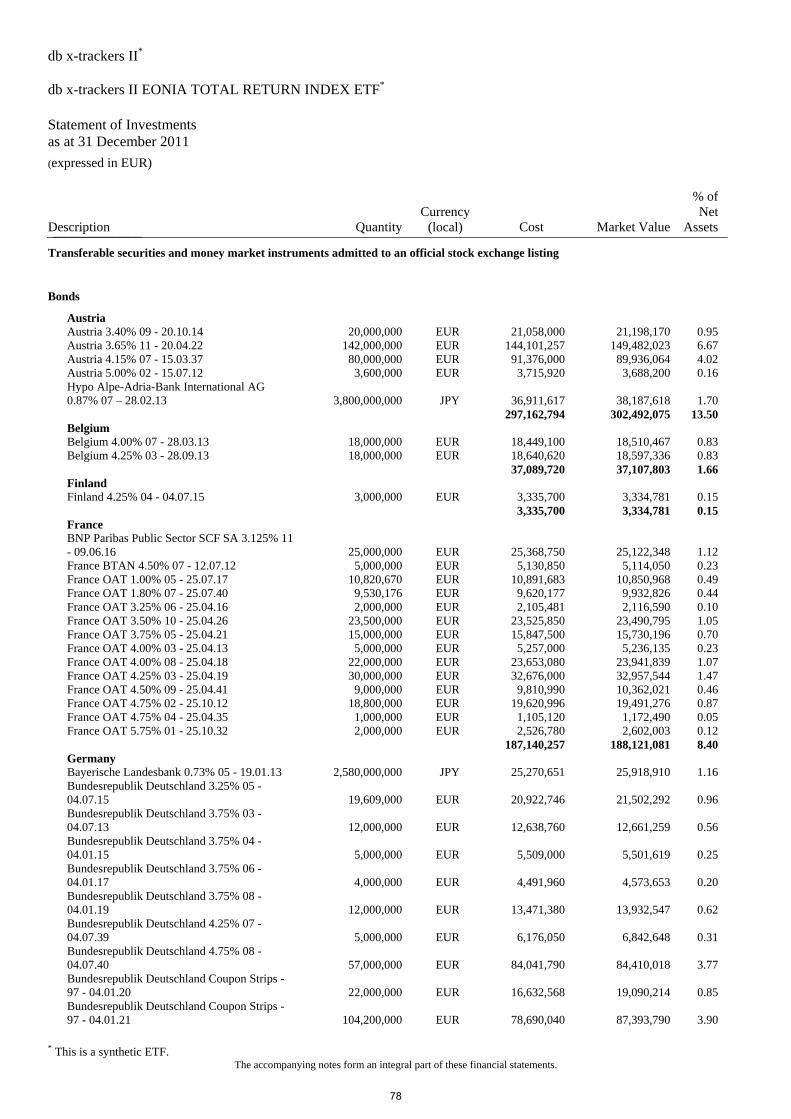
db x-trackers II*
*db x-trackers II EONIA TOTAL RETURN INDEX ETF Statement of Investments as at 31 December 2011 (expressed in EUR)
Description QuantityCurrency
(local) Cost Market Value
% of Net
Assets_______________
Transferable securities and money market instruments admitted to an official stock exchange listing
Bonds
Austria Austria 3.40% 09 - 20.10.14 20,000,000 EUR 21,058,000 21,198,170 0.95 Austria 3.65% 11 - 20.04.22 142,000,000 EUR 144,101,257 149,482,023 6.67 Austria 4.15% 07 - 15.03.37 80,000,000 EUR 91,376,000 89,936,064 4.02 Austria 5.00% 02 - 15.07.12 3,600,000 EUR 3,715,920 3,688,200 0.16 Hypo Alpe-Adria-Bank International AG
0.87% 07 – 28.02.13 3,800,000,000 JPY 36,911,617 38,187,618 1.70 297,162,794 302,492,075 13.50 Belgium Belgium 4.00% 07 - 28.03.13 18,000,000 EUR 18,449,100 18,510,467 0.83 Belgium 4.25% 03 - 28.09.13 18,000,000 EUR 18,640,620 18,597,336 0.83 37,089,720 37,107,803 1.66 Finland Finland 4.25% 04 - 04.07.15 3,000,000 EUR 3,335,700 3,334,781 0.15 3,335,700 3,334,781 0.15 France BNP Paribas Public Sector SCF SA 3.125% 11
- 09.06.16 25,000,000 EUR 25,368,750 25,122,348 1.12 France BTAN 4.50% 07 - 12.07.12 5,000,000 EUR 5,130,850 5,114,050 0.23 France OAT 1.00% 05 - 25.07.17 10,820,670 EUR 10,891,683 10,850,968 0.49 France OAT 1.80% 07 - 25.07.40 9,530,176 EUR 9,620,177 9,932,826 0.44 France OAT 3.25% 06 - 25.04.16 2,000,000 EUR 2,105,481 2,116,590 0.10 France OAT 3.50% 10 - 25.04.26 23,500,000 EUR 23,525,850 23,490,795 1.05 France OAT 3.75% 05 - 25.04.21 15,000,000 EUR 15,847,500 15,730,196 0.70 France OAT 4.00% 03 - 25.04.13 5,000,000 EUR 5,257,000 5,236,135 0.23 France OAT 4.00% 08 - 25.04.18 22,000,000 EUR 23,653,080 23,941,839 1.07 France OAT 4.25% 03 - 25.04.19 30,000,000 EUR 32,676,000 32,957,544 1.47 France OAT 4.50% 09 - 25.04.41 9,000,000 EUR 9,810,990 10,362,021 0.46 France OAT 4.75% 02 - 25.10.12 18,800,000 EUR 19,620,996 19,491,276 0.87 France OAT 4.75% 04 - 25.04.35 1,000,000 EUR 1,105,120 1,172,490 0.05 France OAT 5.75% 01 - 25.10.32 2,000,000 EUR 2,526,780 2,602,003 0.12 187,140,257 188,121,081 8.40 Germany Bayerische Landesbank 0.73% 05 - 19.01.13 2,580,000,000 JPY 25,270,651 25,918,910 1.16 Bundesrepublik Deutschland 3.25% 05 -
04.07.15 19,609,000 EUR 20,922,746 21,502,292 0.96 Bundesrepublik Deutschland 3.75% 03 -
04.07.13 12,000,000 EUR 12,638,760 12,661,259 0.56 Bundesrepublik Deutschland 3.75% 04 -
04.01.15 5,000,000 EUR 5,509,000 5,501,619 0.25 Bundesrepublik Deutschland 3.75% 06 -
04.01.17 4,000,000 EUR 4,491,960 4,573,653 0.20 Bundesrepublik Deutschland 3.75% 08 -
04.01.19 12,000,000 EUR 13,471,380 13,932,547 0.62 Bundesrepublik Deutschland 4.25% 07 -
04.07.39 5,000,000 EUR 6,176,050 6,842,648 0.31 Bundesrepublik Deutschland 4.75% 08 -
04.07.40 57,000,000 EUR 84,041,790 84,410,018 3.77 Bundesrepublik Deutschland Coupon Strips -
97 - 04.01.20 22,000,000 EUR 16,632,568 19,090,214 0.85 Bundesrepublik Deutschland Coupon Strips -
97 - 04.01.21 104,200,000 EUR 78,690,040 87,393,790 3.90
* This is a synthetic ETF. The accompanying notes form an integral part of these financial statements.
78
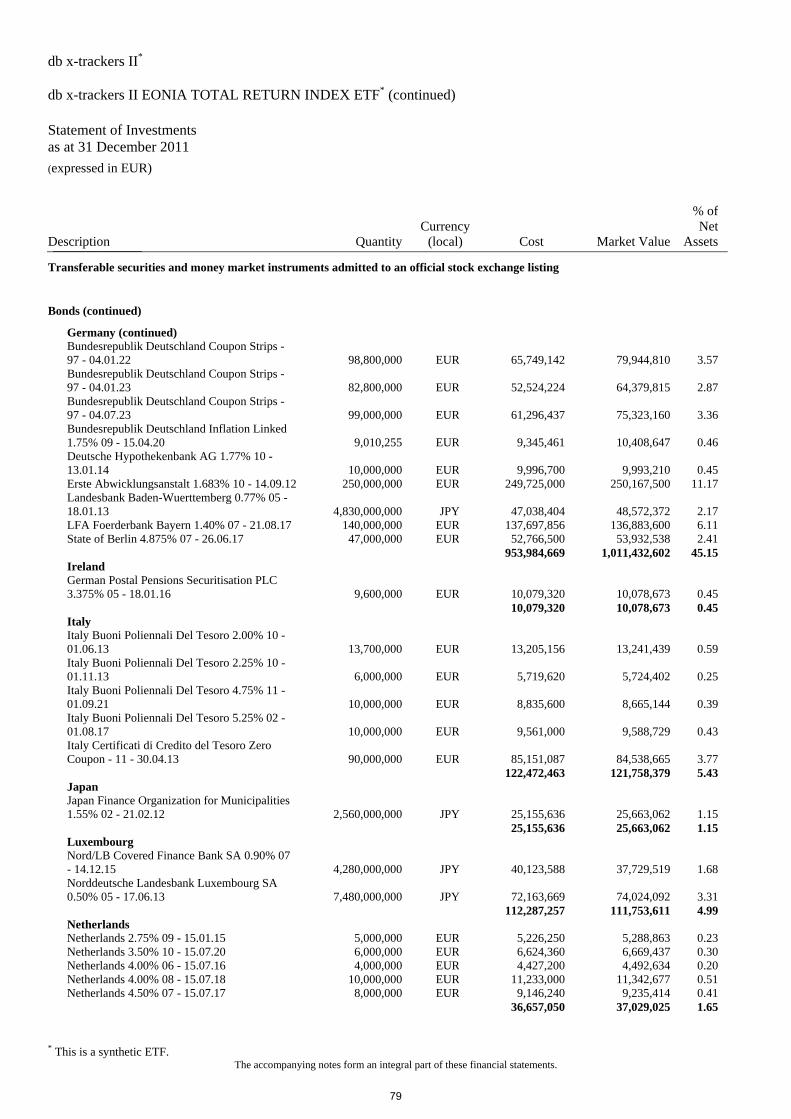
db x-trackers II* db x-trackers II EONIA TOTAL RETURN INDEX ETF* (continued) Statement of Investments as at 31 December 2011 (expressed in EUR)
Description QuantityCurrency
(local) Cost Market Value
% of Net
Assets_______________
Transferable securities and money market instruments admitted to an official stock exchange listing
Bonds (continued)
Germany (continued) Bundesrepublik Deutschland Coupon Strips -
97 - 04.01.22 98,800,000 EUR 65,749,142 79,944,810 3.57 Bundesrepublik Deutschland Coupon Strips -
97 - 04.01.23 82,800,000 EUR 52,524,224 64,379,815 2.87 Bundesrepublik Deutschland Coupon Strips -
97 - 04.07.23 99,000,000 EUR 61,296,437 75,323,160 3.36 Bundesrepublik Deutschland Inflation Linked
1.75% 09 - 15.04.20 9,010,255 EUR 9,345,461 10,408,647 0.46 Deutsche Hypothekenbank AG 1.77% 10 -
13.01.14 10,000,000 EUR 9,996,700 9,993,210 0.45 Erste Abwicklungsanstalt 1.683% 10 - 14.09.12 250,000,000 EUR 249,725,000 250,167,500 11.17 Landesbank Baden-Wuerttemberg 0.77% 05 -
18.01.13 4,830,000,000 JPY 47,038,404 48,572,372 2.17 LFA Foerderbank Bayern 1.40% 07 - 21.08.17 140,000,000 EUR 137,697,856 136,883,600 6.11 State of Berlin 4.875% 07 - 26.06.17 47,000,000 EUR 52,766,500 53,932,538 2.41 953,984,669 1,011,432,602 45.15 Ireland German Postal Pensions Securitisation PLC
3.375% 05 - 18.01.16 9,600,000 EUR 10,079,320 10,078,673 0.45 10,079,320 10,078,673 0.45 Italy Italy Buoni Poliennali Del Tesoro 2.00% 10 -
01.06.13 13,700,000 EUR 13,205,156 13,241,439 0.59 Italy Buoni Poliennali Del Tesoro 2.25% 10 -
01.11.13 6,000,000 EUR 5,719,620 5,724,402 0.25 Italy Buoni Poliennali Del Tesoro 4.75% 11 -
01.09.21 10,000,000 EUR 8,835,600 8,665,144 0.39 Italy Buoni Poliennali Del Tesoro 5.25% 02 -
01.08.17 10,000,000 EUR 9,561,000 9,588,729 0.43 Italy Certificati di Credito del Tesoro Zero
Coupon - 11 - 30.04.13 90,000,000 EUR 85,151,087 84,538,665 3.77 122,472,463 121,758,379 5.43 Japan Japan Finance Organization for Municipalities
1.55% 02 - 21.02.12 2,560,000,000 JPY 25,155,636 25,663,062 1.15 25,155,636 25,663,062 1.15 Luxembourg Nord/LB Covered Finance Bank SA 0.90% 07
- 14.12.15 4,280,000,000 JPY 40,123,588 37,729,519 1.68 Norddeutsche Landesbank Luxembourg SA
0.50% 05 - 17.06.13 7,480,000,000 JPY 72,163,669 74,024,092 3.31 112,287,257 111,753,611 4.99 Netherlands Netherlands 2.75% 09 - 15.01.15 5,000,000 EUR 5,226,250 5,288,863 0.23 Netherlands 3.50% 10 - 15.07.20 6,000,000 EUR 6,624,360 6,669,437 0.30 Netherlands 4.00% 06 - 15.07.16 4,000,000 EUR 4,427,200 4,492,634 0.20 Netherlands 4.00% 08 - 15.07.18 10,000,000 EUR 11,233,000 11,342,677 0.51 Netherlands 4.50% 07 - 15.07.17 8,000,000 EUR 9,146,240 9,235,414 0.41 36,657,050 37,029,025 1.65
* This is a synthetic ETF. The accompanying notes form an integral part of these financial statements.
79
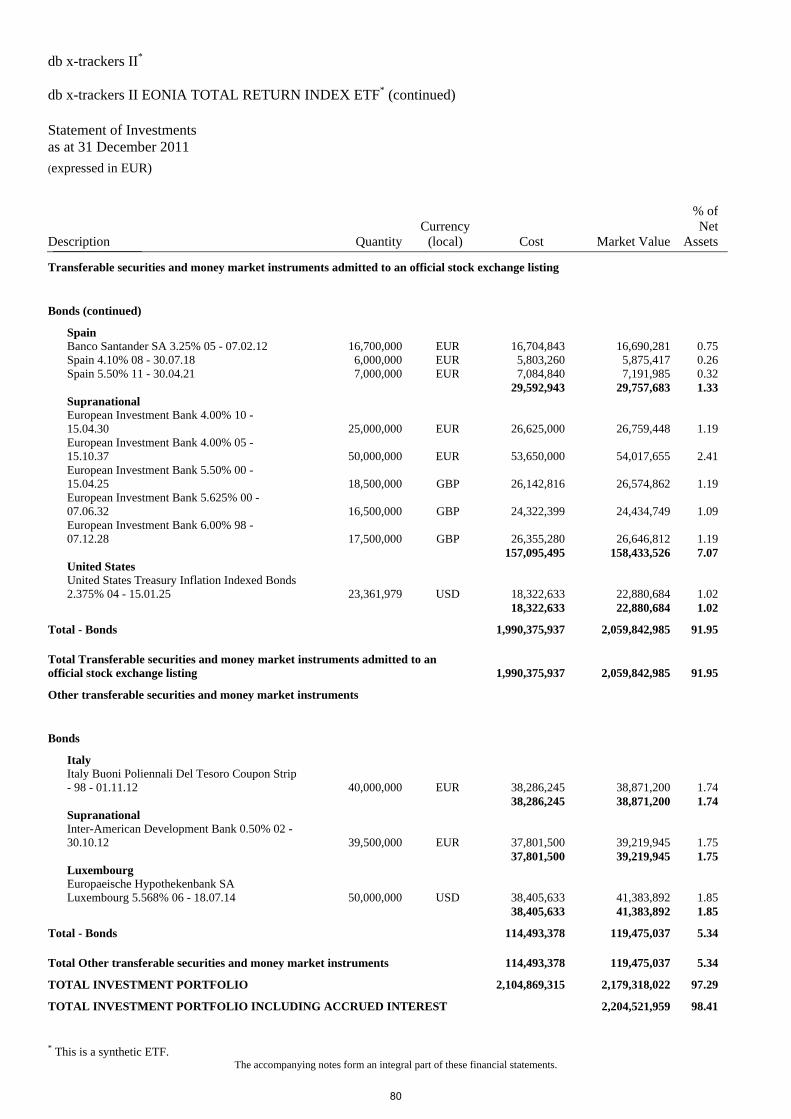
db x-trackers II*
db x-trackers II EONIA TOTAL RETURN INDEX ETF* (continued) Statement of Investments as at 31 December 2011 (expressed in EUR)
* This is a synthetic ETF. The accompanying notes form an integral part of these financial statements.
Description QuantityCurrency
(local) Cost Market Value
% of Net
Assets_______________
Transferable securities and money market instruments admitted to an official stock exchange listing
Bonds (continued)
Spain Banco Santander SA 3.25% 05 - 07.02.12 16,700,000 EUR 16,704,843 16,690,281 0.75 Spain 4.10% 08 - 30.07.18 6,000,000 EUR 5,803,260 5,875,417 0.26 Spain 5.50% 11 - 30.04.21 7,000,000 EUR 7,084,840 7,191,985 0.32 29,592,943 29,757,683 1.33 Supranational European Investment Bank 4.00% 10 -
15.04.30 25,000,000 EUR 26,625,000 26,759,448 1.19 European Investment Bank 4.00% 05 -
15.10.37 50,000,000 EUR 53,650,000 54,017,655 2.41 European Investment Bank 5.50% 00 -
15.04.25 18,500,000 GBP 26,142,816 26,574,862 1.19 European Investment Bank 5.625% 00 -
07.06.32 16,500,000 GBP 24,322,399 24,434,749 1.09 European Investment Bank 6.00% 98 -
07.12.28 17,500,000 GBP 26,355,280 26,646,812 1.19 157,095,495 158,433,526 7.07 United States United States Treasury Inflation Indexed Bonds
2.375% 04 - 15.01.25 23,361,979 USD 18,322,633 22,880,684 1.02 18,322,633 22,880,684 1.02
Total - Bonds 1,990,375,937 2,059,842,985 91.95
Total Transferable securities and money market instruments admitted to an official stock exchange listing 1,990,375,937 2,059,842,985 91.95
Other transferable securities and money market instruments
Bonds
Italy Italy Buoni Poliennali Del Tesoro Coupon Strip
- 98 - 01.11.12 40,000,000 EUR 38,286,245 38,871,200 1.74 38,286,245 38,871,200 1.74 Supranational Inter-American Development Bank 0.50% 02 -
30.10.12 39,500,000 EUR 37,801,500 39,219,945 1.75 37,801,500 39,219,945 1.75 Luxembourg Europaeische Hypothekenbank SA
Luxembourg 5.568% 06 - 18.07.14 50,000,000 USD 38,405,633 41,383,892 1.85 38,405,633 41,383,892 1.85
Total - Bonds 114,493,378 119,475,037 5.34
Total Other transferable securities and money market instruments 114,493,378 119,475,037 5.34
TOTAL INVESTMENT PORTFOLIO 2,104,869,315 2,179,318,022 97.29
TOTAL INVESTMENT PORTFOLIO INCLUDING ACCRUED INTEREST 2,204,521,959 98.41
80
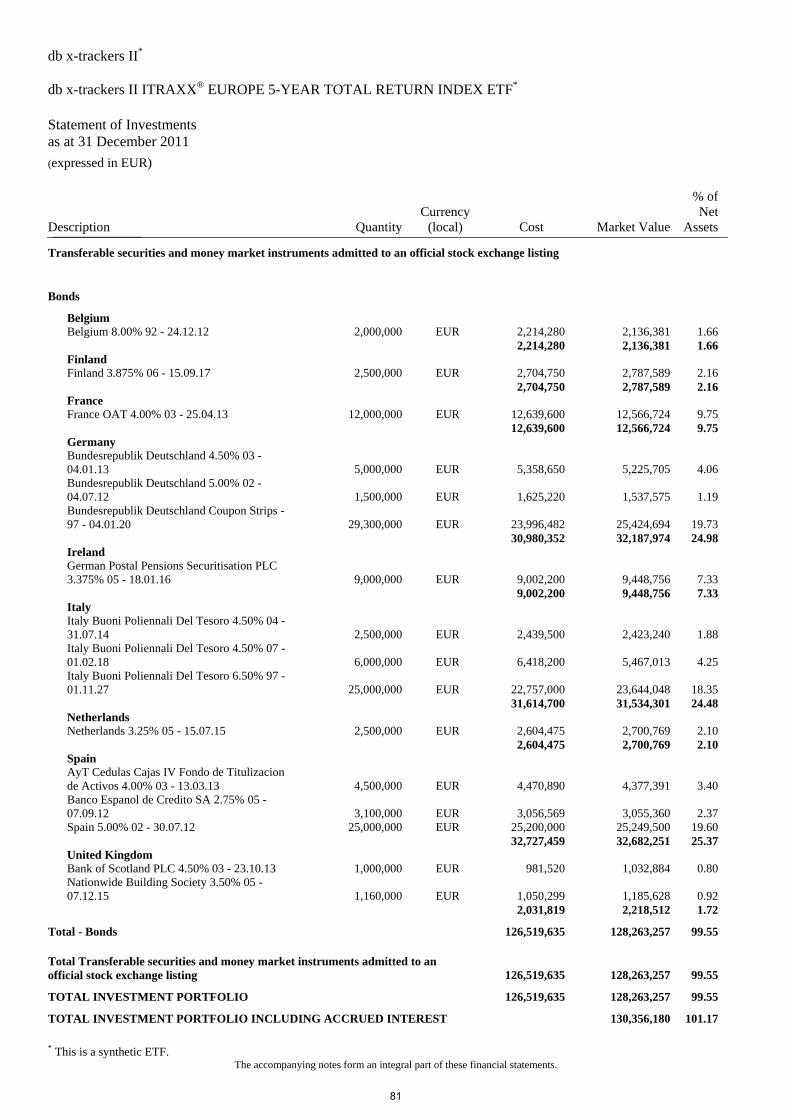
db x-trackers II* db x-trackers II ITRAXX® EUROPE 5-YEAR TOTAL RETURN INDEX ETF* Statement of Investments as at 31 December 2011 (expressed in EUR)
* This is a synthetic ETF. The accompanying notes form an integral part of these financial statements.
Description QuantityCurrency
(local) Cost Market Value
% of Net
Assets_______________
Transferable securities and money market instruments admitted to an official stock exchange listing
Bonds
Belgium Belgium 8.00% 92 - 24.12.12 2,000,000 EUR 2,214,280 2,136,381 1.66 2,214,280 2,136,381 1.66 Finland Finland 3.875% 06 - 15.09.17 2,500,000 EUR 2,704,750 2,787,589 2.16 2,704,750 2,787,589 2.16 France France OAT 4.00% 03 - 25.04.13 12,000,000 EUR 12,639,600 12,566,724 9.75 12,639,600 12,566,724 9.75 Germany Bundesrepublik Deutschland 4.50% 03 -
04.01.13 5,000,000 EUR 5,358,650 5,225,705 4.06 Bundesrepublik Deutschland 5.00% 02 -
04.07.12 1,500,000 EUR 1,625,220 1,537,575 1.19 Bundesrepublik Deutschland Coupon Strips -
97 - 04.01.20 29,300,000 EUR 23,996,482 25,424,694 19.73 30,980,352 32,187,974 24.98 Ireland German Postal Pensions Securitisation PLC
3.375% 05 - 18.01.16 9,000,000 EUR 9,002,200 9,448,756 7.33 9,002,200 9,448,756 7.33 Italy Italy Buoni Poliennali Del Tesoro 4.50% 04 -
31.07.14 2,500,000 EUR 2,439,500 2,423,240 1.88 Italy Buoni Poliennali Del Tesoro 4.50% 07 -
01.02.18 6,000,000 EUR 6,418,200 5,467,013 4.25 Italy Buoni Poliennali Del Tesoro 6.50% 97 -
01.11.27 25,000,000 EUR 22,757,000 23,644,048 18.35 31,614,700 31,534,301 24.48 Netherlands Netherlands 3.25% 05 - 15.07.15 2,500,000 EUR 2,604,475 2,700,769 2.10 2,604,475 2,700,769 2.10 Spain AyT Cedulas Cajas IV Fondo de Titulizacion
de Activos 4.00% 03 - 13.03.13 4,500,000 EUR 4,470,890 4,377,391 3.40 Banco Espanol de Credito SA 2.75% 05 -
07.09.12 3,100,000 EUR 3,056,569 3,055,360 2.37 Spain 5.00% 02 - 30.07.12 25,000,000 EUR 25,200,000 25,249,500 19.60 32,727,459 32,682,251 25.37 United Kingdom Bank of Scotland PLC 4.50% 03 - 23.10.13 1,000,000 EUR 981,520 1,032,884 0.80 Nationwide Building Society 3.50% 05 -
07.12.15 1,160,000 EUR 1,050,299 1,185,628 0.92 2,031,819 2,218,512 1.72
Total - Bonds 126,519,635 128,263,257 99.55
Total Transferable securities and money market instruments admitted to an official stock exchange listing 126,519,635 128,263,257 99.55
TOTAL INVESTMENT PORTFOLIO 126,519,635 128,263,257 99.55
TOTAL INVESTMENT PORTFOLIO INCLUDING ACCRUED INTEREST 130,356,180 101.17
81
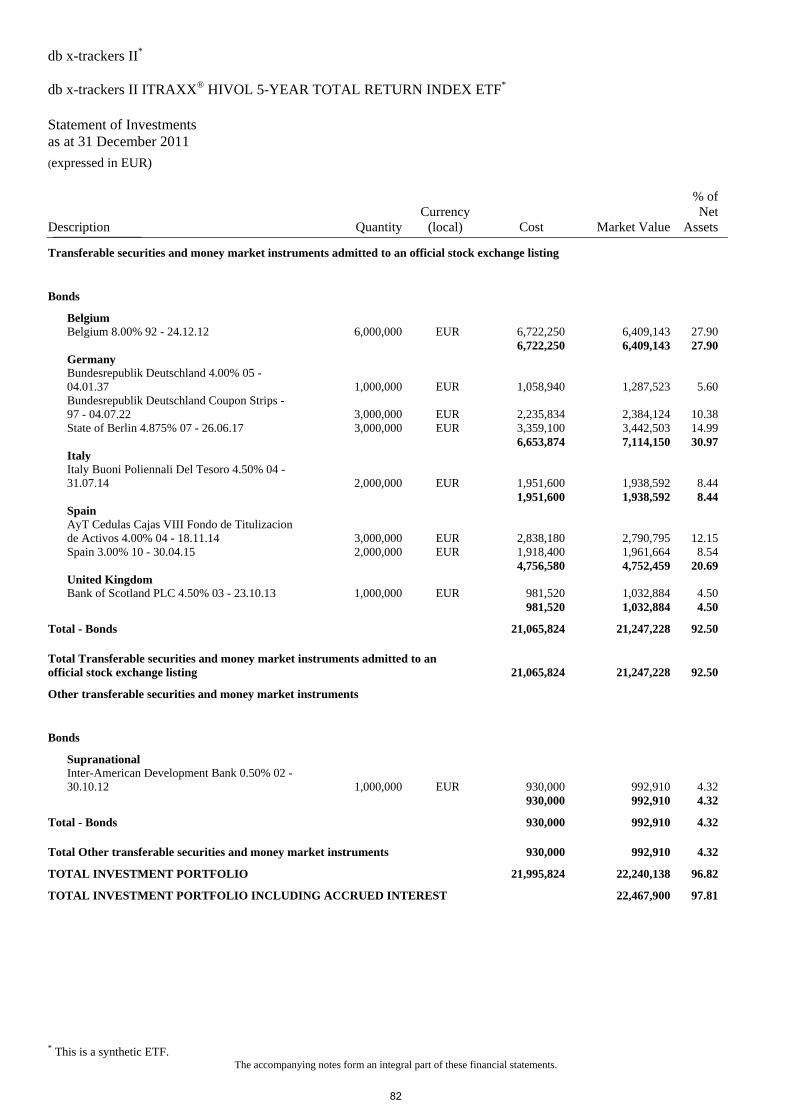
db x-trackers II* db x-trackers II ITRAXX® HIVOL 5-YEAR TOTAL RETURN INDEX ETF* Statement of Investments as at 31 December 2011 (expressed in EUR)
* This is a synthetic ETF. The accompanying notes form an integral part of these financial statements.
Description QuantityCurrency
(local) Cost Market Value
% of Net
Assets_______________
Transferable securities and money market instruments admitted to an official stock exchange listing
Bonds
Belgium Belgium 8.00% 92 - 24.12.12 6,000,000 EUR 6,722,250 6,409,143 27.90 6,722,250 6,409,143 27.90 Germany Bundesrepublik Deutschland 4.00% 05 -
04.01.37 1,000,000 EUR 1,058,940 1,287,523 5.60 Bundesrepublik Deutschland Coupon Strips -
97 - 04.07.22 3,000,000 EUR 2,235,834 2,384,124 10.38 State of Berlin 4.875% 07 - 26.06.17 3,000,000 EUR 3,359,100 3,442,503 14.99 6,653,874 7,114,150 30.97 Italy Italy Buoni Poliennali Del Tesoro 4.50% 04 -
31.07.14 2,000,000 EUR 1,951,600 1,938,592 8.44 1,951,600 1,938,592 8.44 Spain AyT Cedulas Cajas VIII Fondo de Titulizacion
de Activos 4.00% 04 - 18.11.14 3,000,000 EUR 2,838,180 2,790,795 12.15 Spain 3.00% 10 - 30.04.15 2,000,000 EUR 1,918,400 1,961,664 8.54 4,756,580 4,752,459 20.69 United Kingdom Bank of Scotland PLC 4.50% 03 - 23.10.13 1,000,000 EUR 981,520 1,032,884 4.50 981,520 1,032,884 4.50
Total - Bonds 21,065,824 21,247,228 92.50
Total Transferable securities and money market instruments admitted to an official stock exchange listing 21,065,824 21,247,228 92.50
Other transferable securities and money market instruments
Bonds
Supranational Inter-American Development Bank 0.50% 02 -
30.10.12 1,000,000 EUR 930,000 992,910 4.32 930,000 992,910 4.32
Total - Bonds 930,000 992,910 4.32
Total Other transferable securities and money market instruments 930,000 992,910 4.32
TOTAL INVESTMENT PORTFOLIO 21,995,824 22,240,138 96.82
TOTAL INVESTMENT PORTFOLIO INCLUDING ACCRUED INTEREST 22,467,900 97.81
82
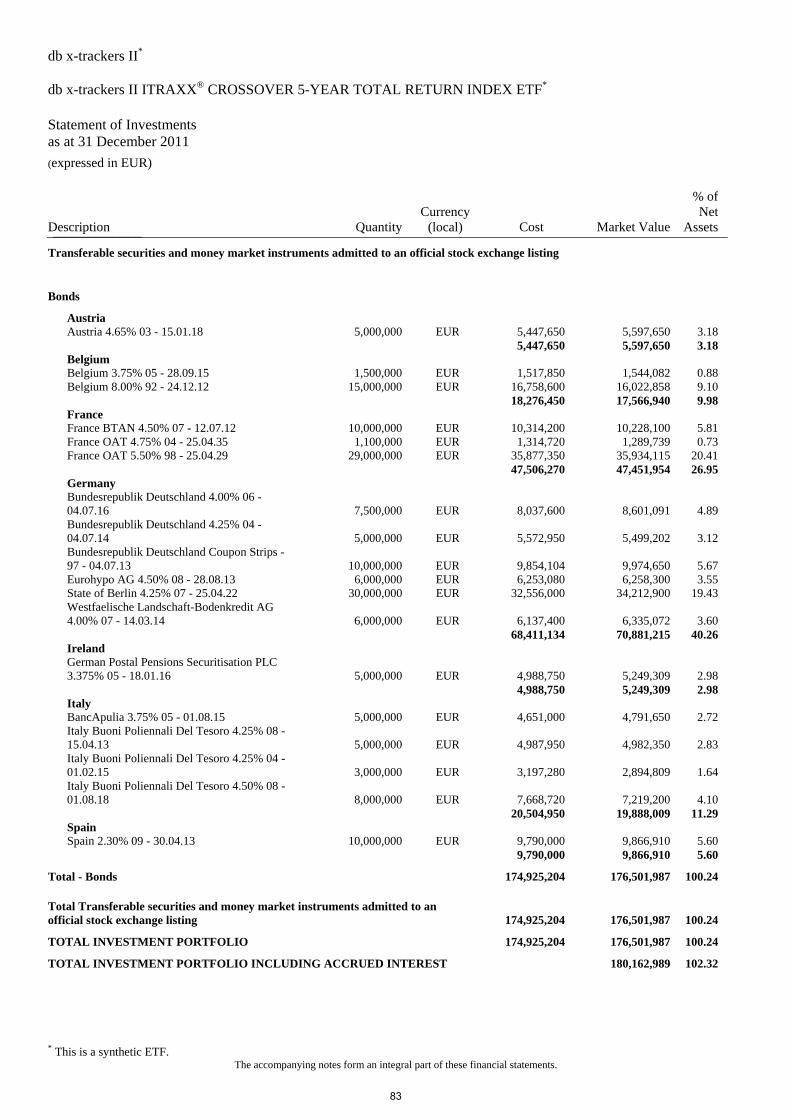
db x-trackers II* db x-trackers II ITRAXX® CROSSOVER 5-YEAR TOTAL RETURN INDEX ETF* Statement of Investments as at 31 December 2011 (expressed in EUR)
* This is a synthetic ETF. The accompanying notes form an integral part of these financial statements.
Description QuantityCurrency
(local) Cost Market Value
% of Net
Assets_______________
Transferable securities and money market instruments admitted to an official stock exchange listing
Bonds
Austria Austria 4.65% 03 - 15.01.18 5,000,000 EUR 5,447,650 5,597,650 3.18 5,447,650 5,597,650 3.18 Belgium Belgium 3.75% 05 - 28.09.15 1,500,000 EUR 1,517,850 1,544,082 0.88 Belgium 8.00% 92 - 24.12.12 15,000,000 EUR 16,758,600 16,022,858 9.10 18,276,450 17,566,940 9.98 France France BTAN 4.50% 07 - 12.07.12 10,000,000 EUR 10,314,200 10,228,100 5.81 France OAT 4.75% 04 - 25.04.35 1,100,000 EUR 1,314,720 1,289,739 0.73 France OAT 5.50% 98 - 25.04.29 29,000,000 EUR 35,877,350 35,934,115 20.41 47,506,270 47,451,954 26.95 Germany Bundesrepublik Deutschland 4.00% 06 -
04.07.16 7,500,000 EUR 8,037,600 8,601,091 4.89 Bundesrepublik Deutschland 4.25% 04 -
04.07.14 5,000,000 EUR 5,572,950 5,499,202 3.12 Bundesrepublik Deutschland Coupon Strips -
97 - 04.07.13 10,000,000 EUR 9,854,104 9,974,650 5.67 Eurohypo AG 4.50% 08 - 28.08.13 6,000,000 EUR 6,253,080 6,258,300 3.55 State of Berlin 4.25% 07 - 25.04.22 30,000,000 EUR 32,556,000 34,212,900 19.43 Westfaelische Landschaft-Bodenkredit AG
4.00% 07 - 14.03.14 6,000,000 EUR 6,137,400 6,335,072 3.60 68,411,134 70,881,215 40.26 Ireland German Postal Pensions Securitisation PLC
3.375% 05 - 18.01.16 5,000,000 EUR 4,988,750 5,249,309 2.98 4,988,750 5,249,309 2.98 Italy BancApulia 3.75% 05 - 01.08.15 5,000,000 EUR 4,651,000 4,791,650 2.72 Italy Buoni Poliennali Del Tesoro 4.25% 08 -
15.04.13 5,000,000 EUR 4,987,950 4,982,350 2.83 Italy Buoni Poliennali Del Tesoro 4.25% 04 -
01.02.15 3,000,000 EUR 3,197,280 2,894,809 1.64 Italy Buoni Poliennali Del Tesoro 4.50% 08 -
01.08.18 8,000,000 EUR 7,668,720 7,219,200 4.10 20,504,950 19,888,009 11.29 Spain Spain 2.30% 09 - 30.04.13 10,000,000 EUR 9,790,000 9,866,910 5.60 9,790,000 9,866,910 5.60
Total - Bonds 174,925,204 176,501,987 100.24
Total Transferable securities and money market instruments admitted to an official stock exchange listing 174,925,204 176,501,987 100.24
TOTAL INVESTMENT PORTFOLIO 174,925,204 176,501,987 100.24
TOTAL INVESTMENT PORTFOLIO INCLUDING ACCRUED INTEREST 180,162,989 102.32
83
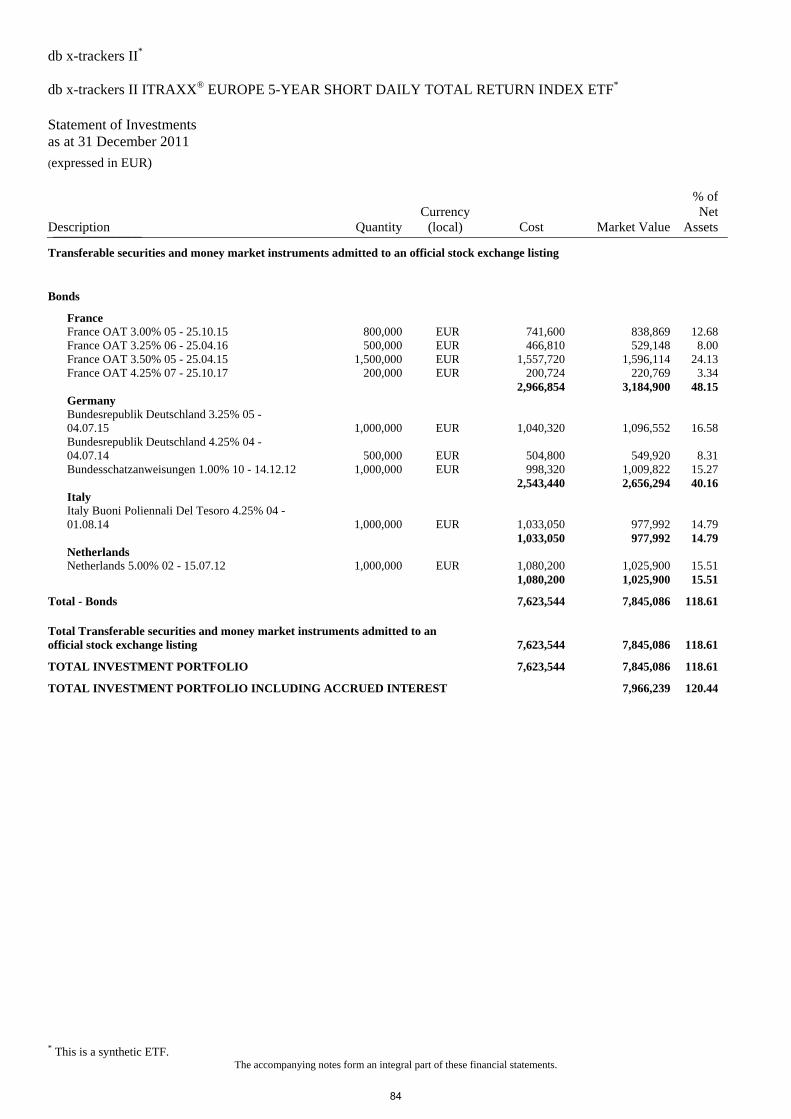
db x-trackers II* db x-trackers II ITRAXX® EUROPE 5-YEAR SHORT DAILY TOTAL RETURN INDEX ETF* Statement of Investments as at 31 December 2011 (expressed in EUR)
* This is a synthetic ETF. The accompanying notes form an integral part of these financial statements.
Description QuantityCurrency
(local) Cost Market Value
% of Net
Assets_______________
Transferable securities and money market instruments admitted to an official stock exchange listing
Bonds
France France OAT 3.00% 05 - 25.10.15 800,000 EUR 741,600 838,869 12.68 France OAT 3.25% 06 - 25.04.16 500,000 EUR 466,810 529,148 8.00 France OAT 3.50% 05 - 25.04.15 1,500,000 EUR 1,557,720 1,596,114 24.13 France OAT 4.25% 07 - 25.10.17 200,000 EUR 200,724 220,769 3.34 2,966,854 3,184,900 48.15 Germany Bundesrepublik Deutschland 3.25% 05 -
04.07.15 1,000,000 EUR 1,040,320 1,096,552 16.58 Bundesrepublik Deutschland 4.25% 04 -
04.07.14 500,000 EUR 504,800 549,920 8.31 Bundesschatzanweisungen 1.00% 10 - 14.12.12 1,000,000 EUR 998,320 1,009,822 15.27 2,543,440 2,656,294 40.16 Italy Italy Buoni Poliennali Del Tesoro 4.25% 04 -
01.08.14 1,000,000 EUR 1,033,050 977,992 14.79 1,033,050 977,992 14.79 Netherlands Netherlands 5.00% 02 - 15.07.12 1,000,000 EUR 1,080,200 1,025,900 15.51 1,080,200 1,025,900 15.51
Total - Bonds 7,623,544 7,845,086 118.61
Total Transferable securities and money market instruments admitted to an official stock exchange listing 7,623,544 7,845,086 118.61
TOTAL INVESTMENT PORTFOLIO 7,623,544 7,845,086 118.61
TOTAL INVESTMENT PORTFOLIO INCLUDING ACCRUED INTEREST 7,966,239 120.44
84
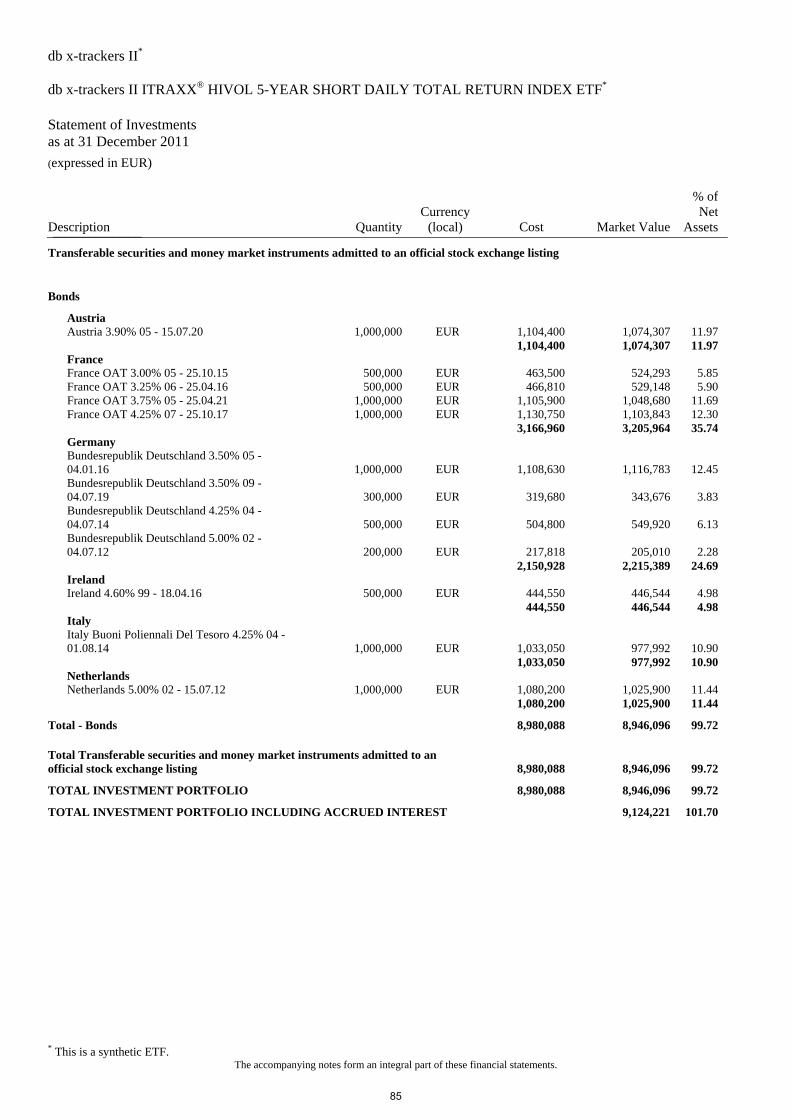
db x-trackers II* db x-trackers II ITRAXX® HIVOL 5-YEAR SHORT DAILY TOTAL RETURN INDEX ETF* Statement of Investments as at 31 December 2011 (expressed in EUR)
* This is a synthetic ETF. The accompanying notes form an integral part of these financial statements.
Description QuantityCurrency
(local) Cost Market Value
% of Net
Assets_______________
Transferable securities and money market instruments admitted to an official stock exchange listing
Bonds
Austria Austria 3.90% 05 - 15.07.20 1,000,000 EUR 1,104,400 1,074,307 11.97 1,104,400 1,074,307 11.97 France France OAT 3.00% 05 - 25.10.15 500,000 EUR 463,500 524,293 5.85 France OAT 3.25% 06 - 25.04.16 500,000 EUR 466,810 529,148 5.90 France OAT 3.75% 05 - 25.04.21 1,000,000 EUR 1,105,900 1,048,680 11.69 France OAT 4.25% 07 - 25.10.17 1,000,000 EUR 1,130,750 1,103,843 12.30 3,166,960 3,205,964 35.74 Germany Bundesrepublik Deutschland 3.50% 05 -
04.01.16 1,000,000 EUR 1,108,630 1,116,783 12.45 Bundesrepublik Deutschland 3.50% 09 -
04.07.19 300,000 EUR 319,680 343,676 3.83 Bundesrepublik Deutschland 4.25% 04 -
04.07.14 500,000 EUR 504,800 549,920 6.13 Bundesrepublik Deutschland 5.00% 02 -
04.07.12 200,000 EUR 217,818 205,010 2.28 2,150,928 2,215,389 24.69 Ireland Ireland 4.60% 99 - 18.04.16 500,000 EUR 444,550 446,544 4.98 444,550 446,544 4.98 Italy Italy Buoni Poliennali Del Tesoro 4.25% 04 -
01.08.14 1,000,000 EUR 1,033,050 977,992 10.90 1,033,050 977,992 10.90 Netherlands Netherlands 5.00% 02 - 15.07.12 1,000,000 EUR 1,080,200 1,025,900 11.44 1,080,200 1,025,900 11.44
Total - Bonds 8,980,088 8,946,096 99.72
Total Transferable securities and money market instruments admitted to an official stock exchange listing 8,980,088 8,946,096 99.72
TOTAL INVESTMENT PORTFOLIO 8,980,088 8,946,096 99.72
TOTAL INVESTMENT PORTFOLIO INCLUDING ACCRUED INTEREST 9,124,221 101.70
85
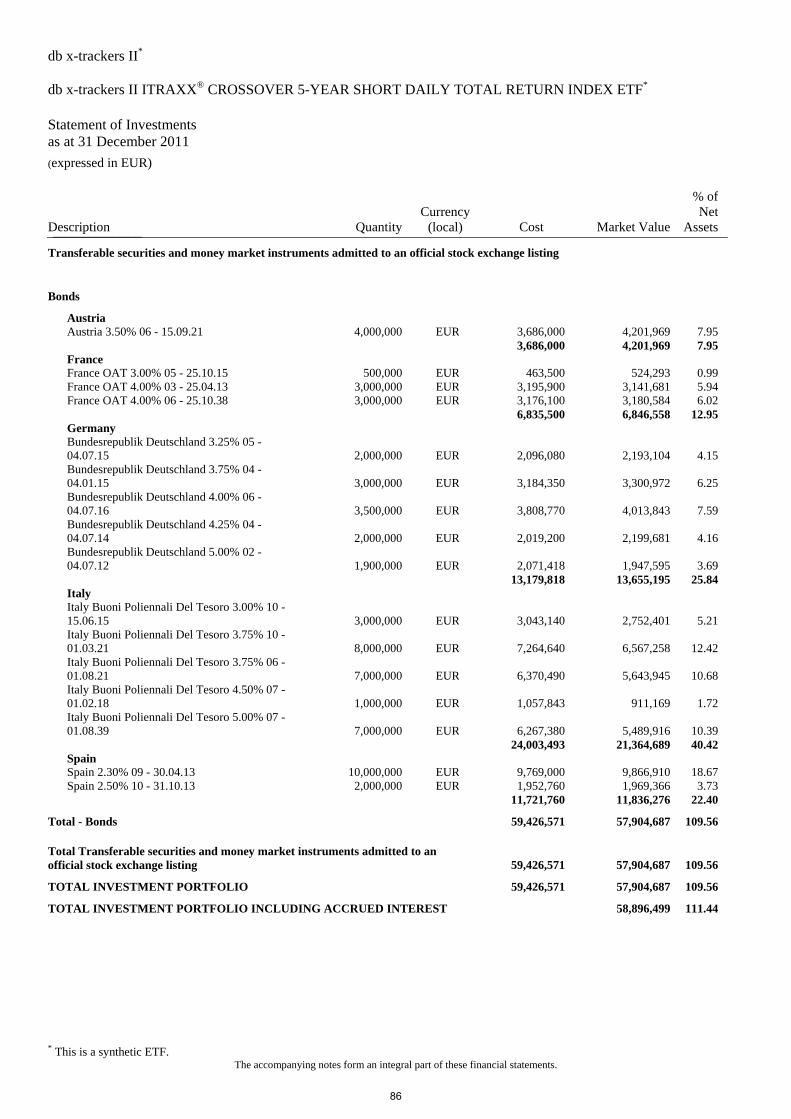
db x-trackers II* db x-trackers II ITRAXX® CROSSOVER 5-YEAR SHORT DAILY TOTAL RETURN INDEX ETF* Statement of Investments as at 31 December 2011 (expressed in EUR)
* This is a synthetic ETF. The accompanying notes form an integral part of these financial statements.
Description QuantityCurrency
(local) Cost Market Value
% of Net
Assets_______________
Transferable securities and money market instruments admitted to an official stock exchange listing
Bonds
Austria Austria 3.50% 06 - 15.09.21 4,000,000 EUR 3,686,000 4,201,969 7.95 3,686,000 4,201,969 7.95 France France OAT 3.00% 05 - 25.10.15 500,000 EUR 463,500 524,293 0.99 France OAT 4.00% 03 - 25.04.13 3,000,000 EUR 3,195,900 3,141,681 5.94 France OAT 4.00% 06 - 25.10.38 3,000,000 EUR 3,176,100 3,180,584 6.02 6,835,500 6,846,558 12.95 Germany Bundesrepublik Deutschland 3.25% 05 -
04.07.15 2,000,000 EUR 2,096,080 2,193,104 4.15 Bundesrepublik Deutschland 3.75% 04 -
04.01.15 3,000,000 EUR 3,184,350 3,300,972 6.25 Bundesrepublik Deutschland 4.00% 06 -
04.07.16 3,500,000 EUR 3,808,770 4,013,843 7.59 Bundesrepublik Deutschland 4.25% 04 -
04.07.14 2,000,000 EUR 2,019,200 2,199,681 4.16 Bundesrepublik Deutschland 5.00% 02 -
04.07.12 1,900,000 EUR 2,071,418 1,947,595 3.69 13,179,818 13,655,195 25.84 Italy Italy Buoni Poliennali Del Tesoro 3.00% 10 -
15.06.15 3,000,000 EUR 3,043,140 2,752,401 5.21 Italy Buoni Poliennali Del Tesoro 3.75% 10 -
01.03.21 8,000,000 EUR 7,264,640 6,567,258 12.42 Italy Buoni Poliennali Del Tesoro 3.75% 06 -
01.08.21 7,000,000 EUR 6,370,490 5,643,945 10.68 Italy Buoni Poliennali Del Tesoro 4.50% 07 -
01.02.18 1,000,000 EUR 1,057,843 911,169 1.72 Italy Buoni Poliennali Del Tesoro 5.00% 07 -
01.08.39 7,000,000 EUR 6,267,380 5,489,916 10.39 24,003,493 21,364,689 40.42 Spain Spain 2.30% 09 - 30.04.13 10,000,000 EUR 9,769,000 9,866,910 18.67 Spain 2.50% 10 - 31.10.13 2,000,000 EUR 1,952,760 1,969,366 3.73 11,721,760 11,836,276 22.40
Total - Bonds 59,426,571 57,904,687 109.56
Total Transferable securities and money market instruments admitted to an official stock exchange listing 59,426,571 57,904,687 109.56
TOTAL INVESTMENT PORTFOLIO 59,426,571 57,904,687 109.56
TOTAL INVESTMENT PORTFOLIO INCLUDING ACCRUED INTEREST 58,896,499 111.44
86
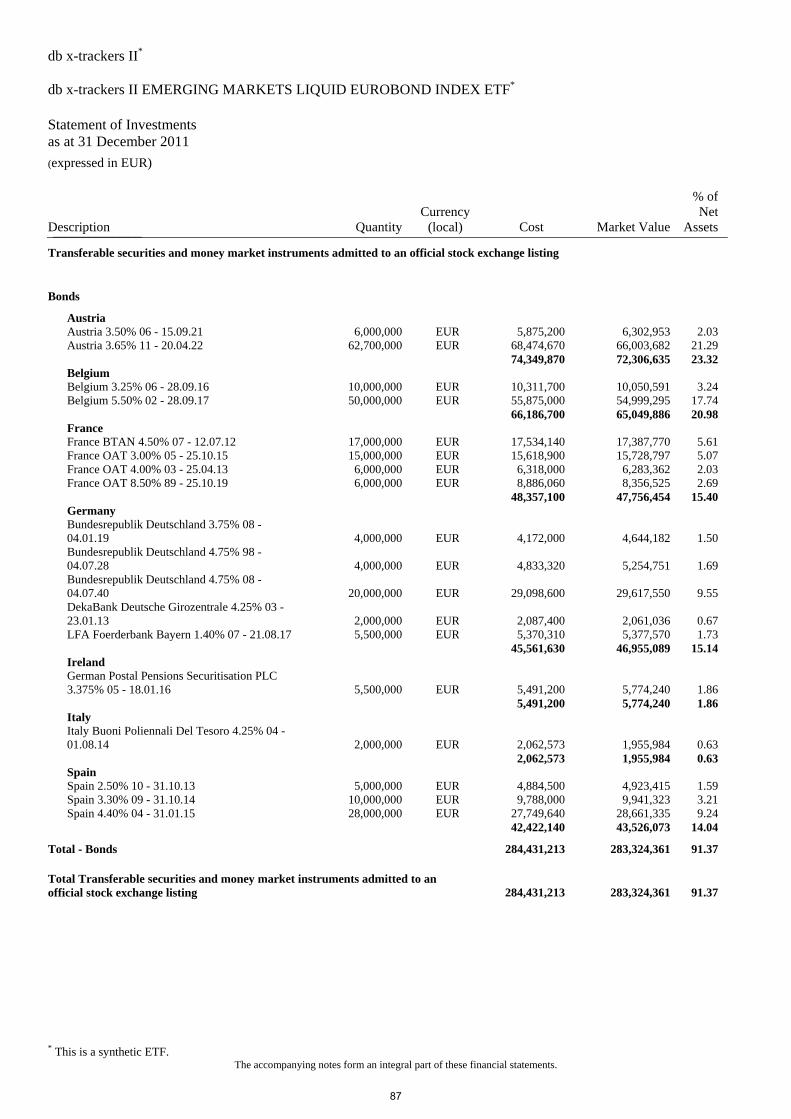
db x-trackers II* db x-trackers II EMERGING MARKETS LIQUID EUROBOND INDEX ETF* Statement of Investments as at 31 December 2011 (expressed in EUR)
* This is a synthetic ETF. The accompanying notes form an integral part of these financial statements.
Description QuantityCurrency
(local) Cost Market Value
% of Net
Assets_______________
Transferable securities and money market instruments admitted to an official stock exchange listing
Bonds
Austria Austria 3.50% 06 - 15.09.21 6,000,000 EUR 5,875,200 6,302,953 2.03 Austria 3.65% 11 - 20.04.22 62,700,000 EUR 68,474,670 66,003,682 21.29 74,349,870 72,306,635 23.32 Belgium Belgium 3.25% 06 - 28.09.16 10,000,000 EUR 10,311,700 10,050,591 3.24 Belgium 5.50% 02 - 28.09.17 50,000,000 EUR 55,875,000 54,999,295 17.74 66,186,700 65,049,886 20.98 France France BTAN 4.50% 07 - 12.07.12 17,000,000 EUR 17,534,140 17,387,770 5.61 France OAT 3.00% 05 - 25.10.15 15,000,000 EUR 15,618,900 15,728,797 5.07 France OAT 4.00% 03 - 25.04.13 6,000,000 EUR 6,318,000 6,283,362 2.03 France OAT 8.50% 89 - 25.10.19 6,000,000 EUR 8,886,060 8,356,525 2.69 48,357,100 47,756,454 15.40 Germany Bundesrepublik Deutschland 3.75% 08 -
04.01.19 4,000,000 EUR 4,172,000 4,644,182 1.50 Bundesrepublik Deutschland 4.75% 98 -
04.07.28 4,000,000 EUR 4,833,320 5,254,751 1.69 Bundesrepublik Deutschland 4.75% 08 -
04.07.40 20,000,000 EUR 29,098,600 29,617,550 9.55 DekaBank Deutsche Girozentrale 4.25% 03 -
23.01.13 2,000,000 EUR 2,087,400 2,061,036 0.67 LFA Foerderbank Bayern 1.40% 07 - 21.08.17 5,500,000 EUR 5,370,310 5,377,570 1.73 45,561,630 46,955,089 15.14 Ireland German Postal Pensions Securitisation PLC
3.375% 05 - 18.01.16 5,500,000 EUR 5,491,200 5,774,240 1.86 5,491,200 5,774,240 1.86 Italy Italy Buoni Poliennali Del Tesoro 4.25% 04 -
01.08.14 2,000,000 EUR 2,062,573 1,955,984 0.63 2,062,573 1,955,984 0.63 Spain Spain 2.50% 10 - 31.10.13 5,000,000 EUR 4,884,500 4,923,415 1.59 Spain 3.30% 09 - 31.10.14 10,000,000 EUR 9,788,000 9,941,323 3.21 Spain 4.40% 04 - 31.01.15 28,000,000 EUR 27,749,640 28,661,335 9.24 42,422,140 43,526,073 14.04
Total - Bonds 284,431,213 283,324,361 91.37
Total Transferable securities and money market instruments admitted to an official stock exchange listing 284,431,213 283,324,361 91.37
87
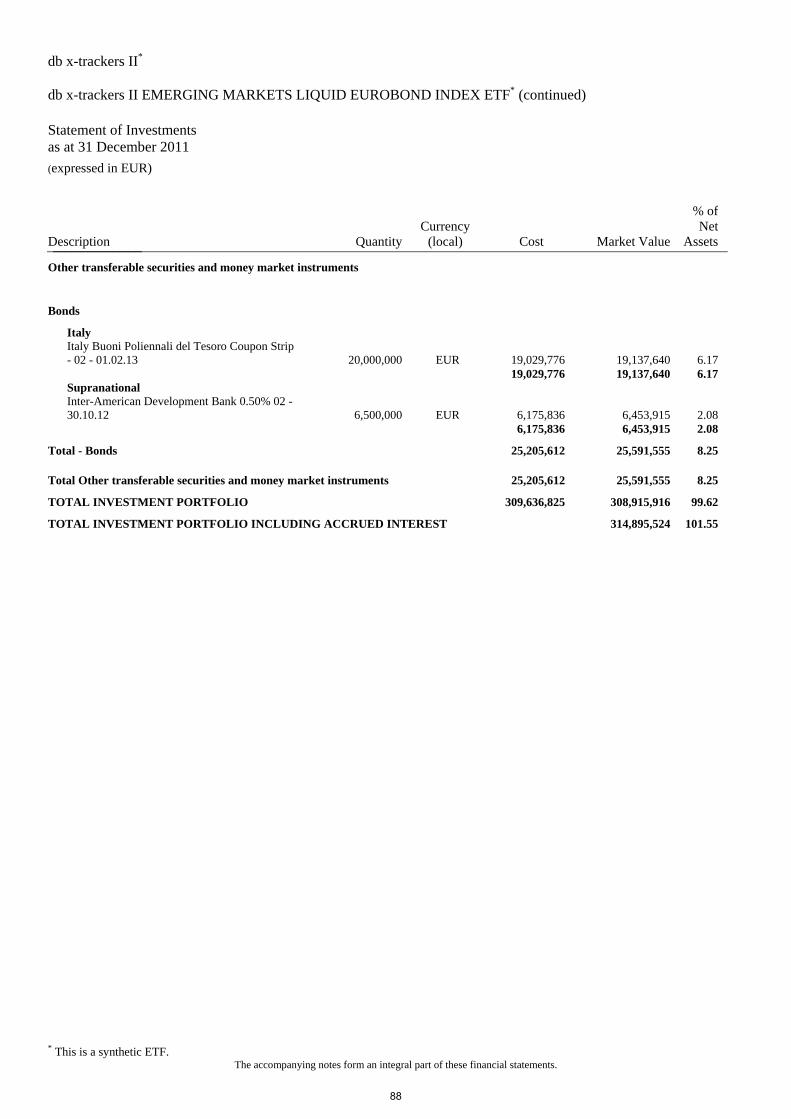
db x-trackers II* db x-trackers II EMERGING MARKETS LIQUID EUROBOND INDEX ETF* (continued) Statement of Investments as at 31 December 2011 (expressed in EUR)
* This is a synthetic ETF. The accompanying notes form an integral part of these financial statements.
Description QuantityCurrency
(local) Cost Market Value
% of Net
Assets_______________
Other transferable securities and money market instruments
Bonds
Italy Italy Buoni Poliennali del Tesoro Coupon Strip
- 02 - 01.02.13 20,000,000 EUR 19,029,776 19,137,640 6.17 19,029,776 19,137,640 6.17 Supranational Inter-American Development Bank 0.50% 02 -
30.10.12 6,500,000 EUR 6,175,836 6,453,915 2.08 6,175,836 6,453,915 2.08
Total - Bonds 25,205,612 25,591,555 8.25
Total Other transferable securities and money market instruments 25,205,612 25,591,555 8.25
TOTAL INVESTMENT PORTFOLIO 309,636,825 308,915,916 99.62
TOTAL INVESTMENT PORTFOLIO INCLUDING ACCRUED INTEREST 314,895,524 101.55
88
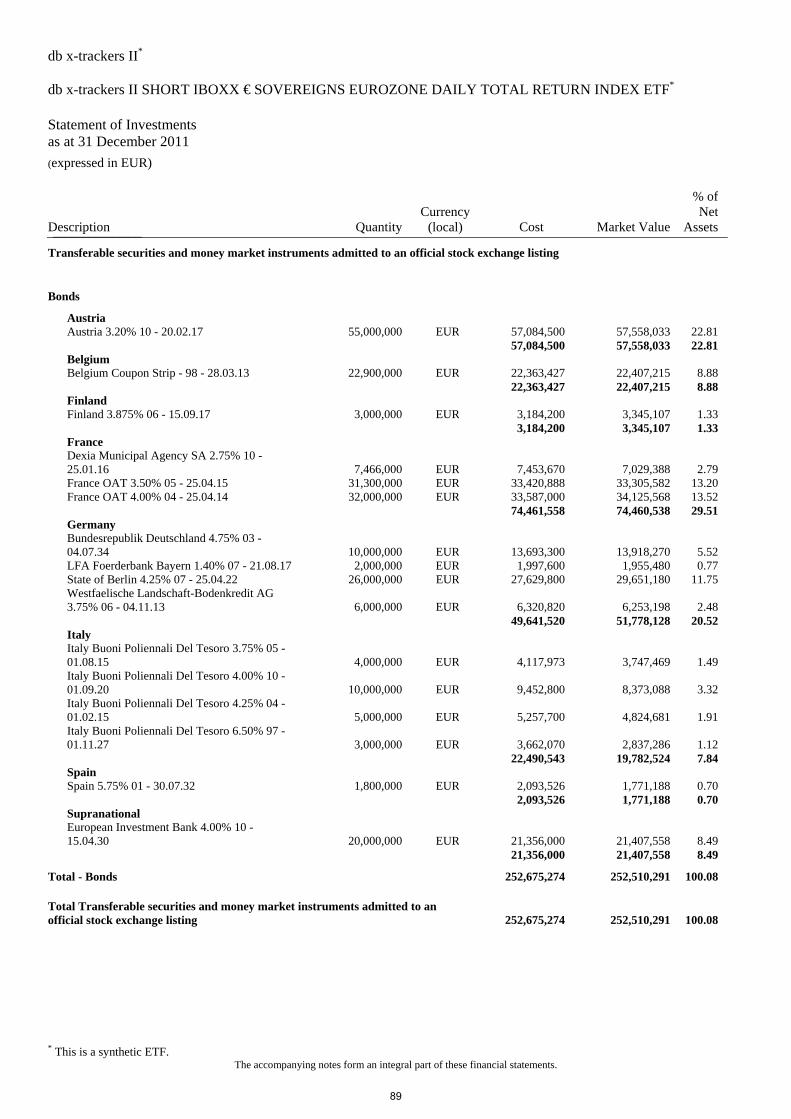
db x-trackers II* db x-trackers II SHORT IBOXX € SOVEREIGNS EUROZONE DAILY TOTAL RETURN INDEX ETF* Statement of Investments as at 31 December 2011 (expressed in EUR)
* This is a synthetic ETF. The accompanying notes form an integral part of these financial statements.
Description QuantityCurrency
(local) Cost Market Value
% of Net
Assets_______________
Transferable securities and money market instruments admitted to an official stock exchange listing
Bonds
Austria Austria 3.20% 10 - 20.02.17 55,000,000 EUR 57,084,500 57,558,033 22.81 57,084,500 57,558,033 22.81 Belgium Belgium Coupon Strip - 98 - 28.03.13 22,900,000 EUR 22,363,427 22,407,215 8.88 22,363,427 22,407,215 8.88 Finland Finland 3.875% 06 - 15.09.17 3,000,000 EUR 3,184,200 3,345,107 1.33 3,184,200 3,345,107 1.33 France Dexia Municipal Agency SA 2.75% 10 -
25.01.16 7,466,000 EUR 7,453,670 7,029,388 2.79 France OAT 3.50% 05 - 25.04.15 31,300,000 EUR 33,420,888 33,305,582 13.20 France OAT 4.00% 04 - 25.04.14 32,000,000 EUR 33,587,000 34,125,568 13.52 74,461,558 74,460,538 29.51 Germany Bundesrepublik Deutschland 4.75% 03 -
04.07.34 10,000,000 EUR 13,693,300 13,918,270 5.52 LFA Foerderbank Bayern 1.40% 07 - 21.08.17 2,000,000 EUR 1,997,600 1,955,480 0.77 State of Berlin 4.25% 07 - 25.04.22 26,000,000 EUR 27,629,800 29,651,180 11.75 Westfaelische Landschaft-Bodenkredit AG
3.75% 06 - 04.11.13 6,000,000 EUR 6,320,820 6,253,198 2.48 49,641,520 51,778,128 20.52 Italy Italy Buoni Poliennali Del Tesoro 3.75% 05 -
01.08.15 4,000,000 EUR 4,117,973 3,747,469 1.49 Italy Buoni Poliennali Del Tesoro 4.00% 10 -
01.09.20 10,000,000 EUR 9,452,800 8,373,088 3.32 Italy Buoni Poliennali Del Tesoro 4.25% 04 -
01.02.15 5,000,000 EUR 5,257,700 4,824,681 1.91 Italy Buoni Poliennali Del Tesoro 6.50% 97 -
01.11.27 3,000,000 EUR 3,662,070 2,837,286 1.12 22,490,543 19,782,524 7.84 Spain Spain 5.75% 01 - 30.07.32 1,800,000 EUR 2,093,526 1,771,188 0.70 2,093,526 1,771,188 0.70 Supranational European Investment Bank 4.00% 10 -
15.04.30 20,000,000 EUR 21,356,000 21,407,558 8.49 21,356,000 21,407,558 8.49
Total - Bonds 252,675,274 252,510,291 100.08
Total Transferable securities and money market instruments admitted to an official stock exchange listing 252,675,274 252,510,291 100.08
89
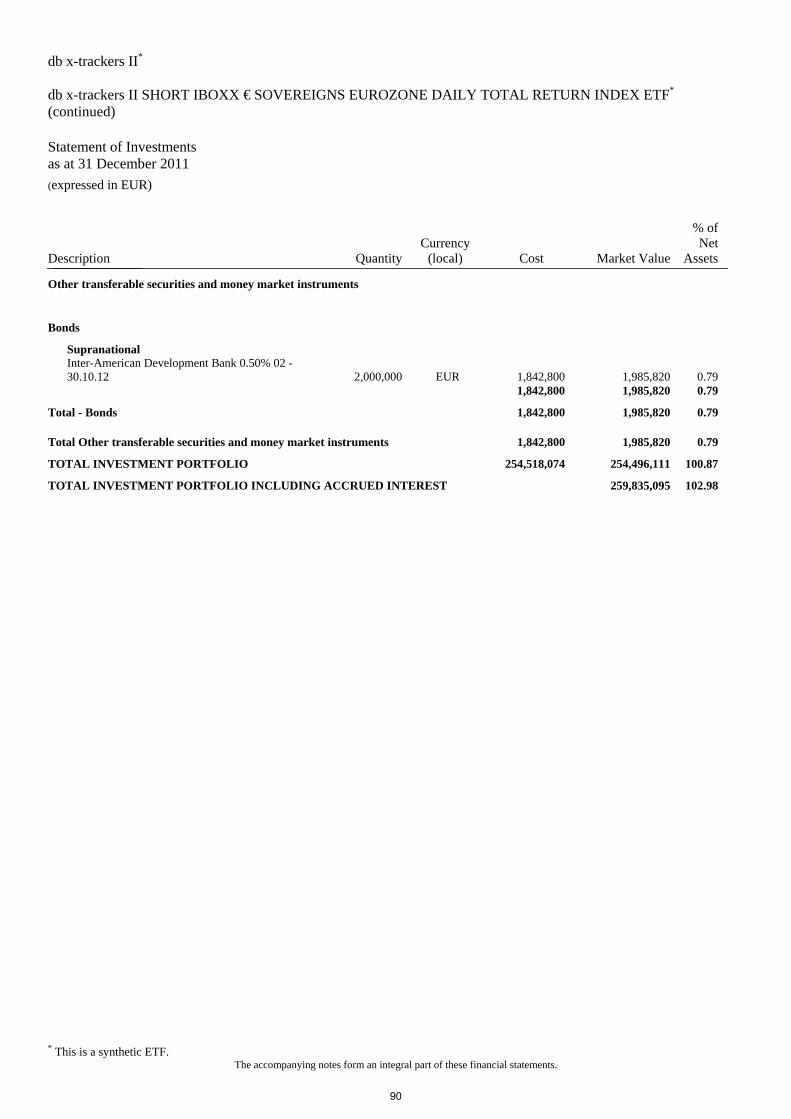
db x-trackers II* db x-trackers II SHORT IBOXX € SOVEREIGNS EUROZONE DAILY TOTAL RETURN INDEX ETF* (continued) Statement of Investments as at 31 December 2011 (expressed in EUR)
* This is a synthetic ETF. The accompanying notes form an integral part of these financial statements.
Description QuantityCurrency
(local) Cost Market Value
% of Net
Assets_______________
Other transferable securities and money market instruments
Bonds
Supranational Inter-American Development Bank 0.50% 02 -
30.10.12 2,000,000 EUR 1,842,800 1,985,820 0.79 1,842,800 1,985,820 0.79
Total - Bonds 1,842,800 1,985,820 0.79
Total Other transferable securities and money market instruments 1,842,800 1,985,820 0.79
TOTAL INVESTMENT PORTFOLIO 254,518,074 254,496,111 100.87
TOTAL INVESTMENT PORTFOLIO INCLUDING ACCRUED INTEREST 259,835,095 102.98
90
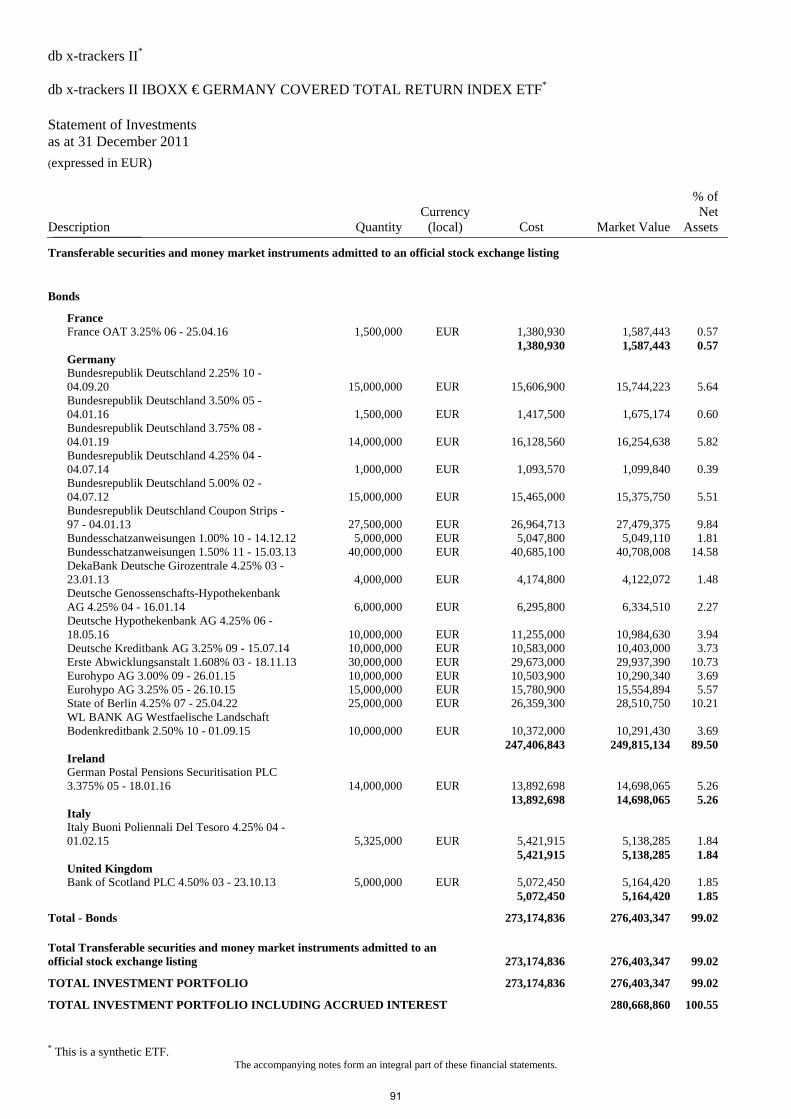
db x-trackers II* db x-trackers II IBOXX € GERMANY COVERED TOTAL RETURN INDEX ETF* Statement of Investments as at 31 December 2011 (expressed in EUR)
* This is a synthetic ETF. The accompanying notes form an integral part of these financial statements.
Description QuantityCurrency
(local) Cost Market Value
% of Net
Assets_______________
Transferable securities and money market instruments admitted to an official stock exchange listing
Bonds
France France OAT 3.25% 06 - 25.04.16 1,500,000 EUR 1,380,930 1,587,443 0.57 1,380,930 1,587,443 0.57 Germany Bundesrepublik Deutschland 2.25% 10 -
04.09.20 15,000,000 EUR 15,606,900 15,744,223 5.64 Bundesrepublik Deutschland 3.50% 05 -
04.01.16 1,500,000 EUR 1,417,500 1,675,174 0.60 Bundesrepublik Deutschland 3.75% 08 -
04.01.19 14,000,000 EUR 16,128,560 16,254,638 5.82 Bundesrepublik Deutschland 4.25% 04 -
04.07.14 1,000,000 EUR 1,093,570 1,099,840 0.39 Bundesrepublik Deutschland 5.00% 02 -
04.07.12 15,000,000 EUR 15,465,000 15,375,750 5.51 Bundesrepublik Deutschland Coupon Strips -
97 - 04.01.13 27,500,000 EUR 26,964,713 27,479,375 9.84 Bundesschatzanweisungen 1.00% 10 - 14.12.12 5,000,000 EUR 5,047,800 5,049,110 1.81 Bundesschatzanweisungen 1.50% 11 - 15.03.13 40,000,000 EUR 40,685,100 40,708,008 14.58 DekaBank Deutsche Girozentrale 4.25% 03 -
23.01.13 4,000,000 EUR 4,174,800 4,122,072 1.48 Deutsche Genossenschafts-Hypothekenbank
AG 4.25% 04 - 16.01.14 6,000,000 EUR 6,295,800 6,334,510 2.27 Deutsche Hypothekenbank AG 4.25% 06 -
18.05.16 10,000,000 EUR 11,255,000 10,984,630 3.94 Deutsche Kreditbank AG 3.25% 09 - 15.07.14 10,000,000 EUR 10,583,000 10,403,000 3.73 Erste Abwicklungsanstalt 1.608% 03 - 18.11.13 30,000,000 EUR 29,673,000 29,937,390 10.73 Eurohypo AG 3.00% 09 - 26.01.15 10,000,000 EUR 10,503,900 10,290,340 3.69 Eurohypo AG 3.25% 05 - 26.10.15 15,000,000 EUR 15,780,900 15,554,894 5.57 State of Berlin 4.25% 07 - 25.04.22 25,000,000 EUR 26,359,300 28,510,750 10.21 WL BANK AG Westfaelische Landschaft
Bodenkreditbank 2.50% 10 - 01.09.15 10,000,000 EUR 10,372,000 10,291,430 3.69 247,406,843 249,815,134 89.50 Ireland German Postal Pensions Securitisation PLC
3.375% 05 - 18.01.16 14,000,000 EUR 13,892,698 14,698,065 5.26 13,892,698 14,698,065 5.26 Italy Italy Buoni Poliennali Del Tesoro 4.25% 04 -
01.02.15 5,325,000 EUR 5,421,915 5,138,285 1.84 5,421,915 5,138,285 1.84 United Kingdom Bank of Scotland PLC 4.50% 03 - 23.10.13 5,000,000 EUR 5,072,450 5,164,420 1.85 5,072,450 5,164,420 1.85
Total - Bonds 273,174,836 276,403,347 99.02
Total Transferable securities and money market instruments admitted to an official stock exchange listing 273,174,836 276,403,347 99.02
TOTAL INVESTMENT PORTFOLIO 273,174,836 276,403,347 99.02
TOTAL INVESTMENT PORTFOLIO INCLUDING ACCRUED INTEREST 280,668,860 100.55
91
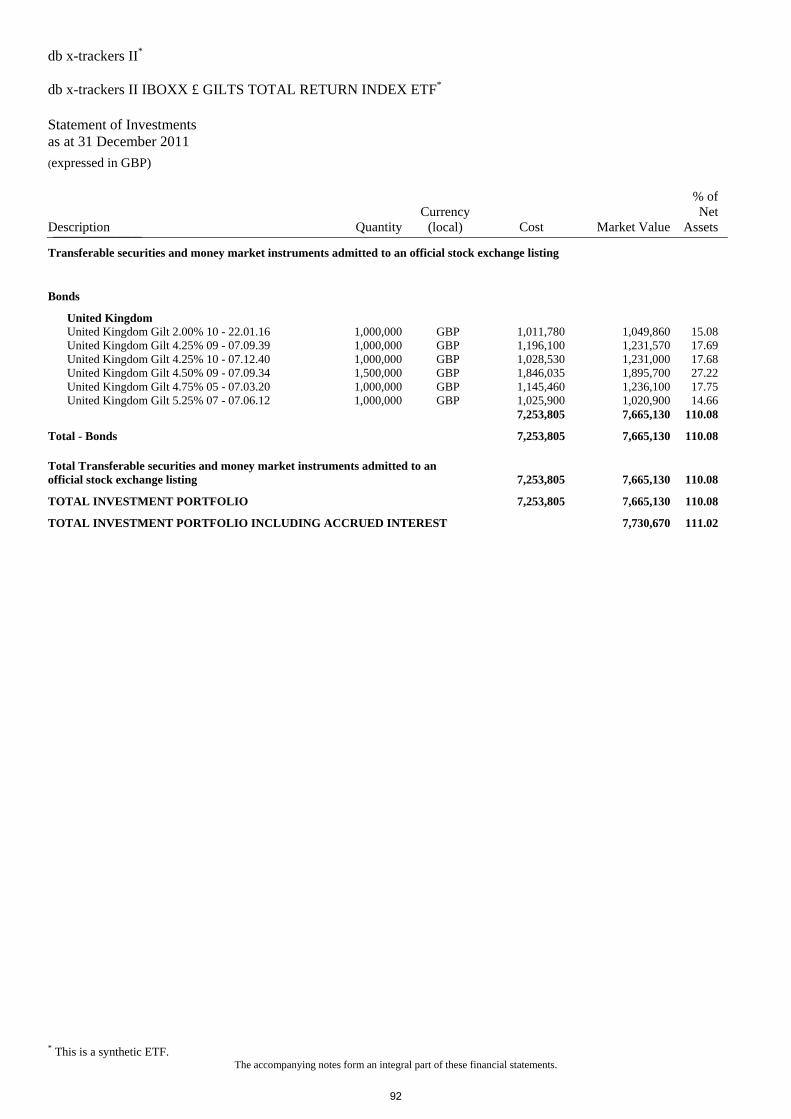
db x-trackers II* db x-trackers II IBOXX £ GILTS TOTAL RETURN INDEX ETF* Statement of Investments as at 31 December 2011 (expressed in GBP)
* This is a synthetic ETF. The accompanying notes form an integral part of these financial statements.
Description QuantityCurrency
(local) Cost Market Value
% of Net
Assets_______________
Transferable securities and money market instruments admitted to an official stock exchange listing
Bonds
United Kingdom United Kingdom Gilt 2.00% 10 - 22.01.16 1,000,000 GBP 1,011,780 1,049,860 15.08 United Kingdom Gilt 4.25% 09 - 07.09.39 1,000,000 GBP 1,196,100 1,231,570 17.69 United Kingdom Gilt 4.25% 10 - 07.12.40 1,000,000 GBP 1,028,530 1,231,000 17.68 United Kingdom Gilt 4.50% 09 - 07.09.34 1,500,000 GBP 1,846,035 1,895,700 27.22 United Kingdom Gilt 4.75% 05 - 07.03.20 1,000,000 GBP 1,145,460 1,236,100 17.75 United Kingdom Gilt 5.25% 07 - 07.06.12 1,000,000 GBP 1,025,900 1,020,900 14.66 7,253,805 7,665,130 110.08
Total - Bonds 7,253,805 7,665,130 110.08
Total Transferable securities and money market instruments admitted to an official stock exchange listing 7,253,805 7,665,130 110.08
TOTAL INVESTMENT PORTFOLIO 7,253,805 7,665,130 110.08
TOTAL INVESTMENT PORTFOLIO INCLUDING ACCRUED INTEREST 7,730,670 111.02
92
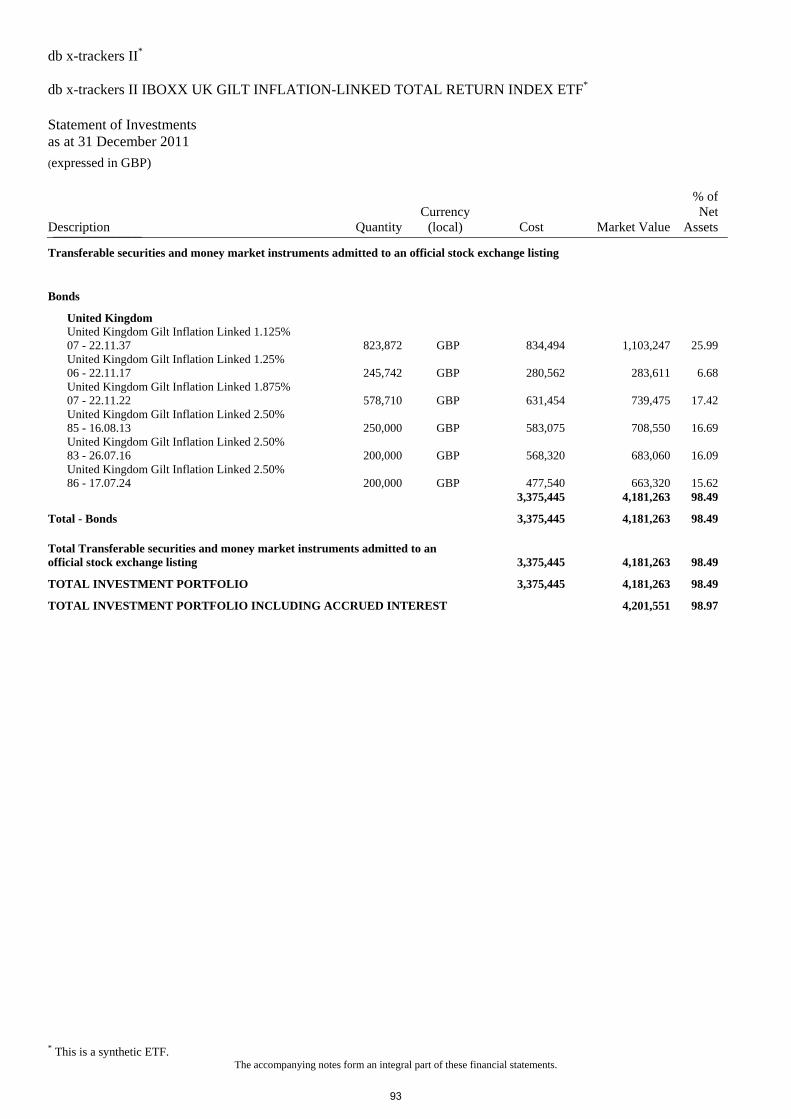
db x-trackers II* db x-trackers II IBOXX UK GILT INFLATION-LINKED TOTAL RETURN INDEX ETF* Statement of Investments as at 31 December 2011 (expressed in GBP)
* This is a synthetic ETF. The accompanying notes form an integral part of these financial statements.
Description QuantityCurrency
(local) Cost Market Value
% of Net
Assets_______________
Transferable securities and money market instruments admitted to an official stock exchange listing
Bonds
United Kingdom United Kingdom Gilt Inflation Linked 1.125%
07 - 22.11.37 823,872 GBP 834,494 1,103,247 25.99 United Kingdom Gilt Inflation Linked 1.25%
06 - 22.11.17 245,742 GBP 280,562 283,611 6.68 United Kingdom Gilt Inflation Linked 1.875%
07 - 22.11.22 578,710 GBP 631,454 739,475 17.42 United Kingdom Gilt Inflation Linked 2.50%
85 - 16.08.13 250,000 GBP 583,075 708,550 16.69 United Kingdom Gilt Inflation Linked 2.50%
83 - 26.07.16 200,000 GBP 568,320 683,060 16.09 United Kingdom Gilt Inflation Linked 2.50%
86 - 17.07.24 200,000 GBP 477,540 663,320 15.62 3,375,445 4,181,263 98.49
Total - Bonds 3,375,445 4,181,263 98.49
Total Transferable securities and money market instruments admitted to an official stock exchange listing 3,375,445 4,181,263 98.49
TOTAL INVESTMENT PORTFOLIO 3,375,445 4,181,263 98.49
TOTAL INVESTMENT PORTFOLIO INCLUDING ACCRUED INTEREST 4,201,551 98.97
93
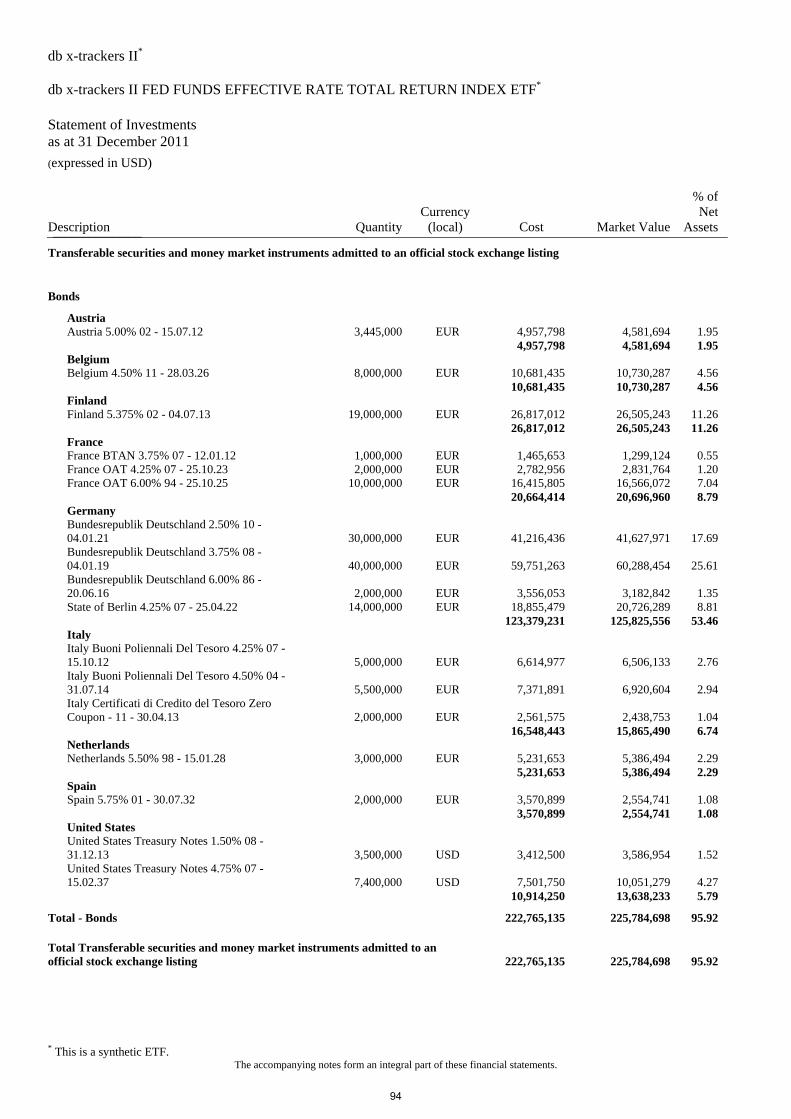
db x-trackers II* db x-trackers II FED FUNDS EFFECTIVE RATE TOTAL RETURN INDEX ETF* Statement of Investments as at 31 December 2011 (expressed in USD)
* This is a synthetic ETF. The accompanying notes form an integral part of these financial statements.
Description QuantityCurrency
(local) Cost Market Value
% of Net
Assets_______________
Transferable securities and money market instruments admitted to an official stock exchange listing
Bonds
Austria Austria 5.00% 02 - 15.07.12 3,445,000 EUR 4,957,798 4,581,694 1.95 4,957,798 4,581,694 1.95 Belgium Belgium 4.50% 11 - 28.03.26 8,000,000 EUR 10,681,435 10,730,287 4.56 10,681,435 10,730,287 4.56 Finland Finland 5.375% 02 - 04.07.13 19,000,000 EUR 26,817,012 26,505,243 11.26 26,817,012 26,505,243 11.26 France France BTAN 3.75% 07 - 12.01.12 1,000,000 EUR 1,465,653 1,299,124 0.55 France OAT 4.25% 07 - 25.10.23 2,000,000 EUR 2,782,956 2,831,764 1.20 France OAT 6.00% 94 - 25.10.25 10,000,000 EUR 16,415,805 16,566,072 7.04 20,664,414 20,696,960 8.79 Germany Bundesrepublik Deutschland 2.50% 10 -
04.01.21 30,000,000 EUR 41,216,436 41,627,971 17.69 Bundesrepublik Deutschland 3.75% 08 -
04.01.19 40,000,000 EUR 59,751,263 60,288,454 25.61 Bundesrepublik Deutschland 6.00% 86 -
20.06.16 2,000,000 EUR 3,556,053 3,182,842 1.35 State of Berlin 4.25% 07 - 25.04.22 14,000,000 EUR 18,855,479 20,726,289 8.81 123,379,231 125,825,556 53.46 Italy Italy Buoni Poliennali Del Tesoro 4.25% 07 -
15.10.12 5,000,000 EUR 6,614,977 6,506,133 2.76 Italy Buoni Poliennali Del Tesoro 4.50% 04 -
31.07.14 5,500,000 EUR 7,371,891 6,920,604 2.94 Italy Certificati di Credito del Tesoro Zero
Coupon - 11 - 30.04.13 2,000,000 EUR 2,561,575 2,438,753 1.04 16,548,443 15,865,490 6.74 Netherlands Netherlands 5.50% 98 - 15.01.28 3,000,000 EUR 5,231,653 5,386,494 2.29 5,231,653 5,386,494 2.29 Spain Spain 5.75% 01 - 30.07.32 2,000,000 EUR 3,570,899 2,554,741 1.08 3,570,899 2,554,741 1.08 United States United States Treasury Notes 1.50% 08 -
31.12.13 3,500,000 USD 3,412,500 3,586,954 1.52 United States Treasury Notes 4.75% 07 -
15.02.37 7,400,000 USD 7,501,750 10,051,279 4.27 10,914,250 13,638,233 5.79
Total - Bonds 222,765,135 225,784,698 95.92
Total Transferable securities and money market instruments admitted to an official stock exchange listing 222,765,135 225,784,698 95.92
94

db x-trackers II* db x-trackers II FED FUNDS EFFECTIVE RATE TOTAL RETURN INDEX ETF* (continued) Statement of Investments as at 31 December 2011 (expressed in USD)
* This is a synthetic ETF. The accompanying notes form an integral part of these financial statements.
Description QuantityCurrency
(local) Cost Market Value
% of Net
Assets_______________
Other transferable securities and money market instruments
Bonds
Germany Landesbank Baden-Wuerttemberg 7.625% 93 -
01.02.23 5,000,000 USD 6,777,500 6,510,970 2.77 6,777,500 6,510,970 2.77 Supranational Inter-American Development Bank 0.50% 02 -
30.10.12 4,000,000 EUR 5,695,631 5,155,784 2.19 5,695,631 5,155,784 2.19
Total - Bonds 12,473,131 11,666,754 4.96
Total Other transferable securities and money market instruments 12,473,131 11,666,754 4.96
TOTAL INVESTMENT PORTFOLIO 235,238,266 237,451,452 100.88
TOTAL INVESTMENT PORTFOLIO INCLUDING ACCRUED INTEREST 243,052,920 103.26
95
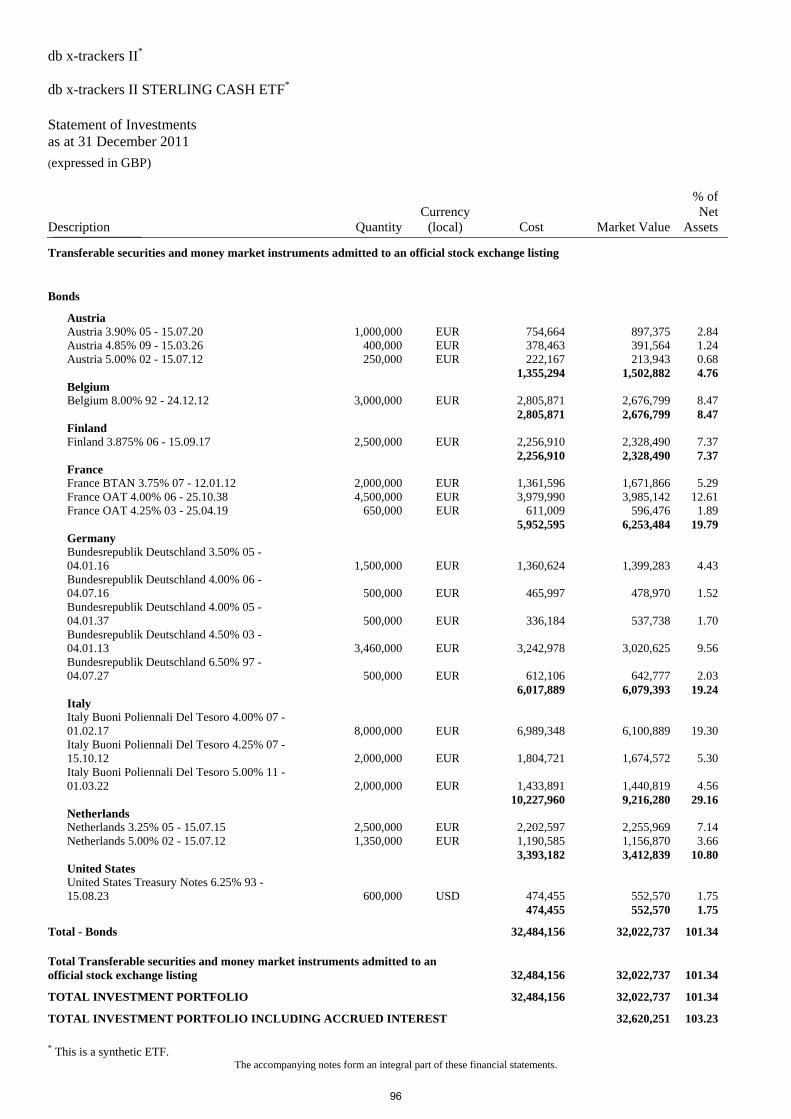
db x-trackers II* db x-trackers II STERLING CASH ETF* Statement of Investments as at 31 December 2011 (expressed in GBP)
* This is a synthetic ETF. The accompanying notes form an integral part of these financial statements.
Description QuantityCurrency
(local) Cost Market Value
% of Net
Assets_______________
Transferable securities and money market instruments admitted to an official stock exchange listing
Bonds
Austria Austria 3.90% 05 - 15.07.20 1,000,000 EUR 754,664 897,375 2.84 Austria 4.85% 09 - 15.03.26 400,000 EUR 378,463 391,564 1.24 Austria 5.00% 02 - 15.07.12 250,000 EUR 222,167 213,943 0.68 1,355,294 1,502,882 4.76 Belgium Belgium 8.00% 92 - 24.12.12 3,000,000 EUR 2,805,871 2,676,799 8.47 2,805,871 2,676,799 8.47 Finland Finland 3.875% 06 - 15.09.17 2,500,000 EUR 2,256,910 2,328,490 7.37 2,256,910 2,328,490 7.37 France France BTAN 3.75% 07 - 12.01.12 2,000,000 EUR 1,361,596 1,671,866 5.29 France OAT 4.00% 06 - 25.10.38 4,500,000 EUR 3,979,990 3,985,142 12.61 France OAT 4.25% 03 - 25.04.19 650,000 EUR 611,009 596,476 1.89 5,952,595 6,253,484 19.79 Germany Bundesrepublik Deutschland 3.50% 05 -
04.01.16 1,500,000 EUR 1,360,624 1,399,283 4.43 Bundesrepublik Deutschland 4.00% 06 -
04.07.16 500,000 EUR 465,997 478,970 1.52 Bundesrepublik Deutschland 4.00% 05 -
04.01.37 500,000 EUR 336,184 537,738 1.70 Bundesrepublik Deutschland 4.50% 03 -
04.01.13 3,460,000 EUR 3,242,978 3,020,625 9.56 Bundesrepublik Deutschland 6.50% 97 -
04.07.27 500,000 EUR 612,106 642,777 2.03 6,017,889 6,079,393 19.24 Italy Italy Buoni Poliennali Del Tesoro 4.00% 07 -
01.02.17 8,000,000 EUR 6,989,348 6,100,889 19.30 Italy Buoni Poliennali Del Tesoro 4.25% 07 -
15.10.12 2,000,000 EUR 1,804,721 1,674,572 5.30 Italy Buoni Poliennali Del Tesoro 5.00% 11 -
01.03.22 2,000,000 EUR 1,433,891 1,440,819 4.56 10,227,960 9,216,280 29.16 Netherlands Netherlands 3.25% 05 - 15.07.15 2,500,000 EUR 2,202,597 2,255,969 7.14 Netherlands 5.00% 02 - 15.07.12 1,350,000 EUR 1,190,585 1,156,870 3.66 3,393,182 3,412,839 10.80 United States United States Treasury Notes 6.25% 93 -
15.08.23 600,000 USD 474,455 552,570 1.75 474,455 552,570 1.75
Total - Bonds 32,484,156 32,022,737 101.34
Total Transferable securities and money market instruments admitted to an official stock exchange listing 32,484,156 32,022,737 101.34
TOTAL INVESTMENT PORTFOLIO 32,484,156 32,022,737 101.34
TOTAL INVESTMENT PORTFOLIO INCLUDING ACCRUED INTEREST 32,620,251 103.23
96
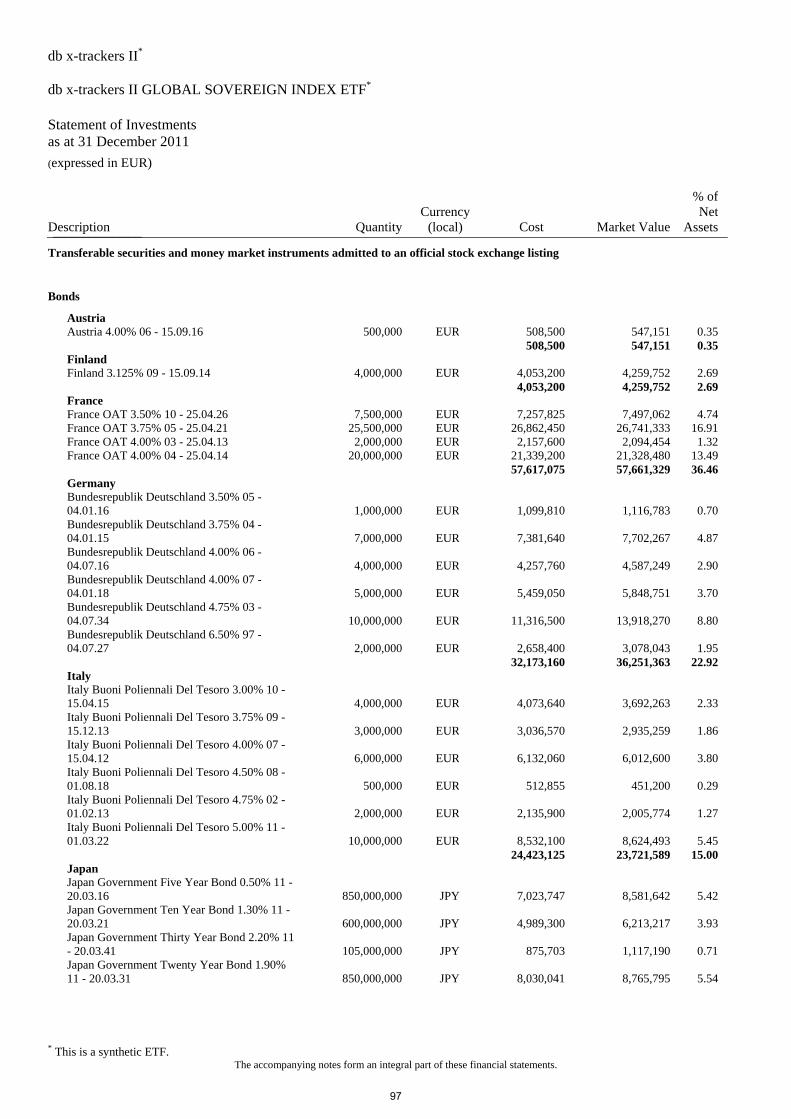
db x-trackers II* db x-trackers II GLOBAL SOVEREIGN INDEX ETF* Statement of Investments as at 31 December 2011 (expressed in EUR)
* This is a synthetic ETF. The accompanying notes form an integral part of these financial statements.
Description QuantityCurrency
(local) Cost Market Value
% of Net
Assets_______________
Transferable securities and money market instruments admitted to an official stock exchange listing
Bonds
Austria Austria 4.00% 06 - 15.09.16 500,000 EUR 508,500 547,151 0.35 508,500 547,151 0.35 Finland Finland 3.125% 09 - 15.09.14 4,000,000 EUR 4,053,200 4,259,752 2.69 4,053,200 4,259,752 2.69 France France OAT 3.50% 10 - 25.04.26 7,500,000 EUR 7,257,825 7,497,062 4.74 France OAT 3.75% 05 - 25.04.21 25,500,000 EUR 26,862,450 26,741,333 16.91 France OAT 4.00% 03 - 25.04.13 2,000,000 EUR 2,157,600 2,094,454 1.32 France OAT 4.00% 04 - 25.04.14 20,000,000 EUR 21,339,200 21,328,480 13.49 57,617,075 57,661,329 36.46 Germany Bundesrepublik Deutschland 3.50% 05 -
04.01.16 1,000,000 EUR 1,099,810 1,116,783 0.70 Bundesrepublik Deutschland 3.75% 04 -
04.01.15 7,000,000 EUR 7,381,640 7,702,267 4.87 Bundesrepublik Deutschland 4.00% 06 -
04.07.16 4,000,000 EUR 4,257,760 4,587,249 2.90 Bundesrepublik Deutschland 4.00% 07 -
04.01.18 5,000,000 EUR 5,459,050 5,848,751 3.70 Bundesrepublik Deutschland 4.75% 03 -
04.07.34 10,000,000 EUR 11,316,500 13,918,270 8.80 Bundesrepublik Deutschland 6.50% 97 -
04.07.27 2,000,000 EUR 2,658,400 3,078,043 1.95 32,173,160 36,251,363 22.92 Italy Italy Buoni Poliennali Del Tesoro 3.00% 10 -
15.04.15 4,000,000 EUR 4,073,640 3,692,263 2.33 Italy Buoni Poliennali Del Tesoro 3.75% 09 -
15.12.13 3,000,000 EUR 3,036,570 2,935,259 1.86 Italy Buoni Poliennali Del Tesoro 4.00% 07 -
15.04.12 6,000,000 EUR 6,132,060 6,012,600 3.80 Italy Buoni Poliennali Del Tesoro 4.50% 08 -
01.08.18 500,000 EUR 512,855 451,200 0.29 Italy Buoni Poliennali Del Tesoro 4.75% 02 -
01.02.13 2,000,000 EUR 2,135,900 2,005,774 1.27 Italy Buoni Poliennali Del Tesoro 5.00% 11 -
01.03.22 10,000,000 EUR 8,532,100 8,624,493 5.45 24,423,125 23,721,589 15.00 Japan Japan Government Five Year Bond 0.50% 11 -
20.03.16 850,000,000 JPY 7,023,747 8,581,642 5.42 Japan Government Ten Year Bond 1.30% 11 -
20.03.21 600,000,000 JPY 4,989,300 6,213,217 3.93 Japan Government Thirty Year Bond 2.20% 11
- 20.03.41 105,000,000 JPY 875,703 1,117,190 0.71 Japan Government Twenty Year Bond 1.90%
11 - 20.03.31 850,000,000 JPY 8,030,041 8,765,795 5.54
97
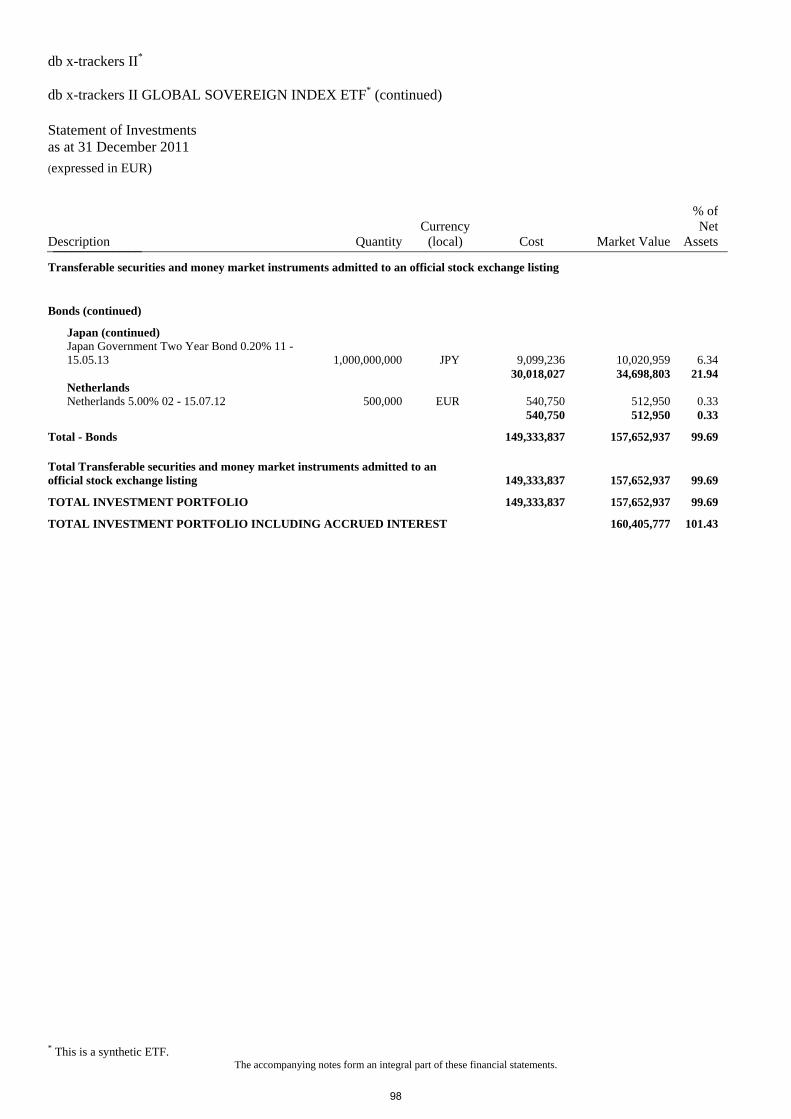
db x-trackers II* db x-trackers II GLOBAL SOVEREIGN INDEX ETF* (continued) Statement of Investments as at 31 December 2011 (expressed in EUR)
* This is a synthetic ETF. The accompanying notes form an integral part of these financial statements.
Description QuantityCurrency
(local) Cost Market Value
% of Net
Assets_______________
Transferable securities and money market instruments admitted to an official stock exchange listing
Bonds (continued)
Japan (continued) Japan Government Two Year Bond 0.20% 11 -
15.05.13 1,000,000,000 JPY 9,099,236 10,020,959 6.34 30,018,027 34,698,803 21.94 Netherlands Netherlands 5.00% 02 - 15.07.12 500,000 EUR 540,750 512,950 0.33 540,750 512,950 0.33
Total - Bonds 149,333,837 157,652,937 99.69
Total Transferable securities and money market instruments admitted to an official stock exchange listing 149,333,837 157,652,937 99.69
TOTAL INVESTMENT PORTFOLIO 149,333,837 157,652,937 99.69
TOTAL INVESTMENT PORTFOLIO INCLUDING ACCRUED INTEREST 160,405,777 101.43
98
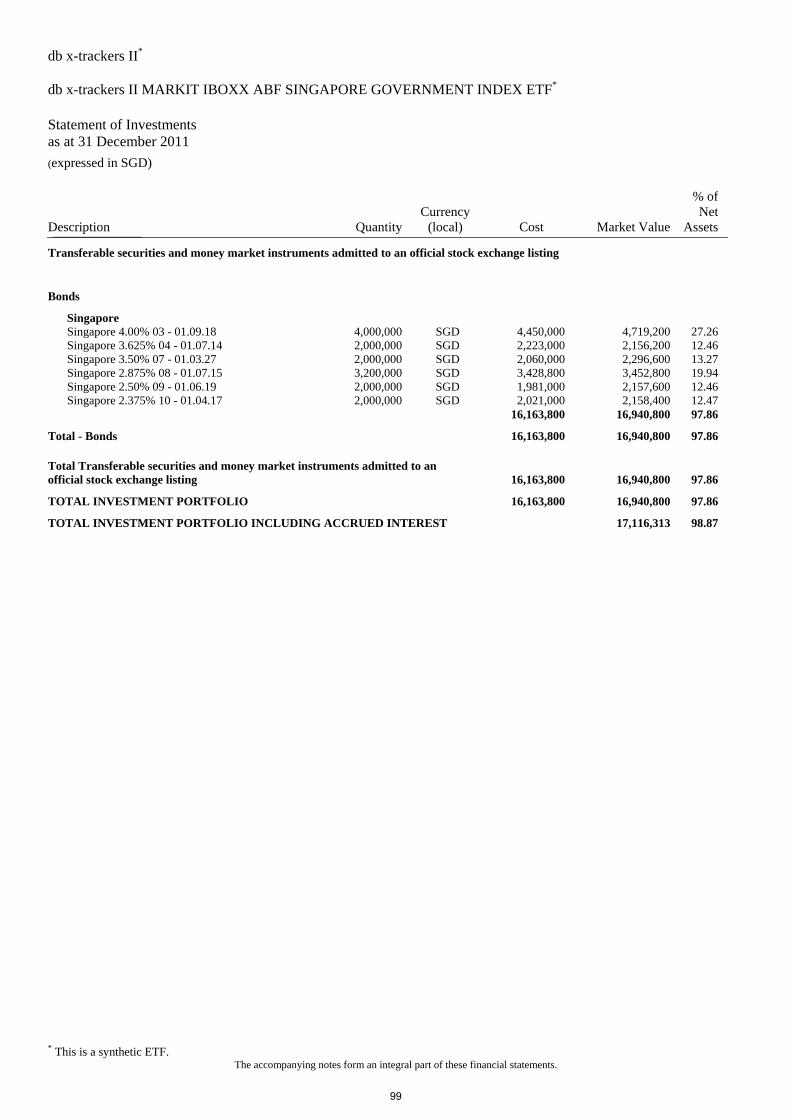
db x-trackers II* db x-trackers II MARKIT IBOXX ABF SINGAPORE GOVERNMENT INDEX ETF* Statement of Investments as at 31 December 2011 (expressed in SGD)
* This is a synthetic ETF. The accompanying notes form an integral part of these financial statements.
Description QuantityCurrency
(local) Cost Market Value
% of Net
Assets_______________
Transferable securities and money market instruments admitted to an official stock exchange listing
Bonds
Singapore Singapore 4.00% 03 - 01.09.18 4,000,000 SGD 4,450,000 4,719,200 27.26 Singapore 3.625% 04 - 01.07.14 2,000,000 SGD 2,223,000 2,156,200 12.46 Singapore 3.50% 07 - 01.03.27 2,000,000 SGD 2,060,000 2,296,600 13.27 Singapore 2.875% 08 - 01.07.15 3,200,000 SGD 3,428,800 3,452,800 19.94 Singapore 2.50% 09 - 01.06.19 2,000,000 SGD 1,981,000 2,157,600 12.46 Singapore 2.375% 10 - 01.04.17 2,000,000 SGD 2,021,000 2,158,400 12.47 16,163,800 16,940,800 97.86
Total - Bonds 16,163,800 16,940,800 97.86
Total Transferable securities and money market instruments admitted to an official stock exchange listing 16,163,800 16,940,800 97.86
TOTAL INVESTMENT PORTFOLIO 16,163,800 16,940,800 97.86
TOTAL INVESTMENT PORTFOLIO INCLUDING ACCRUED INTEREST 17,116,313 98.87
99

db x-trackers II* db x-trackers II EURO INTEREST RATES VOLATILITY TOTAL RETURN INDEX ETF* Statement of Investments as at 31 December 2011 (expressed in EUR)
* This is a synthetic ETF. The accompanying notes form an integral part of these financial statements.
Description QuantityCurrency
(local) Cost Market Value
% of Net
Assets_______________
Transferable securities and money market instruments admitted to an official stock exchange listing
Bonds
Belgium Belgium 4.25% 03 - 28.09.13 1,500,000 EUR 1,595,085 1,549,778 17.13 1,595,085 1,549,778 17.13 France France OAT 4.00% 03 - 25.04.13 1,000,000 EUR 1,064,300 1,047,227 11.58 1,064,300 1,047,227 11.58 Germany Bundesrepublik Deutschland 3.25% 10 -
04.07.42 1,000,000 EUR 1,152,420 1,190,775 13.17 Bundesrepublik Deutschland 4.00% 07 -
04.01.18 2,000,000 EUR 2,183,620 2,339,501 25.86 Bundesrepublik Deutschland 6.25% 00 -
04.01.30 1,500,000 EUR 2,165,055 2,316,364 25.61 Bundesschatzanweisungen 1.00% 10 - 14.12.12 500,000 EUR 499,160 504,911 5.58 6,000,255 6,351,551 70.22 Ireland Ireland 4.60% 99 - 18.04.16 500,000 EUR 445,550 446,544 4.94 445,550 446,544 4.94
Total - Bonds 9,105,190 9,395,100 103.87
Total Transferable securities and money market instruments admitted to an official stock exchange listing 9,105,190 9,395,100 103.87
TOTAL INVESTMENT PORTFOLIO 9,105,190 9,395,100 103.87
TOTAL INVESTMENT PORTFOLIO INCLUDING ACCRUED INTEREST 9,643,932 106.62
100
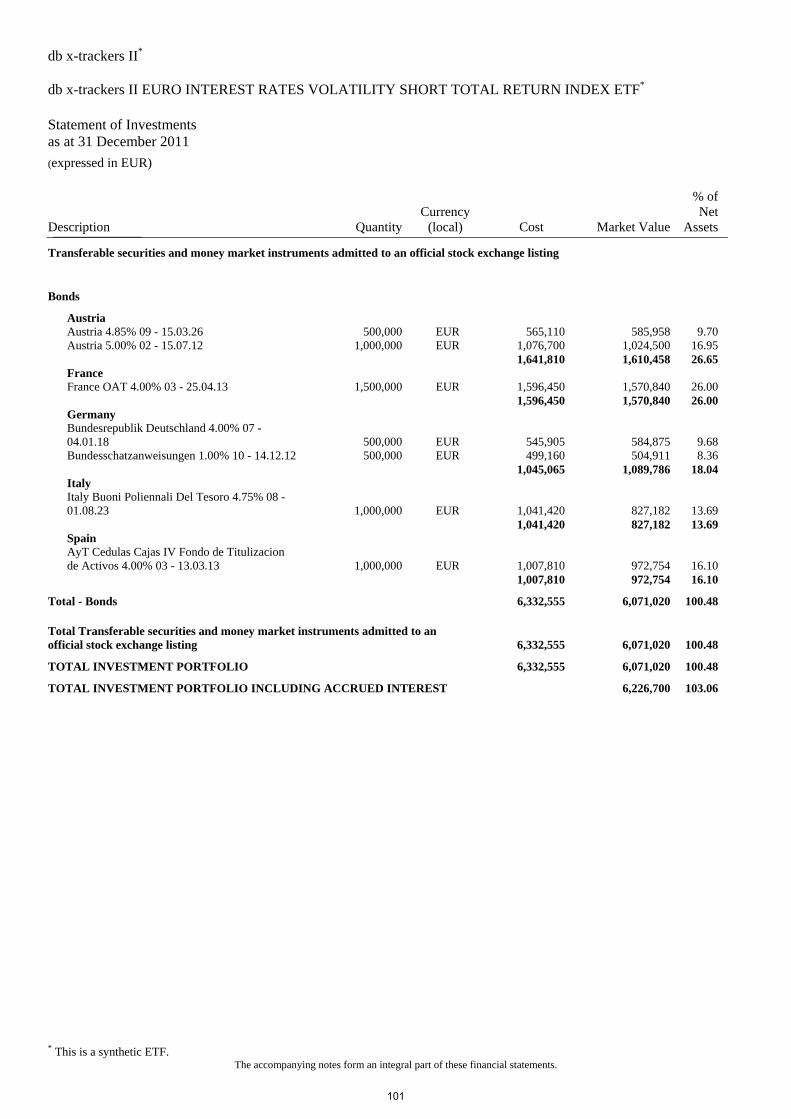
db x-trackers II* db x-trackers II EURO INTEREST RATES VOLATILITY SHORT TOTAL RETURN INDEX ETF* Statement of Investments as at 31 December 2011 (expressed in EUR)
* This is a synthetic ETF. The accompanying notes form an integral part of these financial statements.
Description QuantityCurrency
(local) Cost Market Value
% of Net
Assets_______________
Transferable securities and money market instruments admitted to an official stock exchange listing
Bonds
Austria Austria 4.85% 09 - 15.03.26 500,000 EUR 565,110 585,958 9.70 Austria 5.00% 02 - 15.07.12 1,000,000 EUR 1,076,700 1,024,500 16.95 1,641,810 1,610,458 26.65 France France OAT 4.00% 03 - 25.04.13 1,500,000 EUR 1,596,450 1,570,840 26.00 1,596,450 1,570,840 26.00 Germany Bundesrepublik Deutschland 4.00% 07 -
04.01.18 500,000 EUR 545,905 584,875 9.68 Bundesschatzanweisungen 1.00% 10 - 14.12.12 500,000 EUR 499,160 504,911 8.36 1,045,065 1,089,786 18.04 Italy Italy Buoni Poliennali Del Tesoro 4.75% 08 -
01.08.23 1,000,000 EUR 1,041,420 827,182 13.69 1,041,420 827,182 13.69 Spain AyT Cedulas Cajas IV Fondo de Titulizacion
de Activos 4.00% 03 - 13.03.13 1,000,000 EUR 1,007,810 972,754 16.10 1,007,810 972,754 16.10
Total - Bonds 6,332,555 6,071,020 100.48
Total Transferable securities and money market instruments admitted to an official stock exchange listing 6,332,555 6,071,020 100.48
TOTAL INVESTMENT PORTFOLIO 6,332,555 6,071,020 100.48
TOTAL INVESTMENT PORTFOLIO INCLUDING ACCRUED INTEREST 6,226,700 103.06
101
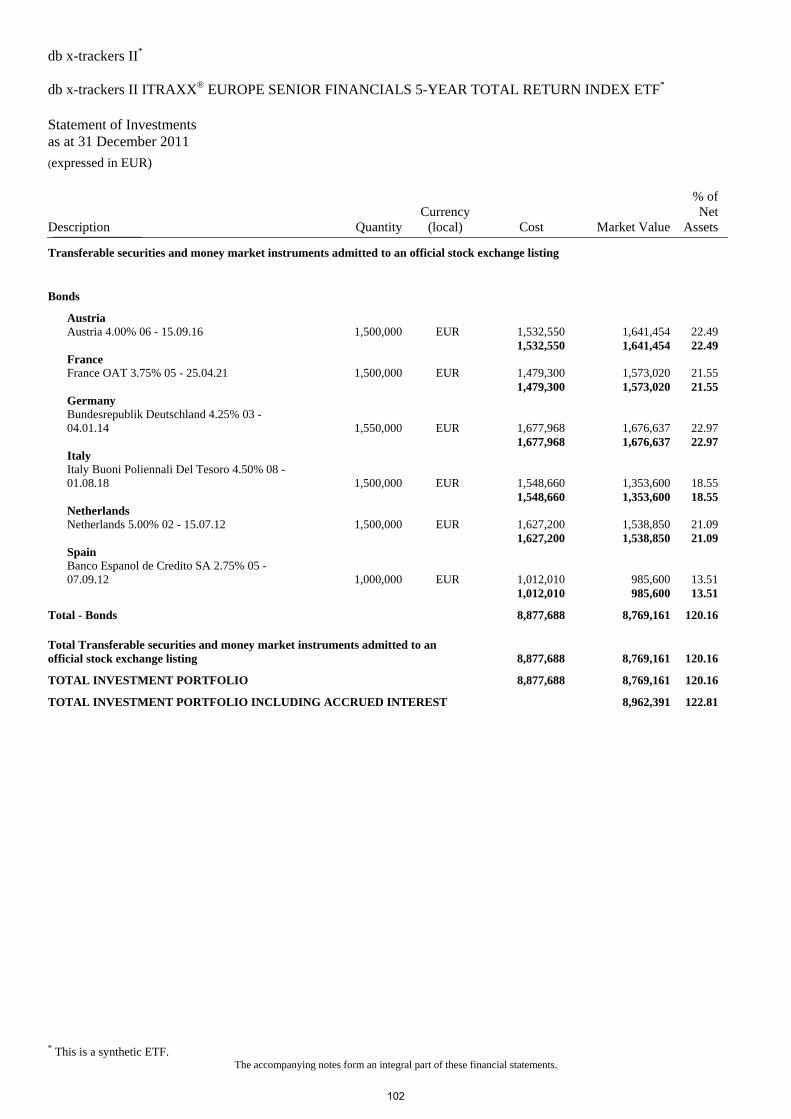
db x-trackers II* db x-trackers II ITRAXX® EUROPE SENIOR FINANCIALS 5-YEAR TOTAL RETURN INDEX ETF* Statement of Investments as at 31 December 2011 (expressed in EUR)
* This is a synthetic ETF. The accompanying notes form an integral part of these financial statements.
Description QuantityCurrency
(local) Cost Market Value
% of Net
Assets_______________
Transferable securities and money market instruments admitted to an official stock exchange listing
Bonds
Austria Austria 4.00% 06 - 15.09.16 1,500,000 EUR 1,532,550 1,641,454 22.49 1,532,550 1,641,454 22.49 France France OAT 3.75% 05 - 25.04.21 1,500,000 EUR 1,479,300 1,573,020 21.55 1,479,300 1,573,020 21.55 Germany Bundesrepublik Deutschland 4.25% 03 -
04.01.14 1,550,000 EUR 1,677,968 1,676,637 22.97 1,677,968 1,676,637 22.97 Italy Italy Buoni Poliennali Del Tesoro 4.50% 08 -
01.08.18 1,500,000 EUR 1,548,660 1,353,600 18.55 1,548,660 1,353,600 18.55 Netherlands Netherlands 5.00% 02 - 15.07.12 1,500,000 EUR 1,627,200 1,538,850 21.09 1,627,200 1,538,850 21.09 Spain Banco Espanol de Credito SA 2.75% 05 -
07.09.12 1,000,000 EUR 1,012,010 985,600 13.51 1,012,010 985,600 13.51
Total - Bonds 8,877,688 8,769,161 120.16
Total Transferable securities and money market instruments admitted to an official stock exchange listing 8,877,688 8,769,161 120.16
TOTAL INVESTMENT PORTFOLIO 8,877,688 8,769,161 120.16
TOTAL INVESTMENT PORTFOLIO INCLUDING ACCRUED INTEREST 8,962,391 122.81
102
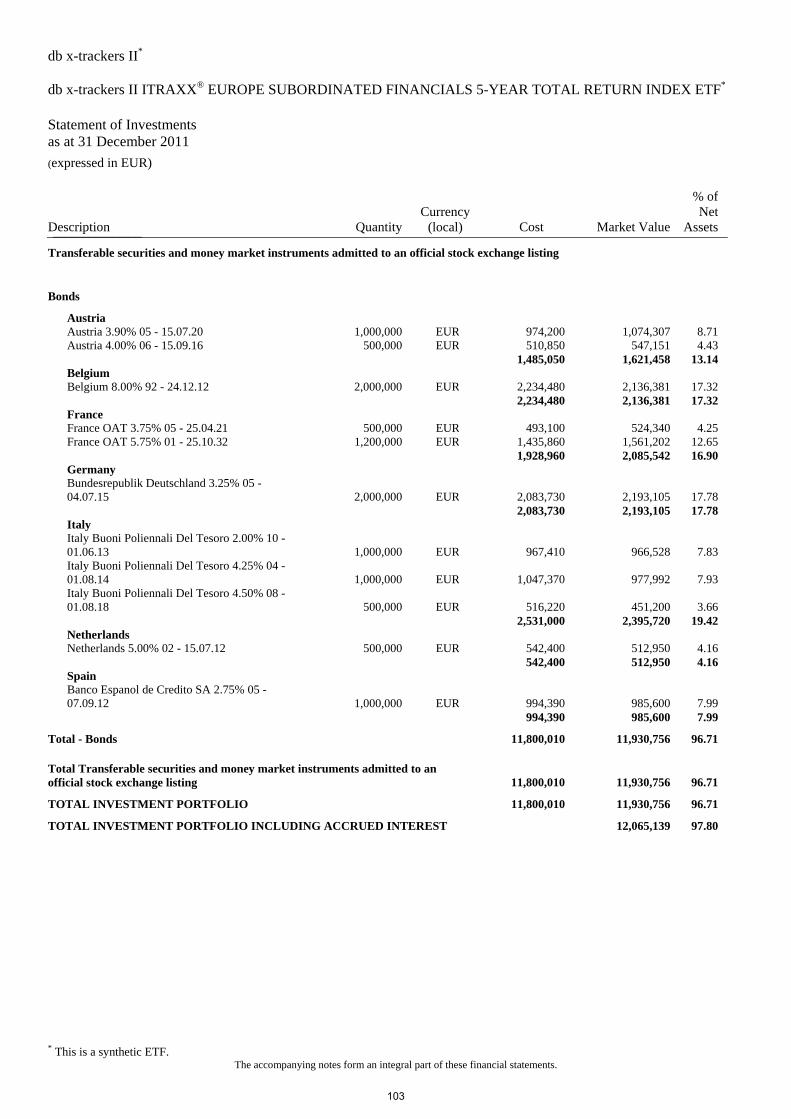
db x-trackers II* db x-trackers II ITRAXX® EUROPE SUBORDINATED FINANCIALS 5-YEAR TOTAL RETURN INDEX ETF* Statement of Investments as at 31 December 2011 (expressed in EUR)
* This is a synthetic ETF. The accompanying notes form an integral part of these financial statements.
Description QuantityCurrency
(local) Cost Market Value
% of Net
Assets_______________
Transferable securities and money market instruments admitted to an official stock exchange listing
Bonds
Austria Austria 3.90% 05 - 15.07.20 1,000,000 EUR 974,200 1,074,307 8.71 Austria 4.00% 06 - 15.09.16 500,000 EUR 510,850 547,151 4.43 1,485,050 1,621,458 13.14 Belgium Belgium 8.00% 92 - 24.12.12 2,000,000 EUR 2,234,480 2,136,381 17.32 2,234,480 2,136,381 17.32 France France OAT 3.75% 05 - 25.04.21 500,000 EUR 493,100 524,340 4.25 France OAT 5.75% 01 - 25.10.32 1,200,000 EUR 1,435,860 1,561,202 12.65 1,928,960 2,085,542 16.90 Germany Bundesrepublik Deutschland 3.25% 05 -
04.07.15 2,000,000 EUR 2,083,730 2,193,105 17.78 2,083,730 2,193,105 17.78 Italy Italy Buoni Poliennali Del Tesoro 2.00% 10 -
01.06.13 1,000,000 EUR 967,410 966,528 7.83 Italy Buoni Poliennali Del Tesoro 4.25% 04 -
01.08.14 1,000,000 EUR 1,047,370 977,992 7.93 Italy Buoni Poliennali Del Tesoro 4.50% 08 -
01.08.18 500,000 EUR 516,220 451,200 3.66 2,531,000 2,395,720 19.42 Netherlands Netherlands 5.00% 02 - 15.07.12 500,000 EUR 542,400 512,950 4.16 542,400 512,950 4.16 Spain Banco Espanol de Credito SA 2.75% 05 -
07.09.12 1,000,000 EUR 994,390 985,600 7.99 994,390 985,600 7.99
Total - Bonds 11,800,010 11,930,756 96.71
Total Transferable securities and money market instruments admitted to an official stock exchange listing 11,800,010 11,930,756 96.71
TOTAL INVESTMENT PORTFOLIO 11,800,010 11,930,756 96.71
TOTAL INVESTMENT PORTFOLIO INCLUDING ACCRUED INTEREST 12,065,139 97.80
103
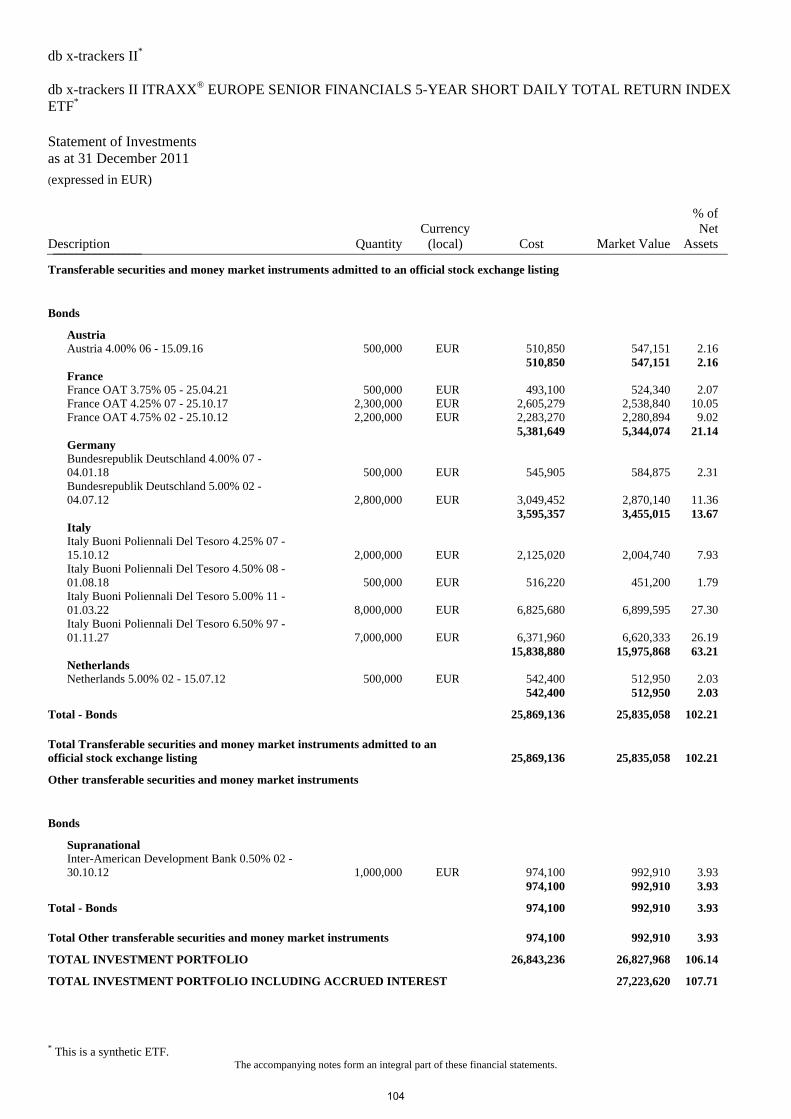
db x-trackers II* db x-trackers II ITRAXX® EUROPE SENIOR FINANCIALS 5-YEAR SHORT DAILY TOTAL RETURN INDEX ETF* Statement of Investments as at 31 December 2011 (expressed in EUR)
* This is a synthetic ETF. The accompanying notes form an integral part of these financial statements.
Description QuantityCurrency
(local) Cost Market Value
% of Net
Assets_______________
Transferable securities and money market instruments admitted to an official stock exchange listing
Bonds
Austria Austria 4.00% 06 - 15.09.16 500,000 EUR 510,850 547,151 2.16 510,850 547,151 2.16 France France OAT 3.75% 05 - 25.04.21 500,000 EUR 493,100 524,340 2.07 France OAT 4.25% 07 - 25.10.17 2,300,000 EUR 2,605,279 2,538,840 10.05 France OAT 4.75% 02 - 25.10.12 2,200,000 EUR 2,283,270 2,280,894 9.02 5,381,649 5,344,074 21.14 Germany Bundesrepublik Deutschland 4.00% 07 -
04.01.18 500,000 EUR 545,905 584,875 2.31 Bundesrepublik Deutschland 5.00% 02 -
04.07.12 2,800,000 EUR 3,049,452 2,870,140 11.36 3,595,357 3,455,015 13.67 Italy Italy Buoni Poliennali Del Tesoro 4.25% 07 -
15.10.12 2,000,000 EUR 2,125,020 2,004,740 7.93 Italy Buoni Poliennali Del Tesoro 4.50% 08 -
01.08.18 500,000 EUR 516,220 451,200 1.79 Italy Buoni Poliennali Del Tesoro 5.00% 11 -
01.03.22 8,000,000 EUR 6,825,680 6,899,595 27.30 Italy Buoni Poliennali Del Tesoro 6.50% 97 -
01.11.27 7,000,000 EUR 6,371,960 6,620,333 26.19 15,838,880 15,975,868 63.21 Netherlands Netherlands 5.00% 02 - 15.07.12 500,000 EUR 542,400 512,950 2.03 542,400 512,950 2.03
Total - Bonds 25,869,136 25,835,058 102.21
Total Transferable securities and money market instruments admitted to an official stock exchange listing 25,869,136 25,835,058 102.21
Other transferable securities and money market instruments
Bonds
Supranational Inter-American Development Bank 0.50% 02 -
30.10.12 1,000,000 EUR 974,100 992,910 3.93 974,100 992,910 3.93
Total - Bonds 974,100 992,910 3.93
Total Other transferable securities and money market instruments 974,100 992,910 3.93
TOTAL INVESTMENT PORTFOLIO 26,843,236 26,827,968 106.14
TOTAL INVESTMENT PORTFOLIO INCLUDING ACCRUED INTEREST 27,223,620 107.71
104
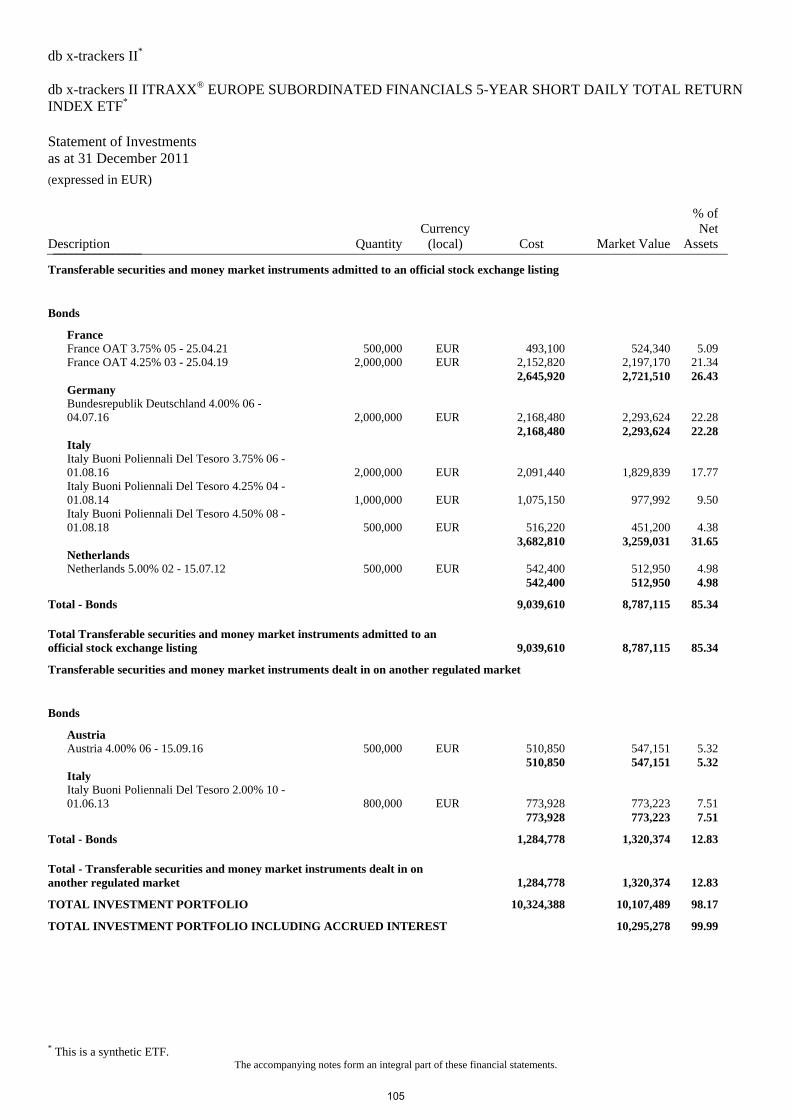
db x-trackers II* db x-trackers II ITRAXX® EUROPE SUBORDINATED FINANCIALS 5-YEAR SHORT DAILY TOTAL RETURN INDEX ETF* Statement of Investments as at 31 December 2011 (expressed in EUR)
* This is a synthetic ETF. The accompanying notes form an integral part of these financial statements.
Description QuantityCurrency
(local) Cost Market Value
% of Net
Assets_______________
Transferable securities and money market instruments admitted to an official stock exchange listing
Bonds
France France OAT 3.75% 05 - 25.04.21 500,000 EUR 493,100 524,340 5.09 France OAT 4.25% 03 - 25.04.19 2,000,000 EUR 2,152,820 2,197,170 21.34 2,645,920 2,721,510 26.43 Germany Bundesrepublik Deutschland 4.00% 06 -
04.07.16 2,000,000 EUR 2,168,480 2,293,624 22.28 2,168,480 2,293,624 22.28 Italy Italy Buoni Poliennali Del Tesoro 3.75% 06 -
01.08.16 2,000,000 EUR 2,091,440 1,829,839 17.77 Italy Buoni Poliennali Del Tesoro 4.25% 04 -
01.08.14 1,000,000 EUR 1,075,150 977,992 9.50 Italy Buoni Poliennali Del Tesoro 4.50% 08 -
01.08.18 500,000 EUR 516,220 451,200 4.38 3,682,810 3,259,031 31.65 Netherlands Netherlands 5.00% 02 - 15.07.12 500,000 EUR 542,400 512,950 4.98 542,400 512,950 4.98
Total - Bonds 9,039,610 8,787,115 85.34
Total Transferable securities and money market instruments admitted to an official stock exchange listing 9,039,610 8,787,115 85.34
Transferable securities and money market instruments dealt in on another regulated market
Bonds
Austria Austria 4.00% 06 - 15.09.16 500,000 EUR 510,850 547,151 5.32 510,850 547,151 5.32 Italy Italy Buoni Poliennali Del Tesoro 2.00% 10 -
01.06.13 800,000 EUR 773,928 773,223 7.51 773,928 773,223 7.51
Total - Bonds 1,284,778 1,320,374 12.83
Total - Transferable securities and money market instruments dealt in on another regulated market 1,284,778 1,320,374 12.83
TOTAL INVESTMENT PORTFOLIO 10,324,388 10,107,489 98.17
TOTAL INVESTMENT PORTFOLIO INCLUDING ACCRUED INTEREST 10,295,278 99.99
105
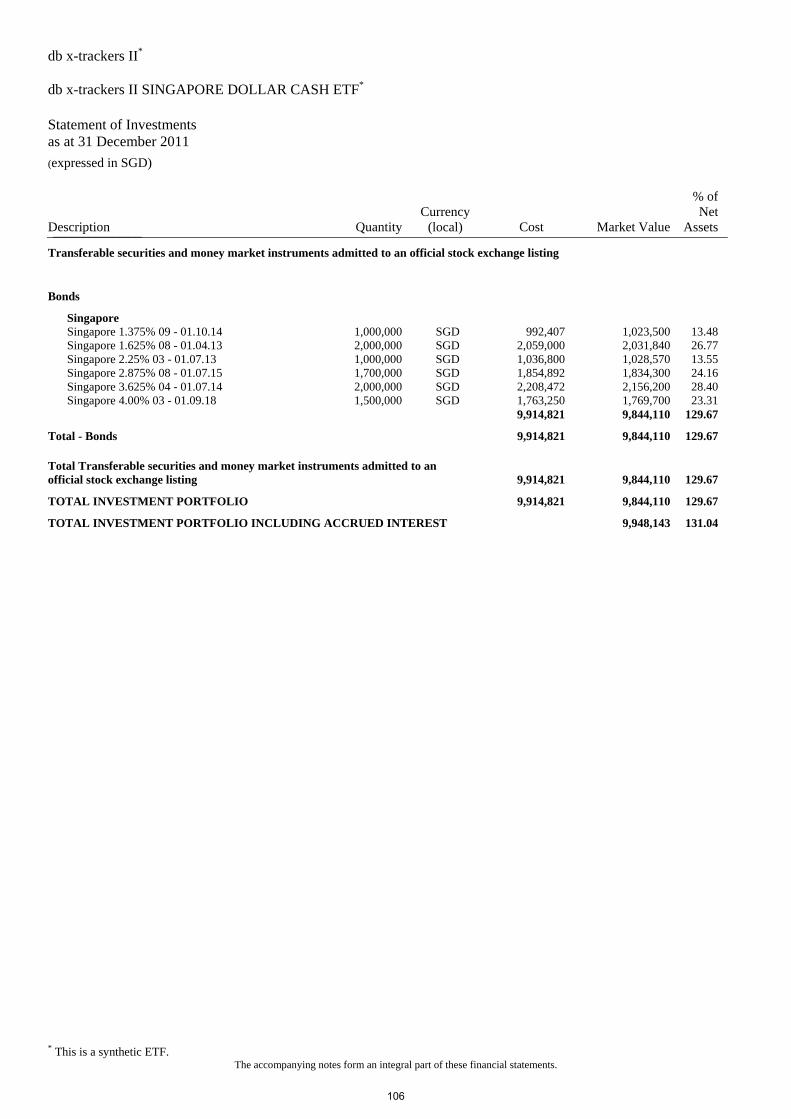
db x-trackers II* db x-trackers II SINGAPORE DOLLAR CASH ETF* Statement of Investments as at 31 December 2011 (expressed in SGD)
* This is a synthetic ETF. The accompanying notes form an integral part of these financial statements.
Description QuantityCurrency
(local) Cost Market Value
% of Net
Assets_______________
Transferable securities and money market instruments admitted to an official stock exchange listing
Bonds
Singapore Singapore 1.375% 09 - 01.10.14 1,000,000 SGD 992,407 1,023,500 13.48 Singapore 1.625% 08 - 01.04.13 2,000,000 SGD 2,059,000 2,031,840 26.77 Singapore 2.25% 03 - 01.07.13 1,000,000 SGD 1,036,800 1,028,570 13.55 Singapore 2.875% 08 - 01.07.15 1,700,000 SGD 1,854,892 1,834,300 24.16 Singapore 3.625% 04 - 01.07.14 2,000,000 SGD 2,208,472 2,156,200 28.40 Singapore 4.00% 03 - 01.09.18 1,500,000 SGD 1,763,250 1,769,700 23.31 9,914,821 9,844,110 129.67
Total - Bonds 9,914,821 9,844,110 129.67
Total Transferable securities and money market instruments admitted to an official stock exchange listing 9,914,821 9,844,110 129.67
TOTAL INVESTMENT PORTFOLIO 9,914,821 9,844,110 129.67
TOTAL INVESTMENT PORTFOLIO INCLUDING ACCRUED INTEREST 9,948,143 131.04
106
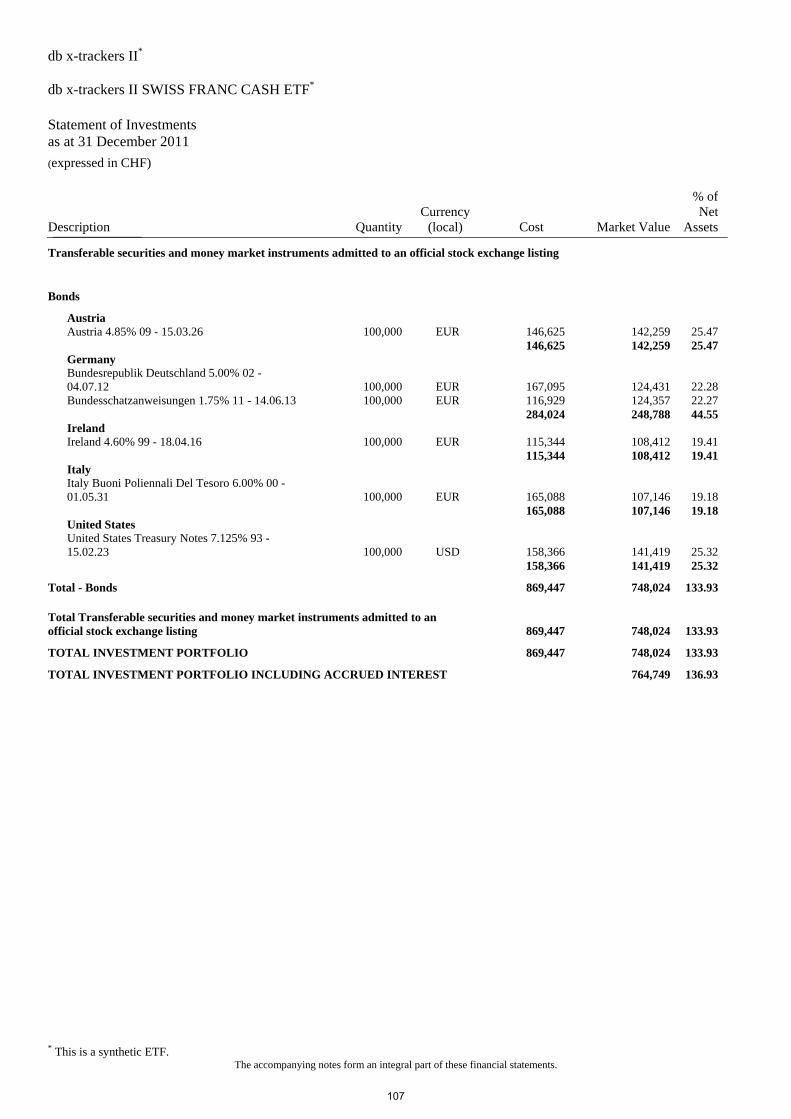
db x-trackers II* db x-trackers II SWISS FRANC CASH ETF* Statement of Investments as at 31 December 2011 (expressed in CHF)
* This is a synthetic ETF. The accompanying notes form an integral part of these financial statements.
Description QuantityCurrency
(local) Cost Market Value
% of Net
Assets_______________
Transferable securities and money market instruments admitted to an official stock exchange listing
Bonds
Austria Austria 4.85% 09 - 15.03.26 100,000 EUR 146,625 142,259 25.47 146,625 142,259 25.47 Germany Bundesrepublik Deutschland 5.00% 02 -
04.07.12 100,000 EUR 167,095 124,431 22.28 Bundesschatzanweisungen 1.75% 11 - 14.06.13 100,000 EUR 116,929 124,357 22.27 284,024 248,788 44.55 Ireland Ireland 4.60% 99 - 18.04.16 100,000 EUR 115,344 108,412 19.41 115,344 108,412 19.41 Italy Italy Buoni Poliennali Del Tesoro 6.00% 00 -
01.05.31 100,000 EUR 165,088 107,146 19.18 165,088 107,146 19.18 United States United States Treasury Notes 7.125% 93 -
15.02.23 100,000 USD 158,366 141,419 25.32 158,366 141,419 25.32
Total - Bonds 869,447 748,024 133.93
Total Transferable securities and money market instruments admitted to an official stock exchange listing 869,447 748,024 133.93
TOTAL INVESTMENT PORTFOLIO 869,447 748,024 133.93
TOTAL INVESTMENT PORTFOLIO INCLUDING ACCRUED INTEREST 764,749 136.93
107
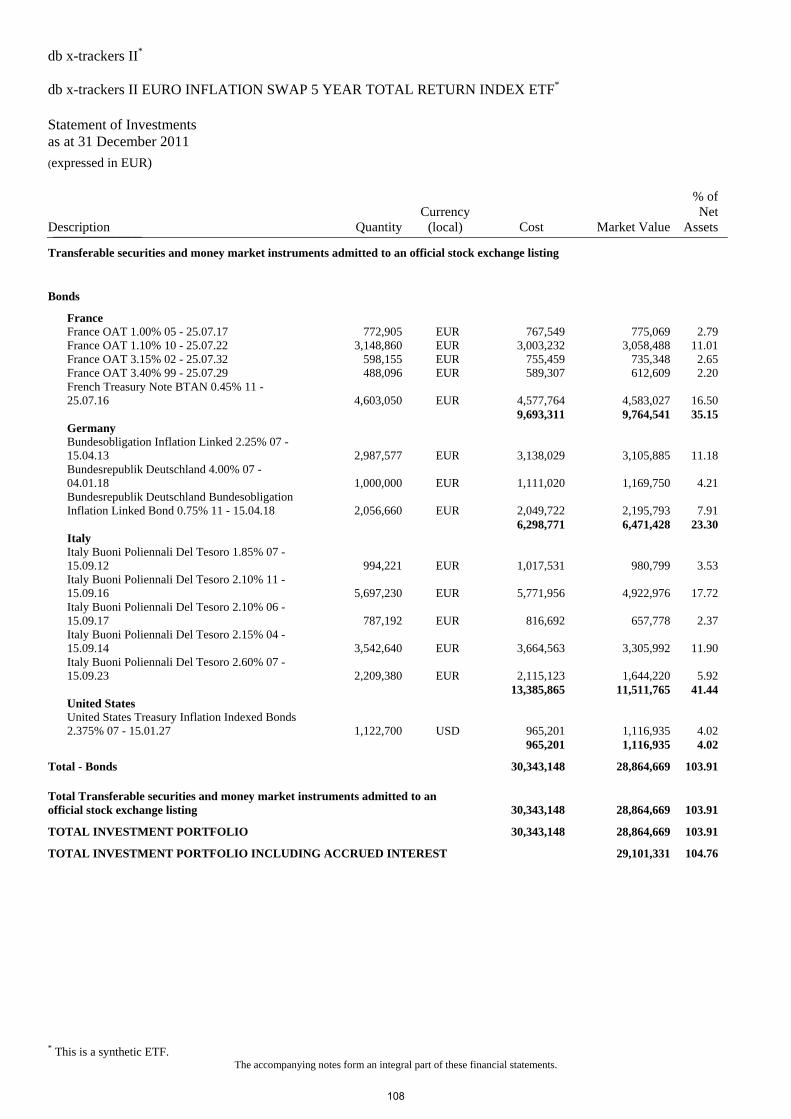
db x-trackers II* db x-trackers II EURO INFLATION SWAP 5 YEAR TOTAL RETURN INDEX ETF* Statement of Investments as at 31 December 2011 (expressed in EUR)
* This is a synthetic ETF. The accompanying notes form an integral part of these financial statements.
Description QuantityCurrency
(local) Cost Market Value
% of Net
Assets_______________
Transferable securities and money market instruments admitted to an official stock exchange listing
Bonds
France France OAT 1.00% 05 - 25.07.17 772,905 EUR 767,549 775,069 2.79 France OAT 1.10% 10 - 25.07.22 3,148,860 EUR 3,003,232 3,058,488 11.01 France OAT 3.15% 02 - 25.07.32 598,155 EUR 755,459 735,348 2.65 France OAT 3.40% 99 - 25.07.29 488,096 EUR 589,307 612,609 2.20 French Treasury Note BTAN 0.45% 11 -
25.07.16 4,603,050 EUR 4,577,764 4,583,027 16.50 9,693,311 9,764,541 35.15 Germany Bundesobligation Inflation Linked 2.25% 07 -
15.04.13 2,987,577 EUR 3,138,029 3,105,885 11.18 Bundesrepublik Deutschland 4.00% 07 -
04.01.18 1,000,000 EUR 1,111,020 1,169,750 4.21 Bundesrepublik Deutschland Bundesobligation
Inflation Linked Bond 0.75% 11 - 15.04.18 2,056,660 EUR 2,049,722 2,195,793 7.91 6,298,771 6,471,428 23.30 Italy Italy Buoni Poliennali Del Tesoro 1.85% 07 -
15.09.12 994,221 EUR 1,017,531 980,799 3.53 Italy Buoni Poliennali Del Tesoro 2.10% 11 -
15.09.16 5,697,230 EUR 5,771,956 4,922,976 17.72 Italy Buoni Poliennali Del Tesoro 2.10% 06 -
15.09.17 787,192 EUR 816,692 657,778 2.37 Italy Buoni Poliennali Del Tesoro 2.15% 04 -
15.09.14 3,542,640 EUR 3,664,563 3,305,992 11.90 Italy Buoni Poliennali Del Tesoro 2.60% 07 -
15.09.23 2,209,380 EUR 2,115,123 1,644,220 5.92 13,385,865 11,511,765 41.44 United States United States Treasury Inflation Indexed Bonds
2.375% 07 - 15.01.27 1,122,700 USD 965,201 1,116,935 4.02 965,201 1,116,935 4.02
Total - Bonds 30,343,148 28,864,669 103.91
Total Transferable securities and money market instruments admitted to an official stock exchange listing 30,343,148 28,864,669 103.91
TOTAL INVESTMENT PORTFOLIO 30,343,148 28,864,669 103.91
TOTAL INVESTMENT PORTFOLIO INCLUDING ACCRUED INTEREST 29,101,331 104.76
108
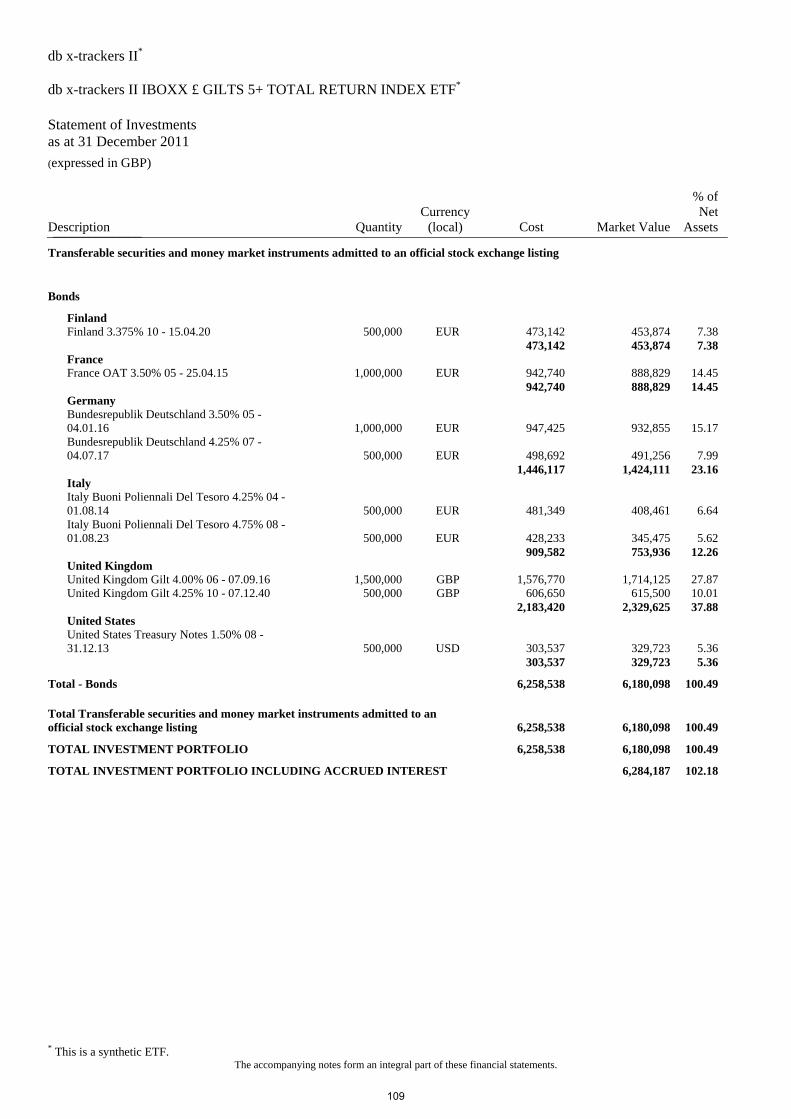
db x-trackers II* db x-trackers II IBOXX £ GILTS 5+ TOTAL RETURN INDEX ETF* Statement of Investments as at 31 December 2011 (expressed in GBP)
* This is a synthetic ETF. The accompanying notes form an integral part of these financial statements.
Description QuantityCurrency
(local) Cost Market Value
% of Net
Assets_______________
Transferable securities and money market instruments admitted to an official stock exchange listing
Bonds
Finland Finland 3.375% 10 - 15.04.20 500,000 EUR 473,142 453,874 7.38 473,142 453,874 7.38 France France OAT 3.50% 05 - 25.04.15 1,000,000 EUR 942,740 888,829 14.45 942,740 888,829 14.45 Germany Bundesrepublik Deutschland 3.50% 05 -
04.01.16 1,000,000 EUR 947,425 932,855 15.17 Bundesrepublik Deutschland 4.25% 07 -
04.07.17 500,000 EUR 498,692 491,256 7.99 1,446,117 1,424,111 23.16 Italy Italy Buoni Poliennali Del Tesoro 4.25% 04 -
01.08.14 500,000 EUR 481,349 408,461 6.64 Italy Buoni Poliennali Del Tesoro 4.75% 08 -
01.08.23 500,000 EUR 428,233 345,475 5.62 909,582 753,936 12.26 United Kingdom United Kingdom Gilt 4.00% 06 - 07.09.16 1,500,000 GBP 1,576,770 1,714,125 27.87 United Kingdom Gilt 4.25% 10 - 07.12.40 500,000 GBP 606,650 615,500 10.01 2,183,420 2,329,625 37.88 United States United States Treasury Notes 1.50% 08 -
31.12.13 500,000 USD 303,537 329,723 5.36 303,537 329,723 5.36
Total - Bonds 6,258,538 6,180,098 100.49
Total Transferable securities and money market instruments admitted to an official stock exchange listing 6,258,538 6,180,098 100.49
TOTAL INVESTMENT PORTFOLIO 6,258,538 6,180,098 100.49
TOTAL INVESTMENT PORTFOLIO INCLUDING ACCRUED INTEREST 6,284,187 102.18
109
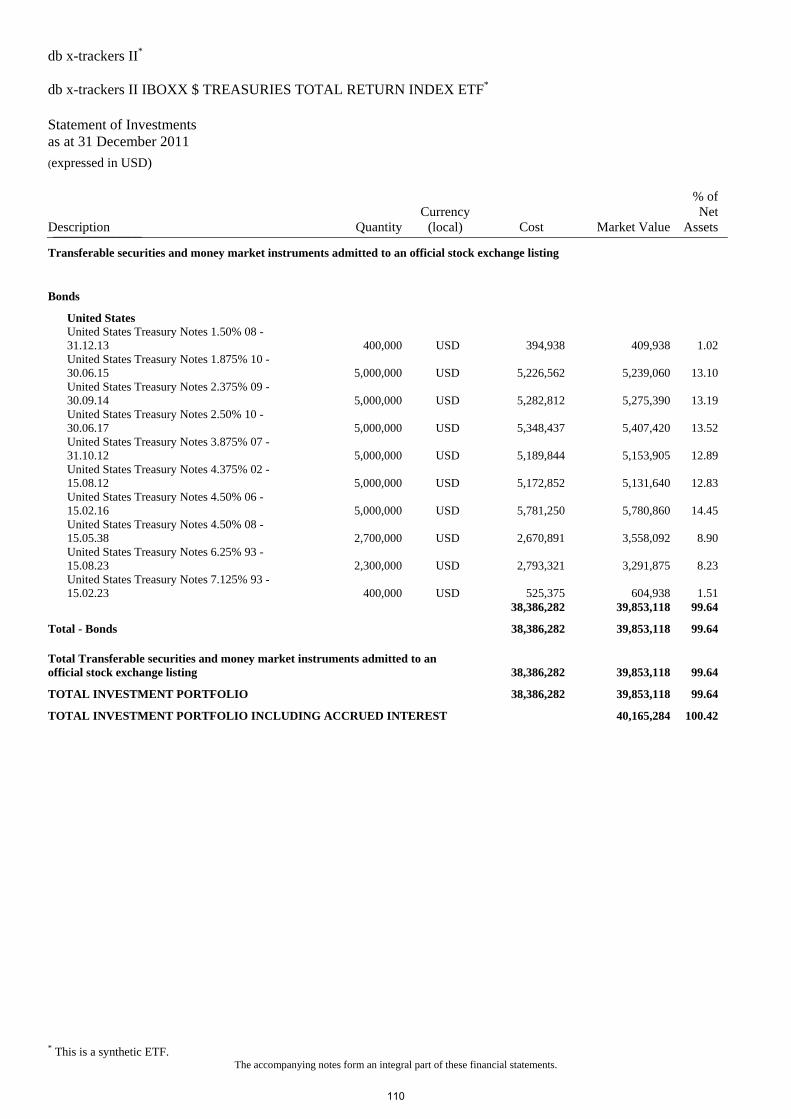
db x-trackers II* db x-trackers II IBOXX $ TREASURIES TOTAL RETURN INDEX ETF* Statement of Investments as at 31 December 2011 (expressed in USD)
* This is a synthetic ETF. The accompanying notes form an integral part of these financial statements.
Description QuantityCurrency
(local) Cost Market Value
% of Net
Assets_______________
Transferable securities and money market instruments admitted to an official stock exchange listing
Bonds
United States United States Treasury Notes 1.50% 08 -
31.12.13 400,000 USD 394,938 409,938 1.02 United States Treasury Notes 1.875% 10 -
30.06.15 5,000,000 USD 5,226,562 5,239,060 13.10 United States Treasury Notes 2.375% 09 -
30.09.14 5,000,000 USD 5,282,812 5,275,390 13.19 United States Treasury Notes 2.50% 10 -
30.06.17 5,000,000 USD 5,348,437 5,407,420 13.52 United States Treasury Notes 3.875% 07 -
31.10.12 5,000,000 USD 5,189,844 5,153,905 12.89 United States Treasury Notes 4.375% 02 -
15.08.12 5,000,000 USD 5,172,852 5,131,640 12.83 United States Treasury Notes 4.50% 06 -
15.02.16 5,000,000 USD 5,781,250 5,780,860 14.45 United States Treasury Notes 4.50% 08 -
15.05.38 2,700,000 USD 2,670,891 3,558,092 8.90 United States Treasury Notes 6.25% 93 -
15.08.23 2,300,000 USD 2,793,321 3,291,875 8.23 United States Treasury Notes 7.125% 93 -
15.02.23 400,000 USD 525,375 604,938 1.51 38,386,282 39,853,118 99.64
Total - Bonds 38,386,282 39,853,118 99.64
Total Transferable securities and money market instruments admitted to an official stock exchange listing 38,386,282 39,853,118 99.64
TOTAL INVESTMENT PORTFOLIO 38,386,282 39,853,118 99.64
TOTAL INVESTMENT PORTFOLIO INCLUDING ACCRUED INTEREST 40,165,284 100.42
110
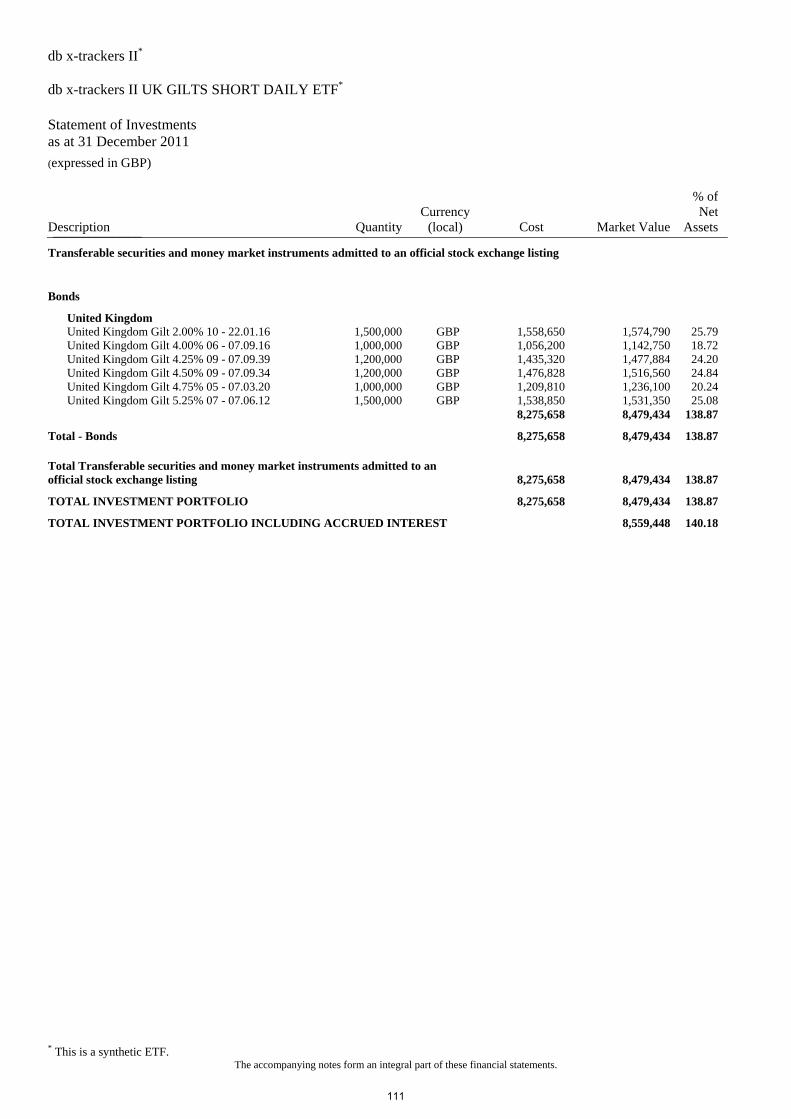
db x-trackers II* db x-trackers II UK GILTS SHORT DAILY ETF* Statement of Investments as at 31 December 2011 (expressed in GBP)
* This is a synthetic ETF. The accompanying notes form an integral part of these financial statements.
Description QuantityCurrency
(local) Cost Market Value
% of Net
Assets_______________
Transferable securities and money market instruments admitted to an official stock exchange listing
Bonds
United Kingdom United Kingdom Gilt 2.00% 10 - 22.01.16 1,500,000 GBP 1,558,650 1,574,790 25.79 United Kingdom Gilt 4.00% 06 - 07.09.16 1,000,000 GBP 1,056,200 1,142,750 18.72 United Kingdom Gilt 4.25% 09 - 07.09.39 1,200,000 GBP 1,435,320 1,477,884 24.20 United Kingdom Gilt 4.50% 09 - 07.09.34 1,200,000 GBP 1,476,828 1,516,560 24.84 United Kingdom Gilt 4.75% 05 - 07.03.20 1,000,000 GBP 1,209,810 1,236,100 20.24 United Kingdom Gilt 5.25% 07 - 07.06.12 1,500,000 GBP 1,538,850 1,531,350 25.08 8,275,658 8,479,434 138.87
Total - Bonds 8,275,658 8,479,434 138.87
Total Transferable securities and money market instruments admitted to an official stock exchange listing 8,275,658 8,479,434 138.87
TOTAL INVESTMENT PORTFOLIO 8,275,658 8,479,434 138.87
TOTAL INVESTMENT PORTFOLIO INCLUDING ACCRUED INTEREST 8,559,448 140.18
111
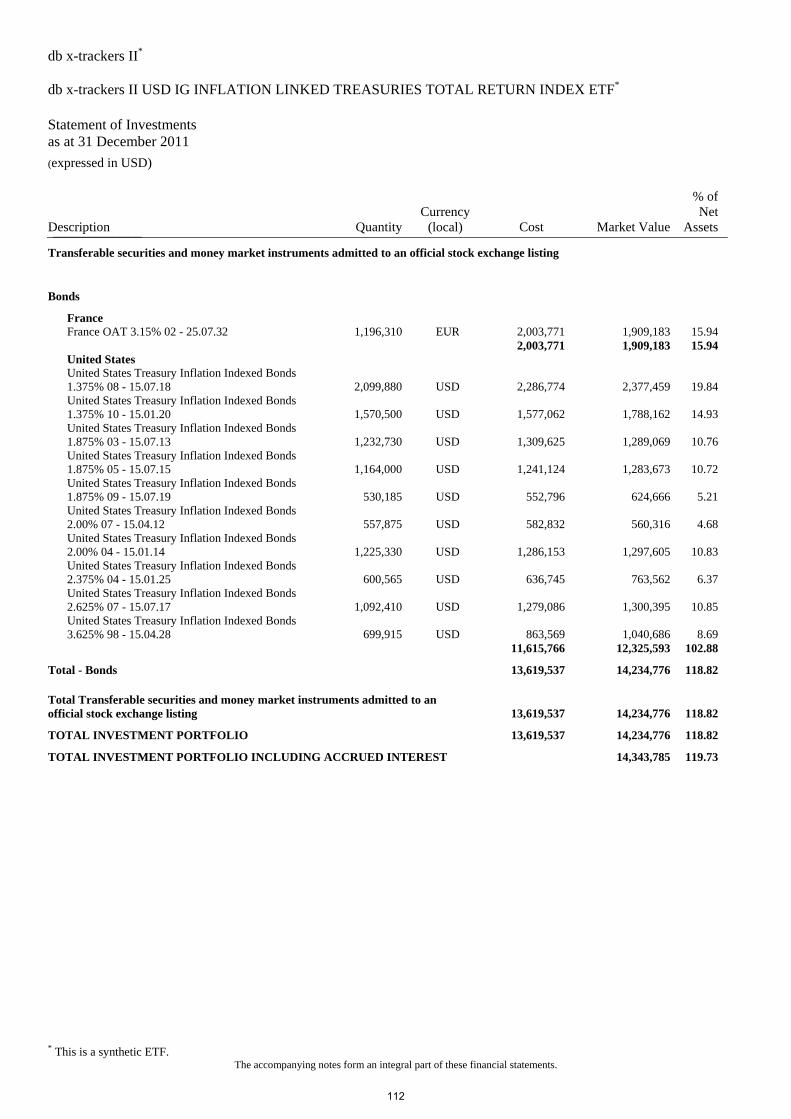
db x-trackers II* db x-trackers II USD IG INFLATION LINKED TREASURIES TOTAL RETURN INDEX ETF* Statement of Investments as at 31 December 2011 (expressed in USD)
* This is a synthetic ETF. The accompanying notes form an integral part of these financial statements.
Description QuantityCurrency
(local) Cost Market Value
% of Net
Assets_______________
Transferable securities and money market instruments admitted to an official stock exchange listing
Bonds
France France OAT 3.15% 02 - 25.07.32 1,196,310 EUR 2,003,771 1,909,183 15.94 2,003,771 1,909,183 15.94 United States United States Treasury Inflation Indexed Bonds
1.375% 08 - 15.07.18 2,099,880 USD 2,286,774 2,377,459 19.84 United States Treasury Inflation Indexed Bonds
1.375% 10 - 15.01.20 1,570,500 USD 1,577,062 1,788,162 14.93 United States Treasury Inflation Indexed Bonds
1.875% 03 - 15.07.13 1,232,730 USD 1,309,625 1,289,069 10.76 United States Treasury Inflation Indexed Bonds
1.875% 05 - 15.07.15 1,164,000 USD 1,241,124 1,283,673 10.72 United States Treasury Inflation Indexed Bonds
1.875% 09 - 15.07.19 530,185 USD 552,796 624,666 5.21 United States Treasury Inflation Indexed Bonds
2.00% 07 - 15.04.12 557,875 USD 582,832 560,316 4.68 United States Treasury Inflation Indexed Bonds
2.00% 04 - 15.01.14 1,225,330 USD 1,286,153 1,297,605 10.83 United States Treasury Inflation Indexed Bonds
2.375% 04 - 15.01.25 600,565 USD 636,745 763,562 6.37 United States Treasury Inflation Indexed Bonds
2.625% 07 - 15.07.17 1,092,410 USD 1,279,086 1,300,395 10.85 United States Treasury Inflation Indexed Bonds
3.625% 98 - 15.04.28 699,915 USD 863,569 1,040,686 8.69 11,615,766 12,325,593 102.88
Total - Bonds 13,619,537 14,234,776 118.82
Total Transferable securities and money market instruments admitted to an official stock exchange listing 13,619,537 14,234,776 118.82
TOTAL INVESTMENT PORTFOLIO 13,619,537 14,234,776 118.82
TOTAL INVESTMENT PORTFOLIO INCLUDING ACCRUED INTEREST 14,343,785 119.73
112
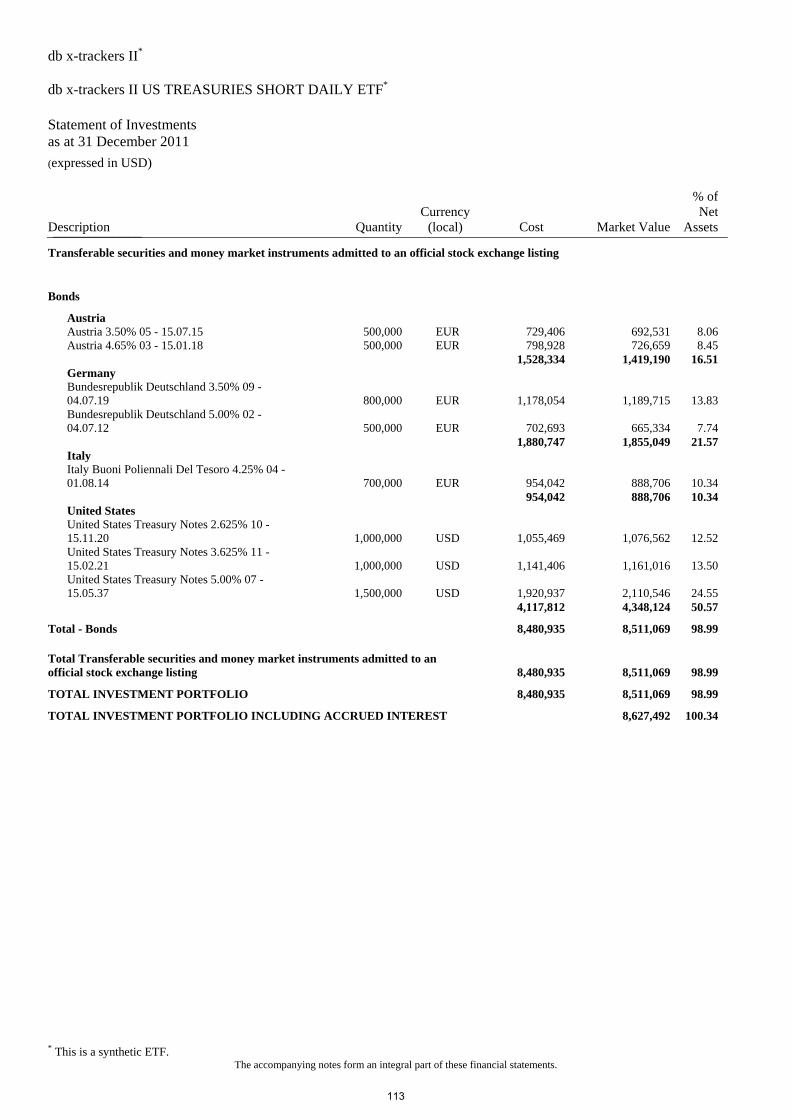
db x-trackers II* db x-trackers II US TREASURIES SHORT DAILY ETF* Statement of Investments as at 31 December 2011 (expressed in USD)
* This is a synthetic ETF. The accompanying notes form an integral part of these financial statements.
Description QuantityCurrency
(local) Cost Market Value
% of Net
Assets_______________
Transferable securities and money market instruments admitted to an official stock exchange listing
Bonds
Austria Austria 3.50% 05 - 15.07.15 500,000 EUR 729,406 692,531 8.06 Austria 4.65% 03 - 15.01.18 500,000 EUR 798,928 726,659 8.45 1,528,334 1,419,190 16.51 Germany Bundesrepublik Deutschland 3.50% 09 -
04.07.19 800,000 EUR 1,178,054 1,189,715 13.83 Bundesrepublik Deutschland 5.00% 02 -
04.07.12 500,000 EUR 702,693 665,334 7.74 1,880,747 1,855,049 21.57 Italy Italy Buoni Poliennali Del Tesoro 4.25% 04 -
01.08.14 700,000 EUR 954,042 888,706 10.34 954,042 888,706 10.34 United States United States Treasury Notes 2.625% 10 -
15.11.20 1,000,000 USD 1,055,469 1,076,562 12.52 United States Treasury Notes 3.625% 11 -
15.02.21 1,000,000 USD 1,141,406 1,161,016 13.50 United States Treasury Notes 5.00% 07 -
15.05.37 1,500,000 USD 1,920,937 2,110,546 24.55 4,117,812 4,348,124 50.57
Total - Bonds 8,480,935 8,511,069 98.99
Total Transferable securities and money market instruments admitted to an official stock exchange listing 8,480,935 8,511,069 98.99
TOTAL INVESTMENT PORTFOLIO 8,480,935 8,511,069 98.99
TOTAL INVESTMENT PORTFOLIO INCLUDING ACCRUED INTEREST 8,627,492 100.34
113
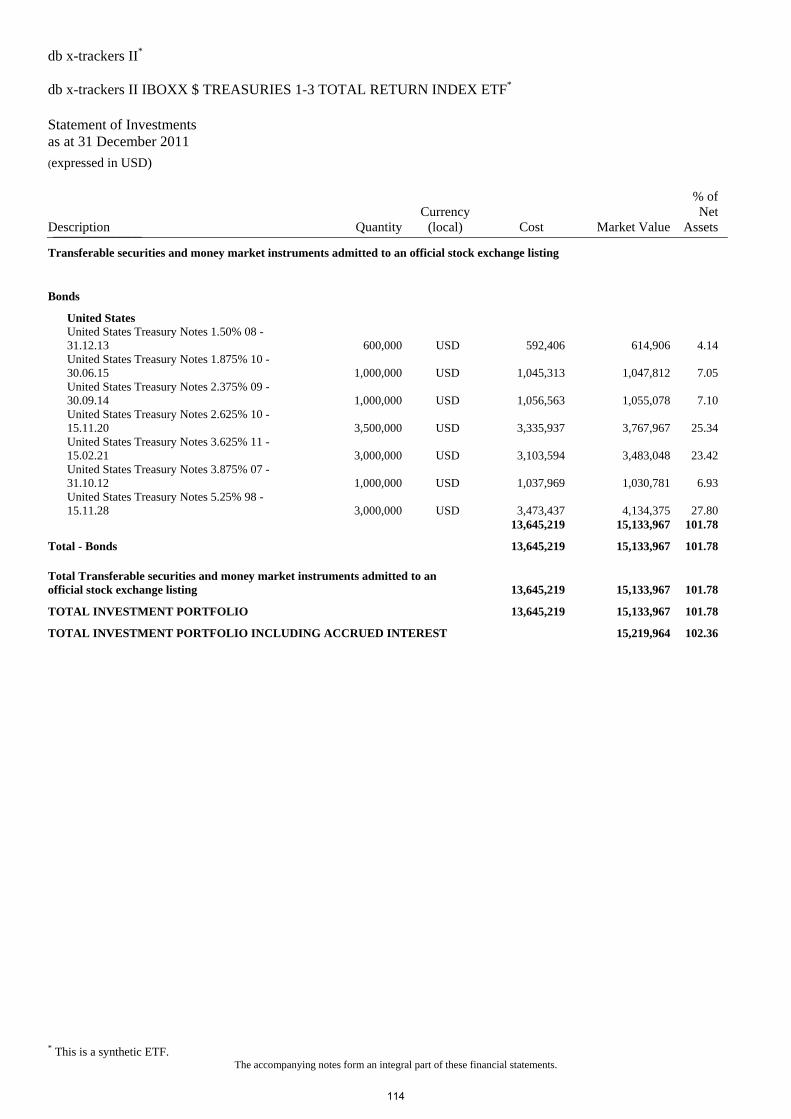
db x-trackers II* db x-trackers II IBOXX $ TREASURIES 1-3 TOTAL RETURN INDEX ETF* Statement of Investments as at 31 December 2011 (expressed in USD)
* This is a synthetic ETF. The accompanying notes form an integral part of these financial statements.
Description QuantityCurrency
(local) Cost Market Value
% of Net
Assets_______________
Transferable securities and money market instruments admitted to an official stock exchange listing
Bonds
United States United States Treasury Notes 1.50% 08 -
31.12.13 600,000 USD 592,406 614,906 4.14 United States Treasury Notes 1.875% 10 -
30.06.15 1,000,000 USD 1,045,313 1,047,812 7.05 United States Treasury Notes 2.375% 09 -
30.09.14 1,000,000 USD 1,056,563 1,055,078 7.10 United States Treasury Notes 2.625% 10 -
15.11.20 3,500,000 USD 3,335,937 3,767,967 25.34 United States Treasury Notes 3.625% 11 -
15.02.21 3,000,000 USD 3,103,594 3,483,048 23.42 United States Treasury Notes 3.875% 07 -
31.10.12 1,000,000 USD 1,037,969 1,030,781 6.93 United States Treasury Notes 5.25% 98 -
15.11.28 3,000,000 USD 3,473,437 4,134,375 27.80 13,645,219 15,133,967 101.78
Total - Bonds 13,645,219 15,133,967 101.78
Total Transferable securities and money market instruments admitted to an official stock exchange listing 13,645,219 15,133,967 101.78
TOTAL INVESTMENT PORTFOLIO 13,645,219 15,133,967 101.78
TOTAL INVESTMENT PORTFOLIO INCLUDING ACCRUED INTEREST 15,219,964 102.36
114
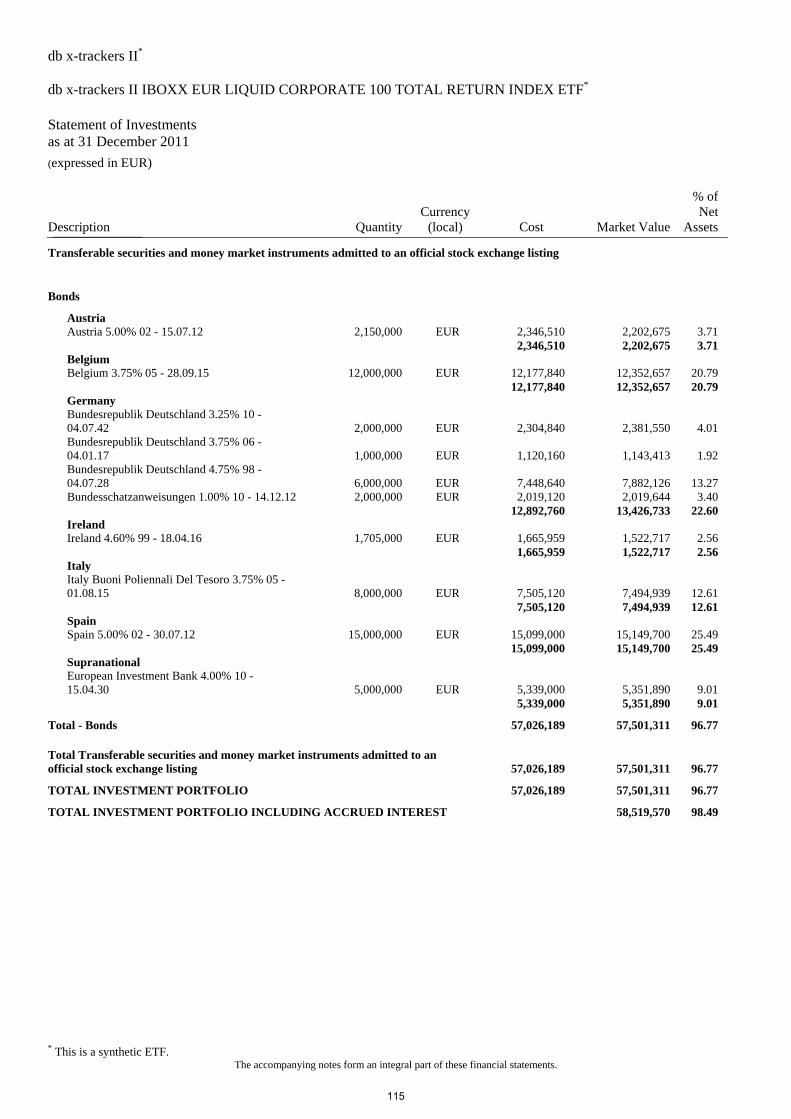
db x-trackers II* db x-trackers II IBOXX EUR LIQUID CORPORATE 100 TOTAL RETURN INDEX ETF* Statement of Investments as at 31 December 2011 (expressed in EUR)
* This is a synthetic ETF. The accompanying notes form an integral part of these financial statements.
Description QuantityCurrency
(local) Cost Market Value
% of Net
Assets_______________
Transferable securities and money market instruments admitted to an official stock exchange listing
Bonds
Austria Austria 5.00% 02 - 15.07.12 2,150,000 EUR 2,346,510 2,202,675 3.71 2,346,510 2,202,675 3.71 Belgium Belgium 3.75% 05 - 28.09.15 12,000,000 EUR 12,177,840 12,352,657 20.79 12,177,840 12,352,657 20.79 Germany Bundesrepublik Deutschland 3.25% 10 -
04.07.42 2,000,000 EUR 2,304,840 2,381,550 4.01 Bundesrepublik Deutschland 3.75% 06 -
04.01.17 1,000,000 EUR 1,120,160 1,143,413 1.92 Bundesrepublik Deutschland 4.75% 98 -
04.07.28 6,000,000 EUR 7,448,640 7,882,126 13.27 Bundesschatzanweisungen 1.00% 10 - 14.12.12 2,000,000 EUR 2,019,120 2,019,644 3.40 12,892,760 13,426,733 22.60 Ireland Ireland 4.60% 99 - 18.04.16 1,705,000 EUR 1,665,959 1,522,717 2.56 1,665,959 1,522,717 2.56 Italy Italy Buoni Poliennali Del Tesoro 3.75% 05 -
01.08.15 8,000,000 EUR 7,505,120 7,494,939 12.61 7,505,120 7,494,939 12.61 Spain Spain 5.00% 02 - 30.07.12 15,000,000 EUR 15,099,000 15,149,700 25.49 15,099,000 15,149,700 25.49 Supranational European Investment Bank 4.00% 10 -
15.04.30 5,000,000 EUR 5,339,000 5,351,890 9.01 5,339,000 5,351,890 9.01
Total - Bonds 57,026,189 57,501,311 96.77
Total Transferable securities and money market instruments admitted to an official stock exchange listing 57,026,189 57,501,311 96.77
TOTAL INVESTMENT PORTFOLIO 57,026,189 57,501,311 96.77
TOTAL INVESTMENT PORTFOLIO INCLUDING ACCRUED INTEREST 58,519,570 98.49
115
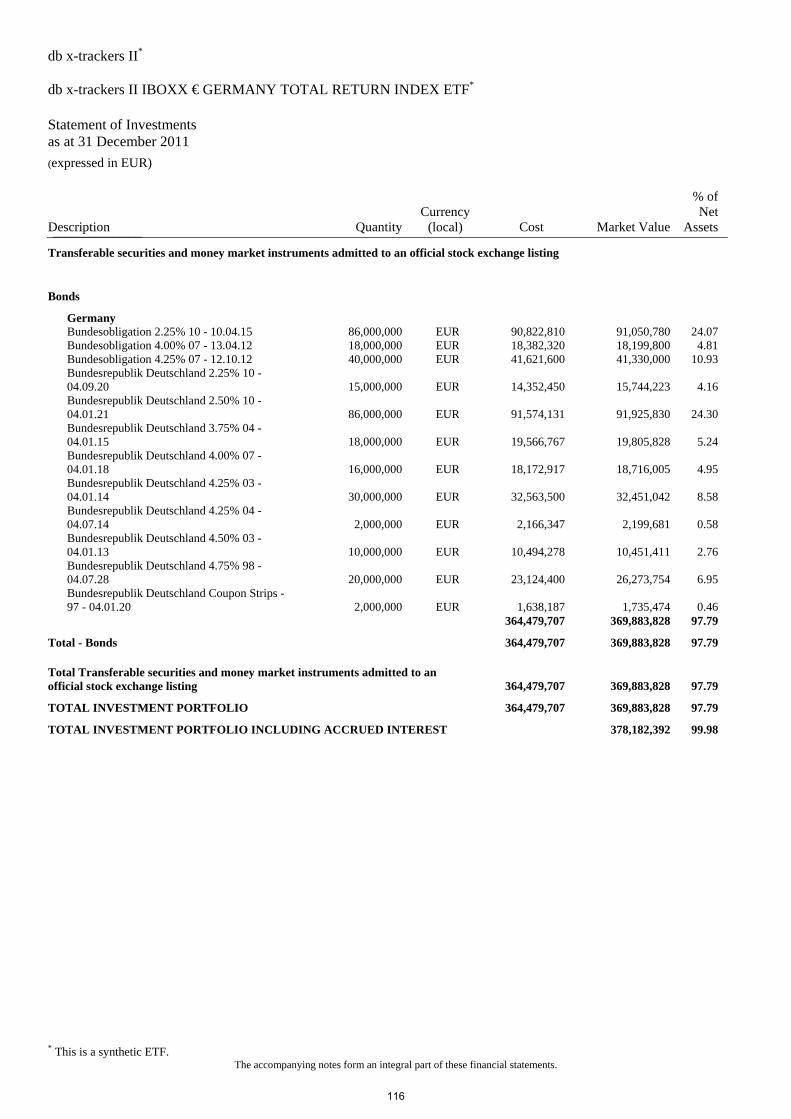
db x-trackers II* db x-trackers II IBOXX € GERMANY TOTAL RETURN INDEX ETF* Statement of Investments as at 31 December 2011 (expressed in EUR)
* This is a synthetic ETF. The accompanying notes form an integral part of these financial statements.
Description QuantityCurrency
(local) Cost Market Value
% of Net
Assets_______________
Transferable securities and money market instruments admitted to an official stock exchange listing
Bonds
Germany Bundesobligation 2.25% 10 - 10.04.15 86,000,000 EUR 90,822,810 91,050,780 24.07 Bundesobligation 4.00% 07 - 13.04.12 18,000,000 EUR 18,382,320 18,199,800 4.81 Bundesobligation 4.25% 07 - 12.10.12 40,000,000 EUR 41,621,600 41,330,000 10.93 Bundesrepublik Deutschland 2.25% 10 -
04.09.20 15,000,000 EUR 14,352,450 15,744,223 4.16 Bundesrepublik Deutschland 2.50% 10 -
04.01.21 86,000,000 EUR 91,574,131 91,925,830 24.30 Bundesrepublik Deutschland 3.75% 04 -
04.01.15 18,000,000 EUR 19,566,767 19,805,828 5.24 Bundesrepublik Deutschland 4.00% 07 -
04.01.18 16,000,000 EUR 18,172,917 18,716,005 4.95 Bundesrepublik Deutschland 4.25% 03 -
04.01.14 30,000,000 EUR 32,563,500 32,451,042 8.58 Bundesrepublik Deutschland 4.25% 04 -
04.07.14 2,000,000 EUR 2,166,347 2,199,681 0.58 Bundesrepublik Deutschland 4.50% 03 -
04.01.13 10,000,000 EUR 10,494,278 10,451,411 2.76 Bundesrepublik Deutschland 4.75% 98 -
04.07.28 20,000,000 EUR 23,124,400 26,273,754 6.95 Bundesrepublik Deutschland Coupon Strips -
97 - 04.01.20 2,000,000 EUR 1,638,187 1,735,474 0.46 364,479,707 369,883,828 97.79
Total - Bonds 364,479,707 369,883,828 97.79
Total Transferable securities and money market instruments admitted to an official stock exchange listing 364,479,707 369,883,828 97.79
TOTAL INVESTMENT PORTFOLIO 364,479,707 369,883,828 97.79
TOTAL INVESTMENT PORTFOLIO INCLUDING ACCRUED INTEREST 378,182,392 99.98
116
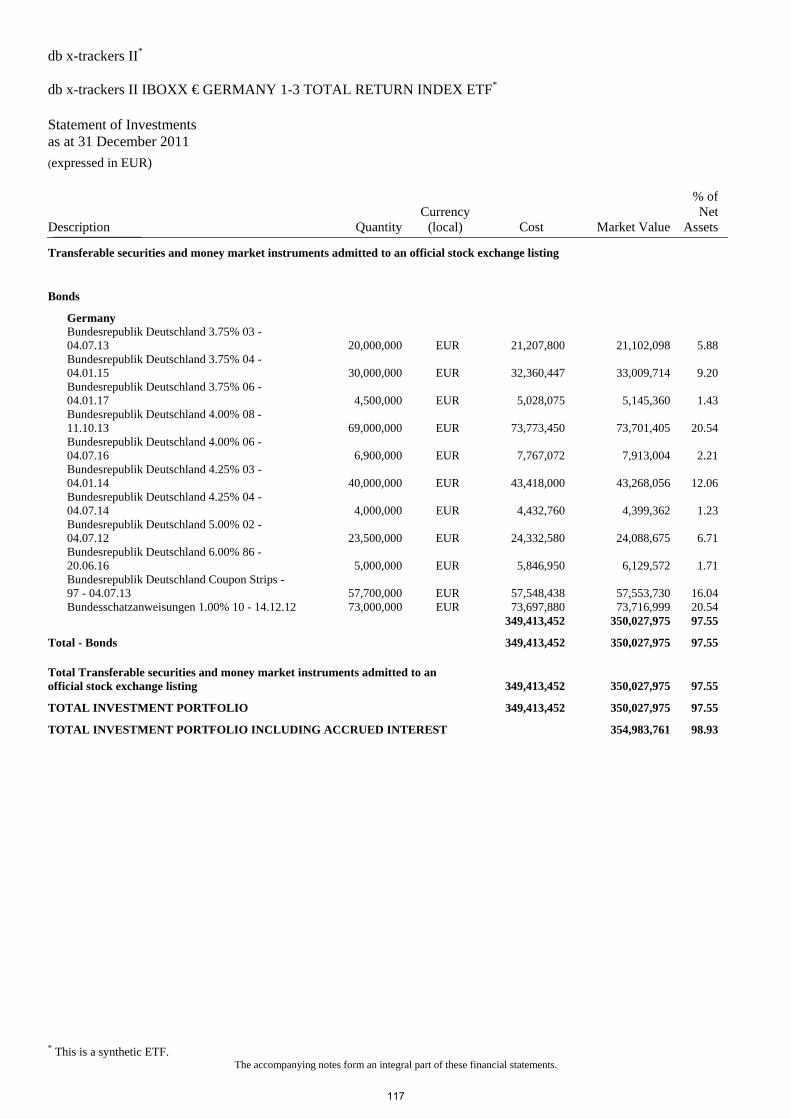
db x-trackers II* db x-trackers II IBOXX € GERMANY 1-3 TOTAL RETURN INDEX ETF* Statement of Investments as at 31 December 2011 (expressed in EUR)
* This is a synthetic ETF. The accompanying notes form an integral part of these financial statements.
Description QuantityCurrency
(local) Cost Market Value
% of Net
Assets_______________
Transferable securities and money market instruments admitted to an official stock exchange listing
Bonds
Germany Bundesrepublik Deutschland 3.75% 03 -
04.07.13 20,000,000 EUR 21,207,800 21,102,098 5.88 Bundesrepublik Deutschland 3.75% 04 -
04.01.15 30,000,000 EUR 32,360,447 33,009,714 9.20 Bundesrepublik Deutschland 3.75% 06 -
04.01.17 4,500,000 EUR 5,028,075 5,145,360 1.43 Bundesrepublik Deutschland 4.00% 08 -
11.10.13 69,000,000 EUR 73,773,450 73,701,405 20.54 Bundesrepublik Deutschland 4.00% 06 -
04.07.16 6,900,000 EUR 7,767,072 7,913,004 2.21 Bundesrepublik Deutschland 4.25% 03 -
04.01.14 40,000,000 EUR 43,418,000 43,268,056 12.06 Bundesrepublik Deutschland 4.25% 04 -
04.07.14 4,000,000 EUR 4,432,760 4,399,362 1.23 Bundesrepublik Deutschland 5.00% 02 -
04.07.12 23,500,000 EUR 24,332,580 24,088,675 6.71 Bundesrepublik Deutschland 6.00% 86 -
20.06.16 5,000,000 EUR 5,846,950 6,129,572 1.71 Bundesrepublik Deutschland Coupon Strips -
97 - 04.07.13 57,700,000 EUR 57,548,438 57,553,730 16.04 Bundesschatzanweisungen 1.00% 10 - 14.12.12 73,000,000 EUR 73,697,880 73,716,999 20.54 349,413,452 350,027,975 97.55
Total - Bonds 349,413,452 350,027,975 97.55
Total Transferable securities and money market instruments admitted to an official stock exchange listing 349,413,452 350,027,975 97.55
TOTAL INVESTMENT PORTFOLIO 349,413,452 350,027,975 97.55
TOTAL INVESTMENT PORTFOLIO INCLUDING ACCRUED INTEREST 354,983,761 98.93
117

db x-trackers II* db x-trackers II MARKIT IBOXX ABF KOREA GOVERNMENT INDEX ETF* Statement of Investments as at 31 December 2011 (expressed in USD)
* This is a synthetic ETF. The accompanying notes form an integral part of these financial statements.
Description QuantityCurrency
(local) Cost Market Value
% of Net
Assets_______________
Transferable securities and money market instruments admitted to an official stock exchange listing
Bonds
Singapore Singapore 1.375% 09 - 01.10.14 2,800,000 SGD 2,336,510 2,203,275 19.15 Singapore 1.625% 08 - 01.04.13 1,800,000 SGD 1,477,958 1,405,902 12.22 Singapore 2.50% 07 - 01.10.12 3,000,000 SGD 2,498,795 2,342,892 20.36 Singapore 2.625% 07 - 01.04.12 2,000,000 SGD 1,648,654 1,545,629 13.43 Singapore 3.50% 02 - 01.07.12 2,500,000 SGD 2,078,219 1,952,026 16.96 Singapore 3.625% 04 - 01.07.14 4,000,000 SGD 3,537,492 3,315,446 28.81 13,577,628 12,765,170 110.93
Total - Bonds 13,577,628 12,765,170 110.93
Total Transferable securities and money market instruments admitted to an official stock exchange listing 13,577,628 12,765,170 110.93
TOTAL INVESTMENT PORTFOLIO 13,577,628 12,765,170 110.93
TOTAL INVESTMENT PORTFOLIO INCLUDING ACCRUED INTEREST 12,892,278 112.04
118

db x-trackers II* db x-trackers II IBOXX EUR LIQUID CORPORATE 100 FINANCIALS SUB-INDEX TOTAL RETURN ETF* Statement of Investments as at 31 December 2011 (expressed in EUR)
* This is a synthetic ETF. The accompanying notes form an integral part of these financial statements.
Description QuantityCurrency
(local) Cost Market Value
% of Net
Assets_______________
Transferable securities and money market instruments admitted to an official stock exchange listing
Bonds
Austria Austria 3.65% 11 - 20.04.22 1,500,000 EUR 1,612,500 1,579,035 20.27 1,612,500 1,579,035 20.27 Belgium Belgium Treasury Bill - 11 - 17.05.12 1,500,000 EUR 1,494,136 1,498,523 19.24 1,494,136 1,498,523 19.24 Finland Finland 4.25% 04 - 04.07.15 1,000,000 EUR 1,067,400 1,111,594 14.27 1,067,400 1,111,594 14.27 Germany Bundesrepublik Deutschland 2.50% 10 -
04.01.21 500,000 EUR 466,965 534,453 6.86 Bundesrepublik Deutschland 4.00% 05 -
04.01.37 500,000 EUR 529,470 643,762 8.26 Bundesrepublik Deutschland 6.50% 97 -
04.07.27 1,000,000 EUR 1,474,360 1,539,021 19.76 2,470,795 2,717,236 34.88 Ireland Ireland 4.60% 99 - 18.04.16 1,000,000 EUR 992,600 893,089 11.46 992,600 893,089 11.46 United States United States Treasury Notes 5.00% 07 -
15.05.37 1,500,000 USD 1,285,563 1,625,811 20.87 1,285,563 1,625,811 20.87
Total - Bonds 8,922,994 9,425,288 120.99
Total Transferable securities and money market instruments admitted to an official stock exchange listing 8,922,994 9,425,288 120.99
TOTAL INVESTMENT PORTFOLIO 8,922,994 9,425,288 120.99
TOTAL INVESTMENT PORTFOLIO INCLUDING ACCRUED INTEREST 9,604,255 123.29
119
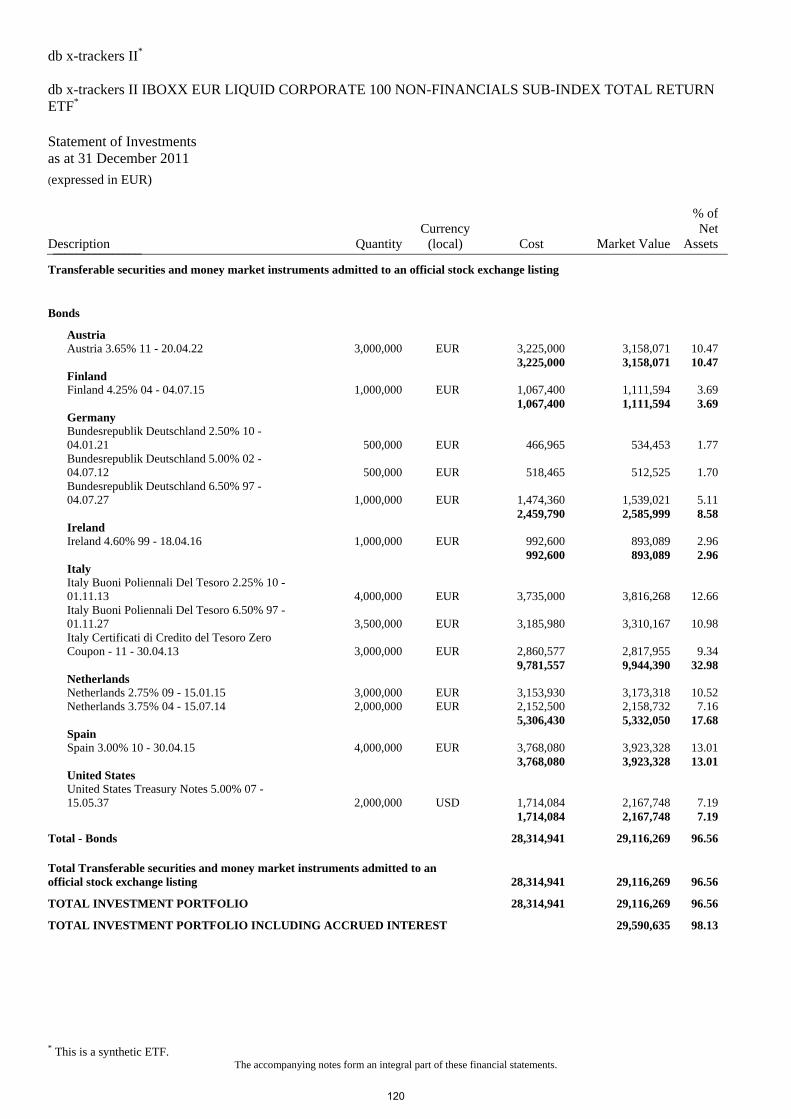
db x-trackers II* db x-trackers II IBOXX EUR LIQUID CORPORATE 100 NON-FINANCIALS SUB-INDEX TOTAL RETURN ETF* Statement of Investments as at 31 December 2011 (expressed in EUR)
* This is a synthetic ETF. The accompanying notes form an integral part of these financial statements.
Description QuantityCurrency
(local) Cost Market Value
% of Net
Assets_______________
Transferable securities and money market instruments admitted to an official stock exchange listing
Bonds
Austria Austria 3.65% 11 - 20.04.22 3,000,000 EUR 3,225,000 3,158,071 10.47 3,225,000 3,158,071 10.47 Finland Finland 4.25% 04 - 04.07.15 1,000,000 EUR 1,067,400 1,111,594 3.69 1,067,400 1,111,594 3.69 Germany Bundesrepublik Deutschland 2.50% 10 -
04.01.21 500,000 EUR 466,965 534,453 1.77 Bundesrepublik Deutschland 5.00% 02 -
04.07.12 500,000 EUR 518,465 512,525 1.70 Bundesrepublik Deutschland 6.50% 97 -
04.07.27 1,000,000 EUR 1,474,360 1,539,021 5.11 2,459,790 2,585,999 8.58 Ireland Ireland 4.60% 99 - 18.04.16 1,000,000 EUR 992,600 893,089 2.96 992,600 893,089 2.96 Italy Italy Buoni Poliennali Del Tesoro 2.25% 10 -
01.11.13 4,000,000 EUR 3,735,000 3,816,268 12.66 Italy Buoni Poliennali Del Tesoro 6.50% 97 -
01.11.27 3,500,000 EUR 3,185,980 3,310,167 10.98 Italy Certificati di Credito del Tesoro Zero
Coupon - 11 - 30.04.13 3,000,000 EUR 2,860,577 2,817,955 9.34 9,781,557 9,944,390 32.98 Netherlands Netherlands 2.75% 09 - 15.01.15 3,000,000 EUR 3,153,930 3,173,318 10.52 Netherlands 3.75% 04 - 15.07.14 2,000,000 EUR 2,152,500 2,158,732 7.16 5,306,430 5,332,050 17.68 Spain Spain 3.00% 10 - 30.04.15 4,000,000 EUR 3,768,080 3,923,328 13.01 3,768,080 3,923,328 13.01 United States United States Treasury Notes 5.00% 07 -
15.05.37 2,000,000 USD 1,714,084 2,167,748 7.19 1,714,084 2,167,748 7.19
Total - Bonds 28,314,941 29,116,269 96.56
Total Transferable securities and money market instruments admitted to an official stock exchange listing 28,314,941 29,116,269 96.56
TOTAL INVESTMENT PORTFOLIO 28,314,941 29,116,269 96.56
TOTAL INVESTMENT PORTFOLIO INCLUDING ACCRUED INTEREST 29,590,635 98.13
120
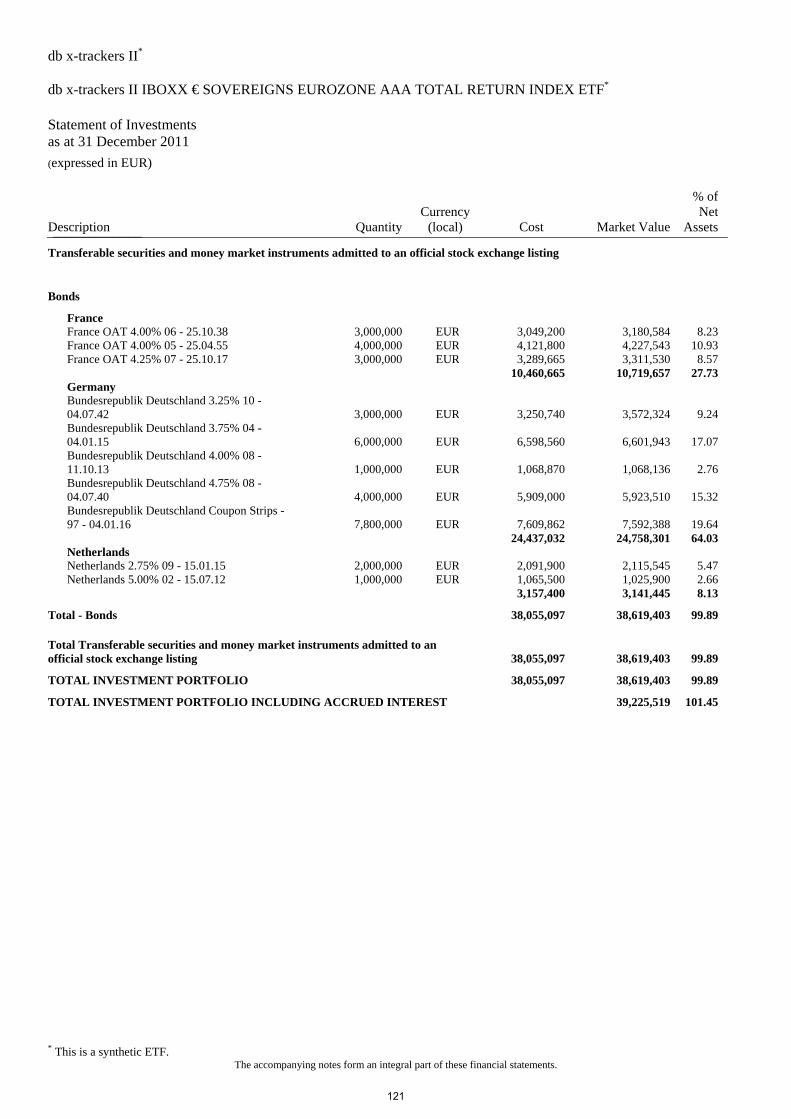
db x-trackers II* db x-trackers II IBOXX € SOVEREIGNS EUROZONE AAA TOTAL RETURN INDEX ETF*
Statement of Investments as at 31 December 2011 (expressed in EUR)
* This is a synthetic ETF. The accompanying notes form an integral part of these financial statements.
Description QuantityCurrency
(local) Cost Market Value
% of Net
Assets_______________
Transferable securities and money market instruments admitted to an official stock exchange listing
Bonds
France France OAT 4.00% 06 - 25.10.38 3,000,000 EUR 3,049,200 3,180,584 8.23 France OAT 4.00% 05 - 25.04.55 4,000,000 EUR 4,121,800 4,227,543 10.93 France OAT 4.25% 07 - 25.10.17 3,000,000 EUR 3,289,665 3,311,530 8.57 10,460,665 10,719,657 27.73 Germany Bundesrepublik Deutschland 3.25% 10 -
04.07.42 3,000,000 EUR 3,250,740 3,572,324 9.24 Bundesrepublik Deutschland 3.75% 04 -
04.01.15 6,000,000 EUR 6,598,560 6,601,943 17.07 Bundesrepublik Deutschland 4.00% 08 -
11.10.13 1,000,000 EUR 1,068,870 1,068,136 2.76 Bundesrepublik Deutschland 4.75% 08 -
04.07.40 4,000,000 EUR 5,909,000 5,923,510 15.32 Bundesrepublik Deutschland Coupon Strips -
97 - 04.01.16 7,800,000 EUR 7,609,862 7,592,388 19.64 24,437,032 24,758,301 64.03 Netherlands Netherlands 2.75% 09 - 15.01.15 2,000,000 EUR 2,091,900 2,115,545 5.47 Netherlands 5.00% 02 - 15.07.12 1,000,000 EUR 1,065,500 1,025,900 2.66 3,157,400 3,141,445 8.13
Total - Bonds 38,055,097 38,619,403 99.89
Total Transferable securities and money market instruments admitted to an official stock exchange listing 38,055,097 38,619,403 99.89
TOTAL INVESTMENT PORTFOLIO 38,055,097 38,619,403 99.89
TOTAL INVESTMENT PORTFOLIO INCLUDING ACCRUED INTEREST 39,225,519 101.45
121
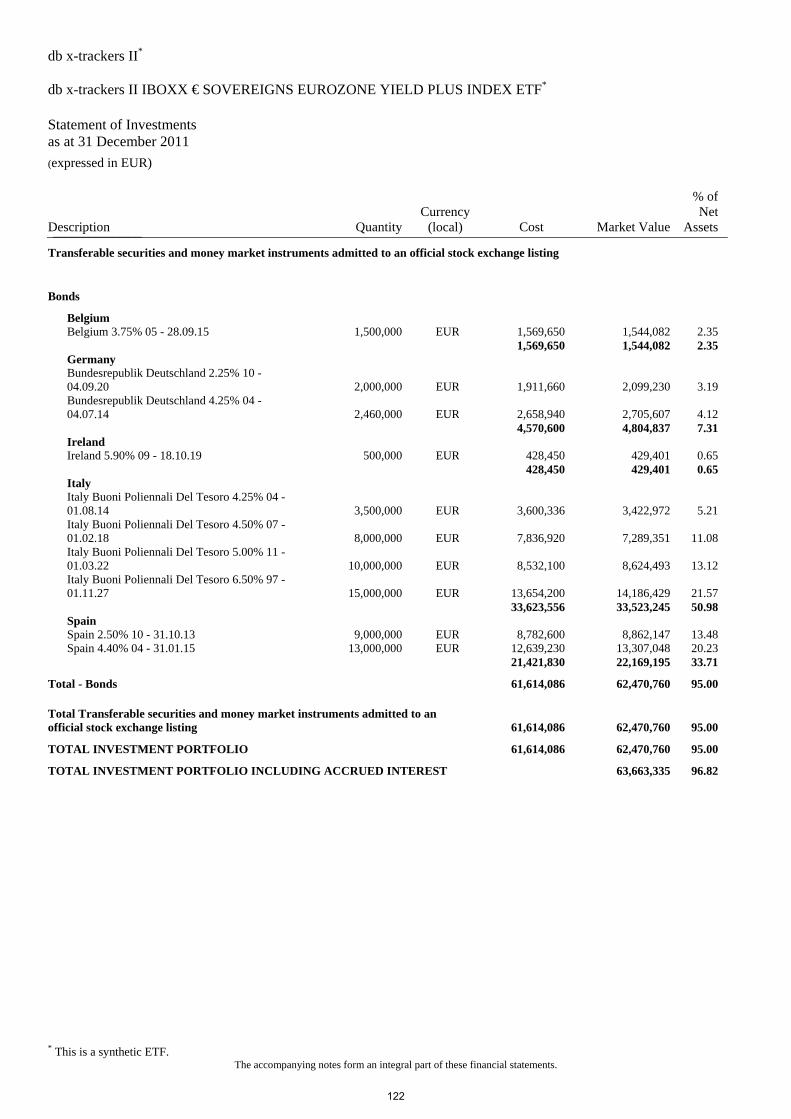
db x-trackers II* db x-trackers II IBOXX € SOVEREIGNS EUROZONE YIELD PLUS INDEX ETF* Statement of Investments as at 31 December 2011 (expressed in EUR)
* This is a synthetic ETF. The accompanying notes form an integral part of these financial statements.
Description QuantityCurrency
(local) Cost Market Value
% of Net
Assets_______________
Transferable securities and money market instruments admitted to an official stock exchange listing
Bonds
Belgium Belgium 3.75% 05 - 28.09.15 1,500,000 EUR 1,569,650 1,544,082 2.35 1,569,650 1,544,082 2.35 Germany Bundesrepublik Deutschland 2.25% 10 -
04.09.20 2,000,000 EUR 1,911,660 2,099,230 3.19 Bundesrepublik Deutschland 4.25% 04 -
04.07.14 2,460,000 EUR 2,658,940 2,705,607 4.12 4,570,600 4,804,837 7.31 Ireland Ireland 5.90% 09 - 18.10.19 500,000 EUR 428,450 429,401 0.65 428,450 429,401 0.65 Italy Italy Buoni Poliennali Del Tesoro 4.25% 04 -
01.08.14 3,500,000 EUR 3,600,336 3,422,972 5.21 Italy Buoni Poliennali Del Tesoro 4.50% 07 -
01.02.18 8,000,000 EUR 7,836,920 7,289,351 11.08 Italy Buoni Poliennali Del Tesoro 5.00% 11 -
01.03.22 10,000,000 EUR 8,532,100 8,624,493 13.12 Italy Buoni Poliennali Del Tesoro 6.50% 97 -
01.11.27 15,000,000 EUR 13,654,200 14,186,429 21.57 33,623,556 33,523,245 50.98 Spain Spain 2.50% 10 - 31.10.13 9,000,000 EUR 8,782,600 8,862,147 13.48 Spain 4.40% 04 - 31.01.15 13,000,000 EUR 12,639,230 13,307,048 20.23 21,421,830 22,169,195 33.71
Total - Bonds 61,614,086 62,470,760 95.00
Total Transferable securities and money market instruments admitted to an official stock exchange listing 61,614,086 62,470,760 95.00
TOTAL INVESTMENT PORTFOLIO 61,614,086 62,470,760 95.00
TOTAL INVESTMENT PORTFOLIO INCLUDING ACCRUED INTEREST 63,663,335 96.82
122

db x-trackers II* db x-trackers II AUSTRALIAN DOLLAR CASH ETF* Statement of Investments as at 31 December 2011 (expressed in AUD)
* This is a synthetic ETF. The accompanying notes form an integral part of these financial statements.
Description QuantityCurrency
(local) Cost Market Value
% of Net
Assets_______________
Transferable securities and money market instruments admitted to an official stock exchange listing
Bonds
Singapore Singapore 1.375% 09 - 01.10.14 1,700,000 SGD 1,384,549 1,317,102 13.46 Singapore 1.625% 08 - 01.04.13 3,115,000 SGD 2,438,500 2,395,523 24.48 Singapore 2.50% 07 - 01.10.12 1,700,000 SGD 1,382,000 1,307,193 13.36 Singapore 2.625% 07 - 01.04.12 1,300,000 SGD 1,045,906 989,187 10.11 Singapore 3.50% 02 - 01.07.12 1,700,000 SGD 1,379,273 1,306,936 13.35 Singapore 3.625% 04 - 01.07.14 3,000,000 SGD 2,589,444 2,448,291 25.02 10,219,672 9,764,232 99.78
Total - Bonds 10,219,672 9,764,232 99.78
Total Transferable securities and money market instruments admitted to an official stock exchange listing 10,219,672 9,764,232 99.78
TOTAL INVESTMENT PORTFOLIO 10,219,672 9,764,232 99.78
TOTAL INVESTMENT PORTFOLIO INCLUDING ACCRUED INTEREST 9,856,572 100.72
123
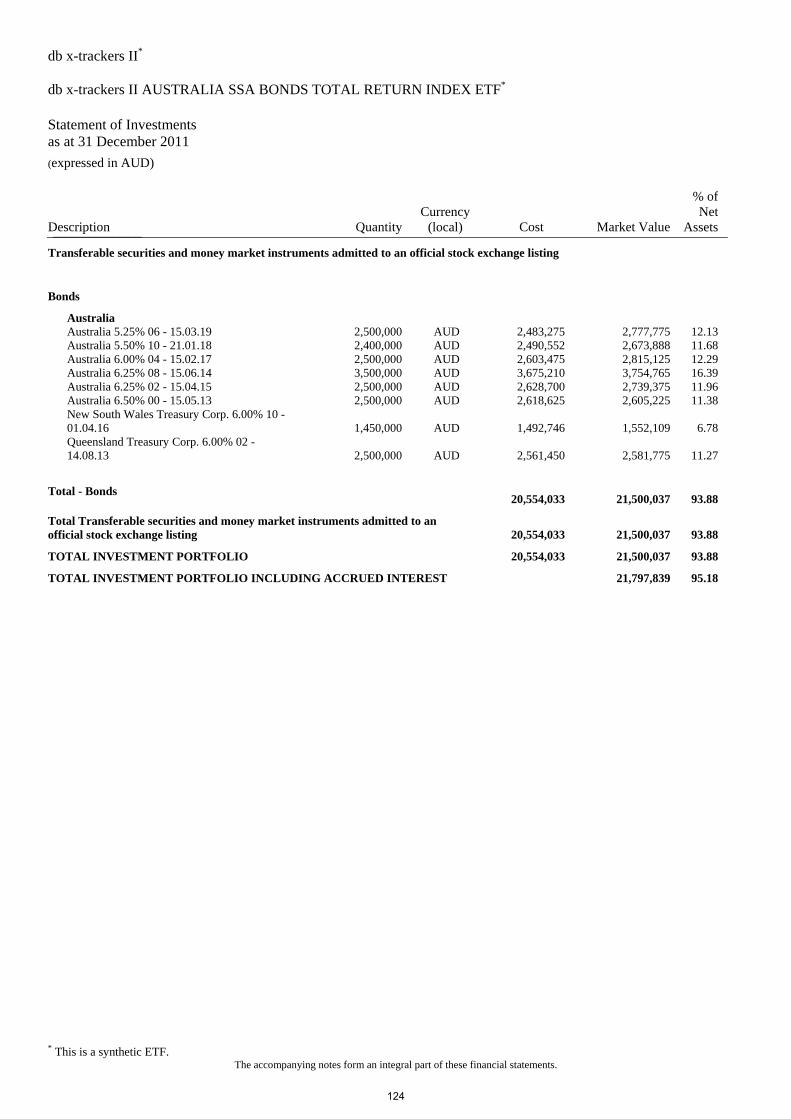
db x-trackers II* db x-trackers II AUSTRALIA SSA BONDS TOTAL RETURN INDEX ETF* Statement of Investments as at 31 December 2011 (expressed in AUD)
* This is a synthetic ETF. The accompanying notes form an integral part of these financial statements.
Description QuantityCurrency
(local) Cost Market Value
% of Net
Assets_______________
Transferable securities and money market instruments admitted to an official stock exchange listing
Bonds
Australia Australia 5.25% 06 - 15.03.19 2,500,000 AUD 2,483,275 2,777,775 12.13 Australia 5.50% 10 - 21.01.18 2,400,000 AUD 2,490,552 2,673,888 11.68 Australia 6.00% 04 - 15.02.17 2,500,000 AUD 2,603,475 2,815,125 12.29 Australia 6.25% 08 - 15.06.14 3,500,000 AUD 3,675,210 3,754,765 16.39 Australia 6.25% 02 - 15.04.15 2,500,000 AUD 2,628,700 2,739,375 11.96 Australia 6.50% 00 - 15.05.13 2,500,000 AUD 2,618,625 2,605,225 11.38 New South Wales Treasury Corp. 6.00% 10 -
01.04.16 1,450,000 AUD 1,492,746 1,552,109 6.78 Queensland Treasury Corp. 6.00% 02 -
14.08.13 2,500,000 AUD 2,561,450 2,581,775 11.27
Total - Bonds 20,554,033 21,500,037 93.88
Total Transferable securities and money market instruments admitted to an official stock exchange listing 20,554,033 21,500,037 93.88
TOTAL INVESTMENT PORTFOLIO 20,554,033 21,500,037 93.88
TOTAL INVESTMENT PORTFOLIO INCLUDING ACCRUED INTEREST 21,797,839 95.18
124
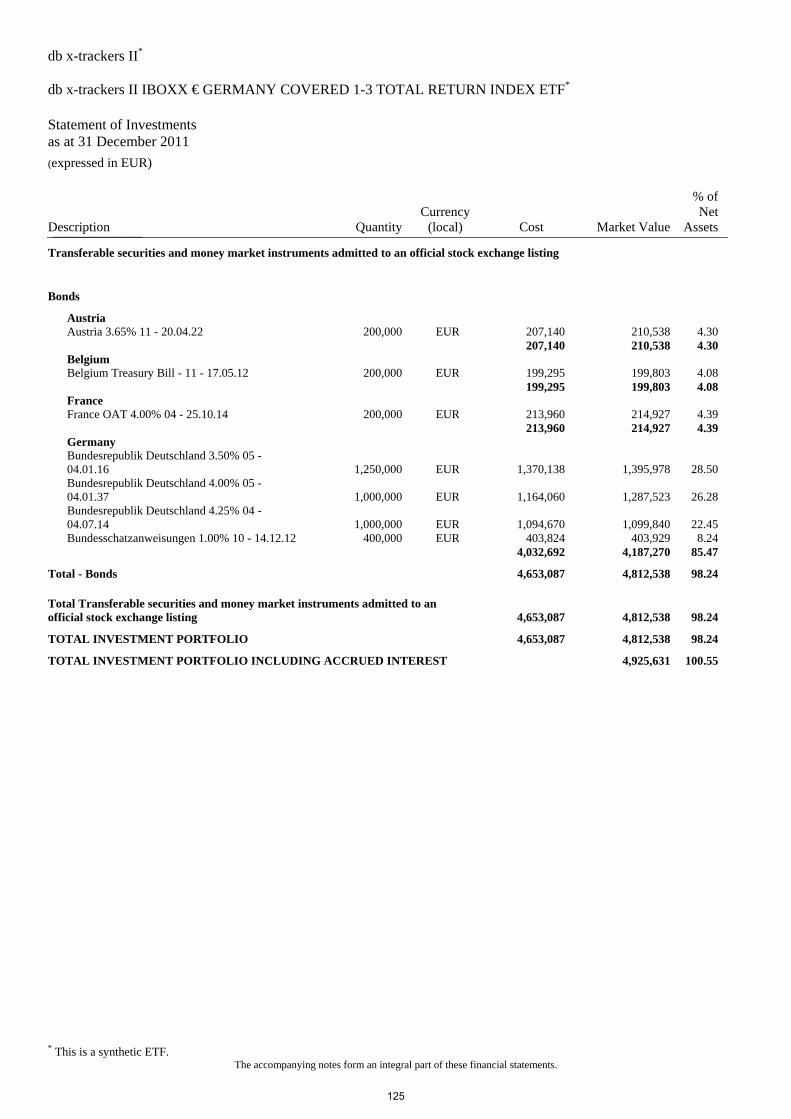
db x-trackers II* db x-trackers II IBOXX € GERMANY COVERED 1-3 TOTAL RETURN INDEX ETF* Statement of Investments as at 31 December 2011 (expressed in EUR)
* This is a synthetic ETF. The accompanying notes form an integral part of these financial statements.
Description QuantityCurrency
(local) Cost Market Value
% of Net
Assets_______________
Transferable securities and money market instruments admitted to an official stock exchange listing
Bonds
Austria Austria 3.65% 11 - 20.04.22 200,000 EUR 207,140 210,538 4.30 207,140 210,538 4.30 Belgium Belgium Treasury Bill - 11 - 17.05.12 200,000 EUR 199,295 199,803 4.08 199,295 199,803 4.08 France France OAT 4.00% 04 - 25.10.14 200,000 EUR 213,960 214,927 4.39 213,960 214,927 4.39 Germany Bundesrepublik Deutschland 3.50% 05 -
04.01.16 1,250,000 EUR 1,370,138 1,395,978 28.50 Bundesrepublik Deutschland 4.00% 05 -
04.01.37 1,000,000 EUR 1,164,060 1,287,523 26.28 Bundesrepublik Deutschland 4.25% 04 -
04.07.14 1,000,000 EUR 1,094,670 1,099,840 22.45 Bundesschatzanweisungen 1.00% 10 - 14.12.12 400,000 EUR 403,824 403,929 8.24 4,032,692 4,187,270 85.47
Total - Bonds 4,653,087 4,812,538 98.24
Total Transferable securities and money market instruments admitted to an official stock exchange listing 4,653,087 4,812,538 98.24
TOTAL INVESTMENT PORTFOLIO 4,653,087 4,812,538 98.24
TOTAL INVESTMENT PORTFOLIO INCLUDING ACCRUED INTEREST 4,925,631 100.55
125
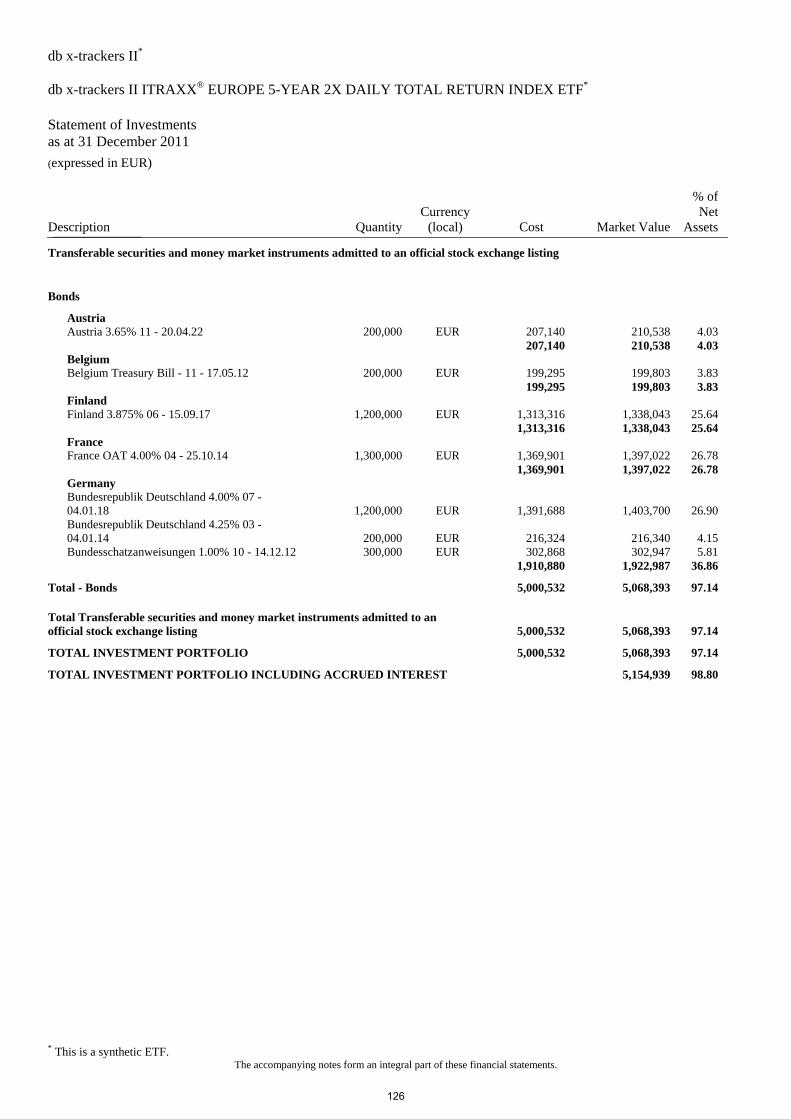
db x-trackers II* db x-trackers II ITRAXX® EUROPE 5-YEAR 2X DAILY TOTAL RETURN INDEX ETF* Statement of Investments as at 31 December 2011 (expressed in EUR)
* This is a synthetic ETF. The accompanying notes form an integral part of these financial statements.
Description QuantityCurrency
(local) Cost Market Value
% of Net
Assets_______________
Transferable securities and money market instruments admitted to an official stock exchange listing
Bonds
Austria Austria 3.65% 11 - 20.04.22 200,000 EUR 207,140 210,538 4.03 207,140 210,538 4.03 Belgium Belgium Treasury Bill - 11 - 17.05.12 200,000 EUR 199,295 199,803 3.83 199,295 199,803 3.83 Finland Finland 3.875% 06 - 15.09.17 1,200,000 EUR 1,313,316 1,338,043 25.64 1,313,316 1,338,043 25.64 France France OAT 4.00% 04 - 25.10.14 1,300,000 EUR 1,369,901 1,397,022 26.78 1,369,901 1,397,022 26.78 Germany Bundesrepublik Deutschland 4.00% 07 -
04.01.18 1,200,000 EUR 1,391,688 1,403,700 26.90 Bundesrepublik Deutschland 4.25% 03 -
04.01.14 200,000 EUR 216,324 216,340 4.15 Bundesschatzanweisungen 1.00% 10 - 14.12.12 300,000 EUR 302,868 302,947 5.81 1,910,880 1,922,987 36.86
Total - Bonds 5,000,532 5,068,393 97.14
Total Transferable securities and money market instruments admitted to an official stock exchange listing 5,000,532 5,068,393 97.14
TOTAL INVESTMENT PORTFOLIO 5,000,532 5,068,393 97.14
TOTAL INVESTMENT PORTFOLIO INCLUDING ACCRUED INTEREST 5,154,939 98.80
126

db x-trackers II* db x-trackers II ITRAXX® CROSSOVER 5-YEAR 2X DAILY TOTAL RETURN INDEX ETF* Statement of Investments as at 31 December 2011 (expressed in EUR)
* This is a synthetic ETF. The accompanying notes form an integral part of these financial statements.
Description QuantityCurrency
(local) Cost Market Value
% of Net
Assets_______________
Transferable securities and money market instruments admitted to an official stock exchange listing
Bonds
Austria Austria 3.65% 11 - 20.04.22 200,000 EUR 207,140 210,538 4.41 207,140 210,538 4.41 Belgium Belgium Treasury Bill - 11 - 17.05.12 200,000 EUR 199,295 199,803 4.18 199,295 199,803 4.18 Finland Finland 3.875% 06 - 15.09.17 1,100,000 EUR 1,203,873 1,226,539 25.68 1,203,873 1,226,539 25.68 France France OAT 4.00% 04 - 25.10.14 1,500,000 EUR 1,580,655 1,611,948 33.76 1,580,655 1,611,948 33.76 Germany Bundesrepublik Deutschland 4.00% 07 -
04.01.18 1,000,000 EUR 1,159,740 1,169,751 24.50 Bundesrepublik Deutschland 4.25% 03 -
04.01.14 200,000 EUR 216,324 216,340 4.53 1,376,064 1,386,091 29.03
Total - Bonds 4,567,027 4,634,919 97.06
Total Transferable securities and money market instruments admitted to an official stock exchange listing 4,567,027 4,634,919 97.06
TOTAL INVESTMENT PORTFOLIO 4,567,027 4,634,919 97.06
TOTAL INVESTMENT PORTFOLIO INCLUDING ACCRUED INTEREST 4,713,726 98.71
127
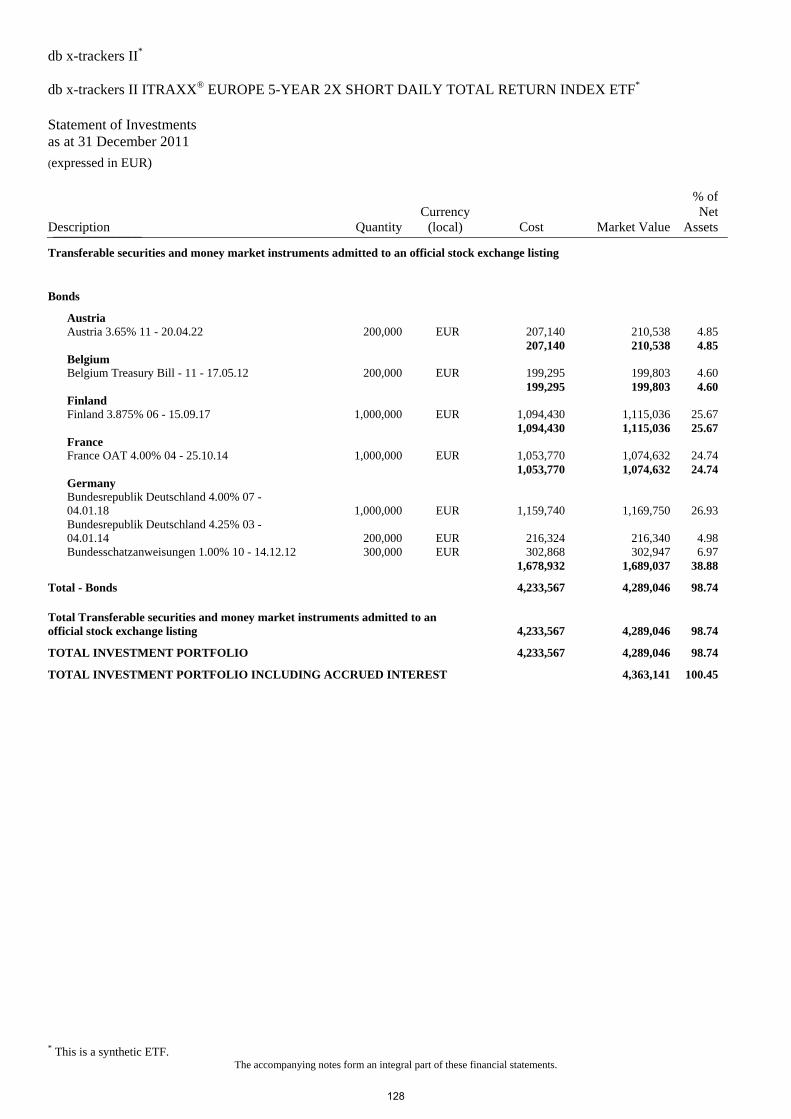
db x-trackers II* db x-trackers II ITRAXX® EUROPE 5-YEAR 2X SHORT DAILY TOTAL RETURN INDEX ETF* Statement of Investments as at 31 December 2011 (expressed in EUR)
* This is a synthetic ETF. The accompanying notes form an integral part of these financial statements.
Description QuantityCurrency
(local) Cost Market Value
% of Net
Assets_______________
Transferable securities and money market instruments admitted to an official stock exchange listing
Bonds
Austria Austria 3.65% 11 - 20.04.22 200,000 EUR 207,140 210,538 4.85 207,140 210,538 4.85 Belgium Belgium Treasury Bill - 11 - 17.05.12 200,000 EUR 199,295 199,803 4.60 199,295 199,803 4.60 Finland Finland 3.875% 06 - 15.09.17 1,000,000 EUR 1,094,430 1,115,036 25.67 1,094,430 1,115,036 25.67 France France OAT 4.00% 04 - 25.10.14 1,000,000 EUR 1,053,770 1,074,632 24.74 1,053,770 1,074,632 24.74 Germany Bundesrepublik Deutschland 4.00% 07 -
04.01.18 1,000,000 EUR 1,159,740 1,169,750 26.93 Bundesrepublik Deutschland 4.25% 03 -
04.01.14 200,000 EUR 216,324 216,340 4.98 Bundesschatzanweisungen 1.00% 10 - 14.12.12 300,000 EUR 302,868 302,947 6.97 1,678,932 1,689,037 38.88
Total - Bonds 4,233,567 4,289,046 98.74
Total Transferable securities and money market instruments admitted to an official stock exchange listing 4,233,567 4,289,046 98.74
TOTAL INVESTMENT PORTFOLIO 4,233,567 4,289,046 98.74
TOTAL INVESTMENT PORTFOLIO INCLUDING ACCRUED INTEREST 4,363,141 100.45
128
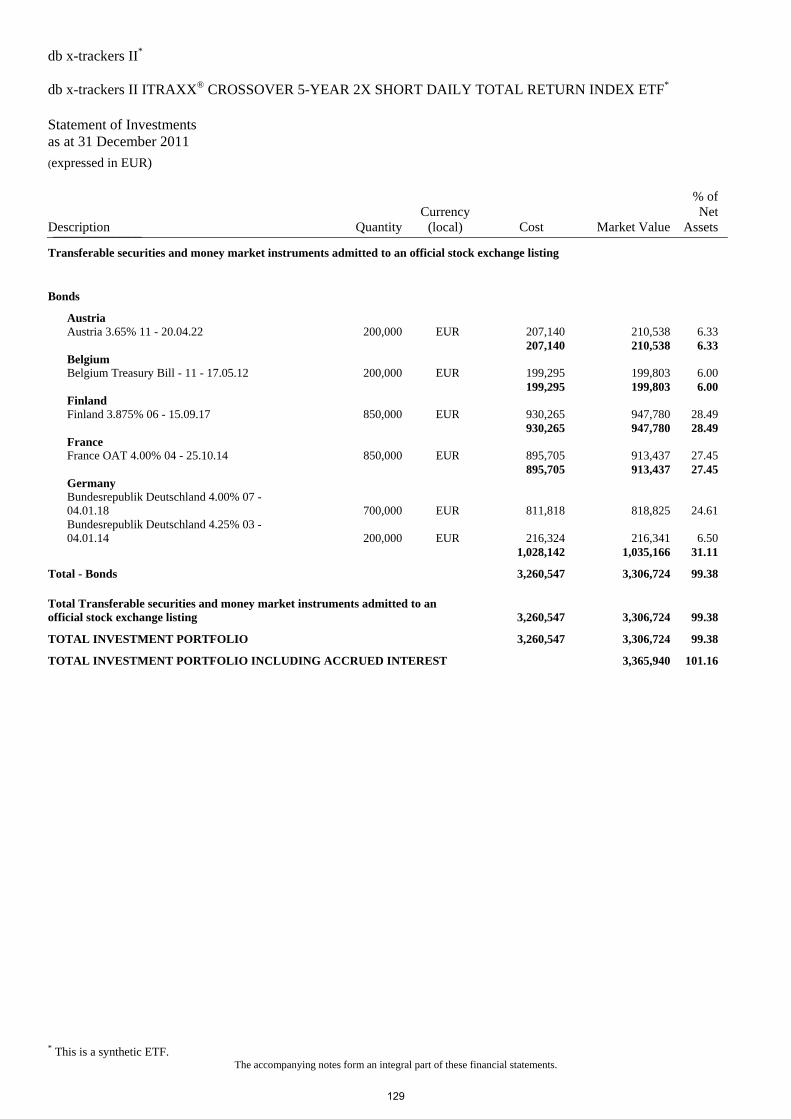
db x-trackers II* db x-trackers II ITRAXX® CROSSOVER 5-YEAR 2X SHORT DAILY TOTAL RETURN INDEX ETF* Statement of Investments as at 31 December 2011 (expressed in EUR)
* This is a synthetic ETF. The accompanying notes form an integral part of these financial statements.
Description QuantityCurrency
(local) Cost Market Value
% of Net
Assets_______________
Transferable securities and money market instruments admitted to an official stock exchange listing
Bonds
Austria Austria 3.65% 11 - 20.04.22 200,000 EUR 207,140 210,538 6.33 207,140 210,538 6.33 Belgium Belgium Treasury Bill - 11 - 17.05.12 200,000 EUR 199,295 199,803 6.00 199,295 199,803 6.00 Finland Finland 3.875% 06 - 15.09.17 850,000 EUR 930,265 947,780 28.49 930,265 947,780 28.49 France France OAT 4.00% 04 - 25.10.14 850,000 EUR 895,705 913,437 27.45 895,705 913,437 27.45 Germany Bundesrepublik Deutschland 4.00% 07 -
04.01.18 700,000 EUR 811,818 818,825 24.61 Bundesrepublik Deutschland 4.25% 03 -
04.01.14 200,000 EUR 216,324 216,341 6.50 1,028,142 1,035,166 31.11
Total - Bonds 3,260,547 3,306,724 99.38
Total Transferable securities and money market instruments admitted to an official stock exchange listing 3,260,547 3,306,724 99.38
TOTAL INVESTMENT PORTFOLIO 3,260,547 3,306,724 99.38
TOTAL INVESTMENT PORTFOLIO INCLUDING ACCRUED INTEREST 3,365,940 101.16
129
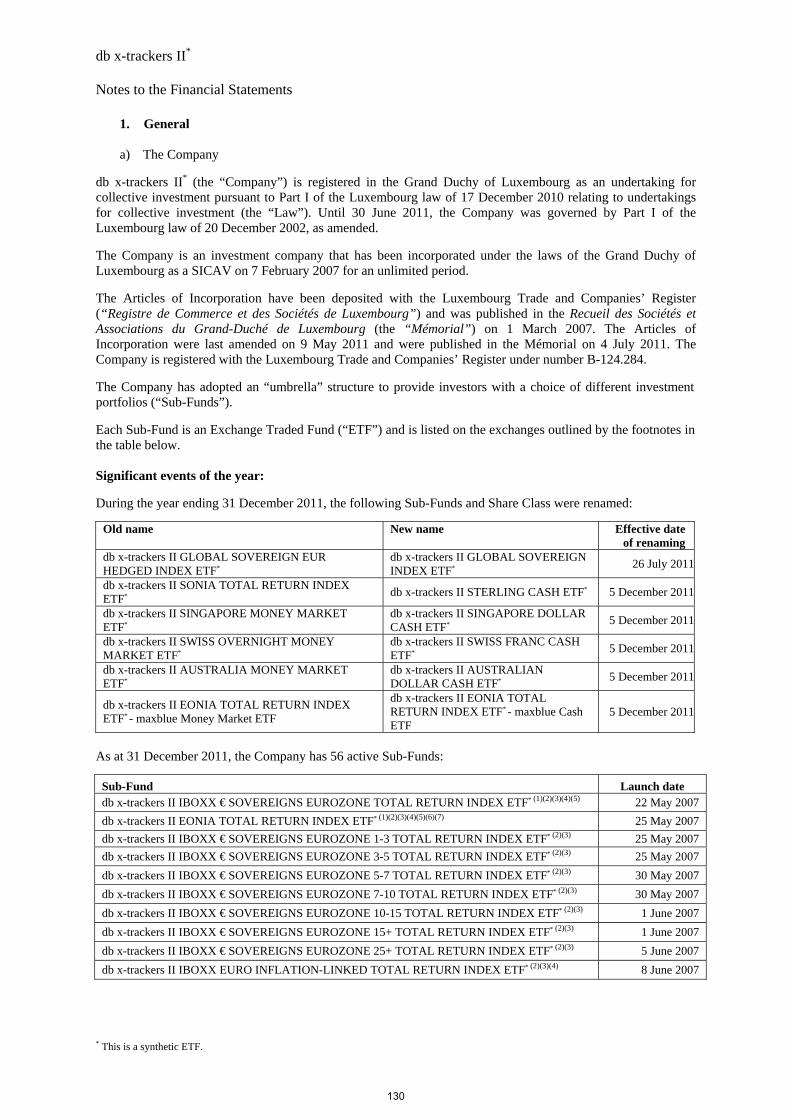
db x-trackers II* Notes to the Financial Statements
* This is a synthetic ETF.
1. General
a) The Company
db x-trackers II* (the “Company”) is registered in the Grand Duchy of Luxembourg as an undertaking for collective investment pursuant to Part I of the Luxembourg law of 17 December 2010 relating to undertakings for collective investment (the “Law”). Until 30 June 2011, the Company was governed by Part I of the Luxembourg law of 20 December 2002, as amended.
The Company is an investment company that has been incorporated under the laws of the Grand Duchy of Luxembourg as a SICAV on 7 February 2007 for an unlimited period.
The Articles of Incorporation have been deposited with the Luxembourg Trade and Companies’ Register (“Registre de Commerce et des Sociétés de Luxembourg”) and was published in the Recueil des Sociétés et Associations du Grand-Duché de Luxembourg (the “Mémorial”) on 1 March 2007. The Articles of Incorporation were last amended on 9 May 2011 and were published in the Mémorial on 4 July 2011. The Company is registered with the Luxembourg Trade and Companies’ Register under number B-124.284.
The Company has adopted an “umbrella” structure to provide investors with a choice of different investment portfolios (“Sub-Funds”).
Each Sub-Fund is an Exchange Traded Fund (“ETF”) and is listed on the exchanges outlined by the footnotes in the table below. Significant events of the year: During the year ending 31 December 2011, the following Sub-Funds and Share Class were renamed:
Old name New name Effective date of renaming
db x-trackers II GLOBAL SOVEREIGN EUR HEDGED INDEX ETF*
db x-trackers II GLOBAL SOVEREIGN INDEX ETF*
26 July 2011
db x-trackers II SONIA TOTAL RETURN INDEX ETF*
db x-trackers II STERLING CASH ETF* 5 December 2011
db x-trackers II SINGAPORE MONEY MARKET ETF*
db x-trackers II SINGAPORE DOLLAR CASH ETF*
5 December 2011
db x-trackers II SWISS OVERNIGHT MONEY MARKET ETF*
db x-trackers II SWISS FRANC CASH ETF*
5 December 2011
db x-trackers II AUSTRALIA MONEY MARKET ETF*
db x-trackers II AUSTRALIAN DOLLAR CASH ETF*
5 December 2011
db x-trackers II EONIA TOTAL RETURN INDEX ETF* - maxblue Money Market ETF
db x-trackers II EONIA TOTAL RETURN INDEX ETF* - maxblue Cash ETF
5 December 2011
As at 31 December 2011, the Company has 56 active Sub-Funds:
Sub-Fund Launch date db x-trackers II IBOXX € SOVEREIGNS EUROZONE TOTAL RETURN INDEX ETF* (1)(2)(3)(4)(5) 22 May 2007
db x-trackers II EONIA TOTAL RETURN INDEX ETF* (1)(2)(3)(4)(5)(6)(7) 25 May 2007
db x-trackers II IBOXX € SOVEREIGNS EUROZONE 1-3 TOTAL RETURN INDEX ETF* (2)(3) 25 May 2007
db x-trackers II IBOXX € SOVEREIGNS EUROZONE 3-5 TOTAL RETURN INDEX ETF* (2)(3) 25 May 2007
db x-trackers II IBOXX € SOVEREIGNS EUROZONE 5-7 TOTAL RETURN INDEX ETF* (2)(3) 30 May 2007
db x-trackers II IBOXX € SOVEREIGNS EUROZONE 7-10 TOTAL RETURN INDEX ETF* (2)(3) 30 May 2007
db x-trackers II IBOXX € SOVEREIGNS EUROZONE 10-15 TOTAL RETURN INDEX ETF* (2)(3) 1 June 2007
db x-trackers II IBOXX € SOVEREIGNS EUROZONE 15+ TOTAL RETURN INDEX ETF* (2)(3) 1 June 2007
db x-trackers II IBOXX € SOVEREIGNS EUROZONE 25+ TOTAL RETURN INDEX ETF* (2)(3) 5 June 2007
db x-trackers II IBOXX EURO INFLATION-LINKED TOTAL RETURN INDEX ETF* (2)(3)(4) 8 June 2007
130
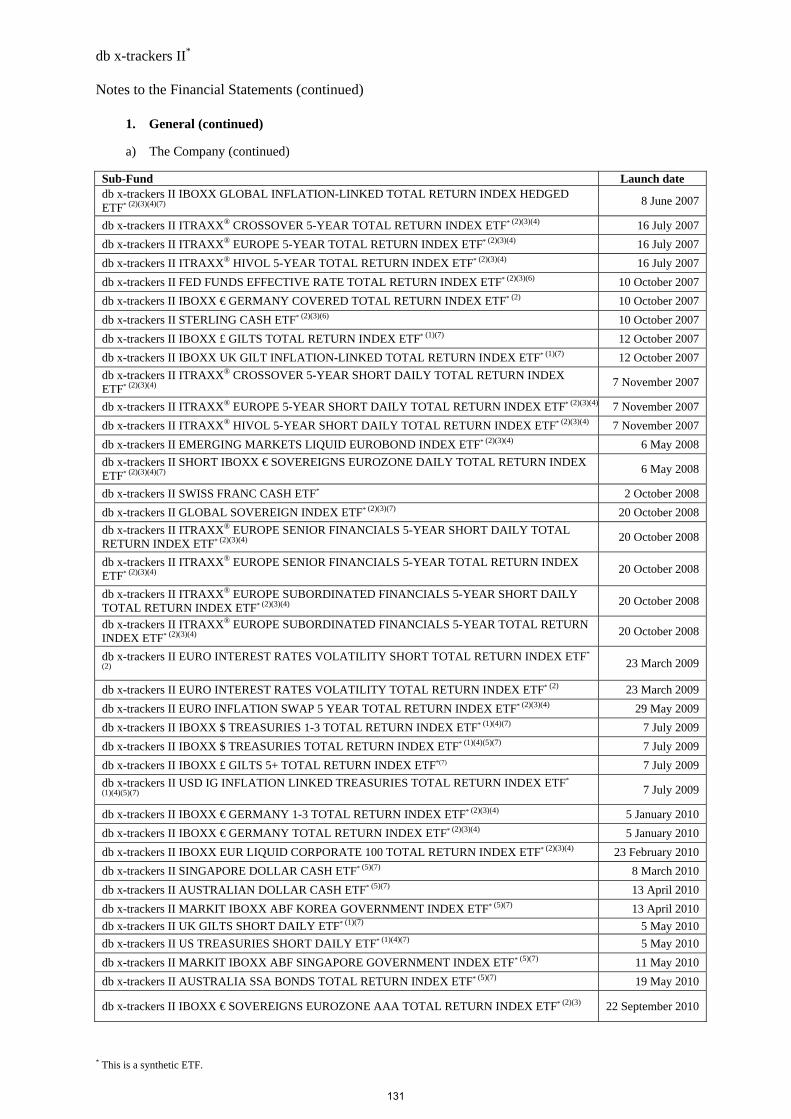
db x-trackers II* Notes to the Financial Statements (continued)
* This is a synthetic ETF.
1. General (continued)
a) The Company (continued) Sub-Fund Launch date db x-trackers II IBOXX GLOBAL INFLATION-LINKED TOTAL RETURN INDEX HEDGED ETF* (2)(3)(4)(7)
8 June 2007
db x-trackers II ITRAXX® CROSSOVER 5-YEAR TOTAL RETURN INDEX ETF* (2)(3)(4) 16 July 2007
db x-trackers II ITRAXX® EUROPE 5-YEAR TOTAL RETURN INDEX ETF* (2)(3)(4) 16 July 2007
db x-trackers II ITRAXX® HIVOL 5-YEAR TOTAL RETURN INDEX ETF* (2)(3)(4) 16 July 2007
db x-trackers II FED FUNDS EFFECTIVE RATE TOTAL RETURN INDEX ETF* (2)(3)(6) 10 October 2007
db x-trackers II IBOXX € GERMANY COVERED TOTAL RETURN INDEX ETF* (2) 10 October 2007
db x-trackers II STERLING CASH ETF* (2)(3)(6) 10 October 2007
db x-trackers II IBOXX £ GILTS TOTAL RETURN INDEX ETF* (1)(7) 12 October 2007
db x-trackers II IBOXX UK GILT INFLATION-LINKED TOTAL RETURN INDEX ETF* (1)(7) 12 October 2007
db x-trackers II ITRAXX® CROSSOVER 5-YEAR SHORT DAILY TOTAL RETURN INDEX ETF* (2)(3)(4)
7 November 2007
db x-trackers II ITRAXX® EUROPE 5-YEAR SHORT DAILY TOTAL RETURN INDEX ETF* (2)(3)(4) 7 November 2007
db x-trackers II ITRAXX® HIVOL 5-YEAR SHORT DAILY TOTAL RETURN INDEX ETF* (2)(3)(4) 7 November 2007
db x-trackers II EMERGING MARKETS LIQUID EUROBOND INDEX ETF* (2)(3)(4) 6 May 2008
db x-trackers II SHORT IBOXX € SOVEREIGNS EUROZONE DAILY TOTAL RETURN INDEX ETF* (2)(3)(4)(7)
6 May 2008
db x-trackers II SWISS FRANC CASH ETF* 2 October 2008
db x-trackers II GLOBAL SOVEREIGN INDEX ETF* (2)(3)(7) 20 October 2008
db x-trackers II ITRAXX® EUROPE SENIOR FINANCIALS 5-YEAR SHORT DAILY TOTAL RETURN INDEX ETF* (2)(3)(4)
20 October 2008
db x-trackers II ITRAXX® EUROPE SENIOR FINANCIALS 5-YEAR TOTAL RETURN INDEX ETF* (2)(3)(4)
20 October 2008
db x-trackers II ITRAXX® EUROPE SUBORDINATED FINANCIALS 5-YEAR SHORT DAILY TOTAL RETURN INDEX ETF* (2)(3)(4)
20 October 2008
db x-trackers II ITRAXX® EUROPE SUBORDINATED FINANCIALS 5-YEAR TOTAL RETURN INDEX ETF* (2)(3)(4)
20 October 2008
db x-trackers II EURO INTEREST RATES VOLATILITY SHORT TOTAL RETURN INDEX ETF*
(2) 23 March 2009
db x-trackers II EURO INTEREST RATES VOLATILITY TOTAL RETURN INDEX ETF* (2) 23 March 2009
db x-trackers II EURO INFLATION SWAP 5 YEAR TOTAL RETURN INDEX ETF* (2)(3)(4) 29 May 2009
db x-trackers II IBOXX $ TREASURIES 1-3 TOTAL RETURN INDEX ETF* (1)(4)(7) 7 July 2009
db x-trackers II IBOXX $ TREASURIES TOTAL RETURN INDEX ETF* (1)(4)(5)(7) 7 July 2009
db x-trackers II IBOXX £ GILTS 5+ TOTAL RETURN INDEX ETF*(7) 7 July 2009
db x-trackers II USD IG INFLATION LINKED TREASURIES TOTAL RETURN INDEX ETF*
(1)(4)(5)(7) 7 July 2009
db x-trackers II IBOXX € GERMANY 1-3 TOTAL RETURN INDEX ETF* (2)(3)(4) 5 January 2010
db x-trackers II IBOXX € GERMANY TOTAL RETURN INDEX ETF* (2)(3)(4) 5 January 2010
db x-trackers II IBOXX EUR LIQUID CORPORATE 100 TOTAL RETURN INDEX ETF* (2)(3)(4) 23 February 2010
db x-trackers II SINGAPORE DOLLAR CASH ETF* (5)(7) 8 March 2010
db x-trackers II AUSTRALIAN DOLLAR CASH ETF* (5)(7) 13 April 2010
db x-trackers II MARKIT IBOXX ABF KOREA GOVERNMENT INDEX ETF* (5)(7) 13 April 2010
db x-trackers II UK GILTS SHORT DAILY ETF* (1)(7) 5 May 2010
db x-trackers II US TREASURIES SHORT DAILY ETF* (1)(4)(7) 5 May 2010
db x-trackers II MARKIT IBOXX ABF SINGAPORE GOVERNMENT INDEX ETF* (5)(7) 11 May 2010
db x-trackers II AUSTRALIA SSA BONDS TOTAL RETURN INDEX ETF* (5)(7) 19 May 2010
db x-trackers II IBOXX € SOVEREIGNS EUROZONE AAA TOTAL RETURN INDEX ETF* (2)(3) 22 September 2010
131

db x-trackers II* Notes to the Financial Statements (continued)
* This is a synthetic ETF.
1. General (continued)
a) The Company (continued) Sub-Fund Launch date
db x-trackers II IBOXX € SOVEREIGNS EUROZONE YIELD PLUS INDEX ETF* (2)(3) 22 September 2010
db x-trackers II IBOXX EUR LIQUID CORPORATE 100 FINANCIALS SUB-INDEX TOTAL RETURN ETF* (2)(3) 18 October 2010
db x-trackers II IBOXX EUR LIQUID CORPORATE 100 NON-FINANCIALS SUB-INDEX TOTAL RETURN ETF* (2)(3) 18 October 2010
db x-trackers II IBOXX € GERMANY COVERED 1-3 TOTAL RETURN INDEX ETF*(2) 24 August 2011
db x-trackers II ITRAXX® EUROPE 5-YEAR 2X DAILY TOTAL RETURN INDEX ETF*(2) 22 November 2011
db x-trackers II ITRAXX® CROSSOVER 5-YEAR 2X DAILY TOTAL RETURN INDEX ETF*(2) 22 November 2011
db x-trackers II ITRAXX® EUROPE 5-YEAR 2X SHORT DAILY TOTAL RETURN INDEX ETF*(2)
22 November 2011
db x-trackers II ITRAXX® CROSSOVER 5-YEAR 2X SHORT DAILY TOTAL RETURN INDEX ETF*(2)
22 November 2011
(1) Sub-Fund listed on London Stock Exchange. (2) Sub-Fund listed on Deutsche Börse. (3) Sub-Fund listed on Borsa Italiana. (4) Sub-Fund listed on SIX Swiss Exchange. (5) Sub-Fund listed on Singapore Stock Exchange. (6) Sub-Fund listed on Euronext Paris. (7) Sub-Fund listed on Luxembourg Stock Exchange (technical listing, Sub-Fund is not traded on the
Luxembourg Stock Exchange). The Investment Objective of the Sub-Funds is to provide the investors with a return linked to the performance of the Underlying Asset. The Sub-Funds will mainly invest in transferable securities and/or money market instruments and use derivative techniques such as index swap agreements to exchange the performance of the transferable securities and/or money market instruments the Sub-Funds invest in against the performance of the Index. The investors do not bear any performance or currency risk of the transferable securities and/or money market instruments. The liabilities of each Sub-Fund shall be segregated on a Sub-Fund by Sub-Fund basis with third party creditors having recourse only to the assets of the Sub-Fund concerned.
b) The Shares
The Shares may be divided into Shares of Classes “I” and “R”. The Shares will be issued by the Company exclusively in relation to Sub-Funds with an Investment Objective for which the subscription will normally be in cash. Shares of Class “I” are available only to Institutional Investors whilst Shares of Class “R” are primarily designated for Retail Investors. The Shares may be further differentiated between Distribution Shares (identified by the letter “D”) and Capitalisation Shares (identified by the letter “C”). Other Classes may be offered with specific features such as conversion or redemption charge, minimum subscription amount, fee structures or other specific features. Within each Class of Shares, several types of sub-classes can be issued, differentiating between (but not limited to) dividend payment structures, dividend payment dates, and fee structures. The Shares will be listed for trading on one or more stock exchanges.
132
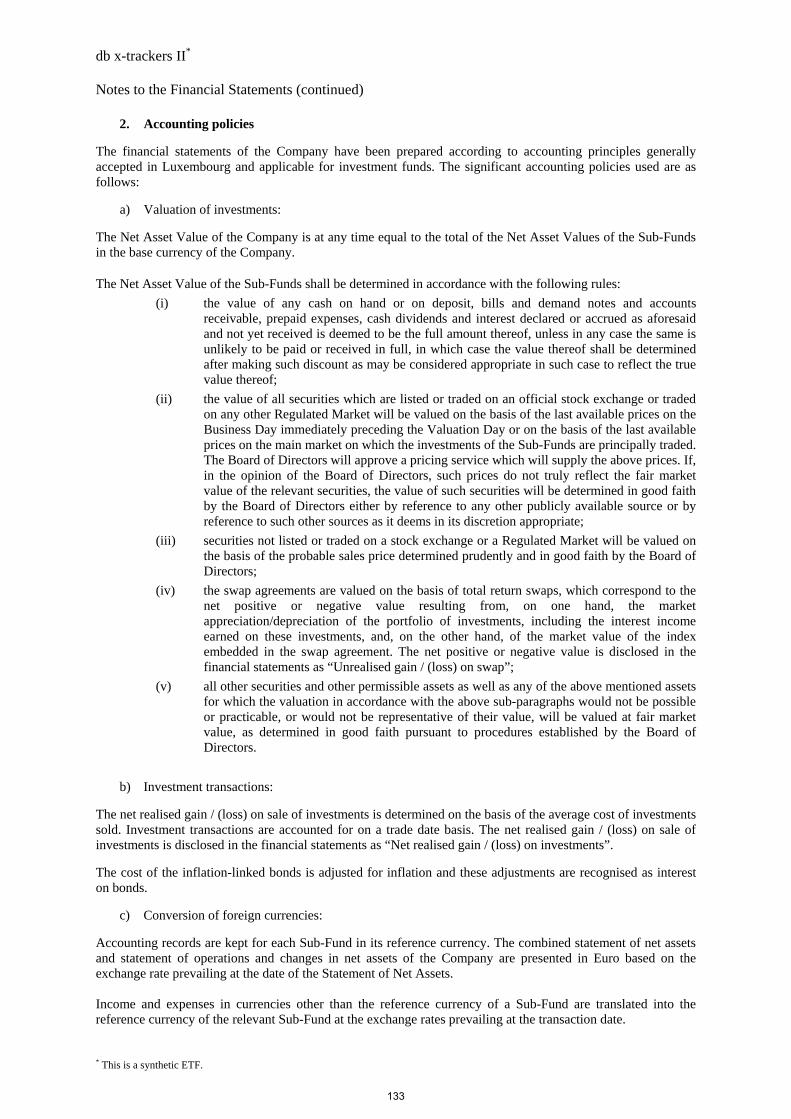
db x-trackers II* Notes to the Financial Statements (continued)
* This is a synthetic ETF.
2. Accounting policies The financial statements of the Company have been prepared according to accounting principles generally accepted in Luxembourg and applicable for investment funds. The significant accounting policies used are as follows:
a) Valuation of investments:
The Net Asset Value of the Company is at any time equal to the total of the Net Asset Values of the Sub-Funds in the base currency of the Company.
The Net Asset Value of the Sub-Funds shall be determined in accordance with the following rules:
(i) the value of any cash on hand or on deposit, bills and demand notes and accounts receivable, prepaid expenses, cash dividends and interest declared or accrued as aforesaid and not yet received is deemed to be the full amount thereof, unless in any case the same is unlikely to be paid or received in full, in which case the value thereof shall be determined after making such discount as may be considered appropriate in such case to reflect the true value thereof;
(ii) the value of all securities which are listed or traded on an official stock exchange or traded on any other Regulated Market will be valued on the basis of the last available prices on the Business Day immediately preceding the Valuation Day or on the basis of the last available prices on the main market on which the investments of the Sub-Funds are principally traded. The Board of Directors will approve a pricing service which will supply the above prices. If, in the opinion of the Board of Directors, such prices do not truly reflect the fair market value of the relevant securities, the value of such securities will be determined in good faith by the Board of Directors either by reference to any other publicly available source or by reference to such other sources as it deems in its discretion appropriate;
(iii) securities not listed or traded on a stock exchange or a Regulated Market will be valued on the basis of the probable sales price determined prudently and in good faith by the Board of Directors;
(iv) the swap agreements are valued on the basis of total return swaps, which correspond to the net positive or negative value resulting from, on one hand, the market appreciation/depreciation of the portfolio of investments, including the interest income earned on these investments, and, on the other hand, of the market value of the index embedded in the swap agreement. The net positive or negative value is disclosed in the financial statements as “Unrealised gain / (loss) on swap”;
(v) all other securities and other permissible assets as well as any of the above mentioned assets for which the valuation in accordance with the above sub-paragraphs would not be possible or practicable, or would not be representative of their value, will be valued at fair market value, as determined in good faith pursuant to procedures established by the Board of Directors.
b) Investment transactions:
The net realised gain / (loss) on sale of investments is determined on the basis of the average cost of investments sold. Investment transactions are accounted for on a trade date basis. The net realised gain / (loss) on sale of investments is disclosed in the financial statements as “Net realised gain / (loss) on investments”.
The cost of the inflation-linked bonds is adjusted for inflation and these adjustments are recognised as interest on bonds.
c) Conversion of foreign currencies:
Accounting records are kept for each Sub-Fund in its reference currency. The combined statement of net assets and statement of operations and changes in net assets of the Company are presented in Euro based on the exchange rate prevailing at the date of the Statement of Net Assets. Income and expenses in currencies other than the reference currency of a Sub-Fund are translated into the reference currency of the relevant Sub-Fund at the exchange rates prevailing at the transaction date.
133
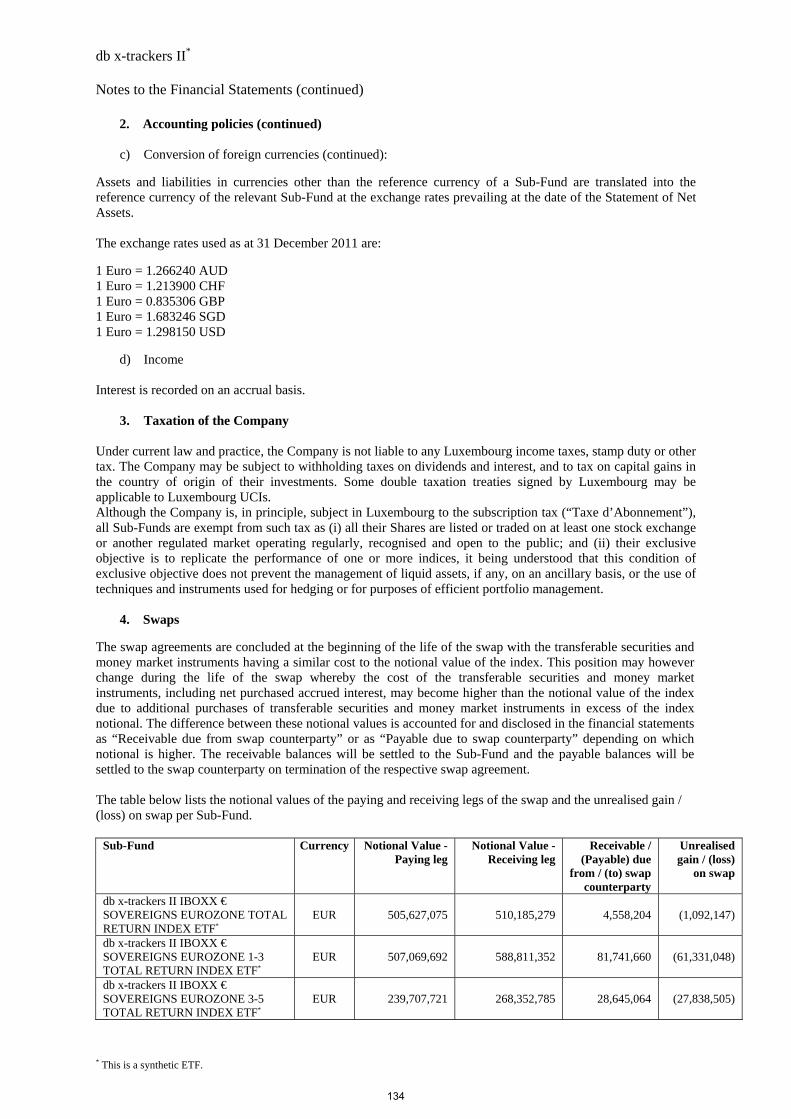
db x-trackers II* Notes to the Financial Statements (continued)
* This is a synthetic ETF.
2. Accounting policies (continued) c) Conversion of foreign currencies (continued):
Assets and liabilities in currencies other than the reference currency of a Sub-Fund are translated into the reference currency of the relevant Sub-Fund at the exchange rates prevailing at the date of the Statement of Net Assets. The exchange rates used as at 31 December 2011 are:
1 Euro = 1.266240 AUD 1 Euro = 1.213900 CHF 1 Euro = 0.835306 GBP 1 Euro = 1.683246 SGD 1 Euro = 1.298150 USD
d) Income Interest is recorded on an accrual basis.
3. Taxation of the Company Under current law and practice, the Company is not liable to any Luxembourg income taxes, stamp duty or other tax. The Company may be subject to withholding taxes on dividends and interest, and to tax on capital gains in the country of origin of their investments. Some double taxation treaties signed by Luxembourg may be applicable to Luxembourg UCIs. Although the Company is, in principle, subject in Luxembourg to the subscription tax (“Taxe d’Abonnement”), all Sub-Funds are exempt from such tax as (i) all their Shares are listed or traded on at least one stock exchange or another regulated market operating regularly, recognised and open to the public; and (ii) their exclusive objective is to replicate the performance of one or more indices, it being understood that this condition of exclusive objective does not prevent the management of liquid assets, if any, on an ancillary basis, or the use of techniques and instruments used for hedging or for purposes of efficient portfolio management.
4. Swaps
The swap agreements are concluded at the beginning of the life of the swap with the transferable securities and money market instruments having a similar cost to the notional value of the index. This position may however change during the life of the swap whereby the cost of the transferable securities and money market instruments, including net purchased accrued interest, may become higher than the notional value of the index due to additional purchases of transferable securities and money market instruments in excess of the index notional. The difference between these notional values is accounted for and disclosed in the financial statements as “Receivable due from swap counterparty” or as “Payable due to swap counterparty” depending on which notional is higher. The receivable balances will be settled to the Sub-Fund and the payable balances will be settled to the swap counterparty on termination of the respective swap agreement. The table below lists the notional values of the paying and receiving legs of the swap and the unrealised gain / (loss) on swap per Sub-Fund.
Sub-Fund Currency Notional Value - Paying leg
Notional Value - Receiving leg
Receivable / (Payable) due
from / (to) swap counterparty
Unrealised gain / (loss)
on swap
db x-trackers II IBOXX € SOVEREIGNS EUROZONE TOTAL RETURN INDEX ETF*
EUR 505,627,075 510,185,279 4,558,204 (1,092,147)
db x-trackers II IBOXX € SOVEREIGNS EUROZONE 1-3 TOTAL RETURN INDEX ETF*
EUR 507,069,692 588,811,352 81,741,660 (61,331,048)
db x-trackers II IBOXX € SOVEREIGNS EUROZONE 3-5 TOTAL RETURN INDEX ETF*
EUR 239,707,721 268,352,785 28,645,064 (27,838,505)
134
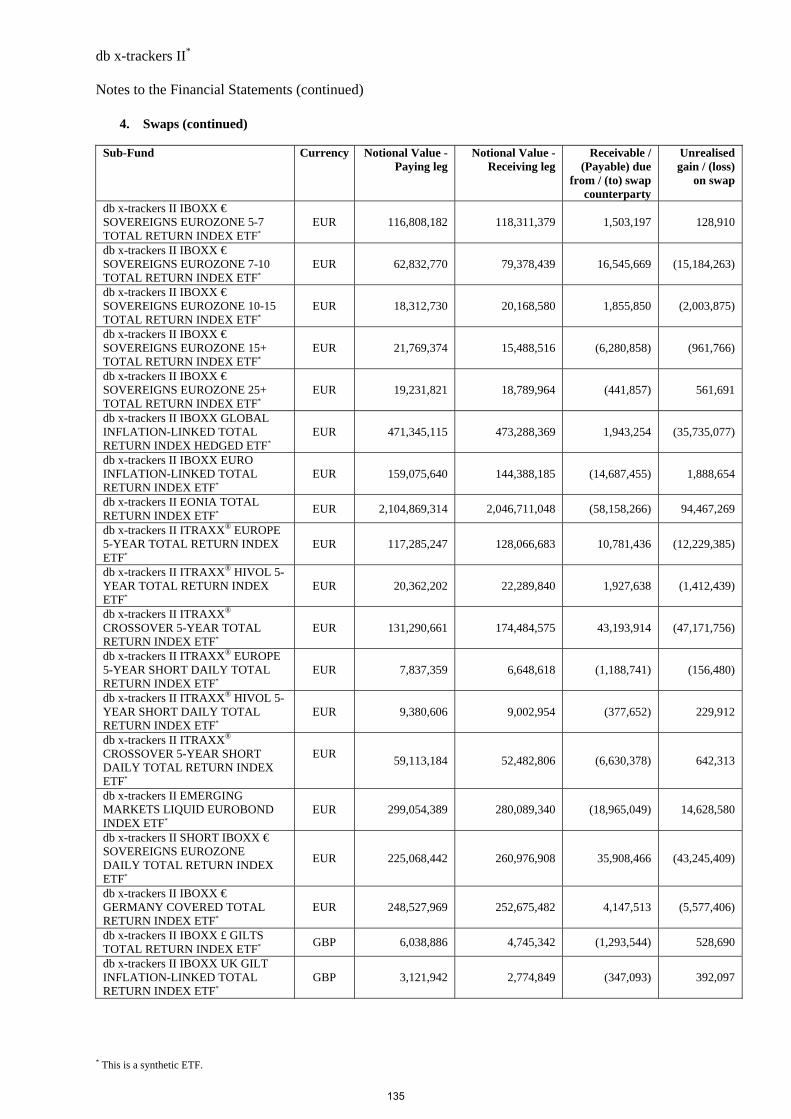
db x-trackers II* Notes to the Financial Statements (continued)
* This is a synthetic ETF.
4. Swaps (continued)
Sub-Fund Currency Notional Value - Paying leg
Notional Value - Receiving leg
Receivable / (Payable) due
from / (to) swap counterparty
Unrealised gain / (loss)
on swap
db x-trackers II IBOXX € SOVEREIGNS EUROZONE 5-7 TOTAL RETURN INDEX ETF*
EUR 116,808,182 118,311,379 1,503,197 128,910
db x-trackers II IBOXX € SOVEREIGNS EUROZONE 7-10 TOTAL RETURN INDEX ETF*
EUR 62,832,770 79,378,439 16,545,669 (15,184,263)
db x-trackers II IBOXX € SOVEREIGNS EUROZONE 10-15 TOTAL RETURN INDEX ETF*
EUR 18,312,730 20,168,580 1,855,850 (2,003,875)
db x-trackers II IBOXX € SOVEREIGNS EUROZONE 15+ TOTAL RETURN INDEX ETF*
EUR 21,769,374 15,488,516 (6,280,858) (961,766)
db x-trackers II IBOXX € SOVEREIGNS EUROZONE 25+ TOTAL RETURN INDEX ETF*
EUR 19,231,821 18,789,964 (441,857) 561,691
db x-trackers II IBOXX GLOBAL INFLATION-LINKED TOTAL RETURN INDEX HEDGED ETF*
EUR 471,345,115 473,288,369 1,943,254 (35,735,077)
db x-trackers II IBOXX EURO INFLATION-LINKED TOTAL RETURN INDEX ETF*
EUR 159,075,640 144,388,185 (14,687,455) 1,888,654
db x-trackers II EONIA TOTAL RETURN INDEX ETF*
EUR 2,104,869,314 2,046,711,048 (58,158,266) 94,467,269
db x-trackers II ITRAXX® EUROPE 5-YEAR TOTAL RETURN INDEX ETF*
EUR 117,285,247 128,066,683 10,781,436 (12,229,385)
db x-trackers II ITRAXX® HIVOL 5-YEAR TOTAL RETURN INDEX ETF*
EUR 20,362,202 22,289,840 1,927,638 (1,412,439)
db x-trackers II ITRAXX® CROSSOVER 5-YEAR TOTAL RETURN INDEX ETF*
EUR 131,290,661 174,484,575 43,193,914 (47,171,756)
db x-trackers II ITRAXX® EUROPE 5-YEAR SHORT DAILY TOTAL RETURN INDEX ETF*
EUR 7,837,359 6,648,618 (1,188,741) (156,480)
db x-trackers II ITRAXX® HIVOL 5-YEAR SHORT DAILY TOTAL RETURN INDEX ETF*
EUR 9,380,606 9,002,954 (377,652) 229,912
db x-trackers II ITRAXX® CROSSOVER 5-YEAR SHORT DAILY TOTAL RETURN INDEX ETF*
EUR
59,113,184 52,482,806 (6,630,378) 642,313
db x-trackers II EMERGING MARKETS LIQUID EUROBOND INDEX ETF*
EUR 299,054,389 280,089,340 (18,965,049) 14,628,580
db x-trackers II SHORT IBOXX € SOVEREIGNS EUROZONE DAILY TOTAL RETURN INDEX ETF*
EUR 225,068,442 260,976,908 35,908,466 (43,245,409)
db x-trackers II IBOXX € GERMANY COVERED TOTAL RETURN INDEX ETF*
EUR 248,527,969 252,675,482 4,147,513 (5,577,406)
db x-trackers II IBOXX £ GILTS TOTAL RETURN INDEX ETF*
GBP 6,038,886 4,745,342 (1,293,544) 528,690
db x-trackers II IBOXX UK GILT INFLATION-LINKED TOTAL RETURN INDEX ETF*
GBP 3,121,942 2,774,849 (347,093) 392,097
135
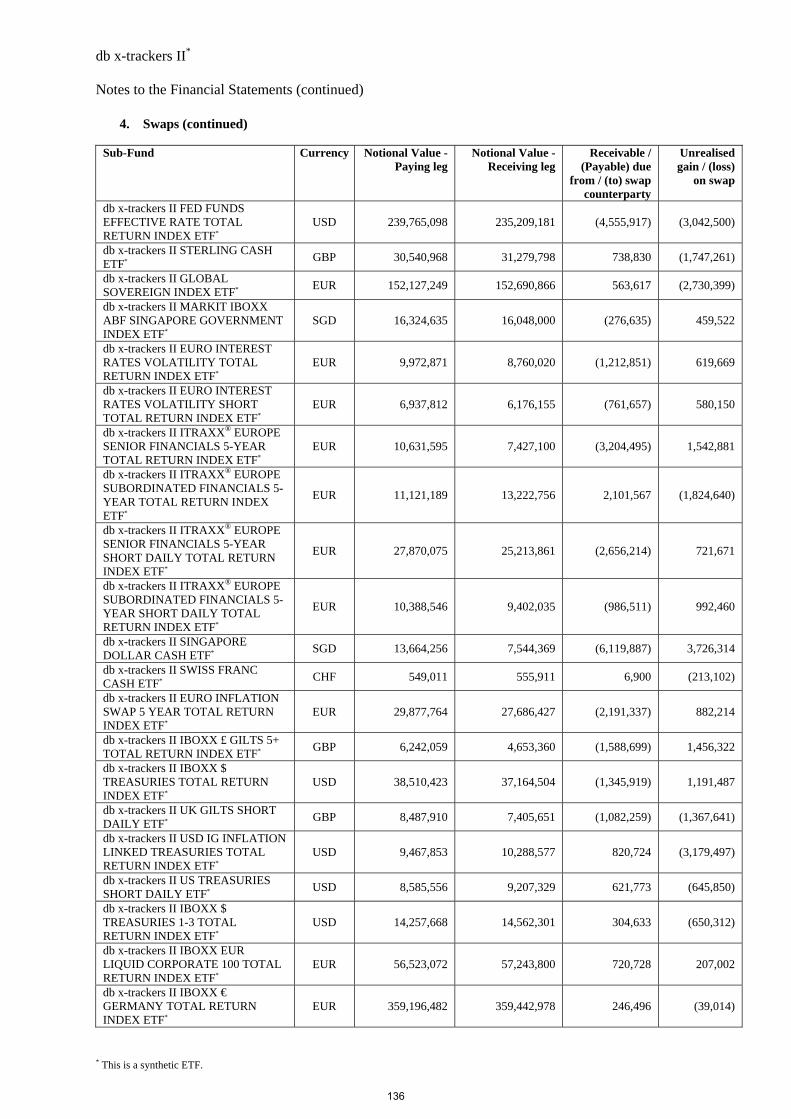
db x-trackers II* Notes to the Financial Statements (continued)
* This is a synthetic ETF.
4. Swaps (continued)
Sub-Fund Currency Notional Value - Paying leg
Notional Value - Receiving leg
Receivable / (Payable) due
from / (to) swap counterparty
Unrealised gain / (loss)
on swap
db x-trackers II FED FUNDS EFFECTIVE RATE TOTAL RETURN INDEX ETF*
USD 239,765,098 235,209,181 (4,555,917) (3,042,500)
db x-trackers II STERLING CASH ETF*
GBP 30,540,968 31,279,798 738,830 (1,747,261)
db x-trackers II GLOBAL SOVEREIGN INDEX ETF*
EUR 152,127,249 152,690,866 563,617 (2,730,399)
db x-trackers II MARKIT IBOXX ABF SINGAPORE GOVERNMENT INDEX ETF*
SGD 16,324,635 16,048,000 (276,635) 459,522
db x-trackers II EURO INTEREST RATES VOLATILITY TOTAL RETURN INDEX ETF*
EUR 9,972,871 8,760,020 (1,212,851) 619,669
db x-trackers II EURO INTEREST RATES VOLATILITY SHORT TOTAL RETURN INDEX ETF*
EUR 6,937,812 6,176,155 (761,657) 580,150
db x-trackers II ITRAXX® EUROPE SENIOR FINANCIALS 5-YEAR TOTAL RETURN INDEX ETF*
EUR 10,631,595 7,427,100 (3,204,495) 1,542,881
db x-trackers II ITRAXX® EUROPE SUBORDINATED FINANCIALS 5-YEAR TOTAL RETURN INDEX ETF*
EUR 11,121,189 13,222,756 2,101,567 (1,824,640)
db x-trackers II ITRAXX® EUROPE SENIOR FINANCIALS 5-YEAR SHORT DAILY TOTAL RETURN INDEX ETF*
EUR 27,870,075 25,213,861 (2,656,214) 721,671
db x-trackers II ITRAXX® EUROPE SUBORDINATED FINANCIALS 5-YEAR SHORT DAILY TOTAL RETURN INDEX ETF*
EUR 10,388,546 9,402,035 (986,511) 992,460
db x-trackers II SINGAPORE DOLLAR CASH ETF*
SGD 13,664,256 7,544,369 (6,119,887) 3,726,314
db x-trackers II SWISS FRANC CASH ETF*
CHF 549,011 555,911 6,900 (213,102)
db x-trackers II EURO INFLATION SWAP 5 YEAR TOTAL RETURN INDEX ETF*
EUR 29,877,764 27,686,427 (2,191,337) 882,214
db x-trackers II IBOXX £ GILTS 5+ TOTAL RETURN INDEX ETF*
GBP 6,242,059 4,653,360 (1,588,699) 1,456,322
db x-trackers II IBOXX $ TREASURIES TOTAL RETURN INDEX ETF*
USD 38,510,423 37,164,504 (1,345,919) 1,191,487
db x-trackers II UK GILTS SHORT DAILY ETF*
GBP 8,487,910 7,405,651 (1,082,259) (1,367,641)
db x-trackers II USD IG INFLATION LINKED TREASURIES TOTAL RETURN INDEX ETF*
USD 9,467,853 10,288,577 820,724 (3,179,497)
db x-trackers II US TREASURIES SHORT DAILY ETF*
USD 8,585,556 9,207,329 621,773 (645,850)
db x-trackers II IBOXX $ TREASURIES 1-3 TOTAL RETURN INDEX ETF*
USD 14,257,668 14,562,301 304,633 (650,312)
db x-trackers II IBOXX EUR LIQUID CORPORATE 100 TOTAL RETURN INDEX ETF*
EUR 56,523,072 57,243,800 720,728 207,002
db x-trackers II IBOXX € GERMANY TOTAL RETURN INDEX ETF*
EUR 359,196,482 359,442,978 246,496 (39,014)
136

db x-trackers II* Notes to the Financial Statements (continued)
* This is a synthetic ETF.
4. Swaps (continued)
Sub-Fund Currency Notional Value - Paying leg
Notional Value - Receiving leg
Receivable / (Payable) due
from / (to) swap counterparty
Unrealised gain / (loss)
on swap
db x-trackers II IBOXX € GERMANY 1-3 TOTAL RETURN INDEX ETF*
EUR 343,248,154 353,823,052 10,574,898 (6,636,878)
db x-trackers II MARKIT IBOXX ABF KOREA GOVERNMENT INDEX ETF*
USD 13,826,618 10,576,800 (3,249,818) 1,846,506
db x-trackers II IBOXX EUR LIQUID CORPORATE 100 FINANCIALS SUB-INDEX TOTAL RETURN ETF*
EUR 9,235,485 7,814,241 (1,421,244) (388,438)
db x-trackers II IBOXX EUR LIQUID CORPORATE 100 NON-FINANCIALS SUB-INDEX TOTAL RETURN ETF*
EUR 28,843,017 29,833,566 990,549 (418,401)
db x-trackers II IBOXX € SOVEREIGNS EUROZONE AAA TOTAL RETURN INDEX ETF*
EUR 37,855,105 37,397,524 (457,581) (96,536)
db x-trackers II IBOXX € SOVEREIGNS EUROZONE YIELD PLUS INDEX ETF*
EUR 65,137,531 67,047,536 1,910,005 204,929
db x-trackers II AUSTRALIAN DOLLAR CASH ETF*
AUD 11,744,792 9,022,482 (2,722,310) 2,632,858
db x-trackers II AUSTRALIA SSA BONDS TOTAL RETURN INDEX ETF*
AUD 20,937,671 19,807,425 (1,130,246) 2,241,657
db x-trackers II IBOXX € GERMANY COVERED 1-3 TOTAL RETURN INDEX ETF*
EUR 4,666,099 4,868,700 202,601 (227,731)
db x-trackers II ITRAXX® EUROPE 5-YEAR 2X DAILY TOTAL RETURN INDEX ETF*
EUR 5,064,307 5,084,950 20,643 43,568
db x-trackers II ITRAXX® CROSSOVER 5-YEAR 2X DAILY TOTAL RETURN INDEX ETF*
EUR 4,631,602 4,581,808 (49,794) 113,256
db x-trackers II ITRAXX® EUROPE 5-YEAR 2X SHORT DAILY TOTAL RETURN INDEX ETF*
EUR 4,297,509 4,456,048 158,539 (176,728)
db x-trackers II ITRAXX® CROSSOVER 5-YEAR 2X SHORT DAILY TOTAL RETURN INDEX ETF*
EUR 3,300,811 3,480,450 179,639 (217,105)
5. Management Company Fee and Fixed Fee
a) Management Company Fee
In accordance with and subject to the terms of the Management Company Agreement, the annual Management Company Fee will be a percentage of the Net Assets of each Sub-Fund or Class of Shares or the Initial Issue Price (as indicated in the Product Annexes of the Prospectus). Management Company Fees are payable periodically at a rate which is within a range specified in the table below. The Management Company is also entitled to receive reimbursement for any reasonable disbursements and out-of-pocket expenses. The Management Company Fee will be calculated upon each Valuation Day. The Management Company may pay a Distribution Fee to the Distributor or Sub-Distributors out of the Management Company Fee. The Distributor may re-allocate an amount of the Distribution Fee to the Sub-Distributors.
137
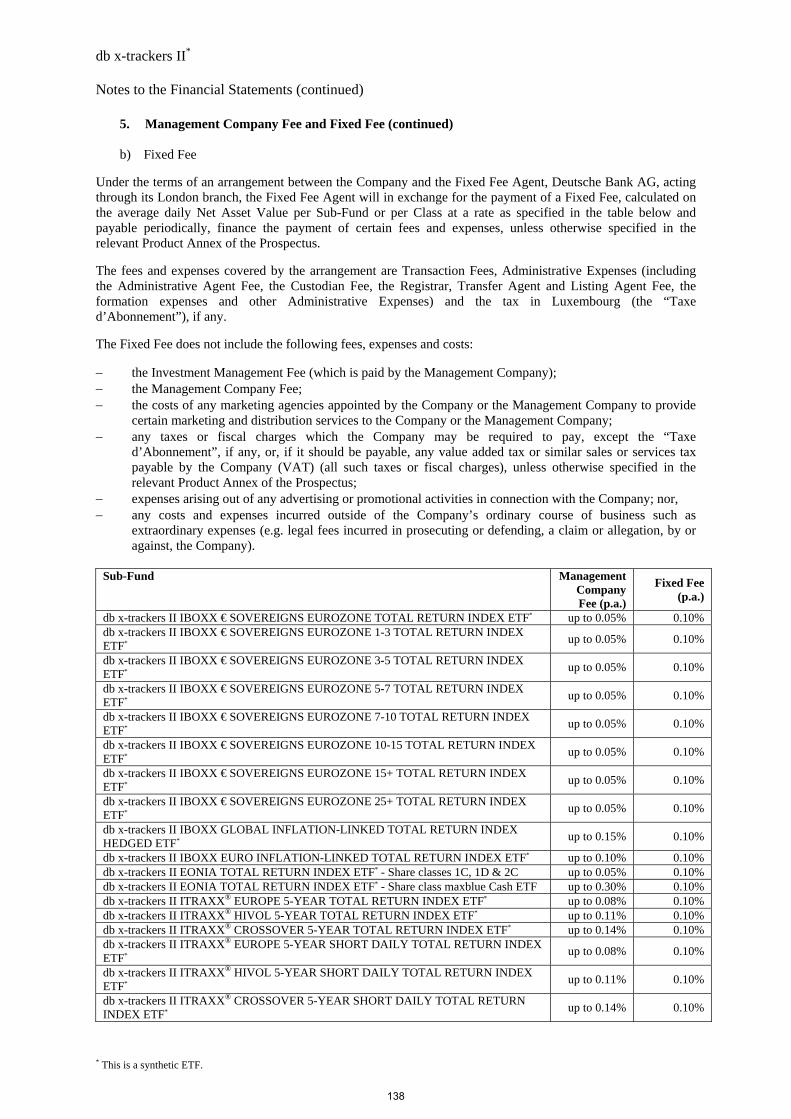
db x-trackers II* Notes to the Financial Statements (continued)
* This is a synthetic ETF.
5. Management Company Fee and Fixed Fee (continued) b) Fixed Fee
Under the terms of an arrangement between the Company and the Fixed Fee Agent, Deutsche Bank AG, acting through its London branch, the Fixed Fee Agent will in exchange for the payment of a Fixed Fee, calculated on the average daily Net Asset Value per Sub-Fund or per Class at a rate as specified in the table below and payable periodically, finance the payment of certain fees and expenses, unless otherwise specified in the relevant Product Annex of the Prospectus.
The fees and expenses covered by the arrangement are Transaction Fees, Administrative Expenses (including the Administrative Agent Fee, the Custodian Fee, the Registrar, Transfer Agent and Listing Agent Fee, the formation expenses and other Administrative Expenses) and the tax in Luxembourg (the “Taxe d’Abonnement”), if any.
The Fixed Fee does not include the following fees, expenses and costs:
the Investment Management Fee (which is paid by the Management Company); the Management Company Fee; the costs of any marketing agencies appointed by the Company or the Management Company to provide
certain marketing and distribution services to the Company or the Management Company; any taxes or fiscal charges which the Company may be required to pay, except the “Taxe
d’Abonnement”, if any, or, if it should be payable, any value added tax or similar sales or services tax payable by the Company (VAT) (all such taxes or fiscal charges), unless otherwise specified in the relevant Product Annex of the Prospectus;
expenses arising out of any advertising or promotional activities in connection with the Company; nor, any costs and expenses incurred outside of the Company’s ordinary course of business such as
extraordinary expenses (e.g. legal fees incurred in prosecuting or defending, a claim or allegation, by or against, the Company).
Sub-Fund Management
Company Fee (p.a.)
Fixed Fee (p.a.)
db x-trackers II IBOXX € SOVEREIGNS EUROZONE TOTAL RETURN INDEX ETF* up to 0.05% 0.10% db x-trackers II IBOXX € SOVEREIGNS EUROZONE 1-3 TOTAL RETURN INDEX ETF*
up to 0.05% 0.10%
db x-trackers II IBOXX € SOVEREIGNS EUROZONE 3-5 TOTAL RETURN INDEX ETF*
up to 0.05% 0.10%
db x-trackers II IBOXX € SOVEREIGNS EUROZONE 5-7 TOTAL RETURN INDEX ETF*
up to 0.05% 0.10%
db x-trackers II IBOXX € SOVEREIGNS EUROZONE 7-10 TOTAL RETURN INDEX ETF*
up to 0.05% 0.10%
db x-trackers II IBOXX € SOVEREIGNS EUROZONE 10-15 TOTAL RETURN INDEX ETF*
up to 0.05% 0.10%
db x-trackers II IBOXX € SOVEREIGNS EUROZONE 15+ TOTAL RETURN INDEX ETF*
up to 0.05% 0.10%
db x-trackers II IBOXX € SOVEREIGNS EUROZONE 25+ TOTAL RETURN INDEX ETF*
up to 0.05% 0.10%
db x-trackers II IBOXX GLOBAL INFLATION-LINKED TOTAL RETURN INDEX HEDGED ETF*
up to 0.15% 0.10%
db x-trackers II IBOXX EURO INFLATION-LINKED TOTAL RETURN INDEX ETF* up to 0.10% 0.10% db x-trackers II EONIA TOTAL RETURN INDEX ETF* - Share classes 1C, 1D & 2C up to 0.05% 0.10% db x-trackers II EONIA TOTAL RETURN INDEX ETF* - Share class maxblue Cash ETF up to 0.30% 0.10% db x-trackers II ITRAXX® EUROPE 5-YEAR TOTAL RETURN INDEX ETF* up to 0.08% 0.10% db x-trackers II ITRAXX® HIVOL 5-YEAR TOTAL RETURN INDEX ETF* up to 0.11% 0.10% db x-trackers II ITRAXX® CROSSOVER 5-YEAR TOTAL RETURN INDEX ETF* up to 0.14% 0.10% db x-trackers II ITRAXX® EUROPE 5-YEAR SHORT DAILY TOTAL RETURN INDEX ETF*
up to 0.08% 0.10%
db x-trackers II ITRAXX® HIVOL 5-YEAR SHORT DAILY TOTAL RETURN INDEX ETF*
up to 0.11% 0.10%
db x-trackers II ITRAXX® CROSSOVER 5-YEAR SHORT DAILY TOTAL RETURN INDEX ETF*
up to 0.14% 0.10%
138
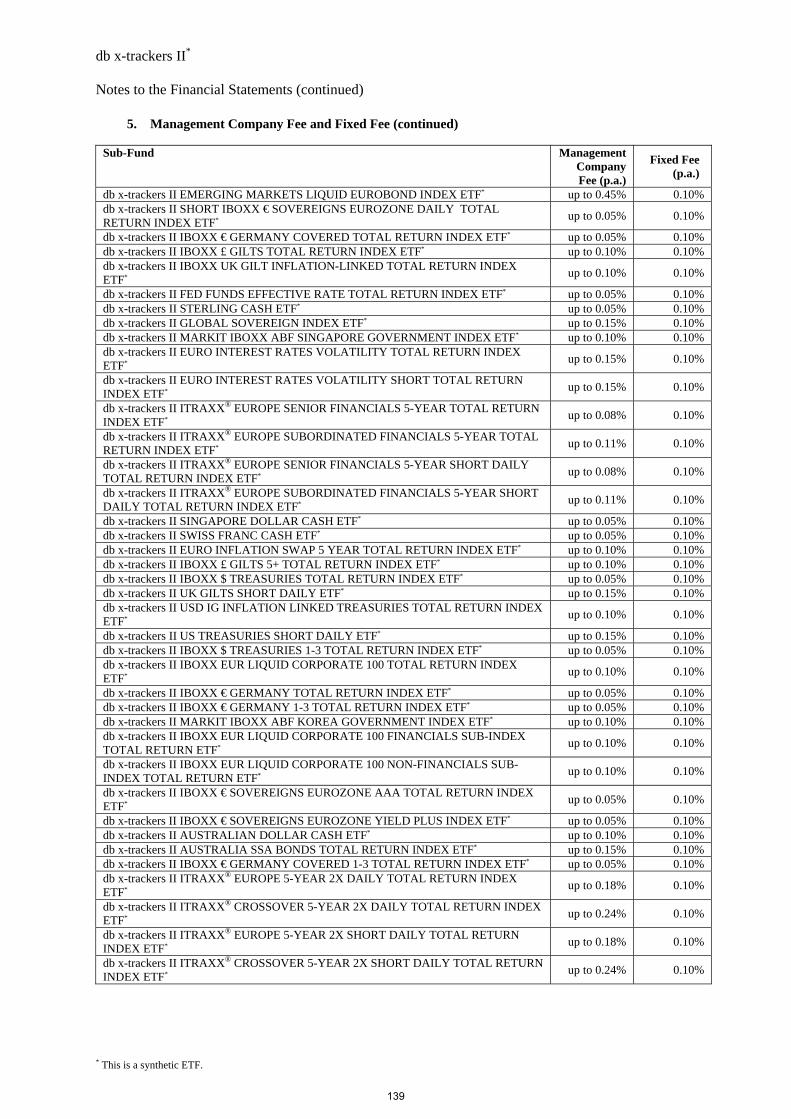
db x-trackers II* Notes to the Financial Statements (continued)
* This is a synthetic ETF.
5. Management Company Fee and Fixed Fee (continued)
Sub-Fund Management Company Fee (p.a.)
Fixed Fee (p.a.)
db x-trackers II EMERGING MARKETS LIQUID EUROBOND INDEX ETF* up to 0.45% 0.10% db x-trackers II SHORT IBOXX € SOVEREIGNS EUROZONE DAILY TOTAL RETURN INDEX ETF*
up to 0.05% 0.10%
db x-trackers II IBOXX € GERMANY COVERED TOTAL RETURN INDEX ETF* up to 0.05% 0.10% db x-trackers II IBOXX £ GILTS TOTAL RETURN INDEX ETF* up to 0.10% 0.10% db x-trackers II IBOXX UK GILT INFLATION-LINKED TOTAL RETURN INDEX ETF*
up to 0.10% 0.10%
db x-trackers II FED FUNDS EFFECTIVE RATE TOTAL RETURN INDEX ETF* up to 0.05% 0.10% db x-trackers II STERLING CASH ETF* up to 0.05% 0.10% db x-trackers II GLOBAL SOVEREIGN INDEX ETF* up to 0.15% 0.10% db x-trackers II MARKIT IBOXX ABF SINGAPORE GOVERNMENT INDEX ETF* up to 0.10% 0.10% db x-trackers II EURO INTEREST RATES VOLATILITY TOTAL RETURN INDEX ETF*
up to 0.15% 0.10%
db x-trackers II EURO INTEREST RATES VOLATILITY SHORT TOTAL RETURN INDEX ETF*
up to 0.15% 0.10%
db x-trackers II ITRAXX® EUROPE SENIOR FINANCIALS 5-YEAR TOTAL RETURN INDEX ETF*
up to 0.08% 0.10%
db x-trackers II ITRAXX® EUROPE SUBORDINATED FINANCIALS 5-YEAR TOTAL RETURN INDEX ETF*
up to 0.11% 0.10%
db x-trackers II ITRAXX® EUROPE SENIOR FINANCIALS 5-YEAR SHORT DAILY TOTAL RETURN INDEX ETF*
up to 0.08% 0.10%
db x-trackers II ITRAXX® EUROPE SUBORDINATED FINANCIALS 5-YEAR SHORT DAILY TOTAL RETURN INDEX ETF*
up to 0.11% 0.10%
db x-trackers II SINGAPORE DOLLAR CASH ETF* up to 0.05% 0.10% db x-trackers II SWISS FRANC CASH ETF* up to 0.05% 0.10% db x-trackers II EURO INFLATION SWAP 5 YEAR TOTAL RETURN INDEX ETF* up to 0.10% 0.10% db x-trackers II IBOXX £ GILTS 5+ TOTAL RETURN INDEX ETF* up to 0.10% 0.10% db x-trackers II IBOXX $ TREASURIES TOTAL RETURN INDEX ETF* up to 0.05% 0.10% db x-trackers II UK GILTS SHORT DAILY ETF* up to 0.15% 0.10% db x-trackers II USD IG INFLATION LINKED TREASURIES TOTAL RETURN INDEX ETF*
up to 0.10% 0.10%
db x-trackers II US TREASURIES SHORT DAILY ETF* up to 0.15% 0.10% db x-trackers II IBOXX $ TREASURIES 1-3 TOTAL RETURN INDEX ETF* up to 0.05% 0.10% db x-trackers II IBOXX EUR LIQUID CORPORATE 100 TOTAL RETURN INDEX ETF*
up to 0.10% 0.10%
db x-trackers II IBOXX € GERMANY TOTAL RETURN INDEX ETF* up to 0.05% 0.10% db x-trackers II IBOXX € GERMANY 1-3 TOTAL RETURN INDEX ETF* up to 0.05% 0.10% db x-trackers II MARKIT IBOXX ABF KOREA GOVERNMENT INDEX ETF* up to 0.10% 0.10% db x-trackers II IBOXX EUR LIQUID CORPORATE 100 FINANCIALS SUB-INDEX TOTAL RETURN ETF*
up to 0.10% 0.10%
db x-trackers II IBOXX EUR LIQUID CORPORATE 100 NON-FINANCIALS SUB-INDEX TOTAL RETURN ETF*
up to 0.10% 0.10%
db x-trackers II IBOXX € SOVEREIGNS EUROZONE AAA TOTAL RETURN INDEX ETF*
up to 0.05% 0.10%
db x-trackers II IBOXX € SOVEREIGNS EUROZONE YIELD PLUS INDEX ETF* up to 0.05% 0.10% db x-trackers II AUSTRALIAN DOLLAR CASH ETF* up to 0.10% 0.10% db x-trackers II AUSTRALIA SSA BONDS TOTAL RETURN INDEX ETF* up to 0.15% 0.10% db x-trackers II IBOXX € GERMANY COVERED 1-3 TOTAL RETURN INDEX ETF* up to 0.05% 0.10% db x-trackers II ITRAXX® EUROPE 5-YEAR 2X DAILY TOTAL RETURN INDEX ETF*
up to 0.18% 0.10%
db x-trackers II ITRAXX® CROSSOVER 5-YEAR 2X DAILY TOTAL RETURN INDEX ETF*
up to 0.24% 0.10%
db x-trackers II ITRAXX® EUROPE 5-YEAR 2X SHORT DAILY TOTAL RETURN INDEX ETF*
up to 0.18% 0.10%
db x-trackers II ITRAXX® CROSSOVER 5-YEAR 2X SHORT DAILY TOTAL RETURN INDEX ETF*
up to 0.24% 0.10%
139

db x-trackers II* Notes to the Financial Statements (continued)
* This is a synthetic ETF.
6. Transaction Fees Transaction fees are any fees and expenses incurred in buying and selling securities or other investments held by a Sub-Fund, e.g., brokerage costs and commissions and correspondence fees for transferring securities or investments or other interests, unless otherwise specified in the relevant Product Annex of the Prospectus. During the year ended 31 December 2011, the Sub-Funds of the Company did not incur transaction fees.
7. Directors Fees and Interests During the year ended 31 December 2011, none of the Directors has received any remuneration or other direct or indirect benefit material to them. Mr. Jacques Elvinger is a partner of the Luxembourg law firm of Elvinger Hoss & Prussen, which provides legal services to the Company.
8. Related Parties
DB Platinum Advisors has been appointed to act as Management Company under the Management Company Agreement and is responsible for providing investment management services, administration services and distribution and marketing services to the various Sub-Funds unless otherwise indicated in the relevant Product Annex of the Prospectus. DB Platinum Advisors is entitled to receive as a compensation for its services to the Company, Management Company Fees as further detailed in Note 5. The Fixed Fee Agent is entitled to receive Fixed Fees as further detailed in Note 5. Deutsche Bank AG, acting through its London branch, is the counterparty to all swap positions entered into by the Company. In the normal course of its operations, each Sub-Fund may enter into transactions on securities or other investments with Deutsche Bank AG or other Deutsche Bank affiliates.
9. Appointed Investment Manager
State Street Global Advisors Limited is acting as Investment Manager for all Sub-Funds except for:
‐ db x- trackers II MARKIT IBOXX ABF SINGAPORE GOVERNMENT INDEX ETF* ‐ db x- trackers II SINGAPORE DOLLAR CASH ETF* ‐ db x- trackers II AUSTRALIAN DOLLAR CASH ETF* ‐ db x- trackers II MARKIT IBOXX ABF KOREA GOVERNMENT INDEX ETF* ‐ db x- trackers II AUSTRALIA SSA BONDS TOTAL RETURN INDEX ETF*
for which DB Platinum Advisors is Investment Manager.
10. Dividends distributed During the year ended 31 December 2011, the Company resolved to pay to the Shareholders of the Distribution Shares “1D” of the Sub-Funds mentioned below, dividends as follows: Sub-Fund Ex-dividend date Currency Dividend
Per Share Dividends distributed
db x-trackers II EONIA TOTAL RETURN INDEX ETF*
22 July 2011 EUR 0.46 373,175
db x-trackers II IBOXX £ GILTS TOTAL RETURN INDEX ETF*
22 July 2011 GBP 9.48 275,110
db x-trackers II IBOXX UK GILT INFLATION-LINKED TOTAL RETURN INDEX ETF*
22 July 2011 GBP 4.17 83,875
db x-trackers II IBOXX € GERMANY TOTAL RETURN INDEX ETF*
22 July 2011 EUR 2.26 2,103,746
db x-trackers II IBOXX € GERMANY 1-3 TOTAL RETURN INDEX ETF*
22 July 2011 EUR 2.08 1,665,441
140
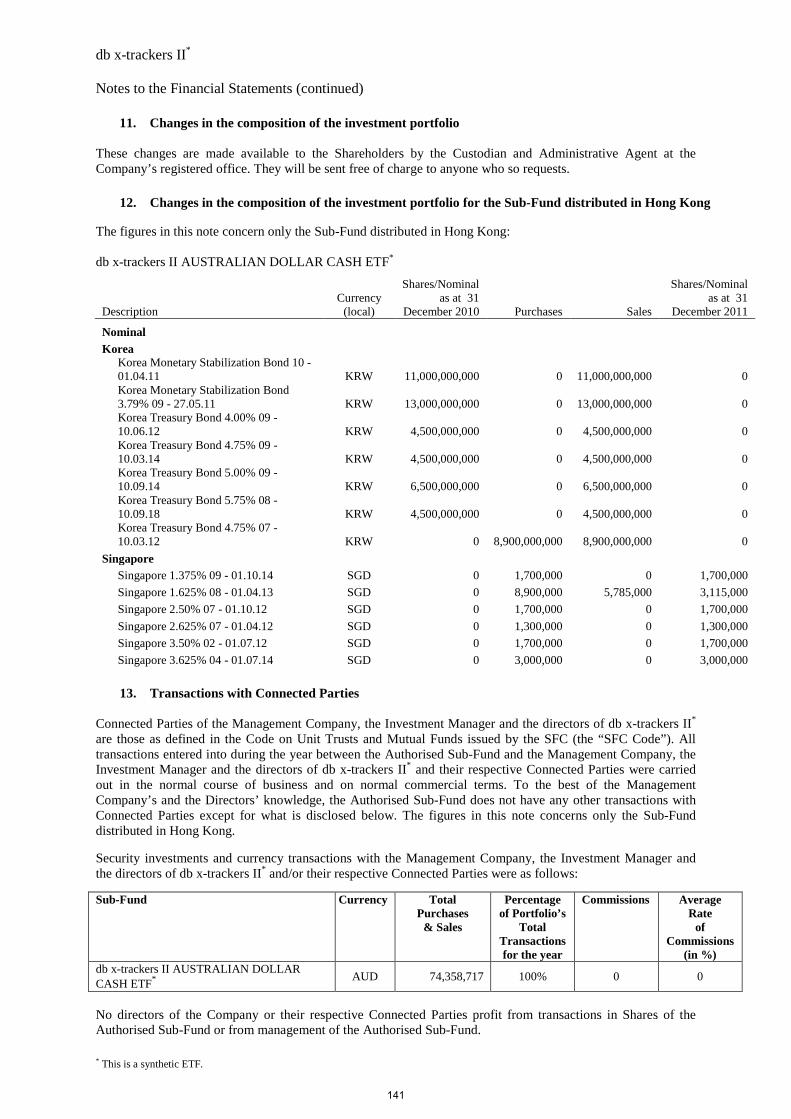
db x-trackers II* Notes to the Financial Statements (continued)
* This is a synthetic ETF.
11. Changes in the composition of the investment portfolio These changes are made available to the Shareholders by the Custodian and Administrative Agent at the Company’s registered office. They will be sent free of charge to anyone who so requests. 12. Changes in the composition of the investment portfolio for the Sub-Fund distributed in Hong Kong The figures in this note concern only the Sub-Fund distributed in Hong Kong: db x-trackers II AUSTRALIAN DOLLAR CASH ETF*
Description Currency
(local)
Shares/Nominal as at 31
December 2010 Purchases Sales
Shares/Nominal as at 31
December 2011
Nominal
Korea
Korea Monetary Stabilization Bond 10 - 01.04.11 KRW 11,000,000,000 0 11,000,000,000 0
Korea Monetary Stabilization Bond 3.79% 09 - 27.05.11 KRW 13,000,000,000 0 13,000,000,000 0
Korea Treasury Bond 4.00% 09 - 10.06.12 KRW 4,500,000,000 0 4,500,000,000 0
Korea Treasury Bond 4.75% 09 - 10.03.14 KRW 4,500,000,000 0 4,500,000,000 0
Korea Treasury Bond 5.00% 09 - 10.09.14 KRW 6,500,000,000 0 6,500,000,000 0
Korea Treasury Bond 5.75% 08 - 10.09.18 KRW 4,500,000,000 0 4,500,000,000 0
Korea Treasury Bond 4.75% 07 - 10.03.12 KRW 0 8,900,000,000 8,900,000,000 0
Singapore
Singapore 1.375% 09 - 01.10.14 SGD 0 1,700,000 0 1,700,000
Singapore 1.625% 08 - 01.04.13 SGD 0 8,900,000 5,785,000 3,115,000
Singapore 2.50% 07 - 01.10.12 SGD 0 1,700,000 0 1,700,000
Singapore 2.625% 07 - 01.04.12 SGD 0 1,300,000 0 1,300,000
Singapore 3.50% 02 - 01.07.12 SGD 0 1,700,000 0 1,700,000
Singapore 3.625% 04 - 01.07.14 SGD 0 3,000,000 0 3,000,000
13. Transactions with Connected Parties Connected Parties of the Management Company, the Investment Manager and the directors of db x-trackers II* are those as defined in the Code on Unit Trusts and Mutual Funds issued by the SFC (the “SFC Code”). All transactions entered into during the year between the Authorised Sub-Fund and the Management Company, the Investment Manager and the directors of db x-trackers II* and their respective Connected Parties were carried out in the normal course of business and on normal commercial terms. To the best of the Management Company’s and the Directors’ knowledge, the Authorised Sub-Fund does not have any other transactions with Connected Parties except for what is disclosed below. The figures in this note concerns only the Sub-Fund distributed in Hong Kong. Security investments and currency transactions with the Management Company, the Investment Manager and the directors of db x-trackers II* and/or their respective Connected Parties were as follows:
Sub-Fund Currency Total Purchases
& Sales
Percentage of Portfolio’s
Total Transactions for the year
Commissions Average Rate
of Commissions
(in %) db x-trackers II AUSTRALIAN DOLLAR CASH ETF*
AUD 74,358,717 100% 0 0
No directors of the Company or their respective Connected Parties profit from transactions in Shares of the Authorised Sub-Fund or from management of the Authorised Sub-Fund.
141
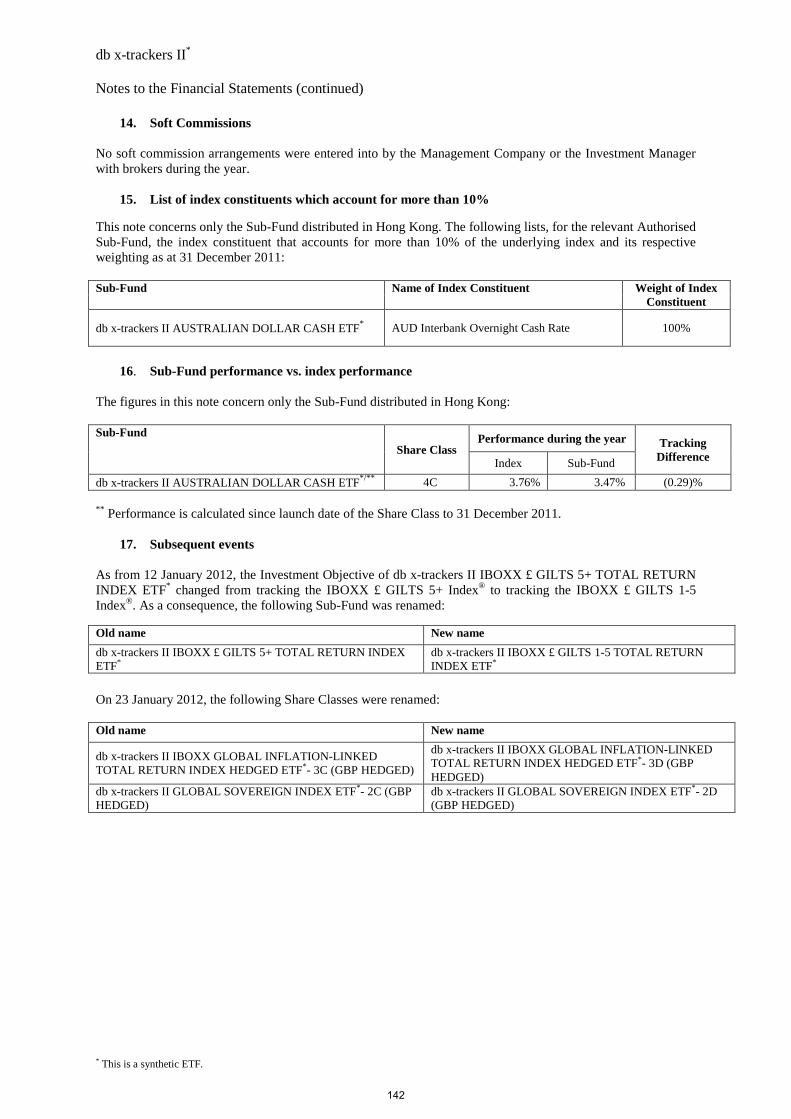
db x-trackers II* Notes to the Financial Statements (continued)
* This is a synthetic ETF.
14. Soft Commissions No soft commission arrangements were entered into by the Management Company or the Investment Manager with brokers during the year.
15. List of index constituents which account for more than 10%
This note concerns only the Sub-Fund distributed in Hong Kong. The following lists, for the relevant Authorised Sub-Fund, the index constituent that accounts for more than 10% of the underlying index and its respective weighting as at 31 December 2011: Sub-Fund Name of Index Constituent Weight of Index
Constituent
db x-trackers II AUSTRALIAN DOLLAR CASH ETF* AUD Interbank Overnight Cash Rate 100%
16. Sub-Fund performance vs. index performance
The figures in this note concern only the Sub-Fund distributed in Hong Kong: Sub-Fund
Share Class Performance during the year Tracking
Difference Index Sub-Fund
db x-trackers II AUSTRALIAN DOLLAR CASH ETF*/** 4C 3.76% 3.47% (0.29)%
** Performance is calculated since launch date of the Share Class to 31 December 2011.
17. Subsequent events As from 12 January 2012, the Investment Objective of db x-trackers II IBOXX £ GILTS 5+ TOTAL RETURN INDEX ETF* changed from tracking the IBOXX £ GILTS 5+ Index® to tracking the IBOXX £ GILTS 1-5 Index®. As a consequence, the following Sub-Fund was renamed: Old name New name
db x-trackers II IBOXX £ GILTS 5+ TOTAL RETURN INDEX ETF*
db x-trackers II IBOXX £ GILTS 1-5 TOTAL RETURN INDEX ETF*
On 23 January 2012, the following Share Classes were renamed: Old name New name
db x-trackers II IBOXX GLOBAL INFLATION-LINKED TOTAL RETURN INDEX HEDGED ETF*- 3C (GBP HEDGED)
db x-trackers II IBOXX GLOBAL INFLATION-LINKED TOTAL RETURN INDEX HEDGED ETF*- 3D (GBP HEDGED)
db x-trackers II GLOBAL SOVEREIGN INDEX ETF*- 2C (GBP HEDGED)
db x-trackers II GLOBAL SOVEREIGN INDEX ETF*- 2D (GBP HEDGED)
142
db x-trackers II*
Information for Shareholders
1) On-line publication of investment portfolios, collateral holdings and swap exposures
Shareholders can view the swap exposures and investment portfolios or collateral holdings for each Sub-Fund on http://www.etf.db.com. The information is available under the “ETF Information” tab section for each Sub-Fund.
2) Determination of the Global Exposure
For all Sub-Funds, the methodology used in order to calculate the Global Exposure resulting from the use of financial derivative instruments is the commitment approach in accordance with the CSSF Circular 11/512.
* This is a synthetic ETF.
143


