PASSIVE ACOUSTIC MONITORING OF COOK INLET … · based recordings were conducted using two...
73
P PASSIVE A ACOUSTIC M MONITORING OF C COOK I INLET B BELUGA W WHALES ANALYSIS REPORT PORT OF ANCHORAGE MARINE TERMINAL REDEVELOPMENT PROJECT Prepared for U.S. Department of Transportation Maritime Administration 1200 New Jersey Avenue, S.E. Washington, D.C. 20590 Port of Anchorage 200 Anchorage Port Road Anchorage, Alaska 99501 Integrated Concepts and Research Corporation 421 West First Avenue, Suite 200 Anchorage, Alaska 99501 Prepared by Dr. Ana Širović and Lindsey Saxon Kendall Department of Environmental Science Alaska Pacific University 4101 University Drive Anchorage, Alaska 99508 December 2009
Transcript of PASSIVE ACOUSTIC MONITORING OF COOK INLET … · based recordings were conducted using two...

PPAASSSSIIVVEE AACCOOUUSSTTIICC MMOONNIITTOORRIINNGG OOFF CCOOOOKK IINNLLEETT BBEELLUUGGAA WWHHAALLEESS
AANNAALLYYSSIISS RREEPPOORRTT
PPOORRTT OOFF AANNCCHHOORRAAGGEE MMAARRIINNEE TTEERRMMIINNAALL RREEDDEEVVEELLOOPPMMEENNTT PPRROOJJEECCTT
Prepared for
U.S. Department of Transportation Maritime Administration
1200 New Jersey Avenue, S.E. Washington, D.C. 20590
Port of Anchorage 200 Anchorage Port Road Anchorage, Alaska 99501
Integrated Concepts and Research Corporation
421 West First Avenue, Suite 200 Anchorage, Alaska 99501
Prepared by
Dr. Ana Širović and Lindsey Saxon Kendall Department of Environmental Science
Alaska Pacific University 4101 University Drive
Anchorage, Alaska 99508
December 2009

This page intentionally left blank

Passive Acoustic Monitoring of Cook Inlet Beluga Whales
i
Table of Contents Acronyms and Abbreviations .................................................................................................... ii EXECUTIVE SUMMARY ............................................................................................................. iii 1.0 INTRODUCTION ................................................................................................................ 1
1.1 Beluga Whale Sounds .................................................................................................... 1 1.2 Objectives ....................................................................................................................... 2
2.0 METHODS ......................................................................................................................... 2 2.1 Sonobuoys ...................................................................................................................... 5 2.2 Array Setup ..................................................................................................................... 6
2.2.1 Pilot Study ............................................................................................................... 6 2.2.2 Mooring Installation ................................................................................................. 6 2.2.3 Sonobuoy Deployment ............................................................................................ 7
2.3 Sampling Efforts ............................................................................................................. 9 2.4 Sound Level Characterization ........................................................................................ 9 2.5 Environmental Conditions in the Study Area ................................................................ 12 2.6 Data Analyses .............................................................................................................. 12
2.6.1 Automatic Detection .............................................................................................. 12 2.6.2 Visual and Acoustic Comparison ........................................................................... 13 2.6.3 Sound Level Characteristics .................................................................................. 16
3.0 RESULTS ........................................................................................................................ 17 3.1 Sampling Efforts ........................................................................................................... 17 3.2 Automatic Detections .................................................................................................... 18 3.3 Visual and Acoustic Comparison .................................................................................. 21 3.4 Localization ................................................................................................................... 25 3.5 Sound Level Characteristics ......................................................................................... 25 3.6 Environmental Conditions in the Study Area ................................................................ 32
4.0 DISCUSSION ................................................................................................................... 33 4.1 Visual and Acoustic Comparison .................................................................................. 33 4.2 Sounds Levels in the Vicinity of the MTR Project ......................................................... 34 4.3 Implications for Future Studies ..................................................................................... 35
5.0 REFERENCES ................................................................................................................. 37 APPENDIX A: Daily Sonobouy Deployments and Sampling Efforts .................................... 40 APPENDIX B: Data Log Sheets ................................................................................................ 46 APPENDIX C: Passive Acoustic Monitoring Plan for Cook Inlet Beluga Whales ............... 50

Passive Acoustic Monitoring of Cook Inlet Beluga Whales
Alaska Pacific University ii
Acronyms and Abbreviations μPa micropascal
APU Alaska Pacific University oC degree Celsius
cm centimeter
dB decibel
EAFB Elmendorf Air Force Base
FFT fast Fourier transform GB gigabyte
GPS Global Positioning System
Hz hertz
ICRC Integrated Concepts and Research Corporation
IHA Incidental Harassment Authorization
kHz kilohertz
km kilometer
m meter
MMPA Marine Mammal Protection Act
MTR (Port of Anchorage) Marine Terminal Redevelopment (Project)
NMFS National Marine Fisheries Service
NOAA National Oceanic and Atmospheric Administration
PAM passive acoustic monitoring
POA Port of Anchorage Administration
Port the Port of Anchorage facility
PVC polyvinyl chloride
r Pearson’s correlation coefficient
RL received level
SL source level
SPL sound pressure level
TL transmission loss
USACE U.S. Army Corps of Engineers

Passive Acoustic Monitoring of Cook Inlet Beluga Whales
Alaska Pacific University iii
EXECUTIVE SUMMARY
A passive acoustic monitoring (PAM) study of the Cook Inlet beluga whales (Delphinapterus
leucas) was conducted during the 2009 Marine Terminal Redevelopment (MTR) Project
construction season. The purpose of the study was “to detect and localize, to the maximum
extent practicable, passing whales and to determine the proportion of beluga whales missed
from visual surveys … [and] characterize sound levels around the Port related to and in
absence of all construction activities.” This report summarizes the results of the PAM study.
The study was conducted over 20 days, from 1 August through 30 September 2009, in the
waters of the Knik Arm of Upper Cook Inlet adjacent to the Port. An array of four sonobuoys
was deployed to detect presence of beluga whale vocalizations. To characterize sound levels
around the Port related to and in absence of all construction activities, complementary boat-
based recordings were conducted using two hydrophones suspended from a boat on six survey
days.
Passive acoustic data were collected for more than 148 hours in August and September 2009.
Beluga whale echolocation clicks were the most common sound detected during the survey; a
total of 63,392 clicks was detected during 14 (out of 20) days of the PAM study. Beluga whales
were visually observed by the Scientific Monitoring Team and the Construction Observers on 9
of the 14 days the whales were acoustically detected. During periods of concurrent visual and
acoustic surveys, beluga whales were detected by acoustic observations alone 55.3 % of the
time, by visual observations alone 3.1 % of the time, and by both methods 15.4 % of the time.
Beluga whales were not detected by either method 26.2 % of the total observation time.
Localization of calling beluga whales was not possible in this study because beluga whale
echolocation clicks were not detected on more than two sonobuoys at any one time. Therefore,
it was not feasible to estimate the total number of beluga whales detected during PAM study.
Average sound pressure level in the vicinity of the MTR Project during the survey was 129.4 ±
5.4 dB re: 1 μPa with construction activities, and 117.9 ± 10.5 dB re: 1 μPa without construction.
The average source level of impact hammer pile driving during the survey was 196.9 ± 6.1 dB
re: 1 μPa at 1 m. Individual impact pile drives lasted an average of 0.0776 ± 0.0110 s. The
energy of impact hammer pile driving extended up to 20 kHz, although most of it was below 10

Passive Acoustic Monitoring of Cook Inlet Beluga Whales
Alaska Pacific University iv
kHz. The average source level of vibratory hammer pile driving was 183.2 ± 4.8 dB re: 1 μPa at
1 m and the energy from vibratory pile driving was mostly contained at frequencies lower than
10 kHz.

Passive Acoustic Monitoring of Cook Inlet Beluga Whales
1
1.0 INTRODUCTION The Port of Anchorage Marine Terminal Redevelopment Project (MTR Project) is designed to
upgrade and expand existing Port of Anchorage facilities (Port) by removing and replacing aging
and obsolete structures and providing additional dock and backland areas, without disruption of
maritime service during construction. The Project includes in-water construction activities that
have the potential to adversely impact marine mammals within the Knik Arm of Upper Cook Inlet
in Southcentral Alaska.
In compliance with Special Condition IV(1)(B)(b) of the U.S. Army Corps of Engineers (USACE)
404-10 Permit for the MTR Project and Stipulation 5(e)(2)(b) of the Incidental Harassment
Authorization (IHA) issued 15 July 2008 to the Port of Anchorage Administration (POA) and the
Department of Transportation, Maritime Administration, by the National Oceanic and
Atmospheric Administration, National Marine Fisheries Service (NOAA/NMFS), a passive
acoustic monitoring (PAM) study of the Cook Inlet beluga whale (Delphinapterus leucas) was
conducted during the 2009 MTR Project construction season. The purpose of the study, as
stated in the IHA, was “to detect and localize, to the maximum extent practicable, passing
whales and to determine the proportion of beluga whales missed from visual surveys … [and]
characterize sound levels around the Port related to and in absence of all construction
activities.”
Under contract with Integrated Concepts & Research Corporation (ICRC), Alaska Pacific
University (APU) provides this Analysis Report: Passive Acoustic Monitoring of Cook Inlet
Beluga Whales. The report analyzes and summarizes the PAM study conducted during the
2009 construction season for the MTR Project. This study was developed in consultation with
ICRC, in accordance with USACE and the NOAA/NMFS guidance for compliance with the
Marine Mammal Protection Act (MMPA).
1.1 Beluga Whale Sounds Beluga whales, in the order Odontoceti or “toothed whales,” are known as the “canaries of the
sea” because of their ability to produce a variety of sounds frequently (Schevill and Lawrence
1949; Reeves et al. 2002), which makes them good candidates for PAM. Beluga whale sounds
are classified in four categories: whistles, pulse tones, noisy vocalization (cries, grunts, barks)
and echolocation clicks. Beluga whistles range between 0.26 to 20 kilohertz [kHz], the pulse
tones between 0.4 to 12 kHz, and noisy vocalizations range between 0.5 to 16 kHz (Richardson

Passive Acoustic Monitoring of Cook Inlet Beluga Whales
2
et al. 1995). These sounds most likely function as social calls. Echolocation clicks recorded in
captive belugas range between 20 and 120 kHz (Au et al. 1985; Lammers and Castellote 2009).
Echolocation clicks are generally used by odontocetes while foraging or for navigation
(Richardson et al. 1995). Lower frequency vocal repertoire of beluga populations has been
described at a number of different locations (Sjare and Smith 1986; Faucher 1988; Angiel
1997), but to date, the full vocal repertoire of the Cook Inlet belugas has not been described.
1.2 Objectives The purpose of the PAM study was to detect and localize, to the maximum extent practicable,
beluga whales in the vicinity of the MTR Project footprint and characterize sound levels both
during construction activities and in the absence of construction activities. Another objective of
the study was to correlate visual and acoustic data to estimate the proportion of whales missed
by visual observation. Under the supervision of Dr. Ana Širović, APU, Department of
Environmental Science, the Passive Acoustic Monitoring Team (PAM Team) collected passive
acoustic data necessary to answer the following questions:
1. How often are beluga whales missed during visual marine mammal monitoring?
2. What are the sound levels related to, and in the absence of, all construction activities in the
area around the Port?
2.0 METHODS The study was conducted from 1 August through 30 September, 2009, in the waters of the Knik
Arm of Upper Cook Inlet adjacent to the Port (Figure 1). Sonobuoys were deployed in the
vicinity of Cairn Point located on the north end of the MTR Project and close to in-water
construction activities (Figure 2). Four moored lines were deployed in a rhomboid formation at
the beginning of the survey period, allowing quick re-deployment of multiple sonobuoys in the
array throughout the survey period. After each sonobuoy deployment, members of the acoustic
study team at the Cairn Point Marine Mammal Monitoring Station (Cairn Point Station) on
Elmendorf Air Force Base (EAFB), monitored and recorded signals received from the
sonobuoys. At the end of the survey period, the moorings were removed. The locations of the
moorings were chosen based on proximity to the Cairn Point Station, favorable bathymetric
conditions, and relative safety from dredging and shipping operations. The time period when
the sonobuoys were deployed corresponds to the period when beluga whales are frequently
sighted in the Port area (Funk et al. 2005; Cornick and Kendall 2008). The days and times of

Passive Acoustic Monitoring of Cook Inlet Beluga Whales
3
acoustic data collection were chosen based on tides and weather conditions, which limited the
ability to launch a boat and deploy sonobuoys.
Figure 1. The map of the Cook Inlet, showing in an inset the study area surrounding MTR project, where passive acoustic monitoring was conducted.

Passive Acoustic Monitoring of Cook Inlet Beluga Whales
4
Figure 2. The location of the tightly spaced array of four moored lines, placed between 400 and 700 m apart and approximately 600 m off Cairn Point. Sonobuoys were attached to the moorings for each day of acoustic monitoring.

Passive Acoustic Monitoring of Cook Inlet Beluga Whales
5
2.1 Sonobuoys Sonobuoys are expendable electronic devices that consist of a hydrophone, float, radio
transmitter, and salt-water battery (Figure 3). The omnidirectional AN/SSQ-57B sonobuoys
used in this study have a calibrated broadband frequency response from 10 to 20,000 hertz
[Hz], but can be used to detect signal up to 30 kHz (Horsley 1989). Signals received by the
omnidirectional hydrophone are amplified and sent up a wire to the radio transmitter and
antenna which are housed in the surface float. The length of the wire between the surface float
and the hydrophone can be controlled and adjusted to meet research requirements. Sonobuoys
continuously transmit their radio signal to a remote observer for a maximum of 8 to 10 hours.
Figure 3. Type AN/SSQ-57 omnidirectional sonobuoy. (Figure adapted from Horsley 1989).

Passive Acoustic Monitoring of Cook Inlet Beluga Whales
6
2.2 Array Setup Before permanent moorings were installed, a one-day pilot study was conducted. The purpose
of the pilot was to test the array setup under the environmental conditions of Knik Arm.
2.2.1 Pilot Study On 24 July, 2009, the PAM Team conducted calibration and initial testing of the system. A
mooring line was placed at the location of one of the permanent moorings to test the equipment
and make adjustments to deployment protocols. The mooring was tested using a 130-pound
section of railroad rail as the anchor, attached to a 5/8-inch nylon line, approximately 25 meters
(m) long, and a surface float. The location of the mooring was recorded using a handheld
Garmin Global Positioning System (GPS) 72 Personal Navigator. The test mooring was
removed after the test deployment. No sonobuoys were deployed during the pilot study.
2.2.2 Mooring Installation Permanent moorings were installed on 1 August and were left in the water until 7 October,
2009. Their location (latitude and longitude) was recorded using the handheld GPS at the time
of installation. The team deployed four moorings with sides between 400 and 700 m long
(Figure 2), each anchored with approximately 600 pounds of railroad rail sections and attached
to a 5/8-inch nylon line approximately 45 to 55 m long with a surface float. A life ring flotation
device was attached to each of the floats with 3 m of additional line. Strobe lights were attached
to the life ring, as requested by the USACE, on 13 August, to increase the visibility of the
moorings to passing vessels under low light conditions. The locations of the moorings were
checked throughout the survey period to verify they were not moved by the strong tidal currents.
The U.S. Coast Guard was notified of the proposed acoustic monitoring program and
continuously updated during project implementation. The PAM Team notified the U.S. Coast
Guard prior to the deployment of mooring lines and reported the GPS coordinates of the
deployed moorings. The PAM Team also provided coordinates of the moorings to ICRC for
relay to the USACE and their dredging team. Additionally, all parties were notified when the
study was complete and the moorings were removed.
Members of the PAM Team cooperated with POA and EAFB personnel and participated in all
necessary training to ensure compliance with POA and EAFB safety and security policies.
During each day of acoustic monitoring, the PAM Team notified ICRC, the POA, and the
dredging team of their activities adjacent to the Port.

Passive Acoustic Monitoring of Cook Inlet Beluga Whales
7
2.2.3 Sonobuoy Deployment Prior to deployment, sonobuoys were stripped from their original casing and placed in a plastic
canister attached to a life ring (Figure 4). The life ring provided additional structural support in
the fast moving currents of Knik Arm, allowing the sonobuoy float to remain at the surface of the
water in a vertical position after deployment (Figure 5). The vertical position of the sonobuoy
float was important to facilitate signal transmission from the sonobuoy to the shore station.
Ninety feet of cable and the clumped weight, preamplifier and hydrophone were passed through
an opening on the bottom of the canister, which allowed the hydrophone to suspend freely in the
water column. A life ring with one sonobuoy was attached to each mooring float at the
beginning of each day of acoustic observations. Previously deployed sonobuoys were collected
each time before the deployment of new sonobuoys. The deployment location was recorded on
each day of acoustic observations using the handheld GPS to verify the location of the
moorings. The moorings did not move during the duration of the study. Once deployed, the
sonobuoys continuously transmitted their radio signal to remote observers at the Cairn Point
Station for approximately 8 to 10 hours.
Figure 4. Omnidirectional sonobuoys (AN/SSQ-57B) used for this study were stripped from their original casing and placed in a plastic canister attached to a life ring flotation device, which added structural support and allowed the sonobuoy float to remain at the surface of the water in a vertical position after deployment.

Passive Acoustic Monitoring of Cook Inlet Beluga Whales
8
Figure 5. Omnidirectional sonobuoy (AN/SSQ-57B) deployed in Knik Arm with flotation ring and surface float.
Two antennae were mounted on the conex at the Cairn Point Station to receive radio signals
from the sonobuoys. A set of custom electronics and software were used to record and analyze
sonobuoy data. The antennae received the signals and passed them to four software-controlled
ICOM scanner radio receivers (one per sonobuoy signal), modified to provide improved
reception of sonobuoy signal. Each radio was connected to a computer, which was connected
to a MOTU Traveler, a high-quality sound card that enables sampling at a high sample rate
(88.2 kHz). Data were digitized using the software program Ishmael (Mellinger 2001) and saved
as .WAV files on 500 gigabyte (GB) hard disks. On 3 August, data were sampled at 44 kHz,
from 4 to 18 August the sampling rate was 48 kHz, and from 20 August to 30 September the
sampling rate was 88.2 kHz. The sample rate was increased during the study to ensure capture
of the maximum possible bandwidth of beluga whale echolocation clicks given the recording
setup. Reception of the sonobuoy signal was verified with the deployment team after each
deployment. In the case of a failed deployment, the deployment team immediately recovered
the failed sonobuoy and deployed another one. The expected failure rate of less than 15
percent, based on previous experiences with this type of sonobuoy (Širović et al. 2006), was
encountered during this study.

Passive Acoustic Monitoring of Cook Inlet Beluga Whales
9
2.3 Sampling Efforts Acoustic data were collected during 20 days spread out between 1 August and 30 September,
2009 (see Appendix A for summary of the deployments and sampling efforts). To ensure full 8
hour coverage of sonobuoy transmission during daily acoustic monitoring periods, monitoring
was conducted at the Cairn Point Station in two shifts, each of approximately 4 hours duration.
If sonobuoys continued transmitting after the PAM Team shifts were over, or it was after dark,
the PAM Team left the recording setup at Cairn Point Station and returned the following morning
to collect the equipment and data. Recordings were collected during periods with and without
construction activity.
The time of acoustic surveys was coordinated, to the maximum extent practicable, with the time
of marine mammal observations by the Scientific Marine Mammal Monitoring Team (Scientific
Monitoring Team), in an effort to ensure concurrent visual and acoustic data collection.
However, to ensure independent sampling, the two groups worked independently and were not
aware of any beluga detections by the other group. Two members of the PAM Team were
present inside the conex listening to the recordings on speakers during each monitoring
session. To avoid biasing the observations of both teams, the PAM Team did not share their
findings with the Scientific Monitoring Team during the study.
The PAM Team collected deployment and environmental data, and conducted preliminary
acoustic analysis during the daily acoustic monitoring period. Data collected included the
following: deployment date, time, latitude, longitude, and transmission channel for each
sonobuoy, as reported by the deployment team; beginning and end of acoustic observation
period; start and end time of vocalizations (if detected), the species detected, channel(s) with
vocalizations; environmental conditions; type of construction (e.g., pile driving with either
vibratory or impact hammer); and duration of construction activity (see Appendix B for examples
of the data log sheets). Members of the PAM Team entered the data into Microsoft Excel for
Windows for storage and analysis. Sections 2.4 and 2.5 provide additional information on the
collection of data on environmental conditions and anthropogenic activities.
2.4 Sound Level Characterization To estimate sound levels in a region, the characteristics of the sound sources in the area, as
well as transmission loss characteristics of the medium, must be understood. The PAM Team
estimated sound transmission loss coefficient for the Knik Arm off Cairn Point using recordings
collected from complementary boat-based recordings. Observers used a 27-foot vessel

Passive Acoustic Monitoring of Cook Inlet Beluga Whales
10
provided by Alaska Divers Underwater Salvage to collect acoustic data using two calibrated
HTI-96-MIN hydrophones suspended from a cable at the bow and the stern of the boat at
approximately 2 m depth (Blackwell and Greene 2002). The hydrophones were suspended
from the boat through polyvinyl chloride (PVC) pipe to keep the hydrophones as vertical as
possible in the current and to reduce flow noise. Signals from each hydrophone were recorded
continuously using an Edirol R-09 digital recorder at a sample rate of 48 kHz. Once the
hydrophones were placed in the water, the boat engines were turned off to reduce the ambient
noise and allow the boat to drift with the current (Figure 6). Recordings took place in
approximately 3-kilometer (km) long transects (current dependent) along the main channel of
Knik Arm, during different tidal stages and construction activities (e.g., vibratory hammer pile
driving, impact hammer pile driving). GPS positions were recorded continuously during
sampling to document the drift pattern. Sampling took place in nine drift transects on six days
during the study. Data from these transects were used to determine the transmission loss
characteristics by documenting sound levels at a range of distances from the sound source.

Passive Acoustic Monitoring of Cook Inlet Beluga Whales
11
Figure 6. Boat-based recordings took place on six days during the survey period for a total of nine drifts (1 or 2 drifts/day). GPS positions were continuously recorded to document the drift pattern. Drifts provided a range of distances from the sound source.

Passive Acoustic Monitoring of Cook Inlet Beluga Whales
12
2.5 Environmental Conditions in the Study Area Environmental conditions were logged every hour during daily sonobuoy deployment and
monitoring efforts (Appendix B). These conditions included: wind speed, sea state (Beaufort
scale), swell height, and precipitation. Water temperature, salinity, and turbidity were
documented at the time of sonobuoy deployment. In addition, all anthropogenic activities within
the study area were documented during daily monitoring efforts. Events were categorized as:
no activity, impact hammer or vibratory hammer pile driving, dredging, in-water fill placement,
and aircraft and vessel activities. The duration of the activity was recorded.
Environmental conditions for the months of August and September were summarized to better
understand ambient and anthropogenic noise, in addition to sound propagation characteristics
and their effects on detecting calls. Mean wind speed, swell height, surface water temperature,
salinity and turbidity were calculated, as well as the mode of the sea state. The sound speed
was calculated based on the formula given by Medwin (1975) using the measurements of Cook
Inlet temperature and salinity recorded by the PAM Team.
2.6 Data Analyses Data analyses were conducted during collection and also during report preparation. All data
were backed up on a hard disk each day of the deployment. MatLab (MathWorks, Natick, MA)
based sound analysis software was used for preliminary sound analysis, such as
characterization of beluga sound frequency and temporal characteristics. To optimize the data
analysis process, automatic detectors were developed after the completion of the field
implementation phase of the study.
2.6.1 Automatic Detection Several automatic detection methods for efficient detection of calls (e.g. spectrogram
correlation, energy summation, and acoustic power level analysis) were investigated using the
software program Ishmael (Mellinger 2001). Short duration and broadband frequency of beluga
whale clicks indicated that energy summation is a good tool for automatic analysis. Energy
summation method is based on the calculation of the total energy in a frequency band that
contains a part or entire sound of interest. To reduce the number of false detections, the ratio
between the energy in the frequency band of interest and that in an adjacent band of noise that
does not contain sound of interest was calculated. The frequency band used for the calculation
of signal energy was 23 to 25 kHz, and it was compared to the energy in the adjacent “noise”
frequency band from 18 to 20 kHz. Due to initial variation in sampling rate from 3 to 18 August,

Passive Acoustic Monitoring of Cook Inlet Beluga Whales
13
the energy summation parameters were adjusted to account for the difference in sample rate
(44 kHz and 48 kHz). Files for 3 August were manually scanned for echolocation clicks.
Detections for 4 to 18 August were based on the energy ratio between the energy in the signal
band from 23 to 23.9 kHz and the noise band from 15 to 18 kHz.
Detection threshold was set iteratively to optimize the ratio of false alarms to missed detections.
Due to the variation in sonobuoy signal over the course of the data collection, the results of the
automatic detector were visually verified and parameters were modified for different recording
times. When the program signaled a detection, 2 seconds of the signal before and after the
detection were saved into an individual .WAV file. Each file was visually verified for the
presence of beluga whale echolocation click. False detections were removed from subsequent
analysis. Automatic detections provided information on the presence and timing of the beluga
whale sounds.
2.6.2 Visual and Acoustic Comparison Acoustically detected presence of beluga whales was compared with the number of beluga
whale sightings recorded by the Scientific Monitoring Team stationed at the Cairn Point Station.
When visual sightings data were not available from the Scientific Monitoring Team, whale
presence data recorded by the MTR Project Construction Observers (Construction Observers)
at the construction site were used. Beluga whale sightings and beluga whale acoustic
detections were pooled into 30-minute bins centered at the time of the first acoustic detection for
all times during which both acoustic and visual data were available. Since visual observations
indicate that beluga whales mostly pass near the Port area (Cornick and Kendall 2008), if visual
and acoustic detections were more than 30 minutes apart, it was assumed that they represent
different groups. Beluga whale acoustic detections were mapped onto the same grid cells used
by the Scientific Monitoring Team, assuming a detection range for echolocation clicks of 400 m
(Figure 7). This detection range was based on the fact that high frequency sounds, like
echolocation clicks, attenuate very quickly. The presence of clicks in a grid cell was compared
to presence of beluga whales from visual surveys in the same cell. For periods during which
visual sightings were available from the Scientific Monitoring Team, visual sightings were
counted only during times when whales were present in one of the grid cells monitored by the
acoustic survey. It was noted, however, if there were beluga whale sightings in an area outside
the acoustic survey range and they were considered as different groups. When visual data
were available only from the Construction Observers, the entire duration of the sighting was
considered to be within the acoustic detection range if beluga whales passed through at least

Passive Acoustic Monitoring of Cook Inlet Beluga Whales
14
one grid cell monitored by the acoustic survey. This was necessary because the sighting maps
from Construction Observers data showed approximate sighting locations in each grid, but there
was no indication of the exact location of the whales at all times. Percent of time beluga whales
were missed by visual observations alone and by acoustic observations alone was determined.
Additionally, number of acoustic detections and individual sightings within the same 500-m grid
cell was determined for each 30-min bin. These two time-series of detections were correlated to
determine if the number of acoustic detections is correlated to the number of visual sightings.
Pearson’s correlation coefficient (r) was calculated.
To localize calling beluga whales, a call has to be recorded concurrently on three or more
instruments. The areas of the array where an echolocating beluga could have been localized
are shown in Figure 7 as the areas where three circles intersect. Since echolocation clicks
propagate over very short distances, and they were the only beluga whale vocalization regularly
recorded, localization of calling beluga whales was not conducted, since no clicks were detected
on three moorings at the same time.

Passive Acoustic Monitoring of Cook Inlet Beluga Whales
15
Figure 7. The area monitored during the study is represented by the light blue grid cells. If a part of the grid cell was within the 400-m acoustic detection range for echolocation clicks it was considered that the echolocating beluga could be located anywhere within those cells. Only visual sightings observed within one of the grid cells monitored by the acoustic survey were used for analysis.

Passive Acoustic Monitoring of Cook Inlet Beluga Whales
16
2.6.3 Sound Level Characteristics The PAM Study characterized sound levels within the study area relating to, and in the absence
of, all in-water construction activities within the MTR footprint. Ten-second recordings with and
without construction activities were examined. Measurements derived from the recordings of
impact hammer pile driving included two parameters: pulse duration and received level. These
measurements were conducted in a way consistent with earlier studies on transient pulses (e.g.
McCauley et al. 1998; Blackwell 2005). Pulse duration was measured as the time interval
during which 90 % of the total estimated sound energy in the pulse arrived at the receiver,
measured in seconds. Received level (RL) is the total energy of the signal averaged over the
pulse duration and its units are decibels relative to 1 micropascal [dB re: 1 µPa]. The mean of
each parameter was calculated from 15 recordings.
Also, the mean RL from vibratory hammer pile driving was measured. The RL was measured
from 10 seconds of recording, after the signal was low-pass filtered at 200 Hz to remove the
low-frequency flow noise that dominated this part of the spectrum during tidal drifts. A total of
15 recordings was used to calculate the average RL of vibratory pile driving.
To calculate source levels (SL) of each of these sounds, propagation loss characteristics of the
environment and range to the source have to be determined. SL is calculated as the sum of the
RL and the transmission loss (TL). A simple propagation model of transmission loss can be
expressed as a product between the propagation loss coefficient (X) and the logarithm of the
range (r) between the recording and the source, TL = X log(r). Empirical data were used to
estimate the propagation loss coefficient X (Section 3.4). In order to obtain this estimate, a
scatter plot of received levels versus estimated range was made for all analyzed recordings of
impact pile driving. The range was estimated using ArcGIS (ESRI, Redlands, CA) as the
difference between the GPS location of the drifting boat and the location of pile driving activity.
The propagation loss coefficient was calculated as the slope of the best-fit line through the
plotted points of received levels versus logarithm of estimated range (Blackwell 2005; Širović et
al. 2007). The standard unit of SL is expressed as dB re: 1 µPa at distance of 1 m from the
source [dB re: 1 µPa at 1 m].

Passive Acoustic Monitoring of Cook Inlet Beluga Whales
17
Additionally, sound propagation modeling was used to theoretically verify the empirical result of
the propagation loss coefficient. The PAM Team modeled incoherent transmission loss1 using
BELLHOP software developed by M. Porter and available from the Ocean Acoustics Library
(http://oalib.hlsresearch.com/). Since Cook Inlet is a well-mixed estuary, the sound speed was
assumed to be homogenous through the water column. (This assumption was verified with the
environmental measurements.) Separate model runs were conducted for August and
September sound speed profile characteristics. The depth was assumed to be flat out to 1 km
from shore, and then it dropped additional 20 m. The model was run for high tide and low tide
conditions, with depth in the flat area assumed to be 25 and 15 m, respectively. The model was
run for frequencies ranging from 10 to 15,000 Hz, which are the frequencies with prevalent
energy content for construction activities.
To understand the noise levels from construction activities within the MTR Project footprint,
sound pressure levels (SPLs) were calculated from 10 second recordings containing dredging
and other general construction activity noises. The average was calculated from 15 recordings
made throughout the area of the drift dives. Finally, 10 second recordings from periods without
construction noise were used to calculate SPLs in the absence of construction noise and the
average was calculated. All signals were band-pass filtered between 200 and 20,000 Hz. The
unit of SPL is dB re: 1 µPa.
3.0 RESULTS Results of data analysis are presented as sampling efforts, automatic detections, visual and
acoustic comparison, localization, sound level characteristics, and environmental conditions in
the study area.
3.1 Sampling Efforts Acoustic monitoring was conducted for more than 148 hours over 20 days in August and
September 2009 (Appendix A). Eighty-six sonobuoys were deployed during the study and there
were 8 failed sonobuoy deployments, giving a sonobuoy failure rate of 9.3 %. A total of 373
hours of passive acoustic data were collected from the four moorings. The signal reception
1 Incoherent transmission loss is calculated by ignoring the phase of the sound pressure wave (Jensen et al. 2000).

Passive Acoustic Monitoring of Cook Inlet Beluga Whales
18
from sonobuoys varied with tidal stage. Occasionally, a signal from a sonobuoy was lost during
high flood or ebb tides because the sonobuoy transmitter was submerged. The signal resumed
once the sonobuoy resurfaced after approximately 20 to 60 minutes. During the recovery of
sonobuoys in subsequent days, it was discovered that the hydrophone was often ripped off from
the sonobuoy cable because of the fast moving currents. Occasionally, this resulted in
abbreviated daily sampling efforts.
3.2 Automatic Detections Beluga whale echolocation clicks were the most common sound detected during the PAM
survey at the MTR Project. Most of the energy in beluga whale clicks recorded in the vicinity of
the MTR Project construction site was above 15 kHz (Figure 8). A total of 63,392 clicks was
detected during 14 (out of 20) days of the passive acoustic survey, although some of those
clicks were likely the same click detected on two different sonobuoys (Table 1). Of the total
number of detected clicks, 39,500 were detected during times when there were concurrent
visual observer efforts by the Scientific Monitoring Team or the Construction Observers. Beluga
whale clicks were detected most commonly on mooring M1, the westernmost mooring.

Passive Acoustic Monitoring of Cook Inlet Beluga Whales
19
Table 1. Number of clicks detected
Date Mooring1 # of Clicks2 04-Aug-09 M2 29 13-Aug-09 M4 1,283 18-Aug-09 M1 31 20-Aug-09 M1 16 20-Aug-09 M2 10 22-Aug-09 M1 8,619 22-Aug-09 M2 2,027 25-Aug-09 M2 21 01-Sep-09 M1 1,367 04-Sep-09 M1 1,382 04-Sep-09 M2 177 08-Sep-09 M2 97 10-Sep-09 M1 399 10-Sep-09 M2 1,094 20-Sep-09 M1 577 23-Sep-09 M1 6,256 23-Sep-09 M4 22 25-Sep-09 M1 2,804 25-Sep-09 M3 785 27-Sep-09 M2 15,231 27-Sep-09 M3 3 27-Sep-09 M4 22,505
Total 63,392 1 The mooring location clicks were detected. 2 The total number of clicks detected on the mooring during that day of acoustic observations.
One beluga whale whistle was recorded during a drift recording on 4 September, 2009 (Figure
9). The whistle was recorded while the boat was outside of the array monitoring area and it was
not recorded on any of the moorings. This was the only beluga sound that was not an
echolocation click recorded during the PAM Study and therefore no whistle detector was
developed.

Passive Acoustic Monitoring of Cook Inlet Beluga Whales
20
Figure 8. Time series and spectrogram of two beluga whale echolocation clicks recorded on 23 September, 2009 on mooring M1. The spectrogram was plotted with 1000-point Fast Fourier Transform (FFT) and the signal was low-pass filtered at 10 kHz.

Passive Acoustic Monitoring of Cook Inlet Beluga Whales
21
Figure 9. Time series and spectrogram of beluga whale whistle recorded during a drift recording on 4 September, 2009. The spectrogram was plotted with 1000-point FFT and low-pass filtered at 300 Hz to eliminate low-frequency flow noise.
3.3 Visual and Acoustic Comparison
Beluga whales were visually observed by the Scientific Monitoring Team and the Construction
Observers on 9 of the 14 days the whales were acoustically detected. During periods of
concurrent visual and acoustic surveys, beluga whales were detected by acoustic observations
alone 55.3 % of the time, by visual observations alone 3.1 % of the time, and by both methods
15.4 % of the time (Figure 10). Beluga whales were not detected by either method 26.2 % of

Passive Acoustic Monitoring of Cook Inlet Beluga Whales
22
the total observation time. Visual and acoustic detections were weakly positively correlated (r =
0.148).
Using the assumption that all acoustic detections less than 30 minutes apart represent a single
group of beluga whales passing through the area, the PAM Team estimated a total of 18 groups
of beluga whales detected acoustically during the survey period (8 in August and 10 in
September; Figure 11). Based on the same 30 minute period assumption, during the same time
the acoustic survey was taking place, the Scientific Monitoring Team sighted 11 groups of
beluga whales within their survey area (4 groups in August and 7 in September).
0.0
10.0
20.0
30.0
40.0
50.0
60.0
70.0
80.0
90.0
100.0
Acoustic Only Visual Only Both Neither
% time
Method
Figure 10. Proportion of time beluga whales were detected by two different observation methods within the area monitored by the acoustic array on 20 days of acoustic effort from 1 August to 30 September, 2009.

Passive Acoustic Monitoring of Cook Inlet Beluga Whales
23
0
0.5
1
1.5
2
2.5
8/3/
2009
8/10
/200
9
8/17
/200
9
8/24
/200
9
8/31
/200
9
9/7/
2009
9/14
/200
9
9/21
/200
9
9/28
/200
9
Num
ber
of g
roup
s pe
r day
Acoustic Visual
Figure 11. Number of beluga whale groups visually sighted and acoustically detected each of the 20 days of acoustic effort from 1 August to 30 September, 2009.
Two examples of beluga whale acoustic detections and visual sightings on 25 August and 8
September, 2009 are given in Figures 12a and 12b, respectively. Beluga whales were visually
and acoustically detected from 11:03 to 14:02 and 15:18 to 18:47 on 25 August, and from 09:34
to 13:33 on 8 September. On both days beluga whales were detected on the sonobuoy
deployed at mooring M2, but were not detected on M1, M3 or M4. On 25 August, beluga
whales were visually observed in grid cells E9, F9, G9, H9, I9 and G7. On 8 September, they
were visually observed in grid cells I4, J4, K7, K8, H9, I9 and J9.

Passive Acoustic Monitoring of Cook Inlet Beluga Whales
24
Figure 12. Visual and acoustic observations of beluga whales on two different days during PAM. Acoustic detections are in blue and visual sightings are in orange. a. Observations on 25 August, 2009 from 11:03 to 14:02 and 15:18 to 18:47. b. Observations on 8 September, 2009 from 09:34 to 13:33.
a. b.

Passive Acoustic Monitoring of Cook Inlet Beluga Whales
25
3.4 Localization Localization of calling beluga whales was not possible in this study because beluga whale
echolocation clicks were not detected on more than two sonobuoys at any one time. Since
individual whales could not be localized based on the vocalizations they produced in the vicinity
of the MTR Project, it was not feasible to estimate the total number of beluga whales detected
during the PAM study.
3.5 Sound Level Characteristics Approximately 4 hours of acoustic data were recorded during boat drifts with and without
construction activities (Table 2). Recordings included periods with impact and vibratory hammer
pile driving, dredging, aircraft and vessel noise, and also some periods without construction
activities (Figures 13 though 16).
Table 2. Boat drifts during the PAM study
Date1 Drift2 Start Time3 End Time4 Duration5
18‐Aug‐09 1 17:11 17:15 0:04 18‐Aug‐09 2 17:20 17:43 0:23 22‐Aug‐09 1 10:30 11:01 0:31 01‐Sep‐09 1 11:12 11:18 0:06 01‐Sep‐09 2 11:28 12:03 0:35 04‐Sep‐09 1 8:19 8:34 0:15 04‐Sep‐09 2 9:39 10:16 0:37 25‐Sep‐09 1 11:39 12:15 0:36 27‐Sep‐09 1 13:37 14:34 0:57
Total 4:04 1 Nine drifts took place during the study. 2 1=first drift of the day; 2=second drift of the day 3 The start time of the drift (local time). 4 The end time of the drift (local time). 5 The total recording time of each drift.

Passive Acoustic Monitoring of Cook Inlet Beluga Whales
26
Figure 13. Time series and spectrogram of impact hammer pile driving recorded on 28 August, 2009 on mooring M1 and plotted with 1000-point FFT and 0% overlap.

Passive Acoustic Monitoring of Cook Inlet Beluga Whales
27
Figure 14. Time series and spectrogram of vibratory hammer pile driving recorded on 28 August, 2009 on mooring M1 and plotted with 1000-point FFT and 0% overlap.

Passive Acoustic Monitoring of Cook Inlet Beluga Whales
28
Figure 15. Time series and spectrogram of sound from the dredge recorded on 23 September, 2009 on mooring M2. Spectrogram was plotted with 1000-point FFT and 0% overlap.

Passive Acoustic Monitoring of Cook Inlet Beluga Whales
29
Figure 16. Time series and spectrogram during a period without construction activities recorded on mooring M4 on 28 August, 2009. Spectrogram was plotted with 1000-point FFT and 0% overlap.
Received levels of impact hammer pile driving varied with distance from the pile driver at which
the recording was taken (Figure 17). The slope of the best-fit line fitted through the scatter plot
of received levels versus the logarithm of range, which is the empirical value of the transmission
loss coefficient, was found to be 16.4. This value falls between the theoretical values for
cylindrical and spherical spreading loss (10 and 20, respectively). The PAM Team compared

Passive Acoustic Monitoring of Cook Inlet Beluga Whales
30
this value with the results of theoretical transmission loss modeling and found that it
corresponds well to the modeled loss at high tide at ranges over 200 m (Figure 18). In general,
transmission loss characteristics did not change over the range of modeled frequencies (10 to
15,000 Hz) and the change in TL characteristics between August and September conditions
was minor. Transmission loss was, however, approximately 2 dB lower during low tide than
during high tide conditions at ranges greater than 20 m (Figure 18), indicating that sound
propagates somewhat better during low tide.
Figure 17. Measured received levels of impact hammer pile driving sounds recorded during four drifts plotted against the log-range. The slope of the best-fit line (shown in orange) gives the coefficient of transmission loss, X = 16.4.

Passive Acoustic Monitoring of Cook Inlet Beluga Whales
31
Figure 18. Results of propagation modeling compared to empirical transmission loss model. The transmission loss results are shown for 500 Hz at 2 m (depth of the hydrophone during drifts). Thick red line is showing September condition and overlapping thin blue line August conditions. Dotted lines show transmission loss during low tide and solid lines show high tide conditions; the difference is <2 dB. Green and yellow lines show theoretical transmission loss for spherical and cylindrical spreading, respectively.
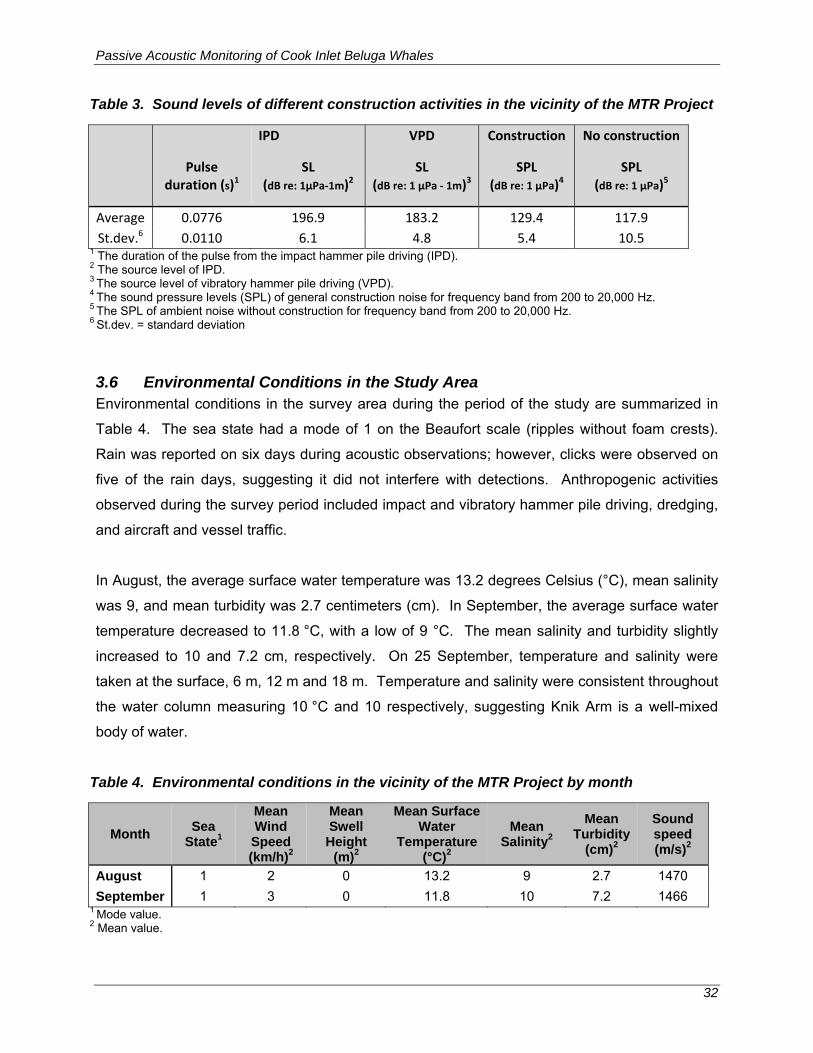
Average sound pressure level in the area of the drift survey during August and September 2009
was 129.4 ± 5.4 dB re: 1 μPa with construction activities, and 117.9 ± 10.5 dB re: 1 μPa without
construction (Table 3). Pile driving occurred frequently during the PAM Team’s study. The
average source level of impact hammer pile driving during period of drift recordings in August
and September 2009 was 196.9 ± 6.1 dB re: 1 μPa at 1 m. Individual impact pile drives lasted
an average of 0.0776 ± 0.0110 s. The energy of impact hammer pile driving extended up to
20,000 Hz, although most of it was below 10,000 Hz (Figure 13). The average source level of
vibratory hammer pile driving was 183.2 ± 4.8 dB re: 1 μPa at 1 m and the energy from vibratory
pile driving was mostly contained at frequencies lower than 10,000 Hz (Figure 14).
Passive Acoustic Monitoring of Cook Inlet Beluga Whales
32
Table 3. Sound levels of different construction activities in the vicinity of the MTR Project
IPD VPD Construction No construction
Pulse
duration (s)1 SL
(dB re: 1µPa‐1m)2 SL
(dB re: 1 µPa ‐ 1m)3 SPL
(dB re: 1 µPa)4 SPL
(dB re: 1 µPa)5
Average 0.0776 196.9 183.2 129.4 117.9 St.dev.6 0.0110 6.1 4.8 5.4 10.5
1 The duration of the pulse from the impact hammer pile driving (IPD). 2 The source level of IPD. 3 The source level of vibratory hammer pile driving (VPD). 4 The sound pressure levels (SPL) of general construction noise for frequency band from 200 to 20,000 Hz. 5 The SPL of ambient noise without construction for frequency band from 200 to 20,000 Hz. 6 St.dev. = standard deviation
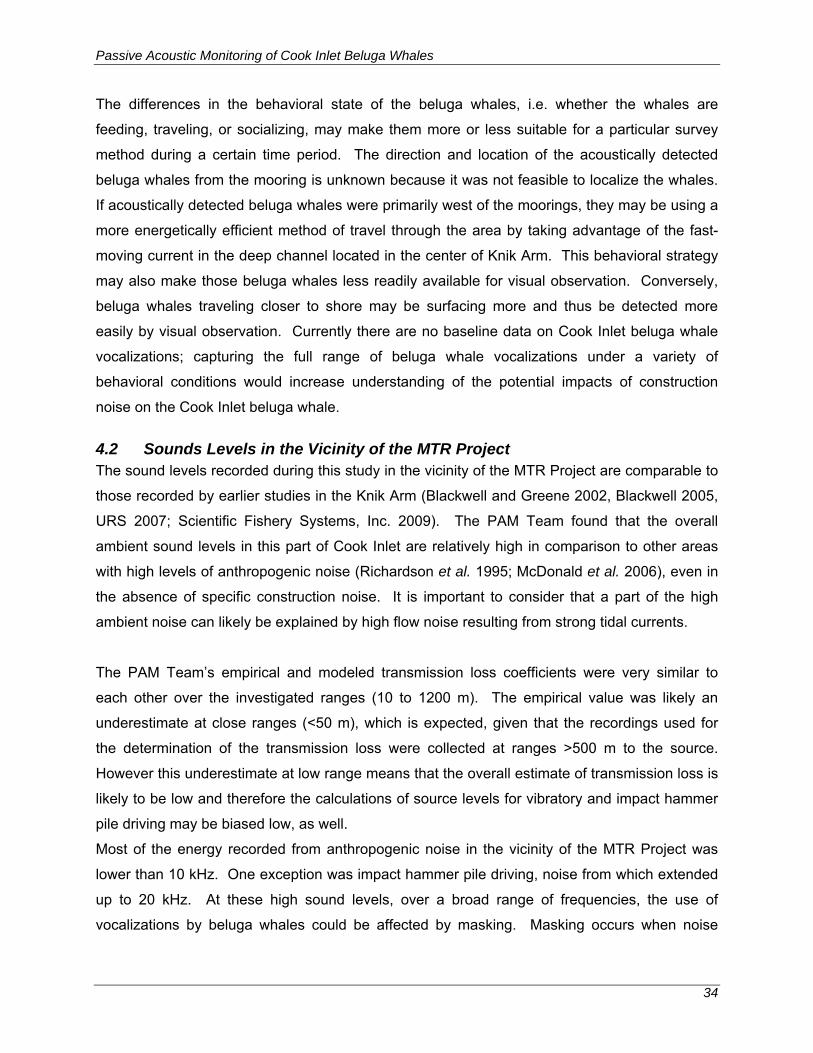
3.6 Environmental Conditions in the Study Area Environmental conditions in the survey area during the period of the study are summarized in
Table 4. The sea state had a mode of 1 on the Beaufort scale (ripples without foam crests).
Rain was reported on six days during acoustic observations; however, clicks were observed on
five of the rain days, suggesting it did not interfere with detections. Anthropogenic activities
observed during the survey period included impact and vibratory hammer pile driving, dredging,
and aircraft and vessel traffic.
In August, the average surface water temperature was 13.2 degrees Celsius (°C), mean salinity
was 9, and mean turbidity was 2.7 centimeters (cm). In September, the average surface water
temperature decreased to 11.8 °C, with a low of 9 °C. The mean salinity and turbidity slightly
increased to 10 and 7.2 cm, respectively. On 25 September, temperature and salinity were
taken at the surface, 6 m, 12 m and 18 m. Temperature and salinity were consistent throughout
the water column measuring 10 °C and 10 respectively, suggesting Knik Arm is a well-mixed
body of water.
Table 4. Environmental conditions in the vicinity of the MTR Project by month
Month Sea State1
Mean Wind Speed (km/h)2
Mean Swell Height
(m)2
Mean Surface Water
Temperature (°C)2
Mean Salinity2
Mean Turbidity
(cm)2
Sound speed (m/s)2
August 1 2 0 13.2 9 2.7 1470 September 1 3 0 11.8 10 7.2 1466
1 Mode value. 2 Mean value.

Passive Acoustic Monitoring of Cook Inlet Beluga Whales
33
4.0 DISCUSSION Beluga whale echolocation clicks with most acoustic energy at frequencies higher than 15 kHz
were commonly recorded in the vicinity of the MTR Project construction site, but other types of
beluga whale vocalizations (e.g. whistles) were very rare. Common anthropogenic noise
recorded during the survey period included impact and vibratory hammer pile driving, dredging,
and aircraft and vessel traffic. Most of these anthropogenic sounds have energy at frequencies
below 10 kHz, but occasionally extend up to 20 kHz in the case of impact hammer pile driving.
4.1 Visual and Acoustic Comparison Beluga whales were detected more frequently by acoustic observations than by the two visual
observation teams. Based on the assumption of beluga whales passing through the Port area,
and given the average group size of 3 animals recorded by the Scientific Monitoring Team, 21
beluga whales were missed by visual observation alone during the survey period. This
discrepancy between visual observation and acoustic detection is expected because visual
observation relies on the brief period of time when the animal surfaces (Mellinger et al. 2007). It
is often difficult to visually observe beluga whales due to their coloration, especially when
environmental conditions are not favorable. On the other hand, beluga whales are highly vocal
animals (Reeves et al. 2002) and rely on echolocation to navigate (Richardson et al. 1995).
Echolocation could be particularly important in the turbid waters of Cook Inlet where the whales
cannot rely on eyesight for navigation, resulting in a greater chance of detecting them
acoustically than by visual observation. Beluga whales have been observed diving for
approximately 20 minutes (Martin and Smith 1999) and could feasibly dive without surfacing
throughout the MTR Project construction site monitoring area.
Beluga whales were more commonly detected acoustically offshore near the deep channel in
Knik Arm (moorings M1 and M2) than adjacent to the shoreline (M3 and M4), indicating beluga
whales may use areas offshore more frequently than originally believed (Moore et al. 2000).
Over the past several years, marine mammal observers for the MTR Project more often
observed beluga whales along the shoreline and adjacent to the MTR Project footprint than
offshore (Markowitz and McGuire 2007; Cornick and Kendall 2008). However, Markowitz and
McGuire (2007) note that sightings are directly related to the location of the observation station
from the beluga whales. Therefore, beluga whales at greater distances from the observation
station are more likely to be missed than beluga whales passing near the shoreline adjacent to
the observation station.
Passive Acoustic Monitoring of Cook Inlet Beluga Whales
34
The differences in the behavioral state of the beluga whales, i.e. whether the whales are
feeding, traveling, or socializing, may make them more or less suitable for a particular survey
method during a certain time period. The direction and location of the acoustically detected
beluga whales from the mooring is unknown because it was not feasible to localize the whales.
If acoustically detected beluga whales were primarily west of the moorings, they may be using a
more energetically efficient method of travel through the area by taking advantage of the fast-
moving current in the deep channel located in the center of Knik Arm. This behavioral strategy
may also make those beluga whales less readily available for visual observation. Conversely,
beluga whales traveling closer to shore may be surfacing more and thus be detected more
easily by visual observation. Currently there are no baseline data on Cook Inlet beluga whale
vocalizations; capturing the full range of beluga whale vocalizations under a variety of
behavioral conditions would increase understanding of the potential impacts of construction
noise on the Cook Inlet beluga whale.
4.2 Sounds Levels in the Vicinity of the MTR Project The sound levels recorded during this study in the vicinity of the MTR Project are comparable to
those recorded by earlier studies in the Knik Arm (Blackwell and Greene 2002, Blackwell 2005,
URS 2007; Scientific Fishery Systems, Inc. 2009). The PAM Team found that the overall
ambient sound levels in this part of Cook Inlet are relatively high in comparison to other areas
with high levels of anthropogenic noise (Richardson et al. 1995; McDonald et al. 2006), even in
the absence of specific construction noise. It is important to consider that a part of the high
ambient noise can likely be explained by high flow noise resulting from strong tidal currents.
The PAM Team’s empirical and modeled transmission loss coefficients were very similar to
each other over the investigated ranges (10 to 1200 m). The empirical value was likely an
underestimate at close ranges (<50 m), which is expected, given that the recordings used for
the determination of the transmission loss were collected at ranges >500 m to the source.
However this underestimate at low range means that the overall estimate of transmission loss is
likely to be low and therefore the calculations of source levels for vibratory and impact hammer
pile driving may be biased low, as well.
Most of the energy recorded from anthropogenic noise in the vicinity of the MTR Project was
lower than 10 kHz. One exception was impact hammer pile driving, noise from which extended
up to 20 kHz. At these high sound levels, over a broad range of frequencies, the use of
vocalizations by beluga whales could be affected by masking. Masking occurs when noise

Passive Acoustic Monitoring of Cook Inlet Beluga Whales
35
interferes with a sound of interest because both the noise and sound of interest have similar
frequencies (Richardson et al. 1995). These construction noises, though, do not mask
echolocation clicks, and it is possible that this is the primary vocalization produced by beluga
whales in this area because they are trying to avoid other loud frequency bands.
4.3 Implications for Future Studies Knik Arm of the Upper Cook Inlet in general, and the area in the vicinity of the MTR Project in
particular, provide a challenging environment for successful PAM of beluga whales. Strong tidal
currents caused occasional losses of sonobuoy signal during survey days with high tidal
fluctuations. It is likely that any other real-time monitoring setup would suffer from similar
problems, or other problems caused by sedimentation and flow. Deployment of long-term
moored recorders would require special adaptation of such equipment. Additionally, such long-
term moorings generally do not provide opportunity for real-time monitoring that was possible
during this study.
An additional problem encountered during PAM in the area was loud, broadband anthropogenic
noise. The sources of most of this noise were transient, but the PAM Team was able to collect
recordings with relatively low noise levels during periods when beluga whales were sighted.
Even in these recordings, however, background noise levels were relatively high (average 118
dB re: 1 μPa). The paucity of beluga whale vocalizations in the lower frequency band (<10 kHz)
thus may indicate that beluga whales are not producing lower frequency sounds (whistles, pulse
tones or noisy vocalizations) while transiting through this area. Alternatively, these sounds may
be masked by other noises at lower frequencies and may only be detectable by nearby
conspecifics or observers. Generally, to improve the recordings of the most common beluga
whale sounds in this area, echolocation clicks, the use of recording gear specifically designed to
record larger bandwidth would be advisable.
Visual and acoustic survey methods operate over different spatial and temporal scales. Visuals
observations cover a much larger area, especially in Knik Arm, where sounds may be masked
by noise or do not propagate far from the sender. Nevertheless, this study indicates that visual
observation alone can potentially miss over one-third of the beluga whale groups passing
through the area. Acoustic method alone missed beluga whales 3 percent of the time and
provided coverage over a small area. However, if a long-term acoustic monitoring program
were implemented, the program would need to use acoustic equipment such as autonomous

Passive Acoustic Monitoring of Cook Inlet Beluga Whales
36
recorders specifically adapted for rough conditions of Upper Cook Inlet that are capable of
recording the full range of beluga whale vocalizations for extended periods of time. Given the
difficulties associated with the implementation of a real-time, broad bandwidth recording system
in Knik Arm, a combination of the two methods would increase the ability to determine the
overall effects of MTR Project in-water construction on Cook Inlet beluga whales.

Passive Acoustic Monitoring of Cook Inlet Beluga Whales
37
5.0 REFERENCES Angiel, N.M. 1997. The vocal repertoire of the beluga whale in Bristol Bay, Alaska. M.Sc. thesis.
University of Washington. Pp. 88. Au, W.W.L., D.A. Carder, R.H. Penner, and B.L. Scronce. 1985. Demonstration of adaptation in
beluga whale echolocation signals. Journal of the Acoustical Society of America. 77: 726-730. Au WWL and Hastings MC. 2008. Principles of Marine Bioacoustics: Springer, New York, NY. Blackwell, S. B., and C. R. Greene, Jr. 2002. Acoustic Measurements in Cook Inlet, Alaska,
During August 2001. Greeneridge Report. 271-2. Report from Greeneridge Sciences, Inc. Santa Barbara, CA, for NMFS, Anchorage, AK.
Blackwell, S.B. 2005. Underwater measurements of pile-driving sounds during the Port
MacKenzie dock modifications, 13-16 August 2004. Report from Greeneridge Sciences, Inc. Goleta, CA, and LGL Alaska Research Associates, Anchorage, AK, in association with HDR Alaska, Inc., Anchorage, AK: Knik Arm Bridge and Toll Authority, Anchorage, AK, Alaska Department of Transportation and Public Facilities, Anchorage, AK, and Federal Highway Administration, Juneau, AK.
Cornick, L.A. and L.S. Kendall. 2008. Distribution, Habitat Use and Behavior of Cook Inlet
beluga whales in Knik Arm, fall 2007. Annual Report for 2008. Prepared for Integrated Concepts and Research Corporation, Anchorage, Alaska, in corporation with the U.S. Department of Transportation, Maritime Administration.
Cato, D.H. 1998. Simple methods of estimating source levels and locations of marine animal
sounds. Journal of the Acoustical Society of America 104: 1667-1678. Faucher, A. 1988. The vocal repertoire of the St. Lawrence Estuary population of beluga whales
(Delphinapterus leucas) and its behavioral social and environmental context. M.Sc. thesis, Dalhousie University.
Funk, D.W., T.M. Markowitz and R. R. Rodrigues. 2005. Baseline studies of beluga whale
habitat use in Knik Arm, Upper Cook Inlet, Alaska, 2004-2005. Rep. from LGL Alaska Research Associates, Inc., Anchorage, AK, in association with HDR Alaska, Inc., Anchorage, AK, for the Knik Arm Bridge and Toll Authority, Anchorage, AK, Department of Transportation and Public Facilities, Anchorage, AK, and the Federal Highway Administration, Juneau, AK.
Horsley, L.E. 1989. Modification and deployment techniques for hand-deployed arctic long-life sonobuoys. IEEE Journal of Oceanic Engineering 14: 211-220.
Jensen, F.B., W.A. Kuperman, M.B. Porter, H. Schmidt. 2000. Computational Ocean Acoustics:
Springer-Verlag, New York, NY. Lammers, M.O. and M. Castellote. 2009. The beluga whale produces two pulses to form its
sonar signal. Biology Letters 5: 297-301.

Passive Acoustic Monitoring of Cook Inlet Beluga Whales
38
Laurinolli, M.H., A.E. Hay, F. Desharnais, and C.T. Taggart. 2003. Localization of North Atlantic right whale sounds in the Bay of Fundy using a sonobuoy array. Marine Mammal Science 19: 708-723.
Martin, A.R. and T.G. Smith. 1999. Strategy and capability of wild belugas, Delphinapterus
leucas, during deep, benthic diving. Canadian Journal of Zoology 77: 1783-1793. McCauley, R.D., M.-N. Jenner, C. Jenner, K.A. McCabe, and J. Murdoch. 1998. The response
of humpback whales (Megaptera novaeangliae) to offshore seismic survey noise: preliminary results of observations about a working seismic vessel and experimental exposures. Australian Petroleum Production and Exploration Association Journal 38: 692-707.
McDonald, M.A. J.A. Hildebrand, S.M. Wiggins. 2006. Increases in deep ocean ambient noise in
the Northeast Pacific west of San Nicolas Island, California. Journal of the Acoustical Society of America 120: 711-718.
Medwin, H. 1975. Speed of sound in water for realistic parameters. Journal of the Acoustical
Society of America 58: 1318. Mellinger, D.K. 2001. Ishmael 1.0 User’s Guide. NOAA Technical Memorandum OAR-PMEL-
120, NOAA Pacific Marine Environmental Laboratory, Seattle. 26 pp. Mellinger, D.K., K.M. Stafford, S.E. Moore, R.P. Dziak, and H. Matsumoto. 2007. An overview of
fixed passive acoustic observation methods for cetaceans. Oceanography 20 (4):36-45. Reeves, R.R., B.S. Stewart, P.J. Clapham, and J.A. Powell. 2002. National Audubon Society:
Guide to Marine Mammals of the World. Alfred A. Knopf, Inc.,New York, NY. Richardson, W.J., C.R. Greene Jr., C.I. Malme, and D.H. Thomson. 1995. Marine Mammals and
Noise: Academic Press, San Diego, CA. Schevill, W.E. and B. Lawrence. 1949. Underwater listening to the white porpoise
(Delphinapterus leucas). Science 109: 143-144. Scientific Fishery Systems, Inc. 2009. 2008 Underwater Noise Survey During Construction Pile
Driving, Port of Anchorage Marine Terminal Development Project, in Support of Alaska Native Technologies, LLC. Prepared for U.S. Department of Transportation Maritime Administration, Port of Anchorage, and Integrated Concepts & Research Corporation. January.
Širović, A., J.A. Hildebrand, and D. Thiele. 2006. Baleen whales in the Scotia Sea during
January and February 2003. Journal of Cetacean Research and Management 8: 161–171. Širović, A., J.A. Hildebrand, and S.M. Wiggins. 2007. Blue and fin whale call source levels and
propagation ranges in the Southern Ocean. Journal of the Acoustical Society of America 122: 1208-1215.
Sjare, B.L. and T.G. Smith. 1986. The vocal repertoire of white whales, Delphinapterus leucas,
summering in Cunningham Inlet, Northwest Territories. Canadian Journal of Zoology 64: 407-415.

Passive Acoustic Monitoring of Cook Inlet Beluga Whales
39
URS. 2007. Port of Anchorage Marine Terminal Development Project Underwater Noise Survey Test Pile Driving Program Anchorage, Alaska. Prepared for United States Department of Transportation Maritime Administration, Washington D.C, Port of Anchorage, Anchorage, Alaska, Integrated Concepts & Research Corporations, Anchorage, Alaska.

Passive Acoustic Monitoring of Cook Inlet Beluga Whales
40
APPENDIX A: Daily Sonobouy Deployments and Sampling Efforts

Passive Acoustic Monitoring of Cook Inlet Beluga Whales
41
Date Mooring Channel Start Time (hh:mm)
Lat/degrees Decimals Long/degrees Decimals Depth (m)
Sonobuoy Sampling Efforts
(hh:mm)
Daily Sampling Effort (hh:mm)
1‐Aug‐09 1 0 9:49 61 15.286 ‐149 53.840 19.8
Mooring Installation 2 0 9:23 61 15.542 ‐149 53.416 7.9 3 0 10:47 61 15.196 ‐149 53.464 15.8 4 0 10:15 61 14.921 ‐149 53.733 15.1
3‐Aug‐09 1 31 6:22 61 15.312 ‐149 53.850 27.4 0:00 3:20 2 28 6:16 61 15.569 ‐149 53.427 12.2 0:00 3 5 6:26 61 15.210 ‐149 53.469 23.6 3:20 4 14 6:30 61 14.945 ‐149 53.721 20.4 0:26
4‐Aug‐09 1* 4 7:11 61 15.315 ‐149 53.315 26.8 − 5:40
1◊ 6 12:18 61 15.278 ‐149 53.838 19.8 −
2 31 7:22 61 15.562 ‐149 53.472 22.9 3:46 3 14 7:36 61 15.182 ‐149 53.502 25.4 1:19 4 28 7:02 61 14.950 ‐149 53.698 20.8 0:00
11‐Aug‐09
1 26 11:07 61 15.309 ‐149 53.830 27.7 4:10 6:48
2 31 11:26 61 15.571 ‐149 53.439 13.7 4:41 3 28 11:32 61 15.193 ‐149 53.465 23.3 5:30 4 14 11:36 61 14.937 ‐149 53.732 21.9 1:36
13‐Aug‐09
1 28 12:40 61 15.318 ‐149 53.839 26.2 4:18 8:17
2 30 12:27 61 15.574 ‐149 53.427 12.2 0:06 3 31 12:21 61 15.206 ‐149 53.470 22.3 7:41 4 14 12:17 61 14.951 ‐149 53.730 21.0 8:17

Passive Acoustic Monitoring of Cook Inlet Beluga Whales
42
Date Mooring Channel Start Time (hh:mm)
Lat/degrees Decimals Long/degrees Decimals Depth (m)
Sonobuoy Sampling
Efforts (hh:mm)
Daily Sampling Effort (hh:mm)
18‐Aug‐09 1 31 19:11 61 15.317 ‐149 53.834 27.2 7:25 8:25 2 14 18:41 61 15.572 ‐149 53.428 12.8 2:26 3* 12 18:51 − − − − − −
3◊ 12 19:46 61 15.181 ‐149 53.496 26.5 0:02
4 28 19:28 61 14.946 ‐149 53.718 21.9 5:45 20‐Aug‐09 1 14 7:58 61 15.303 ‐149 53.854 30.2 7:36 8:07
2* 31 7:17 61 15.577 ‐149 53.410 13.4 −
2◊ 31 8:10 61 15.534 ‐149 53.465 20.1 5:48
3 12 7:33 61 15.207 ‐149 53.472 25.9 1:10 4 28 7:38 61 14.928 ‐149 53.777 22.9 0:53
22‐Aug‐09 1 14 9:38 61 15.283 ‐149 53.859 30.2 6:48 7:01 2* 31 9:06 − − − − − −
2◊ 20 10:02 61 15.511 ‐149 53.442 21.1 1:21
3 28 9:45 61 15.217 ‐149 53.466 24.1 0:34 4 12 9:25 61 14.908 ‐149 53.744 − 3:09
25‐Aug‐09 1 28 11:31 61 15.315 ‐149 53.839 26.7 5:31 7:34 2 14 11:05 61 15.576 ‐149 53.409 12.8 5:11 3 12 11:39 61 15.214 ‐149 53.474 24.3 3:26 4 31 11:10 61 14.957 ‐149 53.705 21.6 5:15
28‐Aug‐09 1 31 13:45 61 15.321 ‐149 53.833 25.0 4:29 9:01 2 28 14:04 61 15.569 ‐149 53.413 11.5 8:14 3 14 14:08 61 15.218 ‐149 53.476 23.1 8:34 4 12 14:12 61 14.943 ‐149 53.702 21.0 8:07

Passive Acoustic Monitoring of Cook Inlet Beluga Whales
43
Date Mooring Channel Start Time (hh:mm)
Lat/degrees Decimals Long/degrees Decimals Depth (m)
Sonobuoy Sampling
Efforts (hh:mm)
Daily Sampling Effort (hh:mm)
1‐Sep‐09 1 31 10:39 61 15.281 ‐149 53.827 21.1 6:36 8:57 2 28 10:47 61 15.532 ‐149 53.416 11.0 3:11 3 14 10:43 61 15.213 ‐149 53.408 18.2 5:24 4 12 10:31 61 14.918 ‐149 53.719 16.4 7:22
4‐Sep‐09 1 14 8:46 61 15.274 ‐149 53.858 28.3 5:21 6:55 2 31 9:14 61 15.510 ‐149 53.479 23.8 6:06 3 28 9:08 61 15.174 ‐149 53.498 25.8 6:32 4 6 9:22 61 14.907 ‐149 53.751 22.5 5:52
8‐Sep‐09 1 20 10:13 61 15.315 ‐149 53.854 29.1 6:36 8:33 2 28 9:54 61 15.562 ‐149 53.417 13.9 3:41 3* 31 − − − − − − −
3◊ 4 10:34 61 15.204 ‐149 53.478 24.8 6:17
4* 31 − − − − − − −
4◊ 14 10:03 61 14.947 ‐149 53.714 22.3 8:26 10‐Sep‐
09 1 31
11:12 61 15.318 ‐149 53.852 27.4 5:25 7:38
2 20 10:51 61 15.572 ‐149 53.416 12.1 6:10 3 28 11:18 61 15.214 ‐149 53.485 22.9 6:22 4 14 11:04 61 14.951 ‐149 53.737 21.8 5:30
15‐Sep‐09
1 14 12:02
61 15.324 ‐149 53.830 22.3 3:04 9:41
2 31 12:05 61 15.553 ‐149 53.459 11.1 0:40 3 28 12:07 61 15.212 ‐149 53.481 15.0 5:08 4* 29 12:10 61 14.944 ‐149 53.741 13.4 −
4◊ 6 12:36 61 14.946 ‐149 53.736 14.2 8:26
Passive Acoustic Monitoring of Cook Inlet Beluga Whales
44
Date Mooring Channel Start Time (hh:mm)
Lat/degrees Decimals Long/degrees Decimals Depth (m)
Sonobuoy Sampling
Efforts (hh:mm)
Daily Sampling Effort (hh:mm)
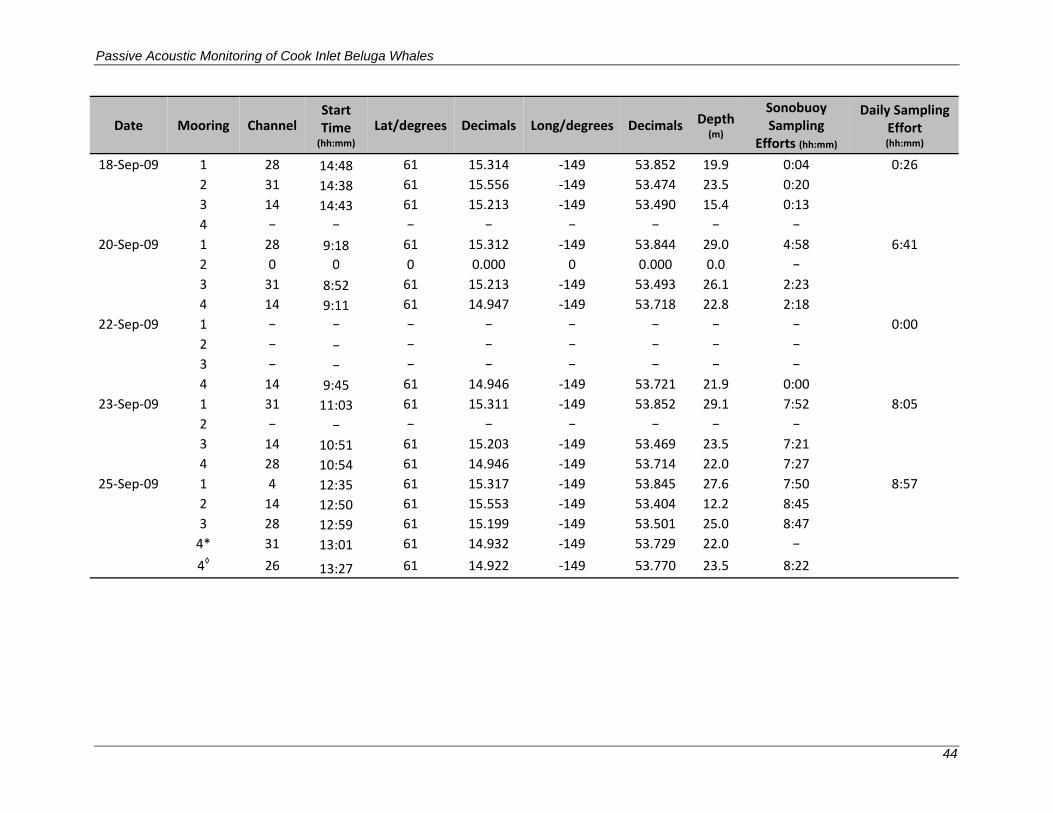
18‐Sep‐09 1 28 14:48 61 15.314 ‐149 53.852 19.9 0:04 0:26 2 31 14:38 61 15.556 ‐149 53.474 23.5 0:20 3 14 14:43 61 15.213 ‐149 53.490 15.4 0:13 4 − − − − − − − −
20‐Sep‐09 1 28 9:18 61 15.312 ‐149 53.844 29.0 4:58 6:41 2 0 0 0 0.000 0 0.000 0.0 − 3 31 8:52 61 15.213 ‐149 53.493 26.1 2:23 4 14 9:11 61 14.947 ‐149 53.718 22.8 2:18
22‐Sep‐09 1 − − − − − − − − 0:00 2 − − − − − − − − 3 − − − − − − − − 4 14 9:45 61 14.946 ‐149 53.721 21.9 0:00
23‐Sep‐09 1 31 11:03 61 15.311 ‐149 53.852 29.1 7:52 8:05 2 − − − − − − − − 3 14 10:51 61 15.203 ‐149 53.469 23.5 7:21 4 28 10:54 61 14.946 ‐149 53.714 22.0 7:27
25‐Sep‐09 1 4 12:35 61 15.317 ‐149 53.845 27.6 7:50 8:57 2 14 12:50 61 15.553 ‐149 53.404 12.2 8:45 3 28 12:59 61 15.199 ‐149 53.501 25.0 8:47 4* 31 13:01 61 14.932 ‐149 53.729 22.0 −
4◊ 26 13:27 61 14.922 ‐149 53.770 23.5 8:22

Passive Acoustic Monitoring of Cook Inlet Beluga Whales
45
Date Mooring Channel Start Time (hh:mm)
Lat/degrees Decimals Long/degrees Decimals Depth (m)
Sonobuoy Sampling
Efforts (hh:mm)
Daily Sampling Effort (hh:mm)
27‐Sep‐09 1 4 15:08 61 15.300 ‐149 53.862 28.4 4:50 9:10 2 26 15:31 61 15.545 ‐149 53.408 11.6 9:10 3 14 15:17 61 15.206 ‐149 53.479 22.9 8:20 4 28 15:21 61 14.942 ‐149 53.723 21.1 7:50
29‐Sep‐09 1 4 17:26 61 15.298 ‐149 53.841 27.1 1:39 9:10 2 5 17:29 61 15.555 ‐149 53.401 13.1 8:33 3 14 17:37 61 15.200 ‐149 53.471 23.2 8:54 4 28 17:41 61 14.944 ‐149 53.735 22.1 8:39
Total 148:26:00 * Failed ◊ Redeployed − No data

Passive Acoustic Monitoring of Cook Inlet Beluga Whales
46
APPENDIX B: Data Log Sheets

Passive Acoustic Monitoring of Cook Inlet Beluga Whales
47
Boat Data Sheet Date: Crew: Time on Water: Time Notified Sam Cunard (ICRC) Port Security Harry M
Recovery: M1: M2: M3: M4: Deployment:
M1 M2 M3 M4 Deployment Time Latitude Longitude Sonobuoy Channel Depth Added Weight GPS Point
Water Environmental: Temperature Salinity Turbidity
Time off Water: Time Notified Sam Cunard (ICRC) Port Security

Passive Acoustic Monitoring of Cook Inlet Beluga Whales
48
Cairn Point Data Sheet Date: Observer: Arrival Time: Time Generator Started:
M1 M2 M3 M4
Deployment Time Sonobuoy Channel Frequency Notes:
Time Comments Activities:
Activity Start End Species Channel Comments
Acronyms IPD = impact pile driving VPD = vibratory pile driving o.h. = overhead Time Left CP:

Passive Acoustic Monitoring of Cook Inlet Beluga Whales
49
Environmental Data Sheet Date:
Time Precipitation Sea State (Beaufort Scale) Wind Speed (km) Swell (m)

Passive Acoustic Monitoring of Cook Inlet Beluga Whales
50
APPENDIX C: Passive Acoustic Monitoring Plan for Cook Inlet Beluga Whales

Passive Acoustic Monitoring of Cook Inlet Beluga Whales
51
PPAASSSSIIVVEE AACCOOUUSSTTIICC MMOONNIITTOORRIINNGG PPLLAANN FFOORR CCOOOOKK IINNLLEETT BBEELLUUGGAA WWHHAALLEESS
PPOORRTT OOFF AANNCCHHOORRAAGGEE MMAARRIINNEE TTEERRMMIINNAALL
RREEDDEEVVEELLOOPPMMEENNTT PPRROOJJEECCTT
Prepared for
U.S. Department of Transportation Maritime Administration 400 Seventh Street, S.W. Washington, D.C. 20590
Port of Anchorage 200 Anchorage Port Road Anchorage, Alaska 99501
Integrated Concepts and Research Corporation
421 West First Avenue, Suite 200 Anchorage, Alaska 99501
Prepared by
Dr. Ana Širović and Lindsey Saxon Kendall
Department of Environmental Science Alaska Pacific University
4101 University Drive Anchorage, Alaska 99508
July 31, 2009

Passive Acoustic Monitoring of Cook Inlet Beluga Whales
52
This page intentionally left blank

Acoustic Monitoring Plan Port of Anchorage MTR Project 2009
Alaska Pacific University 53
Table of Contents Acronyms and Abbreviations ...................................................................................................... 54
1.0 Introduction ...................................................................................................................... 55
2.0 Objectives ........................................................................................................................ 56
3.0 Field Study Approach ....................................................................................................... 56
3.1 Passive Acoustic Monitoring with Sonobuoys ......................................................... 57
3.2 Array Setup and Testing .......................................................................................... 59
3.3 Environmental Conditions in the Study Area ........................................................... 59
3.4 Mooring Installation and Sonobuoy Placement ....................................................... 60
3.5 Sound Level Characterization ................................................................................. 61
3.6 Sampling Efforts ...................................................................................................... 62
4.0 Data Analysis Methods .................................................................................................... 62
5.0 Scheduling ....................................................................................................................... 64
6.0 References ....................................................................................................................... 66
APPENDIX 1: Data Log Sheet .................................................................................................... 67

Acoustic Monitoring Plan Port of Anchorage MTR Project 2009
Alaska Pacific University 54
Acronyms and Abbreviations APU Alaska Pacific University
EAFB Elmendorf Air Force Base GB gigabyte
GPS Global Positioning System
Hz hertz
ICRC Integrated Concepts and Research Corporation
IHA Incidental Harassment Authorization
kHz kilohertz
km kilometer
m meter
MMPA Marine Mammal Protection Act
MTR (Port of Anchorage) Marine Terminal Redevelopment (Project)
NMFS National Marine Fisheries Service
NOAA National Oceanic and Atmospheric Administration
PAM passive acoustic monitoring
POA Port of Anchorage Administration
Port Port of Anchorage Facility
TOAD time of arrival difference
USACE U.S. Army Corps of Engineers

Acoustic Monitoring Plan Port of Anchorage MTR Project 2009
Alaska Pacific University 55
1.0 INTRODUCTION The Port of Anchorage Marine Terminal Redevelopment (MTR) Project (Project) is designed to
upgrade and expand existing Port of Anchorage facilities (Port) by removing and replacing aging
and obsolete structures and providing additional dock and backland areas, without disruption of
maritime service during construction. The Project includes in-water construction activities that
have the potential to adversely impact marine mammals within the Knik Arm of Upper Cook Inlet
in Southcentral Alaska.
In compliance with Special Condition IV(1)(B)(b) of the U.S. Army Corps of Engineers (USACE)
404-10 Permit for the MTR Project and Stipulation 5(e)(2)(b) of the Incidental Harassment
Authorization (IHA) issued 15 July 2008 to the Port of Anchorage Administration (POA) and the
Department of Transportation, Maritime Administration, by the National Oceanic and
Atmospheric Administration, National Marine Fisheries Service (NOAA/NMFS), a passive
acoustic monitoring study of the Cook Inlet beluga whale (Delphinapterus leucas) will be
conducted during the 2009 MTR Project construction season. The purpose of the study, as
stated in the 404-10 Permit and the IHA, is to “detect and localize, to the maximum extent
practicable, passing whales and to determine the proportion of beluga whales missed from
visual surveys. This study shall characterize sound levels around the Port related to and in
absence of all construction activities.”
Under contract with Integrated Concepts and Research Corporation (ICRC), Alaska Pacific
University (APU) provides this Passive Acoustic Monitoring Plan for Cook Inlet Beluga Whales
to be implemented at the Port. This Plan sets forth the methodology that will be used for beluga
whale monitoring and data collection during passive acoustic monitoring. This Plan has been
developed in consultation with ICRC, in accordance with USACE and the NOAA/NMFS
guidance for compliance with the Marine Mammal Protection Act (MMPA).

Acoustic Monitoring Plan Port of Anchorage MTR Project 2009
Alaska Pacific University 56
2.0 OBJECTIVES As stated in Section 1.0, the purpose of the passive acoustic monitoring study is to detect and
localize beluga whales in the vicinity of the MTR Project footprint and characterize sound levels
both during construction activities and in the absence of construction activities. Another
objective of the study is to correlate visual and acoustic data to estimate the proportion of
whales missed by observation, i.e., visual marine mammal monitoring alone. Under the
supervision of Dr. Ana Širović, APU, Department of Environmental Science, the acoustic
monitoring team will collect the data necessary to answer the following questions:
1. How often are beluga whales missed during visual marine mammal monitoring?
2. What is the estimated proportion of beluga whales missed during visual monitoring?
3. What are the sound levels related to, and in the absence of, all construction activities in the
area around the Port?
3.0 FIELD STUDY APPROACH The study will be conducted from 1 August through 30 September 2009, in the waters of the
Knik Arm of Upper Cook Inlet adjacent to the Port. Four moored lines will be deployed in a
square formation at the beginning of the survey period, allowing quick re-deployment of multiple
sonobuoys, electronic devices capable of transmitting passive acoustic data, in the array during
implementation of the Plan. After each sonobuoy deployment, a member of the acoustic study
team will be at the Cairn Point Marine Mammal Monitoring Station (Cairn Point Station) on
Elmendorf Air Force Base (EAFB) to monitor and record signals received from the sonobuoys.
Sonobuoys will be deployed in the vicinity of Cairn Point (Figure 1). Four moored lines will be
deployed in a rhomboid formation (sides between approximately 400 and 700 meters [m]) at the
beginning of the survey period and removed at the end of the survey period. The locations of
the moorings were chosen based on the proximity to the Cairn Point station, favorable
bathymetric conditions, and relative safety from dredging and shipping operations. The time
period when the sonobuoys will be deployed corresponds to the period when beluga whales are
frequently sighted in the Port area (Funk et al. 2005). The days of acoustic data collection will
be chosen based on tides and weather conditions, which limit the ability to launch a boat and
deploy sonobuoys.

Acoustic Monitoring Plan Port of Anchorage MTR Project 2009
Alaska Pacific University 57
Figure 1. Approximate location of the tightly spaced array of four moored lines, placed between 400 and 700 m apart and approximately 600 m off Cairn Point. Sonobuoys will be attached to the moorings for each day of acoustic monitoring.
3.1 Passive Acoustic Monitoring with Sonobuoys Sonobuoys are expendable electronic devices that consist of a hydrophone, float, radio
transmitter, and salt-water battery (Figure 2). Omnidirectional sonobuoys (AN/SSQ-57B), with a
broadband frequency response from 10 up to 35,000 hertz (Hz), will be used for the study.
Signals received by the hydrophone are amplified and sent up a wire to the radio transmitter
that is housed in the surface float. The length of the wire between the surface float and the
hydrophone can be controlled and adjusted to meet research requirements. Sonobuoys

Acoustic Monitoring Plan Port of Anchorage MTR Project 2009
Alaska Pacific University 58
continuously transmit their radio signal to a remote observer2 for a maximum of 8 hours before
scuttling3.
Figure 2. Type AN/SSQ-57 Omnidirectional Sonobuoy. (Figure adapted from Horsley 1989). Two antennae will be mounted on the conex at the Cairn Point station4 to receive radio signals
from the sonobuoy. A set of custom electronics and software will be used to record and analyze
sonobuoy data. The antennae will transmit the received signals to software-controlled ICOM
scanner radio receivers, modified to provide improved reception of sonobuoy signal, and then to
a computer with a high-quality sound card that enables sampling at a high sample rate (96
kilohertz [kHz]). Data will be digitized using the software program Ishmael and saved on 500
gigabyte (GB) hard disks. In the case of a failed deployment, the observer at the Cairn Point
2 Sonobuoys are not capable of data recording or analysis. Instead, they transmit a signal that is recorded and analyzed remotely. 3 Sinking by making a hole in the surface float. 4 In addition to its proximity to the deployed sonobuoys, the Cairn Point Marine Mammal Observation station was chosen because the elevation of the station allows adequate reception of radio signals from the sonobuoys.

Acoustic Monitoring Plan Port of Anchorage MTR Project 2009
Alaska Pacific University 59
station will contact the deployment team by radio to notify them of a failure. The deployment
team will immediately recover the failed sonobuoy and deploy another one. The expected
failure rate, based on previous experiences with this type of sonobuoy, is less than 15 percent
(Širović et al. 2006).
Dr. Širović and her team will monitor and collect deployment, environmental, and preliminary
acoustic analysis data during the daily acoustic monitoring period. Data collected will include
the following: deployment date, time, latitude, longitude, and transmission channel for each
sonobuoy, as reported by the deployment team; beginning and end of acoustic observation
period; start and end time of vocalizations (if detected), the species detected, channel(s) with
vocalizations; environmental conditions; type of construction (e.g., pile driving with vibratory or
impact hammer); and duration of construction activity (Appendix 1). They will enter the data into
Microsoft Excel for Windows and/or SPSS v. 15.0 for Windows for storage and analysis.
Section 3.7 provides additional information on the collection of data on environmental conditions
and anthropogenic activities.
3.2 Array Setup and Testing During the week of 20 July, the acoustic monitoring team will conduct calibration and initial
testing of the system. A mooring line will be placed at the location of one of the permanent
moorings to test the equipment and make any necessary adjustments to protocols. Using a test
130 pound anchor attached to approximately 25 m line and a surface float, one sonobuoy will be
attached to the mooring and the signal from the sonobuoy will be recorded and monitored from
the deployment vessel. The location of the mooring will be recorded using a handheld Garmin
GPS 72 Personal Navigator and shipboard GPS.
3.3 Environmental Conditions in the Study Area Environmental conditions will be logged every hour during daily deployment and monitoring
efforts. These conditions include: wind speed, sea state (Beaufort scale), swell height, and
precipitation. Water temperature, salinity and turbidity will be documented at the time of
sonobuoy deployment. In addition, all anthropogenic activities within the study area will be
documented during daily monitoring efforts. Events will be categorized as: no activity, impact
hammer or vibratory hammer pile driving, dredging, in-water fill placement, and aircraft and
vessel activities. The duration of the activity will be recorded.

Acoustic Monitoring Plan Port of Anchorage MTR Project 2009
Alaska Pacific University 60
3.4 Mooring Installation and Sonobuoy Placement After the permanent moorings are installed, their location (latitude and longitude) will be
recorded using the handheld Garmin GPS. The team will deploy four anchors, each attached to
a line approximately 25 m long with a surface float. One sonobuoy will be attached to each float
at the beginning of each day of acoustic observations. Previously deployed sonobuoys will be
collected each time before the deployment of new sonobuoys, and moorings will be checked for
integrity prior to deployment of new sonobuoys. Once the sonobuoy is attached, the
hydrophone will be released to anchor depth, allowing the hydrophone to settle on the bottom;
this will reduce the flow noise created by currents and tidal fluctuation. The deployment location
will be recorded on each day of acoustic observations using the handheld GPS to verify the
location of the moorings.
Ambient noise is not expected to be problematic. Noise created by strumming5 from the line is
not expected because this noise becomes a problem only on a taut line. Since the hydrophone
will be resting on the bottom with a loose line, strumming should not affect the ability to collect
useful data. Furthermore, sonobuoy hydrophones are suspended by a thin, elastic wire that is
designed to minimize strumming under high flow conditions. Sonobuoys have been
successfully deployed and improved for acoustic data acquisition since the early 1940s. In
conditions similar to those of Cook Inlet, sonobuoys were deployed in the Bay of Fundy to
collect acoustic data on right whales (Laurinolli et al. 2003). If background noise or sediment
load prove to be problematic on the bottom, different hydrophone locations in the water column
can be attempted for maximum noise reduction. Likewise, since the frequency range of flow
noise is different from the frequency range of beluga vocalizations, masking6 of beluga sounds
by flow noise should not affect this study (Richardson et al. 1995).
The Coast Guard has been notified of the proposed acoustic monitoring program and will be
continuously updated throughout the duration of the project. The acoustic monitoring team will
notify the Coast Guard prior to the deployment of mooring lines and will report the GPS
coordinates of the deployed moorings. The acoustic monitoring team will also provide
5 Creation of sound by vibration. 6 Noise interfering with a sound of interest because both the noise and sound of interest have similar frequencies (Richardson et al. 1995).

Acoustic Monitoring Plan Port of Anchorage MTR Project 2009
Alaska Pacific University 61
coordinates of the moorings to ICRC for relay to the USACE and their dredging team.
Additionally, the acoustic monitoring team will notify all parties when the study is complete and
the moorings have been removed.
Members of the acoustic monitoring team will cooperate with POA and EAFB personnel and
undergo all necessary training to ensure compliance with POA and EAFB safety and security
policies. The location of the acoustic monitoring team at the Cairn Point Station may be
changed in consultation with ICRC and POA should this area become unavailable due to EAFB
operational or security needs.
3.5 Sound Level Characterization To estimate sound levels in a region, the characteristics of the sound sources in the area, as
well as transmission loss characteristics of the medium, must be understood7. APU will
estimate sound transmission loss coefficient for the Knik Arm off Cairn Point using recordings
collected from sonobuoys and complementary boat-based recordings. Observers will use a 27-
foot vessel provided by Alaska Divers Underwater Salvage to collect acoustic data using two
calibrated HTI-96-MIN hydrophones suspended from a cable at the bow and the stern of the
boat approximately at 2 m depth (Blackwell and Greene 2002). The hydrophones will be
suspended from the boat through PVC pipe to keep the hydrophones as vertical as possible in
the current and to reduce flow noise. Signals from each hydrophone will be recorded
continuously using an Edirol R-09 digital recorder at a sample rate of 48 kHz. Once the
hydrophones are placed in the water, the boat engines will be turned off to reduce the ambient
noise and allow the boat to drift with the current. Recordings will take place in approximately 3-
km transects during different tidal stages and construction activities (e.g., vibratory hammer pile
driving, impact hammer pile driving). GPS positions will be recorded continuously during
sampling to document the drift pattern. Sampling will take place on two occasions during the
study, for approximately 3 hours each. Transects will aid in determining the transmission loss
characteristics by documenting sound levels at a range of distances from the sound source.
7 Sound level from a source can be calculated as a sum of the received sound level at the receiver and the estimated transmission loss between the source and the receiver. Transmission loss (TL) is a function of the range between the source and the receiver, r, and can be expressed as TL = x * log(r), where x is the transmission loss coefficient.

Acoustic Monitoring Plan Port of Anchorage MTR Project 2009
Alaska Pacific University 62
3.6 Sampling Efforts Acoustic data will be collected for a total of 20 days (~120 hours) spread out throughout the
study. To ensure full 8-hour coverage of sonobuoy transmission during daily acoustic
monitoring periods, monitoring will be conducted at the Cairn Point station in two shifts, each of
approximately 4 hours duration. Recordings will be collected during periods with and without
construction activity.
The time of acoustic surveys will be coordinated, to the maximum extent practicable, with the
time of marine mammal observations by the Scientific Marine Mammal Monitoring Team, in an
effort to ensure concurrent visual and acoustic data collection. However, to ensure independent
sampling, the two groups will work independently and will not be aware of any beluga detections
by the other group. The two teams will be instructed not to communicate with each other, and
the member of the acoustic monitoring team will be wearing headphones and will be unable to
hear any conversations of the marine mammal monitoring team. Since only one member of the
acoustic monitoring team will be present during each monitoring session, the marine mammal
observers will not have an opportunity to overhear conversations from the acoustic study
station. To avoid biasing the observations of the marine mammal observers, the acoustic
monitoring team will not share their findings with the marine mammal observers during the
study.
4.0 DATA ANALYSIS METHODS
Data will be analyzed as it is collected and also during report preparation. All data will be
backed up on a hard disk each day. MatLab (MathWorks, Natick, MA) based sound analysis
software will be used for preliminary sound analysis, such as characterization of beluga sound
frequency and temporal characteristics. To optimize the data analysis process, automatic
detectors8 will be developed and fine-tuned throughout the study. Several automatic detection
methods for efficient detection of calls (e.g. spectrogram correlation, acoustic power level, or
neural network analysis) will be investigated, and the method with the lowest level of false
8Automatized methods will be used for acoustic data analyses to ensure consistency, reduce human error, and increase the ability to process large quantities of acoustic data (Au and Hasting 2008).

Acoustic Monitoring Plan Port of Anchorage MTR Project 2009
Alaska Pacific University 63
detections will be chosen for subsequent analysis. Automatic detection analysis will provide
information on the presence and timing of the beluga whale sounds.
The acoustically detected presence of beluga whales will be compared with the number of
beluga whale sightings recorded by the Scientific Marine Mammal observers stationed at the
Cairn Point station. Beluga whale sightings and beluga whale acoustic detections will be pooled
into 30-minute bins centered at the times of acoustic detections. Since beluga whales mostly
pass near the Port area, if visual and acoustic detections are more than 30 minutes apart, it will
be assumed that they represent different groups. These two time-series of detections will be
correlated and the estimate of the percent of time beluga whales are missed by visual
observations alone will be determined. Also, individual beluga whales will be localized to
estimate the minimum proportion of beluga whales missed by visual observations alone.
The location of vocalizing beluga whales will be determined using the time of arrival difference
(TOAD) method (Cato 1998). All beluga whale sounds <35 kHz that are recorded on all four
sonobuoys in the array will be identified. Accurate differences in the time of arrival of these
sounds to each instrument will be determined by cross-correlating9 the sounds between
different instruments. Programming code for automatic cross-correlation of the signals from
different instruments will be developed and applied to determine accurate time of arrival
differences between each instrument pair. Hyperbolic localization10 method will be used to
determine the location of vocalizing beluga whales. For easier comparison within the 30-min
time bin, the locations of beluga whales detected by the passive acoustic method will be entered
into ArcGIS (ESRI, Redlands, CA) and overlain with a grid showing the locations of the beluga
whale sightings recorded by the Scientific Marine Mammal Observers. The proportion of beluga
whales detected and localized by the passive acoustic method but not seen by the Scientific
Marine Mammal Observers will be estimated. This fine-scale localization and tracking of
vocalizing belugas will allow direct measurement of whales’ response to the MTR in-water
9 Cross-correlation is a measurement of the similarity of two wave-forms as a function of time lag between them. The difference in the time of arrival of the signal between two instruments is determined as the time when cross-correlation function has the maximum value, i.e. when the two signals are the most similar. 10 Determining the location of a sound source with an array of hydrophones by geometrically and mathematically calculating the location of a sound source using the properties of a hyperbola (Au and Hastings 2008).

Acoustic Monitoring Plan Port of Anchorage MTR Project 2009
Alaska Pacific University 64
construction activities (e.g. change in the amount or loudness of vocalizations; change in the
direction of movement; etc.).
APU will characterize sound levels within the study area relating to, and in the absence of, all in-
water construction activities within the MTR Project footprint. Ten-second recordings with and
without construction activities will be examined. Measurements derived from the recordings of
impact hammer pile driving will include three parameters: peak pressure, pulse duration, and
received level. The mean of each parameter will be calculated from 15 recordings. To calculate
sound pressure levels (SPL), propagation loss will be determined. Empirical data will be used
to estimate the propagation loss coefficient (Section 3.6). In order to obtain this estimate, a plot
of received levels versus estimated range will be made for all recordings of the sound of
interest. The propagation loss coefficient will be calculated as the slope of the best-fit line
through the sound received levels versus estimated range plot (Blackwell 2005; Širović et al.
2007). Additionally, sound propagation modeling will be used to theoretically verify the empirical
result. Also, the mean SPL from vibratory hammer pile driving and general construction
activities will be calculated from 15 recordings to better understand the SPL from construction
activities within the MTR Project footprint.
5.0 Scheduling
The schedule for the passive acoustic monitoring (PAM) study includes the development of this
study plan for approval, implementation of the plan, and completion of an analysis report. Upon
receipt of review comments, the draft plan will be revised and submitted to ICRC for final
approval. Exact date of submission will depend on the date when ICRC comments are received
by APU, but the Final Study Plan submission is planned on or before July 31, 2009. During the
week of July 20, 2009, APU will calibrate and test the equipment and make any necessary
adjustments to protocols. Field Implementation of the approved study plan will take place from
August 1 through September 30. Exact dates of acoustic monitoring during this period will
depend on environmental conditions, but will be coordinated to the maximum extent practicable
with the schedule of the marine mammal observation team of the Scientific Marine Mammal
Monitoring Program and with MTR Project construction activities. APU will submit the Draft
PAM Data Analysis Report (Report) to ICRC in accordance with the current contract
requirements on November 30, 2009. The Report will include the elements of the Final PAM
Study Plan, analysis, and conclusions. The Final PAM Study Plan, Final PAM Analysis Report,

Acoustic Monitoring Plan Port of Anchorage MTR Project 2009
Alaska Pacific University 65
and all relevant supporting information and data will be provided electronically on compact disc
(Plan and Report) and hard disk (data) in Microsoft Word, Microsoft Excel, Adobe, wav files,
and/or other formats as approved by ICRC.
Table 1. Proposed Schedule with Major Tasks
Date Task Week of 20 July Array Calibration and Field Testing 31 July Submit Final PAM Study Plan 1 August-30 September Field Implementation 30 November Submit Draft Analysis Report
Acoustic Monitoring Plan Port of Anchorage MTR Project 2009
Alaska Pacific University 66
6.0 References
Au WWL and Hastings MC. 2008. Principles of Marine Bioacoustics: Springer, New York, NY. Blackwell, S. B., and C. R. Greene, Jr. 2002. Acoustic Measurements in Cook Inlet, Alaska,
During August 2001. Greeneridge Report. 271-2. Report from Greeneridge Sciences, Inc. Santa Barbara, CA, for NMFS, Anchorage, AK.
Blackwell, S.B. 2005. Underwater measurements of pile-driving sounds during the Port
MacKenzie dock modifications, 13-16 August 2004. Report from Greeneridge Sciences, Inc. Goleta, CA, and LGL Alaska Research Associates, Anchorage, AK, in association with HDR Alaska, Inc., Anchorage, AK: Knik Arm Bridge and Toll Authority, Anchorage, AK, Alaska Department of Transportation and Public Facilities, Anchorage, AK, and Federal Highway Administration, Juneau, AK.
Cato, D.H. 1998. Simple methods of estimating source levels and locations of marine animal
sounds. Journal of the Acoustical Society of America 104: 1667-1678. Funk, D.W., T.M. Markowitz and R. R. Rodrigues (2005). Baseline studies of beluga whale
habitat use in Knik Arm, Upper Cook Inlet, Alaska, 2004-2005. Rep. from LGL Alaska Research Associates, Inc., Anchorage, AK, in association with HDR Alaska, Inc., Anchorage, AK, for the Knik Arm Bridge and Toll Authority, Anchorage, AK, Department of Transportation and Public Facilities, Anchorage, AK, and the Federal Highway Administration, Juneau, AK.
Horsley, L.E. 1989. Modification and deployment techniques for hand-deployed arctic long-life sonobuoys. IEEE Journal of Oceanic Engineering 14: 211-220.
Laurinolli, M.H., A.E. Hay, F. Desharnais, and C.T. Taggart. 2003 Localization of North Atlantic
right whale sounds in the Bay of Fundy using a sonobuoy array. Marine Mammal Science 19: 708-723.
Richardson, W.J., C.R. Greene Jr., C.I. Malme, and D.H. Thomson. 1995. Marine Mammals and
Noise: Academic Press, San Diego, CA. Širović, A., J.A. Hildebrand, and D. Thiele. 2006. Baleen whales in the Scotia Sea during
January and February 2003. Journal of Cetacean Research and Management 8: 161–171. Širović, A., J.A. Hildebrand, and S.M. Wiggins. 2007. Blue and fin whale call source levels and
propagation ranges in the Southern Ocean. Journal of the Acoustical Society of America 122: 1208–1215.

Acoustic Monitoring Plan Port of Anchorage MTR Project 2009
Alaska Pacific University 67
APPENDIX 1: Data Log Sheet POA PAM Study Deployment Date: Obs. Start Time: Obs. End Time:
Mooring 1 Mooring 2 Mooring 3 Mooring 4 Time Time Time Time Lat Lat Lat Lat Long Long Long Long Channel Channel Channel Channel
Activity Start time End time Channel Species Comment
Environmental
Time Wind Speed Precipitation
Sea State (Beaufort Scale)
Swell Height