Passenger Facility Charge vs. Airport Improvement Program...
30
To appear in Transportation Research Part E: Logistics and Transportation Review 1 Passenger Facility Charge vs. Airport Improvement Program Funds: A Dynamic Network DEA Analysis for U.S. Airport Financing Young-Tae Chang 1 , Hyosoo (Kevin) Park 1 , Bo Zou 2 , Nabin Kafle 2 , 1 Graduate School of Logistics, Inha University, Incheon, Korea 2 Department of Civil and Materials Engineering, University of Illinois at Chicago, Chicago, USA Abstract: Passenger Facility Charge (PFC) and the Airport Improvement Program (AIP) are two major sources to finance U.S. airports. This paper develops a novel dynamic network DEA framework to investigate the substitutability between PFC and AIP funds. We find that the studied U.S. airports can substitute PFC for 8-35% of the current AIP funds and contribute significantly to the proposed plan of the US congress to cut AIP funding. In addition, the amount of PFC-for-AIP funds substitution negatively correlates with the productive efficiency of airports. The findings send an important message for future policy reforms on U.S. airport financing. Keyword: Passenger Facility Charge (PFC), Airport Improvement Program (AIP), Substitution, Dynamic network DEA, Airport efficiency 1 Introduction Passenger Facility Charge (PFC) and the Airport Improvement Program (AIP) are two major sources for airport financing in the U.S. PFC is a service fee charged to departing and connecting passengers at an airport, collected by airlines and then forwarded to the airport. AIP is a U.S. federal grant program administered by the Federal Aviation Administration (FAA) to provide funds to airports. PFC funds a broad range of capacity enhancing projects, for both airside and landside at airports. PFC can also be used for making payment for airport debt services. The use of AIP funds is similar to PFC, but usually limited to the planning and construction of projects related to aircraft operations improvement, covering runways, taxiways, aprons, noise abatement, land purchase, etc. Commercial revenue producing facilities (such as those related to shop concessions) are not eligible for AIP funding (Kirk, 2010). Together, the two financing sources account for about 46% in total airport funds in the U.S. (Dillingham, 2007). PFC and AIP funds have a complementary relationship. This is because PFC and the formula part of AIP funds, which accounts for 70-76% in total AIP funds (Kirk, 2009), are levied and allocated based on passenger enplanement. Moreover, according to the FAA rule, AIP funds allocated to large and medium airports will be foregone by 50% or 75% if those airports charge PFC at $3.00 or $4.50 per enplanement (Kirk, 2009). The complementary relationship has brought to the arena of policy debate the issue of potential substitution between the two types of airport financing sources, especially given
Transcript of Passenger Facility Charge vs. Airport Improvement Program...

To appear in Transportation Research Part E: Logistics and Transportation Review
1
Passenger Facility Charge vs. Airport Improvement
Program Funds: A Dynamic Network DEA Analysis for
U.S. Airport Financing
Young-Tae Chang1, Hyosoo (Kevin) Park1, Bo Zou2, Nabin Kafle2,
1 Graduate School of Logistics, Inha University, Incheon, Korea
2 Department of Civil and Materials Engineering, University of Illinois at Chicago, Chicago, USA
Abstract: Passenger Facility Charge (PFC) and the Airport Improvement Program (AIP) are two major
sources to finance U.S. airports. This paper develops a novel dynamic network DEA framework to
investigate the substitutability between PFC and AIP funds. We find that the studied U.S. airports can
substitute PFC for 8-35% of the current AIP funds and contribute significantly to the proposed plan of
the US congress to cut AIP funding. In addition, the amount of PFC-for-AIP funds substitution
negatively correlates with the productive efficiency of airports. The findings send an important message
for future policy reforms on U.S. airport financing.
Keyword: Passenger Facility Charge (PFC), Airport Improvement Program (AIP), Substitution,
Dynamic network DEA, Airport efficiency
1 Introduction Passenger Facility Charge (PFC) and the Airport Improvement Program (AIP) are two major
sources for airport financing in the U.S. PFC is a service fee charged to departing and connecting
passengers at an airport, collected by airlines and then forwarded to the airport. AIP is a U.S. federal
grant program administered by the Federal Aviation Administration (FAA) to provide funds to airports.
PFC funds a broad range of capacity enhancing projects, for both airside and landside at airports. PFC
can also be used for making payment for airport debt services. The use of AIP funds is similar to PFC,
but usually limited to the planning and construction of projects related to aircraft operations
improvement, covering runways, taxiways, aprons, noise abatement, land purchase, etc. Commercial
revenue producing facilities (such as those related to shop concessions) are not eligible for AIP funding
(Kirk, 2010). Together, the two financing sources account for about 46% in total airport funds in the
U.S. (Dillingham, 2007).
PFC and AIP funds have a complementary relationship. This is because PFC and the formula part
of AIP funds, which accounts for 70-76% in total AIP funds (Kirk, 2009), are levied and allocated based
on passenger enplanement. Moreover, according to the FAA rule, AIP funds allocated to large and
medium airports will be foregone by 50% or 75% if those airports charge PFC at $3.00 or $4.50 per
enplanement (Kirk, 2009). The complementary relationship has brought to the arena of policy debate
the issue of potential substitution between the two types of airport financing sources, especially given

To appear in Transportation Research Part E: Logistics and Transportation Review
2
the pressure for the federal government to reduce outlay on AIP and the fact that the current PFC scheme
remains unchanged for many years. Indeed, AIP funds have experienced a decline in recent years (GAO,
2014; AMAC, 2014) and the $4.50 cap on the amount of PFC that airports can levy per enplanement
has not been increased since 2000, when the Congress passed the Wendell H. Ford Investment and
Reform Act for 21 Century (AIR-21).
There have been many advocates for lifting PFC by itself or in place of AIP funds. They come
down to mainly two arguments. The first argument relates to inflation: the Airport Council International
– North America (ACI-NA) believes that the $4.50 ceiling set back in 2000 should be raised to $7.00
(ACI-NA, 2015); Airports United, a national airport group, argues that PFC should be “modernized”
by raising it from $4.50 to $8.50 (Laing, 2015). The second argument for increasing PFC is that PFC
can reduce federal expenditures on AIP and thus help alleviate the possible funding shortage. In line
with this argument, the Congressional Research Services has considered partial defederalization as an
option for future airport financing, by allowing large and medium hub airports to opt out of the AIP
program in favor of unrestricted higher PFC (Kirk, 2009). Two additional evidences in support of the
second argument: the H.R. 608 FAA Reauthorization and Reform Act in 2011 proposed annual AIP
funding cut by $500 million from 2012 through 2014; in 2015 the White House’s budget proposal called
for elimination of AIP support for large hub airports in return for an $8.00 PFC (GAO, 2014).
Despite the advocates and arguments on potential reforms of airport financing policy – in particular
the substitution between PFC and AIP funds – there is almost no academic literature that investigates
the implications of PFC-for-AIP funds substitution for airport production efficiency. The only study we
are aware of is Zou et al. (2015), who use second-stage regression in a two-stage Data Envelopment
Analysis (DEA) approach and find positive and negative impacts of PFC and AIP funds on airport
production efficiency. The authors argue that the finding is consistent with the greater flexibility airports
have in utilizing PFC than AIP funds. However, the study does not provide answers to the question of
substitutability between PFC and AIP funds. In addition, the dynamic relationship between PFC and
AIP funds is not recognized: determination of AIP funds for an airport in the current year depends on
passenger enplanement in the previous year, which directly relate to the previous year’s PFC revenues.
The present paper intends to fill these gaps and contributes to the literature on airport efficiency
modeling and financing in six ways. First and foremost, we look into the substitutability of PFC for AIP
funds, by taking into explicit consideration the existing complementary relationship between these two
airport financing sources. Second, we specifically account for the inter-temporal dynamics of airport
passenger enplanement, PFC, and AIP funds allocation, i.e., the fact that passenger enplanement
determine both PFC revenue in the current year and AIP funds in the following year. Third, we specify
sub-structures while modeling the airport production process, which allows for more detailed
characterization of how airports use inputs to generate intermediate and final outputs. The three
contributions are integrated into a dynamic network Data Envelopment Analysis framework, which is
the first time in the airport efficiency literature. Fourth, the results from our modeling provide important
policy insights that support the growing arguments for PFC-for-AIP funds substitution in the US airport
sector. Fifth, using random effect Tobit regression, the relationship between the amount of substitutable
AIP funds and airport efficiency scores is estimated. Finally, while focusing on PFC-for-AIP funds
substitution, the methodological framework proposed in this study can be generalized to investigate
substitutability between any two complementary resources in transportation and non-transportation
production systems.

To appear in Transportation Research Part E: Logistics and Transportation Review
3
The paper continues with a review of existing literature on airport efficiency modeling in Section
2. The dynamic network structure, and subsequently three models on PFC-for-AIP funds substitution,
airport efficiency measurement, and the substitution-efficiency relation are presented in Section 3.
Section 4 presents the data, followed by modeling results and discussions in Section 5. Conclusions and
directions for future research are given in Section 6.
2 Literature review The field of airport efficiency modeling has an established body of literature. Two most popular
methods are DEA and stochastic frontier analysis (SFA). Gillen and Lall (1997) are among the earliest
researchers introducing DEA to measure airport efficiency and derive relevant performance indices.
Both airport terminal efficiency and movement efficiency are quantified. Sarkis (2000) uses a variety
of DEA models to find the effect of airport hub status, being in a snowbelt, and being part of a multi-
airport system on the operational efficiency of U.S. airports. Later Sarkis and Talluri (2004) apply
clustering analysis to DEA results to identify the benchmarking airports with similar resource utilization
structure. Different from DEA which draws frontiers using deterministic mathematical programming,
SFA incorporates random errors in deriving the airport production frontier line. Pels et al. (2003) use
SFA to estimate the efficiency and investigate the returns-to-scale properties for air transport
movements and passenger movements at 34 European airports. SFA is also employed by Oum et al.
(2008) to explore the relationship between airport ownership structure and airport efficiency, and by
Scotti et al. (2012) to assess the impact of airport competition on the technical efficiency of Italian
airports. All these studies consider airport production as an “all-in-one” process, i.e., inputs are
converted to outputs without dealing with what occurs inside the production process. On the other hand,
airport production can be described in more detail, for example, one can consider that airports first use
labor and capital to attract flight traffic, which then produces passenger enplanement and cargo
throughput.
The theoretical DEA literature has evolved recently into incorporating internal structures and inter-
temporal dynamics of production processes. DEA models with internal structures is frequently termed
“network DEA” and models with inter-temporal dynamics named “dynamic DEA”. Network DEA
models are first introduced by Färe and Grosskopf (2000), who enrich traditional all-in-one DEA
models by enabling the characterization of sequential or parallel processes in production. Liang et al.
(2006) develops a network DEA model to measure efficiency of firms in a supply chain. The model
considers the case that a supplier and a retailer are under coordination or in a leader-follower
relationship. The supplier’s improvement influences that of the retailer’s, and the way the influence
works depends on the relationship specified. Yu and Lin (2008) evaluate the performance of European
railways using a network DEA model. The model divides the railway operation into passenger, freight,
and consumption processes, and allocates common inputs (e.g., the number of employees and length of
line) to different operations. Tone and Tsutsui (2009) develop a network model using slacks-based
measures (SBM), which has the advantage of not requiring all inputs or outputs to be improved equi-
proportionally.
Dynamic DEA models consider how production of a firm in one period affects its production in
the next period while measuring efficiency. Nemoto and Goto (1999) first extend traditional DEA to a
dynamic framework by incorporating the adjustment cost of investment and inter-temporal substitution.
Färe et al. (2007) and Tone and Tsutsui (2010) propose dynamic SBM models to capture inter-period
“carryovers”. Applications of dynamic DEA abound, in fields such as electric utilities (Nemoto and

To appear in Transportation Research Part E: Logistics and Transportation Review
4
Goto, 2003), agriculture production (Jaenicke, 2000), and retail department stores (de Mateo et al.,
2006). Recently Lu et al. (2014) use dynamic SBM to evaluate life-insurance firms and recognize the
fact that firm debt and equity in one year will be transcended to the next year.
The DEA literature has further seen combining the network and dynamic aspects of firm
production into a single DEA framework. Färe and Grosskopf (2000) and Färe et al. (2007) lay the
stepping stones of the dynamic network DEA, with adapted definitions of production possibility sets
and efficiency measures. Bogetoft et al. (2009) develop a dynamic network DEA model to examine the
optimal investment path for U.S. manufacturers. The authors decompose total outputs of the chosen
U.S. manufacturers into final outputs (consumption), private investment, and public investment.
Production in one period generates final outputs and investment, which are used as inputs along with
capital stock for the next period. The model then finds the amount of investment that maximizes the
final outputs throughout the investigation periods. Dynamic network DEA has also been considered
lately in the context of SBM (Tone and Tsutsui, 2014). Interested readers may refer to Cook et al. (2010)
and Kao (2014) for detailed review on network and dynamic DEA models.
The literature reports several applications of network DEA to measuring airline performance. Zhu
(2011) uses a virtual price network DEA model to analyze the efficiency of 21 airlines in the world.
The production network comprises two sub-processes: first operational costs producing load factor and
fleet size, which then generate revenue and revenue passenger miles. Tavassoli et al. (2014) develops a
two-stage network SBM model with shared inputs to assess performance of 11 domestic airlines in Iran.
The first stage evaluates airline technical efficiency in relation to capacity building. The second stage
measures the service effectiveness, i.e., how efficiently a given capacity generates passenger and cargo
flows. Mallikarjun (2015) uses an unoriented network DEA model to measure the efficiency of U.S.
domestic airlines, with a three-stage production process: operation, service, and sales. The consideration
of the sales stage is particularly interesting because the ultimate goal of an airline is maximizing revenue
and all other airline network DEA papers confine their analysis up to the service stage. Li et al. (2015)
follow the network structure in Mallikarjun (2015) and develop a virtual frontier SBM model to assess
the performance of 22 international airlines. A hypothetical frontier is constructed to discriminate
efficiency scores among efficient airlines, by using maximum output and minimum input sets. We note
that none of the above studies consider inter-temporal features of the airline production, although this
naturally exists in airline businesses. For instance, airline debt can be carried over from one period to
another.
Network DEA has also been applied to the airport sector. Yu (2010) uses network SBM model to
assess the efficiency of domestic airports in Taiwan. In the paper airport operations are divided into
“production” and “service” stages. The service stage is further disaggregated into airside and landside
services. The author finds that service efficiency is far lower than production efficiency for Taiwanese
airports. Lozano et al. (2013) develops a directional distance function DEA model with a network
structure. Airport operations are divided into “aircraft movements” and “aircraft loading” stages. The
model incorporates the possibility that decreasing airport flight delay restricts the number of aircraft
movements, and shows that network DEA model has more discriminatory power than traditional, all-
in-one DEA model. A virtual price network DEA model is applied to Brazilian airports by Wanke
(2013). It delineates airport operations into two stages pertaining to “physical infrastructure” and “flight
consolidation”. Flight regularity, location, and international status are found to have positive impacts
on the efficiency of flight consolidation. Some of the major features of the above three airport DEA
studies are summarized in Table 1. We note that the network structures in Lozano et al. (2013) and

To appear in Transportation Research Part E: Logistics and Transportation Review
5
Wanke (2013) are largely consistent, with the first stage producing aircraft movements and the second
stage generating passenger enplanement and cargo throughput. Yu (2010) put aircraft movements as an
output in the second stage. The choice of inputs differs in the three studies, which may be because of
data availability. Again, it should be noted that none of these studies consider inter-temporal dynamics
in the airport production process.
Table 1. Application of network DEA in airport analysis
Yu (2010) Lozano et al. (2013) Wanke (2013)
Data Taiwanese airports Spanish airports Brazilian airports
First stage Production Aircraft movement Physical infrastructure
Second stage Service Aircraft loading Flight consolidation
Input Number of employees, runway
area, apron area, terminal area
Runway area, apron
capacity, number of
boarding gates,
number of baggage
belts, number of
check-in counters
Terminal area, aircraft
parking spaces, number of
runways
Intermediate
output between
stages
Runway capacity, terminal
capacity Aircraft movements
Number of aircraft landings
and take-offs
Output Aircraft movements, passenger
movements, cargo volume
Passenger movements,
cargo handled,
number of delayed
flights, accumulated
flight delay minutes
Number of passengers, cargo
throughput
For airport finance in the U.S., as mentioned before academic research to support and inform the
heated policy debate on whether and ways to reduce federal government aids is almost non-existent.
Specifically for the potential substitution of PFC for AIP funds and its implication for airport production
efficiency, we are only aware of Zou et al. (2015) as a relevant study. By developing a two-stage DEA
model, the authors find a positive linkage between airport production efficiency and PFC use, but a
negative linkage between airport production efficiency and the use of AIP funds. Although the study
investigates indirectly the potential change in airport efficiency under hypothetical PFC-for-AIP funds
substitution scenarios, it does not examine the substitutability between the two airport financing sources
conditional on production feasibilities. In addition, the study does not capture any inter-temporal
interactions nor considers the sub-structures of the airport production process.
3 Model This section presents the model formulation. We first specify in subsection 3.1 the dynamic
network structure of the airport production and the choice for production inputs/outputs. Then

To appear in Transportation Research Part E: Logistics and Transportation Review
6
subsections 3.2 and 3.3 present the mathematical models for PFC-for-AIP funds substitution and airport
efficiency measurement. The PFC-for-AIP funds substitution is from the FAA perspective, whereas
airport efficiency measurement is from the standpoint of individual airports. Building on these models,
subsection 3.4 further specifies a random effect Tobit regression model to estimate the relationship
between the amount of substitutable AIP funds and airport efficiency.
3.1 Dynamic network structure
The dynamic network structure of the DEA model considered in our study is shown in Figure 1.
In terms of the network feature, we divide airport production into two stages, termed “aircraft movement”
and “aircraft loading”, based on the previous airport efficiency studies using network DEA (Lozano et
al. (2013) and Wanke (2013), as in Table 1). For the dynamic feature, we explicitly consider the fact
that airport production in year t affects airport production in t+1, through passenger enplanement.
Figure 1. The dynamic network structure of the DEA model
The first stage in the dynamic network structure, “aircraft movement”, uses labor, materials and
capital (net assets) inputs to produce aircraft operations. In addition, the first-stage production generates
flight delay as an undesirable output. The second stage, “aircraft loading”, describes the process of how
aircraft movement produces passenger and cargo flows. At the second stage, promotion is further
considered as an external input, which is defined as the amount of money spent on marketing and
advertising to attract passenger and cargo demand. The two-stage network structure implies that airports
do not generate passengers and cargoes directly from using labor, materials, and capital inputs; rather,
aircraft movements mediate between use of these inputs and passenger/cargo flows.
In terms of inter-temporal dynamics, passenger enplanement in year t determines PFC in year t
and AIP funds in year t+1. Since PFC is levied on a per passenger basis, the number of passengers
enplaned in year t times the amount of PFC levied per passenger gives total PFC in year t. By contrast,

To appear in Transportation Research Part E: Logistics and Transportation Review
7
AIP funds are allocated by the FAA to airports in year t+1 based on the passenger enplanement in year
t. This is why we position “PFC determined” at the end of year t, and “AIP determined” at the beginning
of year t+1 in Figure 1. It should be noted that both AIP funds and PFC are included in capital (net
assets) in the FAA data reporting (see Section 4). Thus there is no need to consider AIP funds and PFC
separately as two additional inputs.
3.2 PFC-for-AIP funds substitution model
3.2.1 Defining production possibility set
The first step to specify the PFC-for-AIP funds substitution model is to define the production
possibility set (PPS), in which airports are assumed to be operable. Defining PPS is important because
airports should be ensured that the optimal PFC-for-AIP funds substitution path is attainable.
As mentioned above, the airport production process is decomposed into two stages. At stage k
(k=1,2) and in year t, an airport o uses a combination of inputs ( )t t t
k1o k2o kIox ,x ,...,xt
kox to produce
outputs ( ).t t t
k1o k2o kRoy , y ,..., yt
koy In particular, an intermediate output 1
t
oz , i.e., aircraft operations, is
produced from stage 1, which is used as an input for stage 2. Then PPS for the airport is the set of
vectors 1( , , )t
ozt t
ko kox y satisfying the following constraints:
1
1
1 2
1 1
(i) , , , ,
(ii) , , , ,
(iii) ,
nt t t
kj kij kio k
j
nt t t
kj krj kro k
j
n nt t t t
j j j j
j j
x x i I k t
y y r R k t
z = z t
(1)
where t
kj is a weight imposed on airport j = 1,…,n to construct the frontier space. n is the number of
airports in the dataset. kI and
kR represent the sets of inputs and outputs in stage k. For inequalities
(1)-i and (1)-ii, the left-hand side (LHS) corresponds to the sets of airports that lie on the production
frontier. The crucial difference between traditional all-in-one DEA models and the network DEA model
presented here is the role of intermediate outputs described in equality (1)-iii. The equation indicates
that the amount of intermediate outputs produced in stage 1 on the frontier should be equal to the amount
used as inputs in stage 2 on the frontier, although in general the intermediate output could be lost or
added from external sources (Tone and Tsutsui, 2009; 2014). In our study, the intermediate output from
stage 1 is aircraft operations, which are not possible to change once produced. Thus the equality
relationship (1)-iii is used. Note that (1)-iii does not require the intermediate outputs to be lower or
higher than the observed level. Tone and Tsutsui (2009; 2014) name this “free link.” If the intermediate
output is restricted to be equal to the observed amount, it will be “fixed link.” To specify the fixed link,
(1)-iii will be substituted by the following constraint:
1 2
1 1
, .n n
t t t t t
j j j j o
j j
z = z z t
(2)
where toz is the observed amount of the intermediate output at time t. As we do not want aircraft
operations to change by PFC-for-AIP funds substitution, the fixed link assumption is more appropriate

To appear in Transportation Research Part E: Logistics and Transportation Review
8
than the free link assumption. In other words, we replace constraint (1)-iii by constraint (2) in
characterizing the PPS for each airport.
3.2.2 Model formulation
The objective of the PFC-for-AIP funds substitution model is to find the maximum amount of AIP
funds that can be replaced by PFC at each airport, while guaranteeing that the airport production is
feasible. In this study, we view that the substitution is from the FAA perspective, and this substitution
departs from the existing complementary relationship between PFC and AIP funds stipulated by the
FAA formulas and rules. The mathematical expressions for the existing complementary relationship
between PFC and AIP funds are rather complex. Details about the relationship is provided in Appendix
A.
To be more specific about the departure from the existing complementary relationship between
PFC and AIP fund through substitution, we define receivable and desirable PFC (AIP funds).
Receivable PFC and AIP funds are PFC and AIP funds that an airport can collect under the current FAA
formulas and rules. In other words, they denote the amounts that we currently observe. Desirable PFC
and AIP funds are PFC and AIP funds when PFC-for-AIP funds substitution were in place. We use the
term “desirable” since we consider it to be the policy direction that the FAA wants to pursue. In sum,
we have:
(i) Desirable PFC = Receivable PFC + Substitutable amount
(ii) Desirable AIP funds = Receivable AIP funds − Substitutable amount (3)
Following the above discussions, we formulate the dynamic network model for PFC-for-AIP funds
substitution as the following linear program:

To appear in Transportation Research Part E: Logistics and Transportation Review
9
1 11 1
,
1 1
1
1
1 2
1 1
1
1
maximize
s.t.
(i) , 1, 2, , ,
(ii) , 1, 2, , ,
(iii) , ,
(iv) ,
T Tt t
pa o ao
t t
nt t t
kj kij kio k
j
nt t t
kj krj kro k
j
n nt t t t
j j j j
j j
nt t t
j j o
j
s s
x x k i I t
y y k r R t
z = z t
z z
1
2
1
1 1 1 1 1 1
2 2 ,
1 1
1 1
1 2
1
,
(v) 1, 1, 2, ,
(vi) , ,
(vii) , 1,..., 1,
(viii) (
nt
kj
j
nt t t
j j o
j
n nt t t t t t
j j o j j pa o
j j
nt t t
j j j j
j
t
k t
e e t
f e s t T
e
1
1 1
2 ,
0 1
1 1 1 1
1 2 ,
1
1
,
, ) ( ) ,
1, 2,...5, 1,..., 1,
(ix) 26 ( , ) , 1,..., 1,
0, 1,2, , ,
,
u un nt t t t t t
o d d n n j j pa o ao
d j
nt t t t t t t
j j j j o pa o ao
j
t
kj
t
pa o a
f c a a a e s s
n t T
e f s s t T
k j t
s s
1
2
0, 1,... 1,
where
0.5 Large, Medium hub airports and 3,
( , ) 0.25 Large, Medium hub airports and 3,
1 Non, Small hub airports.
t
o
t
o
t t t t
j j o o
t T
o f
e f o f
o
(4)
The objective of the linear program is to maximize a weighted sum of two terms: 1) the amount of
PFC-for-AIP funds substitution, 1
,
t
pa os , and 2) the amount of possible redundant AIP funds after the
substitution, 1t
aos . An arbitrary small number 1 distinguishes the priorities between the two
objectives. Note that 1
,
t
pa os and 1t
aos can only be calculated starting from the second year based on
passenger enplanement of the first year, as reflected in the summations.
Two additional points are worth noting for the objective function. First, the research question of
our interest is to measure the substitutability between PFC and AIP funds. Hence the first term of PFC-
for-AIP funds substitution is given a higher weight (i.e., one as opposed to a small number ). Second,
we include 1t
aos to ensure that the relationship between the amounts of receivable and desirable AIP
funds (i.e., Eq. (3)-ii) holds in linear program (4), in addition to finding redundant AIP funds, if there

To appear in Transportation Research Part E: Logistics and Transportation Review
10
is any. More details for keeping the second term in the objective function of (4) and how it leads to the
relationship (3)-ii are presented in Appendix A.
The linear program is subject to several constraints. Constraints (4)-i to (4)-vi regulate the
improvement path of inputs and outputs, as well as the intermediate output from stage 1. That is, these
constraints define the PPS of airport o, as in (1) and (2). More specifically, constraint (4)-i denotes that
the use of each input should be no less than the level on the frontier. Likewise, (4)-ii means that the
outputs should not be higher than the level on the frontier. Constraints (4)-iii and (4)-iv characterize the
“fixed link” relationship for the intermediate output which is already explained in subsection 3.1.
Constraint (4)-v permits variable returns-to-scale operation of airports. In constraint (4)-vi, we consider
that passenger enplanement with and without PFC-for-AIP funds substitution should be the same
(denoted by t
oe ). By holding passenger enplanement constant, we can more conveniently compare the
amount of AIP funds before and after PFC-for-AIP funds substitution. Constraint (4)-vii and (4)-viii
describe the use of PFC and AIP funds, which involve the amount of PFC-for-AIP funds substitution
and the possible amount of redundant AIP funds. In these two constraints, 1t
j is the observed PFC
at airport j in year t+1; 1t
j
the observed AIP funds at airport j in year t+1; 1t
of
the PFC per
passenger at airport o in year t+1. Further details about the two constraints can be found in Appendix
A. Simply speaking, constraint (4)-vii and (4)-viii can be viewed as the more elaborate expressions of
(3)-i and (3)-ii. Constraint (4)-ix reflects the cap set by the FAA on the amount of AIP funds an airport
can receive, equal to $26 million. Finally, all ’s are non-negative. So are the amount of PFC-for-AIP
funds substitution and possible redundant AIP funds.
3.3 Efficiency measurement model
While the FAA is keen to understand the maximum possible amount of PFC-for-AIP funds
substitution, individual airports are interested in their own productive efficiency. In addition, it is of
policy relevance to understand the relationship between the substitutable amount of PFC for AIP funds
and the productive efficiency of airports. To this end, measuring airport productive efficiency, which is
the focus of this subsection, is necessary.
We consider an input-oriented network SBM model, whose specification is first proposed by Tone
and Tsutsui (2010; 2014), for measuring airport efficiency. Compared to other DEA models, SBM
models have the advantage of not requiring all inputs or outputs to be improved equi-proportionally.
Moreover, SBM models have relatively high discriminatory power. Under an SBM model specification,
the efficiency of an airport is obtained from solving the following linear program:

To appear in Transportation Research Part E: Logistics and Transportation Review
11
2
1 1 1
1
1
1 2
1 1
Minimize 1
s.t.
(i) , 1, 2, , ,
(ii) , 1, 2, , ,
(iii) , ,
(iv)
km t k tTkio
tt k i k kio
nt t t- t
kj kij kio kio k
j
nt t t
kj krj kro k
j
n nt t t t
j j j j
j j
w w s
m x
x + s x k i I t
y y k r R t
z = z t
1
1
1
2
1
1 1 1 1 1 1
2 2 ,
1 1
, ,
(v) 1, 1, 2, ,
(vi) , ,
(vii) , 1,..., 1,
(viii)
nt t t
j j o
j
nt
kj
j
nt t t
j j o
j
n nt t t t t t
j j o j j pa o
j j
z z t
k t
e e t
f e s t T
11 1 1 1
1 2 2 ,
1 0 1
1 1 1 1
1 2 ,
1
( , ) ( ) ,
1, 2,...5, 1,..., 1,
(ix) 26 ( , ) , 1,..., 1,
0, 1
u un nnt t t t t t t t t
j j j j o d d n n j j pa o ao
j d j
nt t t t t t t
j j j j o pa o ao
j
t
kj
e f c a a a e s s
n t T
e f s s t T
k
2
, 2, , ,
0, 1, 2, , ,
where
0.5 Large, Medium hub airports and 3,
( , ) 0.25 Large, Medium hub airports and 3,
1 Non, Small hub air
t -
kio k
t
o
t t t t
j j o o
j t
s k i I t
o f
e f o f
o
ports.
(5)
where km is a parameter denoting the number of inputs in stage k,
t
kios slack of input type i in stage
k, i.e., the amount of redundant input. The input slacks in the objective are weighted by and k tw w ,
which are the weights imposed on stage k and time t. We assign equal weights to each stage and time
period: wk = 0.5 (k = 1, 2) and wt = 0.2 (t = 1,…,5). All other notations follow the ones in (4). Only
inputs are considered in the objective because increasing passenger or cargo flows is assumed beyond
the managerial discretion of airports (Zou et al., 2015). The model has a similar structure to (4) except
that constraint (4)-i is replaced with (5)-i. Indeed, linear program (5) maintains the same dynamic
network structure as linear program (4), though the objective is different.

To appear in Transportation Research Part E: Logistics and Transportation Review
12
After running linear program (5) for an airport, airport efficiency scores that are stage-time-specific,
stage-specific, time-specific, and the overall average can be calculated as follows:1
*
1
*
1 1
*
1 1
1 : efficiency of stage at time ,
1 : average efficiency of stage over periods,
1 : average efficiency at time
k
k
k
m tt kiok t
i k kio
m t tTkio
k tt i k kio
m k tKt kio
tk i k kio
sk t
m x
w sk
m x
w st
m x
*2
1 1 1
.
1 : overall efficiency.km t k tT
kio
tt k i k kio
w w s
m x
(6)
where the asterisks denote the optimal solution from solving linear program (5).
3.4 Substitution-efficiency relation model
After the amount of PFC-for-AIP funds substitution and airport efficiency are obtained, a random
effect Tobit regression model is used to examine the statistical relationship between the substitutable
amount and airport efficiency. The choice of a random effect Tobit model is based on the following
features of the data. First, we consider the substitutable amount as the dependent variable, for which
negative values are not possible and many zero values may exist from solving linear program (4). In
this case, Tobit regression is more appropriate than conventional regression models, the latter of which
do not account for data censoring. Second, the data consist of information for 41 airports over 5 years.
There may be characteristics inherent to an airport but not reflected in the explanatory variables included
in the model. By incorporating random effect, we can account for such airport-specific effect and avoid
underspecifying the model. Third, airports considered in our study are only a small portion of the entire
U.S. airports (due to data availability), and considerable variations in airport size exist in the dataset.
This is a typical condition that a random effect model specification is more effective than other
specifications (Greene, 2012).
Following the above discussion, the random effect Tobit regression model is specified as follows:
0 1 , + ,it it n n it i it
n
Substitution Efficiency X u (7)
where subscripts i and t are airport and year indicators. 0 1, , n are the parameters to be estimated;
,n itX the independent variables other than the efficiency score; iu the airport-specific effect; and it
the error term. Similar to Zou et al. (2015), ,n itX includes runway utilization factors, airport hub type,
and year dummies. Runway utilization factors include passengers per runway, cargo tonnage per
runway, and flight delay per runway. For the Efficiencyit variable, we experiment with both average and
stage-specific efficiencies for an airport in a year, i.e., t and
t
k (k = 1, 2) in (6).
1 For brevity, the airport index o is omitted on the LHS.

To appear in Transportation Research Part E: Logistics and Transportation Review
13
We conjecture that the amount of PFC-for-AIP funds substitution is negatively correlated with
airport efficiency. This is because more efficient airports may already use their resources – including
PFC and AIP funds – efficiently, thus leaving less room for substitution than less efficient airports. It
should be noted that we treat airport efficiency as an explanatory variable, which is different from
existing studies in which airport efficiency scores are considered as the dependent variable in post-DEA
second-stage regression analysis, e.g., Gillen and Lall (1997), Adler and Liebert (2014). Those studies
intend to identify the determinants for airport efficiency, whereas this study seeks the impact on the
amount of PFC-for-AIP funds substitution of airport efficiency.
4 Data Yearly data of 41 U.S. airports during 2009-2013 are collected for this study. They represent the
full list of airports for which complete information on inputs and outputs is available. The airports are
listed in Table 4. For inputs, information on the physical use of labor and materials is not available. We
instead use the costs associated with input consumptions. Labor cost includes personnel compensation
and benefits provided to airport employees. Materials cost refers to costs to communication, supply and
material, contractual service, insurance and other operating expenses. We characterize capital input (net
assets) as the property values of the airports net of debts. Inputs data are collected from the FAA Form
5100-127 (FAA, 2012). As already mentioned in subsection 3.1, capital input in Form 5100-127
includes AIP funds and PFC revenue received by an airport. For outputs, passenger enplanement and
cargo tonnage are also directly obtainable from FAA Form 5100-127.
In addition to labor, materials, and capital, we consider flight delay as an undesirable output in the
aircraft movement stage, and promotion as an external input in the aircraft loading stage. For flight
delay, we used the inverse of total flight delay at the airport under study in a year. The flight delay
information is compiled using the Airline On-Time Performance Database in the U.S. Bureau of
Transportation Statistics (BTS, 2013). We convert all monetary values to constant dollars in 2009 using
Consumer Price Index (United States Department of Labor, 2014). While promotion information is
available in FAA Form 5100-127, as shown in Table 2 some airports did not have promotion
expenditure. When this occurs, we adopt the approach in Tone (2001) by removing the promotion term
in linear programs (5) and (6). This way, the airport will have no input slacks for promotion and thus
no associated input inefficiency.
Note that FAA Form 5100-127 provides precise records of PFC but not of AIP funds. The best
proxy we can use for AIP funds is the “grant” item in Form 5100-127, which includes AIP funds and
state/local aids. According to Kirk (2009, 2010), state/local aid accounts for 14% in the reported grants.
As a further check, we manually review the Comprehensive Annual Financial Report (CAFR) of some
airports included in our study, and find that state/local aids hold an even smaller percentage in the
“grants” item. For example, the share of state/local aids in grants is about 2% for Columbus Regional
Airport and Chicago O’Hare International Airport. In view of this, we consider the reported grants as a
reasonably good approximation for AIP funds.
Table 2. Summary statistics of variables
Variable Min. Med. Mean. Max.
Delay (mins) 7,571 260,700 554,700 4,907,000
Cargo (tons) 43,170,000 369,100,000 812,000,000 6,995,000,000
Enplanement 96,491 3,266,309 6,859,602 33,297,578
To appear in Transportation Research Part E: Logistics and Transportation Review
14
Labor cost ($) 1,479,607 24,117,710 39,709,059 339,551,360
Material cost ($) 742,146 25,144,824 57,898,615 341,442,496
Net asset ($) 4,753,000 337,500,000 555,600,000 3,755,000,000
Promotion ($) 0 482,744 856,309 10,140,734
Aircraft operation
(flights) 17,801 159,697 241,826 3,614,710
PFC ($) 62,145 10,862,739 25,672,257 124,762,198
AIP fund ($) 27,362 8,430,216 14,305,416 201,038,977
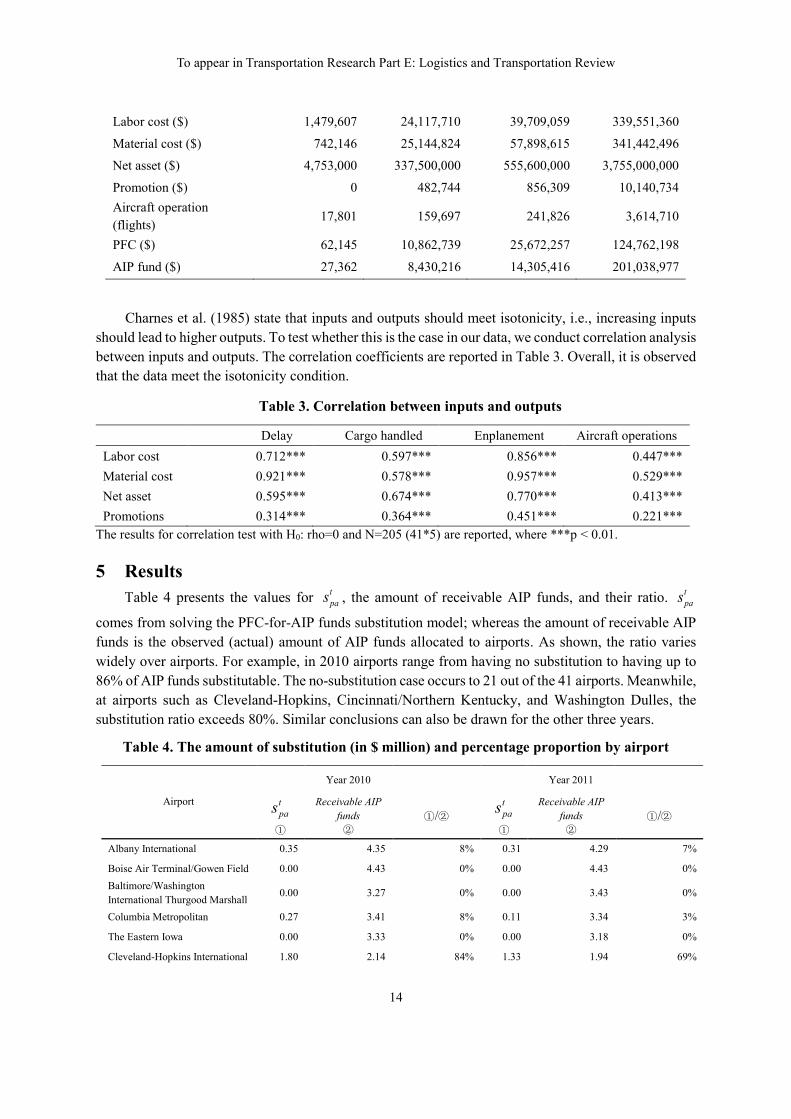
Charnes et al. (1985) state that inputs and outputs should meet isotonicity, i.e., increasing inputs
should lead to higher outputs. To test whether this is the case in our data, we conduct correlation analysis
between inputs and outputs. The correlation coefficients are reported in Table 3. Overall, it is observed
that the data meet the isotonicity condition.
Table 3. Correlation between inputs and outputs
Delay Cargo handled Enplanement Aircraft operations
Labor cost 0.712*** 0.597*** 0.856*** 0.447***
Material cost 0.921*** 0.578*** 0.957*** 0.529***
Net asset 0.595*** 0.674*** 0.770*** 0.413***
Promotions 0.314*** 0.364*** 0.451*** 0.221***
The results for correlation test with H0: rho=0 and N=205 (41*5) are reported, where ***p < 0.01.
5 Results
Table 4 presents the values for t
pas , the amount of receivable AIP funds, and their ratio. t
pas
comes from solving the PFC-for-AIP funds substitution model; whereas the amount of receivable AIP
funds is the observed (actual) amount of AIP funds allocated to airports. As shown, the ratio varies
widely over airports. For example, in 2010 airports range from having no substitution to having up to
86% of AIP funds substitutable. The no-substitution case occurs to 21 out of the 41 airports. Meanwhile,
at airports such as Cleveland-Hopkins, Cincinnati/Northern Kentucky, and Washington Dulles, the
substitution ratio exceeds 80%. Similar conclusions can also be drawn for the other three years.
Table 4. The amount of substitution (in $ million) and percentage proportion by airport
Airport
Year 2010 Year 2011
t
pas
①
Receivable AIP
funds
②
①/②
t
pas
①
Receivable AIP
funds
②
①/②
Albany International 0.35 4.35 8% 0.31 4.29 7%
Boise Air Terminal/Gowen Field 0.00 4.43 0% 0.00 4.43 0%
Baltimore/Washington
International Thurgood Marshall 0.00 3.27 0% 0.00 3.43 0%
Columbia Metropolitan 0.27 3.41 8% 0.11 3.34 3%
The Eastern Iowa 0.00 3.33 0% 0.00 3.18 0%
Cleveland-Hopkins International 1.80 2.14 84% 1.33 1.94 69%

To appear in Transportation Research Part E: Logistics and Transportation Review
15
City of Colorado Springs
Municipal 1.30 3.94 33% 0.97 3.87 25%
Cincinnati/Northern Kentucky
International 1.66 2.08 80% 1.48 1.75 84%
James M Cox Dayton
International 0.00 4.28 0% 0.00 4.29 0%
Denver International 0.00 6.50 0% 0.00 6.50 0%
Des Moines International 0.98 3.89 25% 0.03 3.89 1%
Detroit Metropolitan Wayne
County 3.44 4.74 72% 3.08 4.73 65%
Fresno Yosemite International 0.88 3.50 25% 0.27 3.51 8%
Bishop International 0.32 3.33 10% 0.00 3.37 0%
Fort Wayne International 0.00 2.16 0% 0.00 2.22 0%
Spokane International 0.03 4.56 1% 0.29 4.62 6%
Grand Forks International 0.00 1.26 0% 0.00 1.39 0%
Honolulu International 0.00 2.98 0% 0.00 3.04 0%
Washington Dulles International 3.14 3.64 86% 3.20 3.68 87%
Wichita Mid-Continent 2.73 3.70 74% 0.25 3.73 7%
Indianapolis International 0.00 1.69 0% 0.00 1.70 0%
Jackson-Medgar Wiley Evers
International 0.00 3.56 0% 0.00 3.53 0%
Jacksonville International 0.00 1.47 0% 0.00 1.45 0%
McCarran International 0.00 5.94 0% 0.00 5.76 0%
Los Angeles International 0.00 6.50 0% 0.00 6.50 0%
Long Beach /Daugherty Field/ 0.03 4.50 1% 0.00 4.49 0%
Orlando International 0.00 4.96 0% 0.00 5.04 0%
Harrisburg International 0.58 3.54 16% 0.16 3.60 5%
General Mitchell International 0.00 7.02 0% 0.00 7.96 0%
Will Rogers World 2.32 4.76 49% 0.27 4.72 6%
Chicago O'Hare International 0.00 6.50 0% 0.00 6.50 0%
Philadelphia International 0.00 4.60 0% 0.00 4.56 0%
Phoenix Sky Harbor
International 0.00 5.48 0% 0.00 5.53 0%
Pittsburgh International 1.23 7.05 18% 0.46 7.13 6%
Southwest Florida International 0.69 6.77 10% 0.25 6.75 4%
Shreveport Regional 0.00 2.12 0% 0.00 2.11 0%
Norman Y. Mineta San Jose
International 1.26 7.43 17% 0.00 7.14 0%
Salt Lake City International 0.00 3.26 0% 0.00 3.33 0%
Sacramento International 0.00 1.91 0% 0.01 1.87 1%
Tampa International 1.39 2.90 48% 1.18 2.84 41%
Tucson International 0.13 4.87 3% 0.00 4.89 0%

To appear in Transportation Research Part E: Logistics and Transportation Review
16
Table 4. Continued
Airport
Year 2012 Year 2013
t
pas
①
Receivable AIP
funds
②
①/②
t
pas
①
Receivable AIP
funds
②
①/②
Albany International 0.50 4.27 12% 3.84 4.27 90%
Boise Air Terminal/Gowen
Field 0.00 4.42 0% 0.00 4.36 0%
Baltimore/Washington
International Thurgood
Marshall
0.00 3.57 0% 0.00 3.59 0%
Columbia Metropolitan 0.40 3.34 12% 0.69 3.38 20%
The Eastern Iowa 0.00 3.09 0% 0.00 3.21 0%
Cleveland-Hopkins
International 1.64 1.91 86% 1.56 1.88 83%
City of Colorado Springs
Municipal 0.00 3.79 0% 2.86 3.80 75%
Cincinnati/Northern Kentucky
International 1.42 1.64 86% 1.28 1.52 85%
James M Cox Dayton
International 1.00 4.30 23% 4.09 4.33 94%
Denver International 0.00 6.50 0% 0.00 6.50 0%
Des Moines International 0.00 3.94 0% 0.00 4.03 0%
Detroit Metropolitan Wayne
County 2.27 4.81 47% 3.96 4.80 83%
Fresno Yosemite International 0.76 3.52 22% 2.18 3.57 61%
Bishop International 0.07 3.24 2% 0.33 2.92 11%
Fort Wayne International 0.00 2.23 0% 0.00 2.26 0%
Spokane International 2.19 4.56 48% 4.09 4.53 90%
Grand Forks International 0.00 1.40 0% 0.00 1.50 0%
Honolulu International 0.00 3.05 0% 0.00 3.07 0%
Washington Dulles
International 3.09 3.64 85% 3.02 3.55 85%
Wichita Mid-Continent 3.11 3.72 84% 2.52 3.73 67%
Indianapolis International 0.00 1.70 0% 0.00 1.68 0%
Jackson-Medgar Wiley Evers
International 0.23 3.53 7% 1.68 3.53 48%
Jacksonville International 0.00 1.45 0% 0.00 1.42 0%
McCarran International 0.00 5.82 0% 0.00 6.00 0%
Los Angeles International 0.00 6.50 0% 0.00 6.50 0%
Long Beach /Daugherty Field/ 0.92 4.56 20% 3.01 4.67 64%
Orlando International 0.00 5.21 0% 0.00 5.19 0%
Harrisburg International 0.56 3.58 16% 1.57 3.59 44%
General Mitchell International 0.00 7.79 0% 0.00 6.81 0%
Will Rogers World 2.84 4.78 59% 3.82 4.85 79%
Chicago O'Hare International 0.00 6.50 0% 0.00 6.50 0%
Philadelphia International 0.00 4.66 0% 0.93 4.59 20%
Phoenix Sky Harbor
International 0.00 5.68 0% 0.00 5.83 0%

To appear in Transportation Research Part E: Logistics and Transportation Review
17
Pittsburgh International 5.79 7.19 81% 6.41 7.05 91%
Southwest Florida International 1.36 6.91 20% 3.93 6.71 59%
Shreveport Regional 0.00 2.24 0% 0.00 2.29 0%
Norman Y. Mineta San Jose
International 0.00 7.22 0% 6.46 7.15 90%
Salt Lake City International 0.00 3.36 0% 0.00 3.29 0%
Sacramento International 1.03 1.85 56% 1.08 1.85 59%
Tampa International 2.56 2.86 90% 2.59 2.87 90%
Tucson International 0.00 4.87 0% 0.00 4.86 0%
The aggregate results for t
pas , the amount of receivable AIP funds, and their ratio across all 41
airports and by year are presented in Table 5. The amount of receivable AIP funds highly depends on
total passenger enplanement in a year, as is clearly shown in the second column of Table 5 and from
the FAA AIP funds allocation formulas and rules (see Appendix A). Overall, the amount of receivable
AIP funds steadily increases with passenger enplanement over time, except for 2013. In contrast, greater
fluctuations are observed in t
pas , which sharply increases in 2012 after dipping to the lowest in 2011.
t
pas reaches its maximum of $58 million in 2013, more than double that in 2010. The ratio between t
pas
and the amount of receivable AIP funds also varies significantly, with the highest at 35% in 2013 and
the lowest at 8% in 2011.
Given these results on PFC-for-AIP funds substitution, we are interested in how these substitution
numbers are compared to the $500 million AIP funding cut plan between 2012 and 2014, as proposed
by the H.R. 608 FAA Reauthorization and Reform Act (see Section 1). The results here suggest that the
PFC-for-AIP funds substitution in 2012 and 2013 would save AIP funds by $93 million ($35 million +
$58 million), and this is based on 41 airports. If the analysis were extended to cover all U.S. airports,
the PFC-for-AIP funds substitution would contribute more significantly to the $500 million AIP funding
cut plan.
Table 5. Total amounts of substitution (in million units)
Year Enplanement
t
pas
①
Receivable AIP funds
②
①/②
2010 277.46 24.54 168.32 15%
2011 279.44 13.85 168.61 8%
2012 283.32 35.08 169.21 21%
2013 282.61 58.06 168.03 35%
Table 6 lists the total amounts of PFC-for-AIP funds substitution by airport type, for each year and
over four years. Four airport types are considered: non-hubs, small hubs, medium hubs, and large hubs.
We observe zero substitution possibility for non-hub airports, which may be ascribed to the fact that

To appear in Transportation Research Part E: Logistics and Transportation Review
18
non-hub airports have small passenger bases and most of them do not collect PFC as much as the other
airport types. Thus these airports have limited PFC revenue, and AIP funds plays a very important
financing role. Small hub airports present the largest potential for PFC-for-AIP funds substitution in
terms of the overall absolute amounts. However, this may be attributed to a larger portion of small hubs
in the data set (16 out of the 41 airports are small hubs). Medium hubs have the largest
t
pas Receivable AIP funds ratio. More than half of the receivable AIP funds (over $20 million) for
medium hubs could be substituted in 2013, and the four-year average is nearly one third (28%). For
large hubs, the substitution potential is less significant, on average presenting 14% of their total amount
of receivable AIP funds.
One reason for the different potentials of PFC-for-AIP funds substitution among airport types is
their relative distance from the production frontier (i.e., efficiency). As already mentioned, our
conjecture is that inefficient airports can substitute more PFC for AIP funds than more efficient airports.
Because more efficient airports use resources (including PFC and AIP funds) closer to the production
frontier, the substitution possibility is more limited and cost of doing so would be higher than less
efficient airports. This conjecture indeed can find its argument in other efficiency modeling studies. For
example, Lee et al. (2002) measure the shadow price of noxious gas emissions in terms of the amount
of foregone output, i.e., how much output should be foregone to reduce the emission. The authors
conclude that shadow price for less efficient firms is lower than for more efficient firms as efficient
firms have little flexibility in reallocating resources. On the contrary, inefficient airports can reallocate
resources to a greater extent to further improve production efficiency.
Table 6. Total amounts of substitution by hub type (in million dollars)
Hub type
t
pas
①
Receivable AIP
funds
②
①/② Average efficiency
Year 2010
N 0 5.55 0% 1.000
S 9.93 63.94 16% 0.362
M 6.65 37.56 18% 0.160
L 7.96 61.28 13% 0.385
Year 2011
N 0 5.72 0% 1.000
S 2.67 63.77 4% 0.445
M 3.54 37.69 9% 0.281
L 7.45 61.43 12% 0.325
Year 2012
N 0 5.87 0% 1.000
S 12.58 63.52 20% 0.487
M 11.24 37.66 30% 0.254
L 7.92 62.17 13% 0.457
Year 2013
N 0 6.05 0% 1.000
S 30.68 63.64 48% 0.417
M 20.72 36.06 57% 0.158
L 10.51 62.28 17% 0.463

To appear in Transportation Research Part E: Logistics and Transportation Review
19
Total
N 0 23.19 0% 1.000
S 55.86 254.87 22% 0.881
M 42.15 148.97 28% 0.850
L 33.84 247.16 14% 0.931
Note: N (n=3): non hub, board more than 10,000 but less than 0.05% of total system-wide enplanement; S
(n=16) = small hub, board 0.05% but less than 0.25%; M (n=9) = medium hub, board 0.25% but less than 1%; L
(n=13) = large hub, board 1% or more. Sample sizes are in parentheses.
One way to confirm our conjecture is to check the airport efficiency scores and the amounts of
PFC-for-AIP funds substitution by airport type. We find that, in general, the more inefficient an airport
is, the more it can substitute PFC for AIP funds, as shown in Table 6. The most inefficient hub airport
type is medium hubs, of which an airport on average can substitute PFC of $4.7 million for AIP funds
over the four-year period. In the case of small and large hubs, their amounts of PFC-for-AIP funds
substitution over the four-year period are $3.5 and $2.6 million per airport respectively. Non hub
airports have zero PFC-for-AIP funds substitutability because they are efficient. Detailed airport
efficiency scores by stage and year are presented in Appendix B.
To further investigate the effects of airport efficiency on the PFC-for-AIP funds substitutability,
we estimate three random effect Tobit regression models. The three models differ in the efficiency
variable included. Model 1 uses the average airport efficiency of the two production stages (aircraft
movement and aircraft loading), while Models 2 and 3 uses the stage-specific airport efficiency. The
estimation results are reported in Table 7.
Table 7. Tobit regression results
Variables Model 1 Model 2 Model 3
Time-specific efficiency -6.588***
(1.139)
Time-stage-1 specific
efficiency
-3.446***
(1.222)
Time-stage-2 specific
efficiency
-3.492***
(0.68)
Runway utilization factors:
a. Passengers per runway -4.30e-07
(5.01e-07)
-5.87e-07
(5.47e-07)
-3.31e-07
(5.50e-07)
b. Cargo tonnage per runway -2.21e-09
(1.71e-09)
-3.62e-09**
(1.60e-09)
-3.00e-09
(2.13e-09)
c. Flight delay per runway 7.30e-07
(5.56e-06)
-9.48e-07
(5.88e-06)
-1.99e-06
(5.54e-06)
Large hub 5.6
(300.997)
10.289
(407.949)
9.366
(390.59)
Midium hub 5.701
(300.995)
10.276
(407.947)
9.837
(390.588)
Small hub 6.268
(300.993)
10.076
(407.945)
9.082
(390.587)

To appear in Transportation Research Part E: Logistics and Transportation Review
20
Year 2011 -0.125
(0.325)
-0.704**
(0.346)
-0.068
(0.329)
Year 2012 1.002***
(0.349)
0.302
(0.351)
0.922***
(0.348)
Year 2013 1.895***
(0.307)
1.584***
(0.328)
1.900***
(0.304)
Constant -3.576
(300.993)
-7.535
(407.946)
-7.841
(390.587)
Sigma u 1.394 1.591 1.677
Sigma e 0.997 1.12 0.989
Pseudo-R2 0.267 0.221 0.238
Rho 0.662 0.668 0.742
Observations 164 164 164
Cluster robust standard errors in parentheses.
***p < 0.01, **p < 0.05, *p < 0.10.
The results suggest that all efficiency types have significant impacts on the PFC-for-AIP funds
substitutability. The sign of all efficiency variables is negative in all three models, which supports our
conjecture that less efficient airports have greater potential for PFC-for-AIP funds substitution. In
contrast, more efficient airports already use the resources efficiently, leaving less room for the
substitution. This finding implies that the potential substitution of PFC for AIP funds would mostly
occur to the less efficient airports. For the more efficient airports, the substitution would be smaller and
consequently their productive efficiency would be less affected. Overall, Model 1 has a higher pseudo-
R2 than the other two models; thus considering efficiency from both production stages is preferred to
accounting for efficiency from only one stage.
Besides the efficiency variables, the estimation results suggest that the runway utilization factors
and hub sizes have almost no effects on the PFC-for-AIP funds substitution, except for cargo tonnage
per runway in Model 2. A possible explanation for this is that the efficiency scores already entail
information on runway utilization and hub size. For example, Zou et al. (2015) find that efficiency
scores will be greater at airports with higher runway utilization rate and larger size. Lastly, it is
interesting to note that more recent years have greater potential for PFC-for-AIP funds substitution than
earlier years.
6 Conclusion This paper investigates the possibility of substituting PFC for AIP funds as a viable option to
reform airport financing in the U.S. By extending Zou et al. (2015), which provides empirical evidence
on why AIP funds should be replaced by PFC, this study investigates whether and how much
substitution would be feasible for an airport and assesses the relationship of the substitution with airport
production efficiency. A model framework based on a dynamic network DEA structure with policy-
consistent financing constraints is developed. The model reflects more realistically airport production
in two aspects: 1) decomposing airport production into the aircraft movement and aircraft loading stages;
2) incorporating inter-temporal dynamics for airport financing. Using the model, the amount of
desirable PFC-for-AIP funds substitution are computed for 41 airports in the U.S. In addition, the

To appear in Transportation Research Part E: Logistics and Transportation Review
21
productive efficiencies of these airports are estimated by employing a network SBM model. The results
of the PFC-for-AIP funds substitution model and the efficiency measurement model are further used in
a random effect Tobit model, to test the relationship between the amount of PFC-for-AIP funds
substitution and airport productive efficiency.
Three major findings can be summarized as follows: first, the PFC-for-AIP funds substitution is
viable. The studied U.S. airports can substitute PFC for 8-35% of the current AIP funds, which amounts
to about $14-58 million annually. If extending to the entire U.S. airport system, this could contribute
significantly to the three-year $500 million AIP funding cut plan proposed by the U.S. Congress. Second,
it is not possible for non-hub airports to substitute PFC for AIP funds, probably because these airports
have smaller passenger bases and collect less PFC than other airports, thus relying heavily on AIP funds
for airport financing. By contrast, small and medium hubs are major targets for the PFC-for-AIP funds
substitution. Third, inefficient airports can substitute more PFC for AIP funds than efficient airports, as
the inefficient airports have more room to readjust their resource utilization.
We suggest a few directions for extending the present investigation. First, AIP funds in our study
are approximated by total grants reported in the FAA database. If data become available, more accurate
information on AIP funds can be used to reduce potential bias arising from the approximation. Second,
one could explore alternative network structures and input/output variable choice. Third, the potential
increase in PFC may discourage air passenger travel demand. It would be interesting to examine the
associated welfare loss and compare it with the AIP funds savings as a result of the substitution.
Acknowledgement We would like to thank Danielle Rinsler from the U.S. Federal Aviation Administration for
insightful initial discussions which motivated the conduct of this research.
References
1. Adler, N., Liebert, V. 2014. Joint impact of competition, ownership form and economic regulation
on airport performance and pricing. Transportation Research Part A: Policy and Practice, 64, 92-
109.
2. Airport Council International – North America (ACI-NA), 2015. Passenger Facility Charges.
[Online] Available at: http://www.aci-na.org/static/entransit/Passenger%20Facility%20Charges%
20Fact%20Sheet.pdf (accessed 23.07.15.).
3. Airport Minority Advisory Council (AMAC), 2014. White House releases FY15 budget proposal
includes potential negative impacts for airport DBE and ACDBE programs. [Online] Available at:
http://www.amac-org.com/docs/legislativenews/AMAC_Update_White_House%20_Releases_
FY15_%20Budget_Proposal.pdf (accessed 23.07.15.).
4. Bogetoft, P., Färe, R., Grosskopf, S., Hayes, K., Taylor, L., 2009. Dynamic network DEA: an
illustration. Journal of the Operations Research Society of Japan 52(2), 147-162.
5. Bureau of Transportation Statistics (BTS), 2013. BTS [Online] Available at:
http://www.transtats.bts.gov/OT_Delay/OT_Delay Cause1.asp?pn=1 (accessed 17.09.14.).

To appear in Transportation Research Part E: Logistics and Transportation Review
22
6. Charnes, A., Cooper, W. W., Rhodes, E., 1978. Measuring the efficiency of decision making
units. European journal of operational research 2(6), 429-444.
7. Charnes, A., Cooper, W.W., Golany, B., Seiford, L., Stutz, J., 1985. Foundations of data
envelopment analysis for Pareto-Koopmans efficient empirical production functions. Journal of
Econometrics 30 (1), 91-107.
8. Cook, W.D., Liang, L., Zhu, J., 2010. Measuring performance of two-stage network structures by
DEA: a review and future perspective. Omega 38(6), 423-430.
9. de Mateo, F., Coelli, T., O’Donnell, C., 2006. Optimal paths and costs of adjustment in dynamic
DEA models: with application to Chilean department stores. Annals of Operations Research 145
(1), 211-227.
10. Dillingham, G. L., 2007. Preliminary Analysis Indicates Proposed Changes in the Airport
Improvement Program May Not Resolve Funding Needs for Smaller Airports, s.l.: United States
Government Accountability Office.
11. Färe, R., Grosskopf, S., Whittaker, G., 2007. Network dea. In: Anonymous Modeling Data
Irregularities and Structural Complexities in Data Envelopment AnalysisSpringer, pp. 209-240.
12. Färe, R., Grosskopf, S., 2000. Network DEA. Socio-economic planning sciences 34(1), 35-49.
13. Federal Aviation Administration (FAA), 2012b. [Online] Available at:
http://cats.airports.faa.gov/FINALADVISORYCIRCULAR.pdf (accessed 08.12.14.).
14. Government Accountability Office (GAO), 2014. Raising passenger facility charges would increase
airport funding, but other effects less certain. [Online] Available at: http://gao.gov/products/GAO-
15-107 (accessed 23.07.15.).
15. Gillen, D., Lall, A., 1997. Developing measures of airport productivity and performance: an
application of data envelopment analysis. Transportation Research Part E: Logistics and
Transportation Review 33(4), 261-273.
16. Greene, W.H., 2012. Econometric Analysis, seventh ed. Prentice Hall, Upper Saddle River, New
Jersey.
17. Jaenicke, E., 2000. Testing for intermediate outputs in dynamic DEA models: accounting for soil
capital in rotational crop production and productivity measures. Journal of Productivity Analysis
14 (3), 247-266.
18. Kao, C., 2014. Network data envelopment analysis: A review. European Journal of Operational
Research 239(1), 1-16.
19. Kirk, R. S., 2009. Airport Improvement Program (AIP): Reauthorization Issues for Congress.
Report prepared for the memebers and committees of the Congress.
20. Kirk, R. S., 2010. Airport Improvement Program (AIP): Reauthorization Issues for Congress.
Report prepared for the memebers and committees of the Congress.Laing, K., 2015. Airports want
to double passenger fees. The Hill. [Online] Available at:
http://thehill.com/policy/transportation/235361-airports-want-higher-passenger-fees (accessed
23.07.15.).
21. Lee, J., Park, J., Kim, T., 2002. Estimation of the shadow prices of pollutants with
production/environment inefficiency taken into account: a nonparametric directional distance
function approach. Journal of environmental management 64(4), 365-375.
22. Li, Y., Wang, Y., Cui, Q., 2015. Evaluating airline efficiency: An application of Virtual Frontier
Network SBM. Transportation Research Part E: Logistics and Transportation Review 81, 1-17.
23. Liang, L., Yang, F., Cook, W.D., Zhu, J., 2006. DEA models for supply chain efficiency evaluation.
Annals of Operations Research 145(1), 35-49.

To appear in Transportation Research Part E: Logistics and Transportation Review
23
24. Los Angeles Times, 2015. Obama's proposed hike in airline fee sparks debate. [Online] Available
at: http://www.latimes.com/business/la-fi-airline-fee-increase-20150203-story.html (accessed
23.07.15.).
25. Lozano, S., Gutiérrez, E., Moreno, P., 2013. Network DEA approach to airports performance
assessment considering undesirable outputs. Applied Mathematical Modelling 37(4), 1665-1676.
26. Lu, W., Wang, W., Kweh, Q.L., 2014. Intellectual capital and performance in the Chinese life
insurance industry. Omega 42(1), 65-74.
27. Mallikarjun, S., 2015. Efficiency of US airlines: A strategic operating model. Journal of Air
Transport Management 43(0), 46-56.
28. Nemoto, J., Goto, M., 1999. Dynamic data envelopment analysis: modeling intertemporal behavior
of a firm in the presence of productive inefficiencies. Economic Letters 64, 51-56.
29. Nemoto, J., Goto, M., 2003. Measurement of dynamic efficiency in production: an application of
Data Envelopment Analysis to Japanese electric utilities. Journal of Productivity Analysis 19 (2-3),
191-210.
30. Oum, T.H., Yan, J., Yu, C., 2008. Ownership forms matter for airport efficiency: A stochastic
frontier investigation of worldwide airports. Journal of Urban Economics 64(2), 422-435.
31. Pels, E., Nijkamp, P., Rietveld, P., 2003. Inefficiencies and scale economies of European airport
operations. Transportation Research Part E: Logistics and Transportation Review 39 (5), 341-361.
32. Sarkis, J., 2000. An analysis of the operational efficiency of major airports in the United States.
Journal of Operations Management 18(3), 335-351.
33. Sarkis, J., Talluri, S., 2004. Performance based clustering for benchmarking of US airports.
Transportation Research Part A: Policy and Practice 38(5), 329-346.
34. Scotti, D., Malighetti, P., Martini, G., Volta, N., 2012. The impact of airport competition on
technical efficiency: A stochastic frontier analysis applied to Italian airport. Journal of Air
Transport Management 22, 9-15.
35. Tavassoli, M., Faramarzi, G.R., Farzipoor Saen, R., 2014. Efficiency and effectiveness in airline
performance using a SBM-NDEA model in the presence of shared input. Journal of Air Transport
Management 34, 146-153.
36. Tone, K., 2001. A slacks-based measure of efficiency in data envelopment analysis. European
Journal of Operational Research 130(3), 498-509.
37. Tone, K., Tsutsui, M., 2014. Dynamic DEA with network structure: A slacks-based measure
approach. Omega 42(1), 124-131.
38. Tone, K., Tsutsui, M., 2010. Dynamic DEA: A slacks-based measure approach. Omega 38(3), 145-
156.
39. Tone, K., Tsutsui, M., 2009. Network DEA: a slacks-based measure approach. European Journal
of Operational Research 197(1), 243-252.
40. United States Department of Labor. (2014, Jul.). Consumer Price Index. Bureau of Labor
Statistics. [Online] Available at: http://www.bls.gov/cpi/cpid1407.pdf (accessed 23.10.14.).
41. Wanke, P.F., 2013. Physical infrastructure and flight consolidation efficiency drivers in Brazilian
airports: A two-stage network-DEA approach. Journal of Air Transport Management 31, 1-5.
42. Yu, M., 2010. Assessment of airport performance using the SBM-NDEA model. Omega 38(6),
440-452.
43. Yu, M., Lin, E.T., 2008. Efficiency and effectiveness in railway performance using a multi-activity
network DEA model. Omega 36(6), 1005-1017.

To appear in Transportation Research Part E: Logistics and Transportation Review
24
44. Zhu, Joe., 2011. Airlines performance via two-stage network DEA approach. Journal of
CENTRUM Cathedra: The Business and Economics Research Journal 4(2), 260-269.
45. Zou, B., Kafle, N., Chang, Y. T., and Park, K., 2015. US airport financial reform and its implications
for airport efficiency: An exploratory investigation. Journal of Air Transport Management, 47, 66-
78.
Appendix A: The complementary relationship between PFC and AIP funds
and the mathematical expression for (3) In this appendix, we derive the mathematical expressions for (3) that entail the complementary
relationship between PFC and AIP funds. The amount of desirable PFC for an airport would equal the
amount of receivable PFC given passenger enplanement plus the substitutable amount. Likewise, the
amount of receivable AIP funds under the current appropriation formulas and rules minus the
substitutable amount would be the amount of desirable AIP funds. Feasible substitution also requires
the amounts of desirable PFC and AIP funds in the PPS. Note that although constraints (1)-i, (1)-ii, and
(2) define the PPS for inputs, outputs, and intermediate outputs, they do not explicitly specify the
amounts of desirable and receivable PFC and AIP funds. To specify them, here we consider the
following equations:
1 1 1 1 1 1
,
1 1
1 1 1 1 1
,
1
(i) , 1,..., 1,
(ii) ( , ) , 1,..., 1,
n nt t t t t t
j j o j j pa o
j j
nt t t t t t t
j j j j pa o ao
j
f e s t T
AIP e s s t T
(A1)
where t
j , t
j , and t
je denote the actual level of PFC, AIP funds, and passenger enplanement at
airport j in year t. t
j is a weight imposed on airport j at time t.2
Eq. (A1)-i describes the possibility of PFC-for-AIP funds substitution based on the amounts of
desirable and receivable PFC. On the LHS, 1 1
1
nt t
j j
j
denotes the amount of desirable PFC that
airport o would collect given the maximum substitution between PFC and AIP funds. On the right-hand
side (RHS), parameter 1t
of indicates the actual PFC level that airport o collects from each passenger
enplanement in year t+1. 1 1
1
nt t
j j
j
e
is the passenger enplanement that airport o would achieve if the
airport were run as a most efficient one (i.e., on the production frontier). Thus 1 1 1
1
nt t t
o j j
j
f e
gives
the amount of receivable PFC that airport o would collect given the actual PFC level and passenger
2 As the discussions in the Appendix do not involve stages, t
j does not have a stage subscript. However, the
stage subscript is added in the full model (4).

To appear in Transportation Research Part E: Logistics and Transportation Review
25
enplanement on the frontier. The difference between 1 1
1
nt t
j j
j
and 1 1 1
1
nt t t
o j j
j
f e
, ,
t
pa os , is
then the amount of PFC that airport o would use to substitute for AIP funds in year t+1.
Eq. (A1)-ii describes the possibility of PFC-for-AIP funds substitution based on the amounts of
desirable and receivable AIP funds. The FAA AIP funds allocated to an airport typically comprise a
part that is based on formulas and rules (termed “formula funds”) and a discretionary part (termed
“discretionary funds”) (Kirk, 2009). In the present study, we only consider formula AIP funds, for the
following reasons. First, discretionary AIP funds account for a relatively small portion (24-30%) in total
AIP funds (Kirk, 2009). More importantly, by its name discretionary AIP funds cannot be determined
using formulas. In contrast, formula AIP funds can be exactly quantified based on passenger
enplanement. Focusing on formula AIP funds will allow us to accurately capture the relationship
between passenger enplanement from the previous time period and consequent formula AIP funds
received in the current time period. In the remainder of the paper, the term “AIP funds” denotes formula
AIP funds.
On the RHS of Eq. (A1)-ii, 1( , )t t t
j jAIP e is the amount of receivable AIP funds for airport o
at time t+1 given passenger enplanement level 1
nt t
j j
j
e
. The exact functional forms for
1( , )t t t
j jAIP e depend on the FAA formulas and rules, which are specified below. On the LHS,
similar to Eq. (A1)-i, 1 1
1
nt t
j j
j
represents the amount of desirable formula AIP funds given the
maximum substitution between PFC and AIP funds. The difference between 1( , )t t t
j jAIP e and
1 1
1
nt t
j j
j
consists of two parts: 1) the amount that is substitutable by PFC, 1
,
t
pa os ; and 2) the
amount of possible redundant AIP funds after the PFC-for-AIP funds substitution, 1t
aos .
We now specify the exact functional forms for 1( , )t t t
j jAIP e based on the FAA formulas and
rules, which consist of three parts. First, the FAA stipulates that the amount of formula AIP funds for
an airport relates to passenger enplanement as follows (Kirk, 2009):
$ 7.80 per passenger for the first 50,000 passengers
$ 5.20 per passenger for the next 50,000 passengers
$ 2.60 per passenger for the next 400,000 passengers
$ 0.65 per passenger for the next 500,000 passengers
$ 0.50 per passenger for the excess of 1 million passengers
Second, the FAA sets the rule that large- and medium-sized airports forego a portion of their
formula AIP funds calculated by the above formulas. Specifically, if an airport charges non-zero PFC
equal to or less than $3/enplanement, then the airport foregoes its formula AIP funds by an amount
equal to 50% of its projected PFC revenue up to foregoing 50% of its formula AIP funds. The percentage
foregone increases to 75% if PFC is at the level of $4.5/enplanement. Empirical evidence suggests that

To appear in Transportation Research Part E: Logistics and Transportation Review
26
the caps of 50% and 75% of an airport’s formula AIP funds foregone are always active for large and
medium hub airports which charge PFC (Zou et al., 2015).
Third, the formula AIP funds for an airport cannot exceed $26 million.
As a consequence of the FAA formulas and rules, the amount of receivable formula AIP funds of
an airport can be expressed as a piecewise linear function of the airport’s enplanement. To this end, we
form a vector c = (c1, c2, c3, c4), where c1=50,000; c2=50,000, c3=400,000, and c4=500,000. We further
let vector a = (a1, a2, a3, a4, a5) = (7.80, 5.20, 2.60, 0.65, 0.50) denote the average AIP funds per
enplanement in the respective enplanement intervals 1[0, ]c ,
2
1
1
( , ]i
i
c c
, 2 3
1 1
( , ]i i
i i
c c
,
3 4
1 1
( , ]i i
i i
c c
, and 4
1
( , ).i
i
c
The amount of receivable AIP funds for airport o, given passenger
enplanement at the production frontier at time t+1, i.e., 1( , )t t t
j jAIP e, must satisfy the following
constraints:
1
1
1 1
1
1 1 2 1
1 1
2
3
1 1 1
(i) ( , ) ( , ),
(ii) ( , ) + ( ) ( , ),
(iii) ( , ) (
n nt t t t t t t t
j j o j j j j
j j
n nt t t t t t t t
j j o j j j j
j j
n nt t t t t
j j o i i j j
j i j
e f a e AIP e
e f a c a e c AIP e
e f a c a e
2
1
1
3 31
4
1 1 1 1
4 4
5
1 1 1 1
) ( , ),
(iv) ( , ) ( ) ( , ),
(v) ( , ) ( )
t t t
i j j
i
n nt t t t t t t t
j j o i i j j i j j
j i j i
n nt t t t t t
j j o i i j j i
j i j i
c AIP e
e f a c a e c AIP e
e f a c a e c AIP
1
1
1
( , ),
(vi) ( , ) 26 ( , ),
t t
j j
nt t t t t t
j j o j j
j
e
e f AIP e
(A2)
where parameter 1
( , )n
t t t
j j o
j
e f
denotes the portion of formula AIP funds airport o would actually
receive in year t+1, which as mentioned before is based on passenger enplanement and the PFC level
in year t. For the four airport types considered in our dataset (i.e., large hubs, medium hubs, small hubs,
and non-hubs. See Section 5), only large and medium hub airports charge PFC. As a result,
1
( , )n
t t t
j j o
j
e f
can be expressed as follows:
1
0.5 for Large, Medium hub airports and 3,
( , ) 0.25 for Large, Medium hub airports and 3,
1 for Non, Small hub airports.
t
on
t t t t
j j o o
j
f
e f f

To appear in Transportation Research Part E: Logistics and Transportation Review
27
The LHS in inequalities (A2)-i to (A2)-v denote the amount of receivable formula AIP funds as
passenger enplanement 1
( )n
t t
j j
j
e
fall into the following intervals respectively: 1[0, ]c ,
2
1
1
( , ]i
i
c c
,
2 3
1 1
( , ]i i
i i
c c
, 3 4
1 1
( , ]i i
i i
c c
, and 4
1
( , ).i
i
c
The smallest LHS value among inequalities (A2)-i to
(A2)-v occurs to the constraint whose passenger enplanement interval contains 1
nt t
j j
j
e
. To illustrate
this, let us consider the case that passenger enplanement 1
nt t
j j
j
e
fall in the interval 2
1
1
( , ]i
i
c c
.
Then, we can verify that:
2 1 1
1 1
2
3 2
1 1 1
(the LHS of Eq. (A2)-ii) (the LHS of Eq. (A2)-i) = ( , )( )( ) 0 ,
(the LHS of Eq. (A2)-ii) (the LHS of Eq. (A2)-iii) = ( , )( )( )
n nt t t t t
j j o j j
j j
n nt t t t t
j j o i j j
j i j
e f a a e c
e f a a c e
2
4 2 3 4 3
1 1 1
5 2
1
0,
(the LHS of Eq. (A2)-ii) (the LHS of Eq. (A2)-iv) = ( , ){( )( ) ( )} 0,
(the LHS of Eq. (A2)-ii) (the LHS of Eq. (A2)-v) = ( , ){( )
n nt t t t t
j j o i j j
j i j
nt t t
j j o
j
e f a a c e c a a
e f a a
2
3 5 3 4 5 4
1 1
( ) ( ) ( )} 0.n
t t
i j j
i j
c e c a a c a a
.
Thus the LHS of inequality (A2)-ii, which corresponds to the amount of receivable AIP funds
given the passenger enplanement, is the lowest among all LHS in inequalities (A2)-i to (A2)-v.
We further introduce0 0 0c a . Then the expressions of constraints (A2) can be generalized as:
11
1 0 1
1
1
( , ) ( ) ( , ) 1,2,...5, 1,..., 1,
( , ) 26 ( , ) 1,..., 1.
n n nt t t t t t t t t
j j o d d n n j j j j o
j d j
nt t t t t t t
j j o j j o
j
e f c a a a e AIP e f n t T
e f AIP e f t T
(A3)
Substituting 1( , )t t t
j jAIP ein (A3) by the LHS of Eq. (A1)-ii, we obtain,
11 1 1 1
,
1 1 0 1
1 1 1 1
,
1 1
( , ) ( ) 1,2,...5, 1,..., 1,
26 ( , ) 1,..., 1.
n n n nt t t t t t t t t
j j j j o d d n n j j pa o ao
j j d j
n nt t t t t t t
j j j j o pa o ao
j j
e f c a a a e s s n t T
e f s s t T
(A4)
which are also constraints (4)-viii and (4)-ix in the PFC-for-AIP funds substitution model. Note that
constraint (A4) alone does not ensure that at least one of the inequalities in (A4) is binding. In other
words, the amount of receivable AIP funds computed by (A4), which equals
n
j
t
oa
t
opa
t
j
t
j ss1
,, , can
be always less than the actual amount of receivable AIP funds (which equals the smallest of the LHS

To appear in Transportation Research Part E: Logistics and Transportation Review
28
over all inequalities in (A2)), given 1
nt t
j j
j
e
and t
of . The strict equality of at least one of the
inequalities in (A4) is achieved once we maximize ,
t
pa os and t
aos in the DEA objective. In this way,
the amount of receivable AIP funds computed by (A4) will equal the actual AIP funds from using the
FAA formulas and rules.
Appendix B: Airport efficiency scores by stage and year
Table B1. Stage efficiency
Airport Stage 1:
aircraft movement
Stage 2:
aircraft loading
Albany International 0.344 0.268
Boise Air Terminal/Gowen Field 1.000 1.000
Baltimore/Washington International Thurgood Marshall 0.866 0.030
Columbia Metropolitan 0.768 0.278
The Eastern Iowa 1.000 0.135
Cleveland-Hopkins International 0.115 0.003
City of Colorado Springs Municipal 0.528 0.685
Cincinnati/Northern Kentucky International 0.087 0.370
James M Cox Dayton International 0.330 0.063
Denver International 0.692 0.150
Des Moines International 0.381 0.556
Detroit Metropolitan Wayne County 0.344 0.026
Fresno Yosemite International 0.511 0.123
Bishop International 0.936 0.130
Fort Wayne International 0.964 0.803
Spokane International 0.359 0.132
Grand Forks International 1.000 1.000
Honolulu International 0.036 1.000
Washington Dulles International 0.036 0.001
Wichita Mid-Continent 0.453 0.069
Indianapolis International 0.089 1.000
Jackson-Medgar Wiley Evers International 0.786 0.509
Jacksonville International 0.348 0.031
McCarran International 0.454 0.353
Los Angeles International 0.205 1.000
Long Beach /Daugherty Field/ 0.220 0.237
Orlando International 0.027 1.000
Harrisburg International 0.605 0.081
General Mitchell International 0.418 0.017

To appear in Transportation Research Part E: Logistics and Transportation Review
29
Will Rogers World 0.228 0.155
Chicago O'Hare International 0.815 1.000
Philadelphia International 0.716 0.399
Phoenix Sky Harbor International 0.283 0.476
Pittsburgh International 0.125 0.004
Southwest Florida International 0.142 0.142
Shreveport Regional 1.000 1.000
Norman Y. Mineta San Jose International 0.124 0.608
Salt Lake City International 0.305 0.204
Sacramento International 0.060 0.019
Tampa International 0.072 0.155
Tucson International 0.237 0.692
Average 0.439 0.388
Table B2. Time efficiency
Airport Year 2009 Year 2010 Year 2011 Year 2012 Year 2013
Albany International 0.223 0.228 0.386 0.490 0.202
Boise Air Terminal/Gowen Field 1.000 1.000 1.000 1.000 1.000
Baltimore/Washington International Thurgood Marshall 0.500 0.516 0.520 0.183 0.520
Columbia Metropolitan 0.601 0.466 0.530 0.513 0.505
The Eastern Iowa 0.508 0.521 0.583 0.614 0.612
Cleveland-Hopkins International 0.051 0.058 0.060 0.063 0.064
City of Colorado Springs Municipal 1.000 0.268 0.669 0.710 0.388
Cincinnati/Northern Kentucky International 0.039 0.343 0.317 0.213 0.231
James M Cox Dayton International 0.166 0.190 0.244 0.209 0.174
Denver International 0.346 0.348 0.060 0.603 0.747
Des Moines International 0.354 0.213 0.374 0.697 0.705
Detroit Metropolitan Wayne County 0.205 0.226 0.033 0.193 0.267
Fresno Yosemite International 0.275 0.287 0.368 0.339 0.314
Bishop International 0.437 0.419 0.548 0.697 0.565
Fort Wayne International 0.418 1.000 1.000 1.000 1.000
Spokane International 0.236 0.263 0.344 0.220 0.165
Grand Forks International 1.000 1.000 1.000 1.000 1.000
Honolulu International 0.516 0.518 0.519 0.520 0.517
Washington Dulles International 0.014 0.014 0.018 0.022 0.024
Wichita Mid-Continent 0.239 0.226 0.284 0.288 0.267
Indianapolis International 0.539 0.545 0.545 0.547 0.548
Jackson-Medgar Wiley Evers International 1.000 1.000 0.430 0.431 0.378
Jacksonville International 0.093 0.115 0.528 0.112 0.101
McCarran International 0.280 0.341 0.160 0.472 0.766
Los Angeles International 0.628 0.618 0.509 0.637 0.621
Long Beach /Daugherty Field/ 0.252 0.097 0.215 0.385 0.193

To appear in Transportation Research Part E: Logistics and Transportation Review
30
Orlando International 0.512 0.513 0.513 0.515 0.514
Harrisburg International 0.288 0.300 0.356 0.372 0.400
General Mitchell International 0.121 0.107 0.244 0.505 0.112
Will Rogers World 0.272 0.137 0.167 0.200 0.180
Chicago O'Hare International 1.000 1.000 0.536 1.000 1.000
Philadelphia International 1.000 0.500 0.071 0.951 0.266
Phoenix Sky Harbor International 0.228 0.202 0.154 0.674 0.637
Pittsburgh International 0.061 0.066 0.069 0.065 0.062
Southwest Florida International 0.101 0.123 0.159 0.159 0.167
Shreveport Regional 1.000 1.000 1.000 1.000 1.000
Norman Y. Mineta San Jose International 0.547 0.059 0.564 0.570 0.087
Salt Lake City International 0.119 0.108 1.000 0.025 0.021
Sacramento International 0.032 0.028 0.040 0.052 0.046
Tampa International 0.081 0.095 0.133 0.142 0.118
Tucson International 0.265 0.180 0.624 0.629 0.626
Average 0.404 0.372 0.412 0.464 0.417