PASSENGER COUNTING TECHNOLOGIES AND PROCEDURES
59
T R A N S I T C O O P E R A T I V E R E S E A R C H P R O G R A M SPONSORED BY The Federal Transit Administration Passenger Counting Technologies And Procedures A Synthesis of Transit Practice Transportation Research Board National Research Council TCRP Synthesis 29
Transcript of PASSENGER COUNTING TECHNOLOGIES AND PROCEDURES

T R A N S I T C O O P E R A T I V E R E S E A R C H P R O G R A M
SPONSORED BY
The Federal Transit Administration
Passenger Counting TechnologiesAnd Procedures
A Synthesis of Transit Practice
Transportation Research BoardNational Research Council
TCRP Synthesis 29

TCRP OVERSIGHT AND PROJECTSELECTION COMMITTEE
CHAIRMANMICHAEL S. TOWNESPeninsula Transportation District
Commission
MEMBERSSHARON D. BANKSAC TransitLEE BARNESBarwood IncGERALD L. BLAIRIndiana County Transit AuthoritySHIRLEY A. DELIBERONew Jersey Transit CorporationROD J. DIRIDONInternational Institute for Surface
Transportation Policy StudySANDRA DRAGGOOCATALOUIS J. GAMBACCINISEPTADELON HAMPTONDelon Hampton & AssociatesKATHARINE HUNTER-ZAWORSKITransportation Research InstituteALAN F. KIEPPERParsons Brinckerhoff Quade & DouglasPAUL LARROUSSEMadison Metro Transit SystemROBERT G. LINGWOODBC TransitGORDON J. LINTONFTADON S. MONROEPierce TransitPATRICIA "Tish" S. NETTLESHIPThe Nettleship Group, IncROBERT E. PAASWELLThe City College of New YorkJAMES P. REICHERTReichert Management ServicesLAWRENCE G. REUTERNew York City Transit AuthorityPAUL TOLIVERKing County Department ofTransportation/MetroLINDA WATSONCorpus Christi RTAEDWARD WYTKINDAFL-CIO
EX OFFICIO MEMBERSWILLIAM W. MILLARAPTARODNEY E. SLATERFHWAFRANCIS B. FRANCOISAASHTOROBERT E. SKINNER, JR.TRB
TDC EXECUTIVE DIRECTORFRANK J. CIHAKAPTA
SECRETARYROBERT J. REILLYTRB
TRANSPORTATION RESEARCH BOARD EXECUTIVE COMMITTEE 1998
OFFICERSChairwoman: SHARON D. BANKS, General Manager, AC Transit, Oakland, CaliforniaVice Chair: WAYNE SHACKELFORD, Commissioner Georgia Department of TransportationExecutive Director: ROBERT E. SKINNER, JR., Transportation Research Board, National ResearchCouncil, Washington, D.C.
MEMBERSBRIAN J.L. BERRY, Lloyd Viel Berkner Regental Professor, Bruton Center for Development Studies,University of Texas at DallasSARAH C. CAMPBELL, President, Trans Management Inc, Washington, D.C.E. DEAN CARLSON, Secretary, Kansas Department of TransportationJOANNE F. CASEY, President, Intermodal Association of North America Greenbelt, MarylandJOHN W. FISHER, Director, ATLSS Engineering Research Center, Lehigh UniversityGORMAN GILBERT, Director, Institute for Transportation Research and Education, North Carolina StateUniversityDELON HAMPTON, Chairman & CEO, Delon Hampton &Associates, Washington, D.C.LESTER A. HOEL, Hamilton Professor, University of Virginia, Department of Civil Engineering (PastChair, 1986)JAMES L. LAMMIE, Director, Parsons Brinckerhoff, Inc., New YorkTHOMAS F. LARWIN, San Diego Metropolitan Transit Development BoardBRADLEY L. MALLORY, Secretary of Transportation, Commonwealth of PennsylvaniaJEFFREY J. McCAIG, President and CEO, Trimac Corporation, Calgary, CanadaJOSEPH A. MICKES, Chief Engineer, Missouri Department of TransportationMARSHALL W. MOORE, Director, North Dakota Department of TransportationANDREA RINIKER, Executive Director, Port of Tacoma, WashingtonJOHN M. SAMUELS, Vice President-Operations Planning & Budget, Norfolk Southern Corporation, VirginiaLES STERMAN, Executive Director of East-West Gateway Coordinating Council, St. Louis, MissouriJAMES W. VAN LOBEN SELS, Director, California Department of Transportation (Past Chair, 1996)MARTIN WACHS, Director, University of California Transportation Center, University of California, BerkeleyDAVID L. WINSTEAD, Secretary, Maryland Department of TransportationDAVID N. WORMLEY, Dean of Engineering, Pennsylvania State University, (Past Chair, 1997)
EX OFFICIO MEMBERSMIKE ACOTT, President, National Asphalt Pavement Association, Lanham, MarylandJOE N. BALLARD, Chief of Engineers and Commander, U.S. Army Corps of Engineers, Washington, D.C.ANDREW H. CARD, JR., President & CEO, American Automobile Manufacturers Association,Washington, D.C.KELLEY S. COYNER, Acting Administrator, Research & Special Program Administration, U.S. Departmentof Transportation, Washington, D.C.MORTIMER L. DOWNEY, Deputy Secretary, Office of the Secretary, U.S. Department of Transportation,Washington, D.C.
FRANCIS B. FRANCOIS, Executive Director, American Association of State Highway and TransportationOfficials, Washington, D.C.
.
DAVID GARDINER, Assistant Administrator, Office of Policy, Planning, and Evaluation, U.S.Environmental Protection Agency, Washington, D.C.JANE F. GARVEY, Administrator, Federal Aviation Administration, U.S. Department of Transportation,Washington, D.C.JOHN E. GRAYKOWSKI, Acting Administrator, Maritime Administration, U.S. Department ofTransportation, Washington, D.C.ROBERT A. KNISELY, Deputy Director, Bureau of Transportation Statistics, U.S. Department ofTransportation, Washington, D.C.GORDON J. LINTON, Administrator, Federal Transit Administration, U.S. Department of Transportation,Washington, D.C.RICARDO MARTINEZ, Administrator, National Highway Traffic Safety Administration, Washington, D.C.WALTER B. McCORMICK, President and CEO, American Trucking Associations, Inc, Alexandria, VirginiaWILLIAM W. MILLAR, President, American Public Transit Association, Washington, D.C.JOLENE M. MOLITORIS, Administrator, Federal Railroad Administration, U.S. Department ofTransportation, Washington, D.C.KAREN BORLAUG PHILLIPS, Senior Vice President, Policy, Legislation, and Economics, Association ofAmerican Railroads, Washington, D.C.GEORGE D. WARRINGTON, Acting President and CEO. National Railroad Passenger Corporation,Washington D. C. KENNETH R. WYKLE, Administrator, Federal Highway Administration, U.S.Department of Transportation,
Washington, D.C.
TRANSIT COOPERATIVE RESEARCH PROGRAM
Transportation Research Board Executive Committee Subcommittee for TCRPSHARON D. BANKS, AC Transit (Chairwoman)DENNIS J. FITZGERALD, Capital District Transportation AuthorityLESTER A. HOEL, University of VirginiaGORDON J. LINTON, U.S. Department of TransportationROBERT E. SKINNER, JR., Transportation Research BoardJAMES W. VAN LOBEN SELS, California Department of Transportation

T R A N S I T C O O P E R A T I V E R E S E A R C H P R O G R AM
Synthesis of Transit Practice 29
Passenger Counting TechnologiesAnd Procedures
DANIEL K. BOYLETransportation Management & Design
Solana Beach, California
TOPIC PANEL
MARK C. DOUGLAS, Metropolitan Transit Authority of Harris CountyTHOMAS W. FRIEDMAN, King County Department of Transportation
AARON ISAACS, Metropolitan Council Transit OperationsJOEL S. KOFFMAN, Ottawa-Carleton Regional Transit Commission
WILLIAM B. MENZIES, City of Winnipeg Transit SystemJACK M.REILLY, Capital District Transportation Authority
SEAN RICKETSON, Federal Transit AdministrationPETER L. SHAW, Transportation Research Board
DAVID H. SEMENDINGER, Washington Metropolitan Area Transit Authority
Transportation Research BoardNational Research Council
Research Sponsored by the Federal Transit Administration inCooperation with the Transit Development Corporation
NATIONAL ACADEMY PRESSWashington, D.C. 1998

TRANSIT COOPERATIVE RESEARCH PROGRAM
The nation's growth and the need to meet mobility,environmental, and energy objectives place demands on publictransit systems. Current systems, some of which are old and in needof upgrading, must expand service area, increase service frequency,and improve efficiency to serve these demands. Research isnecessary to solve operating problems, to adapt appropriate newtechnologies from other industries, and to introduce innovations intothe transit industry. The Transit Cooperative Research Program(TCRP) serves as one of the principal means by which the transitindustry can develop innovative near-term solutions to meet demandsplaced on it.
The need for TCRP was originally identified in TRB SpecialReport 213--Research for Public Transit: New Directions, publishedin 1987 and based on a study sponsored by the Federal TransitAdministration (FTA). A report by the American Public TransitAssociation (APTA), Transportation 2000, also recognized the needfor local, problem-solving research. TCRP, modeled after thelongstanding and successful National Cooperative Highway ResearchProgram, undertakes research and other technical activities inresponse to the needs of transit service providers. The scope of viceconfiguration, equipment, facilities, operations, human resources,maintenance, policy, and administrative practices.
TCRP was established under FTA sponsorship in July 1992.Proposed by the U.S. Department of Transportation, TCRP wasauthorized as part of the Intermodal Surface TransportationEfficiency Act of 1991 (ISTEA). On May 13, 1992, a memorandumagreement outlining TCRP operating procedures was executed by thethree cooperating organizations: FTA, the National Academy ofSciences, acting through the Transportation Research Board (TRB),and the Transit Development Corporation, Inc. (TDC), a nonprofiteducational and research organization established by APTA. TDC isresponsible for forming the independent governing board, designatedas the TCRP Oversight and Project Selection (TOPS) Committee.
Research problem statements for TCRP are solicitedperiodically but may be submitted to TRB by anyone at anytime. It isthe responsibility of the TOPS Committee to formulate the researchprogram by identifying the highest priority projects. As part of theevaluation, the TOPS Committee defines funding levels and expectedproducts.
Once selected, each project is assigned to an expert panel,appointed by the Transportation Research Board. The panels prepareproject statements (requests for proposals), select contractors, andprovide technical guidance and counsel throughout the life of theproject The process for developing research problem statements andselecting research agencies has been used by TRB in managingcooperative research programs since 1962. As in other TRBactivities, TCRP project panels serve voluntarily withoutcompensation.
Because research cannot have the desired impact if productsfail to reach the intended audience, special emphasis is placed ondisseminating TCRP results to the intended end-users of the research:transit agencies, service providers, and suppliers. TRB provides aseries of research reports, syntheses of transit practice, and othersupporting material developed by TCRP research. APTA willarrange for workshops, training aids, field visits, and other activitiesto ensure that results are implemented by urban and rural transitindustry practitioners.
The TCRP provides a forum where transit agencies cancooperatively address common operational problems. TCRP resultssupport and complement other ongoing transit research and trainingprograms.
TCRP SYNTHESIS 29
Project J-7, Topic SA-09ISSN 1073-4880ISBN 0-309-06815-0Library of Congress Catalog Card No. 98-67630
© 1998 Transportation Research Board
Price $23.00
NOTICE
The project that is the subject of this report was a part of the TransitCooperative Research Program conducted by the TransportationResearch Board with the approval of the Governing Board of theNational Research Council. Such approval reflects the GoverningBoard's judgment that the project concerned is appropriate withrespect to both the purposes and resources of the National ResearchCouncil.
The members of the technical advisory panel selected tomonitor this project and to review this report were chosen forrecognized scholarly competence and with due consideration for thebalance of disciplines appropriate to the project. The opinions andconclusions expressed or implied are those of the research agencythat performed the research, and while they have been accepted asappropriate by the technical panel, they are not necessarily those ofthe Transportation Research Board, the Transit DevelopmentCorporation, the National Research Council, or the Federal TransitAdministration of the U.S. Department of Transportation.
Each report is reviewed and accepted for publication by thetechnical panel according to procedures established and monitored bythe Transportation Research Board Executive Committee and theGoverning Board of the National Research Council.
Special Notice
The Transportation Research Board, the Transit DevelopmentCorporation, the National Research Council, and the Federal TransitAdministration (sponsor of the Transit Cooperative ResearchProgram) do not endorse products or manufacturers. Trade ormanufacturers' names appear herein solely because they areconsidered essential to the clarity and completeness of the projectreport.
Published reports of the
TRANSIT COOPERATIVE RESEARCH PROGRAM
are available from:
Transportation Research BoardNational Research Council2101 Constitution Avenue, N.W.Washington, D.C. 20418
and can be ordered through the Internet at:
http://www.nas.edu/trb/index.html
Printed in the United States of America

PREFACE
FOREWORDBy Staff
TransportationResearch Board
A vast storehouse of information exists on many subjects of concern to the transitindustry. This information has resulted from research and from the successfulapplication of solutions to problems by individuals or organizations. There is acontinuing need to provide a systematic means for compiling this information andmaking it available to the entire transit community in a usable format. The TransitCooperative Research Program includes a synthesis series designed to search for andsynthesize useful knowledge from all available sources and to prepare documentedreports on current practices in subject areas of concern to the transit industry.
This synthesis series reports on various practices, making specificrecommendations where appropriate but without the detailed directions usually foundin handbooks or design manuals. Nonetheless, these documents can serve similarpurposes, for each is a compendium of the best knowledge available on those measuresfound to be successful in resolving specific problems. The extent to which these reportsare useful will be tempered by the user's knowledge and experience in the particularproblem area.
This synthesis will be of interest to transit agency general managers, their planningand scheduling, operations and maintenance, computer services, and budget andfinance staffs, as well as to technology providers. It summarizes information fromselected transit agencies about benefits and problems associated with each passengercounting technology, as reported by current users. It also presents advice for agenciesconsidering each technology.
Administrators, practitioners, and researchers are continually faced with issues orproblems on which there is much information, either in the form of reports or in termsof undocumented experience and practice. Unfortunately, this information often isscattered or not readily available in the literature, and, as a consequence, in seekingsolutions, full information on what has been learned about an issue or problem is notassembled. Costly research findings may go unused, valuable experience may beoverlooked, and full consideration may not be given to the available methods ofsolving or alleviating the issue or problem. In an effort to correct this situation, theTransit Cooperative Research Program (TCRP) Synthesis Project, carried out by theTransportation Research Board as the research agency, has the objective of reportingon common transit issues and problems and synthesizing available information. Thesynthesis reports from this endeavor constitute a TCRP publication series in whichvarious forms of relevant information are assembled into single, concise documentspertaining to a specific problem or closely related issues.
This document from the Transportation Research Board reports on the ranges oftechniques to count passengers and estimate ridership. Issues considered deal with datacollection methodology, data processing, end uses of ridership data, organizationalresponsibilities, and resource requirements.
To develop this synthesis in a comprehensive manner and to ensure inclusion ofsignificant knowledge, available information was assembled from numerous sources,including a number of public transportation agencies. A topic panel of experts in thesubject area was established to guide the researchers in organizing and evaluating thecollected data, and to review the final synthesis report.
This synthesis is an immediately useful document that records practices that wereacceptable within the limitations of the knowledge available at the time of itspreparation. As the processes of advancement continue, new knowledge can beexpected to be added to that now at hand.

CONTENTS
1 SUMMARY
4 CHAPTER ONE INTRODUCTIONBackground, 4Purpose and Scope, 4Literature Review, 5Organization of the Synthesis, 5
7 CHAPTER TWO WHY COLLECT RIDERSHIP DATA?Definition of Ridership, 7Uses of Ridership Data, 7Summary, 8
9 CHAPTER THREE PASSENGER COUNTING TECHNOLOGIESAND PROCEDURES
Frequency of Ridership Counts, 9One Hundred Percent Versus Sample Counts, 9Passenger Counting Technologies and Procedures, 9Summary, 14
15 CHAPTER FOUR PROCESSING AND REPORTINGData Input, 15Data Validation, 15Data Reports, 15Summary, 16
17 CHAPTER FIVE ORGANIZATION AND RESOURCEREQUIREMENTS
Organization, 17Staffing, 17Cost, 17Summary, 18
19 CHAPTER SIX TECHNOLOGY PROVIDERS' PERSPECTIVETechnology Providers Interviewed, 19Perspective on Transit Industry Applications, 19Summary, 20

21 CHAPTER SEVEN CASE STUDIESMetropolitan Transit Authority of Harris County, Texas, 21Tidewater Transportation District Commission, 23Chicago Transit Authority, 24Tri-County Metropolitan Transportation District of Oregon, 25Ottawa-Carleton Regional Transit Commission, 27South Coast Area Transit, 29
31 CHAPTER EIGHT CONCLUSIONS
33 REFERENCES
34 APPENDIX A SURVEY QUESTIONNAIRE AND RESPONSES
48 APPENDIX B LIST OF SURVEY RESPONDENTS AND TECHNOLOGYFIRMS INTERVIEWED

TCRP COMMITTEE FOR PROJECT J-7
CHAIRJACK REILLYCapital District Transportation Authority
MEMBERSGERALD BLAIRIndiana County Transit AuthorityKENNETH J. DUEKERCenter for Urban StudiesL.G. FULLERTranspo Enterprises, Inc.ALAN J. GIBBSNational Transit InstituteHENRY HIDEBrown & Root TGMFRANK T. MARTINMetro-Dade Transit AgencyPATRICIA V. McLAUGHLINLos Angeles County Metropolitan Transportation
AuthorityBEVERLY A. SCOTTRhode Island Public Transit AuthorityBEVERLY G. WARDCenter for Urban Transportation Research
TRB LIAISONROBERT SPICHERTransportation Research Board
COOPERATIVE RESEARCH PROGRAMS STAFFROBERT J. REILLY, Director, Cooperative Research ProgramsSTEPHEN J. ANDRLE, Manager, TCRPGWEN CHISHOLM, Project Manager, TCRP
TCRP SYNTHESIS STAFFSTEPHEN R. GODWIN, Director for Studies and Information ServicesDONNA L. VLASAK, Senior Program OfficerLINDA S. MASON, Editor
ACKNOWLEDGMENTS
Daniel K. Boyle, a consultant in transportation managementand design from Solana Beach, California, was responsible forcollection of the data and preparation of the report
Valuable assistance in the preparation of this synthesis wasprovided by the Topic Panel, consisting of Mark C. Douglas,Director Research, Evaluation & Trip Planning, Metropolitan TransitAuthority of Harris County, Texas; Thomas W. Friedman, SeniorPlanner, King County Department of Transportation, Washington;Aaron Isaacs, Manager of Team Transit & Public Facilities,Metropolitan Council Transit Operations, Minnesota; Joel S.Caveman, Head, Research & Development, Planning Division,Ottawa-Carleton Regional Transit Commission; William B. Menzies,Manager of Planning and Schedules, City of Winnipeg TransitSystem; Jack M. Reilly, Director of Planning and Development,Capital District Transportation Authority, New York; SeanRicketson, Transportation Program Specialist, Federal
Transit Administration; Peter L. Shaw, Public TransportationSpecialist, Transportation Research Board; and David H.Semendinger, Manager, Schedules and Traffic, WashingtonMetropolitan Area Transit Authority.
This study was managed by Donna L. Vlasak, Senior ProgramOfficer, who worked with the consultant, the Topic Panel, and the J-7project committee in the development and review of the report.Assistance in Topic Panel selection and project scope developmentwas provided by Sally D. Liff, Senior Program Officer. Linda S.Mason was responsible for editing and production. Cheryl Keithassisted in meeting logistics and distribution of the questionnaire anddraft reports.
Gwen Chisholm, Senior Program Officer, assisted TCRP staffin project review.
Information on current practice was provided by many transitagencies. Their cooperation and assistance were most helpful.

PASSENGER COUNTING TECHNOLOGIESAND PROCEDURES
SUMMARY The transit industry has a long history of counting passengers on its buses. Frompaper and pencil, still in use at many agencies today, technologies have evolved toinclude handheld units, electronic registering fareboxes (ERFs), automatic passengercounters (APCs), and smart cards. As detailed analyses of system, route and sub-routeridership data become a standard way to identify opportunities to reallocate scarceresources in times of fiscal constraints, transit agencies today face more choices thanever in terms of how to count their passengers. Complicating the issue is the fact thatno one method works best for all purposes.
The purpose of this synthesis is to examine the current state of the practice interms of passenger counting technologies and procedures. Survey results from 33transit agencies provide information on a variety of topics, including the purposes ofcollecting ridership data at various levels, technologies and procedures currently in useor planned, data input and retrieval, analysis and reporting of ridership data,organizational issues, resource requirements (including staffing and cost), and benefitsand problems associated with each technology. The transit agencies included in thesurvey range in fleet size from 46 to 2,155 buses and have experience, in terms of day-to-day use or demonstration projects, with every technology currently in use in NorthAmerica.
The synthesis also provides insight from the perspective of companies supplyingpassenger counting technologies and equipment to the transit industry. Interviews wereconducted with five companies specializing in passenger counting technology to obtaintheir views regarding factors contributing to successful adoption of new technologies attransit agencies. Finally, case studies were conducted through detailed telephoneinterviews with six agencies that represent the spectrum of passenger countingtechnologies. The case study agencies include:
• Metropolitan Transit Authority of Harris County (METRO) in Houston, Texas,
• Tidewater Transportation District Commission (TTDC) in Norfolk, Virginia,• Chicago Transit Authority (CTA) in Chicago, Illinois,• Tri-County Metropolitan Transportation District of Oregon (Tri-Met) in
Portland, Oregon,• Ottawa-Carleton Regional Transit Commission (OC Transpo), in Ottawa,
Ontario, Canada, and• South Coast Area Transit (SCAT), in Oxnard, Ventura County, California.
Houston METRO is an example of an agency that uses ERFs for system and route-level ridership estimates and manual pencil and paper procedures for trip-level analysesin developing an effective ridership data collection program that meets the agency'sneeds. TTDC pioneered the use of hand-held data collection on its system. CTA hasrecently concluded an extended process of considering advanced passenger collectiontechnologies with

2
an APC demonstration, and has been an industry leader in making effective use of farebox data. Tri-Met isintegrating its existing APC data collection system with a new GPS-based automated vehicle location (AVL)system. Ottawa is in its second decade of relying on a signpost-based APC system for virtually all of its ridershipdata. South Coast Area Transit is one of the first agencies to undertake an extensive smart card demonstrationproject on its bus system.
The synthesis summarizes benefits and problems associated with each passenger counting technology, asprovided by current users, and also presents advice for agencies considering each technology. The case studies areable to go into greater detail on these issues, especially on how problems have been resolved. Case study agenciesand technology providers are in agreement on many key points related to the adoption of new technologies by transitagencies.
Primary conclusions of this synthesis include the following:
• Procedures are more important than technology--Experience to date strongly suggests that establishing andadhering to data collection procedures that meet the agency's needs is the most critical factor, regardless of thetechnology selected to count ridership. There is a tendency within the industry to focus too much on the hardwareside and not enough on the need and uses for ridership data within an agency.
• Internal changes are necessary to ensure the success of new passenger counting technologies--A significantinvestment in time and effort is needed in the early stages to update internal databases and analytical techniques, toensure that the system receives the priority it needs, and to train staff in its maintenance and usage.
• Visit and learn from other agencies before deciding on a new passenger counting technology--Thisemerged as a strong recommendation from both the surveys and the case studies. While each agency obviously hasunique aspects, the process of implementing new passenger counting technologies is very similar throughout theindustry. Instead of reinventing the wheel, a savvy agency can draw on the experiences of others in planning its ownimplementation of new technology.
• Unnecessary customization should be avoided--This phenomenon is related to the emphasis on technologyseen within the transit industry. Attempts to redesign what is available on the market to make one's own systemunique or better almost always result in failure. Most installations require a fair degree of customization to matchagency needs, but taken to extremes, this is a recipe for failure.
• A strong commitment from senior management is required--Adoption of new passenger countingtechnologies and procedures involves changes in departmental functions and responsibilities. Support from thegeneral manager raises the priority attached to passenger counting and ensures cooperation among the variousdepartments involved.
• Active management of the passenger counting system is critical to success—Senior management support isvital, but agencies that have successfully adopted new technologies are characterized by a mid-level person whoassumes responsibility for the system and takes the necessary action to ensure its proper functioning.
• Responsibilities must be clarified--Adopting a new technology is not a step taken in isolation. Internalworking relationships (between planning and dispatching, for example) are likely to change noticeably. Cooperationfrom several departments within the agency is needed, and does not necessarily happen overnight. Clarification ofresponsibilities at the outset is advised by agencies that have been through the process.
• Advanced passenger counting technologies offer several benefits--Among benefits cited by survey and casestudy agencies are more frequent data collection, a reduction in turnaround time, the ability to analyze ridership dataat finer levels of detail, greater timeliness and responsiveness, and lower cost. These do not accrue automatically;the most successful

3
agencies have updated internal databases and adapted procedures to maximize the benefits offered by advancedtechnologies.
• There is no one perfect solution--Agencies must consider their need for and uses of ridership data beforedeciding how best to proceed. Each ridership counting technology is appropriate to use for certain purposes, andthere are successful examples of each in the case studies. Many agencies using manual techniques are satisfied withestablished data collection schedules and have been successful in meeting the needs of data users. One hundredpercent accuracy does not exist with any technology. New passenger counting technologies have a break-in periodof approximately 18 months during which start-up problems are identified and solved.
Integration of passenger counting technologies with other emerging technologies (e.g., integration of APCs withAVL systems) is a developing trend. The number of agencies that are at least considering new technologies suggeststhat the state of the practice is likely to undergo considerable changes within the next decade.
4
CHAPTER ONE
INTRODUCTION
BACKGROUND
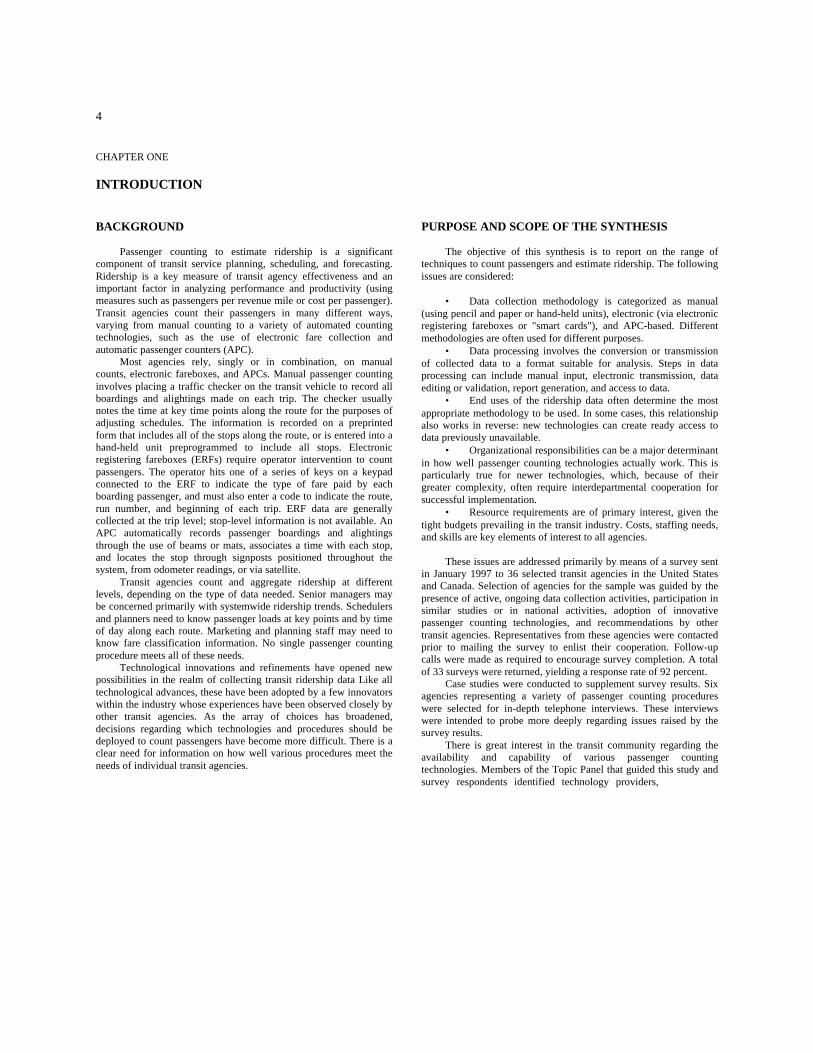
Passenger counting to estimate ridership is a significantcomponent of transit service planning, scheduling, and forecasting.Ridership is a key measure of transit agency effectiveness and animportant factor in analyzing performance and productivity (usingmeasures such as passengers per revenue mile or cost per passenger).Transit agencies count their passengers in many different ways,varying from manual counting to a variety of automated countingtechnologies, such as the use of electronic fare collection andautomatic passenger counters (APC).
Most agencies rely, singly or in combination, on manualcounts, electronic fareboxes, and APCs. Manual passenger countinginvolves placing a traffic checker on the transit vehicle to record allboardings and alightings made on each trip. The checker usuallynotes the time at key time points along the route for the purposes ofadjusting schedules. The information is recorded on a preprintedform that includes all of the stops along the route, or is entered into ahand-held unit preprogrammed to include all stops. Electronicregistering fareboxes (ERFs) require operator intervention to countpassengers. The operator hits one of a series of keys on a keypadconnected to the ERF to indicate the type of fare paid by eachboarding passenger, and must also enter a code to indicate the route,run number, and beginning of each trip. ERF data are generallycollected at the trip level; stop-level information is not available. AnAPC automatically records passenger boardings and alightingsthrough the use of beams or mats, associates a time with each stop,and locates the stop through signposts positioned throughout thesystem, from odometer readings, or via satellite.
Transit agencies count and aggregate ridership at differentlevels, depending on the type of data needed. Senior managers maybe concerned primarily with systemwide ridership trends. Schedulersand planners need to know passenger loads at key points and by timeof day along each route. Marketing and planning staff may need toknow fare classification information. No single passenger countingprocedure meets all of these needs.
Technological innovations and refinements have opened newpossibilities in the realm of collecting transit ridership data Like alltechnological advances, these have been adopted by a few innovatorswithin the industry whose experiences have been observed closely byother transit agencies. As the array of choices has broadened,decisions regarding which technologies and procedures should bedeployed to count passengers have become more difficult. There is aclear need for information on how well various procedures meet theneeds of individual transit agencies.
PURPOSE AND SCOPE OF THE SYNTHESIS
The objective of this synthesis is to report on the range oftechniques to count passengers and estimate ridership. The followingissues are considered:
• Data collection methodology is categorized as manual(using pencil and paper or hand-held units), electronic (via electronicregistering fareboxes or "smart cards"), and APC-based. Differentmethodologies are often used for different purposes.
• Data processing involves the conversion or transmissionof collected data to a format suitable for analysis. Steps in dataprocessing can include manual input, electronic transmission, dataediting or validation, report generation, and access to data.
• End uses of the ridership data often determine the mostappropriate methodology to be used. In some cases, this relationshipalso works in reverse: new technologies can create ready access todata previously unavailable.
• Organizational responsibilities can be a major determinantin how well passenger counting technologies actually work. This isparticularly true for newer technologies, which, because of theirgreater complexity, often require interdepartmental cooperation forsuccessful implementation.
• Resource requirements are of primary interest, given thetight budgets prevailing in the transit industry. Costs, staffing needs,and skills are key elements of interest to all agencies.
These issues are addressed primarily by means of a survey sentin January 1997 to 36 selected transit agencies in the United Statesand Canada. Selection of agencies for the sample was guided by thepresence of active, ongoing data collection activities, participation insimilar studies or in national activities, adoption of innovativepassenger counting technologies, and recommendations by othertransit agencies. Representatives from these agencies were contactedprior to mailing the survey to enlist their cooperation. Follow-upcalls were made as required to encourage survey completion. A totalof 33 surveys were returned, yielding a response rate of 92 percent.
Case studies were conducted to supplement survey results. Sixagencies representing a variety of passenger counting procedureswere selected for in-depth telephone interviews. These interviewswere intended to probe more deeply regarding issues raised by thesurvey results.
There is great interest in the transit community regarding theavailability and capability of various passenger countingtechnologies. Members of the Topic Panel that guided this study andsurvey respondents identified technology providers,

5
who contributed descriptive material regarding various products.Selected providers were interviewed to obtain their perspective ondevelopments within the transit industry.
LITERATURE REVIEW
A review of current literature addressing passenger countingwas also conducted as part of this synthesis and results aresummarized here. While several reports provided extremely usefulbackground information, the fast-changing nature of passengercounting technologies and procedures resulted in greater reliance onthe 1997 surveys and case studies in synthesizing recommendations.
Hodges (1) prepared the first comprehensive overview of APCsystems in a 1985 report detailing the state of the practice. Theapproach taken in this study involved the analysis of survey resultsfrom APC users and of findings from 13 case studies (seven inCanada, six in the United States). Three of the case study systems arealso used in this synthesis (Chicago Transit Authority, Ottawa-Carleton Regional Transit Commission, and Tri-Met). The study'sassessment of intended uses and benefits of APC systems is still ofinterest, but technological improvements over the past decade makeother elements in the report outdated.
A more recent 1992 report on Advanced Public TransportationSystems by Labell, Schweiger, and Kihl (2) updated the state of thepractice in terms of new technologies. Smart card demonstrationprograms were discussed in this report along with APC systems. By1997, this report is also somewhat dated, given the developmentsover the past 5 years.
Rossetti (3) describes the feasibility of an automatic transitmonitoring system based on radio frequency identification (RF/ID)of transit users. The prototype developed in this 1996 IDEA(Innovations Deserving Exploratory Analysis) project integratesautomatic passenger counting, automatic vehicle location, and farepayment via RF/ID tags incorporated directly into bus passes. Muchof the demonstration project is taken up with testing how well thevehicle location component works. RF/ID passes were tested only insimulation, although riders were surveyed regarding attitudes towardsuch passes. If successful, this system promises boarding/alightingdata by passenger. Since AVL technology has been proven in thefield, a more useful test would have involved how well passengercounting and passenger-specific boarding and alighting data areintegrated and reported at the stop level. The issue of how to countpassengers not using an RF/ID encoded pass is not addressed.
Greneker et al. (4) describe in a 1996 IDEA report anexperimental transit vehicle passenger counter designed from off-the-shelf systems and field-tested in a bus. The experimental system isintended to permit origin-destination data to be collected forindividual passengers by recognizing footprint patterns of boardingand alighting riders. As with existing APC mat-based systems, theexperimental system was able to identify entering and exitingpassengers. The goal of determining if the passenger is a man,woman, or child was not achieved. This study concludes byproposing use of a radar
unit instead of floor mat sensors in a second phase of the study,although it is unclear whether the radar unit would be able to detectindividual passenger movements and produce origin-destinationpatterns.
Boyle and Perk (5) reviewed procedures for data collection,analysis, and usage at operations planning departments of 20 majortransit agencies as part of a study for Metro-Dade Transit Agency inMiami, Florida. This 1995 study addressed many of the elementsanalyzed in this synthesis, although many systems have instituteddemonstration projects or implemented changes to their datacollection procedures even in the 2 years since the study waspublished.
Several technology providers have published descriptions oftheir APC systems. These publications contain considerable technicaldetail on system components (6,7) as well as a non-technicaloverview of APC systems (8).
Finally, several agencies participating in this study providedresults of their research into and experiences with passenger countingtechnologies. WMATA in Washington, D.C. provided a 1993 studyon hand-held units (9) as well as an internal 1996 memorandumcontaining the results of a seven-agency survey related to usage ofhand-held data collection devices (10). CTA made their 1996 APCagency and vendor contact lists available (11); these helped in theidentification of agencies and vendors to be included in this study.OC Transpo provided a 1986 report (12) describing the evolution ofAPC at the agency over the previous 10 years and summarizingreasons for success. Key factors in success (that still, incidentally,apply today) include intra-agency cooperation, managementcommitment, the high caliber of hardware and software suppliers,and the APC experience developed within the agency. Lynx inOrlando, Florida sponsored a 1996 APC pilot study that includedresults of an APC-related survey of 25 transit systems (13). SCAT inVentura County, California, sent along a newspaper articleaddressing privacy concerns related to the smart card demonstrationproject (14).
ORGANIZATION OF THE SYNTHESIS
Following this introductory chapter, chapter 2 discusses thereasons for collecting ridership data. Survey results support the needfor specific information at the system, route, trip, and stop orsegment levels. Chapter 3 forms the heart of the synthesis,summarizing the current state of the practice in counting riders. Theextent of usage, capabilities, strengths and weaknesses of eachtechnology, as noted by users, are reported in this chapter. Case studyresults are included as appropriate in this chapter to supplement thesurvey findings. Chapter 4 addresses processing and reporting issuesrelated to passenger counting, including data input, data validation,and reporting capabilities. While processing and reporting techniquesare not a direct subject of the synthesis, these issues need to beaddressed to provide a more complete picture of the usefulness ofvarious technologies in meeting agency needs.
Chapter 5 examines organizational and resource requirementswithin each transit agency for carrying out the passenger

6
counting program. This chapter includes an analysis of the placementof the passenger counting function within each agency, andtechniques for resolving and/or minimizing intra-agency conflicts.Staffing needs and capital, operating, and maintenance costsassociated with the passenger counting function at each agency aresummarized, although it should be noted that there is variation in thelevel of detail provided in these areas across different systems.
Chapter 6 provides basic information on the characteristics ofavailable technologies as provided by the vendors identified bysurvey respondents or panel members. This is not intended as an all-inclusive inventory of technology providers, but as an example ofvarious technologies that are being used by transit agencies includedin the survey sample. The chapter also includes observations withregard to the application of
these technologies in the transit industries from the suppliers'perspective.
Chapter 7 reports detailed findings from the six case studies.Agencies were selected for the case studies to represent differenttechnologies and procedures. The case studies consisted of detailedtelephone interviews, intended to elaborate on critical areas such asbenefits, problems, and recommendations, with key agencypersonnel.
Chapter 8 summarizes the findings of the synthesis project andprovides a "snapshot" of passenger counting technologies andprocedures currently in use along with an assessment of theirstrengths and weaknesses. Findings from the surveys and particularlythe case studies will be cited to support recommendations regardingthe implementation and use of various technologies for specificpurposes.

7
CHAPTER TWO
WHY COLLECT RIDERSHIP DATA?
There can be many reasons to collect ridership data, and manyuses for the data collected. Ridership is an accepted measure ofsuccess for any transit agency, and so systemwide ridership totals areusually summarized for senior management and finance departments.Route-level ridership is also of general interest. Service planning andscheduling departments require more detailed ridership data at thetrip, route segment, time of day, and/or stop level to be able to matchservice to demand. Time-related data are often collected inconjunction with ridership data and used to monitor scheduleadherence. Analysis of origin-destination patterns generally requiresspecial on-board surveys that go beyond the simple counting ofpassengers.
This chapter addresses the general purposes for which ridershipdata are collected and used, and reports purposes and uses at thesystem, route, trip, and segment or stop levels of data. Specific usesof data are summarized from the survey results. Also included are thedepartments within each transit agency that use each level ofridership data.
DEFINITION OF RIDERSHIP
The transit industry uses two definitions of ridership. Unlinkedtrips refers to total boardings, and is nearly always the unit ofridership counted in the field. Linked trips is the term used to definetotal riders, and measures the actual number of complete trips fromorigin to destination, including transfers. The Federal TransitAdministration's National Transit Data Base (formerly known asSection 15) reporting requirements specify unlinked trips as the unitfor measuring ridership.
Surveyed agencies were split among those that use and reportonly unlinked trips (19 respondents) and those that report both linkedand unlinked trips (14 respondents). No agency reports only linkedtrips. Among those counting and reporting both linked and unlinkedtrips, there was a fairly uniform distribution of purposes. Unlinkedtrips are seen as a measure of transit utilization (at the system, route,or subroute level), while linked trips are used to measure revenuepassengers. The ratio of unlinked to linked trips indicates the relativeusage of transfers for the transit system. Data on linked trips aregenerally used only at the system level, while those for unlinked tripsare used at all levels.
USES OF RIDERSHIP DATA
System-Level Uses
In the survey, transit agencies were asked to report all purposesfor which ridership data are collected and used. Table 1 summarizesthe responses from the 33 agencies and indicates
that most agencies in the sample count passengers for a variety ofpurposes. The most common purposes were reported by at least 80percent of the agencies in the sample. At the system level, 28agencies (85 percent) collect ridership data to track systemwideridership totals. The other system-level purpose included in Table 1,to analyze origin-destination patterns, was reported by only 12systems (36 percent). Other system-level purposes include meetingfederal reporting requirements, checking operator compliance withfarebox procedures, and counting boardings by fare type.
TABLE 1PURPOSE OF PASSENGER COUNTING
Purposes Number ofSystems
Compile ridership by routeCompile ridership by tripTrack systemwide ridership totalsCompile boardings/alightings by stopMonitor passenger loads at maximum load pointsCompile ridership by day type and time periodCompile ridership by route segmentMonitor schedule adherenceAnalyze origin-destination patternsOther
323028282827262412 6
Agencies using more than one technique for collectingridership data were asked to indicate the purposes for which eachtechnique is used. The responses to this question are summarized bytechnique in the next chapter.
The survey also asked agencies for specific uses of ridershipdata. As shown in Table 2, there was little differentiation in usesamong agencies, with each use indicated by over 75 percent of allrespondents. At the system level, assessing changes in ridership is akey use of ridership data.
TABLE 2USES OF RIDERSHIP DATA
Uses Number of SystemsAssess changes in ridershipAdd or delete tripsRevise (change, continue or add) routesCalculate performance measuresAdjust running timesDetermine locations for bus sheltersOther
32313130272610
The organizational units most frequently using system-leveldata include budget and finance (which uses only system-level datain almost all agencies), planning, and scheduling. Over 90 percent ofagencies reported that budget and finance

8
TABLE 3NUMBER OF SYSTEMS USING RIDERSHIP DATA BY LEVEL OF DATA AND ORGANIZATIONAL UNIT
Organizational UnitSystemLevel
Route Level Trip LevelRoute
SegmentLevel
Bus Stop Level
Budget/Finance 30 5 0 0 0Planning 25 31 30 27 25Scheduling 10 28 30 26 20Computer Services/MIS 1 1 0 0 2Operations 2 3 3 2 5Marketing/Public Affairs 6 5 0 0 2Research/Analysis/Customer Service 4 3 3 3 4Senior Management 4 3 0 0 0Other 1 0 1 0 1
used system-level data. Table 3 shows use of ridership data by levelof data and by organizational unit.
Route-Level Uses
Compiling ridership by route is cited by 97 percent of agenciesas one purpose for counting passengers. Several other purposes listedin Table 1 are frequently carried out at the route level, includingmonitoring passenger loads at maximum load points (85 percent),compiling ridership by day type and time period (82 percent), andmonitoring schedule adherence (73 percent). Performance measuresare frequently calculated at the route level, and running timeadjustments, route revisions, and ridership trends also rely on route-level data.
The primary users of route-level data are the planning andscheduling units within an agency.
Trip-Level Users
Over 90 percent of respondents indicate that compilingridership by trip is one purpose of passenger counting. Varyingtechniques are used to count ridership at the trip level. Trip-levelanalysis is frequently carried out with regard to schedule adherenceand passenger loads.
Data at the trip level are used to add or delete trips and to adjustrunning times. As with route-level data, the planning and schedulingunits are the primary users of trip-level data.
Stop/Segment-Level Uses
Compiling boardings and alightings by stop is reported as adata collection purpose by 85 percent of all respondents, whilecompiling ridership by route segment is routinely carried out by 79percent of responding agencies. Stop-level data is very useful indetermining locations for bus shelters. Segment-level analysis istypically used in adjusting running times, but is also used in serviceplanning at some agencies as
a more refined method of assessing route performance and needs byroute segment.
Farebox-derived data are generally difficult to use at subroutelevels, such as for route segments or stops. Route segment data areused almost exclusively by planning and scheduling units or otherorganizational units involved in detailed service planning analysis.Stop-level data are used more broadly, in large part due to theusefulness of this level of data in making decisions regarding theplacement of bus shelters.
SUMMARY
Why collect ridership data? The foregoing discussion suggestsfour answers:
• To report to external funding and oversight agencies (e.g.,federal, state, and local governments; regional authorities;metropolitan planning organizations);
• To monitor trends over time;• To analyze usage and performance at various levels with
the overall goal of enhancing efficiency and effectiveness;• To identify locations with the greatest boarding and
alighting activity, often in relation to the provision of passengeramenities.
As a general rule (and there are many exceptions), smallertransit agencies in stable environments tend to collect and utilizeridership data at the macro levels (system and route) that can often becollected through the farebox. As systems grow larger and morecomplex, and as operating budgets tighten, agencies have a greaterinterest in micro-level data (route by time of day, segment, and stop)that may require a range of collection technologies and procedures,but that in turn permit a finer level of analysis and greater technicalsupport for targeted recommendations for change. Perhaps the keyfactor in determining the level of detail at which ridership data arecollected and analyzed is the agency's proactiveness in making minorand major changes to its system.

9
CHAPTER THREE
PASSENGER COUNTING TECHNOLOGIES AND PROCEDURES
This chapter summarizes the current state of the practice incounting transit riders. General methodological issues, such as thefrequency of ridership counts at the system, route, and subroutelevels and the use of sampling versus one hundred percent counts, areaddressed first. The chapter then summarizes the extent of usage ofthree different procedures (manual, electronic fare collection, andAPC) to count ridership. Capabilities, strengths, and weaknesses ofeach technology, as noted by users, are reported, and current plansfor adopting new passenger counting technologies are indicated. Thesurvey of transit agencies is the primary source of data used in thischapter. Case study findings are included as appropriate.
FREQUENCY OF RIDERSHIP COUNTS
Different types of data are required for different reportingperiods. For example, systemwide ridership data may be reportedmonthly, while trip-level data may be needed for each servicechange. The survey asked agencies how often they counted andsummarized ridership at various levels. System-level ridership iscounted on a regular and frequent basis, with over 50 percent of theagencies reporting daily counts and 33 percent reporting monthlycounts. At the route level, 48 percent of agencies count andsummarize ridership on a daily or monthly basis, and 24 percentcount ridership each service change (typically three or four times peryear). The majority of systems count ridership below the route levelinfrequently or only as needed. Table 4 summarizes surveyresponses.
The service change interval of counting ridership is interestingfrom the service planning perspective, because this is the mostfrequent interval feasible for analyzing ridership data at the route andsubroute levels. Approximately one-quarter to one-third ofrespondents report this interval for route and trip-level ridership andfor ridership at maximum load points. Of these respondents whocount riders at service change intervals, approximately 70 percent areusing or testing APC equipment.
The survey also asked agencies how often ridership on anygiven route was counted and analyzed for service planning or
schedule purposes. Half of the systems responding report thatweekday ridership is counted at intervals of one year or greater,although 27 percent count weekday ridership at each service changeinterval. Saturday and Sunday counts occur less often, withapproximately 30 percent of agencies counting weekend ridershiponly on an as-needed basis.
ONE HUNDRED PERCENT VERSUS SAMPLECOUNTS
The standard approach to counting passengers has been toconduct a 100 percent count within a relatively short timeframe (e.g.,4 to 6 weeks) on any given route. Some agencies will use a sample oftrips for ridership counts. At more aggregate levels (system androute), agencies with electronic registering fareboxes often estimateridership by factoring total revenue.
At the system level, 48 percent of the agencies in our samplereport factoring ridership from revenue totals, while 42 percentconduct complete counts, usually by tracking all ERF-recordedboardings. At all other levels (route, trip, route segment, and stop),the majority of agencies conduct 100 percent counts, although aboutone-third of all agencies report the use of samples for countingridership by trip, route segment, and stop.
Agencies use a variety of factoring and sampling techniques.While no one technique emerged as typical, a common approach is tostratify revenue totals by fare payment category and use averagefares for each category to calculate ridership. Another method usedby agencies with APC is to rotate APC buses throughout the systemin order to sample every trip a certain number of times over a giventimeframe.
PASSENGER COUNTING TECHNOLOGIES ANDPROCEDURES
Table 5 presents survey results related to how passengers arecounted by the various transit agencies. These results are
TABLE 4FREQUENCY OF RIDERSHIP COUNTS BY LEVEL OF DATA
Level of Data Daily Monthly At Service Changes As Needed/OtherSystem 17 11 0 3Route 9 7 8 9Trip 3 1 8 21Route Segment 0 1 3 25Stop Boardings and Alightings 0 1 3 27Maximum Load Points 1 1 11 18
10
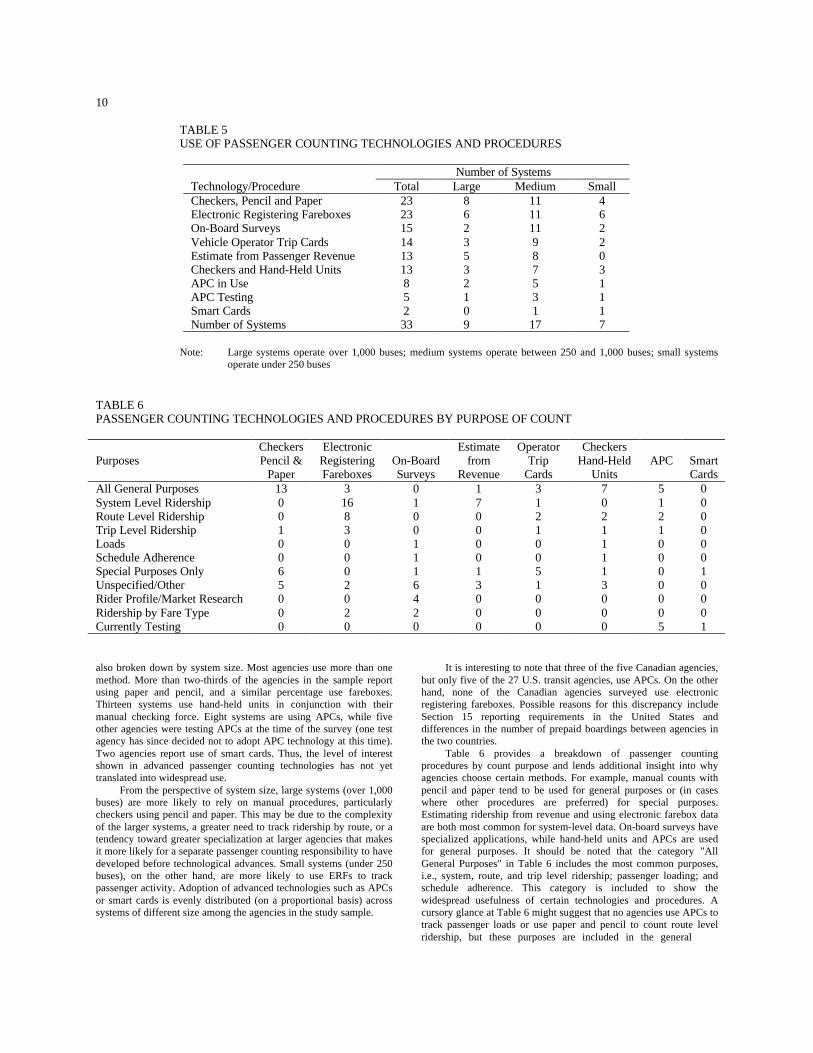
TABLE 5USE OF PASSENGER COUNTING TECHNOLOGIES AND PROCEDURES
Number of SystemsTechnology/Procedure Total Large Medium SmallCheckers, Pencil and Paper 23 8 11 4Electronic Registering Fareboxes 23 6 11 6On-Board Surveys 15 2 11 2Vehicle Operator Trip Cards 14 3 9 2Estimate from Passenger Revenue 13 5 8 0Checkers and Hand-Held Units 13 3 7 3APC in Use 8 2 5 1APC Testing 5 1 3 1Smart Cards 2 0 1 1Number of Systems 33 9 17 7
Note: Large systems operate over 1,000 buses; medium systems operate between 250 and 1,000 buses; small systemsoperate under 250 buses
TABLE 6PASSENGER COUNTING TECHNOLOGIES AND PROCEDURES BY PURPOSE OF COUNT
PurposesCheckersPencil &
Paper
ElectronicRegisteringFareboxes
On-BoardSurveys
Estimatefrom
Revenue
OperatorTrip
Cards
CheckersHand-Held
UnitsAPC Smart
CardsAll General Purposes 13 3 0 1 3 7 5 0System Level Ridership 0 16 1 7 1 0 1 0Route Level Ridership 0 8 0 0 2 2 2 0Trip Level Ridership 1 3 0 0 1 1 1 0Loads 0 0 1 0 0 1 0 0Schedule Adherence 0 0 1 0 0 1 0 0Special Purposes Only 6 0 1 1 5 1 0 1Unspecified/Other 5 2 6 3 1 3 0 0Rider Profile/Market Research 0 0 4 0 0 0 0 0Ridership by Fare Type 0 2 2 0 0 0 0 0Currently Testing 0 0 0 0 0 0 5 1
also broken down by system size. Most agencies use more than onemethod. More than two-thirds of the agencies in the sample reportusing paper and pencil, and a similar percentage use fareboxes.Thirteen systems use hand-held units in conjunction with theirmanual checking force. Eight systems are using APCs, while fiveother agencies were testing APCs at the time of the survey (one testagency has since decided not to adopt APC technology at this time).Two agencies report use of smart cards. Thus, the level of interestshown in advanced passenger counting technologies has not yettranslated into widespread use.
From the perspective of system size, large systems (over 1,000buses) are more likely to rely on manual procedures, particularlycheckers using pencil and paper. This may be due to the complexityof the larger systems, a greater need to track ridership by route, or atendency toward greater specialization at larger agencies that makesit more likely for a separate passenger counting responsibility to havedeveloped before technological advances. Small systems (under 250buses), on the other hand, are more likely to use ERFs to trackpassenger activity. Adoption of advanced technologies such as APCsor smart cards is evenly distributed (on a proportional basis) acrosssystems of different size among the agencies in the study sample.
It is interesting to note that three of the five Canadian agencies,but only five of the 27 U.S. transit agencies, use APCs. On the otherhand, none of the Canadian agencies surveyed use electronicregistering fareboxes. Possible reasons for this discrepancy includeSection 15 reporting requirements in the United States anddifferences in the number of prepaid boardings between agencies inthe two countries.
Table 6 provides a breakdown of passenger countingprocedures by count purpose and lends additional insight into whyagencies choose certain methods. For example, manual counts withpencil and paper tend to be used for general purposes or (in caseswhere other procedures are preferred) for special purposes.Estimating ridership from revenue and using electronic farebox dataare both most common for system-level data. On-board surveys havespecialized applications, while hand-held units and APCs are usedfor general purposes. It should be noted that the category "AllGeneral Purposes" in Table 6 includes the most common purposes,i.e., system, route, and trip level ridership; passenger loading; andschedule adherence. This category is included to show thewidespread usefulness of certain technologies and procedures. Acursory glance at Table 6 might suggest that no agencies use APCs totrack passenger loads or use paper and pencil to count route levelridership, but these purposes are included in the general

11
purposes category. Thus, in reading the table the reader must keep inmind the inclusive nature of the "All General Purposes" category.
Each of the following sections of this chapter focuses on aspecific category of passenger counting technology (manual,electronic registering farebox, smart card, and APC). Surveyresponses from agencies currently using or testing these varioustechnologies are summarized. The usefulness of a particulartechnique varies, depending on the level of ridership data sought.Non-manual techniques are rated in terms of usefulness andsatisfaction. Respondents listed benefits associated with eachtechnique and offered advice for other agencies considering thespecific technology. Problems encountered with all methods ofcounting riders are presented as well. The final section compares userresponses across the different categories of technologies andprocedures.
Manual Technologies and Procedures
Virtually every agency responding to the survey uses manualdata collection for some purpose, even if it is not the primary datacollection technology. Manual procedures are often the base againstwhich other technologies are compared. The following proceduresare included in this category:
• Estimating ridership from passenger revenue• Using vehicle operator trip cards• Using traffic checkers, pencil and paper• Using traffic checkers and hand-held units• Distributing on-board surveys.
Estimating ridership from passenger revenue could also becategorized under electronic registering fareboxes, but historicallyhas been done on the basis of manual revenue counts without ERFs.
Twenty-three systems answered questions in this portion of thesurvey. Those agencies that make only occasional use of manualpassenger counting procedures did not respond and thus are notincluded in this summary. The comments and responses for manualdata collection technologies and procedures thus are indicative ofthose systems that rely on these tools for collecting ridership data.
Manual data collection is rated as most useful at moredisaggregate levels (i.e., route segment, stop and trip levels). Manualtechniques are moderately useful for collecting route-level data, butare not particularly well-suited for gathering system-levelinformation.
A key benefit of manual passenger counting is that it is a well-established method that does not require special technologicalknowledge or extensive capital expenditures. Manual counting is notcontroversial and does not generally require a re-thinking of howdata are organized and analyzed within an agency. The use of hand-held units is a partial exception. Agencies with hand-held units havereorganized the data input function, and in some cases the increasedavailability and timeliness of detailed ridership data have affectedanalytical techniques and procedures.
Major problems encountered with manual collection techniquesfall into four main categories:
• Accuracy and consistency of the data• Labor intensiveness of manual techniques• Reliability of the traffic checkers• Cost and consequent limitations on data collection
resources.
Accuracy is a major concern in any data collection effort. Theuse of manual techniques can result in errors at the initial collectionlevel (i.e., by the traffic checkers), and these errors tend to be randomin nature. Transcription of manually collected data in the data inputstage is a second source of error. Agencies invest time in trainingpersonnel, but a "burnout" factor among traffic checkers that affectsreliability of data has been noted and requires consistent supervision.Hand-held units (which include units manufactured specifically fordata collection, laptop computers, and palmtop computers) eliminatedata transcription, but introduce programming and operationalcomplexities.
Manual passenger counting is a very labor-intensive and time-consuming activity. The traffic checkers who ride the buses orconduct point checks at key locations form a large portion of thelabor required, but professional staff time must also be invested inpreparing assignments, checking for accuracy, and supervising thecheckers. In some agencies, work rule restrictions affect the efficientassignment of traffic checkers. The process of editing and cleaningthe data to ensure accuracy and entering the data into a computerizedformat can constitute a major share of the time involved in theoverall passenger counting process. All of these factors reduce thefrequency of route checks, the productivity of professional staff, andthe timeliness of the collected and processed data. Shortage ofqualified personnel is reported as a factor contributing to theseproblems.
Reliability of the checkers affects the first two problemsdiscussed in relation to manual passenger counting procedures.Absenteeism is a recurring problem. Fitting assignment make-upsinto an established schedule is not always possible, resulting inmissed data and a less than 100 percent ridecheck.
The limited resources available, both in personnel and fiscalterms, hinders effective manual data collection efforts. Manyagencies that rely on manual data collection have seen their trafficchecker forces reduced in number as budgets have tightened in thepast several years. A contributing factor is the frequency of high-level requests for special checks that disrupt the established datacollection schedule. A successful manual data collection program isnot cheap to operate. Controlling costs while maintaining therequired quantity and accuracy of data is a major challenge.
Beyond these considerations, however, several agencies thatcount passengers manually are very satisfied with the results and donot see clear benefits for themselves from proposed moves to newtechnologies that permit more frequent data collection. Manyagencies have established schedules for periodic analysis andevaluation of routes that adequately meet the transit agency's needs.Some concern has been expressed

12
regarding the ability of agencies to make use of additional ridershipdata, given limited resources and staff.
This does not mean that there is no interest in other datacollection technologies among agencies that currently collectridership data manually. Only one agency indicated that there hasbeen no consideration of other technologies. Hand-held units andAPC systems were most frequently mentioned as having beenconsidered, and half of all respondents in this area indicated aninterest in electronic fare collection (fareboxes and/or smart cards).Roughly 40 percent of agencies have rejected at least one passengercounting technology. Reasons for rejection include cost, reliability,practicality, and selection or testing of other options.
Approximately 50 percent of systems in the manual categoryare planning to purchase new passenger counting technologies,primarily APC units. At nine agencies, investment in newtechnologies is still being decided, although certain options may havebeen rejected already. Agencies express a strong interest in obtainingadditional information regarding vendors, current users and theirexperiences, availability, software interfaces, and vendor support.The ability to duplicate and improve on current data collectionactivities is also of interest.
In summary, 70 percent of agencies responding to the surveyare still collecting at least a significant portion of their ridership datamanually. Manual techniques are seen as very useful at moredisaggregate levels of data collection, and as well-established andrelatively straightforward. Areas of concern include data accuracy,labor intensiveness, reliability of traffic checkers, and limitedresources. Most agencies have at least considered other passengercounting technologies, and 50 percent plan to make the investment.Information regarding vendors, available technologies, andexperiences of other transit agencies is reported to be of greatest useto transit agencies.
Electronic Registering Fareboxes
Electronic registering fareboxes (ERFs) are much morecommonplace in the United States, than in Canada. A total of 23agencies (all in the United States) completed this section of thesurvey. GFI and Cubic are the predominant manufacturers offareboxes used by agencies in this sample, with well over half (17 of20 specifying a particular manufacturer) using GFI fareboxes.Revenue issues and related concerns (including revenue control andaccountability) played a much larger role than collection of ridershipdata in the decision to purchase ERFs, but agencies have utilized theability to count passengers with this technology.
Ridership data are accumulated in a variety of ways; the mostcommon are by bus block or run assignment and by operator runassignment with route and trip segmentation. The accuracy offarebox data is most commonly verified by a comparison withrevenue or with manual counts. Pass boardings can be problematicbecause they require operator intervention to be recorded.
As with the introduction of any new technology, a "debugging"period occurs in which employees become familiar with the newequipment and start-up problems are addressed.
The average length of the debugging period for ERFs is just under 18months, with a range from 6 weeks to 6 years. Several agenciesreport an ongoing need to train new operators and to work outproblems related to changes in fare media. One agency has hadconsiderable success by including preprinted trip numbers and farecategories on the operator paddles.
The usefulness of ERFs is greatest at aggregate levels of datacollection. Respondents rated ERFs very highly for collectingsystem-level data, and above average for route-level data. Fareboxesare least useful at the stop or route segment level, and were ratedbelow average at the trip level.
On average, agencies with ERFs are satisfied with theperformance of this equipment in terms of counting passengers. Sixagencies expressed some dissatisfaction, but there was no "verydissatisfied" response.
Primary benefits of ERFs include the collection of greaterquantities of data at greater levels of detail. The ability to countridership by route, trip, block, and fare category was mentionedrepeatedly by transit agencies, who also noted improved accuracyand reliability as well as better access to data. Information regardingboardings by fare category is often of interest to marketingpersonnel. Improvements in accountability and revenue control arealso seen as important benefits.
Problems encountered with ERFs include the following:
• Mechanical/equipment problems• Operator compliance• Software problems• Accuracy of ridership data.
Mechanical problems include currency jams, aging coinmechanisms, difficulty reading swipe cards, overloaded vaults, andreliability of the time/date stamp that records when trips were made.Agencies reported that some of these difficulties were solved to agreat extent over time (more frequent cleaning of the heads on swipecard readers was a notable example), while others such as currencyjams appeared to be chronic problems. Mechanical problems are notdirectly related to collection of ridership data, but are a source ofconcern to the agencies.
Bus operator compliance and attitudes are key issues inensuring the usefulness of farebox data. Operators must enter specificcodes at the beginning of their shifts and at the start of each new tripto tie fares to specific blocks and trips. Operators also need to recordnon-cash boardings using specific keys on the keypad. Theseadditional operator duties frequently must be agreed to in negotiationwith their union representatives. Lack of compliance can rendermuch of the data useless. A contributing factor is that problems withoperator compliance are non-random, i.e., data on specific tripsdriven by specific operators are consistently missing or inaccurate.One transit property noted that the first operator to take a bus out inthe morning generally enters correct data, but that the level ofcompliance declines with subsequent reliefs. At another agency,Route 0 often has the highest ridership on daily printouts of ERFdata.
Mechanical difficulties and operator compliance were mostfrequently cited as problem areas with ERFs. Software problemsprimarily concerned limited data manipulation capabilities

13
and difficulties with information retrieval and reports at the routelevel. Accuracy issues, related to operator compliance and softwareissues, were raised as a problem (although several agencies also citedincreased accuracy as a benefit of ERFs). Incomplete data and trip-by-trip inconsistencies in ridership counts contributed to concernsover accuracy, and the verification of ridership data was alsoproblematic.
Comprehensive, ongoing training for bus operators is critical interms of maximizing the benefits of ERFs. The agencies that havebeen most successful are those that have developed internal programsto access and analyze ridership data. Complex fare structures canlimit the effectiveness of ERFs in counting passengers. Specificresponsibilities and policies for collecting and analyzing data shouldbe established prior to implementation. One policy should be to testfrequently for accuracy.
In summary, electronic registering fareboxes receive highmarks for obtaining aggregate-level (system or route) ridership data,although they are not the appropriate technology to collect detailedridership information. Operators can make or break ERF datacollection efforts. There is a consequent need for comprehensive andcontinuous training, particularly when new fare media areintroduced. Processing of ERF-generated data is a key issue that canbe overlooked during implementation. Effective software,establishment of clear responsibilities and policies, and ongoing testsfor accuracy enhance the usefulness of ERFs.
Smart Cards
The use of smart cards by transit agencies is still at thedemonstration or early implementation stage, and so there is littleinformation to report at this time. Only three agencies (South CoastArea Transit, Seattle Metro, and Pierce Transit) responding to thesurvey reported even limited experience in demonstration projectsregarding the use of smart cards on buses, although MARTA inAtlanta began use of a bank card as a smart card on its rail system inconjunction with the 1996 Summer Olympics. Preliminary findings,with the emphasis on "preliminary," related to smart cards aresummarized in the following paragraphs.
Agencies that have tested smart cards are very positive abouttheir experiences and the potential of this technology. Of course, thebenefits of smart cards are not primarily in the area of passengercounting, but they do offer the ability to obtain stop data for ridersusing smart cards as their fare payment method. Problems identifiedin demonstration projects to date include a lack of integration withthe farebox and other onboard equipment and software, softwarebugs, data retrieval (particularly the need for training), and hardwareproblems. Agencies contemplating smart cards should be verydeliberate in system design and (in the words of personnel at onedemonstration site) "Don't believe anyone who tells you that it'ssimple." The time commitment for training personnel in retrievingand formatting data, and in performing these functions, can beextensive. Maintenance Department's support for installation andmaintenance of additional equipment strongly influences thetransition to smart cards. To gain their support,
operators also need to be informed of the value of smart cards.Agencies without ERFs would require operator intervention to recordcash fares in a smart card system, and experience at demonstrationsites shows that operators are the ones who must deal with passengercomplaints regarding smart card malfunctions.
In general, passenger counting is not expected to be a majorfactor in the decision to use smart cards. As is the case with ERFs,adoption of this technology will be driven by other factors, but therewill be ancillary benefits in terms of collecting ridership data. Thedemonstration projects conducted to date suggest that smart cardpenetration among transit users will need to be much greater toprovide any meaningful ridership data beyond how many people areusing smart cards.
Automatic Passenger Counting
APC units have the ability to count passengers as they boardand alight a bus as well as to record times at each stop, and thus canprovide disaggregate data well suited for service planning andscheduling purposes. Thirteen agencies (three in Canada, 10 in theUnited States) report using APCs. Eight of these agencies can beclassified as regular APC users, while five others were in thedemonstration phase at the time of the survey.
APC units are not needed on every bus in the fleet. The eightagencies that make regular use of APCs equip about 10 percent oftheir fleet with APC units, and rotate this segment of the fleetthroughout the routes in the system. Demonstration agenciestypically equip two percent of their fleet, although one of the smalleragencies was able to equip 20 percent of its fleet with APC units.
APCs count passengers in two different ways. Infrared beamsare used in seven systems included in the study sample. These beamscross the stairwells at waist-high level. As passengers board andalight, the beams are broken (in a different order for boardings andalightings), and passenger activity is recorded (8). Treadle mats areused in six systems included in the study sample. The mats aremounted to the vehicle steps and contain switches that close whenthe mat is stepped on. The transitions of closing and openingswitches and the times between them determine passenger flows (6).In certain climates, treadle mats can be difficult to maintain, but mostobservers report no difference in accuracy between the twotechnologies.
A means of ascertaining location is required, so that theboardings and alightings can be matched to a particular stop. Six ofthe 13 APC systems are signpost-based. The signposts calibratelocation along a route, and the mileage before or after the signpost isused to locate the particular stop. Five agencies use some sort ofglobal positioning system (GPS) that locates the bus via satellite.One agency reports having used both methods, and one of thedemonstration agencies relied on bus mileage to locate the vehicles.Signpost and GPS systems both have their advocates. There appearsto be a trend toward GPS among transit agencies recently purchasingor considering the purchase of an APC system.
Tri-County Metropolitan Transportation District of Oregon(Tri-Met) in Portland is one of the case study agencies discussed indetail in chapter 7. Tri-Met is in the process of
14
switching its APCs from signposts to GPS, and reports that theintegration of APC with the new automatic vehicle location (AVL)system being installed in the buses results in much lower unit costsfor the APCs, because the vehicle location component is no longerneeded within the APC unit. Locational referencing problems aremore common on systems without AVL.
The break-in or debugging period for APCs averages 17months, very similar to the average for electronic fareboxes. It ispossible that any new passenger counting technology would have asimilar period of adjustment.
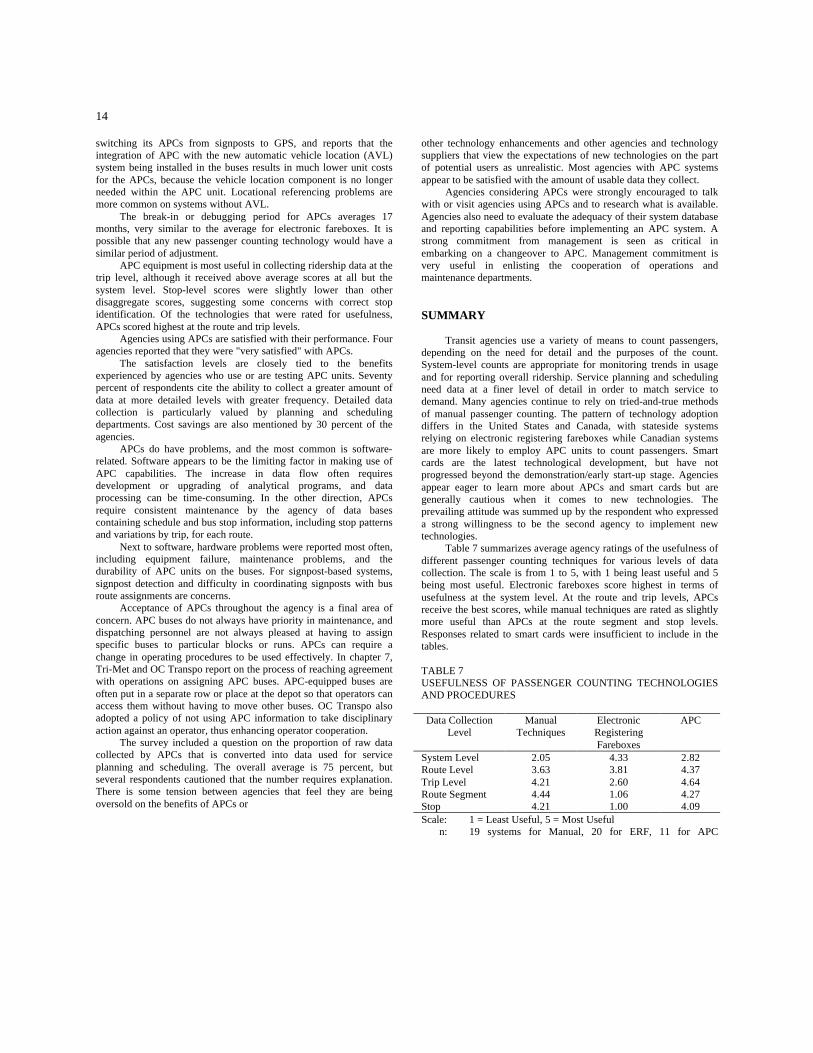
APC equipment is most useful in collecting ridership data at thetrip level, although it received above average scores at all but thesystem level. Stop-level scores were slightly lower than otherdisaggregate scores, suggesting some concerns with correct stopidentification. Of the technologies that were rated for usefulness,APCs scored highest at the route and trip levels.
Agencies using APCs are satisfied with their performance. Fouragencies reported that they were "very satisfied" with APCs.
The satisfaction levels are closely tied to the benefitsexperienced by agencies who use or are testing APC units. Seventypercent of respondents cite the ability to collect a greater amount ofdata at more detailed levels with greater frequency. Detailed datacollection is particularly valued by planning and schedulingdepartments. Cost savings are also mentioned by 30 percent of theagencies.
APCs do have problems, and the most common is software-related. Software appears to be the limiting factor in making use ofAPC capabilities. The increase in data flow often requiresdevelopment or upgrading of analytical programs, and dataprocessing can be time-consuming. In the other direction, APCsrequire consistent maintenance by the agency of data basescontaining schedule and bus stop information, including stop patternsand variations by trip, for each route.
Next to software, hardware problems were reported most often,including equipment failure, maintenance problems, and thedurability of APC units on the buses. For signpost-based systems,signpost detection and difficulty in coordinating signposts with busroute assignments are concerns.
Acceptance of APCs throughout the agency is a final area ofconcern. APC buses do not always have priority in maintenance, anddispatching personnel are not always pleased at having to assignspecific buses to particular blocks or runs. APCs can require achange in operating procedures to be used effectively. In chapter 7,Tri-Met and OC Transpo report on the process of reaching agreementwith operations on assigning APC buses. APC-equipped buses areoften put in a separate row or place at the depot so that operators canaccess them without having to move other buses. OC Transpo alsoadopted a policy of not using APC information to take disciplinaryaction against an operator, thus enhancing operator cooperation.
The survey included a question on the proportion of raw datacollected by APCs that is converted into data used for serviceplanning and scheduling. The overall average is 75 percent, butseveral respondents cautioned that the number requires explanation.There is some tension between agencies that feel they are beingoversold on the benefits of APCs or
other technology enhancements and other agencies and technologysuppliers that view the expectations of new technologies on the partof potential users as unrealistic. Most agencies with APC systemsappear to be satisfied with the amount of usable data they collect.
Agencies considering APCs were strongly encouraged to talkwith or visit agencies using APCs and to research what is available.Agencies also need to evaluate the adequacy of their system databaseand reporting capabilities before implementing an APC system. Astrong commitment from management is seen as critical inembarking on a changeover to APC. Management commitment isvery useful in enlisting the cooperation of operations andmaintenance departments.
SUMMARY
Transit agencies use a variety of means to count passengers,depending on the need for detail and the purposes of the count.System-level counts are appropriate for monitoring trends in usageand for reporting overall ridership. Service planning and schedulingneed data at a finer level of detail in order to match service todemand. Many agencies continue to rely on tried-and-true methodsof manual passenger counting. The pattern of technology adoptiondiffers in the United States and Canada, with stateside systemsrelying on electronic registering fareboxes while Canadian systemsare more likely to employ APC units to count passengers. Smartcards are the latest technological development, but have notprogressed beyond the demonstration/early start-up stage. Agenciesappear eager to learn more about APCs and smart cards but aregenerally cautious when it comes to new technologies. Theprevailing attitude was summed up by the respondent who expresseda strong willingness to be the second agency to implement newtechnologies.
Table 7 summarizes average agency ratings of the usefulness ofdifferent passenger counting techniques for various levels of datacollection. The scale is from 1 to 5, with 1 being least useful and 5being most useful. Electronic fareboxes score highest in terms ofusefulness at the system level. At the route and trip levels, APCsreceive the best scores, while manual techniques are rated as slightlymore useful than APCs at the route segment and stop levels.Responses related to smart cards were insufficient to include in thetables.
TABLE 7USEFULNESS OF PASSENGER COUNTING TECHNOLOGIESAND PROCEDURES
Data CollectionLevel
ManualTechniques
ElectronicRegisteringFareboxes
APC
System Level 2.05 4.33 2.82Route Level 3.63 3.81 4.37Trip Level 4.21 2.60 4.64Route Segment 4.44 1.06 4.27Stop 4.21 1.00 4.09Scale: 1 = Least Useful, 5 = Most Useful
n: 19 systems for Manual, 20 for ERF, 11 for APC

15
CHAPTER FOUR
PROCESSING AND REPORTING
This chapter addresses post-counting issues related to datainput, validation, and reports. These areas are not a primary focus ofthe synthesis, but must be included in any discussion of passengercounting techniques because the processing and reporting of dataaffect their usefulness for the agency involved.
DATA INPUT
Automated input of ridership data is one area in which hand-held units, ERFs, and APCs have a clear advantage over manualtechniques. Even agencies that have established successful manuallybased data collection programs are very interested in automating thedata input function. Nearly all of the agencies that count ridersmanually also use a manual process in which completed checkerforms are given to clerical personnel to input into the computer.Toronto Transit Commission relies exclusively on an opticalcharacter reader (OCR) for data input, with few other agenciestesting OCR technology.
Agencies that collect ridership data using hand-held units areevenly split with regard to data input procedures. Slightly over halfof the agencies transmit data via a physical connection, while slightlyunder half have established remote data transmission capabilities(usually via a modem). With remote data transmission, the checkerscan also get their next assignments via modem, and thus are notrequired to report to the office. This is sometimes viewed as abenefit, and sometimes as a disadvantage.
For electronic registering fareboxes, a probe of the farebox atthe garage is by far the most common means of transferring data tothe host computer. Five systems report retrieval of data at the garagewithout a physical connection (including one system that retrievessmart card data), and two report dynamic or periodic remote retrievalof farebox data.
Of the eight systems using APCs, half retrieve the APC data atthe garage without a physical connection. The others either establisha direct downlink at the garage or transmit data remotely via radiowhile the bus is on the street. All three of these techniques are usedby at least one of the five systems testing APCs. Automated datainput is frequently cited as a major benefit of technology-basedoptions for counting ridership.
Automated procedures are seen as eliminating a source of erroras well as a major bottleneck in the overall process of collecting andanalyzing ridership data. The decrease in turnaround time cited forvarious data collection technologies is closely related to automateddata input.
DATA VALIDATION
Validating ridership data is important to ensure data quality, butcan be difficult because of normal day-to-day variations as
well as seasonal or weekly effects (for example, many agenciesreport that ridership is greater on the first few days of the month thanat the end of the month). Data validation can take place at the route,time-of-day, or trip level. Few if any agencies rely on a single meansof validation. The most common step cited is to compare withprevious counts to establish that the order of magnitude is correct.Agencies often rely on the professional judgment of planners,schedulers, and others responsible for the route to determine thevalidity of ridership data. Experienced transit personnel can veryquickly sense problems with ridership data. Other validationtechniques include a comparison of ridership and revenue totals andexamination of trip-level data to see if there are unexplainedvariations across trips.
Agencies take a variety of approaches to the issue of datavalidation. One approach is to check ridership for reasonableness interms of order of magnitude. This approach does not involve detailedscrutiny under the assumption that small errors tend to cancel out.There is also a sense that small differences in ridership or averageloads will not affect service planning and scheduling decisionsregarding a particular route. A second approach is to analyze trip-by-trip ridership counts in detail to determine accuracy, and to makeadjustments where necessary. Practitioners of this approach arguethat ridership data are frequently used to answer future unanticipatedquestions and thus need to be as accurate as possible. There are alsoagencies that do not have the personnel available to conduct anythingmore than very cursory checks of ridership data. Some agencies takea random sample of trips and analyze these in detail to gauge overallaccuracy and to identify problems in this area. There are likely to beother approaches not revealed by this sample of transit agencies. Theultimate use of ridership data and the availability of resources todevote to data validation are major considerations in determining theapproach taken.
Automated data input procedures often include a validationcomponent based on thresholds. Trips that fall outside establishedthresholds are flagged for manual inspection and editing. Someautomated programs search for errors such as mismatches in totalboardings and alightings on a trip or negative loads at any point on atrip, and may contain algorithms for making minor correctionswithout manual intervention and/or for discarding data withunexplained discrepancies. An immense amount of effort is neededto validate ridership data at the trip level, making automatedvalidation components extremely useful.
DATA REPORTS
Transit agencies generate a variety of reports based on theridership data as well as on other information gathered concurrently.Reports on system-level ridership are typically

16
generated from ERF data or derived from revenue extrapolation andare most commonly prepared on a monthly basis. Route-levelridership reports use both ERF and boarding/alighting data and aretypically prepared monthly or quarterly. Performance reports also useboth ERF and boarding/alighting data and are prepared monthly,quarterly, or annually. Reports at the route segment level are notusually scheduled but are prepared as needed. Stop-level data aresummarized and reported annually at some agencies, although it ismore common to prepare stop-level reports on an as needed basis.Schedule adherence reports were cited least often among the sixcategories specified here and on the survey, but are still prepared bya majority of responding agencies. No particular pattern emergedwith regard to the timing and frequency of schedule adherencereports.
The majority of agencies developed data processing and reportgeneration software using in-house programming expertise, usually(but not always) in the MIS or computer services department. Thoseagencies that developed processing and reporting software throughan outside vendor reported considerable customization ormodification of the software. In many cases, regardless of theoriginal source of the software, ongoing modification appears to bethe rule rather than the exception.
The ability to query the ridership database becomesincreasingly important as data users increase their understanding ofthe system and begin to ask new types of questions. The majority ofagencies have built a query component into their ridership database.Some prefer to have the end users query the database directly, whileother agencies have a database manager who handles all specialrequests.
SUMMARY
Processing and reporting procedures, while not directly relatedto the topic of this synthesis, are important in terms of enhancing theusefulness of ridership data within a transit agency. Automated datainput technologies increase accuracy and decrease turnaround timefor processing data. Agencies take several approaches to theverification of ridership data, usually involving a cross-check eitherto previous counts or to counts done by other means. Aggregate-leveldata tend to be reported more frequently and regularly, but the abilityto query the ridership database on an ad hoc basis gives the plannersand schedulers, who usually have the greatest need for detailed data,access at any time.

17
CHAPTER FIVE
ORGANIZATION AND RESOURCE REQUIREMENTS
Organizational issues have a potentially strong effect on thesuccess of ridership data collection, particularly in cases where newtechnologies are being introduced. More complex passenger countingtechnologies and procedures necessarily involve a broader segmentof the transit agency. This chapter examines organizationalresponsibilities for the collection of ridership data. In addition, theneed for involving different departments, depending on technology,is considered. Staff requirements for implementing a passengercounting program are summarized, along with the cost. It should benoted, however, that costs reported by transit agencies varied,depending on the methods and assumptions used. Some agencieswere able to go into great detail regarding operating costs; someappeared to lump costs related to the analysis of ridership data inwith broader planning and scheduling functions and did not provide abreakout; other agencies reported no information on certain costs. Inthe cost discussion, averages, medians, and ranges are used toprovide as complete a picture as possible with limited data, but thereader is cautioned that cost data are neither uniform nor complete.
ORGANIZATION
Planning and (to a lesser extent) Scheduling departments aretypically responsible for all aspects of ridership data collection,including overall methodology, selection of data to be collected,system set-up and implementation, and day-to-day management.Budget and Finance departments are most likely to take part indecisions regarding overall methodology (due to the costimplications) and day-to-day management. The Computer Servicesor MIS department is heavily involved in system set-up andimplementation. Specialized departments dealing with research,analysis, transit studies, or strategic planning can also haveresponsibilities in these areas.
Very few agencies cite specific responsibilities assigned to theOperations and Maintenance departments with regard to passengercounting. Experience indicates that these departments have a strongeffect on successful implementation of new technologies, particularlyAPCs and electronic registering fareboxes. Both technologies presentunique maintenance problems, and often the Maintenance departmentis not inclined to assign a particularly high priority to these problems.Operations must ensure that its personnel are trained to use ERFscorrectly, and must re-train the operators when changes are made tothe fare structure. The dispatch function is critical to ensuring thatAPC-equipped buses are assigned to routes where ridership data arerequired. One common theme in the questionnaires and the casestudies is that the entire agency must be sold on the purposes andbenefits of passenger counting technology. This effort shouldnaturally focus on the
departments whose cooperation is essential but whoseresponsibilities are limited to particular elements of the system.
Almost half of the agencies report that the data users aredifferent from those responsible for the data collection process. Theneed to clarify responsibilities for various aspects of data collectionis one element in avoiding problems that can arise in the separationof functions. Keeping open channels of communication among thevarious departments involved in aspects of passenger counting is alsomentioned.
STAFFING
Survey respondents were asked to estimate the number of staff(in terms of full-time equivalents (FTEs)) assigned to carry out thepassenger counting program in five separate categories:managers/professionals; support (maintenance); clerical; trafficcheckers; and other. The overall average is 14 FTEs, with a medianof seven (indicating that the average is pulled up by a few systemswith many employees).
Agencies were then categorized by primary passenger countingtechnology. Manual and ERF agencies could not be totally separated,because several rely on both techniques. Not surprisingly, agencieswith manual procedures had the highest average(17) and median (10.5) number of employees, due primarily to thenumber of checkers (average = 11; median = 7). The average andmedian number of employees assigned to carry out the passengercounting program are broken down by type of passenger countingtechnology in Table 8.
To control for the size of agencies, the results in Table 8 arealso presented for large, medium, and small agencies as determinedby the number of buses. Within each agency size grouping, theoverall pattern of fewer employees associated with advancedtechnology (in this case, APC) was consistent.
Agencies that changed to a more automated data collectiontechnology were asked if the shift resulted in any headcountreductions or additions. The primary area where reductions tookplace, not surprisingly, was in the checker force. Six agenciesreported an average decrease of 10 checkers and one supervisor witha change in passenger counting procedures. Four agencies reportedadding an average of one or two programmers or technicians. A shiftto more automated data collection was accompanied by a need toenhance computer and analytical skills.
COST
As noted in the introduction to this section, cost data from thesurvey are not completely reliable. There is considerable variationacross agencies, and not all agencies reported costs

18
TABLE 8AVERAGE AND MEDIAN NUMBER OF EMPLOYEES ASSIGNED TO PASSENGER COUNTING BY PASSENGERCOUNTING TECHNOLOGY
Number of EmployeesTotal Large Agencies Median Agencies Small AgenciesTechnology
Average Median Average Median Average Median Average MedianManual 17.2 10.5 23.2 23.9 16.4 8.0 2.8 2.8Hand-held units 17.8 9.0 38.5 38.5 8.5 8.5 6.3 6.3ERF 15.7 12.0 23.2 23.9 14.6 8.0 1.6 1.6APC 5.1 4.0 6.5 6.5 5.5 4.0 0.3 0.3All Systems 13.9 7.0 22.8 22.0 13.0 7.0 3.2 2.8
or provided sufficient detail to categorize specific cost numbers.Some agencies included software or installation costs, while othersreported only hardware costs. As one example of the problems indealing with cost data, MARTA in Atlanta reported a capital cost of$17 million for its ITS system installation, which includes APCs.Median figures are probably more useful for costs than averages,which can be significantly inflated by numbers like $17 million.
With these caveats, reported capital costs are highest for ERFpurchases (median = $1.4 million). The median capital cost for APCequipment is approximately $600,000. The difference between thetwo is accounted for by the fact that fareboxes are needed on everybus, while APC units are generally placed on 10 to 15 percent of thefleet. Capital costs for manual and hand-held techniques are bothunder $50,000. Software costs can account for 25 to 50 percent oftotal capital costs for an APC system, according to the two agenciesthat were able to provide a reliable cost breakdown.
Median reported operating costs are $650,000 annually foragencies using manual/hand-held methods (these agencies arecounted together in the operating cost category due to low responsesin this question), and $150,000 annually for agencies using EREAgencies with APC report median operating costs of $90,000, dueprimarily to decreased labor requirements. Median maintenance costsvary from $14,000 for hand-held and manual methods to $75,000 forAPC, and $105,000 for ERF technology per year.
While cost data from the survey responses are fragmentary andnot always consistent, the general trends correspond withconventional wisdom. Capital and maintenance costs associated withpassenger counting are higher at agencies that have invested in ERFand APC technology, while operating costs
are lower at these agencies. Manual techniques are labor-intensiveand require lower capital expenditures. Median cost data suggest ashort payback period for purchase of an APC system, but these costestimates are based on incomplete data and do not fully reflectdifferences among agencies in terms of size and/or labor cost.
Costs can vary significantly for the same type of technologydepending on optional items included. Software is often classified asan optional item. Agencies considering purchase of a specifictechnology for passenger counting should not rely on these figures,which are included in the report for informational purposes toprovide comparative estimates, but should contact suppliers or otheragencies that have recently made purchases to obtain additional costinformation.
SUMMARY
Planning and Scheduling departments generally have primaryresponsibility for all aspects of ridership data collection. There is aclear need to involve other departments in the process, particularlywhen an agency is changing to a more automated technology. Staffrequirements are highest at agencies with manual data collection,owing to the sizable traffic checker force required, and have beenreduced at agencies shifting to more advanced technologies. Achange in passenger counting technology can require upgrades incomputer and analytical skills. Reported capital costs are greatest forfarebox and APC systems. APC agencies report lower annualoperating costs and higher maintenance costs. Median cost datasuggest a relatively short payback period for investments inpassenger counting technologies such as APC.

19
CHAPTER SIX
TECHNOLOGY PROVIDERS' PERSPECTIVE
This chapter provides a shift in perspective from the transitagencies using various passenger counting technologies to thecompanies providing the systems. A full review of technical features,capabilities, and performance is well beyond the scope of thissynthesis. The intent of this chapter is to provide observations fromselected technology providers regarding the experience withapplications of technologies at different systems, with particularfocus on factors seen as affecting success or failure in the adoption ofnew passenger counting technologies.
TECHNOLOGY PROVIDERS INTERVIEWED
Information was gathered through telephone interviews withselected technology providers. The selection process for intervieweeswas based on firms that were cited most frequently as sources ofpassenger counting systems by transit agencies responding to thesurvey. These firms provided basic information on their products,and were then interviewed regarding their perspectives on passengercounting technologies within the transit industry. Companiesproviding information for this chapter include:
• Echelon Industries, Inc., Diamond Bar, California, aconsulting firm with specific experience in the design andimplementation of APC systems and smart card technology;
• Microtronix Vehicle Technologies, Ltd., London, Ontario,provider of APC systems;
• Red Pine Instruments Ltd., Denbigh, Ontario, anengineering company that manufactures APC hardware;
• Urban Transportation Associates, Cincinnati, Ohio,specializing in the supply of APC hardware, software, and expertise;and
• Wardrop Applied Systems Inc., Mississauga, Ontario, afirm that provides software for turnkey APC systems.
The list of companies is weighted toward APC providers.Attempts were made to contact the major farebox manufacturers(Cubic and GFI) via telephone and/or letter. Neither companyresponded to requests for an interview.
PERSPECTIVE ON TRANSIT INDUSTRYAPPLICATIONS
One problem facing technology vendors is that transit agenciesare often not sure what they want from a particular passengercounting technology. The transit industry tends to focus too much onthe hardware side and not enough on the need and uses for ridershipdata within an agency. There is often an erroneous perception that atechnological solution
will provide 100 percent accuracy. Agencies do not always realize atthe outset the need to provide a strong commitment to a newtechnology and to invest in the upgrade of internal procedures andstaff training (in terms of computer and data analysis skills) to makemaximum use of whatever passenger counting technology isselected. The internal dynamics of transit agencies play a major rolein determining the success of a new passenger counting technologyinstallation.
Technology companies also recognize several key technicalissues contributing to success. Variations in bus design can makeinstallation of APC systems more or less difficult. A good vehiclelocation system is viewed as necessary to optimize APCperformance; signpost and GPS-based systems both have theiradvocates. The choice of treadle mats versus beams as the means ofactually counting passengers can be influenced by climate andvehicle design; some companies view one counting technology assuperior to the others, but there are again a variety of opinions. Theintegration of APC systems with other technologies on and off thebus can enhance usefulness, although some agencies are reported aspreferring a stand-alone APC system. Diagnostic tests and softwarealgorithms that process boarding and alighting data are keycomponents of an effective APC package. Vendor support is alsocited (by vendors) as important.
One concern voiced by transit agencies is the ability to useAPCs on low-floor buses. Steps control the speed of access andegress and thus enhance the accuracy of treadle mat systems, whilebeam systems are not equipped to handle the parallel flows ofpassengers possible with wide-door low-floor buses. APC technologyis constantly evolving, however, and recent tests of APCs on low-floor buses in Montreal (an optical sensor system) and Ottawa(beams installed on an Orion II) have revealed fewer problems andgreater accuracy than initially expected. While innovative busdesigns can cause problems with the placement of APC equipment,these problems are not unsolvable. The ongoing evolution of APCtechnology does have the effect of making development of industrystandards more difficult.
There are obviously several benefits obtained from particularpassenger counting technologies, and these have been discussed bythe transit agencies elsewhere in this synthesis. Technology providersworking with a variety of agencies have noted that enhancedpassenger counting techniques allow an agency to be proactiveinstead of reactive.
From their experiences, technology providers offer thefollowing observations regarding factors contributing to a successfulapplication of new passenger counting technologies:
• Commitment of senior management. Support from thegeneral manager has a ripple effect throughout the agency by raisingthe priority attached to passenger counting.

20
• Active management of the passenger counting system.Senior management support is critical, but agencies that havesuccessfully adopted new technologies are characterized by a mid-level person who assumes responsibility for the system and takes thenecessary action to ensure its proper functioning. This persontypically is responsible for ridership data collection and/or use.
• Ability to utilize ridership data. New technologies oftenrequire increased attention to internal agency databases andanalytical techniques.
• Maintenance. Prompt maintenance will ensure maximumaccuracy. Adherence to APC procedures is also recommended.
The following factors were mentioned as potential pitfalls thatcan jeopardize a successful APC implementation:
• No internal changes to accommodate new technology. Asignificant investment in time and effort is needed to make the newtechnology work well by updating databases, ensuring that thesystem receives the priority it needs, and training staff in itsmaintenance and usage. In a very real sense, a passenger countingsystem does not stand alone.
• Lack of ownership. Someone within the agency needs totake the responsibility for making the new technology work. Withoutthis, the technology can fall between the bureaucratic cracks. Internalagency politics can lead to the same result.
• Unnecessary customization. This phenomenon is relatedto the emphasis on technology seen within the transit industry.Attempts to redesign what is available on the market to make one'sown system unique or better almost always result in failure. Mostinstallations require a fair degree of customization to match agencyneeds, but there are examples, such as Lane Transit District inEugene, Oregon, where a good passenger counting system has beenestablished by combining standardized APC modules.
Another concern of technology providers is the highexpectations for accuracy using new technologies. Agenciessometimes appear to assume that their manual passenger countingtechniques are 100 percent accurate. Under normal conditions, mostsuppliers indicate that an agency can expect 85 percent accuracy, i.e.,85 percent of all boardings and alightings will be counted correctly.Increases in accuracy are dependent on the quality and timeliness ofmaintenance diagnosis and response
and the volume of inventory of spare parts. Survey results for currentAPC users reveal that, on average, 75 percent of APC data areusable, and APC agencies indicate that this is still significantly moredata than what had been available using previous collectiontechniques.
Cost is of major interest to agencies considering new passengercounting technologies. As noted in chapter 5, reported costs of newtechnologies vary considerably. APC technology providers indicatethat several factors affect the total cost, including the number of APCunits ordered, whether the agency or the vendor installs the system,how location is ascertained (by APC units or by an integrated AVLsystem), and what optional components (software is frequently in theoptional category) are included. Some agencies (Metro in Cincinnatiis one example) lease passenger counting equipment for use asneeded.
Most of the technology provider interviews took place withcompanies that are involved with APC systems, but there were alsocomments related to smart cards. An industry shift toward proximitycards for fare collection has been noted, and there is some concernthat this will overshadow the fact that other solutions are appropriatein certain circumstances. Magnetic strip and contact cards can be thebest option for a particular agency, and there is also a potential rolefor inexpensive disposable cards that can be offered at a discount. Atransit agency does not have to find the best fare card, just one thatworks for its current and envisioned purposes.
SUMMARY
Technology providers advise transit agencies to purchaseequipment that has been proven to be reliable and that is ruggedenough to withstand a moving vehicle environment. The transitagency needs to make whatever internal changes are required toenhance system performance. A sense of ownership of the newtechnology, usually occurring at the agency's middle levels, isgenerally predictive of success, particularly in conjunction with acommitment from senior management. Care must be taken tomaintain the new system to ensure continued high levels ofperformance. The technology providers view internal organizationalproblems and unnecessary customization as factors contributing tofailed attempts to adopt new passenger counting technologies.

21
CHAPTER SEVEN
CASE STUDIES
Survey results and comments solicited from respondentsprovide an excellent overview of the major issues regardingpassenger counting technologies and procedures. Following a reviewof these results, six agencies were selected as case study sites.Personnel directly involved with collection and analysis of ridershipdata and with decision-making regarding appropriate technologiesand procedures at these agencies agreed to be interviewed bytelephone. The case studies are intended to provide a more completeunderstanding of the evolution of passenger counting via differenttechniques.
The selection process for case studies focused on includingagencies of various sizes in different parts of the country that usedifferent procedures and on identifying systems that have achievedsome level of success. Most of the agencies surveyed offered to serveas case study sites, and some that have not been able to implement orchange passenger counting programs, due to problems withtechnology, lack of clear direction and support from uppermanagement, or internal organizational disputes, would haveprovided instructive examples. One finding from this study, however,is that agencies face very similar problems in attempting to optimizepassenger counting. The six agencies selected have overcome manyof these common barriers. While they do not necessarily holdthemselves up as examples of best practices, they have all managedto establish effective passenger counting programs that meet theirneeds.
The six case study agencies are:
• Houston Metro (Metropolitan Transit Authority of HarrisCounty, Texas). Houston Metro operates over 1,200 buses on itsfixed-route system, and relies on manual passenger counting usingtraffic checkers, pencil and paper for trip-level data and ERFs forsystem and route-level data.
• TTDC (Tidewater Transit District Commission). TTDC isa 146-bus system serving Norfolk, Virginia and surrounding areas. Ituses hand-held equipment (portable computers) in conjunction with amanual traffic checking force to collect ridership data.
• CTA (Chicago Transit Authority). With over 2,000 busesin fixed-route service, CTA is the largest case study agency. CTA'sresponses concerned only its passenger counting procedures forbuses. The agency developed innovative techniques to use electronicregistering farebox data as a basis for its route and trip-level ridershipcounts. After a long process, CTA is now conducting ademonstration project using APC equipment.
• Tri-Met (Tri-County Metropolitan Transportation Districtof Oregon). Tri-Met is a multi-modal agency operating 600 busesalong with its light rail system in Portland, Oregon. It has used APCunits since the early 1980s, and is now converting its system fromsignpost to GPS and integrating the APCs with a new AVL system.
• OC Transpo (Ottawa-Carleton Regional TransitCommission) is an 800-bus system serving the Ottawa region inOntario, Canada. OC Transpo is a long-time user of APCs forpassenger counting.
• SCAT (South Coast Area Transit) is a 46-bus system inVentura County, California. It is conducting one of the first and mostextensive demonstration projects using smart card technology.
Survey responses for each case study agency are summarized toprovide background information, followed by an in-depth descriptionof the reasons for choosing certain technologies, benefits, problems,and advice for other agencies.
METROPOLITAN TRANSIT AUTHORITY OFHARRIS COUNTY (HOUSTON METRO)
Houston Metro's primary means of collecting ridership data ismanual, using traffic checkers, pencil and paper. Electronicregistering fareboxes are used to estimate monthly ridership totalsfrom passenger fare activity counts, vehicle operator trip cards recordridership on employee shuttles, and onboard surveys are used formarket research. The traffic checker data are used for serviceplanning and scheduling purposes. A schedule of counting each routeon weekdays every 3 years has been established, with weekendcounts scheduled as needed. Data input is done manually (ERF dataare retrieved at the garage). System and route-level ridership issummarized monthly based on ERF data. Manual commuter/park-and-ride counts are also reported on a monthly basis, while reportsare generated for other routes as they are counted on the 3-year cycle.Houston Metro established a separate department Research,Evaluation and Trip Planning-that oversees most of the agency's datacollection activities, including primary responsibility for ridershipdata collection. The data collection function was reassigned to thisnew department from Scheduling, which had geared data collectionefforts solely to scheduling-related needs. Planning, Scheduling, andBudget/Finance have input into the data collection schedule.
Houston Metro uses five full-time traffic checkers who areformer bus operators. The full-time equivalent of one data entry clerkenters the ridership data. There are seven temporary passenger countmonitors whose primary duty is to assist in checking operatoraccuracy for farebox totals, but who are available one and one-halfweeks per month to assist the fulltime checkers. As needed, Metrosupplements staff with temporary personnel. This level of staffinghas been reduced from 13 regular full-time and seven temporarytraffic checkers in 1991, as introduction of more automatedpassenger data collection technology was planned. This newtechnology is not

22
yet in place. APC purchase is still planned, while the investigationinto using hand-held units has been delayed pending action on APCs.
Metro makes routine service changes three times per year, withmajor changes tending to occur in January. Due to requirements forpublic hearings and internal schedule reviews, Service Evaluationtries to have the necessary information ready 3 months prior toimplementation.
When the current Manager of Service Evaluation assumed hisduties in January 1995, current ridechecks were available for about65 of the 100 routes in the system. This meant that the agency had nostop-level ridership data for about one-third of the routes. ServiceEvaluation developed a plan, with Planning and Scheduling review,intended to provide quality data in a timely fashion on all Metroservice. As a result, an initial priority was to collect data on thesmaller routes that are often overlooked. By 1998, Metro will havetwo counts on each route within the previous 4 years, at which timethey may partially shift priorities back to focusing on the largerroutes in the system.
Metro stresses the importance of developing a data collectionplan that addresses all routes within the system. Like other systems,Metro responds to special requests that require a deviation from theestablished collection schedule, but notes a real difference in terms ofawareness that such requests require a change in plans. It has becomemore possible to fit non-emergency special requests into theestablished plan, and thus to build a current database of ridership onall routes, as opposed to responding almost solely to otherdepartments' priorities.
In addition to the five full-time traffic checkers, seventemporary passenger count monitors are available part-time, andoutside temporary workers, and professional and administrative stafffill in on occasion to complete a check. Metro is pleased to haveformer bus operators as full-time checkers because they know theroutes and are keenly aware of what can be done. Attendance andmorale are not problems with the full-time checker force becausethey are eligible for bonus awards prorated for attendance. In thepreceding 8 months, full-time checkers have missed only 5 days. Bycontrast, the temporary passenger count monitors average 86 percentattendance, meaning that one of the seven is absent on a typical day,and outside temporary workers show up 50 percent of the time. Useof full-time personnel who are eligible for attendance-based awardshas been a very successful approach.
Metro has recently moved toward a policy of conductingweekday and weekend counts jointly on a given route. This providesa fuller picture of route dynamics, and also reduces errors by thecheckers. Overall, data variation from route-level ERF estimates hasdecreased from 12 percent several years ago to five or six percenttoday, but Metro has found that the error rate is even lower whencheckers are immediately familiar with the route (e.g., from justhaving completed a weekday check).
The reliability of core traffic-checking personnel is a key factorin Metro's satisfaction with manual data collection. The agencyidentifies several other benefits of manual passenger counting:
• If there are significant problems with a route or schedule,the checkers function as an early warning system. Use of former busoperators accentuates this ability, but experienced traffic checkerswill also notice problems in the field. One example involved anextended route that encountered major on-time performanceproblems. The checkers noted that the extension involved a secondcrossing of railroad tracks that virtually ensured a delay on the route.Running time was increased, with a slight increase in headways,reliability was restored and ridership remained constant whileoperating costs were reduced. Conscientious traffic checkers provideimportant information to planners and schedulers who may not beable to get out into the field as often as they would like.
• Checkers return forms with extensive notes on the back.Service Evaluation finds these notes to be invaluable. Often theseexplain unusual discrepancies in running time or identify locationswith awkward transfer or pulsing issues (such as an operator waitingfor a transferring passenger at a transit center when the originatingbus is running late). The explanatory or diagnostic power of thesenotes is something that cannot be obtained electronically.
• A checker absence is readily observable, and missed datacan be factored or the assignment repeated. When technologymalfunctions, there is a different response. In part this is due to anassumption that the technology will collect 100 percent of theinformation with immediate availability. The problem of identifyinga malfunction can be more complex than simply noting that achecker is not present. Service Evaluation is particularly sensitive tothis issue after a comment regarding the accuracy of ERF data onbuses that experience mechanical difficulties in the field required thediversion of resources from other needs to identify the extent of thisproblem (as it turned out, the problem was insignificant).
• More data are sometimes collected than can be used, evenrelying on manual techniques and a 3-year data collection schedulefor each route. The Service Evaluation Section and other departmentscannot get to all the data. For example, the department recently sentresults from 14 route ridechecks to the Schedules Section, followedby 10 more in the following week. The Schedules Section is hard-pressed in these circumstances to convert the ridecheck results tonew schedules in a timely fashion. Given these constraints, there isno priority attached to the ability to count passengers morefrequently.
Metro is very interested in what new technologies can offer,particularly in the area of data entry, a major bottleneck in the currentsystem. It notes that ERFs were supposed to solve all problems interms of aggregate ridership counts, but turned out to have difficultyin accounting for non-cash, nonmagnetic media boardings. Thetemporary passenger count monitors' tallies routinely differ from theERFs by three percent, which can be very significant at an agencywhere even a 0.1 percent drop in ridership may elicit questions andconcerns. Metro recognizes the benefits that will accrue when APCs,AVL, and ERFs all work together, but views this occurrence as stillwithin the theoretical realm.
In the interim, Metro is an example of an agency that hasestablished an effective manual data collection program that

23
meets the agency's needs for ridership data. Key factors in thissuccess are summarized as follows:
• Get Agency Support--Make sure that all internal clienteleare in agreement with the data collection procedures and scheduleand are willing to do what it takes to make the system work.
• Keep it Simple--Do not ever take for granted that datarecipients will understand the data, even with extensive professionalexperience. Service Evaluation transmitted a spreadsheet with on-time performance data to another department and received a callasking why no trips were early. The spreadsheet formatting showednegative numbers in parentheses, not with a minus sign.
• Develop a Plan--Perhaps the corollary to this is: recognizethat there will be deviations caused by special requests. Without aplan for data collection by route, however, special requests tend toedge out everything else.
• Conduct Joint Weekday and Weekend Checks--While thisis not always possible due to personnel limits, Metro has found thistechnique to provide a more complete picture of the dynamics ofridership on a given route. It also reduces data variations, because thecheckers are experienced with the route from the weekday checks.
• Use Checkers as Your Eyes and Ears--Encouragecheckers to note unusual occurrences, unexpected ridership patterns,and apparent reasons for variations in running time. Good data resultfrom a combination of quantitative and qualitative information.
• Use Full--Time Personnel and Reward AttendanceAbsenteeism has been noted as a major problem at agencies usingmanual data collection techniques, but Metro's checkers haveexcellent attendance rates. The reward system implemented at Metroencourages responsibility among the traffic checker personnel, whichin turn has a major impact on the success of the data collection effort.
TIDEWATER TRANSPORTATION DISTRICTCOMMISSION (TTDC)
TTDC collects detailed ridership data manually, using trafficcheckers and hand-held units. Electronic registering fareboxes areused for aggregate system, route, and trip-level ridership counts. Thetraffic checker data include boardings and alightings by stop, whichprovide a route profile, and are used for all service planning andscheduling purposes. A schedule of counting each route once ortwice each year on weekdays and once a year on Saturday has beenestablished, with Sunday counts scheduled as needed. Laptopcomputers are used as hand-held units, and are directly connected toa host computer to upload and download data (ERF data aretransmitted via a direct downlink). System and route-level ridershipis summarized and performance measures are calculated monthly,based on ERF data. Annual reports include more detailed datacollected manually with the hand-held units and summarized at theroute segment and stop levels. The Planning Department has primaryresponsibility for ridership data collection. TTDC
uses four full-time traffic checkers, one clerical person, and one half-time support person for passenger counting.
TTDC makes major service changes once a year, usually inOctober at the start of its fiscal year. Any minor problems areaddressed 6 months later. Formerly, the agency worked on a 6 monthcycle for making service changes of all types, but the costs involvedin public information led to the new schedule. The ridership datacollected with the hand-held units are the source data for currentridership, and are in constant use in analyzing the transit network.
Prior to converting to hand-held units, TTDC collected datamanually using pencil and paper. When hand-held units becameavailable, improved efficiency in data collection was the primaryreason for the switch. Formerly, check sheets would have to beprepared and grouped on clipboards, and the resulting trip-by-tripdata would be reconfigured by time of trip on a single big sheet. Withhand-helds, required information for every route is stored on a hostcomputer and downloaded to the laptops when needed. Ridershipdata are uploaded when the check is completed. Changes inschedules or stop lists are made in a single location (on the hostcomputer).
TTDC is very satisfied with current data collection procedures.One problem reported by the agency is the rapidly increasing costs oflaptop computers. As laptops become more sophisticated, it isincreasingly difficult to find a simple, inexpensive machine. Becausethey are used extensively in the field, the laptops do get dirtier thanoffice computers and require more frequent maintenance. Theft is apotential issue, although it has not occurred at TTDC. The small sizeof TTDC's checker force has resulted in close working relationshipsand a considerable degree of trust.
A final area of concern is devising a means of powering toensure that the laptops work on the bus. The laptop battery is goodfor four hours, and each unit has a back-up battery. On the bus,TTDC has used plugs, adaptors, invertors, and cables to construct aneffective (though aesthetically unattractive) means of deliveringpower to the laptops.
In converting from paper and pencil to hand-held units, TTDCfound that other changes were required. Programs were developed tokeep stop inventories, headway sheets, and schedules current. Linksbetween scheduling and data collection databases were established sothat changes in stops, schedules, and route descriptions occurautomatically in both. Procedures were established to address short-lines, interlines, and branches. Download and upload programs allowinformation to be passed routinely between the host computer and thelaptops. Data analysis and reporting software converts ridership datainto immediately useful formats. While all these programs werebeing developed, the agency also switched from a mini-computer to aPC-based system. A local programming company provided customprogramming for TTDC. While this required a significant timeinvestment up front, the data collection system now runs with littleintervention.
TTDC recognized several benefits in the conversion to hand-held units. Most of these flowed directly from the elimination of theintermediate step of inputting data manually. Primary benefitsinclude:

24
• Faster turnaround--The time between data collection andanalysis has been reduced significantly, and ridership data areavailable more quickly than under the pencil and paper procedures.
• Improved accuracy--Elimination of manual data inputmeans that there is one less source of error in the data collectionprocess.
• More efficient use of personnel--Traffic checkers are nowfocused full-time on collecting data and keeping files updated. Moreroutes and/or trips can be checked within a given period of time, andcheckers are now being used to provide assistance with customerservice functions.
• Sense of ownership--In going through the process ofadopting a new passenger counting system, TTDC found that thoseinvolved developed a strong sense of ownership in the new system.This has helped to ensure support for the system throughout theagency.
TTDC currently has a signpost-based AVL system, and isconsidering a change to APC with the next generation of AVL. Amore immediate priority at the agency is integrating ridership datawith the route network in a Geographic Information Systemenvironment. Functionality is the key: the first step is to displayridership data in the way it is currently used, so that it can be usedimmediately. TTDC anticipates that additional uses will developonce the systems are integrated.
In summary, TTDC is very pleased with the use of handheldunits to collect ridership information. The system works very well,and provides information that is used constantly by planning andscheduling. The agency offers the following observations based onits experience in converting to and using hand-held units:
• Use generic computer equipment, such as laptops.Handheld units manufactured specifically to count data are available,but their purchase locks an agency into one specific vendor. Laptopcomputers avoid this problem, since there are obviously multiplevendors.
• Be prepared to devote time initially to develop databasesand programs to work with the hand-held units. TTDC spentconsiderable time up-front, but now has a system that nearly runsitself.
• Involve all data users in the process. Adopting newtechnology can be stressful and difficult, but it is possible to build asense of ownership in the process by involving all of the appropriateparties. This sense of ownership ensures continued support for thedata collection system as it matures.
CHICAGO TRANSIT AUTHORITY (CTA)
CTA collects ridership data via electronic registering fareboxesand manually, using traffic checkers, pencil and paper. ERF data arethe primary data, used for service planning, ridership trends, andperformance reports. CTA has developed techniques to adjustfarebox-generated ridership data for operator error through sampledsurveys. These adjustment factors are applied automatically andupdated through periodic
re-surveys. Data collected manually by paper and pencil are usedsolely by the Schedules Department. System and route-levelridership is summarized monthly, and performance measures arecalculated on a quarterly basis. ERF data input is done via directdownlinks. Manual counts for scheduling purposes remain on paper.The planning and scheduling departments have primaryresponsibility for ridership data collection.
All of these procedures are changing. CTA is completing ademonstration of APC units on 25 buses and is moving forward withthe implementation of APCs.
CTA currently has 14 traffic checkers for its entire system (busand rail), and also relies on six clerical and one professional staff inthe Traffic and Analysis Section. Seven traffic checker positionswere eliminated concurrent with APC system development.Resulting staff levels are insufficient to conduct all-day weekday andany weekend checks. A current buy-out proposal is expected toreduce the current checker staff even further, and these positions willnot be filled.
The development of farebox adjustment factors to countridership by route and by hour is a notable example of a transitagency's general process of attempting to extract the mostinformation from available data. However, CTA rated fareboxes asnot very useful at the trip level and indicated that ratings at other sub-route levels were not applicable, since ERFs do not produce data atthose levels. Despite the unavailability of detailed data, CTAachieved considerable success in being able to use farebox data forservice planning purposes, primarily by extracting ridership capturedat the trip level by route and by hour. The only ERF-related problemnoted was operator noncompliance in following the proper sign-onprocedures and recording each passenger boarding by fare categorycorrectly.
Continuing interest in APCs reflected the fact that ERF data arenot truly suitable for detailed route analysis. As noted in theintroduction, ERF ridership data are collected on a trip-by-trip basis.These can be combined to provide route-level and system-levelridership totals, but cannot be disaggregated to yield route segmentor stop-level data. As CTA notes, the reliability of data on a specifictrip is dependent on operator compliance with entering the correctcode to indicate the start of a new trip. Thus, ERF data cannotprovide information regarding key stops along a route withsignificant boarding and alighting activity, nor do ERFs have thecapability of recording actual time at specific timepoints along theroute. APCs use the stop as the basic unit at which passenger activityis recorded, and have the capability to provide a time stamp at everystop. APC data are considerably more useful for service planners andschedulers because of the disaggregate nature of the ridership count.
The length of time involved in the decision to go ahead withAPC is typical of many agencies. As changes occurred in seniormanagement, APC priority within the agency also changed. Thus, theCTA process highlights the importance of commitment by seniormanagement to whatever data collection technology is selected.Another reason for the lengthy decision-making period was CTA'sapproach. The agency was both cautious and demanding, very waryof being taken for a ride and very insistent on getting exactly what itneeded.

25
Results of the recently concluded APC demonstration project(using a signpost-based system) revealed several important lessons,the first of which was the importance of conducting a demonstration.The agency was surprised that, despite its best efforts, it had not fullyspecified all needed system elements. Hardware was the leastimportant part of the overall system. Sources of route-level inventorydata and post-collection report processing proved to be much morecritical to the effective functioning of the APC system.
Bus stop inventory, route descriptions, and schedulinginformation are key inputs to APC, and the demonstration projectshowed that these databases needed additional work. For example,the output of schedules was flawed, and program modifications wereneeded to produce internally consistent schedules. A clear needemerged to dedicate staff to data maintenance. In terms of dataprocessing, the need for separate work, calibration, and data storageareas led to a reconfiguration of the computer network. The processof software modification can reveal how the data system reallyworks. The demonstration project emphasized the need for an agencyto get its own house in order before adopting a new technology likeAPC.
CTA clearly endorses the consensus that support of seniormanagement is necessary to the success of a technology changeoversuch as introducing APCs. At the same time, the system should bedesigned at lower levels, with the participation of those who will usethe results, instead of being dictated in top-down fashion. The lower-level design must involve a considerable amount of give-and-take.Some departments may insist on having ridership data in exactly thesame format, even though this may not suit broader agency needs.The discipline forced on departments by notification that they wouldlose all traffic checkers by a certain date (an approach taken byMontreal) can help to ensure cooperation in making sure the newAPC system will work.
The APC demonstration also showed the importance ofinterdepartmental cooperation and direction from management inensuring success. APCs were used to gather detailed data on fiveroutes that were strong candidates for pruning or possiblydiscontinuation. At one garage where there was a supportivemanager, the APC units produced very good data. At the othergarage, where the direction was along the lines of "fit this in wherepossible," the APC units produced marginal data.
CTA was obviously very pleased with the APC demonstrationproject, since it is implementing an APC-based system. The staffreported that accuracy was better than expected, and the detailedlevel of data produced was remarkable. Unexpected uses havealready been found for APC data, such as responding in detail to aquery from senior management regarding the possibility ofincreasing speed on a specific route by reducing the number of busstops. The APC stop-level data showed several stops that were notbeing used, including one that was assumed to be an importanttransfer point.
There is an awareness that adoption of APC means a transitionfrom traffic checkers to analysts in management positions, who willrequire training to develop and polish the necessary skills.Coincidentally, a significant portion of the
scheduling department is taking an early buy-out offer, creating anopportunity to bring in new and possibly different types of people (interms of education and experience) and train them from the outset onuse of APC data.
CTA suggests that several lessons from its APC demonstrationare applicable to agencies considering APCs or some other form oftechnology upgrade:
• Visit other systems or invite key personnel to visit you--Ask the agencies that have been through the process to lay out whatyou need. Take their advice and get your own house in order beforegoing out to talk with vendors.
• Set up your database inventories--As noted, bus stopinventories, headway sheets, and schedule information are key items.
• Build flexibility into your reporting system--Data tend tofind their own uses. Decide on standard reports that will be neededon a recurring basis, but design the ridership database as flexibly aspossible to permit special queries.
• Get firm support from management--Experience with theAPC demonstration suggests that success is ultimately determined bysupport from management.
• Keep the faith--Converting to APCs is harder thanexpected, and may take longer than expected, but it can be donesuccessfully.
TRI-COUNTY METROPOLITAN TRANSPORTATIONDISTRICT OF OREGON (TRI-MET)
Tri-Met uses electronic registering fareboxes for revenuecalculations and for determining special boarding counts (i.e., lift andbicycle), and uses APCs to summarize schedule adherence and tocount ridership at the system, route, trip, route segment, and nowstop levels. APC data are used for all service planning andscheduling purposes. The APCs count passengers via infrared beams.Weekday and weekend counts of each route are conducted duringeach driver sign-up (or nearly once every quarter), with a goal ofsampling each trip five times during the quarter by rotating APC-equipped buses throughout the system. Ridership data are retrievedfrom the buses at the garage automatically via infrared at the fareboxcollection point. System-level ridership is summarized monthly,while data at sub-system levels are available daily on request. TheOperations Planning and Analysis Department has primaryresponsibility for ridership data collection, and makes routine servicechanges in conjunction with its quarterly driver sign-ups using theAPC data.
Tri-Met eliminated one supervisory and six traffic checkerpositions when the APC system became operational in 198384. Thereare no longer any traffic checkers at Tri-Met. Staff assigned to carryout the passenger counting program includes about 75 percent of oneprofessional, five percent of one clerical, and 25 percent of oneelectronic maintenance person's time. Capital costs for an APC unithave declined with the addition of an AVL system, from an estimated$5,000 per APC unit to $1,000. Annual operating costs are estimatedat $70,000, and annual maintenance costs at $15,000. Ninety

26
buses, or about 15 percent of the fleet, are equipped with APCs.There are plans to expand this number by 110 buses in the currentfiscal year, bringing the percentage of APC-equipped buses to 33percent of the fleet, and possibly to move toward a 100 percent APCfleet within the next few years. The cost reduction as a result of AVLand increased flexibility in bus assignments are the principal reasonsfor APC expansion plans.
APCs were introduced at Tri-Met approximately 15 years agoto achieve lower cost and greater efficiencies in the area of passengercounting. Implementation proceeded incrementally, from use forsystem and route-level ridership to a focus at the trip level, then atthe route segment level and finally, with the pending reliability ofAVL, at the stop level. Interestingly, the pre-AVL system wascompletely odometer-based, with no signposts or GPS. Reliance onodometers meant that the agency needed to upgrade its schedulemileage by route to ensure that APCs worked accurately. Inconjunction with odometer data and time stamps, Tri-Met usedlayovers as virtual signposts. After the trip-level data wereestablished as accurate, the agency then would segment portions ofroutes by time points, based on the distance traveled. Tri-Met wasnot confident enough in stop-by-stop location via the odometersalone to use stop-level data.
Now, with a GPS-based AVL system integrated with the APCs,each boarding and alighting is recorded by the APC unit while AVLmatches the information with the correct stop. Tri-Met is in theprocess of converting its software to make full use of the newlycaptured data, while other projects (such as the bus shelterplacement) are already showing interest in the stop-level information.Software conversion to stop-level reporting will take some time, butthe agency made the decision to do the conversion while keeping thecurrent APC reporting system up and running.
While the AVL-APC integration is allowing Tri-Met to do evenmore with its passenger counting program, the agency's considerablesuccess with adoption and use of APCs as a stand-alone componentfor over a decade may be more relevant for other systemsconsidering APC technology. As noted above, Tri-Met proceededincrementally in terms of making use of the APCs, and this approachhelped in terms of establishing organizational responsibilities. Theagency was fortunate to have established programming positionswithin the Planning department, ensuring that needed work on APC-related software received a high priority. There were still dealingswith other key departments, including Information Systems andMaintenance. The APC project manager noted that he was successfulin transferring responsibility for maintaining APC equipment toMaintenance only after the third attempt.
It also took time to ensure correct APC dispatching. Afterseveral different approaches, the Maintenance and Planningdepartments worked out an agreement under which Planning asks foronly 60 percent of APC buses to be specifically assigned. This targetis reachable every day and avoids the problem of the assignmentclerk being forced to decide which assignments should be skipped inthe event that APC buses are not available due to maintenance orother reasons. This
compromise has worked successfully even at times of high turnoveramong assignment clerks.
In the pre-AVL system, ridership data were accumulated on abus block assignment basis. Two different methods have been usedto match ridership data to bus assignment: either the assignment clerkwould assign a specific pre-programmed bus or the bus operatorwould program the bus before leaving the garage. The integration ofridership data with schedule information was part of the post-processing program. Tri-Met has noted no real change in skill levelsrequired when it comes to analyzing ridership data collected byAPCs. The change has occurred in the amount of data and number ofanalytical tools available. More frequent data collection has resultedin enabling changes to happen more quickly. When questions arise,ridership data are immediately available or can be obtained quickly,making the department and the agency more responsive.
Data availability, with the consequent ability to respondquickly, is one of the benefits of APCs. The ability to collect moredetailed data is also important. A third benefit is cost savings. Onereason that Tri-Met adopted APCs is that an APC-based ridershipcounting process is less expensive and more accurate than a manualprocess. Implementation of an AVL system has reduced the cost ofAPCs, because the new APCs do not need data storage, datatransmission, and odometer interface capabilities that are nowhandled by AVL.
One of the problems still faced at Tri-Met is getting priority forAPCs in the Maintenance department. The problem is not necessarilysolvable, since Maintenance is very clear that safety issues (radios)and customer service issues (destination signs) have greater prioritythan APCs. One possible solution is to assume budgetaryresponsibility for half of a full-time maintenance person, who canthen be devoted (half-time) to APC maintenance needs. Anotherprevious maintenance related problem was the high-pressure steamwash used for bus interiors. This was fixed by having certain APCparts epoxied. These cannot be repaired and must be replaced whenthey break down, but now break down much less frequently.
Accuracy of the data is another problem for Tri-Met with itsAPC equipment. Some counters do not yield a consistent set ofcounts, while others are consistently high or low. The agency hasnever tried to determine whether the problem lies with the vendor,the technology, or its own installation process. What the agency didwas to develop an algorithm that corrects counts based on thecounters' history, but the correction is made in the post-processingphase. As a result, real-time data cannot be supplied with confidence.
Tri-Met points out that the definition of accuracy is inconsistentwithin the industry. A typical definition is that boardings andalightings must be counted to within + 10 percent or ± 3 passengersat the trip level, whichever is greater. Tri-Met specifies that, for 90percent of all runs within a 30-day period, all boardings must becorrectly counted at 90 percent of all passenger stops, and allalightings must be correctly counted at 90 percent of all passengerstops. The APC Project Manager noted that he has seen four or fivedifferent specifications regarding accuracy, but has never seen astandard. Parenthetically, other agencies have consideredspecifications that take

27
passenger loads into account along with boardings and alightings.Overall, Tri-Met has been satisfied with its APC system, and
views the addition of an AVL system as a major improvement thatopens up a variety of new analytical possibilities. With the reducedcost of APCs, due to many functions now being handled by AVL,Tri-Met is planning to expand its APC fleet to a size larger than anyother APC agency included in the survey. Tri-Met's experience withAPCs results in the following suggestions for agencies consideringthis technology:
• Integrate with AVL--Accurate locational referencingenhances APC capabilities. AVL reduces the cost of new APC units,which no longer need to handle data storage, data transmission, andodometer interface.
• Plan and budget for maintenance, and clarifyresponsibilities--Effective maintenance is one of the keys to makingan APC program work.
• Get a commitment from management--This is critical tosuccess. Senior management must understand the usefulness of thedata to be collected and the importance of the purposes for which thedata can be used. From management's perspective, enhancedresponsiveness to queries and reduced turnaround time are importantimprovements that APCs can offer.
• APCs can be implemented incrementally--Tri-Met beganby equipping 10 to 12 buses, and had a single person responsible formanagement, programming, maintenance, and procurement. Atsmaller systems with relatively simple route structures, a high levelof automation in terms of providing schedule information may not beneeded. An incremental approach can work at any system, at least interms of the number of APC units. Related software must bedeveloped largely at the same time as the initial implementation, butwill also be enhanced incrementally.
OTTAWA-CARLETON REGIONAL TRANSITCOMMISSION (OC TRANSPO)
OC Transpo relies on a signpost-based APC system for allridership data collection. Boardings and alightings are counted viainfrared beams. Counts are scheduled on a quarterly basis (coincidingwith the four annual booking periods) for each weekday route and ona biannual basis for each weekend route. All weekday trips arescheduled to be sampled at least once each booking period, and allweekend trips are scheduled to be sampled at least once every otherbooking period. On average, each scheduled trip is captured fourtimes. Data collected during the day are stored onboard in memoryand are downloaded remotely each night via radio. OC Transposummarizes system-level ridership monthly (based on revenue andpass sales analysis) and APC ridership data at more detailed levelsquarterly. The Planning Department has primary responsibility forridership data collection.
OC Transpo has no traffic checkers. In the early 1980s, eighttraffic checkers were redeployed within the agency after APCs wereon line. Staffing needs for passenger counting include 2.5professionals, one hardware maintenance employee,
and a half-time student from a local engineering college who assistswith equipment maintenance. APCs did require a change in skilllevel in the areas of computer usage, hardware maintenance, systemdevelopment, and quantitative analysis.
The estimated replacement cost for capital equipment andsoftware is $650,000 for hardware and $250,000 for software. OCTranspo reports an annual operating cost of $110,000 and an annualmaintenance cost of $95,000 for its passenger counting program. Themaintenance cost includes staff resources and materials for both thehardware and software components. Eleven percent of its fleet, or 86buses, are equipped with APC units.
The Ottawa-Carleton region experienced tremendous growthduring the 1970s, and OC Transpo realized that a limited trafficchecker force was not producing coordinated information that theplanners needed. Backed with an absolute commitment frommanagement, the agency, in 1978, moved ahead with the decision toautomate the data collection and analysis function based on an APCsystem. Software problems initially limited the effectiveness ofAPCs, and the payback for the capital investment was questionablein the early days, but in 1986 the software was thoroughly revised,with periodic minor upgrades in subsequent years. Ridership data aretransmitted via radio and processed overnight. Sophisticateddiagnostics can identify when a unit is not working properly, to thedetailed level of which beam is the likely culprit. End users(managers, planners, and schedulers) obtain information from thesystem through the APC database staff. Requests are usuallyprocessed within 24 hours. The end users are pleased with thisprocedure, because the data managers are intimately familiar with allaspects of the data and will determine whether ridership data on aparticular route constitute an adequate sample for their purposes.
The agency has bought into the use of APCs, and recognizesthe data collection function as an equal and integral part of theoverall transit operation. The planners and schedulers who are theprimary users of the APC data have also accepted the system totally.Over time, a variety of standard analyses and reports have beendeveloped, including those listed below.
• Average loads and passenger activity (boardings andalightings) along a route at the bus stop level.
• Distribution of running times along a route by timepointsection (or any stop-to-stop section) by hourly increments throughoutthe day. This is used to calibrate scheduled running time so as tomatch actual travel times on the route.
• Route performance relative to service standards. OCTranspo has developed service standards for transitway, base andregular route categories, and uses APC data to analyze performanceby route category, route, and five major time periods. The systemproduces revenue to cost ratios for each route by major time period.The analysis highlights poorly performing routes as candidates forremedial action. Like all transit systems, the agency faces tradeoffs atthe Board level between performance and mobility. The detailedperformance analysis relative to the cost recovery target provides theBoard with the necessary information to make its decisions.

28
• On-time performance. The APC data permit scheduleadherence at the bus stop level to be determined. When firstconducted, this analysis revealed that many buses were leaving stopsearlier than scheduled, due largely to how running times were beingassigned to routes. Ongoing revisions to scheduling practices andimproved supervision in the field are solving the problem.
• Area analysis. Each bus stop has a unique number, andcan be grouped to determine boardings and alightings within an areaby day and time period. Individual stops are analyzed and prioritizedfor potential shelter installation based on the volumes of boardingpassengers.
• Screenline crossings. This reports the total passengervolume on buses crossing a cordon line. One important use of thedata is to augment the screenline count program carried out by theRegional Transportation Department to determine modal split. Theprocess of identifying screenline locations within the APC system islabor intensive and can only be simplified when APC is linked toGIS in the future.
• Travel times along a corridor. This information is beingused to identify major corridors that can benefit most from buspriority treatments. OC Transpo can break down bus travel times intoindividual components: boarding/alighting; access to/egress from busstops; idling in traffic; caught in traffic congestion; and moving.Moving speed and total speed can be calculated, and corridors can beranked. This activity had previously been done manually.
• Special ad hoc queries by day type, time of day, route,segment, etc.
OC Transpo's APC system uses 40 signposts as locationalreferences, strategically situated throughout the region to achievemaximum route coverage. The APC units log activity whenevercertain events occur. These include bus stops, idle time, stop-and-gotime, and signposts along a route. Odometer mileage is used to matchstops relative to signposts, trip origin, and trip end. Post-processingverification ensures that at least two-thirds of all stops on a given triprecord are within a specified distance of their actual location, or thetrip is discarded. The agency has a high level of confidence in itssignpost system. It recognizes the potential benefits of GPS, butcannot justify the expense of installing a new system solely on thebasis of passenger counting activity. If the Commission's AVLsystem is upgraded to use GPS, then APC will be modified to takeadvantage of it.
The process of establishing APCs as an integral part of anagency's day-to-day operation is not simple. There is a huge amountof work at the outset, and decisions are needed regardingresponsibilities for installation and maintenance. At OC Transpo, thehardware installation and maintenance functions are cooperativelyshared between Planning's APC technologist and the Equipmentdepartment's electrical and body shop staff. Software in manyrespects presents a larger challenge than hardware. The level ofprogramming effort depends partly on the existing level ofsophistication within the organization. The major issue is gettingpeople within the agency to buy into the APC system and changehow they view data collection.
Management support, which was strong and consistent at OCTranspo, ultimately determines the success of this effort.
One key to smooth operation at OC Transpo has been theintegration of APC bus assignment with the dispatching system. Thestrength of the APC database is based on the results of the samplingapproach. Determining which vehicle blocks are to be assigned anAPC bus the following day is automated within the APC softwareprogram. Vehicle blocks selected are electronically passed along tothe bus starting module overnight, so that the bus starter is flaggedwith the APC assignments for the day. Attempts are made to parkAPC buses in dedicated lanes, so that a driver assigned to an APCrun can be sent to the appropriate lane and take the next bus in line.Operations, and particularly dispatch, now reports few problems withAPC bus assignment, but the agency suggests that this process ofmaking APCs a routine part of operations will require considerabletime (perhaps one year) to be fully integrated as the norm.
The principal benefit of an APC system for OC Transpo lies inits role as primary provider of all planning and scheduling data.Benefits include:
• A fully automated system collecting data 24 hours perday, seven days a week
• An extensive database for each booking period coveringall routes
• A variety of standard reports that users are comfortablewith, as well as the facilitation of ad hoc queries
• Better decision making is possible because ridership dataare available
• Time use information (travel times and scheduleadherence) is available along with passenger count data.
Problems encountered by OC Transpo in the early years ofdevelopment included acceptance by users (improved dramaticallyover time), software development, data storage prior to automatedradio-based data transfer (APC buses cannot store more than 3 or 4days of data), and maintenance. Other APC agencies have cited OCTranspo as not having significant maintenance problems, and this canbe attributed to a constant effort to keep on top of maintenance needsand to the presence of an electronic technologist as part of the APCteam. OC Transpo would like to see integration of its APC systemwith GIS, the use of which could simplify area and screenline reportinputs and allow graphical representation of the data.
Within the transit industry, there has been concern over theability to use APC systems with low-floor buses. OC Transpo hassuccessfully equipped a low-floor Orion II bus, and reports that thebeam-based counts are providing reliable data. With the proviso thatpassenger boardings be single-streamed (achieved through placementof stanchions, for example), the agency does not anticipate problemswith standard 40-ft low-floor vehicles.
Many agencies have looked to OC Transpo over the years foradvice on implementing APC systems. Experience over the past twodecades has suggested the following approaches to be mostbeneficial:

29
• Obtain a strong commitment from management--This isthe most critical factor in determining the ultimate success of an APCpassenger counting program. All other problems can be solved if thiscommitment is present. In particular, management commitmentallows you to develop standard procedures to be followed throughoutthe agency.
• Visit and learn from other transit agencies--APCtechnology is still viewed as new by many agencies, but there is aconsiderable and growing body of experience. Tapping thisexperience avoids recreating the wheel, increases awareness ofpotential pitfalls, and provides concrete examples of how solutions tovarious problems have been reached and implemented.
• Put a high priority on maintenance--Preventivemaintenance and early diagnosis of problems keep the APC systemoperating effectively.
• Address software issues--Once routine maintenanceprocedures are established and followed, hardware is rarely theproblem. APCs require a new approach to data collection, andexisting databases will need upgrading. Considerable effort isinvolved up front in APC implementation, but the results are clearlyworth the effort.
• Budget for system improvements every year--Thesegenerally relate to data processing and reporting enhancements. Theamount can be modest, but it will permit continued upgrades to thesystem.
SOUTH COAST AREA TRANSIT (SCAT)
SCAT is a small (46-bus) transit system serving Oxnard andsurrounding areas of Ventura County, California. Until recently,SCAT has counted ridership using GFI fareboxes at the system androute levels and interns (supplemented when necessary by temporaryworkers) with pencil and paper or handheld units at the route, trip,and trip segment levels. SCAT is now a beta test site for a smart cardand an APC demonstration project. The smart card data provideorigins and destinations, and have the potential to be useful forservice planning purposes as the use of smart cards by ridersincreases. An evaluation of the smart card demonstration is close tocompletion. Both the smart card and the APC systems use GPSvehicle location to determine at which stop boardings occur.
SCAT is planning to use APC data to conduct more detailedservice evaluations and to respond to Board inquiries in a moretimely fashion. A permanent schedule for APC data collection hasnot yet been set, but SCAT intends to evaluate recently institutedevening service by rotating the APC-equipped buses through theevening runs. Ridership data for smart cards and APCs are retrievedfrom the buses at the garage. The Planning and MarketingDepartment will have primary responsibility for ridership datacollection after the contractor completes its contract period.
South Coast Area Transit was originally approached to be abeta test site for a smart card and APC system. Due to limited size ofstaff and fleet, the agency declined the original offer, but the VenturaCounty Transportation Commission was intrigued with the idea andrecommended that all transit agencies
(SCAT and municipal systems) in the county participate. Afterreconsidering the potential benefits, SCAT agreed to participate. Oneof the more attractive elements of the arrangement is that the agencycan keep the equipment after the demonstration is completed.Because of this arrangement and the fact that the demonstration isongoing at this time, SCAT could not provide detailed capital,operating and maintenance costs associated with smart cards orAPCs.
The smart cards replaced the Countywide Passport, a multi-agency pass that was accepted by all transit agencies within VenturaCounty. Each transit agency still offers its own monthly pass, and theprice of a single-agency pass is less than the price of a smart card.Thus, the primary market for smart cards to date includes riders whouse more than one transit agency on a regular basis. Limited usage ofthe smart card limits the usefulness of the data to any one agency,because the data represent an atypical sample of ridership (i.e., thosewho use more than one system). The smart card data provide insightson multi-agency ridership patterns that were previously difficult totrack.
Customers reacted positively to the smart card, which wasviewed as the Passport in a slightly different form. The localnewspaper did a feature article in which some riders expressedconcern over the "big brother" aspects of the smart card, but mostriders were unaware that they were using a cutting-edge technology(14).
SCAT makes routine service changes once a year, with majorchanges to the route network coinciding with periodic larger studies.The APC system will replace the manual procedures that formerlyprovided the data used to identify needed service changes. At thetime of program initiation, all but two of SCAT's buses wereequipped with smart card readers. Since that time, nine replacementbuses have been added to the fleet, resulting in a fleet size of 46.Thirty-five buses, or 76 percent of the current fleet, are equippedwith smart card readers. Nine buses, or 20 percent of the fleet, areequipped with APC units.
SCAT does not envision any changes in personnel as a result ofadopting smart cards and APC. As with many smaller agencies,SCAT did not have a dedicated traffic checking force. Internsformerly handled data collection, and will be reassigned to otherfunctions.
It is too soon to quantify improvements associated with smartcards and APCs at SCAT, but the agency recognizes several potentialbenefits. The key benefit is improved route evaluation and planning.Smart cards are providing new information on multi-agency tripswithin Ventura County, and APC data will enhance SCAT's ability toevaluate service. The first major example of this ability is theupcoming evaluation of new evening service. SCAT also sees asimportant the ability to make a commitment (to its Board ofDirectors, for example) to conduct detailed ridership counts on aroutine basis, thus solidifying the Board's confidence in the agency'sday-today oversight of its system. Related to this is the ability torespond to inquiries from the agency's Board of Directors and othersin a more timely fashion.
The beta-test nature of the demonstration project wasresponsible for some of the problems that ensued. Communication

30
problems among the softwares of the smart card issuing equipment,the card reader, and the passenger card were traced to differentsoftware versions. In order to test various configurations, the vendorwould frequently switch equipment and revise software; once aspecific version was made to work, it was often replaced by anotherfor testing. This caused frustration among maintenance personnel,who were incorrectly perceived by many bus operators as beingresponsible for smart card equipment maintenance, as well as amongbus operators, who dealt on a daily basis with the inconsistency ofthe equipment's performance. Administrative personnel who sold thesmart cards did not have the technical knowledge to correct anysoftware problems that arose. Given SCAT's small size, this resultedin managers becoming involved in day-to-day trouble-shooting.Finally, the operators bore the brunt of customer dissatisfaction whena card would not function properly.
Overall, SCAT is satisfied with the very limited results to dateof the smart card and APC demonstration project, and envisionsadditional and more routine applications as the system matures fromits demonstration status. The agency recognizes that marketpenetration of smart cards is the key to obtaining useful ridershipdata. SCAT offers the following advice for agencies consideringeither smart cards or APCs:
• Be absolutely clear regarding roles--Each departmentneeds to understand its responsibilities in making implementationsuccessful. Operations, maintenance, administration, and planningmust clearly understand what they need to do as departments toensure a smooth transition and to work as a team in trouble-shooting.The role of the maintenance department can be particularlyimportant, whether it is to maintain the equipment or to facilitatemaintenance by the equipment contractor.
• Research training needs--Understand the timecommitment required both to train employees in retrieving andformatting data and to carry out these tasks.
• Work cooperatively with all departments involved--Inform the operators of the value of the new technology to gain theirsupport. Allow them to anticipate problems.
• Be aware that implementation will be harder thanexpected--Agencies typically adopt new technologies with a focus onbenefits and do not always fully understand the difficulty of adaptingall of their related procedures to function in coordination with thenew technology. The beta-test nature of the SCAT experienceintensified this problem, but the other case studies and surveyresponses consistently show a longer-than-anticipated break-inperiod and the emergence of unexpected issues.

31
CHAPTER EIGHT
CONCLUSIONS
Passenger counting remains an important function at transitagencies, which tend to measure their success by the number ofriders they carry. Systemwide and route-level ridership are of interestthroughout the transit agency. Ridership data at disaggregate levels,by route segment, stop, trip, and time of day, are generally utilized byservice planning and scheduling departments for detailed analyses oftransit routes and service levels. In the constrained fiscalenvironment affecting most transit agencies in recent years, thesetypes of analyses have often resulted in an ability to reallocate transitresources to more closely match demand patterns.
Passenger counting technologies and procedures have evolvedconsiderably from their paper and pencil origins, although paper andpencil continue to be the preferred mode of data collection at manyagencies, large and small. Choices now include hand-held units foruse by checkers on the buses, automated passenger counting (APC)systems, and electronic registering fareboxes (ERFs). Smart cardsalso offer potential in the area of passenger counting, but it ispremature to place them in the same category as the other options.Many agencies use different technologies for different purposes.
Smart cards are the most recent development in this area, andare still in the demonstration or preliminary installation phase on bussystems in North America. They potentially offer the ability tocombine boarding and fare information that can be recordedautomatically, although cash boardings must still be accounted for inanything less than a 100 percent smart card system. It is important tonote that passenger counting is not the major purpose of smart cards;fare collection issues are the driving force in the development of thistechnology. Depending on the market penetration of smart cards,passenger counting may have significant potential as a secondaryfunction of this developing fare medium.
APCs have been in use in a mature state for over a decade, butare still viewed by many agencies as a new technology. APCsprovide transit agencies with extensive capabilities to collectdetailed, stop-level ridership and time-based data that can be of greatpractical use to planners and schedulers. Signposts and GPS are mosttypically used to locate transit vehicles. Integration with new GPS-based AVL systems offers locational referencing and reduced costsper APC unit, which no longer needs to be equipped with locationalcomponents. APC technology continues to evolve to meet challengesoffered by different vehicle types, such as low-floor buses. APCs aremost useful at the trip, route segment, and stop levels. The automatedradio transmittal of data is a preferred method of data retrieval thatalso greatly reduces turnaround time. Agencies with APC equipmentgenerally collect ridership data on a given route more frequently thancan be done using manual techniques.
Electronic registering fareboxes are virtually standardequipment in the United States, although not in Canada.
Revenue-related issues have been the primary reason for the adoptionof ERFs by transit agencies; passenger counting is a secondaryfunction that can require operator intervention for non-cash fares.ERFs are most useful at the system and route levels in terms ofcounting riders. Some agencies (notably Chicago Transit Authority)have developed factors to convert revenue totals by route directly toridership. A common source of frustration with ERFs is the need foroperator intervention to obtain accurate data, both in terms ofoperator sign-on procedures and the recording of boardings bycertain types of fare media. ERF data are commonly used to trackoverall ridership trends. Passenger counting at the route level can beachieved only with full operator compliance with sign-on andpassenger recording procedures, particularly on systems withsignificant interlining of routes.
Hand-held units are used by traffic checkers to recordpassenger activity along a bus route. A key advantage for handheldunits over paper and pencil techniques is that the data can beuploaded automatically, eliminating the need for manual data inputand decreasing turnaround time. Hand-held units are used to collectroute, trip, and stop-level information. Some agencies usemanufactured units, while others rely on laptop computers. Poweringhand-held units can be a problem.
Ridership counting with paper and pencil has not yet beenreplaced by more advanced technologies. Familiarity with theprocedures involved is viewed as a benefit. Agencies such asHouston Metro have been successful in establishing passengercounting programs using manual techniques that provide sufficientridership data to meet agency needs. Manual data collectiontechniques are time-consuming and labor intensive, and manual datainput introduces another source of data error. These techniques donot require capital investment, and some observers have questionedwhether transit agencies have the resources to analyze ridership datamore frequently. Establishing a plan and schedule for manual datacollection is important in ensuring that all routes are covered on asystematic basis.
Key findings and conclusions of this synthesis are summarizedin the following paragraphs.
Procedures are more important than technology. Theestablishment of passenger counting procedures is much more criticalto success than the choice of technology, as shown by successfulprograms using manual techniques at Houston Metro and otheragencies around the country. Transit as an industry tends to focus toomuch on the hardware side and not enough on the need and uses forridership data within an agency.
Internal changes are necessary to ensure the success of newpassenger counting technologies. A significant investment in timeand effort is needed in the early stages to update internal databasesand analytical techniques to ensure that

32
correct stop and schedule data are available and that the ridershipdata can be readily used. Steps must also be taken to ensure that thesystem receives the priority it needs and to train staff in itsmaintenance and usage. In a very real sense, a passenger countingsystem does not stand alone.
Visit and learn from other agencies before deciding on a newpassenger counting technology. This emerged as a strongrecommendation from both the surveys and the case studies. Whileeach agency obviously has unique aspects, the process ofimplementing new passenger counting technologies is very similarthroughout the industry. Instead of re-inventing the wheel, a savvyagency can draw on the experiences of others in planning its ownimplementation of new technology.
Unnecessary customization should be avoided. Thisphenomenon is related to the emphasis on technology seen within thetransit industry. Attempts to redesign what is available on the marketto make one's own system unique or better almost always result infailure. Most installations require a fair degree of customization tomatch agency needs, but there are examples, such as Lane TransitDistrict in Eugene, Oregon, where a good passenger counting systemhas been established by combining standardized APC modules.
A strong commitment from senior management is required.Adoption of new passenger counting technologies and proceduresinvolves changes in departmental functions and responsibilities.Support from the general manager raises the priority attached topassenger counting and is of great assistance in ensuring cooperationamong the various departments involved.
Active management of the passenger counting system is criticalto success. Senior management support is vital, but agencies thathave successfully adopted new technologies are characterized by amid-level person who assumes responsibility for the system andtakes the necessary action to ensure its proper functioning. Withoutthis sense of ownership, the project can fall between the bureaucraticcracks. Internal agency politics can lead to the same result. Theresponsible person typically has oversight over ridership datacollection and/or use.
Responsibilities must be clarified. Agencies that have strongservice planning and scheduling departments and take a proactiveapproach to making changes to their routes and networks tend tomake the best use of advanced passenger counting technologies.However, adopting a new technology is not a step taken in isolation.Internal working relationships (between planning and dispatching,for example) are likely to change noticeably. The agency must beprepared and willing to make necessary changes in ancillaryprocedures to make maximum use of advanced passenger countingtechnologies. Cooperation from several departments within theagency is needed, and does not necessarily happen overnight.Clarification of responsibilities at the outset is advised by agenciesthat have been through the process. Obtaining buy-in from the busoperators can pose particular problems beyond interdepartmental
cooperation. The additional operator duties required by ERFs aretypically a negotiated item with the union. To promote cooperationwith use of APCs, at least one agency implemented a policy thatAPC information could not be used as a basis for disciplinary actionagainst an operator.
Advanced passenger counting technologies offer severalbenefits. Among benefits cited by survey and case study agencies aremore frequent data collection, a reduction in turnaround time, theability to analyze ridership data at finer levels of detail, greatertimeliness and responsiveness, and lower cost. These do not accrueautomatically; the most successful agencies have updated internaldatabases and adapted procedures to maximize the benefits offeredby advanced technologies.
There is no one perfect solution. Agencies must consider theirneed for and uses of ridership data before deciding how best toproceed. Each ridership counting technology is appropriate to use forcertain purposes, and there are successful examples of each in thecase studies. Many agencies using manual techniques are satisfiedwith established data collection schedules and have been successfulin meeting the needs of data users. One hundred percent accuracydoes not exist with any technology. New passenger countingtechnologies have a break-in period of approximately 18 monthsduring which start-up problems are identified and solved.
It is interesting to consider the adoption of new passengercounting technologies within the transit industry in the broadercontext of the spread of any new technology in any industry. A fewinnovators first implement new technologies when they becameavailable, because these agencies immediately grasp the benefits totheir operation. These are followed by early adopters, agencies thatpay close attention to industry trends and see that the potentialbenefits of these new technologies are being realized. Late adopters,always the largest group, follow trends in technology once they arewell established. Traditionalists, the fourth and final group in thistypology, continue to observe the old ways of doing things long afternew technologies are proven.
The transit industry appears to be in the latter stages of earlyadoption. New technologies and procedures can significantlyincrease the timeliness, quality, and quantity of ridership dataavailable to an agency, enabling it to be more responsive to specialrequests and queries. Time invested in the early stages of use of newtechnologies to ensure that the agency's house is in order is generallyconsidered to be well spent, and results in smooth data collection andanalysis procedures once the initial bugs have been worked out.Nearly every agency surveyed reports that new passenger countingtechnologies are at least under active consideration, and manyindicate plans to purchase in the near future. New developments andrefinements in passenger counting technologies, along with theintegration of the passenger counting function in ITS applications,suggest that the field will continue to evolve rapidly over the nextdecade.

33
REFERENCES
1. Hodges, C.C., Automatic Passenger CounterSystems: The State of the Practice, prepared forthe Office of Planning Assistance, Urban MassTransportation Administration, Washington, D.C.,Report No. DOT-I-87-36 (June 1985).
2. Labell, L.N., C.P. Schweiger, and M. Kihl,Advanced Public Transportation Systems: TheState of the Art Update '92, John A. VolpeNational Transportation Systems Center,Cambridge, Mass, Report No. DOT-VNTSC-FTA-92-3 (April 1992).
3. Rossetti, M.D., "Automatic Data Collection onTransit Users via Radio Frequency Identification,"IDEA Project Final Report Contract TRANSIT-10,Transportation Research Board, Washington, D.C.(June 1996).
4. Greneker III, E., K. Murphy, and B. Johnson,"Improved Passenger Counter and ClassifierSystem for Transit Operations," IDEA ProjectFinal Report Contract TRANSIT-5, TransportationResearch Board, National Research Council,Washington, D.C. (September 1996).
5. Boyle, D. K. and V. A. Perk, Transit ServicePerformance Analysis and Monitoring Process,prepared for Metro-Dade Transit Agency byCenter for Urban Transportation Research, Tampa,Florida, (August 1995).
6. Microtronix Vehicle Technologies Ltd. andWardrop Engineering Inc., Description of aStandard Automatic
Passenger Counting System for the TransitIndustry, London, Ontario, no date.
7. Urban Transportation Associates, Inc., AutomaticPassenger Counter Catalog of SoftwareCapability, Cincinnati, Ohio, no date.
8. Red Pine Instruments Ltd, APC Systems, Denbigh,Ontario, no date. See especially the Preface, pp. 1-8.
9. Washington Metropolitan Area Transit Authority,Study of Hand-Held Data Collection Devices,internal study (November 1993).
10. Saunders, R. W., Transit Properties TelephoneInterview for Hand Held Data Collection Devices,internal memorandum, Washington MetropolitanArea Transit Authority, Jan. 26, 1996.
11. Chicago Transit Authority, APC System TransitInterested Parties, (March 1996).
12. Ottawa-Carleton Regional Transit Commission,Systems Planning Department, APC at OCTranspo: "A New Dimension," Ottawa, Ontario(March 1986).
13. Baltes, M.R. and J.R. Rey, Lynx AutomatedPassenger Counter Pilot Project:Recommendations, prepared for Lynx by Centerfor Urban Transportation Research, Tampa,Florida, (November 1996).
14. Sullivan, T. J., "Do They Know Too Much?"Ventura County Sunday Star, November 24, 1996.
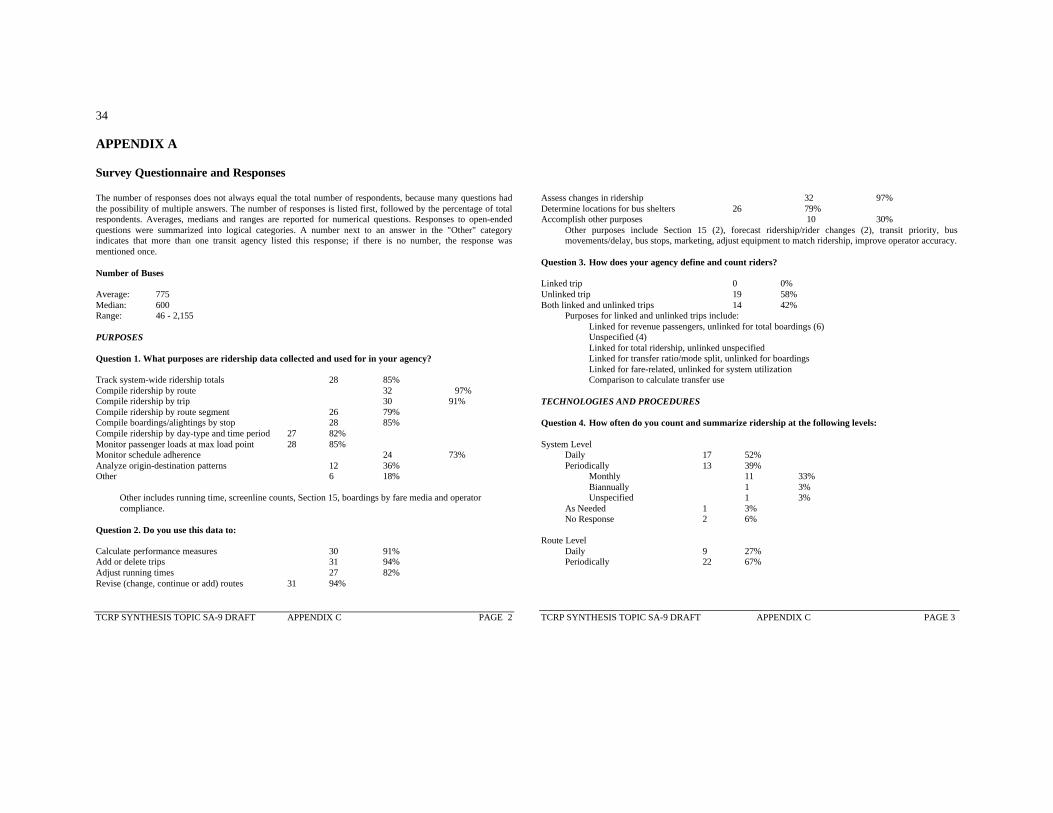
34
APPENDIX A
Survey Questionnaire and Responses
The number of responses does not always equal the total number of respondents, because many questions hadthe possibility of multiple answers. The number of responses is listed first, followed by the percentage of totalrespondents. Averages, medians and ranges are reported for numerical questions. Responses to open-endedquestions were summarized into logical categories. A number next to an answer in the "Other" categoryindicates that more than one transit agency listed this response; if there is no number, the response wasmentioned once.
Number of Buses
Average: 775Median: 600Range: 46 - 2,155
PURPOSES
Question 1. What purposes are ridership data collected and used for in your agency?
Track system-wide ridership totals 28 85%Compile ridership by route 32 97%Compile ridership by trip 30 91%Compile ridership by route segment 26 79%Compile boardings/alightings by stop 28 85%Compile ridership by day-type and time period 27 82%Monitor passenger loads at max load point 28 85%Monitor schedule adherence 24 73%Analyze origin-destination patterns 12 36%Other 6 18%
Other includes running time, screenline counts, Section 15, boardings by fare media and operator compliance.
Question 2. Do you use this data to:
Calculate performance measures 30 91%Add or delete trips 31 94%Adjust running times 27 82%Revise (change, continue or add) routes 31 94%
TCRP SYNTHESIS TOPIC SA-9 DRAFT APPENDIX C PAGE 2
Assess changes in ridership 32 97%Determine locations for bus shelters 26 79%Accomplish other purposes 10 30%
Other purposes include Section 15 (2), forecast ridership/rider changes (2), transit priority, busmovements/delay, bus stops, marketing, adjust equipment to match ridership, improve operator accuracy.
Question 3. How does your agency define and count riders?
Linked trip 0 0%Unlinked trip 19 58%Both linked and unlinked trips 14 42%
Purposes for linked and unlinked trips include:Linked for revenue passengers, unlinked for total boardings (6)Unspecified (4)Linked for total ridership, unlinked unspecifiedLinked for transfer ratio/mode split, unlinked for boardingsLinked for fare-related, unlinked for system utilizationComparison to calculate transfer use
TECHNOLOGIES AND PROCEDURES
Question 4. How often do you count and summarize ridership at the following levels:
System LevelDaily 17 52%Periodically 13 39%
Monthly 11 33%Biannually 1 3%Unspecified 1 3%
As Needed 1 3%No Response 2 6%
Route LevelDaily 9 27%Periodically 22 67%
TCRP SYNTHESIS TOPIC SA-9 DRAFT APPENDIX C PAGE 3

35
Monthly 7 21%Quarterly 8 24%Biannually 1 3%Annually 2 6%Less than once a year 4 12%As Needed 2 6%
Trip LevelDaily 3 9%Periodically 17 52%
Monthly 1 3%Quarterly 8 24%Annually 3 9%Less than once a year 5 15%
As Needed 13 39%
Route Segment LevelPeriodically 13 39%
Monthly 1 3%Quarterly 3 9%Annually 4 12%Less than once a year 5 15%
As Needed 16 48%No Response 4 12%
Stop Ons/OffsPeriodically 13 39%
Monthly 1 3%Quarterly 3 9%Annually 4 12%Less than once a year 5 15%
As Needed 18 55%No Response 2 6%
Maximum Load PointsDaily 1 3%
TCRP SYNTHESIS TOPIC SA-9 DRAFT APPENDIX C PAGE 4
Periodically 18 55%Monthly 1 3%Quarterly 11 33%Annually 2 6%Less than once a year 2 6%Unspecified 2 6%
As Needed 12 36%No Response 2 6%
Question 5. If you conduct detailed counts and analysis at the route, stop or segment level for service planning or scheduling purposes, how often is ridership on any given route counted and analyzed for:
WeekdaysDaily 2 6%Monthly 4 12%Quarterly 9 27%Biannually 1 3%Annually 5 15%Every 1-2 years 4 12%Every 2+ years 6 18%As needed/no fixed schedule 1 3%No response 1 3%
SaturdaysDaily 2 6%Monthly 2 6%Quarterly 6 18%Biannually 5 15%Annually 2 6%Every 1-2 years 0 0%Every 2+ years 6 18%As needed/no fixed schedule 9 27%No response 1 3%
Sundays
TCRP SYNTHESIS TOPIC SA-9 DRAFT APPENDIX C PAGE 5

36
Daily 2 6%Monthly 2 6%Quarterly 5 15%Biannually 5 15%Annually 1 3%Every 1-2 years 0 0%Every 2+ years 6 18%As needed/no fixed schedule 10 30%No response 2 6%
Question 6. Do you conduct complete 100 percent ridership counts or do you use some sort of sampling plan?
System Level100% Count 14 42%Factored from Revenue 16 48%Sample 0 0%Combination 2 6%Not Specified 1 3%
Route Level100% Count 20 61%Factored from Revenue 5 15%Sample 5 15%Combination 1 3%Not Specified 2 6%
Trip Level100% Count 21 64%Factored from Revenue 1 3%Sample 10 30%Combination 1 3%Not Specified 0 0%
Route Segment Level100% Count 17 52%
TCRP SYNTHESIS TOPIC SA-9 DRAFT APPENDIX C PAGE 6
Factored from Revenue 1 3%Sample 10 30%Combination 1 3%Not Specified 4 12%
Stop Ons/Offs100% Count 19 58%Factored from Revenue 0 0%Sample 10 30%Combination 2 6%Not Specified 2 6%
Question 7. If you indicated use of a factored or sampling method in Question 6, pleasedescribe the factors used and/or your sampling plan and data expansiontechniques.
Expand by fare payment type 5 15%Derive ridership using average fare 4 12%Each trip three times 4 12%Each trip once 2 6%Other 8 24%
Other includes APC-related, typical day, random sample, adjust farebox data by means of asample survey, FTA cost revenue basis, Section 15-related, monthly average of farebox data,and econometric model.
Question 8. How do you collect ridership data?
Manually, estimating ridership from passenger revenue 13 39%Manually, via vehicle operator trip cards 14 42%Manually, using traffic checkers, pencil and paper 23 70%Manually, using traffic checkers and hand-held units 12 36%Manually, via on-board surveys 15 45%Via electronic registering fareboxes 23 70%Via smart cards 2 6%Via automatic passenger counting (in use) 8 24%Via automatic passenger counting (testing) 5 15%
TCRP SYNTHESIS TOPIC SA-9 DRAFT APPENDIX C PAGE 7

37
Question 9. If your agency uses more than one technique for collecting ridership data,please indicate the purposes each technique is used for.
Manually, estimating ridership from passenger revenueGeneral purposes 1 8% of 13 systems using this techniqueSystem ridership 7 54%Special purposes only 2 15%Other/unspecified 3 23%
Manually, via vehicle operator trip cardsGeneral purposes 3 21% of 14 systems using this techniqueSystem ridership 1 7%Route ridership 2 14%Trip ridership 1 7%Special purposes only 6 43%Other/unspecified 1 7%
Manually, using traffic checkers, pencil and paperGeneral purposes 13 57% of 23 systems using this techniqueTrip ridership 1 4%Special purposes only 6 26%Other/unspecified 5 23%
Manually, using traffic checkers and hand-held unitsGeneral purposes 7 54% of 13 systems using this techniqueRoute ridership 2 15%Trip ridership 1 8%Loads 1 8%Schedule adherence 1 8%Special purposes only 1 8%Other/unspecified 3 23%
Manually, via on-board surveysSystem ridership 1 7% of 15 systems using this techniqueLoads 1 7%Schedule adherence 1 7%
TCRP SYNTHESIS TOPIC SA-9 DRAFT APPENDIX C PAGE 8
Special purposes only 1 7%Rider profile/market research 4 27%Ridership by fare type 2 13%Other/unspecified 6 40%
Via electronic registering fareboxesGeneral purposes 3 13% of 23 systems using this techniqueSystem ridership 16 70%Route ridership 8 35%Trip ridership 3 13%Ridership by fare type 2 9%Other/unspecified 2 9%Use, but not reliable 2 9%
Via smart cardsRail only 1 50% of 2 systems using this techniqueCurrently testing 1 50%
Via automatic passenger counting (in use)General purposes 5 63% of 8 systems using this techniqueSystem ridership 1 13%Route ridership 2 25%Trip ridership 1 13%
Via automatic passenger counting (currently testing) 5 systems
PROCESSING AND REPORTING
Question 10. How does your agency input ridership data?
Manual data input 19 58%Paper input via Optical Character Reader 2 6%Hand-held data transmitted via physical connection to host computer 8 24%Hand-held data transmitted remotely 7 21%Direct downlink (probe) of electronic fare collection data 20 61%Retrieval of electronic fare collection data at garage without physical connection 4 12%
TCRP SYNTHESIS TOPIC SA-9 DRAFT APPENDIX C PAGE 9

38
Dynamic or periodic remote retrieval of electronic fare collection data 2 6%Direct downlink (probe) of APC data 2 6%Retrieval of APC data at garage without physical connection 4 12%Dynamic or periodic remote retrieval of APC data 2 6%
Question 11. Please describe what steps are taken to edit and validate ridership data.
Compare ridership and revenue totals 20 61%Compare with previously collected route-level data 24 73%Look for unexplained variations across trips 19 58%Compare daily ridership totals (if counts are taken on more than one day) 13 39%Rely on the professional judgment of planners/schedulers 21 64%Other 6 18%
Other includes use of thresholds, driver observations, compare ons/offs by trip, compare APC withmanual counts, check that data are collected on "normal" days, and compare to other datain the same time period
Question 12. What types of reports are routinely generated from ridership data? Please alsoindicate approximately how often each type of report is prepared.
System ridershipfrom farebox/trip cards 24 73%from boarding/alighting data 3 9%from both 1 3%not specified 3 9%
Daily report 8 26% of 31 systems preparing this reportMonthly report 16 52%Quarterly report 2 6%Biannual report 1 3%Annual report 1 3%Not specified 3 10%
Route ridershipfrom farebox/trip cards 15 46%from boarding/alighting data 14 42%
TCRP SYNTHESIS TOPIC SA-9 DRAFT APPENDIX C PAGE 10
from both 1 3%not specified 2 6%
Daily report 4 13% of 32 systems preparing this reportMonthly report 11 34%Quarterly report 6 19%Biannual report 1 3%Annual report 2 6%Less frequently/as needed 6 19%Not specified 2 6%
Route segment ridership from farebox/trip cards 1 3%from boarding/alighting data 20 61%from both 2 6%
Quarterly report 4 17% of 23 systems preparing this reportBiannual report 2 9%Annual report 3 13%Less frequently/as needed 13 57%Not specified 1 4%
Stop-level boardings/alightingsfrom boarding/alighting data 24 73%from both 2 6%
Monthly report 2 8% of 26 systems preparing this reportQuarterly report 3 12%Biannual report 1 4%Annual report 6 23%Less frequently/as needed 13 50%Not specified 1 4%
Performance measuresfrom farebox/trip cards 11 33%from boarding/alighting data 12 36%
TCRP SYNTHESIS TOPIC SA-9 DRAFT APPENDIX C PAGE 11

39
from both 4 12%Not specified 1 3%
Daily report 1 4% of 28 systems preparing this reportMonthly report 8 29%Quarterly report 4 14%Biannual report 1 4%Annual report 4 14%Less frequently/as needed 8 29%Not specified 2 7%
Schedule adherencefrom farebox/trip cards 2 6%from boarding/alighting data 15 45%from both 1 3%other/not specified 5 15%
Monthly report 5 22% of 23 systems preparing this reportQuarterly report 4 17%Biannual report 2 9%Annual report 2 9%Less frequently/as needed 8 35%Not specified 2 9%
Otherfrom farebox/trip cards 1 3%from boarding/alighting data 4 12%
Monthly report 2 40% of 5 systems preparing other reportsAnnual report 1 20%Less frequently/as needed 2 40%
Other reports include Section 15 (2), running times, running time utilization, transfers, scheduleadherence, and activity center checks
Question 13. How did your agency develop data processing and report generation software?
TCRP SYNTHESIS TOPIC SA-9 DRAFT APPENDIX C PAGE 12
In-house, by MIS or computer services department 20 61%In-house, by end users of data 12 36%Through the hardware vendor 11 33%Through another outside vendor 14 42%Through in-house department staff 3 9%No response 1 3%
Question 14. If software was developed through an outside vendor, did the process include customization or modification of the software?
Yes, considerable 12 67% of 18 systems using the hardware vendor or an outside vendorYes, moderate 3 17%Yes, minor 2 11%No 1 6%
Question 15. Does your agency have the capability of generating ad hoc, specialized ridershipreports?
Yes, through MIS or computer services department 15 45%Yes, directly by end users 21 64%
Yes, through the outside vendor 6 18%Through in-house department staff 3 9%No 2 6%
ORGANIZATION
Question 16. Within your agency, which organizational unit is responsible for the followingaspects of ridership data collection?
Overall MethodologyBudget/Finance 11 33%Planning 23 70%Scheduling 19 58%Computer Services/MIS 5 15%Other 6 18%
TCRP SYNTHESIS TOPIC SA-9 DRAFT APPENDIX C PAGE 13

40
Other includes Analysis/Research/Customer Services (4) and APC Manager/User IS Group (2)
Selection of Data to be CollectedBudget/Finance 5 15%Planning 26 79%Scheduling 22 67%Computer Services/MIS 1 3%Other 5 15%
Other includes Analysis/Research/Customer Services (4) and APC Manager/User IS Group
System Set-Up and ImplementationBudget/Finance 6 18%Planning 19 58%Scheduling 12 36%Computer Services/MIS 14 42%Other 7 21%
Other includes Analysis/Research/Customer Services (4), APC Manager/User IS Group(2) and Operations
Day-to-Day ManagementBudget/Finance 8 24%Planning 19 58%Scheduling 13 39%Computer Services/MIS 4 12%Other 7 21%
Other includes Analysis/Research/Customer Services (4), APC Manager/User IS Group(2) and Maintenance
Question 17. Which organizational units use the ridership data?
At the system levelBudget/Finance 30 91%Planning 25 76%Scheduling 10 30%Computer Services/MIS 1 3%
TCRP SYNTHESIS TOPIC SA-9 DRAFT APPENDIX C PAGE 14
Other 12 36%Other includes Marketing/Government Relations (6), Analysis/Research/Customer Services (4),Executive Office/Senior Management (4), Operations (2) and the State
At the route levelBudget/Finance 5 15%Planning 31 94%Scheduling 28 85%Computer Services/MIS 1 3%Other 10 30%
Other includes Marketing/Government Relations (5), Analysis/Research/Customer Services (3),Operations (3), and Executive Office/Senior Management (3)
At the trip levelPlanning 30 91%Scheduling 30 91%Other 5 15%
Other includes Analysis/Research/Customer Services (3), Operations (3), and Legal/WorkersCompensation
At the route segment levelPlanning 27 82%Scheduling 26 79%Other 4 12%
Other includes Analysis/Research/Customer Services (3) and Operations (2)
At the bus stop levelPlanning 25 76%Scheduling 20 61%Computer Services/MIS 2 6%Other 10 30%
Other includes Operations (4), Analysis/Research/Customer Services (4), Marketing/PublicAffairs (2) and Maintenance
TCRP SYNTHESIS TOPIC SA-9 DRAFT APPENDIX C PAGE 15

41
Question 18. If the data users are different from those responsible for the data collectionprocess, please describe briefly the interaction between the two groups and anysynergy or problems that arise as a result of the separation of these functions.
Clarification of Responsibilities 7 42% of 17 systems responding to this questionCommunications 4 24%Data Issues 3 18%Priority 2 12%No problem 2 12%
RESOURCE REQUIREMENTS
Question 19. How many staff (in terms of full-time equivalents) are assigned to carry out your agency's passenger counting program?
Managers/ProfessionalsAverage 2.22 Median 1
by data collection technologyManual Average 2.31 Median 1Hand Held Average 2.33 Median 2.5ERF Average 2.28 Median 1APC Average 2.34 Median 1
Support (i.e., equipment maintenance staff)Average 1.25 Median 0
by data collection technologyManual Average 1.81 Median 0Hand Held Average 0.58 Median 0ERF Average 1.93 Median 0APC Average 0.94 Median I
ClericalAverage 1.28 Median 1
TCRP SYNTHESIS TOPIC SA-9 DRAFT APPENDIX C PAGE 16
by data collection technologyManual Average 1.41 Median 1Hand Held Average 1.67 Median 1.5ERF Average 1.65 Median 1APC Average 0.27 Median 0
Traffic CheckersAverage 8.59 Median 4
by data collection technologyManual Average 10.88 Median 7Hand Held Average 12.33 Median 5.5ERF Average 9.33 Median 8APC Average 1.50 Median 0
OtherAverage 0.55 Median 0
by data collection technologyManual Average 0.75 Median 0Hand Held Average 0.83 Median 0ERF Average 0.47 Median 0APC Average 0.06 Median 0
TotalAverage 13.89 Median 7
by data collection technologyManual Average 17.15 Median 10.5Hand Held Average 17.75 Median 9ERF Average 15.67 Median 12APC Average 5.11 Median 4
Question 20. What is the cost associated with your agency's passenger counting technology and program? Please report capital, operating, and maintenance costs separately. For capital costs, list actual purchase cost and year purchased. If
TCRP SYNTHESIS TOPIC SA-9 DRAFT APPENDIX C PAGE 17
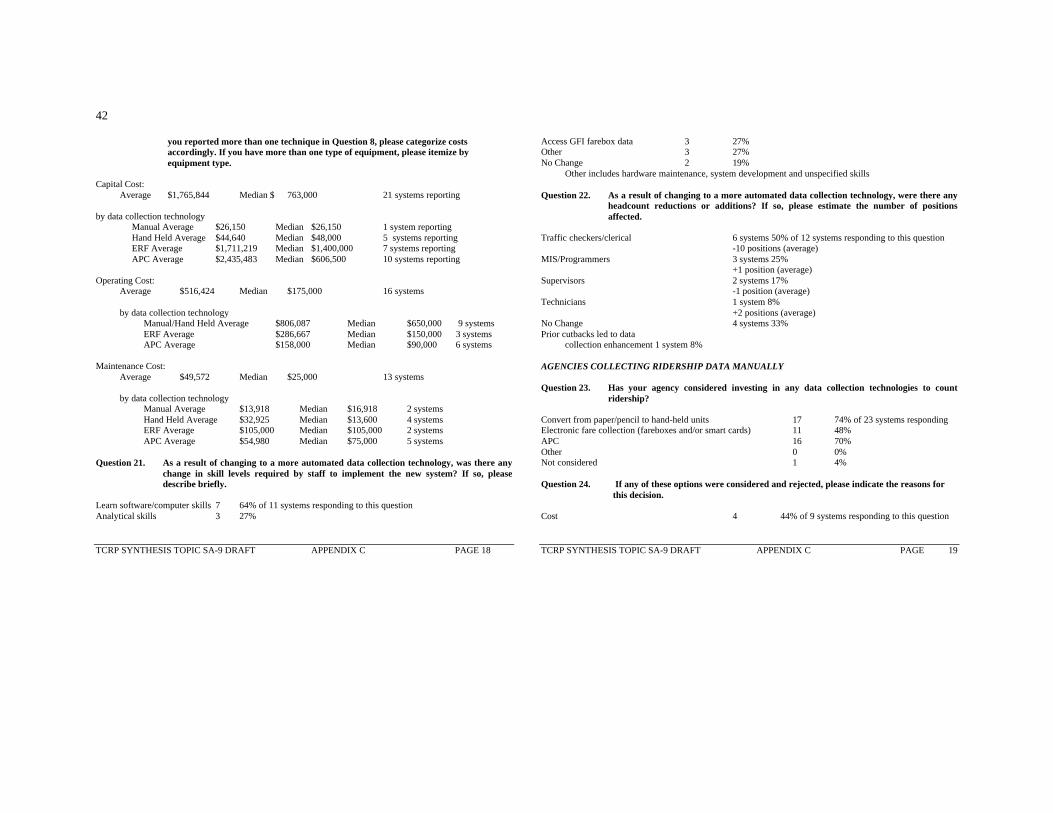
42
you reported more than one technique in Question 8, please categorize costs accordingly. If you have more than one type of equipment, please itemize by equipment type.
Capital Cost:Average $1,765,844 Median $ 763,000 21 systems reporting
by data collection technologyManual Average $26,150 Median $26,150 1 system reportingHand Held Average $44,640 Median $48,000 5 systems reportingERF Average $1,711,219 Median $1,400,000 7 systems reportingAPC Average $2,435,483 Median $606,500 10 systems reporting
Operating Cost:Average $516,424 Median $175,000 16 systems
by data collection technologyManual/Hand Held Average $806,087 Median $650,000 9 systemsERF Average $286,667 Median $150,000 3 systemsAPC Average $158,000 Median $90,000 6 systems
Maintenance Cost:Average $49,572 Median $25,000 13 systems
by data collection technologyManual Average $13,918 Median $16,918 2 systemsHand Held Average $32,925 Median $13,600 4 systemsERF Average $105,000 Median $105,000 2 systemsAPC Average $54,980 Median $75,000 5 systems
Question 21. As a result of changing to a more automated data collection technology, was there anychange in skill levels required by staff to implement the new system? If so, pleasedescribe briefly.
Learn software/computer skills 7 64% of 11 systems responding to this questionAnalytical skills 3 27%
TCRP SYNTHESIS TOPIC SA-9 DRAFT APPENDIX C PAGE 18
Access GFI farebox data 3 27%Other 3 27%No Change 2 19%
Other includes hardware maintenance, system development and unspecified skills
Question 22. As a result of changing to a more automated data collection technology, were there anyheadcount reductions or additions? If so, please estimate the number of positionsaffected.
Traffic checkers/clerical 6 systems 50% of 12 systems responding to this question-10 positions (average)
MIS/Programmers 3 systems 25%+1 position (average)
Supervisors 2 systems 17%-1 position (average)
Technicians 1 system 8%+2 positions (average)
No Change 4 systems 33%Prior cutbacks led to data
collection enhancement 1 system 8%
AGENCIES COLLECTING RIDERSHIP DATA MANUALLY
Question 23. Has your agency considered investing in any data collection technologies to countridership?
Convert from paper/pencil to hand-held units 17 74% of 23 systems respondingElectronic fare collection (fareboxes and/or smart cards) 11 48%APC 16 70%Other 0 0%Not considered 1 4%
Question 24. If any of these options were considered and rejected, please indicate the reasons for this decision.
Cost 4 44% of 9 systems responding to this question
TCRP SYNTHESIS TOPIC SA-9 DRAFT APPENDIX C PAGE 19

43
Other technologies have priority 3 27%Accuracy concerns 2 18%Marginal usefulness 2 18%Lack of personnel 1 9%
Question 25. What is the current status regarding agency investment in passenger countingtechnologies?
Plan to purchase 12 52% of 23 systems responding to this questionAPC 7Additional APC units 2Hand-held units 2Unspecified 2
Still being decided 9 39%Considered, but rejected 1 4%Has not been considered 1 4%
Question 26. What sort of information regarding these technologies has been or would be ofgreatest use to your agency?
Inventory of vendors/technologies available 5 42% of 12 systems responding to this questionAbility to duplicate/improve data collection 4 33% Experience elsewhere 4 33%Integration with fare structure/other components 2 17%Other 3 25%
Other includes equipment reliability, data management issues, maintenance cost
Question 27. Please rate the usefulness of current manual techniques on a scale of 1 to 5, with1 being least useful and 5 being most useful, in terms of collecting ridershipdata:
Averages:At the system level 2.05At the route level 3.63At the trip level 4.21At the route segment level 4.44
TCRP SYNTHESIS TOPIC SA-9 DRAFT APPENDIX C PAGE 20
At the stop level 4.21
Question 28. What have been the major problems encountered with manual collection techniques?
Accuracy 7 39% of 18 systems responding to this questionTime-consuming 7 39%Absenteeism/missed data 6 33%Limited resources/cost 6 33%Labor intensive/labor issues 4 22%Off peak/weekend data collection 3 17%Correct stop list/preparing data sheets 2 11%
AGENCIES WITH ELECTRONIC REGISTERING FAREBOXES
Question 29. How many buses and what percentage of your fleet are equipped with electronic registering fareboxes?
Average number of buses 730Average percentage of bus fleet 100%
Question 30. Please indicate the type of farebox and other hardware/software options.
GFI 16 70% of 23 systems responding to this questionCubic 2 9%GFI hardware/Cubic software 1 4%Duncan Faretronic 1 4%Unspecified 3 13%
Question 31. How are ridership data accumulated?
Bus block or run assignment 10 43% of 23 systems respondingOperator run assignment 5 22%Operator run assignment with route segmentation 5 22%Operator run assignment with route and trip segmentation 9 39%
TCRP SYNTHESIS TOPIC SA-9 DRAFT APPENDIX C PAGE 21

44
Question 32. How satisfied have you been with the performance of this equipment in terms of counting passengers?
Very satisfied 5 22%Satisfied 11 48%Dissatisfied 6 26%Very dissatisfied 0 0%Neutral 1 4%Average (1 = very dissatisfied, 4 = very satisfied) = 2.93
Question 33. Most new technologies require an implementation or "debugging" period in whichoperators become familiar with the new equipment and start-up problems areaddressed. How long did this period last at your agency?
Average = 17.42 months
Question 34. What have been the primary benefits of the fareboxes for the agency?
Improved accuracy/reliability/access to data 9 43% of 21 systems responding to this questionRidership by route, block, and trip 8 38%More data; more detailed data 7 33%Ridership by fare category 5 24%Improved accountability/revenue control 5 24%Systemwide ridership 4 19%
Question 35. What have been the major problems encountered with the fareboxes?
Currency jams/equipment problems 12 60% of 20 systems responding to this questionOperator compliance/attitude 8 40%Software problems/limited data manipulation 5 25%Accuracy 4 20%Other 4 20%No problems 3 15%
Other includes vendor cooperation, cost to maintain, maintaining revenue security procedures, and lackof integration with other on-board systems.
TCRP SYNTHESIS TOPIC SA-9 DRAFT APPENDIX C PAGE 22
Question 36. Do you check the accuracy of farebox data? If so, please explain how farebox data are verified.
Compare with revenue 6 32% of 19 systems responding to this questionCompare with manual counts 4 21%Random checks and counts 2 11%Other 3 16%No verification 3 16%
Other includes check against past counts, verify on an exception basis only, and compare withAPC
Question 37. Please rate the usefulness of the fareboxes on a scale of 1 to 5, with 1 being least usefuland 5 being most useful, in terms of collecting ridership data:
Averages:At the system level 4.33At the route level 3.81At the trip level 2.60At the route segment level 1.06At the stop level 1.00
Question 38. What advice would you offer to other agencies interested in using electronic registeringfareboxes to collect ridership data?
Comprehensive, ongoing training for drivers 6 35% of 17 systems responding to this questionDevelop internal programs to analyze data 6 35%Ensure that it can handle your fare structure 4 24%Identify specific responsibilities 3 18%Test often for accuracy 3 18%Wait for new technology to be proven 2 12%Work with manufacturers/software vendors 2 12%Frequent preventive maintenance 2 12%Very worthwhile for trip/system level data 2 12%Understand reporting capabilities 2 12%Ensure large memory or transmit data via radio 1 6%
TCRP SYNTHESIS TOPIC SA-9 DRAFT APPENDIX C PAGE 23

45
AGENCIES WITH SMART CARDS
Question 39. How many buses and what percentage of your fleet are equipped with smart card technology?
Average number of buses 13Average percentage of bus fleet 27.1%
Question 40. How satisfied have you been with the performance of this equipment in terms of counting passengers?
Satisfied 1
Question 41. Most new technologies require an implementation or "debugging" period in whichoperators become familiar with the new equipment and start-up problems areaddressed. How long did this period last at your agency?
6-18 months (two responses)
Question 42. What have been the primary benefits of smart cards for the agency?
Demo only, but great experience 1Section 15 data collection 1
Question 43. What have been the major problems encountered with smart cards?
Software bugs/software integration 2Equipment problems 2Training re data retrieval 1
Question 44. Do you check the accuracy of smart card data? If so, please explain how smart card data are verified.
Compare to manual counts 1Customer interaction 1No verification yet 1
TCRP SYNTHESIS TOPIC SA-9 DRAFT APPENDIX C PAGE 24
Question 45. Please rate the usefulness of smart cards on a scale of 1 to 5, with 1 being least useful and 5 being most useful, in terms of collecting ridership data:
Only one response:At the system level 2.0At the route level 2.0At the trip level 2.0At the route segment level 1.0At the stop level 1.0
Note: Low ratings on usefulness are closely related to the fact that the number of smart card users is verylimited at this time.
Question 46. What advice would you offer to other agencies interested in using smart cards to collect ridership data?
Be very deliberate as the system is designedGet the support of the Maintenance Dept.Work with bus operators to gain their cooperationDon't believe anyone who tells you it's simpleResearch the time investment required in training and in retrieving/formatting data
AGENCIES USING APC
Question 47. How many buses and what percentage of your fleet are equipped with APC units?
Average number of buses 51Average percentage of bus fleet 6.8%Average percentage for non-demonstration agencies 9.2%
Question 48. Who manufactures your agency's APC system (Hardware and Software)?
UTA 4 33% of 13 systems with APCs BothMicrotronix 2 17% hardware onlyRed Pine 2 17% one hardware only, one bothWardrop 2 17% one software only, one both
TCRP SYNTHESIS TOPIC SA-9 DRAFT APPENDIX C PAGE 25

46
Internal development 2 7% software onlyOthers 5 33%
Others include Echelon (both) Mafia (hardware), IRL (hardware), Pachera (hardware), SWISystemware (software)
Question 49. How are passenger boardings/alightings counted?
Infrared beam 7 54% of 13 systems with APCsTreadle mats 6 46%
Question 50. How is location ascertained?
Signposts 6 46% of 13 systems with APCsGlobal Positioning System (GPS) 4 31%Differential GPS 1 8%Other 2 15%Other includes signpost/GPS, mileage off bus transmission
Question 51. How satisfied have you been with the performance of this equipment in termsof counting passengers?
Very satisfied 4 36% of 11 systems responding to this questionSatisfied 7 64%Dissatisfied 0 0%Very dissatisfied 0 0%Average (1 = very dissatisfied, 4 = very satisfied): 3.36
Question 52. Most new technologies require an implementation or "debugging" period in whichoperators become familiar with the new equipment and start-up problems are ironedout. How long did this period last at your agency?
Average: 16.9 months
Question 53. What have been the primary benefits of APC for the agency?
Detailed, more frequent data 9 75% of 12 systems responding to this question
TCRP SYNTHESIS TOPIC SA-9 DRAFT APPENDIX C PAGE 26
Cost savings 4 33%Other 4 33%
Other includes minimized turnaround/reporting time, understanding of what needs changing internally,Section 15 data collection, and electronic data transmission
Question 54. Have there been any problems encountered with the APC system?
Software development/maintenance/abilities 5 46% of 11 systems responding to this questionMaintenance/APC unit durability 4 36%Signpost difficulties 3 27%Data processing/manipulation time consuming 3 27%User acceptance/priority within agency 3 27%Other 3 27%
Other includes inability to equip all vehicle types within the fleet, incompatibility with operatingprocedures, and locational referencing problems in the absence of an AVL system
Question 55. Please rate the usefulness of the APC equipment on a scale of 1 to 5, with 1being least useful and 5 being most useful, in terms of collecting ridership data:
Averages:At the system level 2.82At the route level 4.37At the trip level 4.64At the route segment level 4.27At the stop level 4.09
Question 56. What proportion of raw data collected by APCs in you system is converted intodata that can be used for service planning and scheduling?
Average: 74.4%
Question 57. What advice would you offer to other agencies interested in using APCequipment to collect ridership data?
Talk with and visit current users 5 36% of 12 systems respondingEvaluate adequacy of system database and upgrade 3 25%
TCRP SYNTHESIS TOPIC SA-9 DRAFT APPENDIX C PAGE 27

47
Use GPS-based system 2 17%Obtain strong management commitment 2 17%Work within agency to establish priority for APC 2 17%Other 5 36%
Other includes consider signpost system, be aware that extremes in passenger boardingsmay affect accuracy, integrate with AVL if possible, APCs are invaluable, and timely,thorough maintenance is critical.
TCRP SYNTHESIS TOPIC SA-9 DRAFT APPENDIX C PAGE 28
48
APPENDIX B
List of Survey Respondents
Director of Planning and DevelopmentCapital District Transportation Authority110 Watervliet AvenueAlbany, NY 12206-2599
Chief of Service MonitoringMetropolitan Atlanta Rapid Transit Authority2424 Piedmont Road, NEAtlanta, GA 30324-3330
Acting Manager, Operations Planning & SchedulingMass Transit Administration of Maryland300 West Lexington StreetBaltimore, MD 21201-3415
Manager, Service PlanningMassachusetts Bay Transportation Authority10 Park PlazaBoston, MA 02116
Coordinator of Transit StudiesCalgary TransitBox 2100Station 'M'Calgary, Alberta T2P 2M5Canada
General Manager, Market ResearchAPC Project ManagerChicago Transit Authority120 N. RacineChicago, IL 60607
Planning ManagerMetro/Southwest Ohio Regional Transit AuthorityKroger Building, Suite 20001014 Vine StreetCincinnati, OH 45202-1122
Consumer Research AnalystGreater Cleveland Regional Transit Authority615 Superior Avenue, W.Cleveland, OH 44113-1877
Senior Manager, Service PlanningDallas Area Rapid Transit1401 Pacific AvenuePO Box 660163Dallas, TX 75266-0163
APC System ManagerLane Transit DistrictPO Box 7070Eugene, OR 97401-0470
Assistant General ManagerConnecticut Transit100 Leibert RoadPO Box 66Hartford, CT 06141-0066
Manager, Service EvaluationMetropolitan Transit Authority of Harris County1201 Louisiana, Room 20105PO Box 61429Houston, TX 77208-1429
Planning ManagerKansas City Area Transportation Authority1200 East 18th StreetKansas City, MO 64108
Scheduling Systems SupervisorLos Angeles County Metropolitan TransportationAuthorityOne Gateway PlazaLos Angeles, CA 90012-2932
Transit Planner 2Metro-Dade Transit Agency3300 N.W. 32 Avenue, 2nd FloorMiami, FL 33142
Transit PlannerMilwaukee Transport Services1942 North 17th StreetMilwaukee, WI 53205

49
Chef de sectionAnalyse et échantillonnageSociété de transport de la Communauté urbainede Montréal800 rue de la Gauchetiére ouestMontreal, Quebec H5A 1J6CANADA
Senior Director, Business PlanningNew Jersey Transit CorporationOne Penn Plaza EastNewark, NJ 07105-2246
Service Development ManagerTidewater Regional TransitPO Box 2096Norfolk, VA 23501
Service Development ManagerAC Transit1600 Franklin Street, Room 701Oakland, CA 94612
Planning ManagerLynx (Central Florida Regional Transit Authority)225 E. Robinson, Suite 300Orlando, FL 32801
Head, Research and Development, Planning DivisionOttawa-Carleton Regional Transit Commission1500 St. Laurent BoulevardOttawa, Ontario K1G 0Z8Canada
Deputy Chief Officer, Frontier DivisionSoutheastern Pennsylvania Transportation Authority1525 Alanwood RoadConshohocken, PA 19428
Supervisor—Service AnalysisPort Authority of Allegheny County2235 Beaver AvenuePittsburgh, PA 15233-1080
Director, Operations Planning & AnalysisAPC Project ManagerTri-County Metropolitan TransportationDistrict of Oregon4012 Southeast 17th AvenuePortland, OR 97202-3993
APC Project ManagerBi-State Development Agency707 North First StreetSt. Louis, MO 63102-2595
Vice President, Operations/General ManagerSan Diego TransitPO Box 2511San Diego, CA 92112
Senior Planner/Capital Program ManagerKing County Department of Transportation821 Second Avenue, Exchange BuildingMail Stop 53Seattle, WA 98104-1598
Service Planning ManagerPierce Transit3701 96th Street, SWPO Box 99070Tacoma, WA 98499-0070
Supervisor, Data Collection and AnalysisToronto Transit Commission1138 Bathurst StreetToronto, Ontario M5R 3H2Canada
Director of Planning and MarketingSouth Coast Area Transit301 East Third StreetOxnard, CA 93030
Manager, Schedules and TrafficWashington Metropolitan Area Transit Authority600 Fifth Street, NWWashington, DC 20001
Manager of Planning and SchedulesCity of Winnipeg Transit System421 Osborne StreetWinnipeg, MB R3L 2A2Canada
Technology Firms Interviewed
Echelon Industries, Inc.556 N. Diamond Bar BoulevardSuite 202Diamond Bar, CA 91765

50
Red Pine Instruments, Ltd.RR # 1Denbigh, ON K0H 1LOCanada
Microtronix Vehicle Technologies, Ltd.200 Aberdeen DriveLondon, ON N5V 4N2Canada
Urban Transportation Associates Inc.700 East McMillanSuite 302Cincinnati, OH 45206
Wardrop Applied Systems Inc.6725 Airport Road, 6th FloorMississauga, ON L4V 1V2Canada

THE TRANSPORTATION RESEARCH BOARD is a unit of the National Research Council, which serves the NationalAcademy of Sciences and the National Academy of Engineering It evolved in 1974 from the Highway Research Board, whichwas established in 1920. The TRB incorporates all former HRB activities and also performs additional functions under a broaderscope involving all modes of transportation and the interactions of transportation with society. The Board's purpose is tostimulate research concerning the nature and performance of transportation systems, to disseminate information that the researchproduces, and to encourage the application of appropriate research findings. The Board's program is carried out by more than 270committees, task forces, and panels composed of more than 3,300 administrators, engineers, social scientists, attorneys,educators, and others concerned with transportation; they serve without compensation. The program is supported by statetransportation and highway departments, the modal administrations of the U.S. Department of Transportation, the Association ofAmerican Railroads, the National Highway Traffic Safety Administration, and other organizations and individuals interested inthe development of transportation.
The National Academy of Sciences is a private, nonprofit, self-perpetuating society of distinguished scholars engaged inscientific and engineering research, dedicated to the furtherance of science and technology and to their use for the generalwelfare. Upon the authority of the charter granted to it by the Congress in 1863, the Academy has a mandate that requires it toadvise the federal government on scientific and technical matters. Dr Bruce Alberts is president of the National Academy ofSciences.
The National Academy of Engineering was established in 1964, under the charter of the National Academy of Sciences, as aparallel organization of outstanding engineers It is autonomous in its administration and in the selection of its members, sharingwith the National Academy of Sciences the responsibility for advising the federal government. The National Academy ofEngineering also sponsors engineering programs aimed at meeting national needs, encourages education and research, andrecognizes the superior achievements of engineers. Dr. Robert M.White is president of the National Academy of Engineering.
The Institute of Medicine was established in 1970 by the National Academy of Sciences to secure the services of eminentmembers of appropriate professions in the examination of policy matters pertaining to the health of the public. The Institute actsunder the responsibility given to the National Academy of Sciences by its congressional charter to be an adviser to the federalgovernment and, upon its own initiative, to identify issues of medical care, research, and education. Dr. KennethI. Shine is president of the Institute of Medicine.
The National Research Council was organized by the National Academy of Sciences in 1916 to associate the broadcommunity of science and technology with the Academy's purposes of furthering knowledge and advising the federalgovernment. Functioning in accordance with general policies determined by the Academy, the Council has become the principaloperating agency of both the National Academy of Sciences and the National Academy of Engineering in providing services tothe government, the public, and the scientific and engineering communities The Council is administered jointly by bothAcademies and the Institute of Medicine. Dr. Bruce Alberts and Dr. Robert M. White are chairman and vice chairman,respectively, of the National Research Council.