Partos, T. R., Gilmore, A. B., Hitchman, S. C., Hiscock, R ...
12
Partos, T. R., Gilmore, A. B., Hitchman, S. C., Hiscock, R., Branston, J. R., & McNeill, A. (2017). Availability and use of cheap tobacco in the UK 2002 - 2014: Findings from the International Tobacco Control Project. Nicotine and Tobacco Research. https://doi.org/10.1093/ntr/ntx108 Publisher's PDF, also known as Version of record License (if available): CC BY Link to published version (if available): 10.1093/ntr/ntx108 Link to publication record in Explore Bristol Research PDF-document This is the final published version of the article (version of record). It first appeared online via Oxford Academic at https://doi.org/10.1093/ntr/ntx108 . Please refer to any applicable terms of use of the publisher. University of Bristol - Explore Bristol Research General rights This document is made available in accordance with publisher policies. Please cite only the published version using the reference above. Full terms of use are available: http://www.bristol.ac.uk/red/research-policy/pure/user-guides/ebr-terms/
Transcript of Partos, T. R., Gilmore, A. B., Hitchman, S. C., Hiscock, R ...
Partos, T. R., Gilmore, A. B., Hitchman, S. C., Hiscock, R., Branston,J. R., & McNeill, A. (2017). Availability and use of cheap tobacco inthe UK 2002 - 2014: Findings from the International Tobacco ControlProject. Nicotine and Tobacco Research.https://doi.org/10.1093/ntr/ntx108
Publisher's PDF, also known as Version of recordLicense (if available):CC BYLink to published version (if available):10.1093/ntr/ntx108
Link to publication record in Explore Bristol ResearchPDF-document
This is the final published version of the article (version of record). It first appeared online via Oxford Academicat https://doi.org/10.1093/ntr/ntx108 . Please refer to any applicable terms of use of the publisher.
University of Bristol - Explore Bristol ResearchGeneral rights
This document is made available in accordance with publisher policies. Please cite only thepublished version using the reference above. Full terms of use are available:http://www.bristol.ac.uk/red/research-policy/pure/user-guides/ebr-terms/

Nicotine & Tobacco Research, 2017, 1–11doi:10.1093/ntr/ntx108Original investigation
Received August 31, 2016; Editorial Decision May 9, 2017; Accepted May 17, 2017Advance Access publication May 19, 2017
© The Author 2017. Published by Oxford University Press on behalf of the Society for Research on Nicotine and Tobacco.1
This is an Open Access article distributed under the terms of the Creative Commons Attribution License (http://creativecommons.org/licenses/by/4.0/), which permits unrestricted reuse, distribution, and reproduction in any medium, provided the original work is properly cited.
Original investigation
Availability and Use of Cheap Tobacco in the United Kingdom 2002–2014: Findings From the International Tobacco Control ProjectTimea R. Partos PhD1,2, Anna B. Gilmore PhD2,3, Sara C. Hitchman PhD1,2, Rosemary Hiscock PhD2,3, J. Robert Branston PhD4, Ann McNeill PhD1,2
1Addictions Department, King’s College London, London, United Kingdom; 2UK Centre for Tobacco & Alcohol Studies, Nottingham, United Kingdom; 3Department for Health, University of Bath, Bath, United Kingdom; 4Centre for Governance and Regulation, School of Management, University of Bath, Bath, United Kingdom
Corresponding Author: Timea R. Partos, PhD, King’s College London, Addictions Department, Addiction Sciences Building, 4 Windsor Walk, Denmark Hill, London SE5 8BB, United Kingdom. Telephone: 20 7848 0440; E-mail: [email protected]
Abstract
Introduction: Raising tobacco prices is the most effective population-level intervention for reduc-ing smoking, but this is undermined by the availability of cheap tobacco. This study monitors trends in cheap tobacco use among adult smokers in the United Kingdom between 2002 and 2014 via changes in product type, purchase source, and prices paid.Methods: Weighted data from 10 waves of the International Tobacco Control policy evaluation study were used. This is a longitudinal cohort study of adult smokers with replenishment; 6169 partici-pants provided 15 812 responses. Analyses contrasted (1) product type: roll-your-own (RYO) tobacco, factory-made packs (FM-P), and factory-made cartons (FM-C); (2) purchase source: UK store-based sources (e.g., supermarkets and convenience stores) with non-UK/nonstore sources representing tax avoidance/evasion (e.g., outside the UK, duty free, and informal sellers); and (3) prices paid (inflation-adjusted to 2014 values). Generalized estimating equations tested linear changes over time.Results: (1) RYO use increased significantly over time as FM decreased. (2) UK store-based sources constituted approximately 80% of purchases over time, with no significant increases in tax avoid-ance/evasion. (3) Median RYO prices were less than half that of FM, with FM-C cheaper than FM-P. Non-UK/nonstore sources were cheapest. Price increases of all three product types from UK store-based sources from 2002 to 2014 were statistically significant but not substantial. Wide (and increasing for FM-P) price ranges meant each product type could be purchased in 2014 at prices below their 2002 medians from UK store-based sources.Conclusions: Options exist driving UK smokers to minimize their tobacco expenditure; smokers do so largely by purchasing cheap tobacco products from UK stores.Implications: The effectiveness of price increases as a deterrent to smoking is being undermined by the availability of cheap tobacco such as roll-your-own tobacco and cartons of packs of fac-tory-made cigarettes. Wide price ranges allowed smokers in 2014 to easily obtain cigarettes at prices comparable to 12 years prior, without resorting to tax avoidance or evasion. UK store-based sources accounted for 80% or more of all tobacco purchases between 2002 and 2014, suggesting little change in tax avoidance or evasion over time. There was a widening price range between the cheapest and most expensive factory-made cigarettes.

Nicotine & Tobacco Research, 2017, Vol. 00, No. 002
Introduction
Raising taxes to increase the price of tobacco is the most effective population-level intervention for reducing smoking1,2 and among the few policies shown to reduce inequalities in smoking.3–6 The World Health Organization (WHO) identifies price and tax measures as one of the key areas of tobacco control.7 The United Kingdom is leading the way, with real tobacco prices among the highest in the world.8,9 The potential public health benefits of tobacco tax increases are, however, influenced by a variety of factors including the avail-ability of cheap tobacco and smokers’ purchasing choices. There is mounting evidence that smokers would be more responsive to price increases if there were fewer opportunities to obtain cheap tobacco.1,10–12 Disadvantaged smokers are more likely to use cheap tobacco,13–16 so its availability may also contribute to the widening socioeconomic disparities associated with smoking. The present study therefore aims to track cheap tobacco sources and use among adult smokers in the United Kingdom between 2002 and 2014 via changes in product type, purchase source, and prices paid and to identify the implications for tobacco tax policy.
Smokers can minimize their tobacco expenditure by changing the type of product they buy or the source from which they buy it. In terms of product type, smokers can change from more expen-sive factory-made (FM) cigarettes to cheaper roll-your-own (RYO) tobacco,17,18 change the brand they smoke (there is a large range in price between “premium” and “discount” brands14,19), or purchase in bulk (FM cigarettes are often cheaper purchased in bulk by the carton than by the single pack20,21). With regard to purchase source, smokers can purchase from supermarkets rather than convenience stores or from sources where duties are either minimized or not paid at all. The latter includes legal products (e.g., duty-free or from low tax jurisdictions outside the United Kingdom —commonly known as tax avoidance22), and illicit tobacco (including counterfeit and smug-gled—commonly known as tax evasion23). The incentives for smok-ers to change their purchasing behaviors will depend on the price differences between, and ease of obtaining, the varying products.
In the United Kingdom during the study period of interest, changes occurred both in the rates of tobacco taxation and in the strategies adopted to curb illicit trade, so a rise in tobacco prices over time and a reduction in illicit trade were expected. From 2001 to 2008, tobacco taxation increased at the rate of inflation. In 2010, the UK government modified the tobacco tax structure, in part to combat the industry segmentation of the market into “premium” and “discount” sectors and also committed to keeping tobacco duty at least 2% above inflation from 2011 to 2014.24,25 In 2011, an addi-tional 10% increase on RYO duty was also implemented.24 The UK tobacco duty rates from 2001 to 2014 are presented in Table 1. The first comprehensive strategy to tackle illicit tobacco in the United Kingdom was implemented in 2000 and included £201 million of targeted funding, 1000 new customs staff, a national network of freight scanners, the introduction of “UK duty paid” markings on all tobacco packs, harsher penalties for tobacco smuggling, coopera-tion with tobacco companies to reduce the availability of tobacco to smugglers, and an awareness-raising publicity campaign.26 This strategy was reinforced and updated in 2006 with the major change being an increased focus on RYO27 and also in 2011 where changes in European Union (EU) law allowed for tougher sanctions for illicit traders.28 A recent government review has credited these efforts with reducing the UK illicit tobacco market from 22% for FM and 61% for RYO tobacco in 2000, to 10% for FM and 39% for RYO tobacco in 2013/2014.29 In 2009, a program to tackle illicit tobacco in the
north of England was also launched, which placed an emphasis on reducing the demand for illicit tobacco, and this was also evaluated as largely meeting its aims.30
Availability and use of cheap tobacco is associated with reduced smoking cessation,11–13,31 underlining the importance of understand-ing the sources and types of cheap tobacco and the incentives under-pinning their use. Research to date has indicated that RYO use in the United Kingdom is increasing,18 particularly among younger smok-ers,32 and between 2006 and 2009, the market share of discount FM brands increased significantly in the United Kingdom while their prices remained largely unchanged.19 In contrast, self-reported tax avoidance and evasion showed a declining trend among UK smokers from 2002 to 2011.33 Understanding the trends in cheap tobacco use is vital for informing tobacco control policy not least because the tobacco industry and its allies repeatedly argue that tax evasion is increasing in light of high tobacco taxes in the United Kingdom.34,35 With other countries looking to increase tobacco taxes, yet fearful of the potential impact on illegal sales and tax revenues, this article will be of importance further afield.
Prior studies examining price minimizing have focused on one par-ticular aspect, or considered a limited time frame.34 The present study uses data from the International Tobacco Control (ITC) study35,36 to track cheap tobacco sources and use among adult smokers in the United Kingdom between 2002 and 2014. It does so by monitoring changes in product type, purchase source, and prices paid. The ITC is unique in making it possible to track concurrently multiple forms of price minimizing behavior in a single data set over a substantial period.
Methods
ParticipantsData were from the first 10 waves (2002–2014) of the UK arm of the ITC project.35,36 This is a longitudinal cohort survey of adult smokers (18+) at recruitment with yearly replenishment (except at wave 8). Respondents who quit are also followed up. The survey uses a strati-fied random sample design and was administered either via com-puter-aided telephone interviewing or online (piloted in wave 7 and introduced gradually from wave 8 in 2010 onward). Surveys were conducted approximately annually, although some longer interwave intervals resulted in no surveys taking place in 2009, 2011, or 2012. Population cross-sectional sampling weights were calculated at each wave to be representative of national distributions of age, sex, and geographical region, and longitudinal weights were adjusted for attrition. Participants were included in the present analyses if they smoked at least monthly at the time of the survey and had smoked more than 100 cigarettes in their lifetime. Table 2 presents the demographic characteristics of the eligible study sample: N = 6169 participants who provided 15 812 responses over the 10 waves. On average, each individual took part in 2.6 surveys (SD = 2.0).
MeasuresDemographicsFor descriptive purposes and missing data analyses, participants at each wave were asked their sex, age, annual household income, household composition, and geographical region. Household income was adjusted for household composition, converted to 2014 values using Consumer Price Index (CPI) data from the UK Office for National Statistics,37 and stratified to “low,” “medium,” and “high” values. Refusals to report income were retained as a separate category.

Nicotine & Tobacco Research, 2017, Vol. 00, No. 00 3
Cheap Tobacco Product Type and Purchase SourceFigure 1 presents a schematic of the survey questions used to classify tobacco product types and purchase sources. Each participant’s usual tobacco product was determined by asking “Do you now smoke... (packet/factory-made cigarettes only; roll-your-own cigarettes only; both)?” All remaining indicators of cheap tobacco use were based on participants’ last reported tobacco purchase. These were classi-fied as FM cigarettes by the pack (FM-P), FM cigarettes in a carton containing multiple packs (FM-C), or RYO tobacco. Smokers who indicated having a usual brand and variety of tobacco (see Figure 1) were asked if their last purchase was their usual brand. Buying nonu-sual brands may indicate being less brand-loyal or more swayed by in-store discounts and price promotions.
A novel approach to classifying tobacco purchase sources was undertaken. This was done to address the difficulties associated with clearly identifying tax evasion from tax avoidance in self-report surveys. Such difficulties include socially desirable responding, the prevalence of “under-the-counter” sales from legitimate sources, and counterfeit tobacco that smokers may be unaware of purchas-ing.34,38–40 Sources that are easily accessible to the majority of UK smokers were contrasted with sources where arguably an effort was made to obtain cheap tobacco. The former was considered to be “UK store-based” sources (e.g., supermarkets, convenience stores, and tobacconists) and the latter to be “non-UK/nonstore” sources (e.g., duty-free, overseas, Internet, and informal sellers). An “other” category captured the remaining sources, which represented less than 0.52% of all responses (see Figure 1). Keeping these uncertain-ties in mind, it was nevertheless expected that within the non-UK/nonstore category, “outside the UK” and “duty-free” were likely to be tax avoidance and “informal sellers” and “from friends/relatives” to be tax evasion.
Tobacco PricePrice per stick (FM cigarettes: all waves; RYO: available only from Wave 4 in 2005, onwards) was also derived from the last purchase. Based on available data from the most recent six waves (2006–2014), the average grams of tobacco per RYO cigarette for this
UK sample was calculated to lie between 0.45 and 0.55 g (data not shown), which is consistent with other research.41–43 The mid-point of 0.50 g was chosen as the amount of tobacco per cigarette for calculating price per stick for RYO smokers. Depending on whether the last purchase was FM-P, FM-C, or RYO (see Figure 1), a further series of questions determined how many cartons/packs were pur-chased, how many packs per carton, how many cigarettes per pack, or the number and weight of RYO pouches purchased. Participants then had the option to report the price of a single unit (one carton, pack, or pouch) or the total paid if they had purchased multiple units. This was then divided by the number of cigarettes or 0.50 g of tobacco purchased. Since price calculations relied on these multiple responses, the occurrence of inconsistencies and missing data was increased. The following improbable responses (determined a priori by consensus among the authors) were therefore excluded from price analyses: (a) all prices per FM stick or 1.0 g of RYO tobacco over £0.50 (prior to Wave 6) or £0.80 (Wave 6 onward); (b) prices per FM stick or 1.0 g of RYO tobacco from UK store-based sources below £0.07 (prior to Wave 6) or £0.10 (Wave 6 onward); and (c) FM packs from UK store-based sources reported to contain more than 50 cigarettes. For comparability over time, all prices were con-verted into 2014 values using Consumer Price Index (CPI) data.
The median reported price for each product type last purchased within each source was calculated, and for UK store-based sources only, the “price range” for each product type was also calculated. The price range was truncated to lie between the 2.5th and 97.5th percen-tiles (capturing 95% of all prices) in an attempt to obtain a more rep-resentative value by excluding the most extreme low-frequency cases.
AnalysesThe aim was to examine general population trends in cheap tobacco use, rather than perform predictive modeling. The main results therefore comprise the population-weighted proportion of smok-ers at each wave using cheap tobacco, and purchasing from various sources, without controlling for any covariates. Multilevel logistic regression analyses using Generalized Estimating Equations (GEE) was also conducted to test for linear trends in proportions over time.
Table 1. Tobacco duty rates for factory-made (FM) cigarettes and roll-your-own (RYO) tobacco in the United Kingdom from 2001 to 2014
Specific dutya, £ per 1000 FM cigarettes
Specific dutya, £ per kilogram of RYO tobacco
Ad Valoremb % (factory- made cigarettes only)
Value added tax (VAT)c %
Relative to inflationd
2001 March 92.25 96.81 22.0 17.5 = inflation2002 April 94.24 98.66 22.0 17.5 = inflation2003 April 96.88 101.42 22.0 17.5 = inflation2004 March 99.80 104.47 22.0 17.5 = inflation2005 April 102.39 107.18 22.0 17.5 = inflation2006 March 105.10 110.02 22.0 17.5 = inflation2007 March 108.65 113.74 22.0 17.5 = inflation2008 March 112.07 117.32 22.0 17.5 = inflation2008 November 112.07 122.01 24.0 15.0 = inflation2009 April 114.31 124.45 24.0 15.0 2% above2010 March 119.03 129.59 24.0 17.5 1% above2011 March 145.95 151.90 16.5 20.0 2% above2012 March 167.41 164.11 16.5 20.0 5% above2013 March 176.22 172.74 16.5 20.0 2% above2014 March 184.10 180.46 16.5 20.0 2% above
aSpecific duty is set in fixed cash terms as an amount per 1000 FM cigarettes or per kilogram of RYO tobacco.bAd Valorem duty is set as a percentage of the retail price, and is only applied to FM cigarettes.cValue added tax (VAT) is set as a percentage of the retail price and is applied to all consumer goods.dData taken from Action on Smoking and Health (ASH) UK analysis of tobacco tax increases in the United Kingdom fact sheet.24

Nicotine & Tobacco Research, 2017, Vol. 00, No. 004
GEE estimates population-averaged effects and controls for corre-lated responses from the same individual over multiple time points. These analyses used a binomial distribution with a logit link func-tion and an unstructured correlation matrix (or exchangeable when the unstructured failed to converge). GEE was also used to test for linear trends in the prices paid for each product type within each purchase source, via multilevel linear regression analyses using a Gaussian distribution with an identity link function. GEE analyses have commonly been used with the ITC data.14–17,33
Missing Data and AttritionMissing data for most of the variables used were minimal (see Table 2). However, the price paid for the last purchase could not be calculated for a relatively large proportion of participants due to missing data (2.3–15.2% per wave) or exclusion due to improbable responses (1.0–3.7%). Chi-square analyses were therefore used to compare the group who were excluded from price calculations to the rest of the sample on their responses to the remaining variables. This showed that in a majority of the 10 waves, the price missing
Figure 1. Schematic of survey questions and categorization of source and type of tobacco products. Note. The low reported prices associated with refusals to answer were consistent with this source being classified as “non-UK/nonstore”.

Nicotine & Tobacco Research, 2017, Vol. 00, No. 00 5
group was significantly (p < .05): less likely to purchase by the pack
rather than the carton or RYO (all waves); less likely to usually
smoke exclusively FM cigarettes (9 of 10 waves); less likely to report
their purchase source (9 of 10 waves); less likely to report purchas-
ing from UK store-based sources (6 of 10 waves); and less likely to
disclose their income (5 of 10 waves). This pattern of responses sug-
gests that the price missing group was more likely to be using cheap
tobacco. Estimates of tobacco price, particularly from non-UK/non-
store sources, are therefore likely to be slightly overestimated, and
this should be taken into consideration when interpreting results
on price.
Participants who had been included in any one survey year were
excluded from the analyses at subsequent years if they were lost
to follow-up (25.5% of all valid participants), had quit smoking
(8.0%), or had missing data (0.6%).
Results
The prevalence of RYO use increased significantly, and the major-
ity of purchases were from UK store-based sources. There was lit-
tle change observed in the real prices of cigarettes over the survey
period from 2002 to 2014.
Type of Product (Usual Tobacco Product and Product Last Purchased)Usual tobacco product type showed a significant linear increase in exclusive RYO use over time (Table 3), with the main increase occur-ring between 2002 and 2010 and then plateauing. Simultaneously, exclusive FM use significantly declined such that by 2014, only 55% were smoking exclusively FM, 30% RYO, and 15% smoking a mix. The linear trend for mixed FM and RYO use was not statistically significant, although the increase from 10.2% in 2010 (±95% confi-dence interval [CI] = 7.2% to 13.1%) to 18.2% in 2013 (±95% CI = 15.3% to 21.2%) coincided with the plateauing of exclusive RYO use. Consistent with this, based on the last purchase data, purchases of FM cigarettes (by the pack and carton) declined significantly as purchases of RYO increased over the survey period.
For all smokers (FM, RYO, and mixed), there was a significant linear increase over time in the proportion who reported that their last purchase was their usual brand (see Table 3). Among exclusive FM or RYO smokers, the proportion last purchasing their usual brand was generally high (above 90% in most waves), whereas for mixed users it was somewhat lower, ranging between 66.0% (±95% CI = 58.0% to 74.1%) in 2003 to 83.8% (±95% C.I. = 74.9% to 92.8%) in 2013.
Table 2. Unweighted sample characteristics by survey wave
w1 2002 w2 2003 w3 2004 w4 2005 w5 2006 w6 2007 w7 2008 w8 2010 w9 2013 w10 2014
Met selection criteria, N 2367 1914 1831 1727 1690 1636 1474 960 1096 1117Sex % Female 56.6 55.4 55.8 57.2 57.2 57.4 55.8 55.3 51.0 52.9 Male 43.4 44.6 44.2 42.9 42.8 42.6 44.2 44.7 49.0 47.1Age brackets, years, % 18–24 8.5 6.4 5.0 4.4 4.7 4.8 3.7 2.6 4.2 3.0 25–39 32.2 29.6 27.7 26.0 24.6 24.4 20.8 14.4 21.4 21.6 40–54 33.9 36.3 37.8 38.6 36.6 36.7 35.7 37.0 34.0 33.4 55+ 25.4 27.6 29.5 31.0 34.1 34.2 39.8 46.0 40.3 42.1Geographical region % London 13.4 13.3 12.3 12.1 13.3 13.1 11.5 11.7 10.3 10.8 Yorkshire and The Humber 8.8 8.6 8.6 8.9 8.1 7.1 6.7 7.0 7.5 7.6 East Midlands 6.8 7.0 7.7 7.1 7.0 7.3 8.0 7.2 6.7 6.8 Eastern 8.5 8.3 8.8 8.9 7.9 8.2 7.6 8.9 9.6 9.8 North East 4.7 4.6 4.6 5.0 4.9 4.6 4.3 4.1 4.3 4.5 South East 13.7 14.0 13.9 13.1 13.3 13.2 13.1 14.3 13.1 13.5 South West 7.7 8.1 8.0 8.1 8.4 8.3 9.4 8.4 7.9 8.2 West Midlands 8.5 8.9 8.7 8.1 7.7 8.7 8.6 8.3 9.5 8.0 North West 10.6 10.6 10.9 10.9 10.1 9.7 9.4 9.2 11.0 11.5 Wales 5.0 4.7 4.6 5.3 5.9 5.9 6.7 6.5 5.8 5.9 Scotland 9.9 10.0 10.2 10.1 10.9 10.7 11.5 12.0 11.0 10.7 Northern Ireland 2.3 2.0 2.5 2.5 2.6 3.2 3.2 2.5 3.5 2.8Income bracketsa, % Low 17.2 23.0 22.4 24.5 25.7 25.6 24.8 25.0 25.3 21.6 Moderate 44.1 39.0 39.7 40.6 40.6 38.7 38.2 37.5 36.7 37.8 High 29.2 29.7 29.6 26.7 24.8 25.7 27.0 28.5 30.2 32.3 Not disclosed 9.6 8.3 8.4 8.2 8.9 10.1 10.0 9.0 7.9 8.3Missing/excluded datab, % Usual tobacco product 0.04 0.21 0.05 0.23 0.00 0.00 0.14 1.98 0.00 0.18 Product last purchased 2.15 2.09 0.82 0.69 0.47 3.73 0.95 4.48 2.55 2.24 Source of last purchase 0.38 0.52 0.11 0.12 0.24 0.79 0.54 0.21 1.51 1.52 Price 7.73 4.86 3.77 5.50 5.21 8.13 6.17 8.75 16.97 17.64 All valid (complete cases) 90.5 94.0 96.1 94.3 94.3 91.1 93.6 91.0 82.2 81.7
aIncome brackets are based on annual household income, equivalized for household composition and Consumer Price Index (CPI) adjusted to 2014 values.bNote that missing data + complete cases do not sum to 100%, as it was possible for participants to have data missing on more than one variable.

Nicotine & Tobacco Research, 2017, Vol. 00, No. 006
Tab
le 3
. Usu
al t
ob
acco
pro
du
ct, p
rod
uct
last
pu
rch
ased
, an
d s
ou
rce
of
last
pu
rch
ase
(wei
gh
ted
dat
a), w
ith
tes
ts f
or
linea
r tr
end
s ov
er t
ime.
w1
2002
w2
2003
w3
2004
w4
2005
w5
2006
w6
2007
w7
2008
w8
2010
w9
2013
w10
201
4Β
(95
% C
I) f
or t
ime
tren
dsa
Usu
al t
obac
co p
rodu
ctFa
ctor
y m
ade
only
%69
.668
.068
.867
.262
.662
.261
.557
.753
.555
.0−0
.044
***
(−0.
054
to −
0.03
4)L
ast
purc
hase
= u
sual
%82
.694
.191
.495
.289
.689
.492
.993
.994
.393
.200
83**
* (0
.055
to
0.11
1)R
oll-
your
-ow
n on
ly %
17.5
19.3
20.3
22.5
25.0
26.5
24.7
30.0
28.3
30.3
0.05
7***
(0.
042
to 0
.072
)L
ast
purc
hase
= u
sual
%78
.990
.286
.798
.390
.195
.094
.295
.587
.195
.90.
104*
** (
0.06
0 to
0.1
49)
Mix
ed %
12.9
12.5
10.9
10.2
12.4
11.2
13.7
10.2
18.2
14.5
0.01
4 (−
0.00
2 to
0.0
30)
Las
t pu
rcha
se =
usu
al %
69.1
66.0
75.4
81.7
73.2
78.3
73.8
83.8
77.1
83.0
0.04
8**
(0.0
16 t
o 0.
080)
Prod
uct
last
pur
chas
edFa
ctor
y-m
ade
Pack
%59
.458
.058
.357
.152
.447
.651
.645
.249
.045
.9−0
.034
***
(−0.
044
to −
0.02
3)U
K, s
tore
-bas
ed97
.097
.297
.597
.399
.298
.998
.998
.996
.898
.2N
/AN
on-U
K/n
onst
ore
2.6
2.7
2.5
2.6
0.8
0.8
1.1
1.1
2.7
1.1
N/A
Fact
ory-
mad
e C
arto
n %
21.4
20.5
20.2
19.6
17.8
18.4
17.1
16.7
15.2
16.9
−0.0
39**
* (−
0.04
to
−0.0
25)
UK
, sto
re-b
ased
55.8
45.1
49.8
54.5
54.3
50.2
57.9
61.5
70.7
55.0
0.02
5* (
0.00
3 to
0.0
48)
Non
-UK
/non
stor
e44
.154
.950
.245
.545
.749
.842
.137
.327
.444
.3−0
.032
** (
−0.0
54 t
o −0
.009
)R
oll-
your
-ow
n %
17.3
19.0
20.7
22.5
29.5
30.0
30.5
32.2
33.2
35.0
0.06
6***
(0.
053
to 0
.080
)U
K, s
tore
-bas
ed71
.764
.968
.165
.669
.478
.166
.774
.282
.980
.00.
045*
* (0
.016
to
0.07
4)N
on-U
K/n
onst
ore
27.9
34.5
31.3
34.0
30.0
21.7
33.3
25.8
16.8
17.6
−0.0
48**
(−0
.06
to −
0.01
9)So
urce
of
last
pur
chas
eU
K, s
tore
-bas
ed %
83.7
79.9
81.6
81.8
82.4
83.3
81.5
83.2
87.1
83.7
0.01
9 (−
0.00
2 to
−0.
041)
Con
veni
ence
sto
re51
.249
.750
.546
.445
.050
.148
.044
.240
.041
.0−0
.033
***
(−0.
044
to −
0.02
2)Su
perm
arke
t41
.442
.444
.549
.850
.647
.447
.952
.454
.154
.20.
040*
** (
0.02
8 to
0.0
51)
UK
, sto
re-b
ased
oth
erb
7.4
7.9
5.0
3.9
4.4
2.6
4.0
3.4
5.9
4.8
−0.0
38**
(−0
.066
to
−0.0
10)
Non
-UK
/non
stor
e %
15.9
19.6
18.3
18.1
17.4
16.1
17.9
16.5
11.5
14.3
−0.0
25**
(−0
.041
to
−0.0
09)
Out
side
the
UK
55.6
52.9
53.2
43.5
41.1
57.6
28.8
33.6
37.7
39.5
−0.0
77**
* (−
0.11
to
−0.0
48)
Dut
y-fr
ee25
.827
.627
.834
.734
.121
.836
.835
.132
.436
.30.
044*
* (0
.015
to
0.07
2)In
form
al s
elle
rs16
.116
.47.
26.
65.
95.
813
.97.
811
.56.
4−0
.081
** (
−0.1
4 to
−0.
027)
Frie
nd/r
elat
ive
2.2
0.4
9.8
13.9
15.2
14.2
19.3
23.6
11.5
13.4
0.12
***
(0.0
86 t
o 0.
14)
Non
-UK
/non
stor
e ot
herb
0.2
2.7
2.0
1.3
3.7
0.6
1.2
0.0
6.9
4.4
N/A
Oth
er, %
0.4
0.5
0.1
0.2
0.2
0.6
0.6
0.3
1.4
2.0
N/A
a Tes
ts f
or t
rend
wer
e no
t co
nduc
ted
(N/A
) w
hen
floor
or
ceili
ng e
ffec
ts w
ere
appa
rent
.b “
UK
sto
re-b
ased
oth
er”
cate
gory
incl
udes
dis
coun
t st
ores
, tob
acco
nist
s, b
ars/
ente
rtai
nmen
t ve
nues
, off
-lic
ense
s, v
endi
ng m
achi
nes,
and
unc
lass
ified
UK
sto
re-b
ased
res
pons
es; “
non-
UK
/non
stor
e ot
her”
cat
egor
y in
clud
es
mili
tary
com
mis
sari
es, t
oll-
free
num
bers
, int
erne
t pu
rcha
ses,
ref
usal
s to
ans
wer
and
unc
lass
ified
non
-UK
/non
stor
e re
spon
ses.
*p <
.05.
**p
< .0
1. *
**p
< .0
01.
Nicotine & Tobacco Research, 2017, Vol. 00, No. 00 7
Source of Last Tobacco PurchaseUK store-based sources accounted for 80% or more of all purchases (Table 3), and this proportion did not vary significantly over time. The majority of UK store-based purchases were from convenience stores and supermarkets. Within this group, however, there was a significant decrease in purchases from convenience stores and a correspond-ing increase in supermarket purchases over time such that by 2014, significantly more purchases were from supermarkets (54.1%: ± 95% CI = 50.0% to 58.1%) than convenience stores (40.0%: ±95% CI = 36.0% to 44.0%).
Purchases from non-UK/nonstore sources showed a significant downward linear trend over time. It is therefore unexpected that purchases from UK store-based sources did not show a statistically
significant linear increase but remained relatively stable over time. This is attributable to the proportion with missing data on source (see Table 2). These participants were arguably more likely to have purchased from non-UK/nonstore sources, because smokers with missing data on price had a pattern of missing data consistent with using cheap tobacco (including missing data on source). When all missing data were assumed to be non-UK/nonstore purchases, the linear trends were no longer statistically significant. Whichever way the missing cases are categorized, there was no indication that non-UK/nonstore purchases were increasing overall.
Within the group purchasing from non-UK/nonstore sources, purchases from outside the United Kingdom were most common (40% or more in most waves) but declined significantly over time,
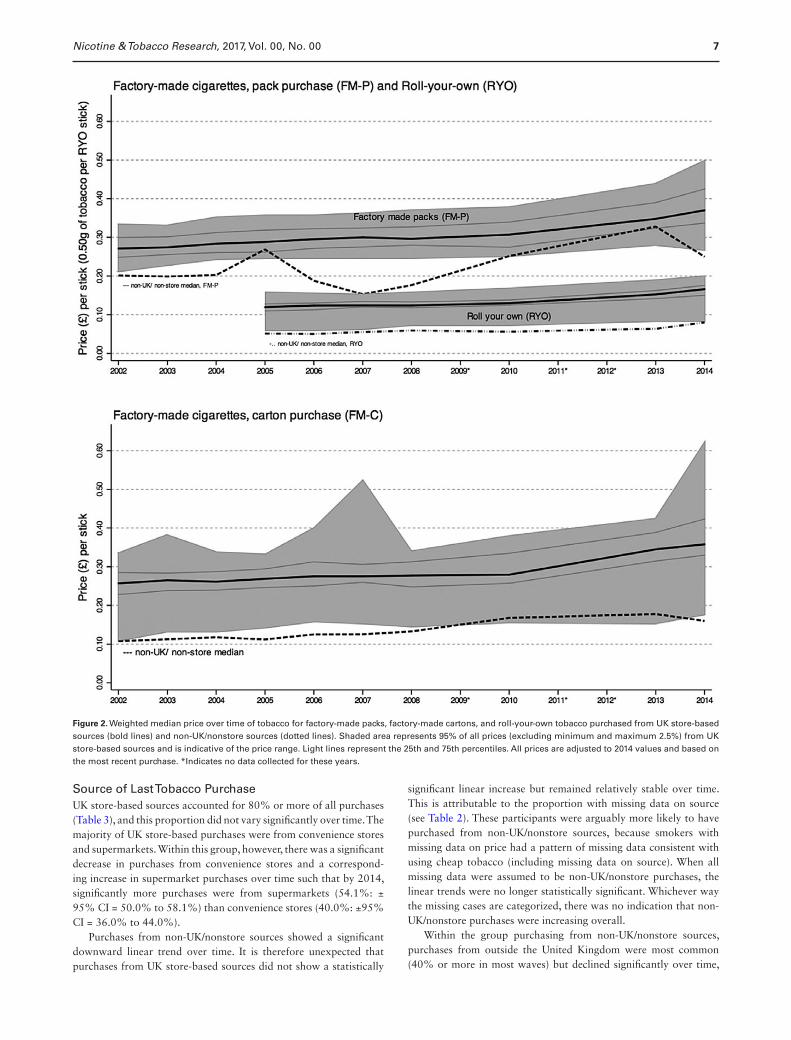
Figure 2. Weighted median price over time of tobacco for factory-made packs, factory-made cartons, and roll-your-own tobacco purchased from UK store-based sources (bold lines) and non-UK/nonstore sources (dotted lines). Shaded area represents 95% of all prices (excluding minimum and maximum 2.5%) from UK store-based sources and is indicative of the price range. Light lines represent the 25th and 75th percentiles. All prices are adjusted to 2014 values and based on the most recent purchase. *Indicates no data collected for these years.

Nicotine & Tobacco Research, 2017, Vol. 00, No. 008
with the largest drop occurring between 2007 and 2008. Duty-free purchases showed a significant linear increase with time, reaching 36% in 2014. Purchasing from informal sellers was below 17% in all waves and significantly decreased over time. Purchasing from friends or relatives was initially very low but increased significantly over time, reaching a peak in 2010 at 23.6%. Online and phone pur-chases combined accounted for less than 7% of all non-UK/nonstore purchases over the survey period.
At least 97% of FM-P purchases were from UK store-based sources (Table 3). These consistently high figures constituted ceil-ing effects and precluded statistical tests for linear trend. Relatively fewer FM-C purchases were from UK store-based sources (between 45.1% and 70.7% over the survey period). However, these increased significantly over time, whereas FM-C purchases from non-UK/nonstore sources significantly declined. This suggests that the over-all decline in FM-C purchasing noted earlier was largely due to a decline in non-UK/nonstore sources. Finally, the proportion of RYO purchases made from UK store-based sources increased significantly over time, whereas those from non-UK/nonstore sources declined.
Tobacco PriceUK Store-Based SourcesSignificant linear increases over time were observed in the real prices of all tobacco product types from UK store-based sources. Prices remained essentially unchanged up to 2010, however, then increased slightly thereafter (Figure 2). In real terms, the median price per stick for FM cigarettes (both pack and carton purchases) rose by only 10 pence over the entire 12 years of the study. Median prices per stick for FM-P rose from £0.27 in 2002 to £0.37 in 2014, with FM-C typically one or two pence cheaper per stick. For RYO, the real median price per stick (0.50 g) increased by only 5 pence over the 9-year period for which data were available, from £0.12 in 2005 to £0.17 in 2014.
The price range for tobacco products purchased from UK store-based sources varied by product type (Figure 2), but across all three it was possible in 2014 to buy the same type of product at real prices similar to 2002. The range for FM-P was relatively narrow and changed little between 2002 (£0.12 per stick) and 2010 (£0.13), followed by an increase to £0.16 in 2013, and then a more marked widening to £0.23 in 2014, where both an increase in the highest price and a decrease in the lowest price was evident. For FM-C, although median prices were similar to FM-P, the range was wider and more variable, ranging between £0.19 and £0.27 in most years, with spikes of £0.37 in 2007 and £0.45 in 2014. The price range for RYO tobacco changed little over the period measured, from £0.10 in 2005 to £0.12 per 0.50 g stick in 2014. It may be seen in Figure 2, however, that for FM-P, the prices were evenly distributed over the range, whereas for RYO they were negatively skewed such that there was greater variation at the cheaper (below median) end of the price range.
Non-UK/Nonstore SourcesThe FM-P from non-UK/nonstore sources accounted for a very small portion of tobacco purchases (see Table 3), so there were limited data available to calculate precise estimates of median prices per stick, and trend analyses were not conducted. As may be seen in Figure 2, however, median prices were consistently at least £0.02 below that of FM-P from UK store-based sources, although the fluctua-tions were large. More consistent price estimates were obtained for FM-C, which were often less than half the price of UK store-based
sources, and changed little (£0.11 per stick in 2002 and £0.16 in 2014), although this increase was statistically significant. Similarly, median prices for non-UK/nonstore RYO tobacco were considerably cheaper than UK store-based sources, ranging from £0.05 per 0.50 g stick in 2005 to £0.08 in 2016, again a significant linear increase. Median prices from non-UK/nonstore sources were often cheaper than the cheapest products available from UK store-based sources for all tobacco product types (see Figure 2).
Discussion
This article shows there are numerous options for UK smokers to minimize their tobacco expenditure, thus mitigating the public health impact of tobacco tax/price increases. They do so largely by purchasing cheap products from UK stores (84% purchased from cheap sources in 2014). Significant increases in exclusive RYO use and declines in exclusive FM cigarette use were observed. A considerable proportion of smokers (15% in 2014) were identified who usually smoked both RYO and FM products, and this group appeared to be the least brand loyal. Purchasing FM by the carton was not uncommon, with around one in six smokers choosing to buy FM cigarettes in bulk this way. We found no evidence to support industry arguments that smokers are increasingly engaging in tax avoidance or evasion, insofar as this is captured in this study by non-UK/nonstore sources. The analysis of real prices supports these findings. There were clear price incentives to “down-trade” both between and within products purchased from the legal market (UK store-based sources). Hence although for all three product types (FM-P, FM-C, and RYO) the median price from non-UK/nonstore sources was typically lower than the cheapest products from UK store-based sources, it was possible to purchase all three types, legally, at prices below their 2002 medians.
Although the trading of illicit tobacco products from UK store-based sources cannot entirely be ruled out, the present findings sug-gest tax avoidance and evasion are not the predominant source of cheap tobacco. A change in the most common source of tobacco purchases in the United Kingdom occurred during the study, from convenience stores to supermarkets, which would have conferred price savings. Changing product type also enabled considerable sav-ings. For example, FM-C purchases typically conferred a saving of £0.01 to £0.03 per stick on the median price, compared to FM-P. A larger saving could be made by switching to RYO, a 0.50-g stick being typically around £0.18 cheaper than one FM-P cigarette: less than half the price. For the average UK smoker smoking around 11.4 cigarettes per day,44 this is a saving of about £750 per year compared to smoking FM-P. Changing within product types also led to savings. The price range between the cheapest and the most expensive FM-C products was consistently wide, and from around 2010 onward, the price range of FM-P products also widened mark-edly, providing more opportunities to switch to cheaper brands. The tobacco industry pricing strategy of overshifting tax increases on premium FM brands to maximize profits while undershifting to maintain lower prices for discount FM brands has been observed worldwide.10,15,19,45,46 The present findings indicate that this strat-egy is becoming more aggressive in the United Kingdom. Unlike for FM-P, the observed price range for RYO was disproportionately due to more variation in the cheap (below median) prices. This suggests that industry undershifting may be particularly relevant within the RYO market, a finding not previously observed.
Purchasing from non-UK/nonstore sources did not increase over-all (even when we assumed all missing data on purchase source to be

Nicotine & Tobacco Research, 2017, Vol. 00, No. 00 9
non-UK/nonstore) and the nonsignificant trends were for a decrease. However, some more specific trends are worth highlighting. The majority of non-UK/nonstore purchases were duty-free or from out-side the United Kingdom, with purchasing from duty-free sources increasing significantly over time and non-UK purchases declining. There were few reports (typically under 25% of non-UK/nonstore purchases and under 5% of all purchases) of sources most likely to be tax evasion, such as informal sellers or from friends or relatives. Purchasing from informal sellers significantly decreased over the sur-vey period, whereas purchasing from friends or relatives increased, reaching a peak in 2010 at just under a quarter of all non-UK/non-store purchases. Online and phone purchases combined accounted for less than 7% of all non-UK/nonstore purchases over the survey period. The FM-C was most commonly purchased from non-UK/nonstore sources, followed by RYO.
The economic recession that occurred in the United Kingdom in the last quarter of 2008 appeared to influence tobacco purchasing patterns. Around this time, purchases from supermarkets overtook convenience stores as the most popular purchase source, and there was also a drop in purchases made outside the United Kingdom and a spike from informal sellers and friends or relatives. Government policies have also played a role. For example, the period from 2011 onward where tobacco duty was higher than in previous years (at 2–5% above inflation) coincides with the more accelerated increase in tobacco prices from UK store-based sources observed in the pre-sent study. Even if this relationship was causal, however, the tax increases did not have a substantial impact on prices in real terms, had no apparent effect on the widening gap between the cheapest and most expensive FM-P products, and little impact on the lowest price paid for RYO. Overall, when inflation is taken into consid-eration, although statistically significant, the increase in the median price paid for tobacco between 2002 and 2014 was not substantial. On the other hand, the UK strategies to reduce illicit tobacco supply and use appears to have been successful.30,47 Taken together, pur-chases from sources that would most likely represent tax evasion and avoidance did not increase.
Policy ImplicationsWhile efforts have been made in the United Kingdom in recent years for higher tax increases on RYO than those of FM,24 considerable price differentials remain. We echo the call from previous UK researchers18 for larger relative tax increases for RYO to reduce the price differen-tials, a move that is likely to result in a reduction in RYO consump-tion.16 In order to further address the tobacco industry practice of undershifting tobacco prices on FM cigarettes, the UK government has committed to introducing a Minimum Excise Tax (MET) in 2017, which will help to raise the price of the cheapest FM tobacco brands.48 The exact value of the MET is not yet known, and careful observation will be required to determine if it is sufficient. For maximal impact, the MET should be at least equivalent to the amount of tax currently due based on the weighted average price of tobacco.49 Alternative measures such as price-cap regulations50 and moving toward a fully specific tax structure13,15 may better address this problem. The sale of FM cigarettes in cartons could also be banned, the limits on duty-free purchases could be further reduced or removed altogether, and cross-border purchases could be limited, given the close proximity of the United Kingdom to countries with cheaper tobacco. The current rate of increase of 2% above inflation for UK tobacco excise taxes could also be raised to strengthen impact. Combining this with the other measures outlined could help to increase price while reducing price differentials and the availability of cheaper tobacco.
Further ResearchPurchases from friends or relatives have remained at rates sig-nificantly higher than what was observed at the start of the study period. More research is needed to determine whether this consti-tutes tax avoidance and/or tax evasion or an effort to pool resources in order to buy in bulk. Subpopulations of particular interest are mixed smokers of both RYO and FM cigarettes and also those who do not consider themselves to be brand loyal. These groups may be particularly susceptible to tobacco price changes and warrant further exploration. Our research team is currently exploring the socioeco-nomic and addiction-related factors associated with cheap tobacco use to assist in the development of more targeted price-based smok-ing intervention strategies.
LimitationsThe survey included a considerable period (2011 and 2012) where no data were collected, precluding the observation of any fluctua-tions specific to this period, and perhaps overestimating the linear nature of the trends over time. The large, longitudinal sample of smokers does, however, allow for the observation of overall pat-terns with some confidence. It is not possible to definitively pin-point instances of tax evasion in self-reports, as in this study and described in detail elsewhere,16 and this may explain discrepancies with UK government estimates.51 In particular, “under-the-counter” purchases from legitimate sources cannot be ruled out. This is unlikely, however, as reports of very low prices paid from UK store-based sources were excluded in an effort to overcome this issue. The continuing availability of very low-priced tobacco products from UK store-based sources may be due to a deepening of discount-ing, increased tax-evasion, or both. Framing the problem in terms of UK store-based versus non-UK/nonstore sources, however, has the advantage of contrasting ease of access for the majority of UK smokers with directed efforts to buy cheaper. If cheap tobacco is increasingly available from the most accessible sources, then this is something that requires careful monitoring, whether or not it is due to tax evasion.
To be included in the study, participants had to be current smokers, so our procedure meant that quitters were progressively excluded from the analysis. However, the missing data analysis also suggested that users of cheap tobacco (who are less likely to quit11–13,31) were more likely to be excluded. Thus, these two effects balance each other to some extent. The ITC survey is replenished at each wave with a representative sample of current smokers, tominimize attrition effects. We therefore think it is unlikely that the observed trends are due to attrition.
Conclusion
UK smokers have many options to reduce their tobacco expenditure and largely do so by purchasing from UK stores. Wide price ranges for each product type (FM-P, FM-C, RYO) from UK store-based sources in 2014 meant that smokers could buy the same products legally at prices comparable to 2002, 12 years prior. Price differences between product types also drove switching from FM to RYO or from FM-P to FM-C. Several policies that could mitigate these trends have been highlighted.
FundingThis project was funded by the National Institute for Health Research Public Health Research (project number 13/43/58). The views and opinions expressed

Nicotine & Tobacco Research, 2017, Vol. 00, No. 0010
therein are those of the authors and do not necessarily reflect those of the Public Health Research programme, NIHR, NHS or the Department of Health. The ITC project is funded by the following grants: Canadian Institutes of Health Research (57897, 79551, 115016), Robert Wood Johnson Foundation (045734), Cancer Research U.K. (C312/A326, C312/A6465, C312/A11039, C312/A11943), Commonwealth Department of Health and Aging, Canadian Tobacco Control Research Initiative (014578), National Health and Medical Research Council of Australia (265903, 450110, APP1005922), U.S. National Cancer Institute (P50 CA111236, R01 CA100362), Ontario Institute for Cancer Research (Senior Investigator Award).
Declaration of InterestsAG, RH, SH, AM, and TP are members of the UK Centre for Tobacco & Alcohol Studies, a UK Clinical Research Collaboration Public Health Research: Centre of Excellence whose work is supported by funding from the Medical Research Council, British Heart Foundation, Cancer Research UK, Economic and Social Research Council, and the National Institute for Health Research under the auspices of the UK Clinical Research Collaboration (MR/K023195/1).
AcknowledgmentsThe authors would like to thank members of the Data Management Core at the University of Waterloo for assistance in preparing the data for this analysis.
References 1. Chaloupka FJ, Straif K, Leon ME. Effectiveness of tax and price policies in
tobacco control. Tob Control. 2011;20(3):235–238. 2. IARC. IARC Handbooks of cancer prevention, tobacco control, Vol 14:
Effectiveness of tax and price policies for tobacco control. Lyon, France: IARC; 2011.
3. Thomas S, Fayter D, Misso K, et al. Population tobacco control interven-tions and their effects on social inequalities in smoking: systematic review. Tob Control. 2008;17(4):230–237.
4. Hiscock R, Bauld L, Amos A, Fidler JA, Munafò M. Socioeconomic status and smoking: a review. Ann N Y Acad Sci. 2012;1248(1):107–123.
5. Brown T, Platt S, Amos A. Equity impact of population-level interven-tions and policies to reduce smoking in adults: a systematic review. Drug Alcohol Depend. 2014;138:7–16.
6. Hill S, Amos A, Clifford D, Platt S. Impact of tobacco control interventions on socioeconomic inequalities in smoking: review of the evidence. Tob Control. 2014;23(e2):e89–e97.
7. World Health Organization (2015). The economic and health benefits of tobacco taxation. Retrieved from http://www.who.int/tobacco/publica-tions/economics/post2015tobacco/en/. Accessed August 8, 2016.
8. Joosens L, Raw M. The Tobacco Control Scale 2013 in Europe. Brussels, Belgium: Association of European Cancer Leagues (ECL); 2014
9. Shang C, Chaloupka FJ, Zahra N, Fong GT. The distribution of ciga-rette prices under different tax structures: findings from the International Tobacco Control Policy Evaluation (ITC) Project. Tob Control. 2014;23(Suppl 1):i23–i29.
10. Hanewinkel R, Isensee B. Five in a row—reactions of smokers to tobacco tax increases: population-based cross-sectional studies in Germany 2001–2006. Tob Control. 2007;16(1):34–37.
11. Licht AS, Hyland AJ, O’Connor RJ, et al. How do price minimizing behav-iors impact smoking cessation? Findings from the International Tobacco Control (ITC) Four Country Survey. Int J Environ Res Public Health. 2011;8(5):1671–1691.
12. Ross H, Blecher E, Yan L, Hyland A. Do cigarette prices motivate smokers to quit? New evidence from the ITC survey. Addiction. 2011;106(3):609–619.
13. Li QA, Hyland A, Fong GT, Jiang YA, Elton-Marshall T. Use of less expensive cigarettes in six cities in China: findings from the International Tobacco Control (ITC) China Survey. Tob Control. 2011;19:i63–i68.
14. Cornelius ME, Driezen P, Fong GT, et al. Trends in the use of premium and discount cigarette brands: findings from the ITC US Surveys (2002–2011). Tob Control. 2014;23(Suppl 1):i48–i53.
15. Saenz de Muera Juarez B, Thrasher JF, Shigematsu LMR, Avila MH, Chaloupka FJ. Tax, price and cigarette brand preferences: a longitudi-nal study of adult smokers from the ITC Mexico Survey. Tob Control. 2014;23(Suppl 1):80–85.
16. Curti D, Shang C, Ridgeway W, Chaloupka FJ, Fong GT. The use of legal, illegal and roll-your-own cigarettes to increasing tobacco excise taxes and comprehensive tobacco control policies: findings from the ITC Uruguay Survey. Tob Control. 2015;24(Suppl 3) :17–24.
17. Young D, Yong HH, Borland R, et al. Trends in roll-your-own smok-ing: findings from the ITC Four-Country Survey (2002–2008). J Environ Public Health. 2012;2012:1–7.
18. Rothwell L, Britton J, Bogdanovica I. The relation between cigarette price and hand-rolling tobacco consumption in the UK: an ecological study. BMJ Open. 2015;5(6):e007697.
19. Gilmore AB, Tavakoly B, Taylor G, Reed H. Understanding tobacco indus-try pricing strategy and whether it undermines tobacco tax policy: the example of the UK cigarette market. Addiction. 2013;108(7):1317–1326.
20. Choi K, Hennrikus D, Forster J, St Claire AW. Use of price-minimizing strategies by smokers and their effects on subsequent smoking behaviors. Nicotine Tob Res. 2012;14(7):864–870.
21. DeCicca P, Kenkel D, Liu F. Who pays cigarette taxes? The impact of con-sumer price search. Rev Econ Stat. 2013;95(2):516–529.
22. Nagelhout GE, van den Putte B, Allwright S, et al. Socioeconomic and country variations in cross-border cigarette purchasing as tobacco tax avoidance strategy. Findings from the ITC Europe Surveys. Tob Control. 2014;23(Suppl 1):i30–i38.
23. Gilmore AB, Rowell A, Gallus S, Lugo A, Joossens L, Sims M. Towards a greater understanding of the illicit tobacco trade in Europe: a review of the PMI funded ‘Project Star’ report. Tob Control. 2014;23(e1):e51–e61.
24. ASH. Analysis of tobacco tax increases in the United Kingdom. Retrieved from http://ash.org.uk/files/documents/ASH_976.pdf. Accessed August 8, 2016.
25. European Union. COUNCIL DIRECTIVE 2010/12/EU of 16 February 2010: amending Directives 92/79/EEC, 92/80/EEC and 95/59/EEC on the structure and rates of excise duty applied on manufactured tobacco and Directive 2008/118/EEC. Official J Eur Union. 2010;50:1–7. Accessed February 27, 2010; 57:L50.
26. HM Customs and Excise & HM Treasury (2000). Tackling Tobacco Smuggling. Retrieved from http://tobacco.cleartheair.org.hk/wp-content/uploads/2010/02/433.pdf. Accessed January 23, 2017.
27. HM Treasury and HM Revenue & Customs (2006). New responses to new challenges: Reinforcing the tackling tobacco smuggling strategy. Retrieved from http://www.thecre.com/ccsf/wp-content/uploads/2011/06/New_responses_to_new_challenges_reinforcing_Tackling_Tobacco_Smuggling_Strategy.pdf. Accessed January 23, 2017.
28. HM Revenue & Customs (2011). Tackling tobacco smuggling—building on our success. Retrieved from https://www.gov.uk/government/uploads/system/uploads/attachment_data/file/398461/Tackling_tobacco_smug-gling_-_building_on_our_success.pdf. Accessed January 23, 2017.
29. HM Revenu Customs (2015). Tackling illicit tobacco: From leaf to light. Retrieved from https://www.gov.uk/government/uploads/system/uploads/attachment_data/file/418732/Tackling_illicit_tobacco_-_From_leaf_to_light__2015_.pdf. Accessed January 23, 2017.
30. McNeill A, Iringe-Koko B, Bains M, Bauld L, Siggens G, Russell A. Countering the demand for, and supply of, illicit tobacco: an assess-ment of the ‘North of England Tackling Illicit Tobacco for Better Health’ Programme. Tob Control. 2014;23(e1):e44–e50.
31. Hyland A, Laux FL, Higbee C, et al. Cigarette purchase patterns in four countries and the relationship with cessation: findings from the International Tobacco Control (ITC) Four Country Survey. Tob Control. 2006;15(Suppl 3):iii59–iii64.
32. Gilmore AB, Tavakoly B, Hiscock R, Taylor G. Smoking patterns in Great Britain: the rise of cheap cigarette brands and roll your own (RYO) tobacco. J Public Health (Oxf). 2015;37(1):78–88.
Nicotine & Tobacco Research, 2017, Vol. 00, No. 00 11
33. Guindon GE, Driezen P, Chaloupka FJ, Fong GT. Cigarette tax avoid-ance and evasion: findings from the International Tobacco Control Policy Evaluation (ITC) Project. Tob Control. 2014;23(Suppl 1):i13–i22.
34. Licht AS, Hyland AJ, O’Connor RJ, et al. Socio-economic variation in price minimizing behaviors: findings from the International Tobacco Control (ITC) Four Country Survey. Int J Environ Res Public Health. 2011;8(1):234–252.
35. Fong GT, Cummings KM, Borland R, et al. The conceptual framework of the International Tobacco Control (ITC) policy evaluation project. Tob Control. 2006;15(Suppl 3):iii3–iii11.
36. Thompson ME, Fong GT,Hammond D, et al. Methods of the International Tobacco Control (ITC) four country survey. Tob Control. 2006;15(Suppl 3):iii12–iii18.
37. Campbell R. (2015). Consumer Price Inflation: July 2015 [Version 3A77-323643: Office for National Statistics]. Retrieved from: http://www.ons.gov.uk/ons/rel/cpi/consumer-price-indices/june-2015/index.html. Accessed January 23, 2017.
38. Joossens L, Raw M. From cigarette smuggling to illicit tobacco trade. Tob Control. 2012;21(2):230–234.
39. L’Hoiry XD. Tobacco smuggling: A review of the literature. Eur J Crime Crim Law Crim Justice. 2012;20(4):415–444.
40. Guindon GE, Driezen P, Chaloupka FJ, Fong GT. Cigarette tax avoid-ance and evasion: findings from the International Tobacco Control Policy Evaluation (ITC) project. Tob Control. 2014;23(Suppl 1):i13–i22.
41. Laugesen M, Epton M, Frampton CM, Glover M, Lea RA. Hand-rolled cigarette smoking patterns compared with factory-made cigarette smoking in New Zealand men. BMC Public Health. 2009;9:194.
42. Rosenberry ZR, Strasser AA, Canlas LL, Potts JL, Pickworth WB. Make your own cigarettes: characteristics of the product and the consumer. Nicotine Tob Res. 2013;15(8):1453–1457.
43. Gallus S, Lugo A, Ghislandi S, La Vecchia C, Gilmore AB. Roll-your-own cigarettes in Europe: use, weight and implications for fiscal policies. Eur J Cancer Prev. 2014;23(3):186–192.
44. Orchard C. (2016). Adult smoking habits in Great Britain: 2014. Office for National Statistics. Retrieved from http://www.ons.gov.uk/peoplepop-ulationandcommunity/healthandsocialcare/healthandlifeexpectancies/bul-letins/adultsmokinghabitsingreatbritain/2014. Accessed January 23, 2017.
45. Gray C, Joss T. (2013). Tobacco factsheet, November 2013. London, United Kingdom: HM Revenue Customs. Retrieved from https://www.uktradeinfo.com/Statistics/Pages/TaxAndDutyBulletins.aspx. Accessed January 23, 2017.
46. Marsh L, Cameron C, Quigg R, et al. The impact of an increase in excise tax on the retail price of tobacco in New Zealand. Tob Control. 2016;25(4):458–463.
47. HM Revenu & Customs (2015). Tackling illicit tobacco: From leaf to light. Retrieved from https://www.gov.uk/government/uploads/system/uploads/attachment_data/file/418732/Tackling_illicit_tobacco_-_From_leaf_to_light__2015_.pdf. Accessed January 23, 2017.
48. Gauke D. (2016). Budget 2016. (HC 901). United Kingdom: HM Treasury. Retrieved from https://www.gov.uk/government/uploads/sys-tem/uploads/attachment_data/file/508193/HMT_Budget_2016_Web_Accessible.pdf. Accessed January 23, 2017.
49. ASHUKCTAS. HM Treasury Budget 2017: Representation from ASH and the UK Centre for Tobacco and Alcohol Studies to the Chancellor of the Exchequer. United Kingdom; 2017.
50. Branston JR, Gilmore AB. The case for Ofsmoke: the potential for price cap regulation of tobacco to raise £500 million per year in the UK. Tob Control. 2014;23(1):45–50.
51. Whicker H, White A. (2015). HMRC: Measuring Tax Gaps 2015 Edition: Tax Gap Estimates for 2013–14. London, United Kingdom.