Particulate Carbon and Dust Deposition The...
19
Subscriber access provided by City University of Hong Kong Library Environmental Science & Technology is published by the American Chemical Society. 1155 Sixteenth Street N.W., Washington, DC 20036 Published by American Chemical Society. Copyright © American Chemical Society. However, no copyright claim is made to original U.S. Government works, or works produced by employees of any Commonwealth realm Crown government in the course of their duties. Article The Discoloration of the Taj Mahal due to Particulate Carbon and Dust Deposition Mike H. Bergin, Sachi Nand Tripathi, J Jai Devi, Tarun Gupta, Michael McKenzie, K S Rana, Martin M. Shafer, Ana M Villalobos, and James J. Schauer Environ. Sci. Technol., Just Accepted Manuscript • DOI: 10.1021/es504005q • Publication Date (Web): 03 Dec 2014 Downloaded from http://pubs.acs.org on December 10, 2014 Just Accepted “Just Accepted” manuscripts have been peer-reviewed and accepted for publication. They are posted online prior to technical editing, formatting for publication and author proofing. The American Chemical Society provides “Just Accepted” as a free service to the research community to expedite the dissemination of scientific material as soon as possible after acceptance. “Just Accepted” manuscripts appear in full in PDF format accompanied by an HTML abstract. “Just Accepted” manuscripts have been fully peer reviewed, but should not be considered the official version of record. They are accessible to all readers and citable by the Digital Object Identifier (DOI®). “Just Accepted” is an optional service offered to authors. Therefore, the “Just Accepted” Web site may not include all articles that will be published in the journal. After a manuscript is technically edited and formatted, it will be removed from the “Just Accepted” Web site and published as an ASAP article. Note that technical editing may introduce minor changes to the manuscript text and/or graphics which could affect content, and all legal disclaimers and ethical guidelines that apply to the journal pertain. ACS cannot be held responsible for errors or consequences arising from the use of information contained in these “Just Accepted” manuscripts.
Transcript of Particulate Carbon and Dust Deposition The...

Subscriber access provided by City University of Hong Kong Library
Environmental Science & Technology is published by the American Chemical Society.1155 Sixteenth Street N.W., Washington, DC 20036Published by American Chemical Society. Copyright © American Chemical Society.However, no copyright claim is made to original U.S. Government works, or worksproduced by employees of any Commonwealth realm Crown government in the courseof their duties.
Article
The Discoloration of the Taj Mahal due toParticulate Carbon and Dust Deposition
Mike H. Bergin, Sachi Nand Tripathi, J Jai Devi, Tarun Gupta, MichaelMcKenzie, K S Rana, Martin M. Shafer, Ana M Villalobos, and James J. Schauer
Environ. Sci. Technol., Just Accepted Manuscript • DOI: 10.1021/es504005q • Publication Date (Web): 03 Dec 2014
Downloaded from http://pubs.acs.org on December 10, 2014
Just Accepted
“Just Accepted” manuscripts have been peer-reviewed and accepted for publication. They are postedonline prior to technical editing, formatting for publication and author proofing. The American ChemicalSociety provides “Just Accepted” as a free service to the research community to expedite thedissemination of scientific material as soon as possible after acceptance. “Just Accepted” manuscriptsappear in full in PDF format accompanied by an HTML abstract. “Just Accepted” manuscripts have beenfully peer reviewed, but should not be considered the official version of record. They are accessible to allreaders and citable by the Digital Object Identifier (DOI®). “Just Accepted” is an optional service offeredto authors. Therefore, the “Just Accepted” Web site may not include all articles that will be publishedin the journal. After a manuscript is technically edited and formatted, it will be removed from the “JustAccepted” Web site and published as an ASAP article. Note that technical editing may introduce minorchanges to the manuscript text and/or graphics which could affect content, and all legal disclaimersand ethical guidelines that apply to the journal pertain. ACS cannot be held responsible for errorsor consequences arising from the use of information contained in these “Just Accepted” manuscripts.

Page 1 of 18
ACS Paragon Plus Environment
Environmental Science & Technology
1
The Discoloration of the Taj Mahal due to 1
Particulate Carbon and Dust Deposition 2
M.H. Bergin1,2*, S.N. Tripathi
3*, J. Jai Devi
1,2, T. Gupta
3, M.Mckenzie
2, K.S. Rana
4, M.M. 3
Shafer5, Ana M. Villalobos
5, J.J. Schauer
5 4
1School of Earth and Atmospheric Sciences, Georgia Institute of Technology, Atlanta, GA, USA. 5
2School of Civil and Environmental Engineering, Georgia Institute of Technology, Atlanta, GA, 6
USA, [email protected], 404-894-9723 7
3Department of Civil Engineering and Center for Environmental Science and Engineering, Indian 8
Institute of Technology, Kanpur, India, [email protected], 91-512-259-7845 9
4Archaelogical Survey of India (Science Branch), Delhi, India. 10
5Environmental Chemistry and Technology Program, University of Wisconsin at Madison, 11
Madison, WI, USA. 12
KEYWORDS: Brown Carbon (BrC), Black Carbon (BC), Dust, Surface Discoloration, Biomass 13
Burning, Trash/Refuse Burning 14
15
Page 2 of 18
ACS Paragon Plus Environment
Environmental Science & Technology

2
Abstract 16
The white marble domes of the Taj Mahal are iconic images of India that attract millions of 17
visitors every year. Over the past several decades the outer marble surfaces of the Taj Mahal 18
have begun to discolor with time and must be painstakingly cleaned every several years. 19
Although it has been generally believed that the discoloration is in some way linked with poor air 20
quality in the Agra region, the specific components of air pollution responsible have yet to be 21
identified. With this in mind, ambient particulate matter (PM) samples were collected over a one-22
year period and found to contain relatively high concentrations of light absorbing particles that 23
could potentially discolor the Taj Mahal marble surfaces, that include black carbon (BC), light 24
absorbing organic carbon (brown carbon, BrC), and dust. Analyses of particles deposited to 25
marble surrogate surfaces at the Taj Mahal indicate that a large fraction of the outer Taj Mahal 26
surfaces are covered with particles that contain both carbonaceous components and dust. We 27
have developed a novel approach that estimates the impact of these deposited particles on the 28
visible light surface reflectance, which is in turn used to estimate the perceived color by the 29
human eye. Results indicate that deposited light absorbing dust and carbonaceous particles (both 30
BC and BrC from the combustion of fossil fuels and biomass) are responsible for the surface 31
discoloration of the Taj Mahal. Overall, the results suggest that the deposition of light absorbing 32
particulate matter in regions of high aerosol loading are not only influencing cultural heritage but 33
also the aesthetics of both natural and urban surfaces. 34
35
Page 3 of 18
ACS Paragon Plus Environment
Environmental Science & Technology

3
Introduction 36
On the timescale of several years the outer marble surfaces of the Taj Mahal become discolored 37
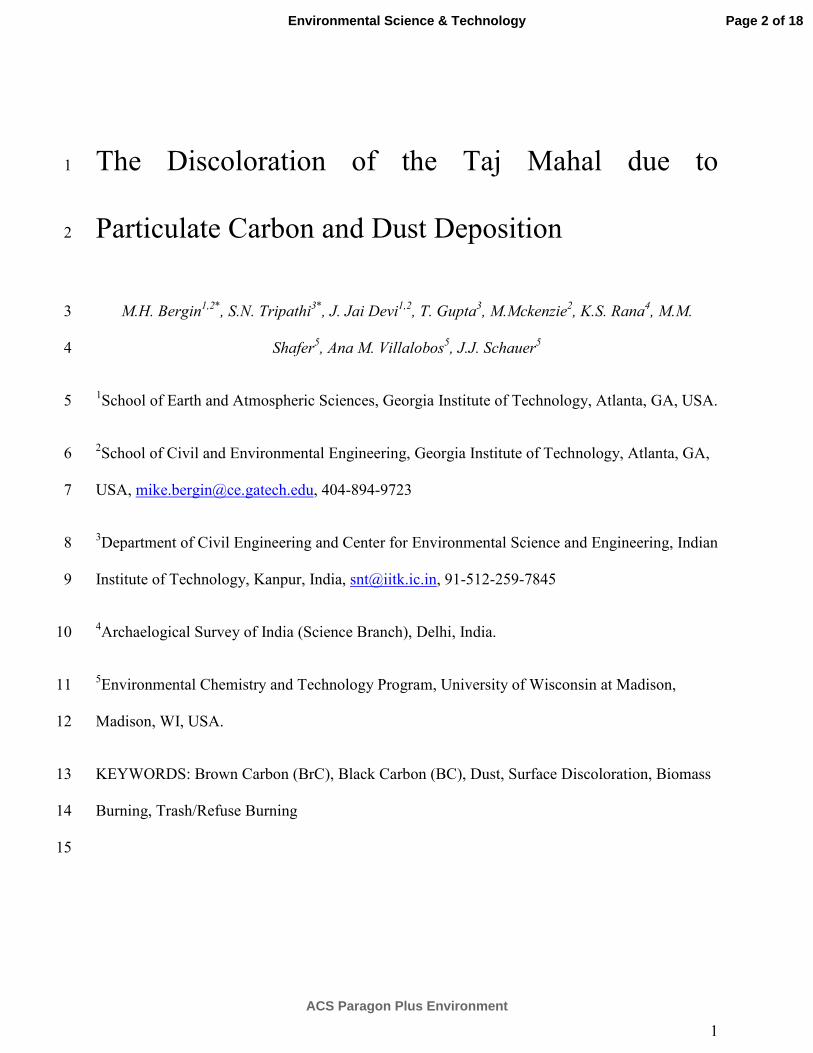
and must be cleaned in a time consuming process (1). Figure 1 shows a cleaned section of a 38
marble Mosque Dome at the Taj Mahal (where cleaning involves applying a layer of clay and 39
removing the clay after it 40
dries, followed by rinsing 41
the surface with clean 42
water) directly next to an 43
area being prepared for 44
cleaning. An obvious 45
contrast is seen between 46
the clean, white marble 47
surface and the darker 48
discolored surface of the 49
Marble Dome. Many 50
measures have been 51
undertaken to avoid the impact of local air pollution, including restricting traffic within 1 km of 52
the grounds and limiting the emissions of industrial pollution in the city of Agra, where the Taj 53
Mahal is located. While detailed scientific studies have not been reported in the literature, past 54
efforts focusing on the discoloration have hypothesized that local air quality is responsible and 55
suggestions have included surface reactions with gas-phase SO2, as well as aqueous phase 56
chemistry linked with the deposition of fog droplets, and water condensation (2), as well as dust 57
FIGURE 1. A clean surface and an area being prepared for
cleaning on a marble Mosque dome at the Taj Mahal
Page 4 of 18
ACS Paragon Plus Environment
Environmental Science & Technology

4
deposition (1). Despite efforts to keep the outer surfaces of the Taj Mahal white, it continues to 58
become discolored with time, and the reason for the discoloration is not currently understood. 59
Recent work has reported poor air quality throughout the Indo-Gangetic plain (3,4), including 60
relatively high concentrations of particulate matter in Agra (5-7). Particulate matter in the region 61
includes the light absorbing components black carbon (BC), light absorbing organic carbon (a 62
fraction of which can absorb light preferentially in the UV region and is often termed brown 63
carbon, BrC), and dust (8). Both organic carbon and dust have the potential to preferentially 64
absorb solar light in the blue region of the spectrum, which can give the atmosphere a brown hue 65
and has thus been dubbed the Atmospheric Brown Cloud (9). The presence of these light 66
absorbing aerosols, and in particular those that can take on a dark hue against a light colored 67
background, suggest that the deposition of ambient particulate matter may be playing a role in 68
the discoloration of the outer white marble surfaces of the Taj Mahal. 69
70
Experimental Methods 71
72
Ambient Particulate Sampling and Analyses. In order to determine the influence of PM on the 73
Taj Mahal, ambient aerosol sampling was conducted for a roughly one-year period beginning on 74
Nov. 5, 2011 and continuing through June, 2012 just prior to the monsoon season. Filters were 75
collected every 6th
day each month for both PM2.5 (fine particulate matter having diameters less 76
than 2.5 µm) and total suspended particulate matter (TSP), and analyzed for major anions, 77
organic (OC) and elemental carbon (EC), and trace elements. The PM2.5 cut-point was 78
established using an upstream cyclone, while the TSP directly sampled ambient air. Portions of 79
each filter were combined to make monthly composites that were extracted and analyzed for 80
source specific trace organic compounds using GCMS. The trace organic concentrations were 81
Page 5 of 18
ACS Paragon Plus Environment
Environmental Science & Technology

5
used to estimate source contributions to particulate organic carbon using chemical mass balance 82
(CMB) modeling (10). Additional information on the sampling and chemical analyses is 83
presented in the Supplementary Material section (sections S1 and S2). 84
85
Marble Deposition Target Sampling and Analyses. In addition to ambient samples, several 86
pre-cleaned marble deposition targets (with dimensions 2 cm x 2 cm x 0.5 cm) were placed 87
outdoors within roughly 300 m of the main Taj Mahal dome. Both the air sampling equipment 88
and targets were located in a section of the Taj Mahal that was accessible only to staff of the 89
Archaeological Survey of India (ASI), and had very little foot traffic. Pre-cleaned marble 90
cuboids were fastened to Taj Mahal structures with double-sided tape at a variety of locations, 91
and exposed from April to June 2012. Some of the marble samples were placed horizontally and 92
others vertically. Prior to, and after exposure, the marble samples were placed in sealed, pre-93
cleaned petri dishes and stored in a freezer to avoid degradation of deposited particles. 94
Scanning Electron Microscopy (SEM) (LEO 1530, Carl Zeiss Microscopy) and Energy 95
Dispersive X-ray (EDX) Spectroscopy (Oxford Instruments Xmax detector) were carried out on 96
two horizontally facing marble targets. Images were taken at many different magnifications to 97
capture the particles having sizes ranging from 100 nm to 100 µm. The particle sizes and shapes 98
were accessed through SEM images using image processing in a Matlab program. EDX analyses 99
were carried out on the same marble targets on ~ 1000 particles. The information gained from the 100
SEM/EDX analyses allowed for the estimation of the particle number and surface area 101
concentration, and chemical composition as a function of area of the marble target. This 102
information was then used, as described in the next sections, to estimate the change in color of 103
Page 6 of 18
ACS Paragon Plus Environment
Environmental Science & Technology

6
the marble surface. More information on the SEM/EDX analyses is given in the Supplementary 104
Material Sections S1 and S2. 105
106
Linking Deposited Particles to Marble Surface Color. In order to estimate the impact of 107
particles deposited to the marble substrate on the perceived color change of the surface, we 108
developed an approach that estimates the influence of deposited particles on wavelength-109
dependent surface reflectance. The method builds on previous work that estimated the influence 110
of particles deposited to plant leafs on available photosynthetically active radiation (11). First, 111
we use SEM/EDX analyses of particles deposited to the marble targets to estimate the optical 112
depth of deposited particles as a function of wavelength (τλ) as follows: 113
τ λ =π
4Aci
i=1
n
∑ Dp, i
2 Qsλ +Qaλ[ ]i
(1) 114
Where Ac is the areal particle number concentration (number of particles deposited per area of 115
the marble surface) for each size bin, i, Dp is the particle diameter for deposited particles, and 116
Qsλ and Qaλ are the wavelength dependent Mie scattering and absorption efficiencies that are 117
determined based on particle size and composition. 118
119
After estimating the optical depth, the wavelength dependent single scattering albedo, ωλ (ratio 120
of light scattering to extinction) is estimated as: 121
ωλ =
Aci Dp,i
2 Qsλ,i
i=1
n
∑
Aci Dp,i
2Qsλ +Qaλ[ ]
i
i=1
n
∑ (2) 122
Page 7 of 18
ACS Paragon Plus Environment
Environmental Science & Technology

7
The single scattering albedo is a key parameter that determines the relative amount of light 123
absorption that occurs over the white marble surface. For white, scattering only particles the 124
single scattering albedo is near 1.0 and the surface reflectance of a white surface will not change. 125
126
The change in the surface reflectance of the white marble surface is calculated using SBDART, a 127
radiative transfer model (12) with input values including τλ and ωλ estimated from equations 1, 128
and 2 as well as the asymmetry parameter (relative amount of light scattering in the forward 129
direction) as a function of wavelength using Mie theory (13). 130
131
In order to determine the perceived color change of the white marble surface based on particle 132
deposition, and the related change in spectral surface reflectance we used the model described by 133
D’Andrade and Romney (14) to convert spectral reflectance to perceived color in the Munsell 134
color system. The Munsell color system is based on three components that include the value 135
(lightness/darkness), hue (color), and chroma (purity/saturation). The model used to estimate the 136
perceived color of the marble surface with deposited particles uses the spectral reflectance from 137
the radiative transfer model of the marble surface loaded with particles to estimate the Munsell 138
color. The Munsell color estimate also takes into consideration the human eye response as a 139
function of wavelength of incident light (the approach is described in more detail in the 140
supplementary information, section S3). 141
142
Results and Discussion 143
Page 8 of 18
ACS Paragon Plus Environment
Environmental Science & Technology

8
Ambient Particulate Concentrations. Figure 2a shows the average mass concentrations of 144
particulate organic carbon mass (OM), ions, dust and elemental carbon (EC) for both TSP and 145
PM2.5 over the sampling 146
period. The mean daily 147
concentrations (and standard 148
deviations) of both TSP and 149
PM2.5 are 135 (55) and 60 150
(39) µgm-3
. The values are 151
significantly higher than the 152
annual World Health 153
Organization (WHO) PM 154
guidelines for PM10 and 155
PM2.5 of 20 µgm-3
and 10 156
µgm-3
highlighting the poor 157
air quality in the region. The 158
fraction of particulate matter 159
greater than 2.5 µm is ~60%, 160
and is due in large part to the 161
coarse mode dust that 162
increases from 15% of the 163
PM2.5 mass fraction to 30% 164
FIGURE 2. The general chemical composition of (a) Total
Suspended Particulate matter (TSP) and fine particulate
matter (PM2.5), and (b) source apportionment of PM2.5
organic mass (OM) based on filter sampling at the Taj
Mahal
Page 9 of 18
ACS Paragon Plus Environment
Environmental Science & Technology

9
of the TSP mass. In addition to dust, other 165
PM components that absorb light in the 166
visible spectrum, and hence have the 167
possibility to influence the color of the outer 168
white marble surfaces, are elemental carbon 169
(EC) that is responsible for 2% of the TSP 170
mass, as well as OM that accounts for 39% of 171
the TSP mass. Estimates of the sources of 172
OM in the PM2.5 mass fraction shown in 173
Figure 2b indicate that biomass burning, a 174
known source of BrC, is responsible for 175
roughly half of the OM with significant 176
contributions from vehicular emissions. It 177
should be pointed out that biomass burning 178
OM can be from a variety of activities 179
including the combustion of wood and dung, 180
crop residue, and the burning of trash and 181
refuse that is ubiquitous in the region. The 182
prevalence of light absorbing aerosols in 183
Agra (i.e. elemental and organic carbon, and dust) suggests that PM deposition to the white 184
marble surfaces may be responsible for the observed discoloration of the outer Taj Mahal 185
structures including the famous Taj Mahal dome. 186
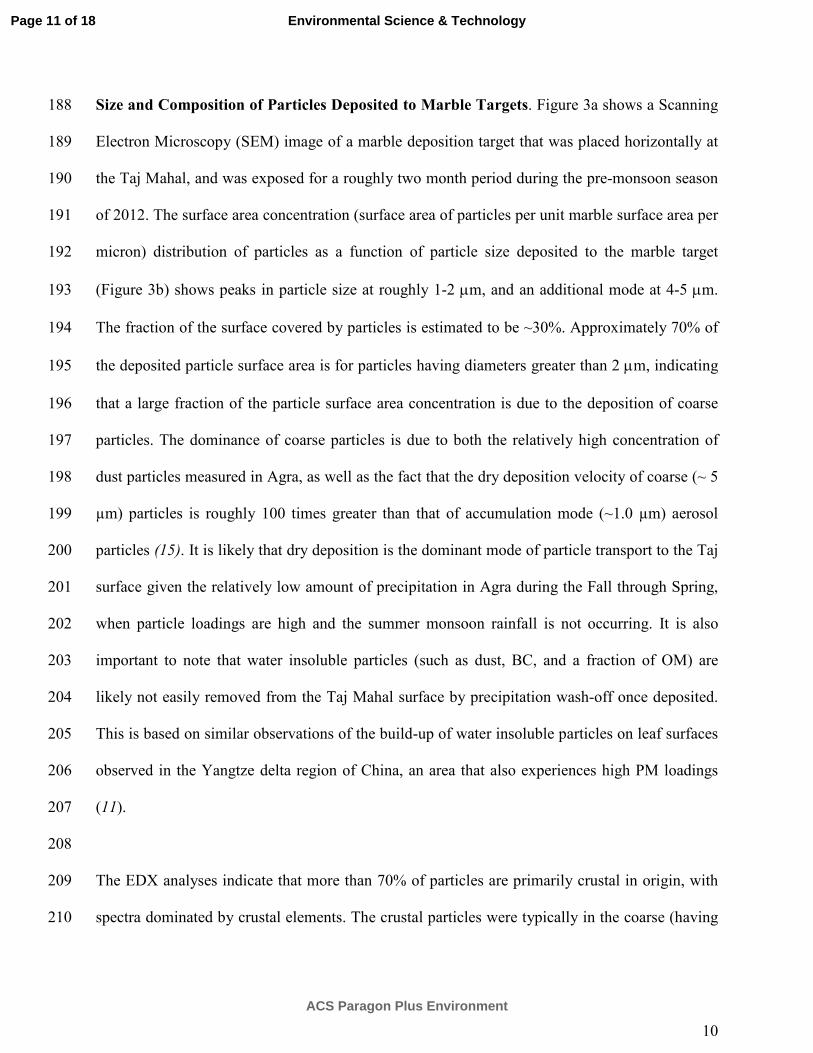
187
FIGURE 3. a) SEM image of marble
target from Taj Mahal indicating
deposited particles and b) surface area
concentration of deposited particles on the
marble target as a function of particle
(a)
(b)
Particle
Marble
Surface
Page 10 of 18
ACS Paragon Plus Environment
Environmental Science & Technology
10
Size and Composition of Particles Deposited to Marble Targets. Figure 3a shows a Scanning 188
Electron Microscopy (SEM) image of a marble deposition target that was placed horizontally at 189
the Taj Mahal, and was exposed for a roughly two month period during the pre-monsoon season 190
of 2012. The surface area concentration (surface area of particles per unit marble surface area per 191
micron) distribution of particles as a function of particle size deposited to the marble target 192
(Figure 3b) shows peaks in particle size at roughly 1-2 µm, and an additional mode at 4-5 µm. 193
The fraction of the surface covered by particles is estimated to be ~30%. Approximately 70% of 194
the deposited particle surface area is for particles having diameters greater than 2 µm, indicating 195
that a large fraction of the particle surface area concentration is due to the deposition of coarse 196
particles. The dominance of coarse particles is due to both the relatively high concentration of 197
dust particles measured in Agra, as well as the fact that the dry deposition velocity of coarse (~ 5 198
µm) particles is roughly 100 times greater than that of accumulation mode (~1.0 µm) aerosol 199
particles (15). It is likely that dry deposition is the dominant mode of particle transport to the Taj 200
surface given the relatively low amount of precipitation in Agra during the Fall through Spring, 201
when particle loadings are high and the summer monsoon rainfall is not occurring. It is also 202
important to note that water insoluble particles (such as dust, BC, and a fraction of OM) are 203
likely not easily removed from the Taj Mahal surface by precipitation wash-off once deposited. 204
This is based on similar observations of the build-up of water insoluble particles on leaf surfaces 205
observed in the Yangtze delta region of China, an area that also experiences high PM loadings 206
(11). 207
208
The EDX analyses indicate that more than 70% of particles are primarily crustal in origin, with 209
spectra dominated by crustal elements. The crustal particles were typically in the coarse (having 210
Page 11 of 18
ACS Paragon Plus Environment
Environmental Science & Technology

11
diameters greater than ~ 2-3 µm) size fraction. Particles having diameters less than 2 µm, which 211
account for roughly 30% of the deposited particle surface area, also contained significant 212
amounts of carbon likely from the sources of OM highlighted in CMB results in Figure 2b. More 213
detailed information on the EDX analyses, including example spectra of particle EDX analyses 214
are given in the supplementary section (S2). 215
216
Deposited Particles and Perceived Color. To estimate τλ we assume that particles having 217
diameters less than 3 µm are composed primarily of light absorbing organic carbon (BrC) with 218
wavelength dependent refractive indices reported by Liu et al. (16). This assumption is based on 219
the fact that ambient filters indicated that roughly half of the PM2.5 was carbonaceous in nature, 220
combined with the fact that we did not observe the presence of major ion related elements (i.e. S) 221
deposted to the marble targets, but did see a dominance of carbon particles in the less than 3 µm 222
particle sizes. We also assume that 10% of the particles less than 3 µm are black carbon (BC) 223
particles with a refractive index commonly used for soot particles (13). It is likely that we 224
overestimate the influence light absorption by BrC and BC since we assume that all of the 225
particles less than 3 µm are carbonaceous and not elemental or ionic in nature. Aerosol optical 226
depth contributions at 400 nm for dust, BrC and BC are estimated to be 0.222, 0.144 and 0.016 227
respectively, highlighting the importance of light extinction by all three components. The single 228
scattering albedo at 400 nm and 700 nm is estimated to be 0.64 and 0.95, indicating that a 229
significant amount of light absorption occurs at near-ultraviolet wavelengths preferentially to 230
that at the longer 700 nm wavelength. 231
232
Page 12 of 18
ACS Paragon Plus Environment
Environmental Science & Technology

12
Figure 4a shows the surface reflectance of a pure marble surface as well as the estimated surface 233
reflectance for several cases including the influence from each light absorbing particulate 234
component separately (BC, BrC and 235
dust), and the case when all 236
components are combined. As seen 237
in the plot, BC absorbs across all 238
wavelengths evenly, with brown 239
carbon showing preferential 240
absorption at shorter wavelengths 241
near 400 nm. Dust substantially 242
reduces the surface reflectance at all 243
wavelengths, and preferentially so at 244
shorter wavelengths due to the 245
presence of hematite, which absorbs 246
at blue wavelengths. When 247
combined, dust, BrC, and BC are 248
estimated to substantially alter the 249
surface reflectance with enhanced 250
absorption (i.e. lower values of 251
surface reflectance) at shorter 252
wavelengths. 253
254
FIGURE 4. (a) Estimated marble target surface
reflectance for a clean surface and surface area
coverage of particles based on Fig. 3 for black
carbon (BC), Brown Carbon (BrC), Dust and all
particles (BC+BrC+Dust) (b) Change in color of
white marble surface for dust, BrC, BC separately
and combined. Values in parenthesis represent
fraction of total surface area concentration
contributed by each component with AOD values
estimated by Eqn. 1 at 400 nm
(a)
(b)
Page 13 of 18
ACS Paragon Plus Environment
Environmental Science & Technology

13
Figure 4b shows the estimated change in color of the white surface for deposition of the light 255
absorbing particles measured in Figure 3b over the two-month period the targets were exposed. 256
Results indicate that separately each component contributes to the color change of the Taj Mahal 257
white marble surfaces. For BC alone (which we estimate to account for 3% of the total particle 258
surface area) the color change results in a greyish color given that the change in surface 259
reflectance is proportionally similar at each wavelength. Both BrC (~30% of the total particle 260
surface area) and dust influence color with preferential absorption in the UV resulting in 261
yellowish-brown hues. When combined, the perceived color of the surface shifts towards darker 262
shades of yellow-brown. It should be pointed out that our sample targets were mounted for a 263
relatively short time (~2 months) compared to the typical time between cleanings of the outer Taj 264
Mahal surfaces (several years), and therefore it may be expected that the perceived color of the 265
marble target would be attenuated compared to that of the white surfaces of the Taj Mahal. 266
Indeed the marble target surface did appear somewhat lighter in color as compared to the color 267
estimates in Figure 4b, although qualitatively were similar. There are several uncertainties in 268
estimating perceived color including the loading, particle size, and optical properties. Analyses 269
(included in section S3) suggest that results are moderately sensitive to both particle loading and 270
size. For example, assuming an uncertainty of 50% for aerosol loading only moderately 271
influences the perceived color and does not change the conclusions that both dust and 272
carbonaceous particles contribute to the perceived color change of the Taj Mahal. Overall, the 273
results indicate that light absorbing particles play an important role in the discoloration of the Taj 274
Mahal surface and that dust, as well as BC and BrC that are primarily from biomass combustion, 275
trash/refuse burning, and mobile sources, all make significant contributions to the discoloration. 276
Page 14 of 18
ACS Paragon Plus Environment
Environmental Science & Technology

14
This work further suggests that the deposition of light absorbing particulate matter to both 277
natural and human-made surfaces results in a substantial discoloration in regions of high aerosol 278
loading. The discoloration impacts not only cultural artifacts but also the aesthetics of the 279
environment through the modification of surface albedo, and hence perceived color. The 280
measurement/modeling approach developed in this paper allows surface color changes to be 281
estimated based on the relative amounts of light absorbing particles deposited to surfaces, and 282
can be used to develop future control strategies to prevent the discoloration of the environment 283
by particle deposition, that will also improve air quality. 284
Acknowlegements: This work was supported by grants from the Indo US Science and 285
Technology Forum (IUSSTF) as well as from the US EPA (grant # RD83479901), and the NSF 286
PIRE Grant 1243535. In addition, chemical analyses at IIT Kanpur were conducted by N. 287
Rastogi and C.M. Shukla. We are also grateful for the efforts by the ASI Staff at the Taj Mahal. 288
Supporting information is associated with this paper and includes details related to filter and 289
marble surrogate surface sampling (S1), chemical analyses on both the filters and marble 290
surrogate surfaces (S2), as well as the approach to estimate perceived color based on surface 291
reflectance (S3). The information is available free of charge via the internet at 292
http://pubs.acs.org. 293
294
References 295
296
1. Sharma, P.K; Gupta, H.O., Dust pollution at the Taj Mahal-A case study, Proceedings of 297
RILEM/UNESCO Congress, Ed. M.J. Thiel 1993, pp. 11-18 298
Page 15 of 18
ACS Paragon Plus Environment
Environmental Science & Technology

15
2. B. B. Hicks, K. Manju, Marble discoloration at the Taj Mahal: A proposed explanation 299
1987, in ICOMOS 8th General Assembly and International Symposium. (Washington, D.C, 300
U.S.A.), pp. 325-332. 301
3. Prasad, A. K.; Singh, R. P.; Singh, A., Seasonal climatology of aerosol optical depth over 302
the Indian subcontinent: trend and departures in recent years. International Journal of Remote 303
Sensing 2006, 27, (12), 2323-2329. 304
4. Dey, S.; Di Girolamo, L.; van Donkelaar, A.; Tripathi, S. N.; Gupta, T.; Mohan, M., 305
Variability of outdoor fine particulate (PM2.5) concentration in the Indian Subcontinent: A 306
remote sensing approach. Remote Sensing of Environment 2012, 127, 153-161. 307
5. Massey, D. D.; Kulshrestha, A.; Taneja, A., Particulate matter concentrations and their 308
related metal toxicity in rural residential environment of semi-arid region of India. Atmospheric 309
Environment 2013, 67, 278-286. 310
6. Kulshrestha, A.; Satsangi, P. G.; Masih, J.; Taneja, A., Metal concentration of PM2.5 and 311
PM10 particles and seasonal variations in urban and rural environment of Agra, India. Science of 312
the Total Environment 2009, 407, (24), 6196-6204. 313
7. Satsangi, P. G.; Kulshrestha, A.; Taneja, A; Rao, P.S.P., Measurements of PM10 and PM2.5 314
aerosols in Agra, a semi-arid region of India, Indian Journal of Radio & Space Physics 40, 2011, 315
203-210. 316
8. Arola, A.; Schuster, G.; Myhre, G.; Kazadzis, S.; Dey, S.; Tripathi, S. N., Inferring 317
absorbing organic carbon content from AERONET data. Atmospheric Chemistry and Physics 318
2011, 11, (1), 215-225. 319
Page 16 of 18
ACS Paragon Plus Environment
Environmental Science & Technology

16
9. Ramanathan, V.; Chung, C.; Kim, D.; Bettge, T.; Buja, L.; Kiehl, J. T.; Washington, W. M.; 320
Fu, Q.; Sikka, D. R.; Wild, M., Atmospheric brown clouds: Impacts on South Asian climate and 321
hydrological cycle. Proceedings of the National Academy of Sciences of the United States of 322
America 2005, 102, (15), 5326-5333. 323
10. Schauer, J. J.; Rogge, W. F.; Hildemann, L. M.; Mazurek, M. A.; Cass, G. R.; Simoneit, B. 324
R. T., Source apportionment of airborne particulate matter using organic compounds as tracers. 325
Atmospheric Environment 1996, 30, (22), 3837-3855. 326
11. Bergin, M. H.; Greenwald, R.; Xu, J.; Berta, Y.; Chameides, W. L., Influence of aerosol 327
dry deposition on photosynthetically active radiation available to plants: A case study in the 328
Yangtze delta region of China. Geophysical Research Letters 2001, 28, (18), 3605-3608. 329
12. Ricchiazzi, P.; Yang, S. R.; Gautier, C.; Sowle, D., SBDART: A research and teaching 330
software tool for plane-parallell radiative transfer in the Earth's atmosphere. Bulletin of the 331
American Meteorological Society 1998, 79, (10), 2101-2114. 332
13. Carrico, C. M.; Bergin, M. H.; Xu, J.; Baumann, K.; Maring, H., Urban aerosol radiative 333
properties: Measurements during the 1999 Atlanta Supersite Experiment. Journal of Geophysical 334
Research-Atmospheres 2003, 108, (D7), 17. 335
14. D'Andrade, R. G.; Romney, A. K., A quantitative model for transforming reflectance 336
spectra into the Munsell color space using cone sensitivity functions and opponent process 337
weights. Proceedings of the National Academy of Sciences of the United States of America 2003, 338
100, (10), 6281-6286. 339
Page 17 of 18
ACS Paragon Plus Environment
Environmental Science & Technology

17
15. Slinn, W. G. N., Predictions for particle deposition to vegatiative Canopies. Atmospheric 340
Environment 1982, 16, (7), 1785-1794. 341
16. Liu, J.; Bergin, M.; Guo, H.; King, L.; Kotra, N.; Edgerton, E.; Weber, R. J., Size-resolved 342
measurements of brown carbon in water and methanol extracts and estimates of their 343
contribution to ambient fine-particle light absorption. Atmospheric Chemistry and Physics 2013, 344
13, (24), 12389-12404. 345
346
347
348
349
Page 18 of 18
ACS Paragon Plus Environment
Environmental Science & Technology