
Seasonal effect of dust deposition on a field of evacuated ...
16
0011-9164/09/$– See front matter © 2008 Elsevier B.V. All rights reserved Desalination 239 (2009) 66–81 Seasonal effect of dust deposition on a field of evacuated tube collectors on the performance of a solar desalination plant Ali M. El-Nashar 22 Ahmed Gharbo Street, Apt. #703, Zizinia, Alexandria, Egypt Tel. +20 (3) 584-0666; Mobile: +20 (12) 382-5263; email: [email protected] Received 1 April 2007; Accepted 10 March 2008 Abstract This paper reveals the results of a study aimed at identifying the seasonal influence of dust deposition on a large field of evacuated tube collectors associated with a multiple-effect distillation plant on the performance of the plant. The system is located near the city of Abu Dhabi, UAE, and the results are therefore relevant to this region. Seasonal dust measurements were made on the system and a mathematical model of the dust effect is incorporated within the SOLDES program, which predicts the performance of such systems, taking into consideration the prevailing dust influence and the frequency of collector cleaning. It was found that dust deposition has a strong seasonal effect on the plant performance with the strongest influence taking place during the summer months of June, July and August during which sand storms prevail in the plant location. It was found that dust deposition can cause a monthly drop in glass tube transmittance of 10–18%. The drop in transmittance of the glass tubes due to dust deposition can cause a large drop in plant production. For example, for a transmittance decrease from an initial value of 0.98 (clean glass condition) to a low value of 0.6, corresponding to a very dusty glass condition, production drops from 100% to 40% of the clean collector production level. The weekly cleaning frequency was found to result in the maximum annual water production for the particular location under consideration. It was found that dust deposition decreases the specific water production (m 3 of water per kJ of incident solar radiation) and increases the specific power consumption (kWh per m 3 water). Keywords: Dust effect; Solar desalination; Evacuated tube collectors; Performance degradation 1. Introduction Dust accumulation on the glazing of solar thermal collectors associated with distillation plants for seawater desalination is one of the main natural causes for performance degradation. This is particularly so for plants in operation in remote desert locations subject to sand storms where the air is laden with fine sand particles. Dust depo- sition on flat plate collectors has been studied by several authors, e.g., Goossens and Van doi:10.1016/j.desal.2008.03.007
Transcript of Seasonal effect of dust deposition on a field of evacuated ...

0011-9164/09/$– See front matter © 2008 Elsevier B.V. All rights reserved
Desalination 239 (2009) 66–81
Seasonal effect of dust deposition on a field of evacuated tubecollectors on the performance of a solar desalination plant
Ali M. El-Nashar22 Ahmed Gharbo Street, Apt. #703, Zizinia, Alexandria, Egypt
Tel. +20 (3) 584-0666; Mobile: +20 (12) 382-5263; email: [email protected]
Received 1 April 2007; Accepted 10 March 2008
Abstract
This paper reveals the results of a study aimed at identifying the seasonal influence of dust deposition on a largefield of evacuated tube collectors associated with a multiple-effect distillation plant on the performance of the plant.The system is located near the city of Abu Dhabi, UAE, and the results are therefore relevant to this region. Seasonaldust measurements were made on the system and a mathematical model of the dust effect is incorporated within theSOLDES program, which predicts the performance of such systems, taking into consideration the prevailing dustinfluence and the frequency of collector cleaning. It was found that dust deposition has a strong seasonal effect onthe plant performance with the strongest influence taking place during the summer months of June, July and Augustduring which sand storms prevail in the plant location. It was found that dust deposition can cause a monthly dropin glass tube transmittance of 10–18%. The drop in transmittance of the glass tubes due to dust deposition can causea large drop in plant production. For example, for a transmittance decrease from an initial value of 0.98 (clean glasscondition) to a low value of 0.6, corresponding to a very dusty glass condition, production drops from 100% to 40%of the clean collector production level. The weekly cleaning frequency was found to result in the maximum annualwater production for the particular location under consideration. It was found that dust deposition decreases thespecific water production (m3 of water per kJ of incident solar radiation) and increases the specific powerconsumption (kWh per m3 water).
Keywords: Dust effect; Solar desalination; Evacuated tube collectors; Performance degradation
1. Introduction
Dust accumulation on the glazing of solarthermal collectors associated with distillationplants for seawater desalination is one of the mainnatural causes for performance degradation. This
is particularly so for plants in operation in remotedesert locations subject to sand storms where theair is laden with fine sand particles. Dust depo-sition on flat plate collectors has been studiedby several authors, e.g., Goossens and Van
doi:10.1016/j.desal.2008.03.007

A.M. El-Nashar / Desalination 239 (2009) 66–81 67
Kerschaever [1], El-Shobokshy and Hussein [2],Sayigh et al. [3], Hegazy [4], Nimmo and Seid [5]and Garg [6]. El-Nashar [7] studied the influenceof dust deposition on the performance of evacu-ated tube collectors on a large field of collectorsand found that accumulated dust on this type ofcollector can result in a substantial reduction incollector efficiency. The effect of dust depositionon the transmittance of the glazing material wasalso studied by Mastekbayeva and Kumar [8] ata tropical climate condition and found that thetransmittance dropped from 87.9% to 75.8% overa period of 30 days. The airborne particles in theatmosphere were found to affect the amount andproperties of the radiation finally reaching thecollectors (see Al-Hassan [9]). Outdoor measure-ments on glazing transparency were performed byNahar and Gupta [10] and Bonvin [11]. Hegazy[4] studied dust accumulation on glass plates withdifferent tilt angles and measured the trans-mittance of the plates under different climaticconditions in Minia, Egypt, over a period of onemonth. The degradation in solar transmittanceduring this period was found to depend on the tiltangle of the glass plates with a maximum valuewhen the plate is in a horizontal position andminimum value when it is vertical. Measurementsmade by Sayigh et al. [3] of dust accumulation ona tilted glass plate located in Kuwait were foundto reduce the transmittance of the plate by anamount ranging from 64% to 17% for tilt anglesranging from 0 to 60E, respectively, after 38 daysof exposure to the environment.
Goossens and Van Kerschaever [1] carried outwind tunnel experiments to find the effect ofwind velocity and airborne dust concentration onthe drop of photovoltaic (PV) cell performancecaused by dust deposition on the cells. It wasfound that the deposition of fine dust particles onPV cells significantly affect the performance ofsuch cells.
The solar desalination plant situated in AbuDhabi, UAE, was used to study the effect of dustaccumulation on the performance of the plant.
This is a demonstration plant that is located onthe site of the Umm Al Nar cogeneration plant(about 20 km northeast of Abu Dhabi city) thatwent online in 1984 and is operated by theResearch Center of Abu Dhabi Water andElectricity Authority (ADWEA).
The aim of this study is to evaluate the effectof seasonal dust deposition on the solar collectorfield and the frequency of collector cleaning onthe performance of the solar desalination plant.
2. Solar desalination plant
A simplified schematic of the plant is shownin Fig. 1 and a photo is shown in Fig. 2. The plantconsists of a field of evacuated tube collectors, athermally stratified heat accumulator consistingof three tanks and a multiple-effect distillation(MED) unit for seawater desalination. The col-lector field consists of 1064 panels of evacuatedtube collectors, each having a selective absorberarea of 1.75 m2, thus making the total absorberarea 1862 m2. The collector field is divided into76 collector arrays each consists of 14 collectorpanels connected in series. The field is dividedinto six blocks named A, B, C, D, E, and F asshown in Fig. 3. All arrays in each block areconnected in parallel to the block inlet and outletheaders. A photo of a single collector panel isshown in Fig. 4 and its specifications are listed inTable 1.
The MED unit consists of 18 effects (arrangedin two vertical stacks) in which the seawater or itsbrine is made to boil under vacuum at differentboiling temperatures ranging from the highest atthe first effect (top effect) to the lowest at the18th effect (bottom effect). Preheated seawater issprayed on the outside surface of the first effectevaporator tube bundle in which hot water fromthe accumulator flows through the tubes. Part ofthe seawater is boiled off and the remaining brinecascades down to the following effects where it issprayed on the second tube bundles and vapor

A.M. El-Nashar / Desalination 239 (2009) 66–8168
Fig. 1. Schematic of the solar desalination plant in Abu Dhabi.
Fig. 2. Artist’s rendering of the solar desalination plant in Abu Dhabi.
generated in each effect by using the vaporgenerated in one effect as a heat source for thefollowing effect.
The plant was designed to operate in an auto-matic fashion where the heat collecting system
(consisting of the collector field, by-pass line andheat collecting pump) is controlled by a solarcontroller and the MED evaporator is controlledby the heat accumulator temperatures. The opera-tion of the heat collecting system depends on the

A.M. El-Nashar / Desalination 239 (2009) 66–81 69
Fig. 3. Schematic of the solar collector field of the solar desalination plant in Abu Dhabi.
Fig. 4. Photo of a single collector panel (Sanyo STC-BH250LB).
intensity of solar radiation as well as the tempera-ture of the accumulator tank. The operation of theevaporator depends on two temperatures mea-sured using RTDs and located at the medium-temperature and high-temperature accumulatortanks. These two RTDs are connected to setpointcontrollers which would allow the evaporator toinitiate its start-up sequence (when it was pre-
Table 1Specifications of a single collector panel
Item Specification
Selective coating Absorptivity 0.91Emissivity 0.12
Absorber area, m2 1.75 m2
External dimensions, mm 2860×985×115Net weight, kg 64Flow rate, L/h 700–1,800Max. operating pressure, bar 6
viously shut down automatically) when themedium temperature rises above the correspond-ing setpoint. When the water temperature in thehot water tank drops below the correspondingsetpoint value, the evaporator starts its shutdown

A.M. El-Nashar / Desalination 239 (2009) 66–8170
sequence and the evaporator will continue in thismode until the medium temperature rises abovethe corresponding setpoint.
Since the collector field represents the onlysource of thermal energy to the evaporator, thecondition of the collectors is expected to affectsubstantially the performance of the whole plant.The purpose of this paper is to find the effect ofdust deposition on the glazing of a commercialevacuated tube collector field on the performanceof an operating solar desalination plant thatutilizes this collector field to supply thermalenergy to a seawater distillation plant of the MEDtype.
3. Measurements and data acquisition system
3.1. Data acquisition system (DAS)
The main components of the data acquisitionsystem (DAS) are shown in Fig. 5. They consist
of two data loggers (Yokogawa Thermodac-32and Yokogawa Thermodac-3), one online PC(NEC model 8001mkII), one data analysis PC(NEC model 8801mkII), one control room printer(NEC-8023C) and one report generating printer(NEC-8023C). The Thermodac-32 data loggerhas the capacity of 32 input signals that can be acombination of 1–5 VDC signals, 4–20 mA sig-nals, and pulse signals. The Thermodac-3 has thecapacity of 20 input Pt100 resistance signals fromRTD probes. Every 15 min data are stored in thememory every hour; the four items of data col-lected during the previous hour are transferred tothe online computer via the RS 232C interface.The results of the mean value of the four datavalues are calculated and displayed every hour bythe online computer.
The DAS has the following functions:C Samples data at 15-min intervals.C Calculates hourly average values once per
hour
Fig. 5. Data acquisition system.

A.M. El-Nashar / Desalination 239 (2009) 66–81 71
C Records data on CD at even hours (i.e. 8:00,10:00, 12:00,…)
C Prints a summary report every 12 h.C Makes daily, weekly and monthly reports.
The following measurements were carried outduring plant operation:C Weather data (solar radiation, relative
humidity, ambient temperature and seawatertemperature)
C Collector water temperature at several loca-tions around the collector bank (inlet andoutlet to Block A, inlet and outlet to Block F,inlet and outlet to the whole collector bank).
C Heat accumulator water temperature at severallocations (water temperature at the bottom,middle and top of each of the three accumu-lator tanks).
C Vapor temperature at different effects of theMED unit (effects 1, 4, 7, 10,13, 16 and 18).
C Feedwater temperature at the entrance and exitof the preheater train.
C Heating water temperature at the inlet and exitof the heater (first effect) tube bundle.
C Flow rate measurements of heat collectingwater, heating water, feedwater, distilled(product) water, and condenser cooling water.
C Heat collected from Block A, Block F and thetotal collector bank (consisting of the sixblocks A, B, C, D, E, and F).
C Pump running hours (heat collecting pumpand product water pump).
C Electrical energy consumption of the wholeplant
3.2. Transmittance measurement
Dust deposition on the collector field isexpected to affect the transmittance of the evacu-ated glass tubes by reducing the intensity of solarradiation impinging on the absorber plates. Sinceit is difficult to measure the transmittance of theevacuated glass tubes of the actual collector field,sample glass tubes (un-evacuated) of identicalmaterial, diameter and wall thickness to the actual
glass tubes were used to measure the trans-mittance. The sample glass tubes are exposed tothe same weather condition as the collector fieldin the plant and they are also exposed to the samecleaning frequency as the collector field sincethey are cleaned whenever the collector field iscleaned. It was then assumed that the dustcondition on the sample tubes is almost identicalto that of the actual glass tubes.
Fig. 6 shows how transmittance of the sampleglass tube was measured using two solar sensors.Measurements were taken at 12:00 mid-dayduring sunny days with the solar sensors attachednear the ends of a support plate. The support plateis inserted inside a sample glass tube such thatone solar sensor is located about the middle of thesample glass tube while the other is outside thetube. The support plate is tilted at the same angleas that of the collector absorber plates. Thevoltage outputs of the two sensors are measuredsimultaneously using two identical milli-voltmeters which have been previously cali-brated. The corresponding solar radiation inten-sity on a tilted surface inside and outside the tubewas estimated and the transmittance was cal-culated using the equation:
2
1s
VC
V
where V1 is the voltage of the outside sensor, V2
is that of the inside sensor and Cs is a calibrationconstant.
Two sample glass tubes were used, one tosimulate the dust condition of each of collectorblocks A and F; they are referred to as sampletubes A and F, respectively. Block F was used asa reference clean block by exposing it to frequentcleanings to make sure that it remained alwaysclean. The frequency of cleaning of block A, onthe other hand, was varied according to therequirement of the test program. The two sampletubes are cleaned at exactly the same time theircorresponding collector blocks are cleaned. Thus,

A.M. El-Nashar / Desalination 239 (2009) 66–8172
Fig. 6. Measuring the transmittance of a sample glass tube.
whenever blocks A and F are cleaned, their corre-sponding sample tubes are also cleaned. Twoindividual test programs were conducted. In thefirst test program, block A (and sample tube A)was cleaned once per month at the first day ofmonth. In this program, the main objective was tofind the seasonal variation of monthly dustaccumulation of block A and the correspondingvariation in its heat collection performance. In thesecond program, the effect of long-term dustaccumulation on the performance of block A wasinvestigated by allowing this block to operate fora whole year without being cleaned. Each of thetest programs was carried out over a period of oneyear.
3.2. Cleaning of Blocks A and F
Collector blocks were cleaned from dustaccumulation by using part of the fresh waterproduced by the MED evaporator using a high-pressure water spray. The water spray was pro-duced by a positive displacement high-pressureplunger pump having a discharge pressure of50 atm and a flow rate of 18 L/min. It was mea-sured that the washing of each collector panel(absorber area of 1.75 m2) consumes about 6 L ofwater and takes about 20 s to clean. It wasestimated that about 6.4 m3 of water would be
needed to clean the whole collector field and thatwould take about 6 hours to do this job.
3.3. Heat collection measurement
Each of blocks A and F are provided with two,three-wire RTD probes for measuring the inletand outlet collector fluid temperatures and avortex flow meter (accuracy 1.0% plus 0.1% offull scale) for measuring the flow rate of collectorfluid through each block. These measurementswere carried out on a continuous basis during thedaytime when the heat collecting pump is inoperation. From these temperature measurements,the instantaneous values for the heat collectedfrom each block can be estimated. Integratingthese quantities over the daily operating period ofthe heat collecting pump would yield the dailyamount of heat collected by each block.
The RTD electrical resistance signals moni-tored by these two probes are converted into 1–5 V DC signals by resistance-to-voltage con-verters. These two voltage signals along with athird one representing the heat collecting waterflow rate were supplied to a programmable com-puting unit which measures the instantaneousheat collected by each of blocks A and F. Thesignals representing the heat collecting water inletand outlet temperatures as well as the instan-

A.M. El-Nashar / Desalination 239 (2009) 66–81 73
taneous heat collected are also supplied to a datalogger (Thermodac-32 Data Acquisition System,Eto Denki).
4. Dust model
The amount of dust accumulated on the glasstube depends on the season of the year. Summermonths are characterized by sand storms and lackof precipitation and dust can readily accumulateon the glass tubes during these months. Fig. 7shows the end-of-month transmittance for eachmonth when the glass tube is cleaned thoroughlyat the beginning of each month. At the beginningof the month, when the glass tube is clean,transmittance reaches an initial value of 0.98 andas the outside of the glass tube is allowed toaccumulate dust over a month, the transmittancegradually falls until it reaches its lowest value atthe end of the month. At this point the sampletube is cleaned again at the beginning of thefollowing month. As can be seen, the monthlydrop in transmittance varies from a low of 2% toa high of 16%. It varies from 2–4% during winter(November–April), with the lowest during themonth of January, and varies from 6–16% duringthe summer (May–August) with the maximumduring the month of July.
Based on the measured values of transmittanceover a period of one year, the monthly drop in thetransmittance of the glass tube can be correlatedto the month number (January =1, February =2,..)as follows:
(1)2m m m mA m B m C
where Δτm is the drop in transmittance of theglass tube during month m, Am, Bm, Cm areconstants for each month, m is the month number(for January, m =1; February, m =2, etc.). Thevalues of the monthly constants Am, Bm, Cm areevaluated from actual experimental data using theleast square technique.
Fig. 7. End-of-month transmittance of glass tube whenthe tube is cleaned at the first of each month and left toaccumulate dust throughout the month.
Fig. 8. Drop in transmittance during a typical month.
Fig. 8 shows how the transmittance varies fora typical month. It is a graph of the transmittanceof a glass tube versus the day number for atypical month. It assumes that the glass tube hasbeen cleaned on the first day of the month andagain after a period of N days has elapsed. Duringthe first day of the month (point 1), the trans-mittance has an initial value of 0.98. At the end ofthe period, the transmittance drops to point 2 dueto dust accumulation. After cleaning, the trans-mittance jumps to its initial value (point 3) andsubsequently drops to point 4 at the end of themonth. Referring to the total drop in transmit-tance for a typical month as A and the dropduring the period of N days as B (see figure), the

A.M. El-Nashar / Desalination 239 (2009) 66–8174
ratio (B/A) has been shown by Sayigh et al. [3] tofollow an exponential form:
(2)1 exp( )B
NA
where α is a constant that has a specific value foreach month. The transmittance after N days cantherefore be estimated by reference to Fig. 8 as:
(3)
0.98
0.98 1 exp( )
N B
A N
5. Results
Fig. 9 shows the monthly average daily solarradiation ratio and the monthly average dailyproduction ratio for clean collector glass tubes.This is a hypothetical situation in which thecollectors are assumed to be absolutely clean withno dust allowed to deposit on them. The monthlyaverage daily ratio is defined as the ratio betweenthe average daily value for a particular month ofthe year to the yearly average daily quantity. Itcan be seen that, as expected, the monthlyaverage distillate production follows the patternof daily solar radiation with the maximum dailyproduction occurring during the month of Junethat is characterized by the highest solar radiationintensity.
The effect of collector glass transmittance onthe plant annual production ratio (defined as theannual plant production with dusty collectorsdivided by the ideal annual production with cleancollectors) is shown in Fig. 10. The data plottedhere are the output of a number of runs of theSOLDES program using the specifications of theAbu Dhabi solar desalination plant. The data ofthe production ratio can be fitted to a polynomialof second degree using the least square technique:
(4)2max
1.523 3.937 1.402d
d
M
M
Fig. 9. Monthly average solar radiation ratio and pro-duction ratio with clean glass tubes — results of theSOLDES program.
Fig. 10. Effect of collector glass tube transmittance on theannual production ratio of the solar desalination plant(production ratio = production of dusty collectors/pro-duction of clean collectors) — results of the SOLDESprogram.
where Md is the annual distillate production whenthe collectors are dusty, is the plant annualmax
dMproduction when the collectors are absolutelyclean throughout the year, and τ is the glasstransmittance assumed constant throughout theyear. When the collectors are clean, their trans-mittance was measured at 0.98 and this corre-sponds to a production ratio of 1.0. As dustdeposits on the glass tubes, their transmittance isreduced, which results in a reduction in the solarintensity reaching the absorber plates of thecollectors. This in turn results in a reduction inthe amount of collected heat and a decline inplant production. If the collectors are not cleanedperiodically and dust is allowed to accumulate onthe glass tubes, the transmittance of the tubes can

A.M. El-Nashar / Desalination 239 (2009) 66–81 75
Fig. 11. Effect of collector glass tube transmittance on themonthly production ratio of the solar desalination plant(production ratio = production of dusty collectors/annualaverage production of clean collectors) — results of theSOLDES program.
reach as low as 0.6 and the plant production canbe diminished to about 40% of maximumproduction.
The effect of the transmittance on the monthlyaverage distillate production for clean glass tubes(τ = 0.98) and very dusty tubes (τ = 0.6) is shownin Fig. 11. This figure shows monthly values ofthe gross production ratio defined as the grossmonthly average daily production divided by theannual average daily production with clean glasstubes. As can be seen from this figure, a verydusty collector field with a transmittance of 0.6can result in a drastic drop in monthly plantproduction.
The specific water production, SWP, definedas the annual average plant water production perunit solar radiation impinging on a tilted surface,having a tilt angle as the collector absorber plate,liter/MJ, is an important plant performance cri-terion. It indicates how efficient the overallconversion process is from the solar radiationincident on the collector field to distilled waterproduced by the evaporator. Calculated on anannual basis, SWP can be expressed as:
(5)
365
1365
1
( )
( )
d ii
t i ci
MSWP
I A
where Md is the daily plant water production inL/day, It is the daily solar radiation on a tiltedsurface, MJ/day.m2 and Ac is the total absorberarea (m2) of the solar collector field. Fig. 12 is aplot of SWP versus the transmittance of the glasstubes and, as expected, SWP increases as theplant average transmittance increases due to thefact that with higher transmittance more thermalenergy is received by the accumulator whichleads to more distillate production for the sameamount of solar radiation. The figure shows theresults of a number of computer runs for differentvalues of collector transmittance ranging from 0.6(very dusty) to 1 (no dust at all). For the theo-retical case of “no dust” with τ = 1.0, the plantcould produce 2.7 L of water for one MJ ofincident solar radiation. As dust deposits on thecollector field with a consequent drop in trans-mittance, the specific water production decreasesalmost exponentially till it reaches 1.8 L/MJ(66.6% of “no dust” value) at a transmittance τ =0.6 (very dusty collectors).
Dust accumulation not only affects plantproduction but also affect its specific powerconsumption, SPC (kWh/m3 distillate). This isbecause as the plant production decreases due todust accumulation while the corresponding pump-ing power requirement decreases in the sameproportion as the production rate. Fig. 13 showshow the transmittance of the glass tubes affectsthe plant’s specific power consumption ratio. TheSPC ratio is defined as the value of SPC withdusty collectors divided by the correspondingSPC of clean collectors. As can be seen, a reduc-tion of transmittance due to dust deposition givesrise to a corresponding increase in the specificpower consumption. An increase of as much as45% in the specific power consumption can resultwhen the transmittance drops to 0.6 (very dustycollectors) as compared with the case of cleancollectors. Based on the results of many programruns, the plant specific power consumption ratiocan be correlated to the transmittance by theequation:

A.M. El-Nashar / Desalination 239 (2009) 66–8176
Fig. 12. Specific water production (L per MJ solar energy) for different plant transmittances — results of the SOLDESprogram.
Fig. 13. Effect of collector glass transmittance on specific power consumption of Abu Dhabi solar desalination plant —results results of the SOLDES program.
(6)20.1556 1.4096 2.2327o
SPC
SPC
where SPC is the (annual average) specific powerconsumption for dusty collectors and SPCo is the(annual average) specific power consumption ofclean collectors. The collector glass tube trans-mittance τ is assumed to be maintained constantthroughout the year.
Fig. 14 displays the effect of cleaning fre-quency on the monthly average specific powerconsumption, SPC, in kWh/m3 net distillate pro-duction. For the theoretical case of no dustdeposition, it can be seen that the specific powerconsumption assumes the minimum values since
the maximum production can be achieved in thiscase. As the cleaning frequency increases fromonce per month to daily cleaning, the specificpower consumption increases gradually.
To demonstrate the effect of cleaning fre-quency on plant production, several computerruns were made with daily, weekly and monthlycleanings carried out for one whole year. Theresults are shown in Fig. 15, which displays themonthly production ratio (monthly productionwith any cleaning frequency divided by thedesign capacity of evaporator) for each month ofthe year. It is to be noted that the daily productionvalues shown in this figure represent the netwater production which is estimated by sub-tracting the amount of cleaning water used from

A.M. El-Nashar / Desalination 239 (2009) 66–81 77
Fig. 14. Effect of collector cleaning frequency on the monthly average specific power consumption of Abu Dhabi solardesalination plant — results of the SOLDES program.
Fig. 15. Ratio of monthly average daily production ratio for different cleaning frequencies — results of the SOLDESprogram.
the total (gross) water production of the plant. Itcan be seen that the maximum monthly pro-duction ratio is achieved by a weekly cleaningregimen while a daily cleaning represents a wasteof water.
The collector field cleaning frequency affectsits monthly collection efficiency as shown inFig. 16. Daily cleaning results in the highestefficiency while monthly cleaning results in thelowest efficiency. This is expected because clean-ing the collectors on a daily basis insures thehighest possible glass transmittance that maxi-mizes the incident solar radiation on the absorber
plant whereas monthly cleaning results in dustdeposition and thus lowers transmittance.
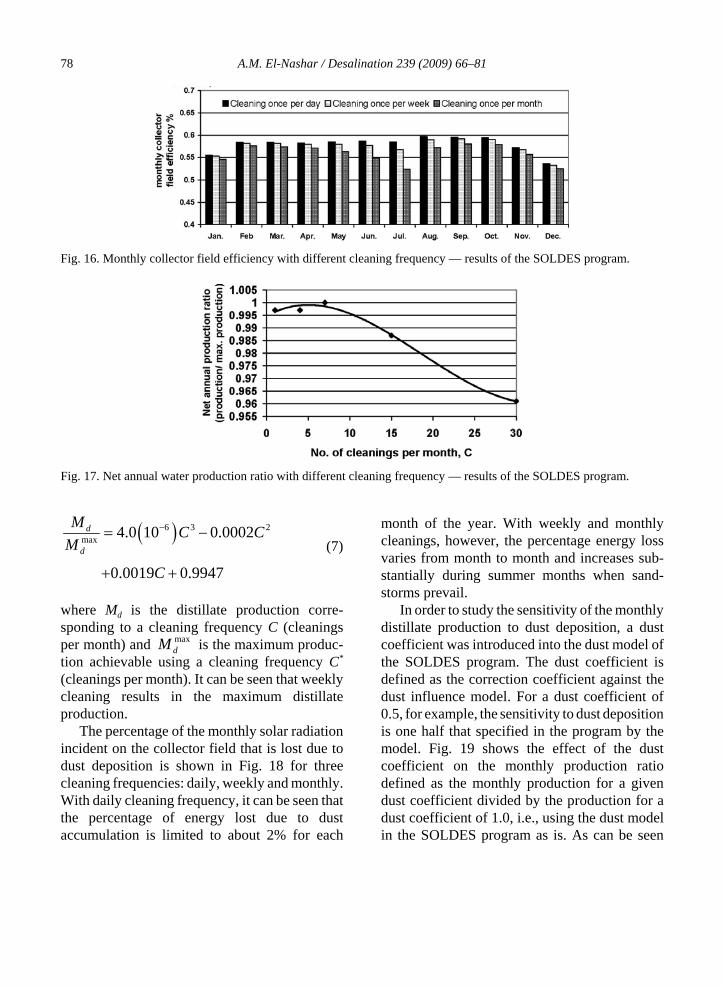
The effect of cleaning frequency on the netplant production ratio is shown in Fig. 17. Thenet production ratio is defined as the ratio of netannual production for any cleaning frequencydivided by the maximum annual productioncorresponding to the optimum cleaning fre-quency. Obviously, the higher the frequency ofcleaning the collector field, the larger the amountof water consumed in cleaning the collector field.The annual production ratio can be correlated tothe cleaning frequency by the equation:
A.M. El-Nashar / Desalination 239 (2009) 66–8178
Fig. 16. Monthly collector field efficiency with different cleaning frequency — results of the SOLDES program.
Fig. 17. Net annual water production ratio with different cleaning frequency — results of the SOLDES program.
(7) 6 3 2
max4.0 10 0.0002
0.0019 0.9947
d
d
MC C
M
C
where Md is the distillate production corre-sponding to a cleaning frequency C (cleaningsper month) and is the maximum produc-max
dMtion achievable using a cleaning frequency C*
(cleanings per month). It can be seen that weeklycleaning results in the maximum distillateproduction.
The percentage of the monthly solar radiationincident on the collector field that is lost due todust deposition is shown in Fig. 18 for threecleaning frequencies: daily, weekly and monthly.With daily cleaning frequency, it can be seen thatthe percentage of energy lost due to dustaccumulation is limited to about 2% for each
month of the year. With weekly and monthlycleanings, however, the percentage energy lossvaries from month to month and increases sub-stantially during summer months when sand-storms prevail.
In order to study the sensitivity of the monthlydistillate production to dust deposition, a dustcoefficient was introduced into the dust model ofthe SOLDES program. The dust coefficient isdefined as the correction coefficient against thedust influence model. For a dust coefficient of0.5, for example, the sensitivity to dust depositionis one half that specified in the program by themodel. Fig. 19 shows the effect of the dustcoefficient on the monthly production ratiodefined as the monthly production for a givendust coefficient divided by the production for adust coefficient of 1.0, i.e., using the dust modelin the SOLDES program as is. As can be seen

A.M. El-Nashar / Desalination 239 (2009) 66–81 79
Fig. 18. Monthly solar radiation lost due to dust deposition — results of the SOLDES program.
Fig. 19. Monthly production ratio for two dust coefficients — results of the SOLDES program.
from the figure, a 50% reduction in the dustmodel can result in a monthly increase of 2–4%in distillate production whereas a 50% increase inthe dust coefficient can cause a reduction in dis-tillate production ranging from 1–12%. Thereduction is highest during the summer monthswhere more sand deposition takes place.
6. Conclusions
The following conclusions can be drawn fromthis study:C The end-of-month transmittance drop was
found to vary between 2–4% during the wintermonths of November and December and 6–16% during the summer months (May–August).
C The transmittance of the glass tubes stronglyaffects plant production; for a transmittance of0.6 (very dusty collectors) the production candrop to 40% of the clean collector production.
C The weekly cleaning frequency was found toresult in the maximum water production forthe location in question (Abu Dhabi).
C The specific water production (water pro-duction per MJ of incident solar energy) forthe clean collector field can reach 2.7 L/MJ

A.M. El-Nashar / Desalination 239 (2009) 66–8180
solar energy but drops to 1.8 L/MJ for verydusty collectors with a transmittance of 0.6.
C The specific power consumption (electricalenergy consumption per unit of net water pro-duction) increases as the transmittance of theglass tubes decreases due to dust deposition.For very dusty tubes, transmittance of 0.6, thespecific power consumption increases by 45%due to the big drop in plant production.
7. Symbols
Ac — Total absorber area of collectorfield, m2
C — No. of cleanings per monthCs — Calibration factorIt — Daily solar radiation on a tilted sur-
face, kcal/d m2
m — Month numberMd — Distilled water production, m3/d or
m3/y— Plant annual production when col-max
dMlectors are absolutely clean through-out the year, m3/y
— Maximum production achievablemaxdM
using a cleaning frequency C*
(cleanings per month)MED — Multiple effect distillation plantN — Number of days after cleaningNm — Number of days in a month mQA — Heat added to accumulatorRTD — Resistance temperature detectorSPC — Specific power consumption, kWh/
m3 distillateSPCo — Annual average specific power con-
sumption of clean collectors, kWh/m3 distillate
SWP — Specific water production, L/MJV2 — Voltage of inside sensor, VV1 — Voltage of outside sensor, V
Greek
Δτ — Drop in transmittance
Δτm — Drop in transmittance during monthm
τ — Transmittance of collector glasstube
References
[1] D. Van Goossens and E. Kerschaever, Aeolian dustdeposition on photovoltaic solar cells: The effects ofwind velocity and airborne dust concentration on cellperformance. Solar Energy, 4 (1999) 277–289.
[2] M.S. El-Shobokshy and F.M. Hussein, Effect of thedust with different physical properties on the per-formance of photovoltaic cells. Solar Energy, 51(1993) 505.
[3] A.A.M. Sayigh, S. Al-Jandal and H. Ahmed, Dusteffect on solar flat surfaces devices in Kuwait, in: C.Furlan, N.A. Mancini, A.A.M. Sayigh and B.O.Seraphin, eds., Proc. Workshop on Physics of Non-Conventional Energy Sources and Materials Sciencefor Energy, ICTP, Triest, Italy. World Scientific,1985, pp. 353–367.
[4] A.A. Hegazy, Effect of dust accumulation on solartransmittance through glass covers of plate-typecollectors. Renewable Energy, 22 (2001) 525–540.
[5] B. Nimmo and S.A.M. Seid, Effect of dust on theperformance of thermal and photovoltaic flat platecollectors in Saudi Arabia: preliminary results, in:T.N. Veziroglu, ed., Proc. 2nd Miami InternationalConference Alternative Energy Sources, 1979,pp. 223–225.
[6] H.P. Garg, Effect of dirt on transparent covers in flat-plate solar energy collectors. Solar Energy, 15 (1974)299–302.
[7] A.M. El-Nashar, The effect of dust accumulation onthe performance of evacuated tube collectors. SolarEnergy, 53 (1994) 105–115.
[8] G.A. Mastekbayeva and S. Kumar, Effect of dust onthe transmittance of low density polyethylene glazingin tropical climate. Solar Energy, 68 (2000) 135–141.
[9] A.Y. Al-Hassan, A new correlation for direct beamsolar radiation received by photovoltaic panel withsand dust accumulated on its surface. Solar Energy,63 (1998) 323.
[10] N.M. Nahar and J.P. Gupta, Effect of dust on trans-mittance of glazing materials for solar collectors

A.M. El-Nashar / Desalination 239 (2009) 66–81 81
under arid zone condition of India. Solar WindTechnol., 7 (1990) 213, 237.
[11] J. Bonvin, Dirt deposit level measurements ondifferent glass type in various surroundings, in: Proc.
13th European Photovoltaic Solar Energy Conf., W.Freiesleben, W. Paltz, H.A. Ossenbrink and P. Helm,eds., Nice, France, 1995, pp. 740–742.