Participatory Scenario Development and Future Visioning in ...

Open Research OnlineThe Open University’s repository of research publicationsand other research outputs
Participatory visioning of indicator useConference or Workshop ItemHow to cite:
Bell, Simon and Morse, Stephen (2009). Participatory visioning of indicator use. In: 15th International SustainableDevelopment Research Conference, 5-7 Jul 2009, Utrecht, Netherlands.
For guidance on citations see FAQs.
c© 2009 The Authors
Version: Accepted Manuscript
Link(s) to article on publisher’s website:http://globalchallenge2009.geo.uu.nl/
Copyright and Moral Rights for the articles on this site are retained by the individual authors and/or other copyrightowners. For more information on Open Research Online’s data policy on reuse of materials please consult the policiespage.
oro.open.ac.uk

1
Title: “Participatory visioning of indicator use” Paper prepared for the 15
th International Sustainable Development Research Conference,
Utrecht, July 5th – 7
th.
Simon Bell1 and Stephen Morse
2
1 Bayswater Institute, London and Communication and Systems Department, Faculty of
Mathematics, Computing and Technology, Open University, Milton Keynes, UK
2 Department of Geography, School of Human and Environmental Sciences, University of
Reading, Reading, Berkshire UK Abstract This paper puts forward a new synthesis to stakeholder participation entitled ‘Tripe Task’. The approach is based on three tasks: a variety of the IMAGINE methodology as the primary task, an external analysis of group interactions arrived at by facilitators who are not within groups and a self-analysis by individuals within groups of themselves and their group interaction using the Symlog approach. The paper present some early findings of employing Triple Task as the basis of a series of participatory workshops run with potential ‘users’ of indicators/indices within the EU Framework 7 ‘Policy Use of Indicators’ (POINT) project. Indicators and indices are increasingly being promoted as tools to aid with the formulation and implementation of policy and the improvement of governance. The argument usually employed for this is that indicators and indices summarise complex sets of information and help ‘users’ make sense of what is happening in the ‘messy’ world in which they have taken responsibility. Results suggest that Triple Task may be valuable as the basis for a typology of group work and thus help elucidate why groups arrive at the visions they do with regard to sustainable development.
Key words: Triple Task, participation, indicators, use
Introduction Stakeholder participation within sustainable development has been accepted as not just desirable but a central requirement of any project. The rationale behind this is straightforward and is founded upon a number of assumptions. First that stakeholders have a fundamental right to be included in deliberations that will have an impact upon their lives and second that listening to the voice of stakeholders and including them within a process of change can help make that change better (Chambers 1992; Chambers 1997). The latter point assumes that if people feel that they are included as partners then they will have a heightened sense of wanting it to work, partly because they helped to envision what change is needed but also because they are involved as ‘change agents’ rather than having change imposed upon them (see for example Cook, 1995). In this sense, the change comes from the ‘inside out’, rather than being imposed from the ‘outside in’. Change is therefore a deeply held product of the community’s self-interest and self-promoting to that community. This type of change might be seen as being viable. But while ‘participation’ may be desirable there is a significant leap to be made between theory and practice. Just how are people to be included within a participatory process? This may seem like a straightforward question but there are many complex dimensions which are often overlooked. For example, take the following logical steps in sequence:
1. Who are the stakeholders of the process? In any one intended process of change the population which could be impacted upon could number thousands, if not millions, and may stretch well beyond the immediate ‘place’ where the activities are to be implemented. Within this population there may well be groupings of ‘like-minded’
2
individuals who share a common agenda, but it is a mistake to assume homogeneity within groups and there can be much diversity in perspective. Hence while the term ‘stakeholder’ is an all too convenient label the identification of those to be included is not as straightforward as it may sound.
2. How to represent stakeholders? If (1) can be achieved then how are the
stakeholders to be represented within the process? There is a need to identify representatives of groups given that it may not be possible to include everyone except in a very limited form (survey for example). But can all groups be included? What about groups that have internal division? Should sub-groups be included as well? Sociologists often refer to the myth of community - that we often assume homogeneity in order to make the process of participation easier – but such assumptions can be highly misleading. The answers to these questions will be driven by the inevitable constraints on time and resource, but that does not diminish their importance. For any given process of change which involves stakeholders there can be many perspectives depending upon who is – and who isn’t – included. This is well known, but there has been no research on how different groups of stakeholder can create the ‘many worlds’ of sustainable development; some no doubt more sustainable than others but still valid as a sustainable worldview nonetheless.
3. What is the ‘best’ form of participation? If (1) and (2) can be achieved in a way
which does provide fair (whatever that may mean) representation of stakeholders then the next question is the form which the process of participation should take? There are many different ways in which stakeholders can be included within a process, and there are many champions of each of these approaches espousing their relative advantages over competitors. Each approach does indeed have its own set of pros and cons, including resources required, and a review can be bewildering. Which one is ‘best’, if such an adjective can be employed in any meaningful sense, will depend upon context and the expertise of those attempting to facilitate the participation. Bad decisions over which approach to take, and indeed a poor implementation of what should be a viable approach, can greatly reduce and even eliminate the value of including stakeholders even if steps (1) and (2) have been done well.
This paper cannot hope to cover all of the questions raised in the logical chain described above. There are many reviews of stakeholder participation as well as an abundance of case studies. Instead we will explore the ‘many worlds’ of sustainable development that can be envisioned by different stakeholders (one of the points raised under step 2). The assumption is that separate groups can negotiate a shared understanding of sustainable development but that understanding will at least in part be driven by the composition and dynamics of the group. Different starting points of group composition and dynamics will yield ‘many worlds’ or multiple perspectives of sustainability in terms of what needs to be done and how change is to be recognized by the use of indicators. The central question we are asking is whether we can look for explanations of the ‘many worlds’ within the groups themselves? Are there facets of group characteristic and function which pre-dispose them towards specific types of worldview? The question we are asking is an important one in terms of both practice and theory. At one level the answers can help us understand (and even predict) why stakeholder groups do what they do. At another level the question challenges the assumption of sustainable development as a single endpoint but instead highlights the probability of there being many sustainable futures, each valid by any general definition of sustainability but different nonetheless. If ‘many worlds’ exist in sustainability then by what criteria should we judge any one of them to be ‘better’ than any other? Whose reality or whose vision should count? In itself this is a complex question given the many dimensions of sustainability which span the environmental, social and economic spheres, and may not have an answer in any normative sense. At root we are attempting to define the rules behind the grammar for the narrative of sustainable development.

3
Triple-Task: a new method of analytical participation The research described in this paper took place in two participatory workshops, one in Malta and one in Slovakia, during March 2009. Each workshop took 2 days with one day set aside for interviews with those that took part. The work was funded by the EU under is Framework 7 programme, and was one workpackage of a larger project entitled POINT – Policy Use of Indicators (contract no 217207). The process employed in the workshops has been called ‘Triple Task’ by us and is a hybrid extension of a number of other approaches and builds on the psychodynamic work of Bridger (Bridger 2007). The 3 components of ‘Triple Task’ are: Task 1. A variant on the IMAGINE methodology described by us in Bell and Morse (2008) and which in turn is a manifestation of the ‘Systemic Sustainability Analysis’ (SSA) theory also put forward by us in Bell and Morse (2003) and an extension of ‘Soft Systems’ analysis developed by Checkland and others (for example see: Checkland, 1981). Task 1 seeks to encourage participants to arrive at a shared understanding of ‘what is’ and ‘what can be done’ in any context. In the project summarized here the aim was to arrive at a shared understanding of the use of indicators in sustainable development, but the same process could be applied in any context. Task 1 involves a 7-step process and a brief summary of the steps is provided as follows: 1. Rich Picture mapping All participants involved in drawing a RP of their
combined experience of the use of indicators to-date
2. Tasks and Issues Participants draw out major issues or problems with their combined use of indicators. Also things that might be done to improve the situation
3. Systems of Challenges Participants put together tasks and issues in four or five Systems of Challenges and provide them with catchy titles to indicate their main meaning.
4. Defining transformation Identifying what is required to address the challenges set out in step 3?
5. Vision of Change What is the vision of change the group would like to see?
6. Scenarios for the future Who needs to do What and When in order to achieve the vision of change.
7. Review and reflect A self and group analysis of the groups progress (See Task 3 below).
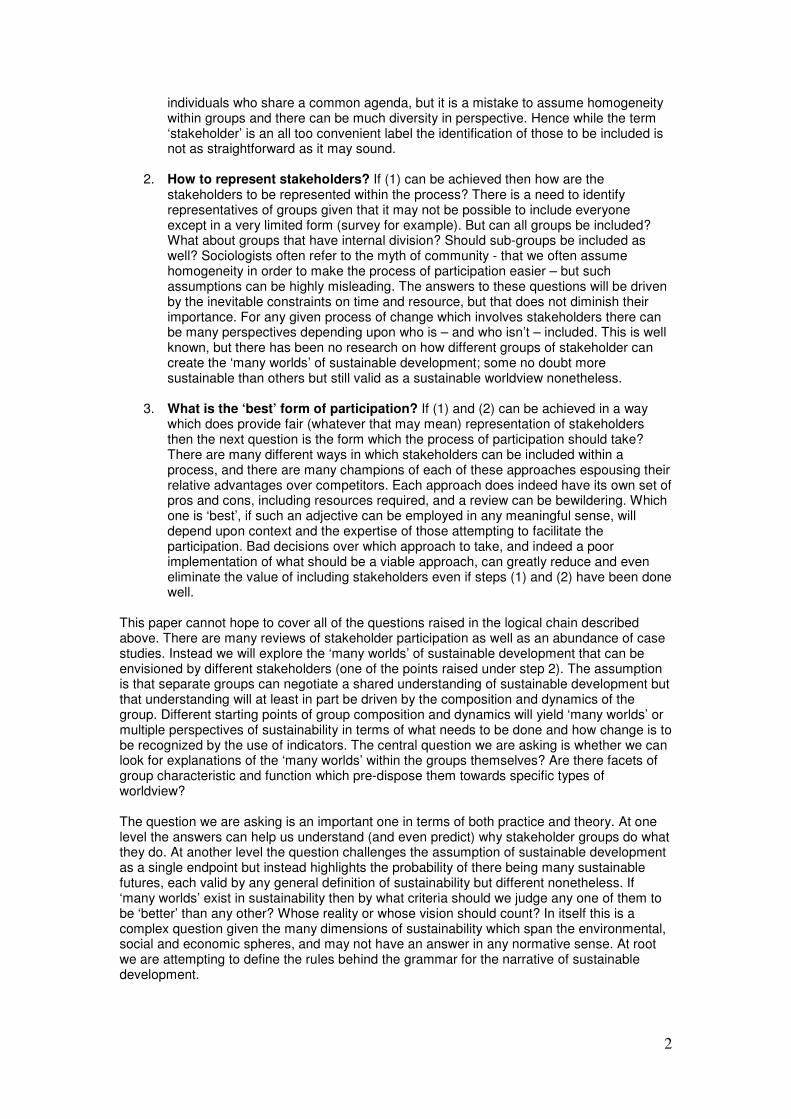
Task 2. An external analysis of group interactions arrived at by facilitators who are not within groups. This is a reflective review of the manner in which the group(s) work using Action Learning Cycle (including the Being, Engaging, Contextualising and Managing or BECM matrix (as shown in use in: Bell 2008). The criteria employed in the BECM assessment are shown in Table 1. There are 7 rows with each row representing a scale from ‘positive’ group behavior (score 1) to ‘negative’ (score 7). The columns list the criteria which can be employed to place groups within respective rows. Even though criteria are set out this is nonetheless a subjective assessment based upon observation of group interactions. Therefore at the end of the workshop some of the participants were interviewed regarding their experiences within their group. Questions asked included:
o How did you find the workshop process? o What, if any, were your main insights from the workshop? o What did you learn?
4
o Do you agree with one, some or all of the issues raised by your group in the workshop?
Questions along these lines helped with confirming (or not) the researchers placement of the group within the BECM matrix. Table 1.
Task 3. A self-analysis by individuals within groups of themselves and their group interaction using the Symlog approach. Symlog has a history going back to 1979 when it was first introduced by Bales and Cohen and has since grown to become a popular approach to the analysis of group work and has been applied in a wide variety of contexts. For more details of the theory and application of Symlog please see Park (1985), Nowack (1987), Keyton and Wall (1989), Eisle (2003) and Blumberg (2006). Examples of application within a variety of contexts can be found in Wall and Galanes (1986), Hurley (1991), Lion and Gruenfeld (1993) and Brown and Miller (2000). The SYMLOG questionnaire has the structure shown in Table 2. For a group of individuals the answers to the questionnaire generate a table and the results are mapped onto a ‘field diagram’ and interpreted. In the ‘Triple Task’ process the Symlog questions at the individual and group level help to generate the categories within the BECM matrix. For example, in Table 3 all the rows of the BECM matrix are addressed alongside the SYMLOG questionnaire.

5
The result of putting these 3 tasks together is a triangulation including a group process along with an analysis as to why groups may have arrived at the outputs they did. Thus it is possible to derive explanatory factors behind the visions, in this case of indicator use in sustainable development, created by the groups. To date most participatory approaches have only dealt with Task 1 – the arrival at the shared understanding without a formal analysis as to how the groups managed to arrive at that understanding.

6
Findings of Triple-Task
Five groups underwent the ‘Triple Task’; two from Malta (groups A and B) and three from Slovakia (groups C, D and E). Five groups is a relatively small sample but even so can provide some indication as to whether ‘Triple Task’ delivers in terms of its promised analytical power. Thus the reader should see these results as indicative rather than being in any way conclusive.
In a paper as short as this it is not possible to go into the detailed outputs from Task 1 and for our purposes we wish to concentrate more on an analysis of the ‘Triple Task’ theory and methodology rather than the findings with regard to indicator use. Table 4 provides a summary of key points from the five groups over their respective days using three ‘waypoints’ in the 7-stage process. The three waypoints that have been selected are: Rich Picture mapping (stage 1), identification of challenges (stage 3) and possible futures (stage 7). Table 4 provides some notes as to how each of the groups is performing at that stage along with some hints as to the issues they identified as important with regard to indicator use. As can be seen the five groups had quite different stories to tell, even if there are also clear overlaps between them. Some issues regarding indicator use emerge fairly consistently across groups such as the need for education in sustainable development, dilemmas of data availability (and quality) and the dominance of economic indicators, but there are other insights as well.
Table 4.
The BECM analysis (Task 2) generated some interesting perspectives although it has to be remembered that BECM is assessing group behavior and not outputs. These are summarized as Figure 1. The figure makes use of a software package called YourScope designed to allow modeling of the sustainability of a community of any kind. In essence the smaller the size of each segment of the YourScope diagram then the closer the group is to a BECM score of 1 which indicates the most reflective functioning by the group. The segments of the charts are different time periods during the workshops. Groups A and E showed particular dysfunction over periods of their respective workshops as evidenced by the arms of the YourScope diagram extending towards the outer margin, while Groups B, C and D had better BECM results suggesting that the groups worked together. The BECM analysis was probed further

7
during interviews at the end of the workshops with participants of the groups and the findings were broadly confirmed. For example the following are some comments from participants illustrating the influence that individuals can have – both negative in terms of fragmentation and positive:
“Yesterday I thought we might go nowhere .. so I took over. It worked. ‘X’ has strong issues .. he is very good. But he can be very dominating. So, he had less influence on the second day.” Group A respondent “ it was really good to have “Y” in our group. Was he planted? It is good to have someone who can direct people. We saved lots of time. He managed our time very well.” Group B respondent
The Symlog results (Task 3) are shown as Figure 2. Given limitations of space the results presented here relate to only 8 of the SYMLOG questionnaires – questions 10 to 17. The diagrams describe the average responses to these questions for each group, but the 8 vectors in the diagram (F, PF, P, PB, B, NB, N, NF) imply different things about the group. High averages along the P, PF, F and PB axes are ‘positive’, implying the group is working well, while high scores along the B, NB, N and NF axes is ‘negative’, implying problems with group behavior. In Figure 2 it can be seen that in the Malta workshop Group A had a more ‘negative’ tendency, especially in Day 2, relative to Group B. The centre of gravity of the shape for Group A is more to the left of the axes that is that of Group B. In the Slovakia workshop there is also a shift in feeling from Day 1 to Day 2. In both days Group E appears to have the best appraisal of itself, with a strong presence in the positive vectors. Group C changed from having a relatively positive view of itself in Day 1 to a much less positive position in Day 2. Group D was consistent over the 2 days, albeit slightly more positive in Day 2.

8
The BECM and SYMLOG analyses can be plotted against each other and that result is shown as Figure 3 (only Day 2 of SYMLOG is used here). While there does seem to be something of a consensus between BECM and SYMLOG (highlighted by the grey shading) there is nonetheless some discontinuity between the 2 perspectives and that shouldn’t be surprising. It is possible for an external viewer to give a group a high BECM score (implying dysfunction) while the group itself has a much more positive opinion of its own working. This is especially apparent with Group E where the BECM score is towards the negative end of the scale yet the SYMLOG analysis suggests that the group was comfortable with itself and thought it was working well. While Group E was dominated by an individual with a great deal of expertise in this field the other members of the group were quite willing to accept this and regarded it as an advantage. For example, here is a quotation from one of the members of Group E.
“The work was very interesting. I felt very well. It was good to relax and then proceed to the goal. In group E the work was good. Good cooperation within the group. My voice was heard in the group. “Z” was the dominant person in the group. Also “V” and “U”. But it was not so dominant. They did not stop people from discussing. All suggestions were put to “Z” and he chose from the suggestions.” Group E respondent

9
Indeed it is not difficult to imagine Figure 3 as the basis for a typology of groups following Task 1 with groups potentially being located anywhere within this 2-dimensional space.
How do these results from BECM and Symlog help explain what the groups produced in terms of their analysis of the use of indicators in Sustainable Development? If the placement in Figure 3 is related to Table 4 it can be seen that there are associations. Groups B and D produced some holistic, focused and logical progressions with their analyses and these two groups did well in terms of BECM and Symlog. Group A, by way of contrast, generated a fractured story which had some points of interest but also somewhat vague in its analysis and this group also did not do so well with regard to both BECM and Symlog. Thus there is a picture here of good group coherence resulting in holistic and focused interpretations and the opposite is also true. But there are also discontinuities. Group E, for example, produced some fascinating and coherent outputs yet was dominated by one individual. In that case the Symlog result is better correlated with the output than is BECM. Task 1 of Group C was well off the mark in terms of what they were asked to do, but the group did work reasonably well together from the perspective of an outsider even if the group itself was more critical of its performance. Thus there are many possible linkages between group dynamics and what emerged from Task 1, and again it would be interesting to develop a typology once more results are available.
Discussion
The results presented here have been based on just 2 out of a total of 7 planned workshops to take place in 2009. The two workshops involved a total of 5 groups and this should rise to 20 plus by the time the fieldwork is complete thus providing a much stronger population for Figure 3 and the confidence in any typology which might emerge. Thus it has to be stressed that the findings reported here are preliminary and our intention has been more to present the theory of ‘Triple Task’ and what it could potentially deliver.

10
The findings from these 5 groups do suggest that it is possible for their visions to be correlated with a combination of external and internal assessment of their mode of deliberation. Signs of fracture within Task 1 did reflect difficulties the group may have had in terms of working together, while more coherent and focused stories tend to emerge from groups that have worked well. This may be an expected outcome but there are signs of a much more complex story. One of the groups (Group E) had problems from the perspective of outsiders (as assessed via BECM) yet members were comfortable with these (as assessed via Symlog and confirmed during interviews) and the group went on to generate visions which while dominated by relatively few voices all members were happy to ‘own’. Another group (Group C) seemed to outsiders to be working well together yet created a Task 1 story that was very narrow (in terms of what they had included) and off the mark in terms of what they were asked to do. While BECM suggested a good degree of functioning Group C were more critical of themselves and acknowledged that they had taken a narrow perspective. One can easily imagine many different associations between group interaction/function and what emerges out of Task 1, including the possibility that apparent fracture and disharmony could generate some of the richer stories. This may take us in many interesting directions. One early musing relates our findings to the philosophy of Koestler (Koestler, 1989). In this work Koestler was seeking the origins for and the conditionality required for creativity. His deliberations took him into a variety of areas: laughter and sagacity, visual creation and habitual states, art and science. Early in his book he states the central tenant of his thesis:
“I have coined the term bisociation in order to make a distinction between the routine skills of thinking on a single ‘plane’ as it were, and the creative act, which, as I shall try to show, always operates on more than one plane. The former may be called single minded, the latter double-minded, transitory state of unstable equilibrium where the balance of both emotions and thought is disturbed.”
(Koestler,1989: 35 – 36).
For Koestler creativity and originality arise from the bisociate mind; the mind where opposite or contradictory planes coincide. An interesting observation for this paper is that it may be that the most interesting and dynamic acts of sustainable creativity come from the most divided and contradictory groups. This in turn may have implications for the way in which we appreciate and encourage/discourage the contradictory nature.
We believe that ‘Triple Task’ provides something entirely new to the field of stakeholder participation within sustainable development. It’s not just a means by which we can engage stakeholders (Task 1) in a systemic but practical sense but also adds entirely new dimensions founded upon how we can analyse that participation and what worldviews and multiple perspectives groups can create out of the ‘many worlds’ that are possible in a sustainable future. The approach thus inculcates a sense of ‘participation-plus’; not just including stakeholders but listening and trying to understand why they are saying what they are saying and thus looking for deeper resonances. ‘Triple Task’ could help us develop a valuable typology of the working of stakeholder groups and how this relates to their envisioning of sustainability. In this sense we are seeking to elucidate the rules for meaningful participation in the writing of the narrative of our times. That would be a valuable asset.
What ‘Triple Task’ doesn’t do, of course, is make any valued judgment about whether any vision of sustainability is better than any other. All the groups that took part in the workshop generated interesting insights – some more than others perhaps – but even so there were many insights as to the limitations of indicator use. However, while it is possible to identify stories that had a greater coherence and richness relative to others that does not necessarily make them any ‘better’ in a normative sense. This is, of course, an important and recurring issue in the broader context of sustainable development. Much of the contestation that takes place tends to revolve around conflict over which vision(s) for the future is best, and this in turn often comes down to which vision is best for whom? The term sustainability is simply not defined in anything like enough detail to significantly narrow down the range of worldviews that it can theoretically encompass, and arguably it should not be defined in this way. After all, the world is a diverse place. Triple Task would not seek to work with any one normative

11
definition or hold any up as being ‘better’ but instead embraces diversity of worldview and tries to understand the rules which produce and orientate it.
Acknowledgements
We would like to thank the EU for funding the work of the POINT (Policy Use of Indicators) Project under its Framework 7 programme (contract number contract no 217207). We would also like to thank Dr Louis Cassar, Ms Elizabeth Conrad, Dr Zuzanna Valkovcova and Dr Daniela Babicova for their help and support in the running of the workshops in Malta and Slovakia.
References:
BELL, S. (2008) Systemic Approaches to Managing Across the Gap in the Public Sector: Results of an action research programme. Systemic Practice and Action Research 21(3), 227 - 240.
BELL, S. & MORSE, S. (2003) Measuring Sustainability: Learning from doing. London. Earthscan.
BELL, S. & MORSE, S. (2008) Sustainability Indicators: Measuring the immeasurable. London, Earthscan.
BALES, R. F. & COHEN, S. P. (1979) SYMLOG: A system for the multiple level observation of groups. New York: Free Press.
BLUMBERG, H. H. (2006) A Simplified Version of the SYMLOG (R) Trait Rating Form. Psychological Reports 99(1), 46 - 50.
BROWN, T. M. & MILLER, C. E. (2000) Communication Networks in Task Performing Groups. Effects of Complexity, Time Pressure and Interpersonal Dominance. Small Group Research 31(2), 131 - 157.
BRIDGER, H. (2007),. The Consultant and the Consulting Process. London. The Bayswater Institute.
CHAMBERS, R. (1992) Rural Appraisal: rapid, relaxed and participatory. Brighton, Institute of Development Studies.
CHAMBERS, R. (1997) Whose Reality Counts? Putting the first last. London, Intermediate Technology Publications.
CHECKLAND, P. (1981) Systems Thinking, Systems Practice. Chichester. Wiley.
COOK, J. (1995),. Empowering People for Sustainable Development. From: ‘Managing Sustainable Development in South Africa. Fitzgeral, P., McLennan, A. and Munslow, B. (Eds.). Cape Town. Oxford University Press.
EISLE, P. (2003) Groups, group members and individual decision processes: The effects of decision strategy, social interaction style and reception of decision-threatening information on post-decision processes. Scandinavian Journal of Psychology 44(5), 467 - 477.

12
HURLEY, J. R. (1991) Self-Acceptance, Acceptance of Others, and SYMLOG: Equivalent measures of the two central interpersonal dimensions? Journal of Clinical Psychology 47(4), 576 - 582.
KEYTON, J. & WALL, V. D. J. (1989) Symlog. Theory and Method of Measuring Group and Organisational Communication. Management Communication Quarterly 2(4), 544 - 567.
KOESTLER, A. (1989) The Act of Creation. London, Penguin.
LION, C. L. & GRUENFELD, L. W. (1993) The Behaviour and Personality of Work Group and Basic Assumption Group Members. Small Group Research 24(2), 236 - 257.
NOWACK, W. (1987) SYMLOG as an instrument of internal and external perspective taking - construct-validation and temporal change. International Journal of Small Group Research 3(2), 180 - 197.
PARK, J. H. (1985) SYMLOG as a method of a team diagnosis of soccer teams. International Journal of Sports Psychology 16(4), 331 - 332.
WALL, V. D. J. & GALANES, G. J. (1986) The SYMLOG Dimensions and Small Group Conflict. Central States Speech Journal 37(2), 61 - 78.