Participatory Scenario Building Workshop Report
71
WISE UP to Climate Participatory Scenario Building Workshop Report “Learning from the Future: Alternative Scenarios for Adaptive Basin Management of Natural and Built Infrastructure Mix under Chaining Climate” Tana River Basin Nairobi 16 th – 18 th November 2015, Nairobi
Transcript of Participatory Scenario Building Workshop Report

WISE UP to Climate
ParticipatoryScenarioBuildingWorkshopReport“LearningfromtheFuture:AlternativeScenariosforAdaptiveBasinManagementofNaturalandBuiltInfrastructureMixunderChaining
Climate”
TanaRiverBasin
Nairobi 16th – 18th November 2015, Nairobi

ParticipatoryScenarioWorkshopReport-ACCESS
i
Executive Summary WISE-UP to climate’ is a project that demonstrates natural infrastructure as a‘nature-basedsolution’forclimatechangeadaptationandsustainabledevelopment.ThisreportpresentsasummaryoftheproceedingsofthestakeholderParticipatoryScenariosworkshop on theWISE-UP to Climate project that took place in NairobiKenyafrom17thto19thNovember2015.TheworkshopwashostedbytheAfricanCollaborative Center for Earth System Sciences (ACCESS) and attended bystakeholder groupsworking the Tana River basin. Theworkshop served both as acapacitybuildingandatechnicalprojectimplementationactivitywherepartnersandWISE-UPusersweremeanttogainskillsonanticipatoryplanningwhileexpandingarangeoffuturebasinwaterinfrastructurealternatives.The overall aim of the scenario-building workshop was to develop skills andcompetencies among participants in the design and use of basin scenarios bystakeholders to inform decision-making and planning for alternative future waterinfrastructure options under changing climate scenarios. The workshop wasparticipatoryandhands-onintegrating lessons,availabledataandtrajectoriesfromother work-packages as inputs into qualitative and quantitative storylines. Basinmanagement tipping points (infrastructural mix) were used to set thresholds forsensitivity analysis and design/practice/behavior/investment/decision/policy trade-offsbasedonlessonsfromemergingfutures.Themaincontent/elementsoftheworkshopwere:
S ContributionofScenarioDevelopmentProcesstoWISE-UPProject
S SettingthesceneandScopingforParticipatoryScenarioBuildingS UnderstandingnaturalandBuilt-infrastructuremixandecosystemservicesapproach
tobasinwatersystemsmanagement
S TheBasinContextS DefiningaCommonVisionforthebasin
S FutureimagesintermsofselecteddriversofecosystemschangeinTannaBasin
S FramingandCharacterizingtheScenarios
S ElaboratingScenariosandSequencingNewDevelopments
S PlausibleFutureTrendsinSelectedDriversandEcosystemsServicesOutcomes
S SequencingofNatura;Infrastructuredevelopments
S StrategyforScenarioCommunicationS Theworkshoptechnicalsessionswereconcludedbyagroupactivitytodevelopa
The workshop was concluded by closing remarks from facilitators, participants’representationandACCESSteam.Theworkshopwasevaluatedusingbothformative(continuous–dailyandbysession)aswellassummative(finallastdayevaluation.Avarietyofparticipatorytoolswereusedtoassesschangeinparticipant’sknowledgebase and received their feedback on key workshop technical and operationalprocesses.

ParticipatoryScenarioWorkshopReport-ACCESS
ii
ParticipatoryScenarioWorkshopparticipants

ParticipatoryScenarioWorkshopReport-ACCESS
iii
Table of Content EXECUTIVESUMMARY......................................................................................................................ITABLEOFCONTENT.........................................................................................................................IIILISTOFABBREVIATIONSANDACRONYMS.......................................................................................IVABOUTWISE-UPTOCLIMATE...........................................................................................................V
PROJECTSUMMARY‘.................................................................................................................................VPROJECTCOMPONENTS.............................................................................................................................V
INTRODUCTION................................................................................................................................1BACKGROUNDTOTHEPARTICIPATORYSCENARIOSWORKSHOP..........................................................................1WORKSHOPAIMSANDOBJECTIVES...............................................................................................................1
AimofWorkshop............................................................................................................................1ExpectedOutcomes.........................................................................................................................1
GENERALAPPROACHTOTHEWORKSHOP.......................................................................................................2CONTRIBUTIONOFWORKSHOPTOWISE-UPTOCLIMATEIMPLEMENTATION......................................................2
SUMMARYOFDAILYPROCEEDINGS.................................................................................................4DAY1:SETTINGTHESCENEANDSCOPINGFORPARTICIPATORYSCENARIOBUILDING..............................................4
WelcomeandOfficialOpening.......................................................................................................4UnderstandingnaturalandBuilt-infrastructuremixandecosystemservicesapproachtobasinwatersystemsmanagement...........................................................................................................5TheBasinContext...........................................................................................................................6CommonVisionforthebasin..........................................................................................................7
DAY2:CHARACTERIZINGTHESCENARIOS...................................................................................................11TanaBasinStakeholderImpressions:WaterInfrastructureforClimateChangeAdaptation.......12ScenarioDevelopmentProcess.....................................................................................................14ScenarioFraming..........................................................................................................................14PlottingoftheCriticalUncertainty...............................................................................................15TheTanaBasinScenarioCriticalUncertaintiesand4Futures......................................................16
SCENARIODEFINITIONEXERCISE................................................................................................................18DAY3:ELABORATINGSCENARIOSANDSEQUENCINGNEWDEVELOPMENTS.......................................................21COMMUNICATIONNEEDS.........................................................................................................................31STAKEHOLDERCONCLUDINGREMARKS.......................................................................................................38
WORKSHOPEVALUATION..............................................................................................................38ANNEXES........................................................................................................................................39
ANNEX1:WORKSHOPAGENDA................................................................................................................39ANNEX2:LISTOFPARTICIPANTS...............................................................................................................41ANNEX3:PRESENTATIONSLIDES...............................................................................................................42
Annex3a:ObjectivesandWorkshopContext...............................................................................42Annex3b:InternationalPolicyonClimateChangeAdaptationandMainstreamingAdaptationinDevelopmentPlanning..................................................................................................................43Annex3c:UnderstandingNaturalandBuild-infrastructuremixandecosystemsservicesapproach.......................................................................................................................................46Annex3d:EcosystemsServiceValuation......................................................................................49Annex3e:TanaTEEBpresentation...............................................................................................56Annex3f:SequencingofinfrastructureintheTanabasin............................................................61
ANNEX4:WORKSHOPEVALUATIONFORM..................................................................................................63

ParticipatoryScenarioWorkshopReport-ACCESS
iv
List of Abbreviations and Acronyms ACCESS - AfricanCollaborativeCenterforEarthSystemScienceBC3 - BasqueCentreforClimateChangeCASELAP - CentreforAdvancedStudiesinEnvironmentalLaw&PolicyCBO - CommunityBasedorganizationCC - ClimateChangeCCA - ClimateChangeandAdaptationCDA - CoastDevelopmentAuthorityCEC - CountyExecutiveCommitteeCGIAR - ConsultativeGroupofInternationalAgriculturalResearchCIAT - InternationalCentreforTropicalAgricultureCIDP - CountyIntegratedDevelopmentPlanES - EcosystemsServicesHGF - HighGrandFallsICPAC - IGADClimatePredictionsandApplicationsCentreIEA - IntegratedEnvironmentalAssessmentIUCN - InternationalUnionfortheConservationofNatureIWMI - InternationalWaterManagementInstituteIWRM - IntegratedWaterResourcesManagementKALRO - KenyaAgricultureandLivestockResearchOrganizationKENGEN - KenyaElectricityGeneratingCompanyKEWI - KenyaWaterInstituteKIPPRA - KenyaInstituteforPublicPolicyResearchandAnalysisKMD - KenyaMeteorologyDepartmentKVDA - KerioValleydevelopmentAuthorityLBDA - LakeBasinDevelopmentAuthorityNCF - NordicClimateFundNDMA - NationalDroughtManagementAuthorityNEMA - NationalEnvironmentManagementAuthorityNGO - Non-GovernmentalOrganizationNIB - NationalIrrigationBoardODI - OverseasDevelopmentInstitutesPDNK - PastoralistDevelopmentNetworkofKenyaPPG - PastoralistsParliamentaryGroupRDA - RegionalDevelopmentAuthoritiesSCMP - Sub-CatchmentManagementPlanSDG - SustainableDevelopmentGoalsSLM - SustainableLandManagementTARDA - TanaandAthiRiverDevelopmentAuthorityTARDA - TanaRiverDevelopmentAuthorityTEEB - TheEconomicsofEcosystemsandBiodiversityUoM - UniversityofManchesterUoN - UniversityofNairobiWASREB - WaterServicesRegulatoryBoardWISE-UP toClimate
- WaterInfrastructureSolutionsfromEcosystemServicesUnderpinningClimateResilientPoliciesandProgrammes
WRI-CSIR - WaterResourcesInstitute–CenterforScientificandIndustrialResearchWRMA - WaterResourcesManagementAuthorityWRUA - WaterResourceUsersAssociation

ParticipatoryScenarioWorkshopReport-ACCESS
v
About Wise-Up to Climate Project Summary‘ WISE-UP to climate’ is a project that demonstrates natural infrastructure as a‘nature-basedsolution’forclimatechangeadaptationandsustainabledevelopment.The project will develop knowledge on how to use combinations of built waterinfrastructure (e.g. dams, levees, irrigation channels) together with naturalinfrastructure(e.g.wetlands,floodplains,watersheds)forpovertyreduction,water-energy-foodsecurity,biodiversityconservation,andclimateresilience.WISE-UPwilldemonstrate the advantages of combined built and natural infrastructureapproaches using dialogue with decision-makers to agree acceptable trade-offs.WISE-UPwillrunoverafour-yearperiodand linkecosystemservicesmoredirectlyintowaterinfrastructuredevelopmentintheTana(Kenya)andVolta(Ghana-BurkinaFaso)riverbasins.Project Components ProjectCoordination–ledbyIUCN&Basinleads–ACCESSintheTanaBasin(Kenya)/ Water Research Institute (WRI-CSIR) in the Volta Basin (Ghana/Burkina Faso),workingwiththeVoltaBasinAuthority
S Ecosystem infrastructure investment analysis – led by IWMI, BC3 andUniversityofManchester
o Eco-hydrological functions of infrastructure in the context ofsustainableadaptation(IWMI)
o Economicvaluationandbenefitsofnaturalinfrastructure(BC3)o System impact modelling and trade-off analysis (University of
Manchester)S Politicaleconomyofwaterinfrastructuredecisionsandgovernance–ledby
ODIS Actionlearningwithstakeholderstostrengthenapplicationsofevidenceand
tools inpolicymaking, infrastructuredecisionsandconsensusbuilding– ledbyIUCN
S CapacityBuilding&Communicationsforintegratingbuiltandnaturalwaterinfrastructure and sharing results – led by ACCESS/CSIR/IUCN

ParticipatoryScenarioWorkshopReport-ACCESS
1
Introduction ThisreportpresentsasummaryoftheproceedingsofthestakeholderParticipatoryScenariosworkshop on theWISE-UP to Climate project that took place in NairobiKenyafrom17thto19thNovember2015.TheworkshopwashostedbytheAfricanCollaborative Center for Earth System Sciences (ACCESS) and attended bystakeholdergroupsworkingtheTanaRiverbasin.Background to the Participatory Scenarios Workshop
• Anaction–orientedscenariosbuildingworkshopplannedforNovember2015inTanabasinbasedonemergingdataandlessonsdrawnfromtheWISE-UPtoClimateprojectimplementation.
• Intheworkshop,participantsexploretheessentialsofsharedvisionplanning,basin developmental trajectories, scenario development (business as usual,worst case and best case scenarios) and propose best practices forinfrastructureoptimizationunderchangingclimateandothersocio-economicandecologicaldrivers.
• This workshop addresses the need for climate compatible developmentwithinthebasin.
• The workshop aims to make research resonate with policymakers/stakeholderswhoaretheconsumersoftheprojectoutputsandthuswillprovideaplatformtogatherinformationonpossiblefuturesandpresentideas/perceptionsofclimate
The workshop served both as a capacity building and a technical projectimplementationactivitywherepartnersandWISE-UPusersweremeanttogainskillson anticipatory planning while expanding a range of future basin waterinfrastructure alternatives. The workshop was premised on the basic assumptionthat scenarios are not predictions or linear projections but rather a coherentdescriptionofhowthefutureofthebasinmightunfold.Withthistheparticipantsexplored the plausible, not just the probable basin futures and challenged users(decision makers, policy makers, experts) from stakeholder organizations to thinkbeyondemergingtrajectoriesanddesignwateruseoptionsundermutuallyexclusive“worlds”thattakeintoaccountuncertaintyofmajordriversofecosystemschange.Workshop aims and objectives Aim of Workshop The overall aim of the scenario-building workshop was to develop skills andcompetencies among participants in the design and use of basin scenarios bystakeholdersto informdecision-makingandplanningforalternativefuturewaterinfrastructureoptionsunderchangingclimate.Expected Outcomes It was expected that after effectively participating in the workshop, participantsshouldbeableto:

ParticipatoryScenarioWorkshopReport-ACCESS
2
1. Explain basic concepts and principles for scenario development for basinwaterinfrastructuremanagement;
2. Applydifferentapproachesandtoolsforscenariogeneration;and3. Use participatory scenario development relevant protocols to engage
stakeholders in joint ecosystems services and basin infrastructuraldevelopmentplanninganddecision-making.
4. Influence decision making/policy using information and lessons fromalternative futures exploration on basin infrastructuremix, investment anddecisionoutcomes
5. Make informed decisions on basin level water infrastructure planning andaction
The workshop was designed to prepare participants to embark on a scenariodevelopment process of their own that supports basin/sub-basin/organizationalecosystemserviceassessmentandinformsdecision-making.Participantslearnthowtodevelopscenarios forbasinwater infrastructureplanningandoverallecosystemservice assessment, including challenges and skills relating to resource and tooldecisions, framing, stakeholder engagement, and designing and interpretingscenarioswithfield-testedscenariodevelopmenttoolsandapproaches.General approach to the workshop Theworkshopwaspurelyparticipatoryandhands-on.Lessons,dataandtrajectoriesfrom other work-packages were used as input into qualitative and quantitativestorylines. Basinmanagement tippingpoints (infrastructuralmix)wereused to setthresholds for sensitivity analysis anddesign/practice/behavior/investment/decision/policy trade-offs based on lessonsfromemergingfutures.Acombinationofpresentations,discussion,games,andhands-onactivitiestobuildknowledge and skills related to scoping, framing, stakeholder engagement, anddesigningand interpretingmap-basedscenarioswillbeadopted.An intuitive logicsapproach was adopted to cover the overall scenario building process of scoping,assessingdrivers,generatingqualitativeandquantitativestorylinesandperformingsensitivityanalysiswithdifferentbasin futures focusingon infrastructuralportfoliomix.
Contribution of Workshop to WISE-UP to Climate Implementation ThetopicsandprocessoftheworkshopwereintentionallydesignedtocontributetoimplementationofWISE-UPtoClimateprojectasindicatedinthetablebelow.

ParticipatoryScenarioWorkshopReport-ACCESS
3
Table1:ContributionofScenarioDevelopmentProcesstoWISE-UPProjectParticipatoryScenarioWorkshopComponent
GeneralUse InputfromOtherWorkPackages
OutputsforuseinOtherWorkPackages
Settingthescene
AwarenesscreationamongstakeholderswithintheWISE-UPproject(projectscope,progressandemergingresults)UnderstandingNaturalandBuild-infrastructuremixandecosystemsservicesapproachtobasinwatersystemsmanagement
Currentresultsandstatusofwork-packagesincludingpossiblefutureusebystakeholdersoftheresults
Ideasandissuestobeexploredinstakeholderworkshopsandactionlearningevents
IntroductiontoScenarios:Understandinggoals,scopingandreviewingdriversofchange
Capacityforscenario
DialogueoutputfromActionLearning/StakeholderforumsOutputsofdataandinnovativetoolsPoliticaleconomyresults
Furthercapacitybuildingneedsfortradeanalysis/co-benefitdecisionsDecisionparameters,performancemetricsandassumptionstoexploreinfurthermodelingandESvaluation
Scenarioexplorationprocess
DeepeningcommonunderstandingandinteractionbetweenDriversofEcosystemsChange
Landusechangeprojections(conceptandpotentialapplicationsinanticipatorybasinplanning)Outputfromactionlearningeventsandpoliticaleconomystudy
ThecriticaluncertaintiesforfurtherquantitativescenariomodelingThescenarioFrameworktobeusedforboundaryanalysisinmodelsIssuestoexploreinfutureactionlearning/stakeholderforums
Sequencingofbuiltinfrastructure
Time-phasingofphysicalperturbations
Socio-economictrendsandinvestmentsESvaluesforcomparisonofdifferentinvestmentsClimatecompatibledevelopmentintheTanabasin
Optionsfortrade-offsforuseinfutureworkshopsofbenefitsharingandtradeoffanalysisParametersformodelsensitivityanalysisandrefineofquantitativetrendsunderdifferentscenarios
Scenarioapplicationandfutureuse
CommunicationanddisseminationRaisingprofileofWISE-UPprojectTechnicalandpopulationpublicationsProjectexitstrategy
ProjectmanagementlessonsIssues/challengesforprojectintegrationandstakeholderengagementemanatingfromactionlearningmeetingsandpartnerinteractions
Inputintoworkpackagesforfinaldata,tools,resultrefinementStrategytoholdsimilarworkshopinVolta

ParticipatoryScenarioWorkshopReport-ACCESS
4
Summary of Daily Proceedings Day 1: Setting the scene and Scoping for Participatory Scenario Building Welcome and Official Opening Dr.BellOkello,thefacilitator,openedtheworkshopbywelcomingtheparticipantsto the workshop and led them in introducing themselves. Following theintroductions,Dr.OkellorequestedMs.OmuombofromACCESStogiveheropeningremarks.Ms. Omuombo recognized and appreciated the presence of all the stakeholderspresent at thismeeting that have been able to support the project from time totime.ShegaveapologiesfromProf.EricOdadawhowasnotpresentatthemeetingdue to the other commitments in New York for a global meeting on SustainableDevelopment Goals (SDG) where water has now been accepted as a stand-aloneagenda.She recognized the participation of the various stakeholders present in the roomwhohaveattendedseveraloftheprojecteventsandwasgladthattheirinstitutionsarewillingtoengagewiththeprojectatdifferentcapacitiesincludingtheprovisionofthedatathatisinformingtheproject.ShereiteratedthattheWISEUPtoClimateprojectwill continually engage the stakeholders andpointed to the importanceoftheparticipatoryscenariosworkshop,aforumtodialogueonissuesintheTanaandelaboration of shared vision for the basin as a means of exploring the possiblefutures alongside climate change. The workshop was designed to foster climatecompatibledevelopmentsonthebackdropofthefactthatclimatechangeis intheforefrontofglobaldiscussionsincludingtheupcomingCOP21.ShenotedthatKenyahasmainstreamed climate change in theNationalWaterMaster Plan. Sustainablelandmanagement,IWRM,droughts,watersecurityandclimateadaptationarealsobeing considered for integration in the current framework of basin management.Shecalledupontheparticipantstotakenoteoftheseandotherdevelopmentsevenas the workshop develops the participatory scenarios over the 3-day period. Sheacknowledged the many challenges within the basin and further thanked thestakeholderspresentforsparingsometimeofftheirbusyschedulestocometothisimportantmeetingthatwillinformtheprojectresultsmovingforwardandhelptheproject adjust or deliver useable results including building capacity of basinstakeholder to use emerging information, tools and knowledge for basininfrastructuredecisionmakingandpractice.Ms.Omuombo, invitedthekeynotespeakerProf.DanielOlago,Professorof in theDepartmentofGeologyandInstituteforClimateChangeandAdaptation,UniversityofNairobiandoneof theDirectorsofACCESS togivehiskeynotepresentationon“Internationalpolicyonclimatechangeadaptationandmainstreamingadaptationindevelopmentplanning”.Inhisaddress,Prof.Olagomadethefollowingkeypoints:

ParticipatoryScenarioWorkshopReport-ACCESS
5
S Climate change is inevitable with the current analysis displaying regionalimpacts of the estimated magnitude of change. There is a possibility ofdisastrous impacts of the anticipated change that would require reliablemonitoring technological options. With the anticipated change, there arelimits to sustainable development that would require monitoring andcollaboration between scientists, institutions and civil society to effectivelycommunicateresultsandfindings.
S His presentation highlighted the impacts of climate change on agriculture,forestry, natural terrestrial ecosystems, water resources, freshwaterfisheries,humansettlementsandhumanhealth.
S He noted the current state of the science of assessment is in its infancy,limited in scope, narrow in terms of discipline and seldom considersadaptation. These issues can be remedies by through assembling relevantinventories, integratedmonitoring toquantify sensitivities,multidisciplinaryimpactresearchprogrammesandnationalandregionalaction.
S In mainstreaming adaptation, there is need to bring climate changeadaptation to the forefront of the national policy agenda and mobilizepolitical goodwill. Climate change adaptationneeds to be integrated in thenational and sub-national (county/regional levels) development strategiesand plans. He further emphasized the need to create fiscal and policyincentives to increase climate financing for equitable climate changeadaptation.
S There is need to improve institutional capacities for the formulation andimplementation of laws, and this can be well done through participatoryapproachesthusenablingtheeliminationofbarriersthatlimitpoor’saccessandeconomicbenefitsofclimatechange.
S He concluded that the governments and NGO’S need to work together inassessingthelocaladaptationneeds,environmentalgovernanceandcapacitydevelopment, have local delivery platforms, support local and indigenousSMEsandcommunitybasedadaptationtoclimatechangeinitiatives.
Understanding natural and Built-infrastructure mix and ecosystem services approach to basin water systems management
• Ms. Omuombo shared a brief of theWISE UP project and focused on theecosystemsasbeinginfrastructurewithinawatermanagementsystem.
• From the presentation it was apparent that the project is looking at basinwide management that looks at multiple objects that would meet theeconomicdevelopmentaswellasfostersustainablenaturalresourcesthatinthiscaseare important infrastructures insatisfyinghumanneedswithinthebasin.
• She highlighted some of the expected outcomes ofWISE UP as being thedevelopment of built and natural infrastructure investment portfolios; thesharing of knowledge and tools that meet the needs of the stakeholderswithin the basin; the improvement of the capacities of the stakeholders inaccessing and applying evidence generated by the project thus ensuringthereisadaptivecapacity.

ParticipatoryScenarioWorkshopReport-ACCESS
6
The Basin Context Inorder to lay the foundation for theTanabasin scenarios, a discussionandbriefpresentations were made/facilitated on prevailing situation with respect tostakeholder portfolio, WISE-UP project agenda, basin ecosystems services andemergingtrendsthatmightinfluencethebasinwaterinfrastructureandecosystemsservicetrajectories.
S Stakeholderportfolio:Differentagencies/stakeholdersareworkingonseveralinitiatives in the basin. These including state and non-state actors.Representatives from some of the organizations present at the workshopmade presentations, namely: KENGEN, TARDA, CDA, County Governments.The presentations covered organizations goals and mandate, currentactivities, information and data holdings on ecosystems services andwaterinfrastructures, need for WISE-UP tools/knowledge base and how theparticipatoryscenariosoutcomeswillenhancetheirwork.
S VideocliponWISE-UPproject:DWvideoaboutWISE-UPprojectshowingDr.LydiaOlakainteractingwithsomeofthestakeholdersintheTanabasin.
S Emergingtrends:AdiscussionwasheldontheemergingtrendsinTanabasinsocio-economic and biophysical processes with implication on waterinfrastructure designs and ecosystems services. The trends reflected thefollowing:
§ Climatechangeandvariability
§ Industrialization
§ Resilienceofecosystems
§ Social–culturalmilieu
§ Basinmanagementincludingdownstream-midstream-upstreamrelations
§ Hydropowerenergy
§ Policydevelopment,implementationandtracking
§ Energy(demandforhydropowerelectricity)
§ Landusechange
§ Populationanddemographyincludingsettlementsandmovements
§ Governance(nationalandcountylevel)
§ Basinbiophysicalprocesses(erosion,flooding,hydrology)Thesessionconcludedthatthereisageneraltrendincomplicationswithrespecttobasin water resources management due the need to balance various ecosystemsservices as key drivers like climate change, land use change, energy requirementsdemandincreasingintegrationofwatergovernance,naturalinfrastructureandbuiltinfrastructure mix as well as conflict between benefits especially agriculture vspastoralism.There isneed forapproaches, toolsanddata tosupport integratedaswellasforwardlookingassessmentsandmanagement.

ParticipatoryScenarioWorkshopReport-ACCESS
7
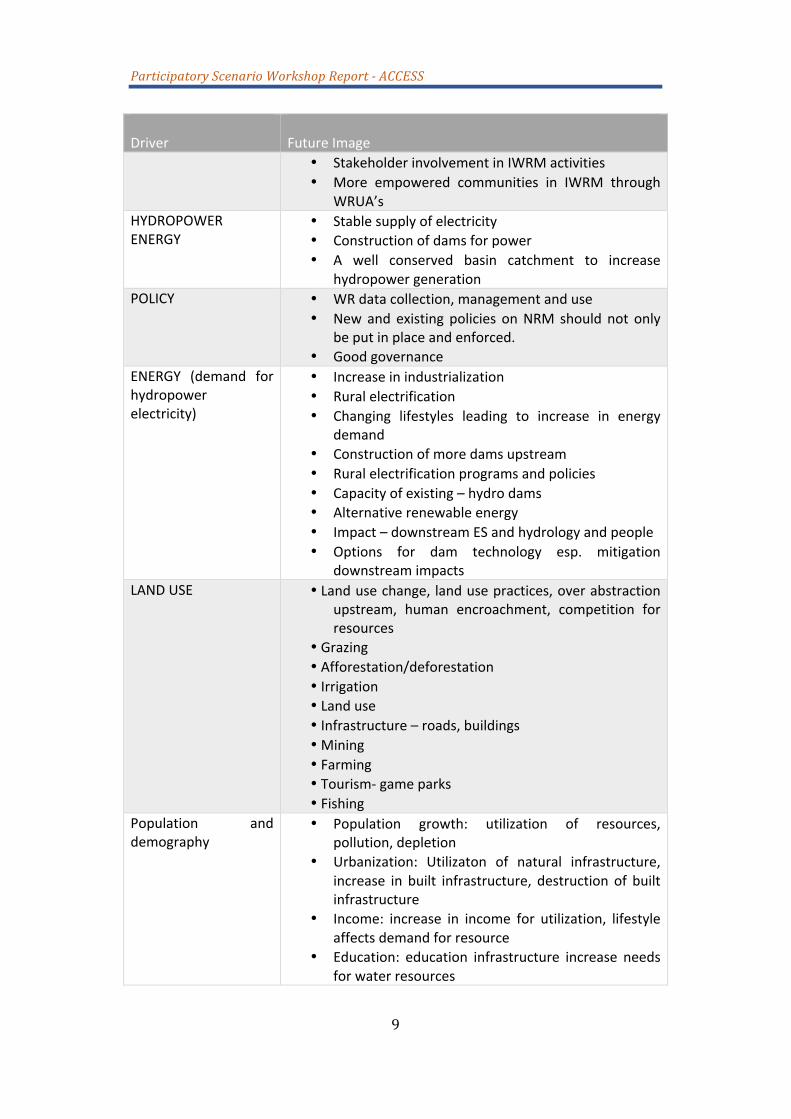
Common Vision for the basin Theparticipantsdiscussed ingroups,thefuture imageofthebasinunderspecifieddriversofchange.Theresultswerepresentedoncardsandaresummarized inthetablebelow.
Table 2: Future images in terms of selected drivers of ecosystems change in Tana Basin Driver
FutureImage
CLIMATECHANGE • WellfunctioningES• Bridging the gap in terms of climate change
knowledge between technocrats and the laymenthiscouldalsoincludesimplifyingthejargons
• Adaptation and adoption of copingmechanisms inaddressingWRissuesinrelationtoCCA
INDUSTRIALIZATION • IndustrializedeconomyRESILIENTECOSYSTEM • Adequatefood
• Nowaste• Continuousflowofwateralltheyearround• Resilienteconomy• Resilientwetlandecosystems• Resilientecosystems/Aconservedenvironment• Awatersecuredbasin• Benefitsharingamongwaterusers

ParticipatoryScenarioWorkshopReport-ACCESS
8
Driver
FutureImage
• Recognition of ecosystems and biodiversity values(includingintrinsicvalues)
SOCIALSPACE • Mutualrespectoflivelihoods• Afoodsecuredcommunity• Aninformedcommunitymakinginformeddecisions
and choices thereby enhancing their resilience toclimatechangeandmanageresourcessustainably
• Stopconflictsalongthebelts• Goodqualitywaterforeveryone• Gender mainstreaming in the development od
policies and plans as well as budgetary process(womenare impactedmostbyclimatechangeduetotheirsocietalroles)
• Effective and efficientwater allocation to differentintendeduses
• Healthypeople• MinimalWateruseconflicts• Cleanwater• Consultativesociety• Easyaccesstowater• 1stratetransportinfrastructure
BASINMANAGEMENT • Collaboration among all the stakeholders in themanagement of the basin/stronger partnershipbetween institutionsdealingwith themanagementof thebasin thereby complementingeachother asopposedtocompetingwitheachother
• Regulationofriverflowthroughdamconstruction• Conserving vegetation cover –upstreamandalong
theriver• A policy in place on land management within the
basin(integratedlandusepolicy)• Protectionofassetsandlives(disasterriskreduction
incasesoffloodsanddroughts)• Abasinthatprovidessomewatertoalluserswithin
thebasineverytime/everywhere• A well managed conserved basin to provide
adequatewaterforirrigation• A basin with improved vegetation cover (forested
basin)• A basin with more consultative management
approach/efficientwateruse• Activemulti-stakeholderdialoguesandforums• Wellcatchmentmanagementofprotection
ParticipatoryScenarioWorkshopReport-ACCESS
9
Driver
FutureImage
• StakeholderinvolvementinIWRMactivities• More empowered communities in IWRM through
WRUA’sHYDROPOWERENERGY
• Stablesupplyofelectricity• Constructionofdamsforpower• A well conserved basin catchment to increase
hydropowergenerationPOLICY • WRdatacollection,managementanduse
• Newand existing policies onNRM should not onlybeputinplaceandenforced.
• GoodgovernanceENERGY (demand forhydropowerelectricity)
• Increaseinindustrialization• Ruralelectrification• Changing lifestyles leading to increase in energy
demand• Constructionofmoredamsupstream• Ruralelectrificationprogramsandpolicies• Capacityofexisting–hydrodams• Alternativerenewableenergy• Impact–downstreamESandhydrologyandpeople• Options for dam technology esp. mitigation
downstreamimpactsLANDUSE • Landusechange, landusepractices,overabstraction
upstream, human encroachment, competition forresources
• Grazing• Afforestation/deforestation• Irrigation• Landuse• Infrastructure–roads,buildings• Mining• Farming• Tourism-gameparks• Fishing
Population anddemography
• Population growth: utilization of resources,pollution,depletion
• Urbanization: Utilizaton of natural infrastructure,increase in built infrastructure, destruction of builtinfrastructure
• Income: increase in income for utilization, lifestyleaffectsdemandforresource
• Education: education infrastructure increase needsforwaterresources

ParticipatoryScenarioWorkshopReport-ACCESS
10
Driver
FutureImage
• Change in diet – tubers to water intensive cropsthusneedforirrigation
Socialchange • Urbanization, externalities, lack of education,povertylevel,educationandawareness,lackof
• Urbanization: increased demand for water, waterquality,catchmentreduction
• Culturalissues:conflicts,competition• Tourism:forestpreservation• Education:Awareness,soilandwaterconservation• Politicalwill:politicalregime,policyframework
Industrialization • Growth in industrialization, technology andtechnological advancements, research anddevelopment
• WRpollution,• OverabstractionofG/W• Obstructionofnaturalwaterinfrastructure• Waterpolitics(trans-basintransfers)• Highdensitypopulationinurbanareas.• Wateruseconflicts• Environmentaldegradation.
Agriculture: • Demand for water intensive foods, conflictingpolicies
• Overstocking• Pooragriculturalpractices• Increaseindemandforagriculturalproduceleading
todegradation• Overfishing• Irrigation
Climatechange • Elementsofclimatechangeandvariability-landuse• Resourcesconflict• Riseinsealevels• Relativeimportanceofclimatechangevariability• Floods• Rainfallpatterns• Changeinvegetation• Recurrentdroughts• Evictionofwildlife• Increaseintemperature–globalwarming
Governance • Geopolitics, hydropolitics, laws and policies,governance
• Genderinclusivity• Prioritization of catchment conservation
programmesbycentralgovernment

ParticipatoryScenarioWorkshopReport-ACCESS
11
Driver
FutureImage
• Poorlegislationandenforcement• Lackofawarenessatlocallevels• Devolution–differentplansandpolicies• Inequitabledistributionofwaterresources• Institutionalframeworks• Hydropolitics• Corruption: misappropriation, water permits
licenses,charcoalpermits Day 2: Characterizing the Scenarios Dr.LucyEmertononbehalfofBC3researchteammadeapresentationonvaluingofecosystemservices.Shepointedout theecosystemserviceshave in thepastbeenundervaluedyet theycountasnatural infrastructureasaneconomicpartofwaterinfrastructure thatneed tobe factors inwaterplanningand investmentdecisions.Her presentation highlighted some of thework carried out in Cameroon, Uganda,Malawi and in the Kenya where ecosystem services valuation has been used todemonstrate to donors and government the options that may be profitable inplanning and management of water resources. She further concluded herpresentation with the mention of the ongoing WISE-UP work that looks atestablishingeconomic linkagesacrossthe landscapeonasmallersubcatchment intheKimakiainUpperTana.Dr. Richard Mulwa from the University of Nairobi, CASELAP highlighted theeconomics of ecosystems and biodiversity (TEEB) project in the Tana River. Thepresentation highlighted the TEEB framework, the impact of drivers on ecosystemservice provision with emphasis on dose response functions of flood recessionfarming,pastoralism,healthandfishcatch.Hefurtherpresentedsomeoftheworkthathasbeencarriedoutinvaluationofthemangroveecosystemswhereextensivewascarriedoutinquantifyingtheeconomicvalues.QuestionandAnswersessionQuestion
Answer
Emmanuel – How sensitive are the ESgoods and services are due to the riverlevel?
It’s possible but what was done wasstatic optimization but to achieve this,dynamic optimization needs to done todetectthissensitivity.
Future changing conditions that mightchangetherelationshipsinthebasin.CCimpacts within the basin? Land use inrelationtostreamflows?
OneoftheindirectdriversintheTEEBisCCbut the impactofCC itselfwillaffecttheflows.
Issues of uncertainty – uncertaintyanalysis a range of values instead of a
Assumption that the value gotten wasrepresentative of the population.

ParticipatoryScenarioWorkshopReport-ACCESS
12
single value. How certain is the onenumber?
Changesinpricemarginscanpresenttherange.
Tana Basin Stakeholder Impressions: Water Infrastructure for Climate Change Adaptation TARDApresentationbyEng.PeterMuliTARDAiscurrentlyundertheministryofEnvironmentandisresponsiblefor138,000sqkmtotaldevelopmentareawithintheTanaandAthibasins.Thecurrentflagshipprojectundervision2030istheHGFdamthatcoverstheTharakaNithi,MwingiandKituicounties.CurrentlythereareloannegotiationswiththeEximbankofChinathatisoneofthemilestonesoftheproject.Thefeasibilitystudyoftheprojecthasbeencarriedoutandtherewillsoonbeagroundbreakingceremony.Thecurrentprojectcostisprojectedat1.54BnUSDanditwilltake6yrstoimplement.TheHGFdamisa5.4bn cubicmetersmultipurposedamprojected toprovide the followingbenefits:200ha of irrigation, 500 – 700 MW hydropower production, Tourism, Floodprotection,WatersupplyandJobcreation.ThereisanongoingESIAthatshouldbecompletedsoonfortheprojecttogoahead.Question
Answer
Has the project had communityconsultation to pave way for such aproject? At what stage was thecommunity consulted? Is there adisplacementofthelocalcommunity
Thereisaresettlementactionplanfrom2009thatiscurrentlyunderrevision.TheESIAwillincludethis.A partial environmental impactassessment.TheprocesshasbeenParticipatory
HowwillingisTARDAtouptakeresultsofstudies intheTanaor isthe informationcastinstonealready?
They are willing to accept anyinformation availed to them from theproject and are willing to borrow fromthe wider stakeholder group and valuethe outcome of the various projects intheTana.
There is an irrigation developmentproposal on the upper Tana (UpperMurang’a being developed) can you letusknowmoreaboutthis?
Murang’a irrigation scheme- there is aunderway feasibility study for 5000ha.Currently its in the prefeasibility stageand the detailed design of the projectshouldbeoutbyearlyMarch
Constitutional issue – is the projectwithin the RDA not in contravening thecurrentconstitution?
Do you think that you could beparastatalizingcountyfunctions?
19milestones,theprojectweredesigneda few years back before devolution andTARDA understands this project betterthanthecounties.RDAs Undertake integrated regional

ParticipatoryScenarioWorkshopReport-ACCESS
13
planning, the counties can approachTARDA in the implementation especiallyifthecountieshavethecapacity.
Irrigation schemes within the upperTana. Level of stakeholder involvementnow that the prefeasibility study isunderway;Howfararesocialaspectsdone?AreWRUAsinconsultation?Legality in terms of water resourcemanagement?
• The counties are now beinginvolvedandall the stakeholdersaretobeinvolved.
AretheRDA’sstillrelevant Yestheyarerelevantsincedevolution isbeing implemented; they are theinstitutions with relevant regionalintegration.
How much are you involving the Tanariver county in Gamba – rice irrigation,andMumiasschemeinthedelta?Have there been consultative meetingswiththecounties?
TheMumiasschemehasstalled.TARDAistryingtointegratethecountiesintheprojects.
Towhatextenthavethecountiesalignedtheir sectoral plans to accommodatenewdevelopments?WilltherebetherevisionofplansorhowtheplansandprojectsfromTARDAfit init.
The counties have now started todevelopwiththeintegratedplanssothattheycanseekcountypartnershipontheprojects.
COMMENTS: TARDAstarted theprocessandare thebest to implement this.Thecountiesareanew constitution and this is in schedule 4 of the constitution. Intergovernmentalrelationsactprovidesprovisionsof thecooperation.Thereare legalitiesunder theconstitutionandnowthecountiesaremandatedtocarryoutdevelopmentprojectsaswell.CommentbyCDA–RDA’sdealwithintegratedprojectsandtransboundaryofriverbasinsandsuchprojectse.g.MwachedaminKwaleandsupplywatertoMombasaandKwale–countiesKwale– Irrigation,Mombasa–Supplyofwater.ContributionfromKwaleandMombasacounties.ImplementationoftheprojectsfromtheRDA’sandcountieswillbeincludedintheprocess.Theconflictsarisingfromthediscussionsarehealthy,lookingatthedifferentprojectdevelopments – counties need to appreciate that there is work that has been ongoing,butthereisneedfordialogue.ThereisneedforrealignmentoftheprojectsfromRDA’sandcountiesspatialplans.
ParticipatoryScenarioWorkshopReport-ACCESS
14
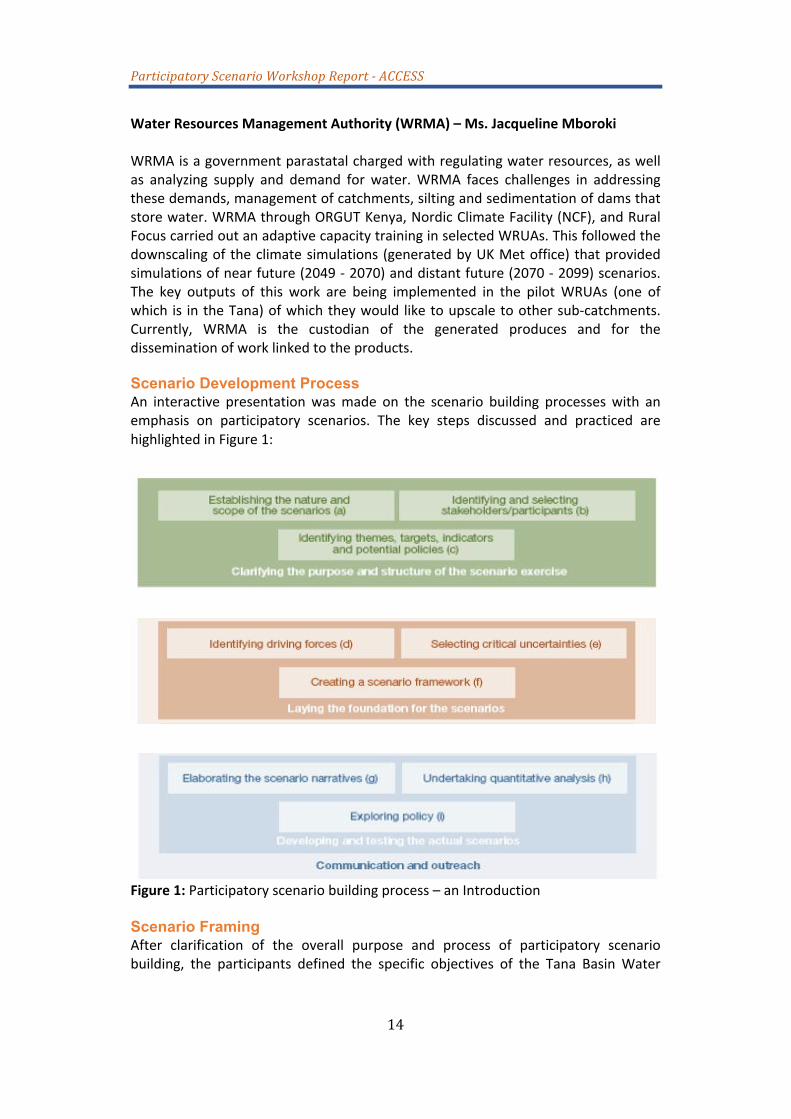
WaterResourcesManagementAuthority(WRMA)–Ms.JacquelineMborokiWRMAisagovernmentparastatalchargedwithregulatingwaterresources,aswellas analyzing supply and demand for water.WRMA faces challenges in addressingthesedemands,managementofcatchments,siltingandsedimentationofdamsthatstorewater.WRMAthroughORGUTKenya,NordicClimateFacility(NCF),andRuralFocuscarriedoutanadaptivecapacitytraininginselectedWRUAs.Thisfollowedthedownscalingoftheclimatesimulations(generatedbyUKMetoffice)thatprovidedsimulationsofnearfuture(2049-2070)anddistantfuture(2070-2099)scenarios.The key outputs of this work are being implemented in the pilotWRUAs (one ofwhich is intheTana)ofwhichtheywould liketoupscaletoothersub-catchments.Currently, WRMA is the custodian of the generated produces and for thedisseminationofworklinkedtotheproducts. Scenario Development Process An interactive presentationwasmade on the scenario building processeswith anemphasis on participatory scenarios. The key steps discussed and practiced arehighlightedinFigure1:
Figure1:Participatoryscenariobuildingprocess–anIntroductionScenario Framing After clarification of the overall purpose and process of participatory scenariobuilding, the participants defined the specific objectives of the Tana BasinWater
ParticipatoryScenarioWorkshopReport-ACCESS
15
Infrastructure/EcosystemsServicesparticipatoryscenariodevelopmentexercise.Thefollowingwerehighlightedasthemainobjectives:
S Capacity building and training to provide information to Tana basinstakeholder on visioning and foresighting as well as raising awareness ofpolicymakersonforwardplanning
S WISE-UP Project work package integration of information from differentprocessesandactorsintoadialogueplatfromplanningandexploringfuturepossibledevelopments
S Toendearstrategicplanningthroughbasinmanagementdecisionsupportbygathering different views and to identify issues that will determine futuretrends and support evidence-based planning for preparedness for futurealternativetrendsindrivers,outcomes,ecosystemsbenefitsandoptimalmixtosupportpolicymeasuredevelopment
Insummary,theplenarydiscussionconcludedthattheprocessshouldallowforthestakeholders to participate, enable the representation of conflicting opinions andviews.Itwasacknowledgedthatchallengessuchasclimatechange,landusechange,biodiversitylossandnaturalresourceuseinefficiencieshavelong-termimplicationsand so require long-term policy solutions that participatory scenario buildingprocesseshelp address aheadof time.By anticipating, jointlywhat lies aheadandgrasping ongoing, emerging and latent developments, we are more able tocollectivelyaddressadaptivebasinmanagementneeds.Plotting of the Critical Uncertainty Theplenarydiscussedtheprocedureandplottedtheidentifieddriverstodeterminethecriticaluncertainties.Acriticaluncertaintyisadriverthatismostimportantforthefuturebasinecosystemschangesbutisalsomostuncertain.
ParticipatoryScenarioWorkshopReport-ACCESS
16
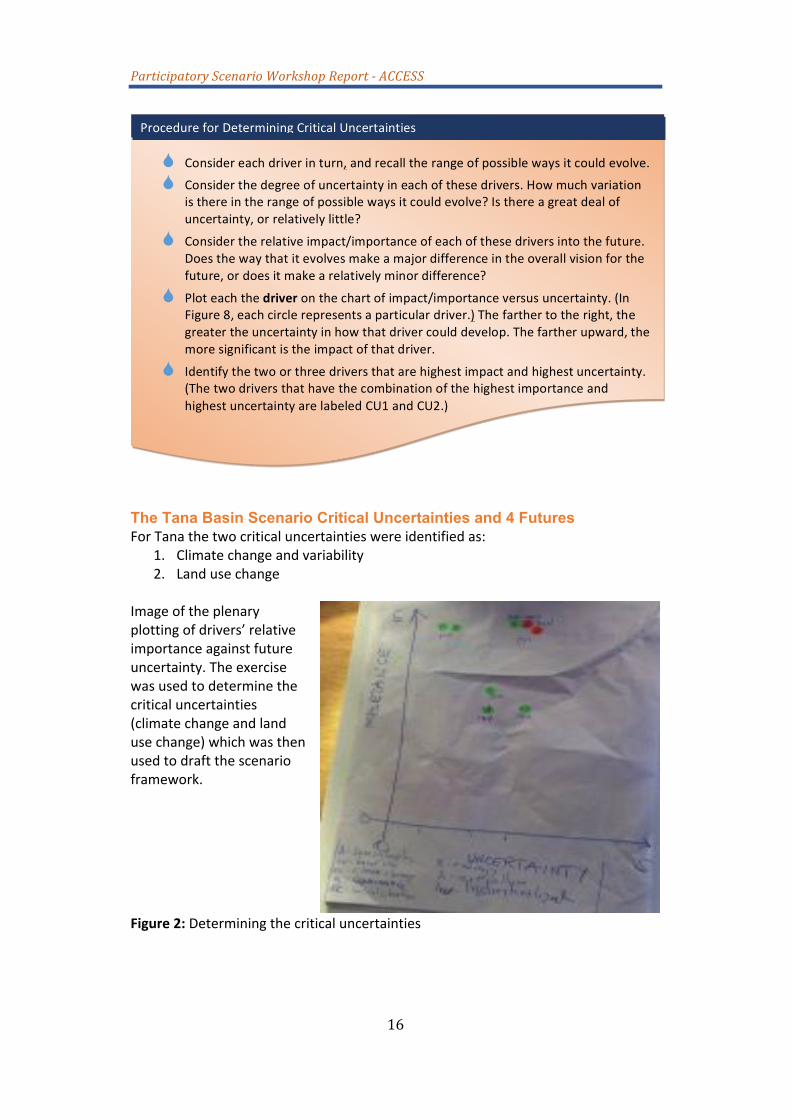
The Tana Basin Scenario Critical Uncertainties and 4 Futures ForTanathetwocriticaluncertaintieswereidentifiedas:
1. Climatechangeandvariability2. Landusechange
Imageoftheplenaryplottingofdrivers’relativeimportanceagainstfutureuncertainty.Theexercisewasusedtodeterminethecriticaluncertainties(climatechangeandlandusechange)whichwasthenusedtodraftthescenarioframework.
Figure2:Determiningthecriticaluncertainties
S Considereachdriverinturn,andrecalltherangeofpossiblewaysitcouldevolve.
S Considerthedegreeofuncertaintyineachofthesedrivers.Howmuchvariationisthereintherangeofpossiblewaysitcouldevolve?Isthereagreatdealofuncertainty,orrelativelylittle?
S Considertherelativeimpact/importanceofeachofthesedriversintothefuture.Doesthewaythatitevolvesmakeamajordifferenceintheoverallvisionforthefuture,ordoesitmakearelativelyminordifference?
S Ploteachthedriveronthechartofimpact/importanceversusuncertainty.(InFigure8,eachcirclerepresentsaparticulardriver.)Thefarthertotheright,thegreatertheuncertaintyinhowthatdrivercoulddevelop.Thefartherupward,themoresignificantistheimpactofthatdriver.
S Identifythetwoorthreedriversthatarehighestimpactandhighestuncertainty.(ThetwodriversthathavethecombinationofthehighestimportanceandhighestuncertaintyarelabeledCU1andCU2.)
ProcedureforDeterminingCriticalUncertainties

ParticipatoryScenarioWorkshopReport-ACCESS
17
Thefourquadrantsthatreflectthefourmutually exclusive futures of Tanabasin ecosystems services as plausiblydictated by climate change and landusechangedimensions.
S Scenario1:S Scenario4:S Scenario2:S Scenario4:
Future participatory work in theworkshop was based on the fourscenarios.
Figure3:Thescenarioframeworkdepictingthefourquadrants(Tanafutures)QUESTION
RESPONSE
Will certificates be issued at the end oftheworkshop?
No there will not be any certificatesissuedalthoughACCESSwilltakethisintoaccountinfutureworkshops
Comments• TheNationalLandscommissionneedstobeincludedinthesediscussions,as
thelandusechangeseemstobearecurringissue.• Theprojectneedstofigureoutamechanismtodistributetheresultstothe
ASALcountiesas theseregionswouldgreatlybenefit fromtheoutcomesofsuchprojects
• DuplicationofmandatesofNDMA,NLC,MinofLands-landuseissuesshouldbeclearlylookedatintheproject
• Lack of awareness on climate change in by local communities, how willinformationdisseminationoccurfromtheprojecttothesecommunities?
• The scenario development is a policy guiding process to select certainplausible futures/actions that can help in the harmonization of the basindevelopmentstrategies.
• Whatroledocountiesspatialplansplayinthedecisionmakingprocessandhowwillthesebetakenupbytheproject?
• ThereisneedtoengageNEMAandcountyenvironmentalcommitteesintheprojectdemonstrationanddisseminationofresults.
• There are several upcoming laws and bills concerning Land use and waterthatneedtobeconsideredespeciallywhenlookingatfuturescenarios.

ParticipatoryScenarioWorkshopReport-ACCESS
18
Scenario Definition Exercise The four emerging future “worlds” were described with respect to the majorfeatures of the critical uncertainties (climate change and land use change).Participants were divided into four groups to characterize the scenarios and giveeachauniquename.GROUPA–JUDAS(Negativelandusechange,positiveClimateChange)LANDUSESCENARIOS
1. Deforestation2. Poorfarmingpractices3. Overstocking4. Unsustainablequarryingpractices5. Unsustainableexploitationofresourcee.g.sand6. Siltationofrivers7. Waterpollution8. Landdegradation9. Soilinfertility10. Dysfunctionaleconomy11. Poorpolicies,regulationsandenforcement12. Encroachment13. Increasedandunresolvedresourceconflict14. Depletionofbiodiversity15. Unplannedsettlement16. Landdisasters17. Increasedfloodingincidences
CLIMATECHANGESCENARIOS
1. Morewater• Replenishthenaturalinfrastructurethusensuremorewater• Foodsecurity(irrigationduringthedryseason)• Moreenergytothenationalgrid• Eco-tourism,watergames
2. Increase levelofawareness inclimatechangethisenhancepreparedness inbuiltinfrastructure
3. Climate change mainstreaming in planning and budgetary allocation in allsectorstofinanceadaptivemeasuresforinfrastructuremix
4. Gender mainstreaming n climate change adaptation to ensure gendersensitiveadaptation
5. Alternativelivelihoodsinplace6. Stakeholderinvolvementinplanningandimplementingprojects7. Coherentclimatechangepoliciesinplace8. ProperM&Etoolsfortrackingclimatefinance9. Sustainableresourceutilizationandmanagementinplace10. Mandatorylifecycleassessmentformostofindustriesinplace11. Policiestoconservebiodiversityinplace

ParticipatoryScenarioWorkshopReport-ACCESS
19
12. Carboncredittradeopportunity.GROUPB–TANAPOA(PositiveLandUseChange,PositiveClimateChange)
1. MainstreamingofCCintodevelopmentplans(CIDPs,sectorplansandcountyspatialplanning)
2. DisasterpreparednessinTanabasin(floods,droughts,diseases)3. Securelivelihoods4. Soilconservationmeasuresinplace5. Resilientbiodiversity(entirebasinandmarineareas)6. CCadaptationplans7. AwarenessonCC8. Foodsecurity(availability)9. Sufficientwaterofgoodqualityforalleverywhereandeverytime10. Soilandwaterconservationplansdevelopedandimplemented11. Climatecompatibledevelopment12. Goodgovernance–policies,politicalgoodwill13. Increaseinforestcover14. Investments(financing)15. Awarenessonlanduse16. Securelandtenure17. Resourceconflictsmanagedandreduced18. Functionalearlywarningsystems19. SCMPsincorporateclimateissues–SubCatchmentManagementPlans20. Harmonizedpoliciesandinstitutionalframeworks21. Governanceonlanduse22. Resilientwetlandecosystems23. Participatorydevelopment(gender,youth,disabled)24. Landuseplansdevelopedandimplemented25. CapacitybuildingonCCandlanduse26. Disseminationandinformationsharing27. AdequatedataforCCandlanduse
GROUPC–Ardhibora(PositiveLandUseChange,NegativeClimateChange)
1. Catchmentconservationprogramse.g.terracingandcheckdams2. AdequatereliableuptodateanduseddatatosupportLUmanagement3. Research–geologicalandecosystemwithlinkagestoresearchinstitutions4. Landusetenuresystem5. Industrialization6. Populationgrowth7. Recreationaltourism8. Culturalsites9. Participatoryapproachinlanduse10. Industrialization/urbanization11. Limitedcapacity(financial,technicalandskills)12. Migration

ParticipatoryScenarioWorkshopReport-ACCESS
20
13. Alotofconflictsoverresources14. Predictability and application of laws to policies (e.g. in Israel, California,
Mauritania)15. Enforcepolicies/laws16. Strengtheninstitutions17. Changeoflivelihoods(dropoutbypastoralisttofarmers)18. Landuse–afforestation,appropriatezoning,landuseplanning19. Climatechange(negative)
• Floodingincreased• Displacement• Destructionofproperty
20. Recurrentdroughts21. Policies–Weakinstitutions/politicalinterference
GROUPD–OkoaTana(NegativeLandUseChange,NegativeClimateChange)
1. Climatechangea. Floods
• Displacementofpeople• Inundation• Lossoflivestockorproperties• Destructionofinfrastructure• Waterbornediseases• Poorwaterquality• Mudslideandlandslide• Lossofbiodiversity• Legalandinstitutionalframeworkweak
b. Droughts• Loosoflivestock,crops,diseaseoutbreak• Degradationofland• Diseasesoutbreak• Reducedflowinrivers• Riseinwateruseconflicts• Displacementofpeople• Human,livestock,wildlifeconflicts• Famine• Disruptionofeducation,health,socialfabric,• Heatstress
c. Landuse• Poordrainage• Erosionincatchmentareas• Poorfarmingpractices• Misuseoflegalframework(selectiveuseoflegalframework)• Inefficientuseoffinancialandeconomicresources• Lossoflandfertility

ParticipatoryScenarioWorkshopReport-ACCESS
21
• Catchmentdegradation• Deforestation• Degradation• Landusepolicyandtenuresystem• Inadequateawareness(Capacitybuilding)
Day 3: Elaborating Scenarios and Sequencing New Developments After a recap of the previous day’s activities, participants continuedwith scenariobuilding focusing on qualitative and quantitative elaboration to create draftstorylinesundereachscenario.Thedaywasalsodedicatedtodiscussionsonimpacts(spatial, socio-economic, ecosystems service based) future trends and impacts ofalternative water installations. The investment categories that were sequencedincluded:
S ProposeddamsS ExistingdamsS AgricultureS PopulationS Watertransfers

ParticipatoryScenarioWorkshopReport-ACCESS
22
Table4:PlausibleFutureTrendsinSelectedDriversandEcosystemsServicesOutcomes
Year
GroupA
GroupB
GroupC
GroupD2050 • Mushroomingurban
center/sprawls • Landdegradation
• Socialchange-majorconflictamonghuman/livestock/wildlifeonresourceisleadingtomigration,displacements,deaths
2045 • Fullpopulationgrowth• Growthinindustrialization
• Alternativeenergysourcedevelopmentby2040
• Populationsurgeinthebasin• Developmentofotheralternativesourcesofenergy• Leachingofsoil
• De-industrialization• Newtechnologicaladvancementinenergyproductionandclimatechange• Continuouscapacitybuilding• Overabstractionsofwaterfromthebasin• Lackofwaterandfoodsecuritypoliciesinplaceleadingtoincreasedandunresolvedwaterrelatedconflictsamongthecompetingusers

ParticipatoryScenarioWorkshopReport-ACCESS
23
Year
GroupA
GroupB
GroupC
GroupD
2035 • InfluxinpopulationinTana
• IncreasedincomelevelsinTana• Technologicaladvancement• Socialchange-culturalissueserosionofculturalvaluesandincreaseinimmorality• Socialchange:tourismboomresultingtomoreemployment/riseinlivingstandards,• Growthintouristresorts
• UrbansprawlsinTanabasin• Technologicaladvancement• Effectivelawsandpoliciesonclimatechangeandefficientenergyproductionby2025• Policyandawarenessinplacewithinthebasintoenhanceandpromotewaterconservationmeasurese.g.damsby2030• Agricultureactandotherlandusepoliciesarebeingeffectivelyenforcesby2035• Researchanddevelopment• Waterandenvironmentalpollution• Socialchange-managedconflictsonresourceuse
• PopulationperturbationinTanabasinby2025• UrbanizationshocksinTanabasinby2025• Landandwateruseconflicts• Socialchange-povertylevel-majorfoodshortageleadingtodependencyonreliefsupplyleadingtoriseofslumsanddeaths• NilebasinIWRMtreatyhasnotbeenratifiedbyKenyasononationalIWRMpolicyandnoIWRMprinciplesbeingappliedtotheTanabasin

ParticipatoryScenarioWorkshopReport-ACCESS
24
Year
GroupA
GroupB
GroupC
GroupD
• Socialchange-displacementofpopulationtoextremefloodsanddroughts
2025 • Adequatewatersupplyforirrigatedagriculture• Zonationofbasinforirrigation• Inadequatewaterforlivestock• Inadequatepastureforlivestock• Harmonizedagriculturalpolicy(by2020)• Socialchange-weakpolicyframeworkwithlackofenforcementandweakinstitutions• Urbanization:massiveurbandevelopment• Urbanization:reclaimingwetlandsandcreatingplanned
• Highwaterdemand• Allocatelandforlivestockkeepingforpastoralists(2020)• Developmentofhydropowerinfrastructure(2025)• Adequatewaterforlivestock• Multi-stakeholdersectoralforumsinplaceforknowledge/informationsharingandmanagementforsustainablemanagementofthebasinandincorporatedintocountydecisionmaking• IntegratedlandusepolicyforTanaBasininplaceandbeingimplementedby2020
• InterferencewithES
• Environmentaldegradationandover-abstractionofresources
• Socialchange-awareness-increasedawarenessonlandusepractices

ParticipatoryScenarioWorkshopReport-ACCESS
25
Year
GroupA
GroupB
GroupC
GroupD
andunplannedsettlement• Effectiveenergypolicy• Changeinlandusepolicy• Capacitybuildingonenergy• Environmentaldegradation• CCAregulationselaboratedandconcreteplanofactionisinplaceforimplementationintheTanabasin2020
Sequencing of built infrastructure in the basin informed by the National Water Master Plan – presentation by Christine Omuombo. Ms.Omuombohighlightedsomeoftheactivitieswithinthenationalwatermasterplanprovidedaholisticoutlookatsomeofthedevelopmentalagenda of the Tana displaying changes in projected infrastructural development associatedwithwater storage,water transfers, irrigation,agriculture,populationandenergythatneedtobegivenconsiderationinthebasinfromthestakeholders.

ParticipatoryScenarioWorkshopReport-ACCESS
26
Table5:SequencingofNatural;Infrastructuredevelopments GroupA GroupB GroupC GroupD
PROPOSEDDAMS
• Reducedwaterstorageby20%by2035• Reducedsupplyby20%by2035• Escalationofcompetitionofresourcesby40%by2035leadingtoconflicts• Increaseddemandforlandtobuildmoredamsby25%by2035
• Increasedwaterstorageby20%by2030• Increasedwatersupplyby20%by2035• Increasedpowersupplyby20%by2035
• Noinvestmentonproposeddamsby2040• Negativeimpactonsociety,ESandeconomyby2040

ParticipatoryScenarioWorkshopReport-ACCESS
27
GroupA GroupB GroupC GroupDEXISTINGDAMS
• Siltationofdamsleadingtofillingup100%by2050• Reducedpowergenerationleadingtopowerrationinganduseofexpensivefossilfuel(diesel)by30%by2050• Reducedwatersupplyleadingtowaterrationingby50%anddryingupofriversdownstreamby40%duetosiltationby2030• Regenerationofvegetationby30%by2050• Increasedsoilfertilityby40%duetodepositiondownstreamby2030• Reducedsoilfertilityby40%duetoerosionupstreamby2030
• Increasedpowergenerationby20%by2035• Increasedwatersupplyby2035
• Floods-increasedpowergenerationandwatersupplyby20%by2030• Droughtsdecreasepowergenerationandwatersupplyby30%by2030
• Siltationofdamsby50%by2040• Increasedpowerrationingby50%by2030• Reducedwatersupplyby50%by2030

ParticipatoryScenarioWorkshopReport-ACCESS
28
GroupA GroupB GroupC GroupDAGRICULTURE
• Decreaseinlivestockproductionby2025• Floodingdisastersaffectinglivestockby2025
• By2015,existinginstitutionalranchesinlowerTana• Meatprocessingplantsby2035• Increasedlivestockproductivityby2025• Location• MostlythemiddleTanabasinespecially(largescale)withsmall/privatealsoinupper/lowerintheriparianzone
• Onsiteimpacts• Equitableallocation/sitingofschemestoallowlivestockaccesstoriverandgrazingzones• Allowforcontinuedtraditionalfloodplainagriculture• SLMtechniquesadoptedbyfarmers,maintainingandimprovingsoil/waterquality
• Downstreamimpacts• Waterabstractionmanagedtoallowsufficientsocial,economicandenvironmentalinstreamflowandquality
• Reducedpastureby2035• Reducedlivestockproductionby2035• Climatesmarttechnologyforpastureby2035
• Location• MostoftheirrigationwillbeinthemiddleTana(especiallyLarge-scaleirrigation)withsmall/privatealsoinupper/lowerTanabutinRiparianzone• Statusby2025-largescaleirrigationwillhaveincreasedby75%,smallscaledeclinedby30%andprivateincreasedby25%butlandwillbebadlymanaged(soilexhaustion,nowastewatertreatment,inefficientwateruse)• 2035-duetolandexhaustionalltypeofirrigationwilldecline• 2050-verylittleirrigablelandleft
• Onsiteimpacts• LargeirrigationschemeswillbelocatedalongfloodplaininmiddleTana(conflictingwithdryseasonpastureandtraditionalfloodplainagriculture• Onsitelandexhaustionleadingtodecreaseinsoilfertility-

ParticipatoryScenarioWorkshopReport-ACCESS
29
GroupA GroupB GroupC GroupDPOPULATION
• Developmentofwaterstoragefacilities(acrosstheboard100%)by2030• Deforestationby5%acrossthebasinby2030• Siltationinriversby2030by30%inmiddleandlowerTana• Airandwaterpollutionby15%acrossthebasinby2025• Erosionacrossthebasinby20%by2030• DestructionofwetlandsinthemiddleandlowerTanaby20%by2025• FloodinginurbanareasinupperandlowerTanaby25%by2025• Pastoralists-conflictsforwatercompetitionlowerby20%by2030• Destructionoffloodplainslowerby30%by2025• Increasedcrime
• Increasedlanduseresourcesby25%acrossthebasinby2020• Increasedwaterstorageby100%acrossthebasinby2030• Equityinwaterallocation
• Conflictsacrossthebasinby2020• Increasedwaterstorageby100%by2030• Waterpollutionacrossboardby15%by2030
• Conflictby2020• Floodingby2030-20%lower• Wetlanddepletion-acrossboard15%by2025• Waterpollution-acrossboardby15%by2030• Lossofbiodiversitylowerby25%• Deforestation-upper20%by2030• Erosion-acrossbasinby20%by2025• Waterbornediseases-increaseby50%acrossboardby2030

ParticipatoryScenarioWorkshopReport-ACCESS
30
GroupA GroupB GroupC GroupDWatertransfers
• Masinga--Kituiextension-delayedimplementationduetotheCCthere'smorewaterbutthisisnotharvestedduetopoorlandusepracticethoughthereisstillpressureforthisby2030• KiamberetoMwingiextension-Noextension-itsalreadyinthered,subsidiesnotavailableanymorethisdeepeningtheoperationalcosts• HGFtoLamu-delayed,thereiswaterbutaffordabilityisachallengeby2035• TCAtoACAforNairobi-immediately(2020)increaseddemandforwaterinthecity
• Masinga–Kituiextension-ThereisadequaterainfallsinceCCispositivewithpositivelandusepracticesthiswaterisharvested• KiamberetoMwingiextension-Shouldn'tcontinuethere'sincreasedrainfallandwaterharvesting• HGF–Lamu-Delayed/notnecessarywithgoodlandusethereisharvestingfromsanddunesandLakeKenyatta.Increasedrainfall-increasedinfiltrationmorewaterwillhappenatsomepointduetopollutioninflux,overextractionmayleadtointrusion• TCAtoACAforNairobi-willbedoneby2025increaseddemandfromindustriesanddomesticuse
• Masinga–Kituiextension-Thiswillhappenimmediately,thereisalot/increaseddemandforwater.Waterharvestingandgoodirrigationinplace• KiamberetoMwingiextension-Couldstartearlier-affordabilitywithpositivelandusepracticesby2025,thereisincreaseindemand• HGF–Lamu-Takeplaceimmediatelyandoperationalby2025itsdemanddriven• TCAtoACADoneimmediatelyduetoincreaseddemandby2020therewillbeafurtherincreaseindemandforurbanwater
• MasingaKituiextension-thiswillbeawhiteelephantasitwillbeaveryexpensiveprojectwhichwillrequireexpensiveinfrastructure.Theprojectcan’tsustainitself.Thereispressuretorescuethesituationthoughby2035• Kiambere-Mwingiextension-Noextension-Nomoneytorun/operateitasaresultofhighoperationalcosts• HGFtoLamu-Delayedto2035duetodemandforwater.

ParticipatoryScenarioWorkshopReport-ACCESS
31
Communication Needs Theworkshop technical sessionswere concluded by a group activity to develop ascenario communication strategy. The activity involved, identifying andcharacterizing the target groups, listing their respecting scenario and WISE-UPinformation needs, determining best communication channels, expectedbehavior/decisionmakingchangesandmeansof receiving feedback.Theresultsofthediscussionsaresummarizedinthetablebelow.

ParticipatoryScenarioWorkshopReport-ACCESS
32
Table6:Broadtargetgroupbasedscenariocommunicationstrategy.TargetGroup CategoriesofStakeholders
inthisGroup(Clusters)InformationNeeds ChannelorMedia ExpectedAction(Decision,
Behavior,Action)WISEUPPARTNERS
• IUCN• IWMI• ACCESS• CSIR• ODI• BC3• UNIVERSITIESAND
RESEARCHINSTITUTIONS
• Socio-economicscenarios• Populationtrendand
projections• Landusescenarios-land
usechanges• Waterdemands-
irrigation,domestic,industry
• Currentandplannedwaterinfrastructure
• Policyinformation/strategicplansforagriculture,energy,wateretc.
• Reports/publication• Workshops/presentati
ons• Emails• Videos/documentary
onscenariodevelopmentwithstakeholders
• Refineoradjusttheresearchobjectivesandprojectoutcomes/outputsmodifyresearchmethodology
• Refinemodelinputdatatoincorporatebetterdata
• Refinestrategyforcommunicatingprojectoutputs

ParticipatoryScenarioWorkshopReport-ACCESS
33
RegionalDevelopmentAuthorities(RDA's)
• CDA
• TARDA
• LBDA
• KVDA
• Community
• Countygovernment
• EwasoNyiroNorth
• EwasoNyiroSouth
• Developmentpartners
• CBO's
• Institutionsofhigher
learning
• NGO's
• Landuseplanning
• Strategicenvironmental
Assessment
• Earlywarning
systems/info
• CCadaptation
• Climatecompatible
development
• Naturalresource
management
• ValuationofESgoods
andservices
• Environmental
awareness
Spatialplanning
• Newspaper
• LocalRadio
• Newsletters
• Barazas
• Internet
• Mobilephone(sms
platform)
• Pamphlets
• TV
• Briefs
• Booklets
• Brochures
• Magazines
• Roadshows
• Theatre
• Artwork/Exhibitions
• Competitions/sports
Letters
• Includeparticipatory
approachesin
development
• MainstreamingCCin
policies,programsand
projects
• Ensureenvironmental
conservation
• Ensuresustainability
Designand
implementationof
sustainableprojects
• Monitoringand
evaluationofprojects
toensure
sustainability
• Mitigationofnegative
environmental
impacts
Developmentpartners
• Cooperatesector
(CESRprogram,water
investors)
• Bilateraldonors(GIZ,
DFID,etc.)
• Multilateral(UNDP,
FAOetc.)
• Developmentbanks
(AfDB,WB)
• InternationalNGO's
(Oxfam,wetlands
• Theyneedtoknow:
Howthescenariosrelate
todevelopmentagendas
whattheimplicationsof
differentdevelopment
futuresare
• Howdifferent
stakeholdergroupsstand
tobeaffected(especially
thepoor/vulnerable)
• Howthenatural
• Viadonorworking
groups
• Roundtable
discussions
• Policybriefs
• Presentationsattheir
offices
• Meetings,workshops
andconferences
• Representations/prese
ntationsatglobalfora
• Reorienttheir
programsandprojects
totargetthese
realitiesanddrivers
• Increasefundingto
sustainable/equitable
naturalandbuilt
infrastructureinthe
Tanabasin
• Factornatural
infrastructure

ParticipatoryScenarioWorkshopReport-ACCESS
34
international)NationalNGO's(NatureKenya,KFWG)
environmentmightbeaffectedandhowitneedstobeconservedwhatdifferenceCCwillmaketodevelopmentintheTanabasin
(e.g.WWW)• Technicalworking
papers
solutionsintheirinvestmentportfolios
• Lobbyandadvocateothernational/internationalagenciesandprocesses
Parastatals • KENGEN• WSPS• Kenyapower• TanawaterServices
board• NEMA• WRMA• AthiWaterservices
board
• DataonecologicalflowsoftheTanabasin
• Populationpatterns• Newtechnologies• Socio-economicdata
existingandproposedprojects
• Seminarsandworkshops
• Publicationandreportscollaborative
• Informationexchange
• Climatesmartinvestment
• IntegrationofCCAintoplanningandoperations
• CreateawarenessonCCinitiativestootherstakeholders
• HarmonizeexistingpoliciesandconsultationwithrelevantministriesEnforcetheexistinglaws
ResearchandAcademia
• CGIAR• KALRO• KIPPRA• IEA• ACCESS• Universities• ICPAC• KMD• CCSec
• Methodology• Casestudies• Inductionandtraining• Funding
• Seminarsandconferences
• Workshops• Involvementin
researchteams• Listserve
• Furtherdisseminationandtraining
• Furtheranalysisanddevelopmentoftools
• Developcasestudies

ParticipatoryScenarioWorkshopReport-ACCESS
35
WRUAs • CommunityBased
organization
• Commoninterest
group
• WRMA
• Waterabstractors
• Chief
• Countygovernment
• Irrigationgroup
• Communicationcapacity
• Awarenesscreation
• Workshops
• Training
• Educationtools
• Chiefbarazas
• Groupmeetings
• Communityfarmer
group
• Mobilephones
• Radio
• Seminars
• Farmerfieldday
• WRUAmembers
meetinggroup
• Implementwhathas
beenpassedon
• Informother
stakeholders
• Developactionplans
• Formsomecommittee
tomonitor
Communities • Pastoralists
• Farmers
• Businessmenand
women
• Clergy
• Community
administration–
chiefs,councilof
elders,opinion
leaders,
• Womenreps
• Women,men,youths
andchildren
• Informationsharing
• Consultationinall
developmentprojects
• Lobbyingandadvocacy
skills
• Sensitizationon
environmental
managementand
conservation
• Alternativelivelihood
options/policiesand
legislationsinplace
• Creationofaplatformto
engagepolicymakersat
national,countyand
communitylevels
• Massmedia-
vernacularradio
stations
• Printmedia-
developmentof
simplifiedtraining
manualstranslatedinto
locallanguages
• Morecommunity
forumsconsidering
theircalendari.e.
barazas,workshops,
multi-culturaldays
• Organizenational
forumstomeetthe
opinionleaderssuchas
thePPGandCPG
• Usemediapersonnel
forspecificissues.
• Activeparticipationin
policymakingprocess
• Alternativelivelihood
uptaketoease
pressureonresource
• Sustainable
managementof
environmentand
resources
• Makeinformed
choicesindecision
making
• Reduceconflictover
resources
• Foodandwater
security
• Changeinbehaviors
andpreferences
• Communityviewsare
articulatedinnational

ParticipatoryScenarioWorkshopReport-ACCESS
36
andcountydevelopmentsthereforeownershipinlanduseandmanagement
• Increasetheforestcover
NationalWaterandirrigationinstitutions
• WRMA• WSBS• NationalWater• Pipelinecooperation• KEWI• WaterAppealsBoard• NIB• WASREB• Researchinstitutions• Countygovernment
• Proposedcatchmentmanagementimplementationactivitiesinthebasin
• Casesofwaterarbitration
• ProposeddamsitesWaterdemandfordifferentusesinthebasin
• Areainacreageavailableforirrigation
• Dataonwaterresourcesinthebasin
• Managingconflictthatwillarise
• Likelywaterconflictsontheproposedscenariosandtheirimpacts
• DataonWR• Dataonunresolved
conflictsandcases• Projectsproject
• Media,• Brochures,• Fliers• TVshows,• Printmedia,• Publicbarazas• localradiostations,• Internet
(twitter,facebook)• Reportsthroughemail
workshops• Officialmaildelivery• Booklets• Electronicmedia• Youtube• Roundtablemeetings• Consultativeforums• Documentaries
• Implementationofbestcasescenario
• Ensureequityinallocationofwaterresource
• Implementationpoliciesinfluencingdifferentscenariosinthecatchmentarea
• Manageconflictsinresourceuse
• Providesustainableandlogicalirrigationdevelopment
• Engagingotherstakeholders
• Respondtoissuesraised
• Reviewpoliciesandcomeupwithnewoneswherenecessary
• Addresstheissueshighlighted

ParticipatoryScenarioWorkshopReport-ACCESS
37
implementationandwheretobeimplemented
• Howthevariousdevelopmentswillaffectthebasin
• Recommendationonsustainablescenariosforthebasindata
• Passoninformationthroughouttheinstitution
• Implementsustainableirrigationschemes
CountyGovernment
• Countygovernment(CEC,CO,governor)
• CountyassemblyCountyPublicServiceBoard
• CountyLandsCommission
• WaterandNaturalResourceDepartmentCouncilofGovernors
• Dataonwaterandweather
• Communicationandplanningtools
• Researchanddevelopmenttools
• Casestudiesforresearchconductedinsimilarbasin
• Informationonpoliciesandlegislationaffectingresourceplanninganddevelopment
• Seminarsandworkshops
• Brochuresandnewspaper
• Countymagazines• Countyradiostations• TVtalkshows• Socialmedia-FB,
twitter,instagramMeetingandbarazas
• Givefeedback• Integrateresearch
findingintotheirdevelopmentagendaandplanning
• Enforcementofresearchfindingsthroughlegislationandpolicies
• Integrationoffeedbackintomanagementstructure
ParticipatoryScenarioWorkshopReport-ACCESS
38
Stakeholder Concluding Remarks The workshop was concluded by closing remarks from facilitators, participants’representationandMs.Omuombo.Keypointsmentionedbythespeakersincluded:
S Livelydiscussion–otherinstitutionspresentingtheiractivitieswasalearningexperience
S CC modeling and life span of the project – meteorology department UoNinvolvedinthis–climateevolutionand
S Recommendation on operational hydrology refresher course at UoN metpostgraduate course – to build capacity of the participants – climate andhydrologyissues,masterscourseinCC
S Pastoralists–needtobegivenadueconsiderationS RightsbasedapproachS Watersupplyandfoodisimportant,waterisfinite–waterconsumptionfor
thepopulationandthevirtualwater,waterfoodprintfortheproductionofcrops? How do we minimize the water consumption and consider virtualwatercontent
S Whatalternativesdoweneed,waterconservation,wateruseS WateruseandtheneedforGibe3toprovideresourcesforthecommunities
Workshop Evaluation The workshop was evaluated using both formative (continuous – daily and bysession) aswell as summative (final last day evaluation. A variety of participatorytoolswereusedtoassedchangeinparticipant’sknowledgebaseandreceivedtheirfeedbackonkeyworkshoptechnicalandoperationalprocesses.Annex4showsthefinalworkshopevaluationformused.

ParticipatoryScenarioWorkshopReport-ACCESS
39
Annexes Annex 1: Workshop Agenda Day1Morning • WelcomeandIntroductions
• KeynoteonWater–Food–Energynexus(Prof.E.Odada)• UnderstandingNaturalandBuild-infrastructuremixandecosystems
servicesapproachtobasinwatersystemsmanagement• TanaBasinContext:StakeholderrealitiesandWISE-UPProject
emergingfindings• ReflectionsonBasin(EcosystemsServices,StakeholderPortfolioand
Objectives)• AboutWISE-UPProject(includingavideoclip)
Afternoon • IntroductiontoScenarios:Clarifyingtheconcept,purposeand
structureofWISE-UPtoClimatescenariocapacityexercises/workshops
• ScenarioScoping(temporalandspatial)• ScenariobuildingObjectives/PurposeandStakeholderScenario
Information/policyanddecisionmakingNeeds• TheDriversofBasinEcosystemsChanges
Day2Morning • KeynoteonESValuation(LucyEmerton)
• Landusechangeprojections(CIAT/ACCESS-conceptandpotentialapplicationsinanticipatorybasinplanning)
• DeepeningunderstandingandinteractionbetweenDriversofEcosystemsChange
• Thecriticaluncertainties• ThescenarioFramework• TheEnd-picture
Afternoon • Expandingtheplausiblescenarionarratives:
o Qualitativeo Quantitative
• TrackingalternativepathwaysanddecisionsandloopingtheESbenefitoutcomes.
Day3 Morning • Sequencingofbuiltinfrastructureinthebasin(Informedbythe
UoMschematic)• Usingthescenarios:
o Policyanddecisionmaking(basingovernance,combinationofbuilt/naturalinfrastructure,naturalinfrastructurebenefits)
o Stakeholderworkincludingbasinmanagement/useplanningo ConflictresolutionandEStrade-offs

ParticipatoryScenarioWorkshopReport-ACCESS
40
o FurtherWISE-UPtoClimatescenarioandsociallearningwork
• Sensitivityanalysis–trackinguncertaintiesandpolicydecisions Afternoon • ScenarioApplicationActionPlanningandFollow-up/Commitment
• ScenarioCommunicationStrategy• WorkshopClosure

ParticipatoryScenarioWorkshopReport-ACCESS
41
Annex 2: List of Participants No. NameofParticipants Institution1 JulieMulonga WetlandsInternational2 PeterMuli TARDA(Environmentalist)3 Eng.HenryMaina TARDA4 LeonardMuchiri TARDA(Forester)5 ElizabethDiego-Lusimba WRMA–CommunityProjectscoordinator
6 JacquelineMborokiWRMA-SubregionalManager-Murang'asubcatchment
7 LawrenceThooko WRMA-RegionalmanagerTanaCatchment8 DanielGichuki WRUA-UpperTana9 GilbertMaigacho CDA10 NelsonMutanda NDMA11 MonicaYator PDNK12 SammyBoit NIB13 NeslineOgwe NIB14 EngineerGinaliusNjiraini KENGEN15 MatthewsMurgor KENGEN–NRM16 EuniceJemutai AthiwaterservicesBoard
17 DamarisWairimu
Chiefofficer-Water,energy,forestry,environment,naturalresourcesandcooperativedevelopmentMurang'aCounty
18 DavidGitongaChiefofficer-water,environmentandSanitation-MeruCounty
19 NasraHanshiChiefOfficer-Environment,WildlifeandNaturalresources-Garissacounty
20 ElizabethWanja KenyaClimateChangeWorkingGroup21 Mr.SamuelMutisya CouncilofGovernorsrepresentative22 RichardRop CouncilofGovernorsrepresentative23 LucyEmerton BC324 EmmanuelObuobie CSIR25 RichardMulwa CASELAP,UoN26 SimonThuo MajinaUfanisi27 DrRwigiStephen MeteorologyDepartment,UoN28 BellOkello ETCEastAfrica29 WashingtonOchola ACCESS30 ChristineOmuombo ACCESS31 DanielOlago ACCESS

ParticipatoryScenarioWorkshopReport-ACCESS
42
Annex 3: Presentation Slides Annex 3a: Objectives and Workshop Context
23/11/15&
1&
WATER & & & &! & & & & INFRASTRUCTURE & & & &! & & & & ECOSYSTEMS &
WISE+UP&TO&CLIMATE&&
Par6cipatory&Scenarios&Workshop&&
Tana Basin – 17th to 19th November, 2015&&
D&E&M&O&N&S&T&R&A&T&I&O&N&&P&R&O&J&E&C&T&S&&
Goals and objectives (section 4.2.1) including Outputs (4.2.2)
Impact
(long term) Investment&in&and&opera6on&of&porFolios&of&
built&and&natural&
infrastructure&op6mised&for&CC&adapta6on&and&sustainable&development&&goals&for&the&water+food+energy&nexus
&
Outcome
(overarching project goal)
Adap6ve&capacity&increased&through&
recogni6on&and&inclusion&of&ecosystem&services&
provided&by&natural&
infrastructure&in&investment&
strategies&for&CC&adapta6on&and&
through&op6misa6on&with&built&
infrastructure&planning&and&&development&
Outputs
Gathering*data*and*
knowledge*to*improve*the*evidence*base**
*Genera6ng**new*tools*&*
skills**&
Understanding*trade9offs*in*infrastructure*por=olios*for*adapta6on*of*
water*management*to*climate*
change*(‘CC’)**
1. Tana&and&Volta&strategies/plans&for&CC&adapta6on&incorporate&op6misa6on&of&mixed&
porFolios&of&built&&&natural&water&infrastructure&at&
policy&level
2. Water&resource&assessments&for&CC&
adapta6on&integrate&natural&infrastructure
Eco+hydrological&Quan6fica6on&of&water+related&ecosystem&
services&in&water&planning&models&&
Economic&&&Comparison&of&economic&
outcomes&from&alternate&mixes&of&built&&&natural&infrastructure&
‘MOHS’&Iden6fica6on&of&
op6mised&porFolios&of&built&&&natural&water&infrastructure&for&
river&basins&&
3. BeUer&integra6on&in&policy&and&decision+making&by&water&ins6tu6ons&of&built&and&natural&infrastructure&choices&for&climate&change&
adapta6on
Poli6cal+economy&Analysis&of&&&&&&&&&pol+econ&
influences&on&decision&logics&of&stakeholders&&
4. User&needs&met&for&decision&making&in&govt&and&
basin&ins6tu6ons&and&among&mul6ple&&
stakeholders&who&are&nego6a6ng&choices
5. New&capaci6es&of&decision&makers,&technical&advisors,&researchers&and&&other&stakeholders&for&
integra6ng&natural&and&&built&water&infrastructure&components&in&CC&
adapta6on&
Inputs
*Ac6on**Learning*
with*stakeholders,*****to*strengthen*applica6ons*of*
evidence*and*tools*in*policy9making,*infrastructure*decisions*and*consensus9*building**
**
*Capacity***Building**
&*Communica6ons*in*learning*
communi6es*and*‘actor*spaces’*(see*
slide*below)**
Tana**and*Volta*river*basins*
2
Impact
(long-term) &
BAS&I&N&&&D&E&M&O&N&S&T&R&A&T&I&O&N&S&&
WISE-UP: working at the science-policy/institutional interface
Outputs as per indicators
&Ecosystems&more&understood&and&
valued&&
&The&concept&of&
‘natural&infrastructure’&
establishes&its&place&in&mixed&porJolios&in&water/river&and&CC&planning…&&
&&&
Models,&&valua6ons,&MOHS&and&poli6cal&economy&analysis&&
&
…from&field&and&community&to&na6onal&level&
Inputs
Outcome (overarching project goal)
Target groups and beneficiaries
Policy/decision+makers
Direct beneficiaries
Indirect beneficiaries
Stakeholders&in&dialogue&on&CC/water&
IFIs&and&banks&&
Researchers&and&research&networks&&&
Technical&advisors
Local&people&and&wider&public/society
Groups&benefi]ng&from&evidence/learning
&Facilitated&
exchanges&of&knowledge;&&good&interRdisciplinary&working&
&
INSTITUTIONS&and&POLICY&&
Encouraging*and*enabling*shiKs*in*mindsets*and**
changes*in*culture****(as*evidenced*in*language)*
‘Coali6ons*of*actors/*networks,*policy*forums,*media’**
SCIENCE&&&&& PRACTICE& 3
- to ‘achieve research into use’
Natural&Water&Infrastructure&
Aim&and&Objec6ves&
Skills&and&competencies&in&the&design&and&use&of&basin&scenarios&+&decision&making&and&planning&for&a&combina6on&of&built&and&natural&infrastructure&
Basic&concepts,&
principles&and&prac6cal&
applica6ons&
Apply&scenario&building&
approaches&and&tools&
Engage&stakeholders&
in&basin&infrastructural&development&planning&and&decision&making.&
Influence&decision&
making/policy&
Tana&Basin&Water&Scenarios:&Why?&
• Informed&ac6on&using&insights&into&the&scope&of&the&plausible&ac6ons&and&policies&
• Illustrate&the&role&of&human&ac6vi6es&(natural&infrastructure&and&major&investments)&in&shaping&the&ecosystems&services&and&the&link&among&issues&rela6ng&to&water&infrastructure.&
• Crea6ve&solu6ons&to&water&use&challenges&under&climate&change&and&a&set&of&interlinked&drivers&may&emerge&for&adap6ve&water&resources&management&

ParticipatoryScenarioWorkshopReport-ACCESS
43
Annex 3b: International Policy on Climate Change Adaptation and Mainstreaming Adaptation in Development Planning.
23/11/15&
2&
Using&the&Basin&Scenarios&– Aiding&in&recogni6on&of&“weak%signals”&of&change;&– Avoiding&being&caught&off&guard&–&“live%the%future%in%advance;”&
– Challenging&“mental%maps;”&– Understanding&the&basin&beUer,&and&make&beUer&decisions;&
– Raising&awareness;&– Tes6ng&strategies/investments&for&robustness&using&“what%if”&ques6ons;&
– Providing&a&common&language;&and&– S6mula6ng&discussion&and&crea6ve&thinking.&
Workshop&Theme&
“Learning%from%the%Future:%Alterna;ve%Scenario%Development%for%Basin%Management%of%Natural%
and%Built%Infrastructure%mix”&
1
INTERNATIONAL POLICY ON CLIMATE CHANGE ADAPTATION
& MAINSTREAMING ADAPTATION IN
DEVELOPMENT PLANNING. By
Eric O. Odada and Daniel O. Olago Director/Associate Director
African Collaborative Centre For Earth System Science (ACCESS) School of Physical Sciences
University of Nairobi Nairobi, Kenya
Presentation Outline • Policy Perspective • Key Impacts • Impacts Assessment • Mainstreaming Adaptation in
Development Planning • Role of NGOs and Governments
2
e.g stern commission
• Agriculture • Forestry • Natural Ecosystems and Wildlife • Water Resources • Fisheries • Human Settlements • Energy • Transport and Industry • Human Health • Air Quality and UV changes • Oceans and Coastal Zones • Seasonal snow cover and Ice
Key Impacts of Climate Change

ParticipatoryScenarioWorkshopReport-ACCESS
44
3
Most Important Changes for Agriculture
• Increased drought incidence associated with temperature rise and increased moisture loss.
• Aggravated weed problem and changes in crop quality due to CO2 effect.
• Increased pest depredation due to high C:N ratio and temperature.
• Changes in suitability of regions for particular crops.
Most Important Changes for Agriculture
• Impact on crop calendar
• Heat stress
• Increase in agricultural diseases
• Higher order effects including altered costs, risks, profitability leading to changes in rural employment, food security, exports and imports.
4
• Impact dependent on details of climate change, physiological adaptability of species, disease and pest susceptibility, and wildlife loss.
• Long lived so abrupt changes (0.10C per decade) reduce survival rate.
• Balance between stress changes and climate where changes are favourable.
• Managed forests demand high levels of investment but have potential to mitigate undesirable impacts.
Impacts on Forestry
Impacts on Natural Terrestrial Ecosystems
- Rate of change may exceed capacity of most
species and systems to change.
- Particularly sensitive species include:
* Those at edge or beyond optimal range
* Geographically localized
* Genetically localized
* Poor dispersers
5
Impacts on Natural Terrestrial Ecosystems
- Aggravation due to land-use change and
anthropogenic disturbance.
- Need to consider socioeconomic and
aesthetic benefits of biodiversity, e.g food,
fuel, medicine, material and income.
- Need to consider domestic water supply, irrigation, hydropower, navigation, industrial cooling, purification and amenity; and also different types of water bodies: * Rivers and water courses * Lakes and reservoirs * Aquifers and shallow ground waters * Wetlands
Impacts on Water Resources
6
- Most water resource schemes are designed to cope with particular extreme events e.g floods or droughts, so are sensitive to changes in their magnitude and frequency.
- Hydrological structures represent large investments with lengthy construction cycles and lifetimes which may span significant change.
Impacts on Water Resources
• Impact dependent on attributes of species and specific regional factors
• Most sensitive species will be those near their thermal limit.
• Wind is a key climatic variable through its influence on stratification and the nutrient- phytoplankton-zooplankton chain.
Impacts on Freshwater Fisheries

ParticipatoryScenarioWorkshopReport-ACCESS
45
7
Impact on Human Settlements • Most vulnerable are those exposed to natural
hazards, e.g low lying coastal or flood plains, in drought-prone regions, subject to landslides, severe wind storms and tropical cyclones.
Impact on Human Settlements
• Most vulnerable populations are in developing countries, in lower income groups, residents of
coastal lowlands and islands, populations in
semi-arid grasslands, and the urban poor.
• Climate change and sea level rise have the capability of causing large population
movements; e.g those in coastal lowlands and
small island nations.
8
• Global warming is expected to affect the availability of water resources and biomass, both major sources of energy in many developing countries.
• Loss of these elements may also jeapordise the supply of materials essential for human habitation and sustenance.
• Many industries in developing countries may find their competitive position eroded by climate-related changes in the availability of production resources: energy, water, food, timber, fibre and minerals.
Impacts on Energy, Transport and Industry
• Major health consequences are possible, especially in large urban areas, due to changes in water and food availability, and problems due to spreading of infections and heat stress.
• Radically altered patterns of vector-borne and viral diseases due to climate changes may lead to range shifts towards higher latitudes, thus putting large populations at risk.
• Such changes could cause large migrations of people leading to disruption of settlement pattern and social instability.
Impacts on Human Health
9
How Healthy is the Science of Impact Assessment?
- In its infancy
- Limited sectoral scope
- Narrow single discipline perspective
- Adaptations seldom considered
What Actions are Needed to remedy the Situation?
- Assembly of relevant inventories
- Integrated monitoring to quantify sensitivities
- Multidisciplinary impact research programmes
- National and regional action
Mainstreaming Adaptation in Development Planning
• Raise the profile of climate change adaptation in the national policy agenda and mobilize political commitment to mainstreaming climate change adaptation in national development processes;
• Integrate the climate change adaptation into national and sub-national development strategies and plans, and key sectoral plans and their implementation;
• Create fiscal and other policy incentives, and increase public budgetary allocations, for sound and equitable climate change adaptation.
10
• Improve institutional capacities to mainstream climate change adaptation in development planning and implementation, using participatory approaches where appropriate;
• Develop and strengthen capacities for the formulation and implementation of laws and regulations that curb activities that could lead to climate change;
• Remove barriers that limit the poor’s access to and economic benefits of climate change e.g ecosystem services and equitable access to water and land resources, particularly among the rural poor and women.
Mainstreaming Adaptation in Development Planning
Roles of NGOs and Governments • Assessing local adaptation needs and
services; • Environmental governance and capacity
development; • Local delivery platforms for climate change
adaptation; • Supporting local and indigenous SMEs for
climate change adaptation; • Local and community-based adaptation to
climate change.

ParticipatoryScenarioWorkshopReport-ACCESS
46
Annex 3c: Understanding Natural and Build-infrastructure mix and ecosystems services approach
23/11/15&
1&
WATER & & & &! & & & & INFRASTRUCTURE & & & &! & & & & ECOSYSTEMS &
WISE-UP to Climate Water Infrastructure Solutions from Ecosystem Services Underpinning Climate Resilient Policies and Programmes
Chris,ne&Omuombo&
African(Collabora-ve(Center(for(Earth(System(Science(
WATER & & & &! & & & & INFRASTRUCTURE & & & &! & & & & ECOSYSTEMS &
Rationale for Water Infrastructure
In&many&developing&countries&• Inability&to&predict&and&manage&rainfall/runoff&
is&a&key&contributor&to&high&levels&of&food&
insecurity&and&poverty&&
&
The&response&&• Water&infrastructure&is&a&cornerstone&of&
economic&development&and&water&security&&
• World&Bank:&&water&resource&projects&provide&the&basis&for&broad®ional&development,&
with&“significant(direct(and(indirect(benefits(for(poor(people”&&
Ecosystems&are&infrastructure&–&&
&
part&of&the&“stock(of(facili-es,(services(and(installa-ons(needed(for(the(func-oning(of(a(society(and(economy.”&
INTERNATIONAL UNION FOR CONSERVATION OF NATURE
flood(regula-on(water(purifica-on(
water(provision(water(storage(
C sequestration coastal defence
water conveyance cultural services
fisheries(provision(
coastal(defence(
Facility Built Natural
Storage • reservoir • upland soils • lakes • aquifers
Conveyance • canals • rivers Flood regulation • levees
• dams • wetlands • floodplains
Water filtration • filtration plant • soils & aquifers • wetland
Coastal protection
• sea walls • breakwaters
• mangroves & reefs • barrier islands
Nature as Water Infrastructure

ParticipatoryScenarioWorkshopReport-ACCESS
47
23/11/15&
2&
INTERNATIONAL UNION FOR CONSERVATION OF NATURE
Impact Vulnerability Infrastructure Ecosystem services
• drought • flood • storms • melting ice • sea-level rise
• food security • disaster • water scarcity • health &
pollution • coastal erosion
• storage • supply • flood control • disaster
protection • coastal defence
• lakes & upland soils • floodplains • wetlands • groundwater • mangroves &
sediments
Water & Climate Change
WATER & & & &! & & & & INFRASTRUCTURE & & & &! & & & & ECOSYSTEMS &
WISE-UP – The Opportunity GOAL:&Adap,ve&capacity&for&climate&change&increased&through&iden,fica,on&in&decision&making&and&consensus&building&of&porOolios&of&built&infrastructure&and&the&ecosystem&services&provided&by&natural&infrastructure&that&will&op,mise&investments&and&benefits&from&the&development&of&water&infrastructure&Natural basin
Crops
Hydropower
Industrial Regulation of water balance
Erosion control
Climate regulation Soil
formation
Nutrient cycling
Recreation
Crops Hydropower
Industrial Regulation of water balance
Erosion control
Climate regulation Soil
formation
Nutrient cycling
Recreation
Intensively utilized basin
Crops Hydropower
Industrial Regulation of water balance
Erosion control
Climate regulation Soil
formation
Nutrient cycling
Recreation
Multifunctional Climate-Resilient “balanced” basin
WATER & & & &! & & & & INFRASTRUCTURE & & & &! & & & & ECOSYSTEMS &
• Basin&management&meets&mul,ple&goals&• solu,ons&for&water&mgt&&&adapta,on&• economic&development,&equity,&ecosystems&
• Key&ins,tu,ons&&&stakeholders&able&to&iden,fy&&&nego,ate&tradeToffs&
• Investment&packages&iden,fied&
• Knowledge&&&tools&meet&users’&needs&
• New&capaci,es&at&all&levels&to&access&and&apply&evidence&
• Adap,ve&capaci,es&&in&place&&
WISE-UP – Outcomes
WATER & & & &! & & & & INFRASTRUCTURE & & & &! & & & & ECOSYSTEMS &
Tana(&(Volta(Basins(
• data,&tools&&&skills&• coTlearning&• trialling&tools&&for&mixing&built&&&
natural&infrastructure&in&planning&&&decisions&
• applica,ons&to&investment&choices&
• mul,Tstakeholder&dialogues&
• adapta,on&ac,ons&
&
Project Implementation - Demonstrations
WATER & & & &! & & & & INFRASTRUCTURE & & & &! & & & & ECOSYSTEMS &
Project Implementation - Learning
Reflec,on&
Ques,ons&for&
analysis&
Use&&&analyse&informa,on&
Op,ons&iden,fied&and&
debated&&
Decision&made&–&NI/BI&
Plans&Strategies&Ac,ons&
WATER & & & &! & & & & INFRASTRUCTURE & & & &! & & & & ECOSYSTEMS &
• decisionTmakers&
• development&agents&
• local&actors&
&
Project Implementation – Capacity Building

ParticipatoryScenarioWorkshopReport-ACCESS
48
23/11/15&
3&
• slide&9:&basin&picture&plus&3D&op,misa,on&&
Science & Innovation
• Eco-hydrology for built & natural infrastructure
• Economic valuation & benefits
• Multi-objective optimisation
• Political-economy of water infrastructure
INTERNATIONAL UNION FOR CONSERVATION OF NATURE
The Role of Stakeholders
• Co-learning
• Shared vision modelling
• Set the demand for information & assessments
• Challenge
• Collaboration in applications
WATER & & & &! & & & & INFRASTRUCTURE & & & &! & & & & ECOSYSTEMS &
Thank&you&

ParticipatoryScenarioWorkshopReport-ACCESS
49
Annex 3d: Ecosystems Service Valuation
����������
�
����������
���������������������� ��������������� ����������������������������������������� ���������� �����������
������������� �����������������������������
�� ������ �����
��������� ��������������������������
������������������������������ !""#$���������������%�����&�����������'�������(�)������*���+�&���������,-(
-����.�+�/(+��0���+�/(����1��+�/(�2���+�'(+�1����+��(+�%�����+�3(+�������+�4(+�5����+�'(+�675����+�/(8(+�*�����+�9(+�/��:��+�/(1(+�'���+�*(������(� �������3��� ;<<=$�>��� ���������������0������������� ���������������������(�5����?@=��!#?�!A"(
���������������7������������� ����
3����� ��� ����������$
8���� B'C�������D�$
6��������� ??+!"" @(?@;
-����� ?+;"! ;!(#A@
>����������� ;+<"" ?(@;?
>����������� !+<## "(@<E
1���D��������� ?+@<@ "(<"A
>���������D����� �� ;A# ;(AE@
'�����D����������� ;A# ?(!?;
��:��D� �� !"" ;(=""
-������ ;+E"" "(;!@
>��� #;+A!# ??(!A@
1�����F��� ���� 8����� B'C�����D�$
����������������� !"(;#
������5>2* ;(=;
B������6���: �������� "(;E
-������������� ?(?<
���������������� E(?E,������������������ !;(#E
%���������������� ;;(;!
>����� ;A"(@=
���������������� �� ?(?@'�����������F������������� @(?!
3���� ���� ;(EA
-�������G������� ;(=A
>��� !?@(;=
4��:����+��(+�����:�+�%(+�-�������� ����4����+�,(� !";;$�>���>�������������8�������������� ���+�>����������������������2����3���:�+�
����������2���+�4����(���:��8������3�����-����������'������+�4�����(
���������������2����-������
�����������������������������(�!""#(���������������%�����&�����������'�������(�)������*���+�&���������,-(

ParticipatoryScenarioWorkshopReport-ACCESS
50
����������
�
H ����������+� ���������� �� ���������������������� ������������������ ������������ �$������F�������� ����
H �������� ������������������ ����������������� �� ����� ������ �������������
H ������������ ������������ ������������������������������F�����������������
H ������������+� ��������� ����� ����������������������������������������������+�������� ���� ������ �����
H �������� �����������������������������+������� ������������������ �����F��������
����������������� �������
����������������������������������������������������������������
���� ������
���������������� ���������F����������� I ����+�����+������+������+� �������+� ��(��J
����G�����
������ ������
������ ��������
������� ��:��������
��������� ��������
���������� ��������
����
���
����
����
����
���
��
��
������������������������ �����
�����������������F��� ���������������
*�
�����
���
'�
����
'���
���
��F
�/�
����
����
'�
����
-���
��
'�
����
���������������� ����� ������ �������������� ������������������� ���������� ����
����������� �������������������������������+�
�������������������
,����8�����
�������������������� ��������������� ���������� �����
�������� ��������������������������� ����� ������� �����
����������� ��������� �������������� ���������������
����������������
)������8�����
������������� ����������� ��������������� �����������
������ �������� ������������������������ �������������������
����������������������
������� ������������������������������������������� ���
�������������� ����+� ������������������������:��������
6�����8�����
B��
�8��
���
���������� ����������� ���������������� ������� �����
��������� �������� ��� ���������������� �����
�������� ������ �������������������������+� ��������� ���
������������������������������� ���
���������8�����
5��
�B��
�8�
����
������������� ���� ���������� ������� �������
������������1������ '(+�/����� �(+�3���� '(+�4������(+���-�� ���� �(+��������� /(+�1���� %(�����*(����3��:� !";"$�-��������'��������������3������������������������5����!"""�5���:(�2����������������������-���������+�,1��� ������(
2��������� ����������� �� ���������������� �������� ����
K������ �
K������ �
������
�(�(������������������ �������+������� �������������+� ��������������� ����
���������� ������(�(����������������� ������ ������������� �����������
�����������
�(�(�� ��������������������� ����+���:������� �������� �������+� �������������� �����

ParticipatoryScenarioWorkshopReport-ACCESS
51
����������
�
�� ��������������������������������� �������������������� &�.��������+�-������$
� ;<="������������� ��������������������� ���� ���� ��������������
� �� ����� ���:����� ������� ������������������ ������������;#"+"""���������:+����������� ���������
� ��������������� ����������������������� ������������������ �������������
� ���������������������2�����������,� ��������3��:������� ����������� �������������� ��:������������������������������������G����������%)*-��� ����������� ����L
&�.��������2���������
E+"""�:�!
M�!+"""�:�!
@+"""�:�!
��:������
��������������
!;#��?D�<"N
���������� ����2�������� ��
����������������
C;;(!A�����C#�����D�
-������������ �������� �������
���������������������
C�=(=A�����A(#�;
5�������� ����3���������� ���
#�����*�����:������
C"(#�����D� C;�����D� C;(#�����D� C!�����D� C!(#�����D�
*���� 2������� -��� 6��
���������������� �!��������"���� ������� � ����������������#����$���������� �%���&������ �����'���(�&������������')�������*����������+�������,-+.��/���
������������������� �������������������������������������������������������������� �� ����������0�-12�3�������4��������5�����������������������������������������������
������� ���������������� ����� ������;<=!��O�B'C�;""�����
������������������������������������F�������������������� 5�:� ���+�B�����$
� 5�:� ��� '�������������������� ����������� F����������� �����������������
� �������������������� ����� �������������� F������������ ����� ��4�������-����������� ��������������
� ������������+� ���� �������������������������������+��������������������������
� ���������������� ������������������.�����������������������������5�:� ��� ������������ ������ .�������������������������������������� ��������.���L
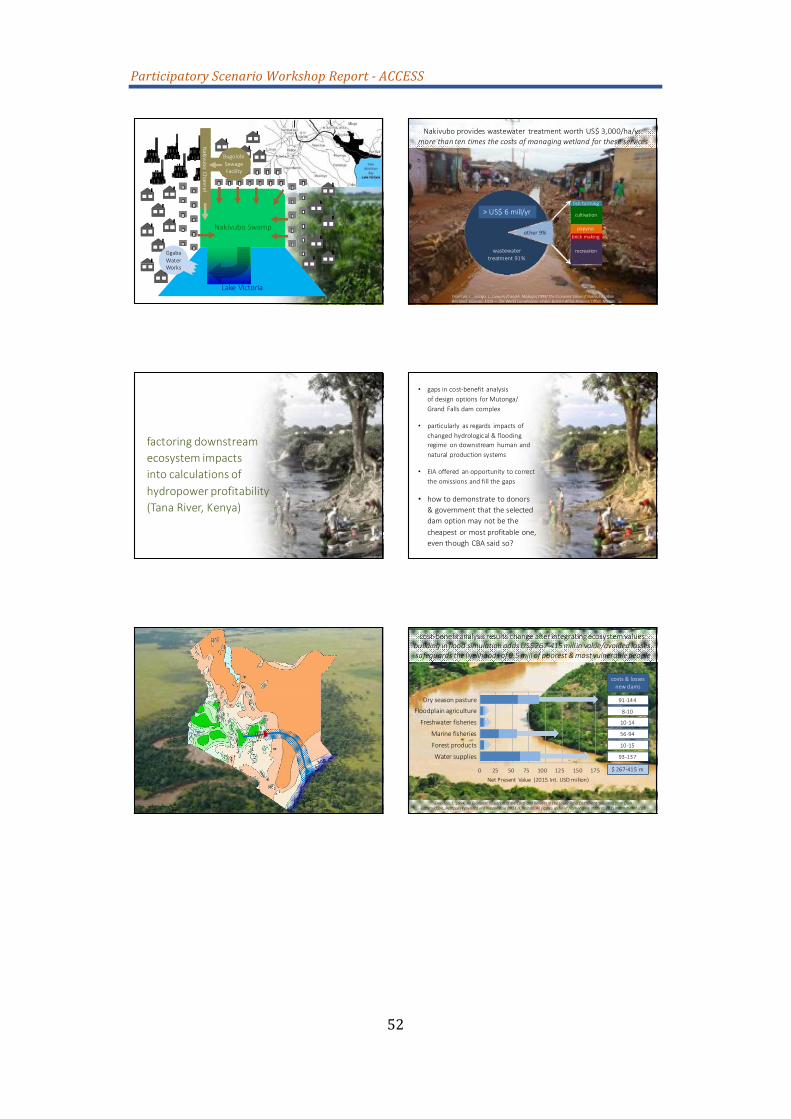
ParticipatoryScenarioWorkshopReport-ACCESS
52
����������
�
5�:� ��� '����
��:��8�����
5�:� ����-������
3�������'�����2������
1�����&���&�:�
������������,����������������$����6��7��� �8999 �%�����������:����� �.;����� -���'������-����,-+.�< %���'�����+���������-����������6 ����&������= �����.�����
5�:� ��� �� ������������� ����������B'C�?+"""D��D������������������������������� ������������ �����������������
�������������<;N
����<N
�����������
���� ����
���������:� ��:���
�������
P�B'C�A�����D�
����������������������������������������������������������������������� >����/� �+�4����$
� ������������������� �������������������������� ���������D1����2����������������
� ���������� ��������� ������������������������������F���������������� �������������������������������������������
� �)��������� ������������ ������������������������������������
� ��������������� ��������F��� ���������������������������������������������������������������������+�� ���������-3���������L
C;A<��
#<
A
=
!<
=
A!
�����F����������������������F�������
��������
C�!A=�E;#��
<;�;EE
@�;"
;"�;E
#A�<E
;"�;#
<?�;?=
������������������������������������������������������� ����������������� ������������������-12��>?5�83������������4���������������� ������������������������ ���3������� ���������@���������������������
�����������899���6���������:������� �����+�������A�� ����������������%�+��������&�������� ����B��+�����������6���������C���������.�����C���� ���D ,+6��.�������6��� �������������� ����������������������83�,��������-1B�
,��������������
2������������������
2���������������
��������������
2����������
&�����������
5��*����� 8����� !";#�)�(�B',��������$
"� !# #" =# ;"" ;!# ;#" ;=#

ParticipatoryScenarioWorkshopReport-ACCESS
53
����������
�
�����������������������F����������
��������������������������������>����3����
� ����������������������+� ����������������������������� ������������������� ���������������������
� �������������� ��� �������������������������� ���������� �����+����������� ������+����������������� ����������������������������
� J�������������������������F��� ����
� J������������������+������������
� J�� ������������� ���� ����
������������������������
���
���
�
�������������������������������������D
� �����������������
�������������������������������������D
� �����������������
���������������������� �������������������������������������������������������������� '����3����+�������$
� ���������������+����������F�������������������� �������������� ������������������������������� �������������������
� ������������������� ����� ���������������� ������������������������������+� ������������ ������������������� ����F������� ������
� -�����'�� ��������� -��$D���������3�������������� ���$���������������� �+��G�������F�������������������� ������������ ������������$
� �������������� ������������������ ������ ��������������������������������������������������L
���������������� ������������������� ���
��������������
��������������
���� �������������
���� �������������
����������������
����������������
����������������� �������� ��������������������
����������������� �������� ��������������������
�����������������������������
�������������
����������
������
�����������������������������������
�����������������������������������
����
������
���� �� ���� ��
!���"�"�������
!���"�"�������
������
� �
������������ ���������������
�����
������������ ���������������
�����

ParticipatoryScenarioWorkshopReport-ACCESS
54
����������
# ��� �������������������������������� �� $����%� ���$�� ��������$���"��%���
# ���� �������� ����������"���&$�%������'��������"����
# ���������� �����������(���$�� ���'������������� $�������������%��
# ������������������������� � ������$�����������'�(���$��� � ��������
# ������ ����������%) ������'��� � �����������*
���� ����� '�������"���� ����� '�������"
���� ����� '���������� ��%���*���� ����� '���������� ��%���*
���������� '���������� (��������������� '���������� (�����
�����(��� ������'������� �""�������(��� ������'������� �""��
�����(��� ����"��������(��� ����"���
�����(������� ����������(������� �����
�����"�"��������'������� �����"�"��������'�������
� �� � ��������$�����'�
�����
� �� � ��(�����
�����������"���
� �� � ������� �������������"���
��� ��" ��$�
�� ���� �����
'����*�� �(�
��� ��" ��$�
�� ���� �����
'����*�� �(�
� �� ������
��(����
'��
�"�����
� �� ������
��(����
'��
�"����� � �� � ���
�������'��������%�
����'����(����� �� ���������������(����� �
���$���&$����$�"����'��� ���� �
�����������������"�'���%���*�
"���������
�����������������"�'���%���*�"���������
���� � ������'���%�� ���
���������"�"�������%���
��������������(�
���� ������'����������$�"����������
��$��������%��
����'�������%�����(�
"����������(��� ���
�����"�����������
�����+��(�!";?(�'�����������������������������/�����(�'����������������>���������������=(�)�������������������������B���6���������������(�/�����������������&����3��:�����1� ��������������������>'�)���������+�%Q,/6-�-�����+�3����
-������������������+����B�� ������������������������-�������,� �����������������+��>'�)���������+�*������:(
-��
���
� ��
���
����
����
B'C
�����
$
�;
"
;
!
?
E
!";" !"?"!";# !"!" !"!#
3�B���3�B���3�B����������
26/������26/���� ���1/�-�� ���1/�-�� ��
'����3�������������������� F���������������� -�� ���������������������������������B'C?�E(#���������� ��3�B�� ������!"�����
�����+��(� !";?$�'�����������������������������/�����(�'����������������>���������������=(�)�������������������������B���6���������������(�/�����������������&����3��:�����1� ��������������������>'�)���������+�%Q,/6-�-�����+�3����
-������������������+����B�� ������������������������-�������,� �����������������+��>'�)���������+�*������:(
+,+ +,- !,-�,- !,+
.��� ������ �
!,+
+ �+ /+�+ -+
0����"�������
!+ 1+
+ +,+! +,�++,+1 +,+2
���*�������""��
+,+/
+ - !+�+ �-
3���� ����(����
3����������'�(�������4�"�'��������5� ��"����������((��
6����� �'��"���7�������'�����
4������� '�������
���*� � '��"���4������� '�������
�������F������������:������������������� ������R�� ���������������D�������� ������ ������������� ������B'C�;(@���������5*8$
�����+��(� !";?$�'�����������������������������/�����(�'����������������>���������������=(�)������������������������B���6���������������(�/�����������������&����3��:�����1� ��������������������>'�)���������+�%Q,/6-�-�����+�3����
-������������������+����B�� ������������������������-�������,� �����������������+��>'�)���������+�*������:(
"
;"
!"
?"
E"
#"
B',
������
���
����
����
��
'�������������
��
%������
������
3��:�������������
)��������������
������D%����1����2������)����������
������������������� 4�������+� 4�����+�1���+��������+� 4������$
�����S�������
�����S�����1����2����
�����S��������S�����1����2����
�����S��������S�%����1����2�����
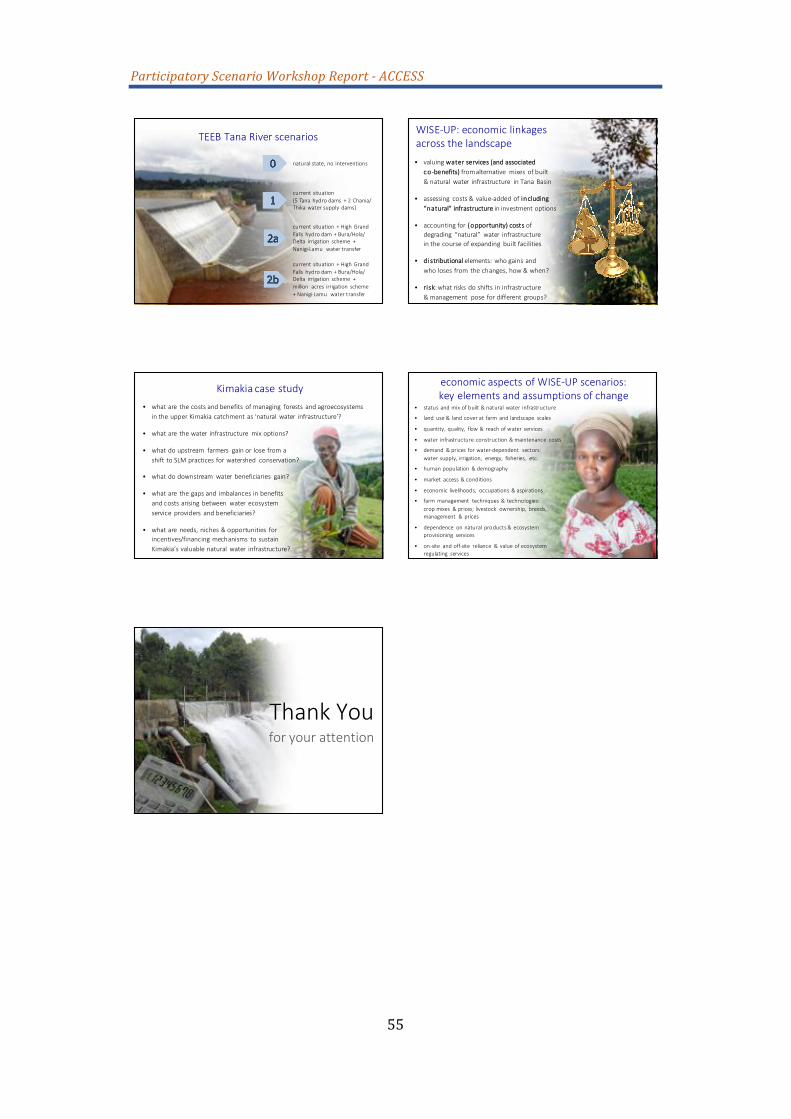
ParticipatoryScenarioWorkshopReport-ACCESS
55
����������
>��3�>����/� ����������
���������+������� ������
������������� #�>�������������� S�!�-�����D�>��:� ����������� ����$
������������� S�%����1����2����� ���������S�3��D%���D�,���� �������� ������� S�5����������� ���������
������������� S�%����1����2����� ���������S�3��D%���D�,���� �������� ������� S��������� ����� �������� �������S�5����������� ���������
&)'��B*��������������:�����������������������
H ������������� ����� ������������������������$����������� �� ��������������F������� ���� ���������� ���>����3����
H ���������� �����F� ����������������������������������������� ����� ������������
H ������������� ��������$������������������ �������� ���� ����������������������������������� ��������������
H ����������� ������������������������������������� ����������+�����F�����L
H ��:��������:����������� �������������F����������� ���������������� �����L
4���:������������H ������� �������������������� ������������ ������ �����������������
�����������4���:�� �������� ���T������ ���� ���������7L
H ������� ������� ���������� ����������L
H �������������� ������ ����������������������� ��'���������������������� ����� ����L
H ���������������� ����������������� ����L
H ������� ������������ ��������������������������������������������� ���� ����������� ������ ����� ����������������L�
H ������������+��������F������������ ��������� ��D�������������������� ���������4���:��7� �������������� ���� ���������L
�������������������&)'��B*�����������:�����������������������������������
H ���������������������F����������� ���������
H ����� ����F� ������� �������� �������������� ������
H G�����+�G�����+� �����F������������� �� ����
H ���� ���������� ����������F������������ ����
H �������F������� ���������������� ����������� ������+��������+� �����+� ��������+� ��(�
H ���������������� F����������
H ��:�� �������F����������
H ��������� �� ��������+� �����������F����������
H �������������� �����G����F� ����������������������� F������U� �� ����:� ��������+� �����+����������� F������
H ����������� ����������������F������������ ��������� �� ����
H ������� ������������ �������� F� ����� ��������������������� �� ����
>���:�Q���������������

ParticipatoryScenarioWorkshopReport-ACCESS
56
Annex 3e: Tana TEEB presentation
1
THE ECONOMICS OF ECOSYSTEMS AND BIODIVERSITY: TANA RIVER BASIN
WISE%UP,)Norfolk,)Nairobi)
Richard)Mulwa)
! The Tana River Basin covers 21% of the country’s total land mass and is home to 18% of the country’s population.
! It contributes over 50% of Kenya’s river discharge to the Western Indian Ocean
TEEB:%TANA)
1. The Tana Basin
Ecosystems in the Tana River Basin
! Forests ! Arid and semiarid lands ! Mountain vegetation ! Freshwaters and Wetlands ! Marine and Coastal areas ! Agro systems
These provide different ecosystem goods and
services (EGS)
! Basin supplies 80% of the drinking water for Kenya's capital, Nairobi
! Primary source of hydro-electric power
(70% of Kenya’s hydroelectric power) through the river's many dams
! Fisheries and agriculture in the basin provide a major source of food and employment
! biodiversity hotspot and is home to
several endangered species
2. Ecosystems Goods and Services
TEEB:%TANA)
! The EGS can be classified into:
! Provisioning services: include freshwater fisheries, biomass fuel, grazing, agriculture
! Regulatory services: include flood
control , water storage and purification
! Supportive services: such as nursery and breeding for fish e.g. in Mangoves
! Cultural/spiritual services : such as recreation and tourism
2. Ecosystems Goods and Services
TEEB:%TANA)
! However, …
! Flow of benefits is threatened by burgeoning ecological and socio-economic threats, fundamentally affecting the provision of valuable ecosystem goods and services.
! The upper catchment: More land is allocated to farming
! Poor farming practices have led to soil erosion and pollution by agro-chemicals.
! Potential over-abstraction of water: Plan to use water for drinking water in Nairobi and Lamu port/city (under development)
! Various forms of mining ! A proposal for the expansion of
intensive and irrigated agriculture (for biofuels and food crops) in the basin and energy through additional dams
2. Ecosystem Goods and Services
SO??
! What is the impact of identified threats and drivers on ecosystem goods service provision?
! What are the economic values of different ecosystem services?
! These questions can be understood from the TEEB framework and using a choice of economic approaches and methods
TEEB:%TANA)
2. Ecosystem Goods and Services

ParticipatoryScenarioWorkshopReport-ACCESS
57
2
3. Analysis Framework
Source: Daily, (1997; 2009) TEEB:%TANA)
TEEB framework
! Decisions: The decisions we make e.g. increased farming, over abstraction of water
! These in turn influence the
hydrological regime of the river
! T h i s i n t u r n a f f e c t s t h e ecosystems and the provision of EGS identified earlier, either positively or negatively
! Quantification of these benefits and values should inform policies and interventions for Swamp management
! These will in turn inform decisions to be taken such as conservation, which in turn influence the ecosystem processes
TEEB:%TANA)
3. Analysis Framework
! The 5 hydropower stations and the planned construction of the High Grand Falls (HGF) provide various valuable functions for the people in and around the Tana River Basin
! Benefits of these infrastructural works include flood regulation, hydropower, irrigation and supply of potable water.
! However, the reduced availability of water downstream (reduced flooding) is expected to have negative effects on local ecosystem service provision
4. Impact of Drivers on Ecosystem Service Provision
! There is need to link benefits provided by ecosystem services
to the Tana river regime ! Benefits of these infrastructural works
include flood regulation, hydropower, irrigation and supply of potable water.
! However, the reduced availability of water downstream (reduced flooding) is expected to have negative effects on local ecosystem service provision
4. Impact of Drivers on Ecosystem Service Provision
! There link is created using a dose response functions
! They are used to assess the effects of changes in quality/quantity of ecosystem services on the profitability/size of related productions/output
4. Impact of Drivers on Ecosystem Service Provision
! There link is created using a dose response functions
! y represents the rice production in tons
! x is the cultivated area in hectares
! z is the amount of days above the flooding threshold.
4. Impact of Drivers on Ecosystem Service Provision
! Dose-response function flood recession farming ! T h e h y d r o l o g i c a l
parameter is the number o f d a y s a b o v e t h e flooding threshold at Garissa. The threshold is a consecutive discharge of over 300 m³/s for at least seven days.
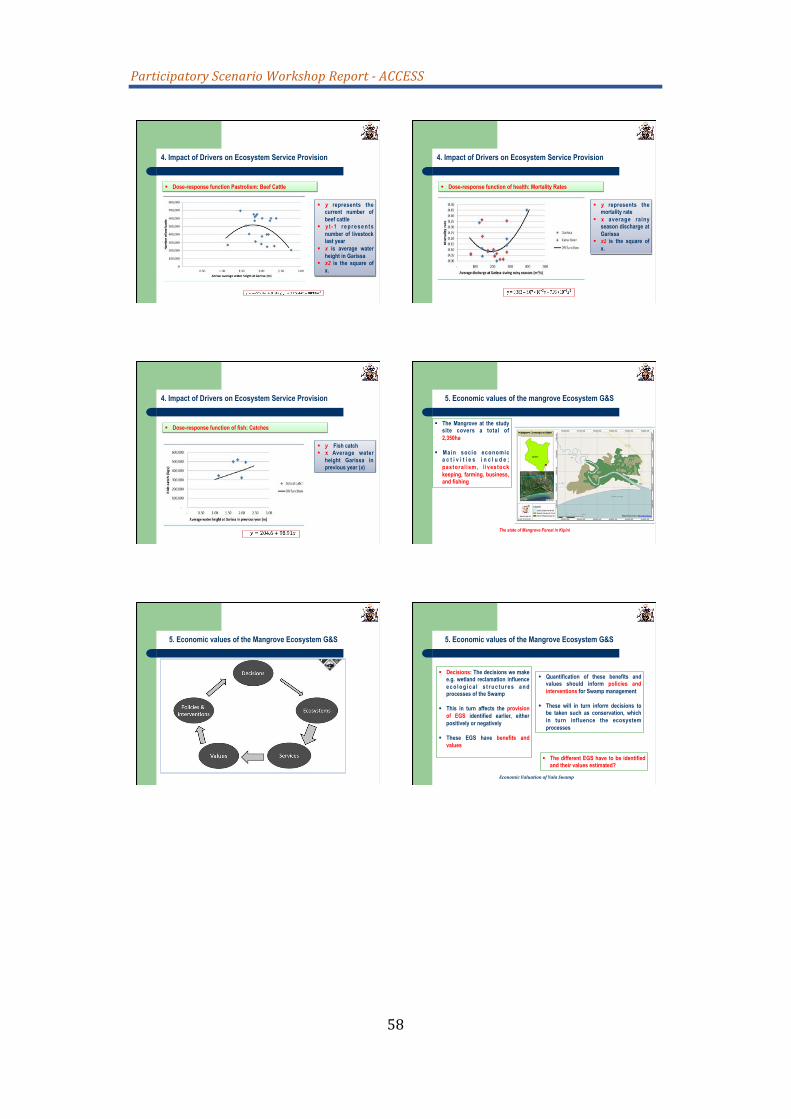
ParticipatoryScenarioWorkshopReport-ACCESS
58
3
! y represents the current number of beef cattle
! y t - 1 r e p r e s e n t s number of livestock last year
! x is average water height in Garissa
! x2 is the square of x.
4. Impact of Drivers on Ecosystem Service Provision
! Dose-response function Pastrolism: Beef Cattle
! y represents the mortality rate
! x average rainy season discharge at Garissa
! x2 is the square of x.
4. Impact of Drivers on Ecosystem Service Provision
! Dose-response function of health: Mortality Rates
! y Fish catch ! x Average water
height Garissa in previous year (x)
4. Impact of Drivers on Ecosystem Service Provision
! Dose-response function of fish: Catches
! The Mangrove at the study site covers a total of 2,350ha
! Main socio economic a c t i v i t i e s i n c l u d e ; pastoral ism, l ivestock keeping, farming, business, and fishing
5. Economic values of the mangrove Ecosystem G&S
The state of Mangrove Forest in Kipini
5. Economic values of the Mangrove Ecosystem G&S
%Economic%Valuation%of%Yala%Swamp)
! Decisions: The decisions we make e.g. wetland reclamation influence e c o l o g i c a l s t r u c t u r e s a n d processes of the Swamp
! This in turn affects the provision of EGS identified earlier, either positively or negatively
! These EGS have benefits and values
! Quantification of these benefits and values should inform policies and interventions for Swamp management
! These will in turn inform decisions to be taken such as conservation, which in turn influence the ecosystem processes
! The different EGS have to be identified and their values estimated?
5. Economic values of the Mangrove Ecosystem G&S

ParticipatoryScenarioWorkshopReport-ACCESS
59
4
%Economic%Valuation%of%Yala%Swamp)
6. Methods: Quantifying Economic Values
Types of Value in TEV Approach Source: Brander et al. (2010) %Economic%Valuation%of%Yala%Swamp)
6. Methods: Identification of EGS
The study identified 4 EGS with Direct use values and 4 with Indirect use values
EGS with Direct Use Values Mangrove Area EGS with Indirect Use Values Mangrove Area
Fisheries production 1645 Flood Protection 2350
Building material 400 Water quality regulation 2350
Firewood 400 Tourism and Recreation 2350
Honey production 235 Nursery and Breeding for Fish 2350
EGS with Direct Use Values
! Market based Approach: ! Methods:
• Market price method
EGS with Indirect Use Values
! Stated preference Approach:
! Method • Choice experiment
6. Methods: Quantifying Economic Values
Primary data: Quota sampling of 405 respondents from 6 villages the using the Mangroves
Secondary data • These were used for Estimating direct
and indirect use values of the Mangroves
7. Data
8a. Direct Use Value of the Mangroves
8a. Direct Use Value of the Mangroves
Ecosystem Goods! Amount Harvested/Year!
Price (Ksh/unit)!
Annual Value (Ksh.)!
Value (Ksh/ha)!
Value (USD/ha)!
Fisheries! 791,338 Kg! 100! 79,133,800! 48,105! 559!
Building Material! 5,131 poles! 100! 513,100! 1284! 15!
Firewood! 9,149 bundles! 100! 914900! 2,287! 27!
Honey! 178 litres! 300! 53,400! 227! 2.60!
Exchange rate • 1USD= 85.6 Ksh

ParticipatoryScenarioWorkshopReport-ACCESS
60
5
8b. Indirect Use Value of the Mangroves
8b. Indirect Use Value of the Mangroves
Wage rate • 1 day= Ksh 300
8b. Indirect Use Value of the Mangroves
Societal WTP
8c. Total Economic Value of the Mangrove: Summary
! The aggregated annual amount adds up to Ksh 213 million or US$2.5 million
! Average value of Kshs 90,638 per ha/year
! US$1 ,054 per ha/year
8c. Total Economic Value of the Mangrove: Summary
! These values can be used in making conservation or conversion decisions
! This would require CBA

ParticipatoryScenarioWorkshopReport-ACCESS
61
Annex 3f: Sequencing of infrastructure in the Tana basin
Sequencing)water)infrastructure)in)the)Tana)Basin:)What)does)the)Na8onal)Water)Master)
Plan)say?)
WATER&& & &! & & & & INFRASTRUCTURE&& & &! & & & &ECOSYSTEMS&
‘WISE-UP to Climate’ Participatory Scenarios workshop 17-19th November 2015, Norfolk, Nairobi )
Final Report Development and Management Plans Main Report Part F: Tana Catchment Area Chapter 4
Nippon Koei Co., Ltd. MF - 9 The Development of the National Water Master Plan 2030
Projected Population (TCA) (Unit: million persons)
Year Urban population Rural Population Total 2010 1.04 4.69 5.73 2030 6.34 4.03 10.37
Source: JICA Study Team, based on the data of Census 2009
Currently, the piped water supply covers 58% of the urban population of TCA. The ratio is relatively high. Large scale urban water supply system developments have been under implementation to meet future water demand. It can be said that water supply system development is well advanced in TCA.
Table 4.2.1 shows the current situations of the seven urban water service providers (WSPs) and seventeen rural WSPs, of which total water supply capacity is 232,000 m3/day. According to the Performance Report of Kenya’s Water Services, No.4, 2011, the registered 11 urban WSPs and 18 rural WSPs carry out water supply services, and the total water supply capacity is 240,358 m3/day for a service population of 1.41 million The average water supply volume per person is 170 L/p/day including non-revenue water (NRW). It is higher than the national average of urban water supply volume of 65 L/p/day including NRW (36 L/p/day excluding NRW). Out of the 11 urban WSPs, four WSPs have records of more than 50% of NRW.
It should be noted that the water supply capacity of the rural WSPs is 130,972 m3/day, which is larger than the capacity of the urban WSPs.
4.2.2 Development Strategy
TCA is divided into three areas, namely, the upper Tana, arid area, and the other area for urban water supply system (UWSS) planning considering the characteristics of these three areas.
Characteristics of the Areas (TCA)
Catchment Areas Features Tana River Upstream
Out of the 19 urban centres in TCA, there are 15 urban centres in this area. It is estimated that the population is around 60% of the total population in 2030. There are many available water sources, such as surface water of the rivers from Mt. Kenya. The water supply development plan in this area will be considered in the existing plan on surface water use.
Arid Area Out of the 3 urban centres in the arid area, there are two urban centres supplied by Tana River in this area. Ground water is used for rural water supply system in the arid area, while surface water is used for the water supply system in the area along Tana River.
Other Area This is outside the abovementioned two areas. There are four urban centres, which plan to use surface water on a priority basis. As for the rural water supply, it is planned to use groundwater on a priority basis.
Source: JICA Study Team
Based on the overall concept mentioned in Section 7.3 of the Main Report Part A, UWSS are planned for 23 urban centres (UCs) in TCA. The water supply capacity required for UWSS in TCA is 543,000 m3/day in 2030 against the current water supply capacity (including those under construction) which is 106,000 m3/day. Therefore, an additional capacity of 437,000 m3/day is to be developed by 2030 through the following projects:
Development and Management Plans Final Report Chapter 4 Main Report Part F: Tana Catchment Area
The Development of MF - 14 Nippon Koei Co., Ltd. the National Water Master Plan 2030
b) In order to strengthen the agricultural sector in TCA, irrigation should be expanded in rainfed agricultural areas in arid and semi-arid lands to increase agricultural productivity and production; and
c) In order to utilise available water resources efficiently for the maximisation of irrigation development, water-saving irrigation should be introduced to improve water productivity in all irrigation areas.
4.4.3 Proposed Irrigation Development Plan
As a result of the water balance study for each sub-basin in TCA, maximum irrigation development areas under the application of water-saving irrigation methods were estimated as summarised below.
Proposed Irrigation Areas in 2030 (TCA) (Unit: ha)
Category
Existing Irrigation Area in 2010
New Irrigation Area in 2030 Total
Irrigation Area
in 2030
Surface Water Irrigation Ground- water
Irrigation (Borehole)
Water Harvesting Irrigation
(Small Dam/Water Pan)
Total New
Irrigation Area
Weir Dam Total
Large-scale 11,200 4,961 131,000 135,961 0 0 135,961 147,161 Small-scale 14,823 0 0 0 10,054 5,730 15,784 30,607Private 38,402 0 0 0 10,054 0 10,054 48,456Total 64,425 4,961 131,000 135,961 20,108 5,730 161,799 226,224
Source: JICA Study Team (Ref. Sectoral Report (E), Section 3.4)
Against the provisional target of new irrigation development area of 482,450 ha (distributed to TCA for the national target of 1.2 million ha) mentioned in Section 7.5 of the Main Report Part A, the possible new irrigation development area comes to 161,799 ha (decrease of 320,651 ha) even with maximum water resources development presented in section 4.6 due to limitation of available water resources.
As for large-scale irrigation projects (more than 500 ha), 15 projects proposed by the government authorities and one projects proposed in this study listed in Table 7.5.1 were taken up for the water balance study, and four projects were selected for implementation by 2030 as suitable projects to contribute to the maximisation of irrigation area in TCA as shown in Table 4.4.1 and their locations are shown in Figure 4.4.1. They are listed as below.
a) High Grand Falls Dam Irrigation Project (106,000 ha, High Grand Falls multipurpose dam);
b) Hola Pump Irrigation Extension Project (800 ha, Weir and pump);
c) Hola Irrigation Greater Extension Project (4,161 ha, Weir); and
d) Kora Dam Irrigation Project (25,000 ha, Kora multipurpose dam).
The irrigation water demands necessary for the abovementioned new irrigation projects were estimated at 2,546 MCM/year for surface irrigation area and 151 MCM/year for groundwater irrigation area as shown in Table 6.5.7 in the Main Report Part A.
WATER&& & &! & & & & INFRASTRUCTURE&& & &! & & & &ECOSYSTEMS&
Final Report Development and Management Plans Main Report Part F: Tana Catchment Area Chapter 4
Nippon Koei Co., Ltd. MF - 17 The Development of the National Water Master Plan 2030
estimated in TCA for 2010 (present) are 5,858 MCM/year for surface water and 675 MCM/year for groundwater.
The present water demands in TCA were estimated to be 891 MCM/year based on the population of 5.73 million and an irrigation area of 64,425 ha as presented in Chapter 3. The existing water resources structures and facilities except for direct intake facilities from rivers that satisfy the present water demands are listed below. The locations of the dams and water transfers are shown in Figure 4.6.1.
Existing Water Resources Structures and Facilities (TCA) Existing Structures/
Facilities Name of Structures/
Facilities Purposes Notes
Dam SasumuaDam Domestic water supply to Nairobi Storage volume of 16 MCM Dam Thika Dam Domestic water supply to Nairobi Storage volume of 69 MCM Dam Masinga Dam Hydropower (40 MW), domestic water supply Storage volume of 1,402 MCMDam Kamburu Dam Hydropower (94 MW) Storage volume of 110 MCMDam Gitaru Dam Hydropower (225 MW) Storage volume of 20 MCM Dam Kindaruma Dam Hydropower (44 MW) Storage volume of 16 MCM Dam Kiambere Dam Hydropower (168 MW), domestic water
supply Storage volume of 585 MCM
Intra-basin Water Transfer
From Kiambere Dam
Domestic water supply to Mwingi 0.5 MCM/year
Intra-basin Water Transfer
From Masinga Dam Domestic water supply to Kitui 3 MCM/year
Inter-basin Water Transfer
From Sasumua Dam Domestic water supply to Nairobi 21 MCM/year
Inter-basin Water Transfer
From Thika Dam Domestic water supply to Nairobi 161 MCM/year
Small Dam/Water Pan
Total No. = 622 Domestic and livestock water supply mainly, partly for irrigation
Total storage volume of 26.9 MCM, average volume per facility of 43,000 m3
Borehole Total No. = 1,587 Domestic water supply mainly Total abstraction volume of 68 MCM/year
Source: JICA Study Team based on NWMP (1992) and data from MWI, WRMA, NWCPC, KenGen, TARDA, and AWSB
The total storage volume of existing water resources structures and facilities in TCA is approximately 2,277 MCM summing the volumes of dams and small dams/ water pans listed in the above table. Out of the 26 existing dams nationwide as described in Chapter 2 of the Sectoral Report (G), there are seven large-scale dams, among which the Sasumua and Thika dams are for the domestic water supply in Nairobi, and the Masinga, Kamburu, Gitaru, Kindaruma, and Kiambere dams are for hydropower generation purposes (the Masinga and Kiambere dams also have the function to supply domestic water).
The Umaa Dam is under construction and will be for domestic water supply (with a storage volume of 1 MCM). The detailed designs of Thiba Dam (irrigation water supply), High Grand Falls Dam (hydropower, domestic and irrigation water supply, and flood control), and Yatta Dam (domestic water supply) have been completed. The water resources structures that are under planning and/or design in the catchment area are Maragua 4, Karimenu 2, and Thika 3A dams (for domestic water supply), and Komu Transfer Scheme to supply domestic water to Nairobi.
There are 622 small dams/water pans with total storage volume of 26.9 MCM, which is 1% of the total storage volume in the catchment area. There are a total of 1,587 boreholes in the catchment area,
WATER&& & &! & & & & INFRASTRUCTURE&& & &! & & & &ECOSYSTEMS&
Final Report Development and Management Plans Main Report Part F: Tana Catchment Area Chapter 4
Nippon Koei Co., Ltd. MF - 21 The Development of the National Water Master Plan 2030
Proposed Dams (TCA) (Unit: MCM)
Name of Dams
Storage Volume for Domestic/ Industrial
Storage Volume for Irrigation
Storage Volume for
Hydropower
Flood Control Space
Total Storage Volume
Remarks
Maragua 4 Dam 33.0 0.0 0.0 0.0 33.0 * F/S and M/P ongoing (AWSB)Ndiara Dam 12.0 0.0 0.0 0.0 12.0 Chania-B Dam 49.0 0.0 0.0 0.0 49.0 Karimenu 2 Dam 14.0 0.0 0.0 0.0 14.0 * F/S and M/P ongoing (AWSB)Thika 3A Dam 13.0 0.0 0.0 0.0 13.0 * F/S and M/P ongoing (AWSB)Yatta Dam 35.0 0.0 0.0 0.0 35.0 * D/D completed (NWCPC)
Thiba Dam 0.0 11.2 0.0 0.0 11.2 * Flagship Project, D/D completed (NIB)
High Grand Falls Dam (291.0) (3,251.0) 3,542.0 1,458.0 5,000.0 * Flagship Project, D/D
completed (MORDA) Kora Dam 0.0 537.0 0.0 0.0 537.0 Flagship Project Mutuni Dam 17.0 0.0 0.0 0.0 17.0 Kitimui Dam 8.0 0.0 0.0 0.0 8.0
Total 181.0 548.2 3,542.0 1,458.0 5,729.2 Note: * Total storage volumes planned or designed by the government.
D/D=Detailed design Source: JICA Study Team, based on information from relevant government agencies
The development plan is formulated for domestic and industrial water supply to ensure the supply for 10-year probable drought and irrigation water supply for 5-year probable drought as stated in Section 7.1 of the Main Report Part A. The storage volumes determined are the volume of the second largest estimated in the water balance study for 20 years for domestic and industrial use, and that of the fourth largest for irrigation use.
The respective total storage volumes of Maragua 4, Karimenu 2, Thika 3A, Yatta, Thiba and High Grand Falls dams followed the completed detailed designs, or ongoing feasibility studies and master plans as mentioned in the above table.
The storage volume of hydropower use for High Grand Falls Dam was estimated by summing the volumes of estimated domestic/industrial and irrigation use. Water for domestic/industrial and irrigation use will be supplied from High Grand Falls Dam after hydropower generation.
The flood control space of High Grand Falls Dam was estimated by subtracting the volume of hydropower use from the total storage volume proposed byMORDA, as a space in which floods can be stored.
Table 4.6.6 presents details of the proposed dams, and Figure 4.6.1 shows the location of the proposed dams.
2) Water Transfers
The proposed amounts of intra-basin water transfers from Masinga Dam to Kitui and from Kiambere Dam to Mwingi as mentioned below were derived from the water balance study as the amount to meet domestic water demands in Kitui and Mwingi. The amount of intra-basin water transfer from High Grand Falls Dam to Lamu followed the transfer amount designed by MORDA. The amount of inter-basin water transfer from TCA to Nairobi followed designs of AWSB.
WATER&& & &! & & & & INFRASTRUCTURE&& & &! & & & &ECOSYSTEMS&
Development and Management Plans Final Report Chapter 4 Main Report Part F: Tana Catchment Area
The Development of MF - 22 Nippon Koei Co., Ltd. the National Water Master Plan 2030
Proposed Water/Transfers (TCA) (Unit: MCM/year)
Structures Amount for Domestic Total Water Transfer Amount Remarks
Intra-basin Water Transfer from Masinga Dam to Kitui (Extension) 23 23
Intra-basin Waer Transfer from Kiambere Dam to Mwingi (Extension) 2 2
Intra-basin Water Transfer from High Grand Falls Dam to Lamu 69 69 (equivalent to 189,000
m3/day), MORDA Inter-basin Water Transfer from TCA to Nairobi in ACA (Extension) 168 168 (AWSB)
Source: JICA Study Team based on M/P and F/S by AWSB (2012) and MORDA
Table 4.6.6 presents details of the proposed water transfers, and Figure 4.6.1 shows the location of the proposed water transfers.
3) Small Dams/Water Pans
The proposed storage volumes of small dams/water pans for domestic use were estimated based on water deficits calculated after the supply of available water from dams and boreholes. The storage volumes for irrigation use were estimated considering the conditions of the irrigation subsector.
The proposed storage volumes of small dams/water pans for livestock, wildlife and fisheries are volumes of their water demands for 2030.
Proposed Small Dams/Water Pans (TCA) (Unit: MCM)
Structures Volume for Domestic
Volume for Irrigation
Volume for Livestock
Volume for Wildlife/ Fisheries
Total Storage Volume
Remarks
Small Dam/Water Pan 26 39 69 17 151
Total No. of small dams/ water pans = 3,020
Note: Excluding the storage volume of the existing small dams and water pans of 27 MCM. Source: JICA Study Team
The total number of the small dams / water pans of 3,020 was estimated by applying the volume per dam/ pan of 50,000 m3 as the minimum capacity following the volume applied in NWMP (1992) and assumed based on the existing volumes.
4) Boreholes
The proposed groundwater abstraction volumes of boreholes for domestic and industrial uses were estimated by applying assumed percentages to the total water demands. The percentages of 5%, 50%, 100% and 50% were assumed for urban domestic, large rural domestic, small rural domestic and industrial water supply respectively as explained in Sub-section 4.3.1 (1) of the Sectoral Report (G). In the case that some water deficits were calculated in the surface water balance study and only groundwater was available, the deficits were added to the groundwater abstraction volumes estimated above.
WATER&& & &! & & & & INFRASTRUCTURE&& & &! & & & &ECOSYSTEMS&
G - F - 15
Source: JICA
Study Team
THE D
EVELO
PMEN
T OF
THE N
ATION
AL W
ATER M
ASTER
PLAN
2030 Figure 4.3.11 Surface W
ater Balance Study Model
(TCA
) JA
PAN
INTER
NATIO
NA
L CO
OPER
ATION
AG
ENC
Y
EX -F -73
Proposed Development Plans
Water Supply Development Plan Urban Water Supply Development (23 Urban Centers) 1) Rehabilitation (15 UC) 106,000 m3/day 2) Expansion (14 UC) 349,000 m3/day 3) New Construction (8 UC) 88,000 m3/day 4) Service Population 4.90 million Rural Water Supply (16 Counties) 1) Large Scale 211,000 m3/day 2) Small Scale 145,000 m3/day 3) Target Population 4.96 million Sanitation Development Plan Sewerage Development (18 Urban Centers) 1) Rehabilitation (6 UC) 32,000 m3/day 2) Expansion (6 UC) 118,000 m3/day 3) New Construction (12 UC) 248,000 m3/day 4) Service Population 5.24 million On-site Sanitation (16 Counties) 1) Installation of Proper On-site Sanitation Facilities
by Individual or Communities 2) Target Population 6.13 million Irrigation Development Plan Large Scale Irrigation Area 1) Large Scale Irrigation 135,961 ha
(4 Projects) 2) Small Scale Irrigation 15,784 ha
(15 Counties) 3) Private Sector Irrigation 10,054 ha
(15 Counties) Hydropower Development Plan Hydropower Development 1) Kindaruma Hydropower Upgrade 0+32 MW 2) High Grand Falls
Multipurpose Dam Project
Stage 1: 500 MW Stage 2: +200 MW
3) Karura Hydropower Project 090 MW Water Resources Development Plan 1) Storage Dams 11 nos. (5,729 MCM) 2) Small Storage Dams and Pans 3,020 nos.
(151 MCM) 3) Boreholes: 1,440 nos.
(144 MCM/year) 4) Inter-basin Transfer
(from Tana CA to Nairobi, Ext.) 168 MCM/year
5) Intra-basin Transfer (from Masinga Dam to Kitui, Ext.)
23 MCM/year
6) Intra-basin Transfer (from Kiambere Dam to Mwingi, Ext.)
2 MCM/year
7) Intra-basin Transfer (from Tana R. to Lamu)
69 MCM/year
LEGEND OF PLANS Dam(Existing) Water Transfer (Existing) Irrigation Potential Area
Note: See a close-up view shown in Figure 19.1.14. Source: JICA Study Team
THE DEVELOPMENT OF THE NATIONAL WATER MASTER PLAN 2030
Figure 19.1.9 Proposed Development Plans for Tana Catchment Area JAPAN INTERNATIONAL COOPERATION AGENCY
P
WATER&& & &! & & & & INFRASTRUCTURE&& & &! & & & &ECOSYSTEMS&
MF - F - 2
Source: JICA
Study Team T
HE
DE
VE
LOPM
EN
T OF
TH
E N
ATIO
NA
L WAT
ER
MA
STE
R PL
AN
2030 Figure 4.4.1 Proposed Irrigation D
evelopment Plan
(TC
A)
JAPA
N IN
TERN
ATION
AL C
OO
PERATIO
N A
GEN
CY
MF - F - 3
Dam (Existing)
Dam (Proposed)
Water Transfer (Existing)
Water Transfer (Proposed)
Proposed Hydropower Development
Existing Hydropower Station
LEGEND
Source: JICA
Study Team
TH
E D
EV
ELO
PME
NT O
F T
HE
NAT
ION
AL W
ATE
R M
AST
ER
PLA
N 2030
Figure 4.5.1 E
xisting Hydropow
er Station and Proposed H
ydropower D
evelopment Plan
(TC
A)
JAPA
N IN
TERN
ATION
AL C
OO
PERATIO
N A
GEN
CY
MF - F - 4
Reference Point
Dam (Existing)
Dam (Proposed)
Water Transfer (Existing)
Water Transfer (Proposed)
LEGEND
Source: JICA
Study Team
TH
E D
EV
ELO
PME
NT O
F T
HE
NAT
ION
AL W
ATE
R M
AST
ER
PLA
N 2030
Figure 4.6.1 E
xisting and Proposed Dam
s and Water
Transfer Facilities (TC
A)
JAPA
N IN
TERN
ATION
AL C
OO
PERATIO
N A
GEN
CY

ParticipatoryScenarioWorkshopReport-ACCESS
62
EX -F -73
Proposed Development Plans
Water Supply Development Plan Urban Water Supply Development (23 Urban Centers) 1) Rehabilitation (15 UC) 106,000 m3/day 2) Expansion (14 UC) 349,000 m3/day 3) New Construction (8 UC) 88,000 m3/day 4) Service Population 4.90 million Rural Water Supply (16 Counties) 1) Large Scale 211,000 m3/day 2) Small Scale 145,000 m3/day 3) Target Population 4.96 million Sanitation Development Plan Sewerage Development (18 Urban Centers) 1) Rehabilitation (6 UC) 32,000 m3/day 2) Expansion (6 UC) 118,000 m3/day 3) New Construction (12 UC) 248,000 m3/day 4) Service Population 5.24 million On-site Sanitation (16 Counties) 1) Installation of Proper On-site Sanitation Facilities
by Individual or Communities 2) Target Population 6.13 million Irrigation Development Plan Large Scale Irrigation Area 1) Large Scale Irrigation 135,961 ha
(4 Projects) 2) Small Scale Irrigation 15,784 ha
(15 Counties) 3) Private Sector Irrigation 10,054 ha
(15 Counties) Hydropower Development Plan Hydropower Development 1) Kindaruma Hydropower Upgrade 0+32 MW 2) High Grand Falls
Multipurpose Dam Project
Stage 1: 500 MW Stage 2: +200 MW
3) Karura Hydropower Project 090 MW Water Resources Development Plan 1) Storage Dams 11 nos. (5,729 MCM) 2) Small Storage Dams and Pans 3,020 nos.
(151 MCM) 3) Boreholes: 1,440 nos.
(144 MCM/year) 4) Inter-basin Transfer
(from Tana CA to Nairobi, Ext.) 168 MCM/year
5) Intra-basin Transfer (from Masinga Dam to Kitui, Ext.)
23 MCM/year
6) Intra-basin Transfer (from Kiambere Dam to Mwingi, Ext.)
2 MCM/year
7) Intra-basin Transfer (from Tana R. to Lamu)
69 MCM/year
LEGEND OF PLANS Dam(Existing) Water Transfer (Existing) Irrigation Potential Area
Note: See a close-up view shown in Figure 19.1.14. Source: JICA Study Team
THE DEVELOPMENT OF THE NATIONAL WATER MASTER PLAN 2030
Figure 19.1.9 Proposed Development Plans for Tana Catchment Area JAPAN INTERNATIONAL COOPERATION AGENCY
P
WATER&& & &! & & & & INFRASTRUCTURE&& & &! & & & &ECOSYSTEMS&
MF - F - 2
Source: JICA
Study Team TH
E DEV
ELOPM
ENT O
F TH
E NATIO
NA
L WATER
MA
STER PLA
N 2030
Figure 4.4.1 Proposed Irrigation D
evelopment Plan
(TCA
) JA
PAN
INTER
NATIO
NA
L CO
OPER
ATION
AG
ENC
Y
MF - F - 3
Dam (Existing)
Dam (Proposed)
Water Transfer (Existing)
Water Transfer (Proposed)
Proposed Hydropower Development
Existing Hydropower Station
LEGEND
Source: JICA
Study Team
THE D
EVELO
PMEN
T OF
THE N
ATION
AL W
ATER M
ASTER
PLAN
2030 Figure 4.5.1 Existing H
ydropower Station and
Proposed Hydropow
er Developm
ent Plan(TC
A)
JAPA
N IN
TERN
ATION
AL C
OO
PERATIO
N A
GEN
CY
MF - F - 4
Reference Point
Dam (Existing)
Dam (Proposed)
Water Transfer (Existing)
Water Transfer (Proposed)
LEGEND
Source: JICA
Study Team
THE D
EVELO
PMEN
T OF
THE N
ATION
AL W
ATER M
ASTER
PLAN
2030 Figure 4.6.1 Existing and Proposed D
ams and W
ater Transfer Facilities (TC
A)
JAPA
N IN
TERN
ATION
AL C
OO
PERATIO
N A
GEN
CY

ParticipatoryScenarioWorkshopReport-ACCESS
63
Annex 4: Workshop Evaluation Form This questionnaire seeks your feed on the planning, processes and outputs of the WISE-UP to Climate Participatory Scenario Building Workshop. Your cooperation in completing this questionnaire will be greatly appreciated. The information you provide will be useful in evaluating the output of the workshop and improving future WISE-UP workshops. A Background Information
Gender Organization Sector (e.g. water, forestry, agriculture, environment)
� Female � Male
B Workshop Objectives and Outputs
In general, I would rate the workshop activities as being
On balance would you consider the workshop objectives to have been achieved?
� Excellent � Good � Average � Fair � Poor
� Yes, Fully � Yes, Partially � No
The following are the main workshop objectives, please rate their level of achievement in your opinion
WORKSHOP OBJECT Not Achieved at
All
Partially Achieved
Fully Achieved
1. Explain basic concepts and principles for scenario development for basin water infrastructure management
2. Apply different approaches and tools for scenario generation
3. Use participatory scenario development approach to engage stakeholders in joint ecosystems services and basin infrastructural development planning and decision making (Shared vision planning).
4. Influence decision making/policy using information and lessons from alternative futures exploration on basin infrastructure management
5. Make informed decisions on basin water infrastructure planning and action using selected WISE-UP to Climate data and tools
C. Strengths of the Participatory Workshop List what you consider as the three main strengths of the meeting
1.
2.
3.

ParticipatoryScenarioWorkshopReport-ACCESS
64
F. Weaknesses of the workshop List what you consider as the three main areas to consider for improvement in the workshop
1.
2.
3. G Workshop Features Features (Please rate the level of your happiness with these meeting aspects)
Poor Fair Good Very Good
Time Management � � � � Workshop Facilitation � � � � Hotel/Venue & Accommodation � � � � House Keeping & Logistics � � � � Stakeholder Participation � � � � Pre-workshop Planning & Organization � � � � Workshop Background Materials � � � � Other (Specify ________________________)
� � � �
Other (Specify_________________________)
� � � �
Other (Specify _________________________)
� � � �
Other (Specify _________________________)
� � � �
H How do you rate the level change in your skill/ competency with respect to the following aspects of scenario building covered in the workshop
Non- Improved
Uncertain Improved fairly
Improved Greatly
Scenario exercise planning and scoping
� � � �
Drivers of water infrastructure change
� � � �
Determining critical uncertainties
� � � �
Developing scenario framework
� � � �
Developing scenario narratives
� � � �
Exploring policies, trade-offs and water use decisions
� � � �
Engaging stakeholders � � � � Communicating scenarios for basin water infrastructure planning
� � � �

ParticipatoryScenarioWorkshopReport-ACCESS
65
H Other General Comments about the Workshop (Please comment freely about the meeting)
I How can the Skills learnt be widely shared (Please suggest ways to ensure the further capacity is built)