Participation, effort, and harvest in the sport fish ... · PDF fileParticipation, Effort, and...
88
Fishery Data Series No. 16-02 Participation, Effort, and Harvest in the Sport Fish Business/Guide Licensing and Logbook Programs, 2014 by Bob Powers and Dora Sigurdsson January 2016 Alaska Department of Fish and Game Divisions of Sport Fish and Commercial Fisheries
-
Upload
hoangthuan -
Category
Documents
-
view
222 -
download
2
Transcript of Participation, effort, and harvest in the sport fish ... · PDF fileParticipation, Effort, and...

Fishery Data Series No. 16-02
Participation, Effort, and Harvest in the Sport Fish Business/Guide Licensing and Logbook Programs, 2014
by
Bob Powers
and
Dora Sigurdsson
January 2016
Alaska Department of Fish and Game Divisions of Sport Fish and Commercial Fisheries
ADF&G
Report Revisions
This report was amended on September 1, 2016. Two changes were made: 1. The table in Appendix E (page 42) was updated to reflect values from 2014 data. The previously-published version of this table contained values from 2013 data. 1. The table in Appendix F (page 44) was updated to reflect values from 2014 data. The previously-published version of this table contained values from 2013 data.
idgill
Sticky Note
Completed set by idgill
Symbols and Abbreviations The following symbols and abbreviations, and others approved for the Système International d'Unités (SI), are used without definition in the following reports by the Divisions of Sport Fish and of Commercial Fisheries: Fishery Manuscripts, Fishery Data Series Reports, Fishery Management Reports, and Special Publications. All others, including deviations from definitions listed below, are noted in the text at first mention, as well as in the titles or footnotes of tables, and in figure or figure captions. Weights and measures (metric) Centimeter cm deciliter dL gram g hectare ha kilogram kg kilometer km liter L meter m milliliter mL millimeter mm Weights and measures (English) cubic feet per second ft3/s foot ft gallon gal inch in mile mi nautical mile nmi ounce oz pound lb quart qt yard yd Time and temperature day d degrees Celsius °C degrees Fahrenheit °F degrees kelvin K hour h minute min second s Physics and chemistry all atomic symbols alternating current AC ampere A calorie cal direct current DC hertz Hz horsepower hp hydrogen ion activity pH (negative log of) parts per million ppm parts per thousand ppt, ‰ volts V watts W
General Alaska Administrative Code AAC all commonly accepted abbreviations e.g., Mr., Mrs.,
AM, PM, etc. all commonly accepted professional titles e.g., Dr., Ph.D., R.N., etc. at @ compass directions:
east E north N south S west W
copyright corporate suffixes:
Company Co. Corporation Corp. Incorporated Inc. Limited Ltd.
District of Columbia D.C. et alii (and others) et al. et cetera (and so forth) etc. exempli gratia (for example) e.g. Federal Information Code FIC id est (that is) i.e. latitude or longitude lat or long monetary symbols (U.S.) $, ¢ months (tables and figures): first three letters Jan,...,Dec registered trademark trademark United States (adjective) U.S. United States of America (noun) USA U.S.C. United States
Code U.S. state use two-letter
abbreviations (e.g., AK, WA)
Mathematics, statistics all standard mathematical signs, symbols and abbreviations alternate hypothesis HA base of natural logarithm e catch per unit effort CPUE coefficient of variation CV common test statistics (F, t, χ2, etc.) confidence interval CI correlation coefficient (multiple) R correlation coefficient (simple) r covariance cov degree (angular ) ° degrees of freedom df expected value E greater than > greater than or equal to ≥ harvest per unit effort HPUE less than < less than or equal to ≤ logarithm (natural) ln logarithm (base 10) log logarithm (specify base) log2, etc. minute (angular) ' not significant NS null hypothesis HO percent % probability P probability of a type I error (rejection of the null hypothesis when true) α probability of a type II error (acceptance of the null hypothesis when false) β second (angular) " standard deviation SD standard error SE variance population Var sample var

FISHERY DATA SERIES NO. 16-02
PARTICIPATION, EFFORT, AND HARVEST IN THE SPORT FISH BUSINESS/GUIDE LICENSING AND LOGBOOK PROGRAMS, 2014
by
Bob Powers
and
Dora Sigurdsson
Alaska Department of Fish and Game Division of Sport Fish, Research and Technical Services 333 Raspberry Road, Anchorage, Alaska, 99518-1599
January 2016
ADF&G Fishery Data Series was established in 1987 for the publication of Division of Sport Fish technically oriented results for a single project or group of closely related projects, and in 2004 became a joint divisional series with the Division of Commercial Fisheries. Fishery Data Series reports are intended for fishery and other technical professionals and are available through the Alaska State Library and on the Internet: http://www.adfg.alaska.gov/sf/publications/. This publication has undergone editorial and peer review.
Bob Powers and Dora Sigurdsson, Alaska Department of Fish and Game, Division of Sport Fish, Research and Technical Services,
333 Raspberry Road, Anchorage, AK 99518-1599, USA
This document should be cited as follows: Powers, B., and D. Sigurdsson. 2016. Participation, effort, and harvest in the sport fish business/guide licensing and
logbook programs, 2014. Alaska Department of Fish and Game, Fishery Data Series No. 16-02, Anchorage.
The Alaska Department of Fish and Game (ADF&G) administers all programs and activities free from discrimination based on race, color, national origin, age, sex, religion, marital status, pregnancy, parenthood, or disability. The department administers all programs and activities in compliance with Title VI of the Civil Rights Act of 1964, Section 504 of the Rehabilitation Act of 1973, Title II of the Americans with Disabilities Act (ADA) of 1990, the Age Discrimination Act of 1975, and Title IX of the Education Amendments of 1972.
If you believe you have been discriminated against in any program, activity, or facility please write: ADF&G ADA Coordinator, P.O. Box 115526, Juneau, AK 99811-5526
U.S. Fish and Wildlife Service, 4401 N. Fairfax Drive, MS 2042, Arlington, VA 22203 Office of Equal Opportunity, U.S. Department of the Interior, 1849 C Street NW MS 5230, Washington DC 20240
The department’s ADA Coordinator can be reached via phone at the following numbers: (VOICE) 907-465-6077, (Statewide Telecommunication Device for the Deaf) 1-800-478-3648,
(Juneau TDD) 907-465-3646, or (FAX) 907-465-6078
For information on alternative formats and questions on this publication, please contact: ADF&G Division of Sport Fish, Research and Technical Services, 333 Raspberry Road, Anchorage AK 99518 (907) 267-2375.

TABLE OF CONTENTS Page
LIST OF TABLES......................................................................................................................................................... ii
LIST OF FIGURES ....................................................................................................................................................... ii
LIST OF APPENDICES ..............................................................................................................................................iii
ABSTRACT .................................................................................................................................................................. 1
BACKGROUND ........................................................................................................................................................... 1
Guide and Business Registration and Licensing ............................................................................................................ 1 Logbooks ....................................................................................................................................................................... 2 Vessel Registration ........................................................................................................................................................ 5 Verification of Logbook Harvest Data .......................................................................................................................... 5 METHODS .................................................................................................................................................................... 5
Guide and Business Licensing ....................................................................................................................................... 5 Logbook Data Collection ............................................................................................................................................... 6
Saltwater Logbook .................................................................................................................................................... 7 Freshwater Logbook ................................................................................................................................................. 8 Vessel Registration ................................................................................................................................................... 9
Logbook Outreach, Validation, and Verification .......................................................................................................... 9 Outreach .................................................................................................................................................................... 9 Validation ............................................................................................................................................................... 10
RESULTS .................................................................................................................................................................... 12
Guide and Business Licensing ..................................................................................................................................... 12 Vessels ......................................................................................................................................................................... 15
Saltwater ................................................................................................................................................................. 15 Freshwater .............................................................................................................................................................. 16
Trips ............................................................................................................................................................................. 16 Saltwater ................................................................................................................................................................. 16 Freshwater .............................................................................................................................................................. 17
Logbook Trip Effort and Harvest ................................................................................................................................ 17 Saltwater ...................................................................................................................................................................... 18 Freshwater ................................................................................................................................................................... 19 DISCUSSION .............................................................................................................................................................. 21
Guide and Business Licensing ..................................................................................................................................... 21 Logbooks ..................................................................................................................................................................... 21
Consideration of an Electronic Reporting Option ................................................................................................... 22 Verification of Logbook Harvest Data ................................................................................................................... 23
ACKNOWLEDGEMENTS ......................................................................................................................................... 23
REFERENCES CITED ............................................................................................................................................... 24
APPENDIX A. SPORT FISH BUSINESS OWNER/GUIDE LICENSE APPLICATION......................................... 25
APPENDIX B. SALTWATER LOGBOOK FORM ................................................................................................... 29
APPENDIX C. FRESHWATER LOGBOOK FORMS .............................................................................................. 33
APPENDIX D. VESSEL REGISTRATION FORMS, DECALS, AND TAGS ......................................................... 37
APPENDIX E. SALTWATER EDITING RESULTS ................................................................................................. 41
i

TABLE OF CONTENTS (Continued) Page
APPENDIX F. FRESHWATER EDITING RESULTS .............................................................................................. 43
APPENDIX G. ELECTRONIC REPORTING SURVEY ........................................................................................... 45
APPENDIX H. FRESHWATER LOGBOOK SUMMARIES BY AREA AND SITE ............................................... 49
APPENDIX I. SALTWATER LOGBOOK SUMMARIES BY AREA AND PORT OF OFFLOADING ................. 71
LIST OF TABLES Table Page 1. Division of Sport Fish regions and management areas. .................................................................................. 3 2. Number of licensed businesses and guides by region, 2009–2014. ............................................................... 13 3. Number of active saltwater businesses and guides by region, 2009–2014. ................................................... 14 4. Number of active freshwater businesses and guides by region, 2009–2014. ................................................ 14 5. Number of registered and active saltwater vessels by region, 2009–2014. ................................................... 15 6. Number of active saltwater vessels that made at least one trip in each target category, by region, 2009–
2014. .............................................................................................................................................................. 15 7. Number of registered freshwater vessels by year and region, 2009–2014. ................................................... 16 8. Number of saltwater trips by targeted species by region, 2009–2014. .......................................................... 16 9. Number of freshwater trips by region, 2009–2014. ....................................................................................... 17 10. Saltwater and freshwater trips and angler-days by region, 2009–2014. ........................................................ 17 11. Saltwater salmon effort and harvest by region and angler type, 2014. .......................................................... 18 12. Saltwater bottomfish effort and harvest by species, region and angler type, 2014. ....................................... 19 13. Freshwater effort and harvest by species, region and angler type, 2014. ...................................................... 20
LIST OF FIGURES Figure Page 1. Map of Alaska and Division of Sport Fish regions and management areas. ................................................... 4 2. International Pacific Halibut Commission regulatory areas. ........................................................................... 5
ii

LIST OF APPENDICES Appendix Page A1. Sport fish business owner/guide license application, 2014. .......................................................................... 26 B1. Saltwater charter logbook form, 2014. .......................................................................................................... 30 C1. Freshwater guide logbook from, 2014. .......................................................................................................... 34 D1. Saltwater sport fish charter logbook sign-out and vessel registration form, 2014. ........................................ 38 D2. Freshwater sport fish guide vessel registration form, 2014. .......................................................................... 39 D3. Vessel decal, 2014. ........................................................................................................................................ 40 D4. Vessel tab, 2012. ........................................................................................................................................... 40 E1. Saltwater editing results, 2014. ..................................................................................................................... 42 F1. Freshwater editing results, 2014. ................................................................................................................... 44 G1. Electronic logbook reporting mail-in survey, 2014. ...................................................................................... 46 H1. Freshwater logbook participation by area and site, Southeast Alaska, 2014. ................................................ 50 H2. Freshwater logbook participation by area and site, Southcentral Alaska, 2014. ........................................... 51 H3. Freshwater logbook participation by area and site, Arctic-Yukon-Kuskokwim Alaska, 2014...................... 55 H4. Freshwater logbook participation by region, Statewide, 2014. ..................................................................... 56 H5. Freshwater logbook angler-days and species kept by area and site, Southeast Alaska, 2014. ...................... 57 H6. Freshwater logbook angler-days and species kept by area and site, Southcentral Alaska, 2014. .................. 58 H7. Freshwater logbook angler-days and species kept by area and site, Arctic-Yukon-Kuskokwim Alaska,
2014. .............................................................................................................................................................. 62 H8. Freshwater logbook angler-days and species kept by region, Statewide, 2014. ............................................ 63 H9. Freshwater logbook angler-days and species released by area and site, Southeast Alaska, 2014. ................ 64 H10. Freshwater logbook angler-days and species released by area and site, Southcentral Alaska, 2014. ............ 65 H11. Freshwater logbook angler-days and species released by area and site, Arctic-Yukon-Kuskokwim
Alaska, 2014. ................................................................................................................................................. 69 H12. Freshwater logbook angler-days and species released by region, Statewide, 2014. ...................................... 70 I1. Saltwater logbook participation and effort by area and port of offloading, Southeast Alaska, 2014. ........... 72 I2. Saltwater logbook participation and effort by area and port of offloading, Southcentral Alaska, 2014. ....... 73 I3. Saltwater logbook participation and effort by region, statewide, 2014. ........................................................ 74 I4. Saltwater logbook salmon participation, effort, and fish kept and released by area and port of
offloading, Southeast Alaska, 2014. .............................................................................................................. 75 I5. Saltwater logbook salmon participation, effort, and fish kept and released by area and port of
offloading, Southcentral Alaska, 2014. ......................................................................................................... 76 I6. Saltwater logbook salmon participation, effort, and fish kept and released by region, statewide, 2014. ...... 77 I7. Saltwater logbook bottomfish participation, effort, and fish kept and released by area and port of
offloading, Southeast Alaska, 2014. .............................................................................................................. 78 I8. Saltwater logbook bottomfish participation, effort, and fish kept and released by area and port of
offloading, Southcentral Alaska, 2014. ......................................................................................................... 79 I9. Saltwater logbook bottomfish participation, effort, and fish kept and released by region, statewide,
2014. .............................................................................................................................................................. 80
iii

iv

ABSTRACT In 2014, 1,115 sport fishing businesses and 2,788 guides were licensed under the Alaska Department of Fish and Game guide and business licensing program, signifying intent to provide sport fishing services in Alaska. Of the 1,115 sport fishing businesses registered in 2014, 983 were combination owner/guide licenses. Based on the 2014 physical addresses of both the businesses and guides, 87% of the businesses were residents of Alaska and 13% were from other residency strata (defined as nonresidents), and 63% of the guides were residents and 37% were nonresidents.
Of the 2,172 saltwater logbooks issued in 2014, 1,742 were activated, and of the 2,160 freshwater logbooks issued in 2014, 1,515 were activated. Of those businesses that submitted logbook information in 2014, 55% offered saltwater services, and 45% offered freshwater guided services. In 2014, logbook records show that 1,006 saltwater vessels were active. Of those active saltwater vessels, 60% were active in Southeast Alaska and 40% were active in Southcentral Alaska.
A total of 50,152 saltwater charter trips and 248,874 saltwater angler-days of fishing occurred in 2014. Of the statewide saltwater trips, 86% of the saltwater angler-days were nonresidents; 11% were residents; and 3% were crew, comped fishing (nonpaying anglers), or unknown residency. In freshwater, 40,152 trips and 117,150 angler-days occurred in 2014. Of the statewide freshwater trips, 89% of the angler-days were nonresidents; 8% were residents; and 3% were crew, comped fishing, or unknown residency.
Saltwater salmon harvest in 2014 show that coho salmon Oncorhynchus kisutch and Chinook salmon O. tshawytscha made up 67% and 18%, respectively, of the total salmon harvest statewide. Saltwater bottomfish harvests in 2014 show that Pacific halibut Hippoglossus stenolepis were the predominant species with 47% of the total saltwater bottomfish harvest statewide. In freshwater, sockeye salmon O. nerka and coho salmon made up 45% and 44% respectively of the total harvest statewide, followed by Chinook salmon at 6%.
Key words: Sport fishing, guide and business registration, freshwater logbook, saltwater logbook, participation, effort, harvest, sport fishing vessel, Pacific halibut, salmon, bottomfish, Southeast Alaska, Southcentral Alaska
BACKGROUND The Alaska Department of Fish and Game (ADF&G) Division of Sport Fish has operated a program to register and license both sport fishing guides and sport fishing guide businesses since 1998. Saltwater information on guided sport fishing participation, effort, and harvest has been collected since 1998. Freshwater guided information on fishing participation, effort, and harvest has been collected since 2005. Summary information on freshwater and saltwater participation, effort, and harvest has been reported since 2006 (Sigurdsson and Powers 2009–2013). This report briefly summarizes the approach, history, and results of this program for 2014.
GUIDE AND BUSINESS REGISTRATION AND LICENSING The activities of the guided sport fishing industry in Alaska have remained fairly steady after a drop in 2009. Resolution of allocation and management issues was hampered by a lack of information regarding the industry and its impact on fishery resources in many parts of Alaska. The sport fishing guide and business registration and licensing programs were designed to provide a comprehensive system to better define this diverse industry throughout Alaska. A brief history of the statewide registration and licensing process follows.
Beginning in May 1995 the owner(s) of any business that engaged in sport fish guiding of anglers anywhere in Alaska were required to register their business information and employees acting as sport fishing guides for the business, and list all vessels used for guiding. In 1997, sport fishing guides were required to register and provide information about the employing business (Dean 2001; Dean and Howe 1999).
1

In 1998, the Alaska Board of Fisheries (BOF) adopted new statewide sport fishing guide registration regulations and definitions during their February Statewide Finfish meeting in Girdwood, Alaska (5 AAC 75.075: Sport Fishing Services and Sport Fishing Guide Services; License Requirements; Regulations of Activities). It should be stressed that this was a registration process, not a licensing process. No fees were required and businesses and guides were allowed to provide services in any area of the state, assuming other regulatory requirements were met. In 1998, ADF&G continued to register guide businesses and guides but stopped registering charter vessels, because the Commercial Fisheries Entry Commission implemented a licensing program for all vessels to be used for guided sport fishing. From 1998 through 2004, ADF&G continued to register sport fishing businesses and sport fishing guides.
On May 11, 2004, the Alaska Legislature adopted House Bill 452 (HB 452), which established licensing requirements for sport fishing guide business owners and sport fishing guides on a statewide basis. This bill was created to establish minimum professional standards required of both freshwater and saltwater sport fish guides and business owners before a license could be obtained. The standards were established to protect consumers and to promote the viability and legitimacy of a professional sport fish guide industry. Businesses providing sport fish guided services were now required to obtain a State of Alaska Occupational Business License and hold liability insurance with a minimum of $300,000 coverage for all incidents in a year (AS 16.40.260). Licensed sport fishing guides were required (1) to be citizens of the United States, Canada, or Mexico; (2) hold a current first aid card; (3) have a current year Alaska sport fishing license; and (4) have a valid U.S. Coast Guard (USCG) operator’s license if they were to operate a motorized vessel in navigable waters. License application forms and the information collected have remained consistent in design since 2006.
LOGBOOKS In February 1998, the BOF adopted regulations (5 AAC 75.076) requiring logbooks for saltwater charter vessels statewide. Information on the location of charter activity and actual participation and harvest by individual vessels and businesses was needed by the BOF for allocation and management of Chinook salmon Oncorhynchus tshawytscha, rockfish Sebastes spp., and lingcod Ophiodon elongatus, and by the North Pacific Fisheries Management Council (NPFMC) for allocation of Pacific halibut Hippoglossus stenolepis. To meet these information needs ADF&G implemented a saltwater sport fishing charter vessel logbook program for Division of Sport Fish Region I, Southeast Alaska (Southeast), and Region II, Southcentral Alaska (Southcentral; Table 1; Figure 1).
In 1999, the NPFMC was considering proposals to limit the guided sport halibut harvest. Their concerns were (1) that growth in this fishery was reallocating resources away from the individual fishing quota commercial longline fishery, and (2) that in some areas there was overcapitalization and localized depletion of the halibut resource. NPFMC endorsed a two-prong approach to resolve the perceived impact of increased guided charter halibut fishing. The first was establishment of guideline harvest limits for International Pacific Halibut Commission (IPHC) Areas 2C and 3A (Figure 2), and the second was a process to establish local area management plans for halibut fisheries in coastal communities.
Since 1998, the logbook design has undergone annual revisions, driven primarily by changes or improvements in the collection of halibut, lingcod, and rockfish data through the logbook program, Statewide Harvest Survey, and expanded port sampling programs. House Bill 452,
2

adopted in 2004, not only established new licensing requirements but also established a logbook reporting requirement for all freshwater businesses in addition to the existing saltwater reporting requirements. For various reasons, both technical and policy-based, information on halibut harvests was not collected in the logbook from 2002 through 2005. The collection of halibut data was resumed in 2006. In addition, the 2006 logbook was redesigned to require reporting of angler license numbers and the harvest and release numbers by angler in an effort to improve reporting and facilitate evaluation of the quality of logbook data.
The data from logbooks are compiled to show where fishing effort occurs, the extent of participation, and the species and numbers of fish kept and released by individual clients. This information is used for regulation decisions and the development and management of fisheries, for project evaluation, and for formulation of department policies and priorities that reflect angler needs, concerns, and preferences. It also provides ADF&G with a tool to promote management of Alaska’s resources for sustained yield.
Table 1.–Division of Sport Fish regions and management areas.
Regions SE Southeast Alaska SC Southcentral Alaska AYK Arctic-Yukon-Kuskokwim
Areas Southeast Alaska A Ketchikan B Prince of Wales Island C Kake, Petersburg, Wrangell, Stikine D Sitka E Juneau F Haines/Skagway G Glacier Bay H Yakutat
Southcentral Alaska J Prince William Sound/North Gulf Coast K Knik Arm Drainage L Anchorage M Susitna River Drainage N West Side Cook Inlet drainages P Kenai Peninsula Q Kodiak R Naknek River/Alaska Peninsula S Kvichak River Drainage T Nushagak, Wood River, and Togiak
Arctic-Yukon-Kuskokwim I Upper Copper River Drainage U Tanana River Drainage V Kuskokwim River-Kuskokwim Bay Drainages W Norton Sound /Seward Peninsula X Northwest Alaska Y Yukon River Drainage Z North Slope/Brooks Range
3

Figure 1.–Map of Alaska and Division of Sport Fish regions and management areas.
4

Figure 2.–International Pacific Halibut Commission (IPHC) regulatory areas.
Currently, a logbook record is required for every chartered or guided trip taken with clients, defined as an outing with one group of clients that ends when the clients and their fish (if fish were kept) are offloaded. Each trip is associated with an individual licensed business and guide.
VESSEL REGISTRATION In addition to establishing a licensing program and statewide freshwater logbook requirement, HB 452 included establishment of a vessel registration program to be conducted by ADF&G as part of the logbook program to monitor the number of vessels used in the guided marine and freshwater fisheries. All guide industry boats used in marine or freshwater are referred to as “charter or guide boats” regardless of their size or the manner in which they are used. All vessels used in the charter guide industry were required to be registered with ADF&G.
VERIFICATION OF LOGBOOK HARVEST DATA Preliminary results from verification studies comparing the accuracy of logbook harvest data with the statewide harvest survey estimates and onsite creel programs are favorable (Meyer and Powers 2009). Logbook data will continue to be compared to counts from these programs. Comparisons are ongoing and are part of a more comprehensive evaluation of logbook data quality. Saltwater and freshwater logbook data have also been used for a variety of regulatory analyses for state-managed species. With the federal adoption of the Catch Sharing Plan (CSP), the saltwater logbook has become the standard measurement tool used by the NPFMC for halibut management.
METHODS GUIDE AND BUSINESS LICENSING Businesses and guides can be licensed to provide sport fishing guided services if they meet the minimum qualifications specified in regulation (AS 16.40.260 and AS 16.40.270).
5
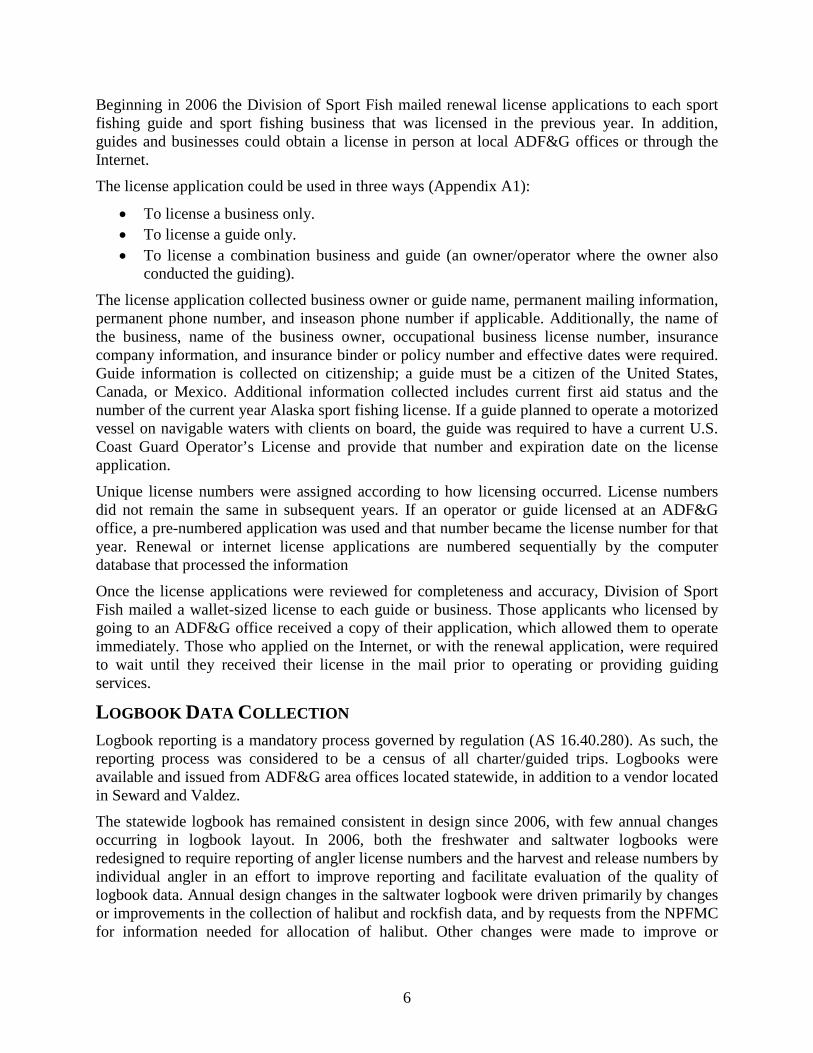
Beginning in 2006 the Division of Sport Fish mailed renewal license applications to each sport fishing guide and sport fishing business that was licensed in the previous year. In addition, guides and businesses could obtain a license in person at local ADF&G offices or through the Internet.
The license application could be used in three ways (Appendix A1):
• To license a business only. • To license a guide only. • To license a combination business and guide (an owner/operator where the owner also
conducted the guiding).
The license application collected business owner or guide name, permanent mailing information, permanent phone number, and inseason phone number if applicable. Additionally, the name of the business, name of the business owner, occupational business license number, insurance company information, and insurance binder or policy number and effective dates were required. Guide information is collected on citizenship; a guide must be a citizen of the United States, Canada, or Mexico. Additional information collected includes current first aid status and the number of the current year Alaska sport fishing license. If a guide planned to operate a motorized vessel on navigable waters with clients on board, the guide was required to have a current U.S. Coast Guard Operator’s License and provide that number and expiration date on the license application.
Unique license numbers were assigned according to how licensing occurred. License numbers did not remain the same in subsequent years. If an operator or guide licensed at an ADF&G office, a pre-numbered application was used and that number became the license number for that year. Renewal or internet license applications are numbered sequentially by the computer database that processed the information
Once the license applications were reviewed for completeness and accuracy, Division of Sport Fish mailed a wallet-sized license to each guide or business. Those applicants who licensed by going to an ADF&G office received a copy of their application, which allowed them to operate immediately. Those who applied on the Internet, or with the renewal application, were required to wait until they received their license in the mail prior to operating or providing guiding services.
LOGBOOK DATA COLLECTION Logbook reporting is a mandatory process governed by regulation (AS 16.40.280). As such, the reporting process was considered to be a census of all charter/guided trips. Logbooks were available and issued from ADF&G area offices located statewide, in addition to a vendor located in Seward and Valdez. The statewide logbook has remained consistent in design since 2006, with few annual changes occurring in logbook layout. In 2006, both the freshwater and saltwater logbooks were redesigned to require reporting of angler license numbers and the harvest and release numbers by individual angler in an effort to improve reporting and facilitate evaluation of the quality of logbook data. Annual design changes in the saltwater logbook were driven primarily by changes or improvements in the collection of halibut and rockfish data, and by requests from the NPFMC for information needed for allocation of halibut. Other changes were made to improve or
6

simplify the use of the forms based on operator input, and to improve the collection of client and crew harvest information.
In 2011, ADF&G worked collaboratively with National Marine Fisheries Service (NMFS) to modify the logbook requirements associated with the federal Charter Halibut Permit (CHP) program, a program that establishes limited access to the guided halibut fishery. The 2011 saltwater logbook was designed to capture CHP numbers associated with the permits granted by the NMFS to qualifying participants in the sport fish charter halibut fishery.
In July 2011, National Oceanic and Atmospheric Administration (NOAA) Fisheries proposed regulations to authorize Guided Angler Fish (GAF) for the charter halibut fisheries in area 2C and area 3A within a CSP. Guided Angler Fish would have offered charter anglers in these areas an opportunity to harvest halibut in addition to, or instead of, the halibut harvest under charter angler daily limits. The proposed GAF regulations included a requirement for charter operators to record a GAF permit number and GAF harvest information in the saltwater logbook. ADF&G again worked with the NMFS to review the options of collecting GAF halibut under the proposed CSP by redesigning the logbook. Although the 2012 and 2013 saltwater logbooks were designed to capture GAF halibut, the federal GAF proposal was not in effect during those 2 years. Effective January 13, 2014, the halibut CSP authorized annual transfers of commercial halibut Individual Fishing Quota (IFQ) as GAF to charter halibut permit holders for harvest in the charter halibut fishery. Guided Angler Fish offered charter halibut permit holders in area 2C and area 3A an opportunity to lease a limited amount of IFQ from commercial quota share (QS) holders to allow charter clients to harvest halibut in addition to, or instead of, the halibut harvested under the daily bag limit for charter anglers. Charter vessel operators who chose to participate in the GAF program were able to offer their clients the opportunity to harvest up to 2 halibut a day without the size restrictions imposed on the guided halibut charter industry. In 2014, operators started reporting their GAF halibut in the saltwater logbook.
Saltwater Logbook A saltwater logbook consisted of the cover page, schedule of reporting deadlines, one logbook sign-out sheet to show the business to which the logbook was issued and to register the saltwater vessel, a set of instructions for filling out the information on the logbook sheets, and 50 data sheets to record trip information (Appendix B1). The following information was recorded on the 2014 saltwater logbook data sheets:
• Date that fishing took place. • Time that trip ended. • ADF&G guide license number for the guide leading the trip. • CHP number. • Primary statistical area fished while targeting salmon or bottomfish. • Number of hours fished. • Port or community where trip ended. • Guided Angler Fish (GAF) permit number • Crew, client, and “comped” angler’s current ADF&G sport fishing license or PID
(permanent fishing license) number, and the word “YOUTH” for anglers under 16. • First and last name of each client and youth angler.
7

• Client residency (Alaska resident/nonresident of Alaska). • Indication if angler was a crew member or if angler was “comped.” • Signature of those anglers who kept halibut while fishing in IPHC areas 2C or 3A. • A breakdown by fish species kept and released by each individual angler.
During a saltwater charter trip, the operator must decide if his/her gear or fishing methods are effectively targeting bottomfish, salmon, or both. A 6-digit statistical area code where most of the fish were caught or targeted is logged for each trip. Statistical area maps were provided to the operator upon logbook issuance.
Saltwater species information collected included kept and released information for “large” Chinook (king salmon) 28″ and longer and for “small” Chinook less than 28″. Also recorded were coho O. kisutch, sockeye O. nerka, other salmon, halibut, GAF halibut kept, lingcod, pelagic rockfish, yelloweye and other nonpelagic rockfish, salmon shark Lamna ditropis, and sablefish Anoplopoma fimbria. To determine the number of businesses and guides that were “active” in the industry, a cross reference of business and guide licenses is made with the logbook checkout sheet and logbook data sheets. If ADF&G received at least one logbook data page that reported targeted effort with paying clients, the charter operator turning in the form was considered an “active” bottomfish or salmon charter operator with an “active” vessel.
Freshwater Logbook A freshwater logbook consisted of the cover page, schedule of reporting deadlines, one logbook sign-out sheet to show the business to which the logbook was issued, a freshwater vessel registration page that collects the unique Alaska Vessel number (AK #) assigned by the Division of Motor Vehicles (DMV) or a USCG documentation number and primary drainage, a set of instructions for filling out the information on the logbook sheets, and 50 data sheets (Appendix C1) to record trip information.
The following information was recorded on the 2014 freshwater logbook data sheets:
• ADF&G guide license number for the guide leading the trip. • Date that fishing took place. • Specific name of river, stream, or lake fished. • Site code of site fished as referenced within a list provided with each logbook. • Number of logbook pages used for a specific trip. • Name of any other species kept or released not already listed. • Crew, client, and “comped” angler’s current ADF&G sport fishing license number, and a
youth angler designation for anglers under 16 years of age. • Client residency. • Indication if angler was a crew member or if angler was “comped.” • A breakdown by fish species kept and released by each individual angler.
The freshwater logbook does not collect targeted species information like the saltwater logbook; it collects information on species kept and released regardless of what was targeted. A trip is counted if a logbook data page is submitted with paying client information. Freshwater trips are
8

assigned to a region of the state based on the name of the site fished; each freshwater site is assigned a unique regional alpha code followed by a numeric code within the region in which it is located (Table 1).
Freshwater information collected consisted of the following: kept and released numbers for Chinook, coho, and sockeye salmon; cutthroat O. clarkii; rainbow and steelhead trout O. mykiss; lake trout Salvelinus namaycush; Dolly Varden S. malma; Arctic grayling Thymallus arcticus; northern pike Esox lucius; sheefish Stenodus leucichthys; and a category for the number of all other fish not already listed.
Business operators are permitted and even encouraged to pick up as many logbooks as they anticipate needing during the course of the season. The ability to acquire as many logbooks as are needed prevents them from having to make multiple trips to an ADF&G office. As a result, numerous businesses ended up getting more logbooks than were eventually used. Because of this, ADF&G differentiates between the number of logbooks issued versus the number that are actually used or activated.
Vessel Registration Vessel registration information was collected when a saltwater or freshwater logbook was issued to a business (Appendices D1 and D2). Registration information included the DMV AK# or the USCG vessel documentation number. Upon completion of vessel registration with ADF&G, each vessel was provided with two decals and year tags to indicate that the vessel is to be used in the guide industry (Appendices D3 and D4). Decals must be applied and visible on both sides of the vessel.
LOGBOOK OUTREACH, VALIDATION, AND VERIFICATION In December 2005, the Commissioner of the ADF&G issued a statement that mandated and detailed strategies for assuring the accuracy of the reporting of Pacific halibut harvest for the saltwater charter logbook through outreach and validation.
Outreach An outreach program was initiated to reach as many operators as possible to field questions and to ensure compliance with the reporting requirements. The outreach program was conducted on-site (in the field) by ADF&G employees and off-site from the Anchorage ADF&G office.
On-site Logbook Inspections Logbook outreach occurred in parts of the Southeast and Southcentral regions in conjunction with existing creel survey and port sampling programs. “Courtesy logbook inspections” were conducted as time allowed by ADF&G creel and port sampling technicians during their regular dockside checks of the primary fisheries from May through September. In addition, management staff continued with periodic checks of charter logbooks while in the field. Logbooks were inspected to make sure they were filled out correctly, and staff answered any questions about how they should be filled out. These checks were not intended for enforcement or for evaluating the accuracy of data but rather as another opportunity to encourage compliance and completeness and as an indicator of how important logbook data are to ADF&G.
9

Off-site Logbook Review The goal of the outreach program was to ensure compliance with all reporting requirements by emphasizing education early in the season. Off-site outreach was conducted by the Division of Sport Fish, Research and Technical Services (RTS) staff in the Anchorage office. All logbook trip data was subject to a reporting deadline. Logbook data pages were required to be completed and returned to ADF&G on a weekly basis as specified in the instructions of both the saltwater and freshwater logbooks. Timely submission was a requirement to facilitate recall and to allow ADF&G staff to review each data page for completeness and legibility. All logbook data sheets were received by RTS in Anchorage where ADF&G data entry staff date-stamped each data page with the date received; reviewed each page for incomplete, illegible or erroneous information; and conducted phone calls to business owners and guides for follow-up and clarification. Calls early in the season were intended to alleviate repeat errors in reporting and were thought to result in fewer calls being necessary later in the fishing season.
As logbook data sheets were received, RTS staff conducted reviews by monitoring all data for completion and legibility prior to data entry. In the event that some of the logbook data sheets required clarification from the operator or guide, staff would place phone calls.
Phone calls to the business owners and guides significantly improved the quality of the data, minimized reoccurring mistakes by the guide, increased compliance, and contributed to the outreach portion of this program. Logbook data entry staff contacted charter operators to resolve logbook reporting issues and to improve future reporting. These calls were intended to improve data quality and reinforce the message to the guide industry that logbook data are important and are consistently being reviewed.
Number of follow-up calls to Operators by year 2010 2011 2012 2013 2014 830 651 829 835 875
Follow-up phone calls have become a valuable outreach tool and will continue to be a standard procedure in the future.
Validation Inseason Saltwater Logbook Editing
Computer routines have been written to check and validate the following saltwater data fields during the fishing season as logbook data pages are returned:
• Validate the guide license is filled in and valid.
• Validate the date is filled in and in the year 2014.
• Validate the port of landing is entered and is in the valid port site table.
• If hours are listed, verify a statistical area is listed for the appropriate effort.
• Verify the statistical area listed is a valid statistical area.
• If there is harvest, verify the appropriate statistical area is filled in.
• If a statistical area is filled out, verify the appropriate hours field is filled in.
10

• Verify a statistical area is filled in (both can’t be blank).
• Verify hours are filled in (both can’t be blank).
• Validate possible incorrect stat areas that appear to be valid;
o If data entry mistakenly enters the hours info in the statistical area, the first statistical area that starts with the same number will be auto-populated and accepted as valid.
• Check to see which log pages were turned in more than 7 days after the due date.
• Verify logbooks are checked out to a business and not a guide.
• Check all records with more than 12 hours listed.
• Check for duplicate logbook pages.
• Check trips that don’t have paying angler records.
• Verify the date fished is not greater than the date the log page is received by ADF&G.
• Check to see if Charter Halibut Permit (CHP) is present if halibut were harvested.
• Verify CHP is valid according to list from NOAA.
• Check to see if Guided Angler Fish (GAF) is present if GAF halibut are harvested.
Postseason Saltwater Logbook Editing At the end of the fishing season, computer routines check and validate the above listed items in addition to the following saltwater data fields in preparation for developing summaries (Appendix E1).
• Re-run all of the inseason edits.
• Check to make sure fish kept are within the limits for the area fished.
• Validate and review excessively large numbers of released fish based on frequency distribution analysis.
Inseason Freshwater Logbook Editing Computer routines have been written to check and validate the following freshwater data fields during the fishing season as logbook data pages are returned:
• Validate the guide license number is filled in and valid.
• Validate the date is filled in and in the year 2014.
• Validate the site code is entered and is in the valid site code table.
• Check to make sure there are paying clients (not comped or crew) on the trip.
• Check to see which log pages were turned in more than 7 days after the due date.
• Check for duplicate logbook pages.
• Verify the date fished is not greater than the date the log page is received by ADF&G.
11

• Verify logbooks are checked out to a business and not a guide.
• Verify that Kenai River trips weren’t taken on Sunday or Monday in May – July.
• Check trip records that don’t have angler records.
Postseason Freshwater Logbook Editing At the end of the fishing season, computer routines check and validate the above-listed items in addition to the following freshwater data fields in preparation for developing summaries:
• Re-run all of the inseason edits.
• Check to make sure fish kept are within the limits for the site fished.
• Check to make sure the fish caught are valid species for the site fished.
• Validate excessively large numbers of released fish based on frequency distribution analysis.
• Recode “Other” site codes to correct values if they exist in the site code table.
• Recode sites with “System” in the description to a more specific site code if available.
• Check records with 6 clients on a single page to verify that the next page is not part of the same trip.
RESULTS GUIDE AND BUSINESS LICENSING In 2014, ADF&G received license applications from 1,115 sport fishing businesses and 2,788 sport fishing guides licensed with the intent to provide sport fishing services in Alaska. The total number of businesses and guides includes saltwater and freshwater operators. Of the 1,115 sport fishing businesses licensed in 2014, 983 were combination owner/guide licenses. Physical addresses of both the businesses and guides in 2014 indicated that 87% of the businesses reported Alaska residency, and 13% were from other residency strata (defined as nonresidents); 63% of the guides were residents and 37% were nonresidents.
The licensed businesses and guides were subtotaled by region of residency for Southeast, Southcentral, and Other Alaska, including the Arctic–Yukon–Kuskokwim area and nonresident. In 2014, businesses with a physical address in Southeast made up 27% of the total licensed businesses, 56% were located in Southcentral, 4% had permanent addresses in other parts of Alaska, and 13% had nonresident addresses based on their license applications. In 2014, of those that licensed as guides only, 12% had permanent addresses in Southeast, 33% in Southcentral, and 4% in other parts of Alaska, and 51% had nonresident addresses based on their license applications (Table 2).
12

Table 2.–Number of licensed businesses and guides by region, 2010–2014.
Licensed Businessesa Regionb 2010 2011 2012 2013 2014
Southeast 32 43 36 31 36 Southcentral 68 64 64 58 63 Other Alaska 4 2 4 3 6
Resident Total 104 109 104 92 105 Other U.S. 25 26 27 30 27 Foreign 0 0 0 0 0
Nonresident Total 25 26 27 30 27 Total 129 135 131 122 132
Combination Licensesc Southeast 351 313 288 277 268 Southcentral 764 726 656 608 560 Other Alaska 62 62 50 53 40
Resident Total 1,177 1,101 994 938 868 Other U.S. 146 135 138 118 115 Foreign 0 0 0 0 0
Nonresident Total 146 135 138 118 115 Total 1,323 1,236 1,132 1,056 983
Licensed Guidesd Southeast 269 269 228 207 222 Southcentral 662 623 614 585 598 Other Alaska 78 85 72 68 72
Resident Total 1,009 977 914 860 892 Other U.S. 702 747 798 850 911 Foreign 0 0 0 1 2
Nonresident Total 702 747 798 851 913 Total 1,711 1,724 1,712 1,711 1,805 Note: Data are current as of 11/06/2015; does not include duplicate licenses. a Business-only licenses that do not include the owner as a guide. b Region assigned based on physical address indicated at time of licensing. c Combination licenses that include the business and the business owner as the guide. d Guide license only, no business license.
13

Based on the submission of logbook data pages with trip information in 2014, data indicated that saltwater services were provided by 571 businesses; 465 provided freshwater services. These totals include 90 businesses that provided both freshwater and saltwater services (Tables 3 and 4).
Table 3.–Number of active saltwater businesses and guides by region, 2010–2014. Active Businessesa Active Guidesb
Regionc 2010 2011 2012 2013 2014 2010 2011 2012 2013 2014 Southeast 373 341 321 301 303 730 673 691 702 691 Southcentral 403 345 300 273 274 633 571 539 541 512 Totald 776 686 620 573 571 1,325 1,222 1,198 1,202 1,164 Note: Data are current as of 11/06/2015. a Active Business counts are based on the business number listed on the sign-out sheet of a logbook (this can be a business only
or a combination business/guide license) and the submission of at least one log page from the logbook. b Active Guide counts are based on the guide number written on each log page (this can be a guide only or a combination
business/guide license) and the submission of at least one log page showing that guide license number. c Region is based on the port of offloading (or salmon and bottomfish statistical areas if port is not listed). d Total is not additive because a business or guide could operate in both regions. Includes businesses and guides that offered
both saltwater and freshwater services.
Table 4.–Number of active freshwater businesses and guides by region, 2010–2014.
Active Businessesa Active Guidesb
Regionc 2010 2011 2012 2013 2014 2010 2011 2012 2013 2014 Southeast 69 68 62 64 59 149 159 160 161 156 Southcentral 433 431 407 389 367 1,035 1,039 1,004 1,033 1,020 Arctic–Yukon–Kuskokwim 62 61 53 63 56 200 218 198 213 229 Totald 546 537 503 496 465 1,331 1,345 1,293 1,318 1,322 Note: Data are current as of 11/09/2015. a Active Business counts are based on the business number listed on the sign-out sheet of a logbook (this can be a business only
or a combination business/guide license) and the submission of at least one log page from the logbook. b Active Guide counts are based on the guide number written on each log page (this can be a guide only or a combination
business/guide license) and the submission of at least one log page showing that guide license number. c Region is based on the site code provided for the site fished on each logbook page. d Total is not additive because a business or guide could operate in multiple regions. Includes businesses and guides that offered
both saltwater and freshwater services.
14

15
VESSELS Saltwater Of the 1,175 registered saltwater vessels in 2014, 1,006 were actually active. Based on the port of offloading, 605 saltwater vessels operated in Southeast and 407 operated in Southcentral in 2014 (Table 5).
Table 5.–Number of registered and active saltwater vessels by region, 2010–2014.
Registered Vessels Active Vessels Regiona 2010 2011 2012 2013 2014 2010 2011 2012 2013 2014 Southeast 778 716 690 679 700 644 610 593 579 605 Southcentral 611 543 497 464 476 528 469 415 396 407
Totalb 1,389 1,259 1,185 1,142 1,175 1,172 1,079 1,005 974 1,006Note: Data are current as of 11/06/2015. a Region for registered vessels is based on primary port of operation listed on the sign-out sheet; for active vessels, region is
based on primary port of offloading, or salmon and bottomfish statistical areas if port is not listed. b Total is not additive because a vessel could be registered or active in both regions.
Logbook data indicate that vessels will target all possible species during the course of a fishing season: bottomfish, salmon, and both (Table 6).
Table 6.–Number of active saltwater vessels that made at least one trip in each target category, by region, 2010–2014.
Targeta
Year Regionb Salmon Bottomfish Both No Stat Areac
2010 Southeast 514 401 567 63 Southcentral 245 476 385 43 Total 759 877 952 106
2011 Southeast 522 287 505 40 Southcentral 257 419 358 38 Total 779 706 863 78 2012 Southeast 483 330 504 43 Southcentral 203 382 303 22 Total 686 712 807 65 2013 Southeast 448 304 501 27 Southcentral 215 355 304 17 Total 663 659 805 44 2014 Southeast 486 328 520 31 Southcentral 212 366 311 14 Total 698 694 831 45Note: Data are current as of 11/06/2015. a Species targeted is based on the provision of salmon and/or bottomfish statistical area. b Region is based on the port of offloading (or salmon and bottomfish statistical areas if port is not listed). c No statistical area was written on the log page, so a target could not be determined.

Freshwater Based on the primary drainage and sites fished, many more freshwater vessels registered in Southcentral than in other regions between 2010 and 2014 (Table 7).
Table 7.–Number of registered freshwater vessels by year and region, 2010–2014.
Year Southeast Southcentral Arctic-Yukon-Kuskokwim Unknowna Totalb 2010 96 1,615 198 3 1,911 2011 91 1,585 244 1 1,920 2012 85 1,535 236 0 1,854 2013 76 1,530 229 0 1,832 2014 71 1,464 250 3 1,787 Note: Data are current as of 11/06/2015. a Insufficient information available during registration and on fishing activity. b Total may not be additive because a vessel could be registered in more than one region.
TRIPS Saltwater Logbook data indicate that 50,152 saltwater charter trips were conducted statewide in 2014. During the past 5 years, a majority of the trips that only targeted salmon occurred in Southeast Alaska, whereas the majority of trips that only targeted bottomfish occurred in Southcentral Alaska. During the same 5 years, operators in Southeast conducted significantly more trips in which both salmon and bottomfish were targeted on the same trip. If a statistical area fished was not provided or indicated, no targeted species was assigned (Table 8).
Table 8.–Number of saltwater trips by targeted species by region, 2010–2014.
Species Targeteda
Year Regionb Salmon Bottomfish Both No Stat Areac Total 2010 Southeast 7,613 5,369 14,740 99 27,821 Southcentral 2,026 13,225 5,593 88 20,932 Total 9,639 18,594 20,333 187 48,753
2011 Southeast 8,687 3,465 16,056 79 28,287 Southcentral 2,057 12,091 5,987 67 20,202 Total 10,744 15,556 22,043 146 48,489
2012 Southeast 8,276 4,789 15,234 60 28,359 Southcentral 1,555 12,962 4,560 47 19,124 Total 9,831 17,751 19,794 107 47,483
2013 Southeast 8,019 4,155 17,410 41 29,625 Southcentral 1,993 12,176 5,260 24 19,453 Total 10,012 16,331 22,670 65 49,078
2014 Southeast 8,910 5,018 18,708 38 32,674 Southcentral 1,604 10,059 5,798 17 17,478 Total 10,514 15,077 24,506 55 50,152
Note: Data are current as of 11/06/2015. a Species targeted is based on the provision of salmon and/or bottomfish statistical area. b Region is based on the port of offloading (or salmon and bottomfish statistical areas if port is not listed). c No statistical area was written on the log page, so a target could not be determined.
16

Freshwater In 2014, 40,152 freshwater trips were conducted statewide; 81% of those trips took place in Southcentral, 12% in the Arctic-Yukon-Kuskokwim (AYK) area, and 7% in Southeast (Table 9).
Table 9.–Number of freshwater trips by region, 2010–2014.
Year Southeast Southcentral Arctic-Yukon-Kuskokwim Total 2010 2,456 31,263 4,069 37,788 2011 2,430 33,131 4,569 40,130 2012 2,672 30,769 4,347 37,788 2013 2,811 31,076 4,243 38,130 2014 2,869 32,389 4,894 40,152 Note: Region is based on the area code of the site code listed on each logbook page. Data are current as of 11/06/2015.
LOGBOOK TRIP EFFORT AND HARVEST Saltwater angler-days and trips remained steady from 2010 to 2014 (Table 10). Freshwater trips show a similar pattern to saltwater trips; numbers remained relatively steady except for a slight increase in 2011 (Table 10).
Table 10.–Saltwater and freshwater trips and angler-days by region, 2010–2014.
Saltwatera Freshwaterb
Year Region Trips Angler-days Trips Angler-days 2010 Southeast 27,821 110,915 2,456 8,898
Southcentral 20,932 135,170 31,263 94,894
Arctic-Yukon-Kuskokwim 0 0 4,069 9,432
Total 48,753 246,085 37,788 113,224
2011 Southeast 28,287 111,120 2,430 8,885
Southcentral 20,202 135,242 33,131 99,661
Arctic-Yukon-Kuskokwim 0 0 4,569 10,750
Total 48,489 246,362 40,130 119,296
2012 Southeast 28,359 112,603 2,672 9,924
Southcentral 19,124 133,283 30,769 90,450
Arctic-Yukon-Kuskokwim 0 0 4,347 9,984
Total 47,483 245,886 37,788 110,358
2013 Southeast 29,625 119,222 2,811 9,978
Southcentral 19,453 138,648 31,076 92,054
Arctic-Yukon-Kuskokwim 0 0 4,243 10,207
Total 49,078 257,870 38,130 112,239
2014 Southeast 32,674 131,966 2,869 10,257
Southcentral 17,478 116,908 32,389 95,003
Arctic-Yukon-Kuskokwim 0 0 4,894 11,890
Total 50,152 248,874 40,152 117,150
Note: Data are current as of 11/06/2015. a Region is based on the port of offloading (or salmon and bottomfish statistical areas if port is not listed). b Freshwater region is based on the area code of the site code listed on each logbook page.
17
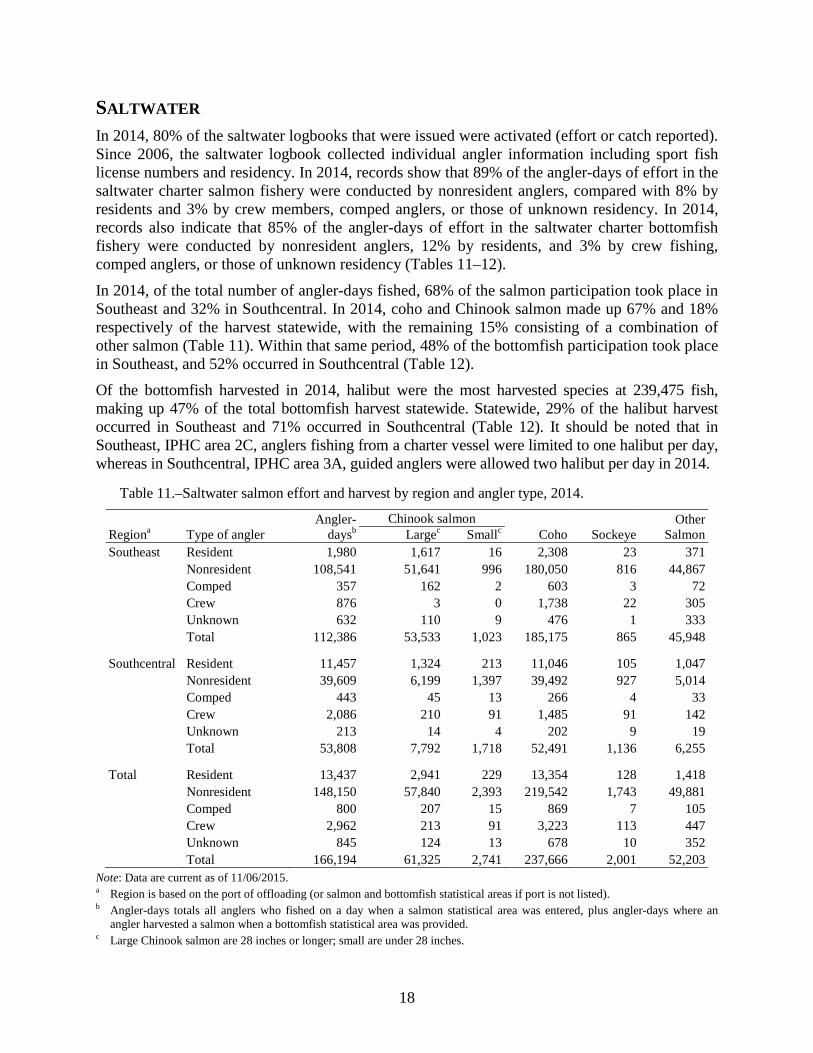
SALTWATER In 2014, 80% of the saltwater logbooks that were issued were activated (effort or catch reported). Since 2006, the saltwater logbook collected individual angler information including sport fish license numbers and residency. In 2014, records show that 89% of the angler-days of effort in the saltwater charter salmon fishery were conducted by nonresident anglers, compared with 8% by residents and 3% by crew members, comped anglers, or those of unknown residency. In 2014, records also indicate that 85% of the angler-days of effort in the saltwater charter bottomfish fishery were conducted by nonresident anglers, 12% by residents, and 3% by crew fishing, comped anglers, or those of unknown residency (Tables 11–12).
In 2014, of the total number of angler-days fished, 68% of the salmon participation took place in Southeast and 32% in Southcentral. In 2014, coho and Chinook salmon made up 67% and 18% respectively of the harvest statewide, with the remaining 15% consisting of a combination of other salmon (Table 11). Within that same period, 48% of the bottomfish participation took place in Southeast, and 52% occurred in Southcentral (Table 12). Of the bottomfish harvested in 2014, halibut were the most harvested species at 239,475 fish, making up 47% of the total bottomfish harvest statewide. Statewide, 29% of the halibut harvest occurred in Southeast and 71% occurred in Southcentral (Table 12). It should be noted that in Southeast, IPHC area 2C, anglers fishing from a charter vessel were limited to one halibut per day, whereas in Southcentral, IPHC area 3A, guided anglers were allowed two halibut per day in 2014.
Table 11.–Saltwater salmon effort and harvest by region and angler type, 2014.
Regiona Type of angler Angler-
daysb Chinook salmon
Other
Salmon Largec Smallc Coho Sockeye Southeast Resident 1,980 1,617 16 2,308 23 371
Nonresident 108,541 51,641 996 180,050 816 44,867
Comped 357 162 2 603 3 72
Crew 876 3 0 1,738 22 305
Unknown 632 110 9 476 1 333
Total 112,386 53,533 1,023 185,175 865 45,948
Southcentral Resident 11,457 1,324 213 11,046 105 1,047
Nonresident 39,609 6,199 1,397 39,492 927 5,014
Comped 443 45 13 266 4 33
Crew 2,086 210 91 1,485 91 142
Unknown 213 14 4 202 9 19
Total 53,808 7,792 1,718 52,491 1,136 6,255
Total Resident 13,437 2,941 229 13,354 128 1,418
Nonresident 148,150 57,840 2,393 219,542 1,743 49,881
Comped 800 207 15 869 7 105
Crew 2,962 213 91 3,223 113 447
Unknown 845 124 13 678 10 352
Total 166,194 61,325 2,741 237,666 2,001 52,203
Note: Data are current as of 11/06/2015. a Region is based on the port of offloading (or salmon and bottomfish statistical areas if port is not listed). b Angler-days totals all anglers who fished on a day when a salmon statistical area was entered, plus angler-days where an
angler harvested a salmon when a bottomfish statistical area was provided. c Large Chinook salmon are 28 inches or longer; small are under 28 inches.
18

Table 12.–Saltwater bottomfish effort and harvest by species, region, and angler type, 2014.
Type of angler Angler-
Rockfish
Regiona daysb Halibut Lingcod Pelagic Yelloweye Non-Pelagic Sablefish Shark Southeast Resident 1,810 1,210 271 1,410 190 506 54 0
Nonresident 97,548 67,995 5,989 105,939 10,588 31,339 6,889 11
Comped 371 236 25 226 32 100 7 0
Crew 882 6 0 436 0 12 21 0
Unknown 329 144 12 200 26 85 12 0
Total 100,940 69,591 6,297 108,211 10,836 32,042 6,983 11
Southcentral Resident 23,979 38,021 2,094 17,272 2,249 2,220 63 1
Nonresident 81,910 129,633 6,944 59,890 6,661 6,104 197 6
Comped 879 1,285 91 701 82 81 6 0
Crew 2,699 165 251 3,104 336 432 1 0
Unknown 514 777 32 241 30 22 0 0
Total 109,981 169,881 9,412 81,208 9,358 8,859 267 7
Total Resident 25,789 39,231 2,365 18,682 2,439 2,726 117 1
Nonresident 179,458 197,628 12,933 165,829 17,249 37,443 7,086 17
Comped 1,250 1,521 116 927 114 181 13 0
Crew 3,581 171 251 3,540 336 444 22 0
Unknown 843 921 44 441 56 107 12 0
Total 210,921 239,472 15,709 189,419 20,194 40,901 7,250 18 Note: Data are current as of 11/06/2015. a Region is based on the port of offloading (or salmon and bottomfish statistical areas if port is not listed). b Angler-days totals all anglers who fished on a day when a bottomfish statistical area was entered, plus angler-days where an
angler harvested a bottomfish when a salmon statistical area was provided.
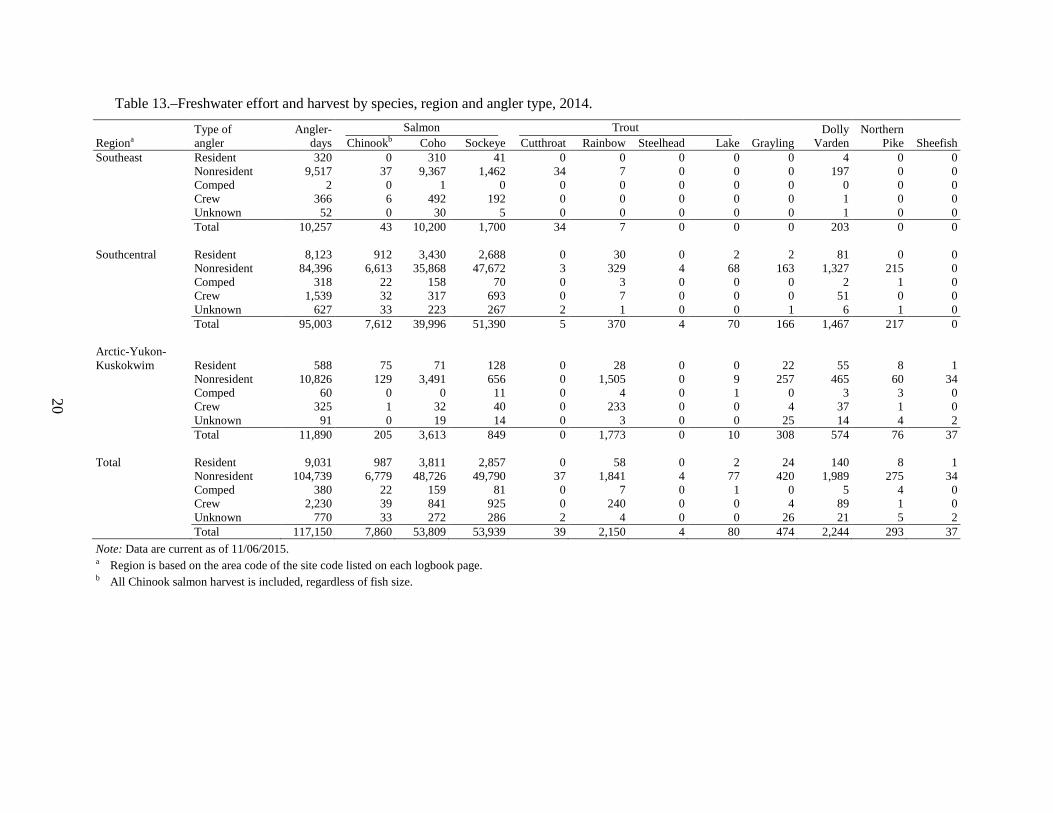
FRESHWATER In 2014, of all freshwater logbooks issued, 70% were activated. Records indicate that 9% of the freshwater participation occurred in Southeast, 81% occurred in Southcentral, and 10% took place in the Arctic-Yukon-Kuskokwim (AYK) region or interior Alaska (Table 13).
Angler-days of effort in 2014 indicate that 89% of the anglers in the freshwater guided fishery were nonresident anglers, 8% were residents, and 3% were crew fishing, comped anglers, or those of unknown residency. In Southeast, 93% of the guided/chartered fishing was conducted by nonresident anglers, 89% were nonresidents in Southcentral, and 91% of the anglers in AYK were nonresidents.
In 2014, sockeye, coho, and Chinook salmon were the predominant species harvested, making up 45%, 44%, and 6% respectively of the harvest statewide, with the remaining 4% consisting of a combination of other fish (Table 13).
19
20
Table 13.–Freshwater effort and harvest by species, region and angler type, 2014.
Type of Angler- Salmon Trout Dolly Northern Regiona angler days Chinookb Coho Sockeye Cutthroat Rainbow Steelhead Lake Grayling Varden Pike Sheefish Southeast Resident 320 0 310 41 0 0 0 0 0 4 0 0 Nonresident 9,517 37 9,367 1,462 34 7 0 0 0 197 0 0 Comped 2 0 1 0 0 0 0 0 0 0 0 0 Crew 366 6 492 192 0 0 0 0 0 1 0 0 Unknown 52 0 30 5 0 0 0 0 0 1 0 0 Total 10,257 43 10,200 1,700 34 7 0 0 0 203 0 0
Southcentral Resident 8,123 912 3,430 2,688 0 30 0 2 2 81 0 0 Nonresident 84,396 6,613 35,868 47,672 3 329 4 68 163 1,327 215 0 Comped 318 22 158 70 0 3 0 0 0 2 1 0 Crew 1,539 32 317 693 0 7 0 0 0 51 0 0 Unknown 627 33 223 267 2 1 0 0 1 6 1 0 Total 95,003 7,612 39,996 51,390 5 370 4 70 166 1,467 217 0
Arctic-Yukon-Kuskokwim Resident 588 75 71 128 0 28 0 0 22 55 8 1 Nonresident 10,826 129 3,491 656 0 1,505 0 9 257 465 60 34 Comped 60 0 0 11 0 4 0 1 0 3 3 0 Crew 325 1 32 40 0 233 0 0 4 37 1 0 Unknown 91 0 19 14 0 3 0 0 25 14 4 2 Total 11,890 205 3,613 849 0 1,773 0 10 308 574 76 37
Total Resident 9,031 987 3,811 2,857 0 58 0 2 24 140 8 1 Nonresident 104,739 6,779 48,726 49,790 37 1,841 4 77 420 1,989 275 34 Comped 380 22 159 81 0 7 0 1 0 5 4 0 Crew 2,230 39 841 925 0 240 0 0 4 89 1 0 Unknown 770 33 272 286 2 4 0 0 26 21 5 2 Total 117,150 7,860 53,809 53,939 39 2,150 4 80 474 2,244 293 37 Note: Data are current as of 11/06/2015. a Region is based on the area code of the site code listed on each logbook page. b All Chinook salmon harvest is included, regardless of fish size.
DISCUSSION GUIDE AND BUSINESS LICENSING From 2005 through 2014, the ADF&G guide and business licensing process differed from the registration process in 2004 and prior in terms of the approach used, fees, and the information collected on license applications. The current licensing approach reflects changes made in 2005 to initiate the new minimum requirements established by HB 452. Guides and businesses offering guided fishing services are now held to a higher standard of compliance than previous to 2005. Violations of the guide licensing statutes or regulations adopted under HB 452 are either violations or misdemeanors, and courts are authorized to revoke the license of the guide or business under certain conditions, such as repeated convictions within a 3-year period.
ADF&G no longer collects the same information collected on pre-2005 applications regarding the type (saltwater vs. freshwater) and location (regions/subareas) of services. That information is available from logbook data. The 2005–2014 licensing processes have been similar and provide a basis for establishing a long-term database of licensed businesses and guides. Charter/guide business and guide licensing still reflects the intent to operate, whereas actual activity is confirmed by the submission of logbook trip data.
LOGBOOKS ADF&G initiated a mandatory saltwater charter logbook program in 1998. The BOF adopted regulations requiring logbook reporting and annual registration of sport fishing guides and businesses. The logbook and registration/licensing program was intended to provide information on actual participation and harvest by individual vessels and businesses.
Recent emphasis from ADF&G management staff and NPFMC on more timely saltwater data spurred discussions on how to hasten logbook data availability. Up until 2010, logbook data entry involved collecting logbook sheets from the guide, entering the logbook data into a logbook database, and editing the data. This process could take RTS from 6 to 8 weeks to complete.
Upon further discussion and research, an alternative approach was considered. In 2009, ADF&G programmers researched the option of developing a system that would electronically scan the image of a redesigned logbook data page. Scanned images would minimize data entry time but allow for data entry personnel to fix images flagged as unrecognizable, thus maintaining data accuracy and quality. This option is not any more “burdensome” to the industry and would probably make the weekly reporting requirement more palatable knowing that the data would be more immediately available.
In 2010, the saltwater logbook data page design change incorporated the ability to use the new scanning software. Due to first year design “glitches” and software troubleshooting, the 2010 saltwater data was not available in as timely a manner as originally hoped. A program review with office assistants (data entry personnel) and discussions with the project analyst programmer resulted in adjustments to the design format and software that were implemented in 2011 and continued to be applied through 2014.
In addition to the full implementation and use of the scanning software in 2011, ADF&G worked collaboratively with NMFS to modify the logbook requirements associated with the federal CHP program, a program that establishes limited access to the guided halibut fishery. Starting in 2011,
21

saltwater logbooks were designed to capture CHP numbers associated with the permits granted by NMFS to qualifying participants in the sport fish charter halibut fishery.
In July 2011, NOAA Fisheries proposed regulations to authorize GAF for the charter halibut fisheries in area 2C and area 3A within a CSP. ADF&G again worked with the NMFS to collect halibut kept data harvested under the proposed CSP as GAF by redesigning the logbook. Although the 2012 and 2013 saltwater logbooks were designed to capture GAF halibut, the federal GAF proposal was not in effect until 2014; the 2014 saltwater logbook was designed to capture GAF halibut information.
Consideration of an Electronic Reporting Option In late 2012, staff discussions included the possibility of an electronic submission option that would provide data to ADF&G and NPFMC staff in a more timely manner. Options and discussions were further brought up early in the 2014 legislative session. Electronic reporting options were, at first, perceived as a method to fulfill both ADF&G management needs and halibut management needs for more timely information. It was agreed that any option for a logbook change would have to include a design that is appealing and easy for the guide industry to use, such that they would perceive it as beneficial to a process that they already consider “burdensome.” Further discussions, however, concluded that due to enforcement and trip recording requirements, electronic reporting would still necessitate the use of a paper version of the logbook. Data would still need to be verified for errors, be entered accurately in a timely manner into a database, and be available for onsite inspection. There are currently no identified benefits to managers or the industry that would result from going “paperless”. In addition, the “paperless” approach would require a change in regulation for reporting requirements, along with extensive research into the cost of electronic reporting. The discussion for going “paperless,” however, is ongoing. Electronic reporting options were further discussed during the 2014 legislative session in reference to Senate Bill 79 (SB79). SB79, a Sport Fishing Guide Services bill, entertained the feasibility and possible future requirement of electronic reporting of logbook data. As a result, division staff designed a mail-out survey to query previously licensed charter business owners to determine the extent and interest the industry has in adopting electronic reporting options (Appendix G1).
In June 2013, a short 3-question survey was mailed to 1,275 guided sport fish business owners who were licensed in 2012; 41% or 526 responded to the postage paid survey. To assist with demography, sport fish business owners were asked if they provided freshwater, saltwater, or both types of services. They were then asked whether they would prefer electronic or paper options as a reporting mechanism if provided with both options. Based on their response to question #2, question #3 followed with a question on which method—electronic or paper—they would prefer if a paper logbook were still required at the time of landing.
In summary, those who provided saltwater only or both saltwater and freshwater services preferred using the paper version of the logbook to report their activity. Freshwater operators were split between both paper and electronic options. It was understandable that freshwater operators were split on their preference when considering the remote nature of many these businesses.
With the inability to speculate on the future of the electronic reporting design, the survey had to be designed to encompass the broadest possible scenarios, including the possibility that operators may still have to maintain a paper logbook while in the field and then choose to either
22

electronically submit the trip information or submit the paper logbook page. The final question on the survey asked the operator if he or she would choose to file electronically or by paper if a paper logbook were still required to be completed at the time of landing.
Of the 526 respondents, 61% indicated that if a paper logbook were required at the time of landing, they would prefer to submit that data page rather than translate the information into an electronic format. The suggestion that a paper logbook may still be required at the time of landing seems to diminish the enthusiasm for electronic reporting.
Survey responses were summarized in September 2014 and made available to the division director in time for the 2014 legislative session. It became clear during evaluation of the survey summary that any development of an electronic reporting program would still have to include a paper logbook option.
Verification of Logbook Harvest Data Preliminary results from verification studies comparing the accuracy of logbook harvest data with the statewide harvest survey estimates and onsite creel programs are favorable (Meyer and Powers 2009). Logbook data will continue to be compared to counts from these programs. Comparisons are ongoing and are part of a more comprehensive evaluation of logbook data quality. Saltwater and freshwater logbook data have also been used for a variety of regulatory analyses for state-managed species. With the federal adoption of the CSP, the saltwater logbook has become the standard measurement tool used by the NPFMC for halibut management.
ACKNOWLEDGEMENTS Southeast and Southcentral regional and area staff, especially numerous front counter personnel, have been critical to the success of the ADF&G sport fishing guide and business licensing and logbook program. The above staff along with Bob Chadwick and Mike Jaenicke from Southeast; Scott Meyer, Matt Miller, and Tom Vania from Southcentral; and Tom Taube from Fairbanks have also provided valuable comments during the process of licensing and logbook form design.
Jim Hasbrouck’s thoughtful insight and direction has been very much appreciated.
Kirk Brogdon of the division’s Research and Technical Services section deserves considerable credit for designing and implementing efficient information management systems for data capture, scanning, cleaning, storage, and reporting.
Kathy Kush and Cindy Palmatier should be acknowledged for their incredible skills in streamlining the licensing process and making sure that all license applications are processed in a timely manner that has allowed the guides and businesses to start operation without delay.
Diane Novinska, Raili Kedzior, Andrea Hamby, and Michaela Young deserve credit for receiving, editing, scanning, entering, and filing the licensing and logbooks forms. Their knowledge has enhanced public relations critical to maintaining a relationship with the industry and encouraging compliance. With their perseverance, we’ve continued to meet reporting deadlines that seemed nearly impossible with available staffing and workloads.
We also acknowledge the cooperation of the thousands of sport fishing guides and sport fishing businesses that licensed and completed their logbooks in a timely and compliant manner.
23

REFERENCES CITED Chapell, R. S. 2010. Production, escapement, and juvenile tagging of Chilkat River Chinook salmon in 2007. Alaska
Department of Fish and Game, Fishery Data Series No. 10-86, Anchorage. http://www.sf.adfg.state.ak.us/FedAidpdfs/FDS10-86.pdf
Dean, M. R. 2001. Alaska Department of Fish and Game sportfishing guide and business registration and saltwater sportfishing charter vessel logbook program, 1999. Alaska Department of Fish and Game, Special Publication No. 01-1, Anchorage. http://www.sf.adfg.state.ak.us/FedAidPDFs/sp01-01.pdf
Dean, M. R., and A. L. Howe. 1999. Alaska Department of Fish and Game sportfishing guide and business registration and saltwater sportfishing charter vessel logbook program, 1998. Alaska Department of Fish and game, Special Publication No. 99-1, Anchorage. http:/www.sf.adfg.state.ak.us/FedAidPDFs/sp99-01.pdf
Jennings, G. B., K. Sundet, and A. E. Bingham. 2011. Estimates of participation, catch, and harvest in Alaska sport fisheries during 2010. Alaska Department of Fish and Game, Fishery Data Series No. 11-60, Anchorage. http://www.adfg.alaska.gov/FedAidpdfs/FDS11-60.pdf
Meyer, S. and R. Powers. 2009. Evaluation of Alaska charter logbook data for 2006-2008. Discussion paper for the North Pacific Fishery Management Council, September 21, 2009. Alaska Department of Fish and Game, Anchorage. http://www.npfmc.org/wp-content/PDFdocuments/halibut/logbookeval909.pdf
Sigurdsson, D. 2014. Alaska Department of Fish and Game statewide freshwater guided sport fishing logbook reporting program, 2014–2016. Alaska Department of Fish and Game, Division of Sport Fish, Regional Operational Plan ROP.SF.4A.2014.02, Anchorage. http://www.adfg.alaska.gov/FedAidpdfs/ROP.SF.4A.2014.02
Sigurdsson, D., and B. Powers. 2014. Participation, effort, and harvest in the sport fish business/guide licensing and logbook programs, 2013. Alaska Department of Fish and Game, Fishery Data Series No. 14-23, Anchorage. http://www.adfg.alaska.gov/FedAidPDFs/FDS14-23.pdf
Sigurdsson, D., and B. Powers. 2013. Participation, effort, and harvest in the sport fish business/guide licensing and logbook programs, 2012. Alaska Department of Fish and Game, Fishery Data Series No. 13-37, Anchorage. http://www.adfg.alaska.gov/FedAidPDFs/FDS13-37.pdf
Sigurdsson, D., and B. Powers. 2012. Participation, effort, and harvest in the sport fish business/guide licensing and logbook reporting programs, 2011. Alaska Department of Fish and Game, Fishery Data Series No. 12-27, Anchorage. http://www.adfg.alaska.gov/FedAidPDFs/FDS12-27.pdf
Sigurdsson, D., and B. Powers. 2011. Participation, effort, and harvest in the sport fish business/guide licensing and logbook reporting programs, 2010. Alaska Department of Fish and Game, Fishery Data Series No. 11-31, Anchorage. http://www.sf.adfg.state.ak.us/FedAidPDFs/FDS11-31.pdf
Sigurdsson, D., and B. Powers. 2010. Participation, effort, and harvest in the sport fish business/guide licensing and logbook reporting programs, 2009. Alaska Department of Fish and Game, Fishery Data Series No. 10-65, Anchorage. http://www.sf.adfg.state.ak.us/FedAidPDFs/FDS10-65.pdf
Sigurdsson, D., and B. Powers. 2009. Participation, effort, and harvest in the sport fish business/guide licensing and logbook reporting programs, 2006-2008. Alaska Department of Fish and Game, Special Publication No. 09-11, Anchorage. http://www.sf.adfg.state.ak.us/FedAidPDFs/SP09-11.pdf
Wendt, K. L., and M. J. Jaenicke. In prep. Harvest estimates for selected marine sport fisheries in Southeast Alaska during 2010. Alaska Department of Fish and Game, Fishery Data Series, Anchorage.
24

APPENDIX A.
SPORT FISH BUSINESS OWNER/GUIDE LICENSE APPLICATION
25
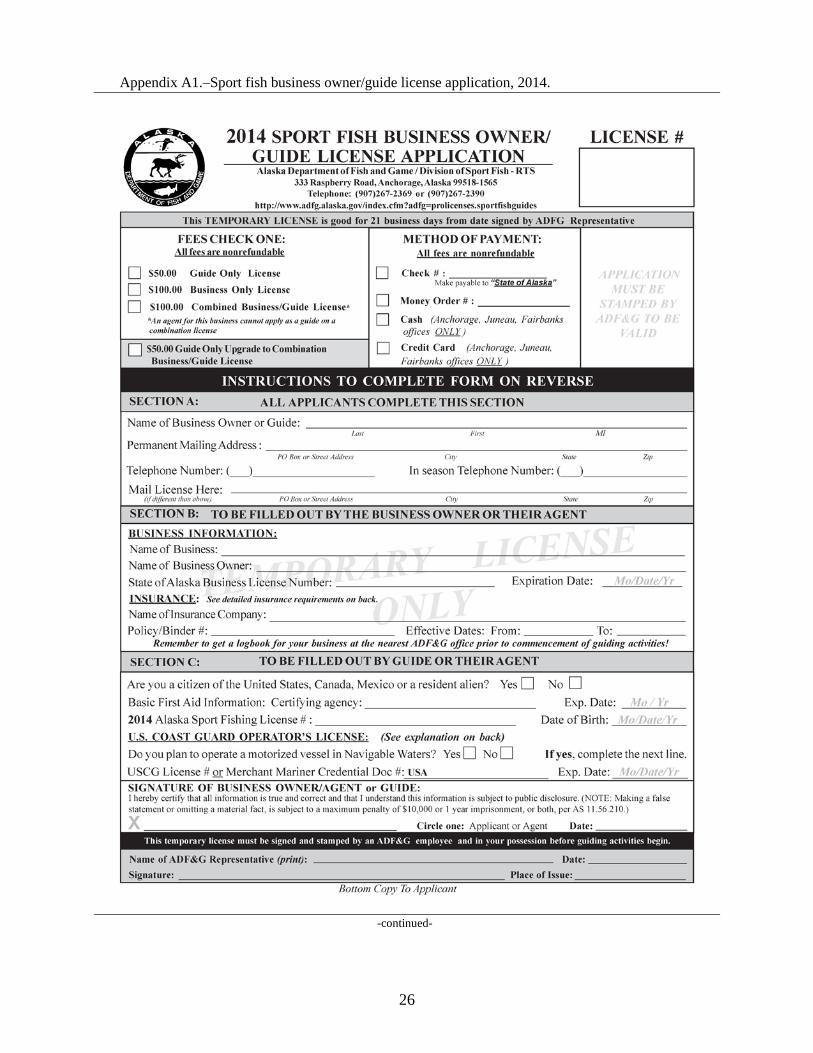
Appendix A1.–Sport fish business owner/guide license application, 2014.
-continued-
26

Appendix A1.–Page 2 of 2.
27

28

APPENDIX B.
SALTWATER LOGBOOK FORM
29

Appendix B1.–Saltwater charter logbook form, 2014.
-continued-
30

Appendix B1.–Page 2 of 2.
31

32

APPENDIX C.
FRESHWATER LOGBOOK FORMS
33

Appendix C1.–Freshwater guide logbook from, 2014.
-continued-
34

Appendix C1.–Page 2 of 2.
35

36

APPENDIX D.
VESSEL REGISTRATION FORMS, DECALS, AND TAGS
37

Appendix D1.–Saltwater sport fish charter logbook sign-out and vessel registration form, 2014.
38

Appendix D2.–Freshwater sport fish guide vessel registration form, 2014.
39

Appendix D3.–Vessel decal, 2014.
Appendix D4.–Vessel tab, 2014.
40

APPENDIX E.
SALTWATER EDITING RESULTS
41

42
Appendix E1.–Saltwater editing results, 2014.
Edit Number of occurrences No guide license number 10 Invalid guide license number 1 Missing date 0 Invalid date (not in correct year) 0 Invalid port of offloading 1 Missing salmon statistical area 16 Missing bottomfish statistical area 31 Invalid salmon statistical area 12 Invalid bottomfish statistical area 32 Salmon harvest no salmon statistical area 1,077 Bottomfish harvest no bottomfish statistical area 1,975 Salmon statistical area listed, no hours listed 429 Bottomfish statistical area listed, no hours listed 571 No statistical area listed 59 No hours listed 43 Possible invalid salmon statistical area 0 Possible invalid bottomfish statistical area 0 Log pages turned in latea 3,351 Log book wasn't checked out to a business 0 Salmon or bottomfish hours are greater than 12 47 Duplicate log pages 0 Trip records without any angler records 0 Date fished greater than date received by ADF&G 1
Total saltwater trips 50,152
a Late includes an additional 7-day grace period.
ADF&G
Report Revisions
Values in this table were updated on September 1, 2016 to reflect 2014 data. The previously-published version of this table displayed values from 2013 data.

43
APPENDIX F.
FRESHWATER EDITING RESULTS

44
Appendix F1.–Freshwater editing results, 2014.
Edit Number of occurrences
No guide license number 0 Invalid guide license number 3 Missing date 0 Invalid date (not in correct year) 0 Missing site code 0 Invalid site code 0 Log pages turned in latea 6,293 Duplicate log pages 0 Date fished greater than date received by ADF&G 83 Log book wasn't checked out to a business 0 Kenai River trips on Sunday or Monday 334 Trip records without any angler records 0
Total freshwater trips 40,152 a Late includes an additional 7-day grace period.
ADF&G
Report Revisions
Values in this table were updated on September 1, 2016 to reflect 2014 data. The previously-published version of this table displayed values from 2013 data.
APPENDIX G.
ELECTRONIC REPORTING SURVEY
45

Appendix G1.–Electronic logbook reporting mail-in survey, 2014.
-continued-
46
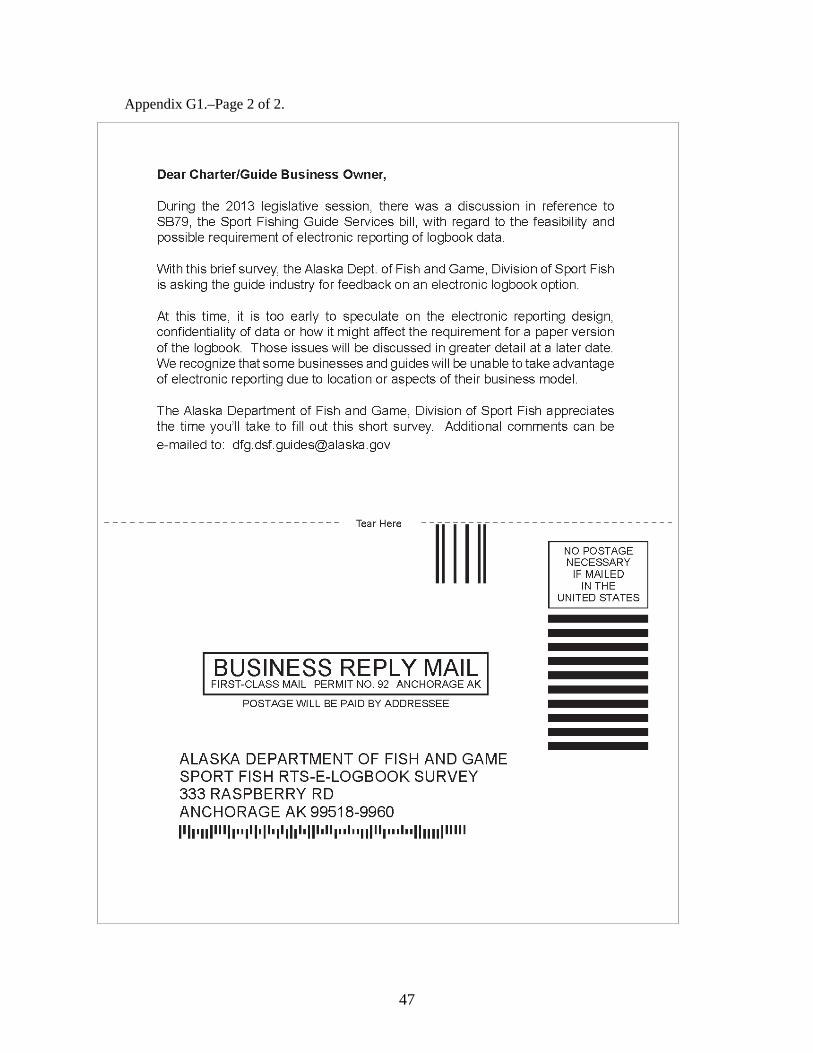
Appendix G1.–Page 2 of 2.
47

48

APPENDIX H.
FRESHWATER LOGBOOK SUMMARIES BY AREA AND SITE
49

50
Appendix H1.–Freshwater logbook participation by area and site, Southeast Alaska, 2014.
Angler-Days
Area Site Businessesa Guidesa Trips Resident Non-Res Comped Unknown Crew Total A Lakes and streams 4 7 63 0 161 0 7 0 168 B Thorne River and Lake 4 8 49 3 112 0 1 0 116 B Other lakes and streams 9 17 114 5 248 0 0 0 253 C Lakes and streams 8 14 97 11 263 0 0 0 274 D Baranof Island streams and lakes 9 31 193 4 607 1 3 3 618 D Chichagof Island streams and lakes 6 10 11 0 31 0 0 0 31 D Eva Lake and Stream (Baranof Island) 6 15 40 3 162 0 1 2 168 D Katlian River (Baranof Island) 4 8 40 1 116 0 1 0 118 D Nakwasina Sound streams (Baranof Island) 7 11 55 0 189 0 8 1 198 D Plotnikof system stream and lake (Baranof Island) 4 4 13 0 33 0 0 0 33 D Politofski Creek (Baranof Island) 4 5 13 1 38 0 0 1 40 D Rezanof system stream and lakes (Baranof Island) 5 5 8 0 25 0 0 1 26 D Sitkoh Creek and Lake (Chichagof Island) 4 5 17 5 45 0 0 0 50 D Other lakes and streams 9 17 57 6 181 0 0 2 189 E Admiralty Island streams (Admiralty Island) 7 30 176 6 740 1 3 1 751 E Other lakes and streams 7 21 213 13 995 0 2 2 1,012 F&G Lakes and streams 9 14 187 1 685 0 13 9 708 H Situk River (above weir) 5 18 539 95 1,164 0 3 169 1,431 H Situk River (below weir) 5 7 27 3 64 0 1 21 89 H Tsiu River 5 23 534 118 1,981 0 6 96 2,201 H Other streams 10 24 423 45 1,677 0 3 58 1,783 Total Southeast 59 156 2,869 320 9,517 2 52 366 10,257
Note: Responses with fewer than 4 businesses are not reported separately, to protect confidentiality of respondents. Data are current as of 11/09/2015. a Regional and statewide business and guide totals are not additive because a business and/or guide can operate in multiple sites and areas.

51
Appendix H2.–Freshwater logbook participation by area and site, Southcentral Alaska, 2014.
Angler-Days
Area Site Businessesa Guidesa Trips Resident Non-Res Comped Unknown Crew Total J East Prince William Sound lakes and streams 4 11 112 27 504 1 0 12 544 J Other lakes and streams 7 9 44 11 180 0 1 3 195 K Little Susitna River 5 7 134 162 354 4 2 34 556 K Little Susitna River above weir 4 6 124 137 320 0 1 11 469 K Other lakes and streams 4 4 21 14 41 2 0 5 62 M Chunilna Creek (Clear Creek) 5 13 207 34 807 0 2 3 846 M Deshka River (Kroto Creek) above weir 5 5 65 14 162 0 0 2 178 M Deshka River (Kroto Creek) below weir 11 14 266 332 689 0 6 3 1,030 M Eightmile Creek 4 5 15 5 38 0 0 0 43 M Fish Lake Creek and Fish Lakes (Yentna drainage) 4 10 19 0 45 0 0 0 45 M Indian Creek (into Yentna near Fish Lakes) 4 9 75 0 284 0 0 2 286 M Lake Creek 14 50 995 65 2,639 3 2 26 2,735 M Little Willow Creek 4 4 19 15 42 0 1 6 64 M Talachulitna Creek 4 6 50 1 88 0 1 0 90 M Talachulitna River 8 15 259 36 761 0 1 2 800 M Talkeetna River 7 19 377 163 1,362 0 21 3 1,549 M Yentna River drainage (remainder) 14 33 330 4 991 1 0 21 1,017 M Other Chulitna /East Susitna drainage lakes and streams 12 13 34 12 101 0 0 2 115 M Other West Susitna drainage lakes and streams 5 9 39 17 133 0 3 0 153 M Other streams 4 4 16 4 40 0 0 1 45 N Bachatna Creek 11 11 22 0 99 0 0 0 99 N Big River 6 13 124 28 425 0 5 4 462 N Big River Lakes 26 38 754 133 2,787 1 14 12 2,947 N Chuitna River 7 7 22 8 99 0 2 0 109 N Coal Creek (into Beluga Lake) 4 7 23 4 61 0 0 1 66 N Crescent Lake 19 25 86 29 327 0 1 7 364 N Crescent River (Grecian River) 10 11 27 5 122 0 2 0 129 N Kamishak River 8 28 147 3 368 0 5 2 378 N Kustatan River 26 33 162 30 662 0 3 1 696 N Sites between North Forelands and Susitna drainage 5 5 5 0 20 0 0 0 20 N Sites south of North Forelands 13 16 53 2 164 0 2 5 173
-continued-

52
Appendix H2.–Page 2 of 4.
Angler-Days
Area Site Businessesa Guidesa Trips Resident Non-Res Comped Unknown Crew Total N Wolverine Creek mouth (by Big River Lakes) 17 37 516 91 1,977 2 4 19 2,093 P Anchor River 5 10 75 18 139 0 4 0 161 P Deep Creek 5 5 31 1 105 1 0 3 110 P Kasilof River - above Highway 35 56 296 33 947 1 5 31 1,017 P Kasilof River - below Highway 67 119 1,310 407 3,743 10 42 20 4,222 P Kasilof River - guided, reach not specified 5 5 12 1 35 0 0 0 36 P Kenai River - Cook Inlet to Soldotna Bridge 126 188 3,698 1,495 11,210 26 79 65 12,875 P Kenai River - Soldotna Bridge to Moose R 44 68 756 121 2,377 2 7 19 2,526 P Kenai River - Moose River to Skilak outlet 85 142 1,858 937 5,007 7 23 41 6,015 P Kenai River - Skilak Inlet to Kenai Lake 42 90 2,679 1,018 7,022 9 119 159 8,327 P Kenai River - guided, reach not specified 14 16 28 13 66 0 4 0 83 P Ninilchik River 4 4 30 15 93 3 0 0 111 P Quartz Creek 8 13 35 4 61 0 1 1 67 P Russian River 9 22 191 29 386 0 10 18 443 P Other lakes 12 13 42 1 102 1 1 16 121 P Other streams 5 6 51 7 212 1 2 1 223 Q Afognak Island streams 4 4 7 1 22 0 0 4 27 Q American River 5 6 27 3 66 0 3 14 86 Q Ayakulik River - above weir 4 7 118 13 472 0 0 0 485 Q Browns Lagoon River 4 6 11 0 50 0 1 5 56 Q Buskin River 4 4 11 2 20 0 0 6 28 Q Dog Salmon Creek (Frazer River) 4 8 61 10 236 0 0 2 248 Q Karluk lake and river above weir 5 13 40 2 170 0 0 21 193 Q Saltery Creek 9 19 194 52 660 7 0 55 774 Q Zachar Bay streams 4 6 22 2 55 0 0 3 60 Q Other remote lakes 5 6 19 7 58 0 0 2 67 Q Other roadside lakes and streams 6 6 52 9 171 0 0 15 195 Q Other streams 20 32 303 35 990 0 1 50 1,076 R American Creek 16 51 353 26 807 1 5 2 841 R Becharof system 12 50 194 10 448 0 4 1 463 R Big Creek (into Naknek) 5 21 73 8 148 0 1 1 158
-continued-

53
Appendix H2.–Page 3 of 4.
Angler-Days
Area Site Businessesa Guidesa Trips Resident Non-Res Comped Unknown Crew Total R Brooks Lake 4 5 5 0 12 0 0 0 12 R Brooks River (into Naknek Lake) 23 97 441 61 957 3 24 6 1,051 R Contact Creek 10 48 146 9 348 0 6 0 363 R Egegik River (Becharof system) 7 28 186 6 682 0 3 23 714 R Naknek River (dwnstream frm Rapids Camp incl trib) 12 41 324 29 671 0 14 3 717 R Naknek River (Rapids Camp upstream to Naknek Lk, incl trib) 14 54 867 83 1,858 7 14 16 1,978 R Naknek River and Tributaries 15 58 213 43 550 3 7 1 604 R Swikshak River 4 11 35 19 124 0 0 0 143 R Ugashik system 11 38 128 5 309 0 2 0 316 R Other lakes 4 5 11 0 23 0 0 0 23 R Other streams 18 74 1,288 250 2,912 0 24 8 3,194 S Alagnak (Branch) River 21 90 1,291 46 2,646 0 33 28 2,753 S Battle River 9 26 96 5 175 0 0 68 248 S Chekok Creek 5 13 18 0 40 0 0 0 40 S Copper River (Lake Iliamna area) 13 66 786 112 1,688 9 7 10 1,826 S Funnel Creek 11 28 55 2 114 0 1 0 117 S Gibraltar River 10 41 141 7 317 2 2 0 328 S Iliamna River 5 22 222 5 510 0 0 2 517 S Kijik Lake 4 4 6 0 19 0 0 0 19 S Kijik River 4 11 25 0 77 0 0 0 77 S Kukaklek River (Big Ku) (into Alagnak) 7 27 111 8 211 0 2 0 221 S Kulik River 16 59 373 44 822 0 4 0 870 S Kvichak River 23 91 666 82 1,485 0 16 44 1,627 S Lake Clark 8 14 63 3 164 0 0 4 171 S Lake Iliamna 11 30 106 1 285 0 2 0 288 S Lower Talarik Creek 8 18 83 6 195 0 0 0 201 S Moraine Creek 21 80 508 28 1,038 5 1 2 1,074 S Nanuktuk Creek 14 38 118 2 243 0 0 0 245 S Newhalen River 9 28 101 4 280 0 2 3 289 S Nonvianuk Lake 4 6 18 2 33 0 0 3 38 S Nonvianuk River (into Alagnak) 8 20 28 3 58 0 0 0 61
-continued-

54
Appendix H2.–Page 4 of 4.
Angler-Days
Area Site Businessesa Guidesa Trips Resident Non-Res Comped Unknown Crew Total S Tazimina River 7 24 132 5 280 0 0 0 285 S Other lakes and streams 5 9 13 0 29 0 0 0 29 T Agulowak River 10 43 863 227 1,085 26 8 300 1,646 T Agulukpak River 10 41 302 58 496 14 0 16 584 T Aleknagik Lake 4 19 106 11 192 3 3 16 225 T Mulchatna River 11 34 326 7 748 1 4 34 794 T Nushagak River - Black Point upstream to sonar site 25 86 1,002 572 2,386 13 18 56 3,045 T Nushagak River - sonar site to outlet of Mulchatna 33 130 1,309 596 3,531 49 8 68 4,252 T Nushagak River - upstream from mouth of Mulchatna River 8 34 381 12 647 38 15 19 731 T Nushagak River system (excluding Mulchatna drainage) 12 15 48 1 114 0 0 4 119 T Nuyakuk River (Tikchik-Nuyakuk Lake system) 4 22 151 11 313 0 1 4 329 T Togiak River system 7 57 965 45 1,970 2 2 45 2,064 T Wood River 4 14 56 3 122 0 4 0 129 T Wood River Lakes system 10 32 238 30 441 55 2 12 540 T Other lakes and streams 6 29 271 12 518 5 5 2 542 Other lakes and streams in Southcentral 4 7 50 6 110 0 2 1 119 Total Southcentral 367 1,020 32,391 8,127 84,398 318 627 1,540 95,010 Note: Responses with fewer than 4 businesses are not reported separately, to protect confidentiality of respondents. Data are current as of 11/09/2015. a Regional and statewide business and guide totals are not additive because a business and/or guide can operate in multiple sites and areas.

55
Appendix H3.–Freshwater logbook participation by area and site, Arctic-Yukon-Kuskokwim Alaska, 2014.
Angler-Days
Area Site Businessesa Guidesa Trips Resident Non-Res Comped Unknown Crew Total I Klutina River 8 13 201 202 447 6 7 11 673 I Other lakes and streams 10 15 71 30 198 6 0 30 264 U Chena Lakes Recreation Area 5 9 81 2 339 0 0 24 365 U Other lakes 6 13 153 35 932 15 1 103 1,086 U Other stocked lakes 5 6 13 1 132 1 0 12 146 U Other streams 9 26 685 49 1,460 2 9 20 1,540 V Aniak River 4 19 255 5 468 23 7 11 514 V Goodnews River 11 50 829 33 1,659 4 13 29 1,738 V Holitna River 5 17 192 23 455 0 14 6 498 V Kanektok River (Quinhagak, Chosen) 8 63 1,286 17 2,516 1 23 10 2,567 V Kuskokwim River drainages below and including Aniak River 4 11 113 90 253 1 6 35 385 V Other lakes and streams 7 10 38 0 118 1 0 15 134 Y Yukon River drainages downstream of Koyukuk River 4 23 612 35 1,172 0 11 2 1,220 Other lakes and streams in Arctic-Yukon-Kuskokwim 5 12 363 62 675 0 0 16 753 Total Arctic-Yukon-Kuskokwim 56 229 4,892 584 10,824 60 91 324 11,883 Note: Responses with fewer than 4 businesses are not reported separately, to protect confidentiality of respondents. Data are current as of 11/09/2015. a Regional and statewide business and guide totals are not additive because a business and/or guide can operate in multiple sites and areas.

56
Appendix H4.–Freshwater logbook participation by region, Statewide, 2014.
Angler-Days
Region Businessesa Guidesa Trips Resident Non-Res Comped Unknown Crew Total Southeast 59 156 2,869 320 9,517 2 52 366 10,257 Southcentral 367 1,020 32,391 8,127 84,398 318 627 1,540 95,010 Arctic-Yukon-Kuskokwim 56 229 4,892 584 10,824 60 91 324 11,883 Total 465 1,322 40,152 9,031 104,739 380 770 2,230 117,150 Note: Data are current as of 11/09/2015. a Regional and statewide business and guide totals are not additive because a business and/or guide can operate in multiple sites and areas.
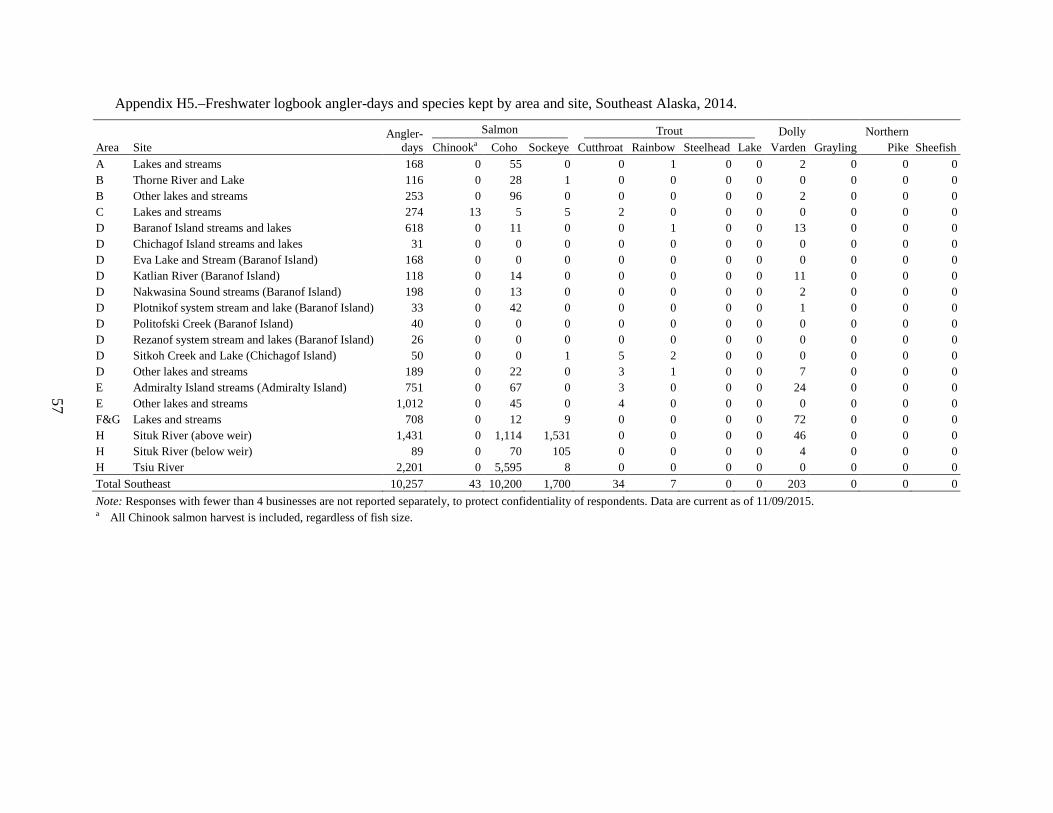
57
Appendix H5.–Freshwater logbook angler-days and species kept by area and site, Southeast Alaska, 2014.
Angler-
days Salmon Trout Dolly
Northern
Area Site Chinooka Coho Sockeye Cutthroat Rainbow Steelhead Lake Varden Grayling Pike Sheefish A Lakes and streams 168 0 55 0 0 1 0 0 2 0 0 0 B Thorne River and Lake 116 0 28 1 0 0 0 0 0 0 0 0 B Other lakes and streams 253 0 96 0 0 0 0 0 2 0 0 0 C Lakes and streams 274 13 5 5 2 0 0 0 0 0 0 0 D Baranof Island streams and lakes 618 0 11 0 0 1 0 0 13 0 0 0 D Chichagof Island streams and lakes 31 0 0 0 0 0 0 0 0 0 0 0 D Eva Lake and Stream (Baranof Island) 168 0 0 0 0 0 0 0 0 0 0 0 D Katlian River (Baranof Island) 118 0 14 0 0 0 0 0 11 0 0 0 D Nakwasina Sound streams (Baranof Island) 198 0 13 0 0 0 0 0 2 0 0 0 D Plotnikof system stream and lake (Baranof Island) 33 0 42 0 0 0 0 0 1 0 0 0 D Politofski Creek (Baranof Island) 40 0 0 0 0 0 0 0 0 0 0 0 D Rezanof system stream and lakes (Baranof Island) 26 0 0 0 0 0 0 0 0 0 0 0 D Sitkoh Creek and Lake (Chichagof Island) 50 0 0 1 5 2 0 0 0 0 0 0 D Other lakes and streams 189 0 22 0 3 1 0 0 7 0 0 0 E Admiralty Island streams (Admiralty Island) 751 0 67 0 3 0 0 0 24 0 0 0 E Other lakes and streams 1,012 0 45 0 4 0 0 0 0 0 0 0 F&G Lakes and streams 708 0 12 9 0 0 0 0 72 0 0 0 H Situk River (above weir) 1,431 0 1,114 1,531 0 0 0 0 46 0 0 0 H Situk River (below weir) 89 0 70 105 0 0 0 0 4 0 0 0 H Tsiu River 2,201 0 5,595 8 0 0 0 0 0 0 0 0 Total Southeast 10,257 43 10,200 1,700 34 7 0 0 203 0 0 0 Note: Responses with fewer than 4 businesses are not reported separately, to protect confidentiality of respondents. Data are current as of 11/09/2015. a All Chinook salmon harvest is included, regardless of fish size.

58
Appendix H6.–Freshwater logbook angler-days and species kept by area and site, Southcentral Alaska, 2014.
Angler-
days Salmon Trout Dolly
Varden Northern
Pike Area Site Chinooka Coho Sockeye Cutthroat Rainbow Steelhead Lake Grayling Sheefish J East Prince William Sound lakes and streams 544 0 857 0 0 0 0 0 12 0 0 0 J Other lakes and streams 195 9 145 136 0 0 0 0 5 0 0 0 K Little Susitna River 556 67 586 1 0 1 0 0 0 0 0 0 K Little Susitna River above weir 469 74 522 1 0 0 0 0 0 0 0 0 K Other lakes and streams 62 2 0 0 0 61 0 0 41 0 0 0 M Chunilna Creek (Clear Creek) 846 0 204 0 0 0 0 0 1 0 0 0 M Deshka River (Kroto Creek) above weir 178 55 138 0 0 28 0 0 0 0 5 0 M Deshka River (Kroto Creek) below weir 1,030 335 62 0 0 5 0 0 0 0 0 0 M Eightmile Creek 43 0 80 0 0 0 0 0 0 0 0 0 M Fish Lake Creek and Fish Lakes (Yentna drainage) 45 9 0 0 0 0 0 0 0 0 144 0 M Indian Creek (into Yentna near Fish Lakes) 286 0 521 0 0 0 0 0 0 0 2 0 M Lake Creek 2,735 221 1,061 138 0 24 0 0 1 11 19 0 M Little Willow Creek 64 0 58 0 0 1 0 0 0 0 0 0 M Talachulitna Creek 90 0 9 26 0 0 0 0 0 0 0 0 M Talachulitna River 800 4 299 120 0 1 0 0 7 0 0 0 M Talkeetna River 1,549 0 818 945 0 2 0 0 4 0 0 0 M Yentna River drainage (remainder) 1,017 41 1,035 217 0 1 0 0 3 7 14 0 M Other Chulitna /East Susitna drainage lakes and streams 115 0 110 17 0 0 0 0 0 0 9 0 M Other West Susitna drainage lakes and streams 153 0 205 18 0 2 0 0 0 0 7 0 M Other streams 45 0 32 0 0 0 0 2 0 1 0 0 N Bachatna Creek 99 0 265 0 0 0 0 0 0 0 0 0 N Big River 462 0 514 741 0 0 0 0 0 0 0 0 N Big River Lakes 2,947 0 2,272 5,768 0 0 0 0 5 0 0 0 N Chuitna River 109 0 166 4 0 0 0 0 4 0 0 0 N Coal Creek (into Beluga Lake) 66 0 16 33 0 0 0 0 1 0 0 0 N Crescent Lake 364 0 143 375 0 10 0 4 50 2 0 0 N Crescent River (Grecian River) 129 0 31 133 0 0 0 0 15 0 0 0 N Kamishak River 378 0 366 3 0 0 0 0 25 0 0 0 N Kustatan River 696 0 1,606 67 0 0 0 0 5 0 0 0 N Sites between North Forelands and Susitna drainage 20 0 25 25 0 0 0 0 0 0 0 0 N Sites south of North Forelands 173 0 282 45 0 0 0 0 0 0 0 0
-continued-

59
Appendix H6.–Page 2 of 4.
Angler- Salmon Trout Dolly
Northern
Area Site days Chinooka Coho Sockeye Cutthroat Rainbow Steelhead Lake Varden Grayling Pike Sheefish N Wolverine Creek mouth (by Big River Lakes) 2,093 0 498 5,114 0 0 0 0 1 0 0 0 P Anchor River 161 8 2 0 0 0 0 0 21 0 0 0 P Deep Creek 110 9 67 0 0 0 0 0 6 0 0 0 P Kasilof River - above Highway 1,017 2 66 2,016 0 0 0 0 7 0 0 0 P Kasilof River - below Highway 4,222 270 652 1,685 5 0 0 0 4 0 0 0 P Kasilof River - guided, reach not specified 36 0 4 49 0 0 0 0 0 0 0 0 P Kenai River - Cook Inlet to Soldotna Bridge 12,875 295 7,942 7,037 0 31 0 0 92 0 0 0 P Kenai River - Soldotna Bridge to Moose R 2,526 0 682 4,204 0 3 0 0 1 0 0 0 P Kenai River - Moose River to Skilak outlet 6,015 4 2,198 5,774 0 37 0 0 45 0 0 0 P Kenai River - Skilak Inlet to Kenai Lake 8,327 0 208 4,479 0 52 0 0 101 1 0 0 P Kenai River - guided, reach not specified 83 0 11 30 0 0 0 0 0 0 0 0 P Ninilchik River 111 106 57 0 0 0 0 0 3 0 0 0 P Quartz Creek 67 0 0 0 0 0 0 0 0 0 0 0 P Russian River 443 0 11 283 0 0 0 0 1 0 0 0 P Other lakes 121 0 13 30 0 49 0 0 0 0 0 0 P Other streams 223 0 56 0 0 0 0 0 38 0 0 0 Q Afognak Island streams 27 0 24 14 0 0 0 0 0 0 0 0 Q American River 86 31 24 0 0 0 0 0 22 0 0 0 Q Ayakulik River - above weir 485 0 127 248 0 0 0 0 51 0 0 0 Q Browns Lagoon River 56 0 3 0 0 0 0 0 1 0 0 0 Q Buskin River 28 0 6 6 0 0 0 0 0 0 0 0 Q Dog Salmon Creek (Frazer River) 248 0 263 576 0 0 0 0 1 0 0 0 Q Karluk lake and river above weir 193 0 98 54 0 0 3 0 17 0 0 0 Q Saltery Creek 774 1 325 1,198 0 0 0 0 34 0 0 0 Q Zachar Bay streams 60 0 71 4 0 0 0 0 4 0 0 0 Q Other remote lakes 67 0 136 25 0 0 0 0 1 0 0 0 Q Other roadside lakes and streams 195 7 83 41 0 0 0 0 16 0 0 0 Q Other streams 1,076 0 1,065 741 0 0 1 0 158 0 0 0 R American Creek 841 0 0 0 0 4 0 0 10 0 0 0 R Becharof system 463 0 2 30 0 1 0 0 17 6 0 0 R Big Creek (into Naknek) 158 0 351 0 0 0 0 0 0 0 0 0 R Brooks Lake 12 0 0 0 0 0 0 0 0 0 0 0
-continued-

60
Appendix H6.–Page 3 of 4.
Angler- Salmon Trout Dolly
Northern
Area Site days Chinooka Coho Sockeye Cutthroat Rainbow Steelhead Lake Varden Grayling Pike Sheefish R Brooks River (into Naknek Lake) 1,051 0 0 9 0 0 0 1 0 0 0 0 R Contact Creek 363 1 0 1 0 0 0 0 6 0 0 0 R Egegik River (Becharof system) 714 4 1,985 53 0 0 0 0 8 0 0 0 R Naknek River (dwnstream frm Rapids Camp incl trib) 717 229 593 102 0 15 0 0 0 0 0 0
R Naknek River (Rapids Camp upstream to Naknek Lk, incl trib) 1,978 132 970 2,068 0 16 0 0 5 2 1 0
R Naknek River and Tributaries 604 0 0 0 0 0 0 0 7 0 0 0 R Swikshak River 143 0 407 0 0 0 0 0 0 0 0 0 R Ugashik system 316 2 113 7 0 0 0 0 8 0 0 0 R Other lakes 23 0 15 0 0 0 0 3 0 0 2 0 R Other streams 3,194 379 1,737 701 0 0 0 0 48 2 0 0 S Alagnak (Branch) River 2,753 349 1,326 1,430 0 0 0 29 36 6 0 0 S Battle River 248 0 0 0 0 0 0 0 0 0 0 0 S Chekok Creek 40 0 1 0 0 0 0 0 0 0 0 0 S Copper River (Lake Iliamna area) 1,826 0 10 333 0 0 0 0 0 0 0 0 S Funnel Creek 117 0 0 0 0 0 0 0 0 0 0 0 S Gibraltar River 328 0 0 87 0 0 0 0 0 0 0 0 S Iliamna River 517 0 0 259 0 0 0 0 2 0 0 0 S Kijik Lake 19 0 0 0 0 0 0 2 2 0 0 0 S Kijik River 77 0 0 0 0 0 0 1 2 49 0 0 S Kukaklek River (Big Ku) (into Alagnak) 221 0 0 46 0 0 0 1 0 0 0 0 S Kulik River 870 0 1 0 0 0 0 1 0 7 0 0 S Kvichak River 1,627 0 170 1,398 0 7 0 10 10 9 0 0 S Lake Clark 171 0 0 0 0 0 0 3 1 2 1 0 S Lake Iliamna 288 0 79 420 0 0 0 0 0 0 0 0 S Lower Talarik Creek 201 0 0 8 0 0 0 0 0 0 0 0 S Moraine Creek 1,074 0 12 1 0 0 0 1 0 13 0 0 S Nanuktuk Creek 245 0 0 2 0 0 0 0 1 7 0 0 S Newhalen River 289 0 34 516 0 0 0 4 0 9 0 0 S Nonvianuk Lake 38 0 0 2 0 2 0 0 0 0 0 0
-continued-

61
Appendix H6.–Page 4 of 4.
Angler- Salmon Trout Dolly
Northern
Area Site days Chinooka Coho Sockeye Cutthroat Rainbow Steelhead Lake Varden Grayling Pike Sheefish R Brooks River (into Naknek Lake) 1,051 0 0 9 0 0 0 1 0 0 0 0 R Contact Creek 363 1 0 1 0 0 0 0 6 0 0 0 R Egegik River (Becharof system) 714 4 1,985 53 0 0 0 0 8 0 0 0
R Naknek River (dwnstream frm Rapids Camp incl trib) 717 229 593 102 0 15 0 0 0 0 0 0
R Naknek River (Rapids Camp upstream to Naknek Lk,incl trib) 1,978 132 970 2,068 0 16 0 0 5 2 1 0
R Naknek River and Tributaries 604 0 0 0 0 0 0 0 7 0 0 0 R Swikshak River 143 0 407 0 0 0 0 0 0 0 0 0 R Ugashik system 316 2 113 7 0 0 0 0 8 0 0 0 R Other lakes 23 0 15 0 0 0 0 3 0 0 2 0 R Other streams 3,194 379 1,737 701 0 0 0 0 48 2 0 0 S Alagnak (Branch) River 2,753 349 1,326 1,430 0 0 0 29 36 6 0 0 S Battle River 248 0 0 0 0 0 0 0 0 0 0 0 S Chekok Creek 40 0 1 0 0 0 0 0 0 0 0 0 S Copper River (Lake Iliamna area) 1,826 0 10 333 0 0 0 0 0 0 0 0 S Funnel Creek 117 0 0 0 0 0 0 0 0 0 0 0 S Gibraltar River 328 0 0 87 0 0 0 0 0 0 0 0 S Iliamna River 517 0 0 259 0 0 0 0 2 0 0 0 Total Southcentral 95,010 7,612 39,996 51,390 5 370 4 70 1,467 166 217 0 Note: Responses with fewer than 4 businesses are not reported separately, to protect confidentiality of respondents. Data are current as of 11/09/2015. a All Chinook salmon harvest is included, regardless of fish size.

62
Appendix H7.–Freshwater logbook angler-days and species kept by area and site, Arctic-Yukon-Kuskokwim Alaska, 2014.
Angler- Salmon Trout Dolly
Northern
Area Site days Chinooka Coho Sockeye Cutthroat Rainbow Steelhead Lake Varden Grayling Pike Sheefish I Klutina River 673 163 0 405 0 0 0 0 61 1 0 0 I Other lakes and streams 264 36 0 130 0 7 0 0 0 8 0 0 U Chena Lakes Recreation Area 365 0 0 0 0 141 0 0 15 1 0 0 U Other lakes 1,086 0 0 0 0 1,125 0 0 132 68 7 0 U Other stocked lakes 146 0 0 0 0 493 0 1 10 0 1 0 U Other streams 1,540 0 2 0 0 0 0 0 0 25 0 0 V Aniak River 514 0 139 0 0 0 0 0 54 20 7 12 V Goodnews River 1,738 5 979 156 0 1 0 5 167 1 0 0 V Holitna River 498 0 137 4 0 0 0 0 14 21 53 24 V Kanektok River (Quinhagak, Chosen) 2,567 1 982 152 0 6 0 0 53 1 0 0
V Kuskokwim River drainages below and including Aniak River 385 0 39 1 0 0 0 0 26 9 0 0
V Other lakes and streams 134 0 2 0 0 0 0 4 3 0 2 0
Y Yukon River drainages downstream of Koyukuk River 1,220 0 351 1 0 0 0 0 16 137 6 0
Other lakes and streams in Arctic-Yukon-Kuskokwim 753 0 982 0 0 0 0 0 23 16 0 1
Total Arctic-Yukon-Kuskokwim 11,883 205 3,613 849 0 1,773 0 10 574 308 76 37 Note: Responses with fewer than 4 businesses are not reported separately, to protect confidentiality of respondents. Data are current as of 11/09/2015. a All Chinook salmon harvest is included, regardless of fish size.

63
Appendix H8.–Freshwater logbook angler-days and species kept by region, Statewide, 2014.
Angler- Salmon Trout Dolly
Northern
Region days Chinooka Coho Sockeye Cutthroat Rainbow Steelhead Lake Varden Grayling Pike Sheefish Southeast 10,257 43 10,200 1,700 34 7 0 0 203 0 0 0 Southcentral 95,010 7,612 39,996 51,390 5 370 4 70 1,467 166 217 0 Arctic-Yukon-Kuskokwim 11,883 205 3,613 849 0 1,773 0 10 574 308 76 37 Total 117,150 7,860 53,809 53,939 39 2,150 4 80 2,244 474 293 37
Note: Data are current as of 11/09/2015. a All Chinook salmon harvest is included, regardless of fish size.

64
Appendix H9.–Freshwater logbook angler-days and species released by area and site, Southeast Alaska, 2014.
Angler- Salmon Trout Dolly
Northern
Area Site days Chinooka Coho Sockeye Cutthroat Rainbow Steelhead Lake Varden Grayling Pike Sheefish A Lakes and streams 168 0 75 0 103 53 5 0 332 0 0 0 B Thorne River and Lake 116 0 0 0 66 7 41 0 108 0 0 0 B Other lakes and streams 253 1 25 7 30 23 60 0 445 0 0 0 C Lakes and streams 274 49 4 8 60 45 219 0 58 0 0 0 D Baranof Island streams and lakes 618 4 28 1 1,146 347 47 0 1,112 0 0 0 D Chichagof Island streams and lakes 31 0 0 0 40 121 0 0 199 0 0 0 D Eva Lake and Stream (Baranof Island) 168 0 1 0 605 57 6 0 92 0 0 0 D Katlian River (Baranof Island) 118 0 12 0 0 30 0 0 288 0 0 0 D Nakwasina Sound streams (Baranof Island) 198 0 5 0 3 26 2 0 191 0 0 0 D Plotnikof system stream and lake (Baranof Island) 33 0 24 0 0 7 5 0 6 0 0 0 D Politofski Creek (Baranof Island) 40 0 0 0 0 49 11 0 36 0 0 0 D Rezanof system stream and lakes (Baranof Island) 26 0 0 0 0 0 38 0 25 0 0 0 D Sitkoh Creek and Lake (Chichagof Island) 50 0 11 1 350 207 4 0 23 0 0 0 D Other lakes and streams 189 0 32 2 202 147 2 0 389 0 0 0 E Admiralty Island streams (Admiralty Island) 751 0 135 6 102 11 9 0 3,087 0 0 0 E Other lakes and streams 1,012 0 23 0 54 0 7 0 6,540 0 0 0 F&G Lakes and streams 708 0 52 365 9 2 0 0 1,402 0 0 0 H Situk River (above weir) 1,431 28 2,711 1,283 0 17 1,437 0 134 0 0 0 H Situk River (below weir) 89 0 52 14 0 0 3 0 6 0 0 0 H Tsiu River 2,201 0 32,191 47 0 1 4 0 2 0 0 0 H Other streams 1,783 21 9,949 34 240 15 186 0 560 0 0 0 Total Southeast 10,257 103 45,330 1,768 3,010 1,165 2,086 0 15,035 0 0 0 Note: Responses with fewer than 4 businesses are not reported separately, to protect confidentiality of respondents. Data are current as of 11/09/2015. a All Chinook salmon released are included, regardless of fish size.

65
Appendix H10.–Freshwater logbook angler-days and species released by area and site, Southcentral Alaska, 2014.
Angler-
days Salmon Trout Dolly
Varden Northern
Pike Area Site Chinooka Coho Sockeye Cutthroat Rainbow Steelhead Lake Grayling Sheefish J East Prince William Sound lakes and streams 544 5 1,471 9 5 9 2 0 298 0 15 0 J Other lakes and streams 195 0 18 0 34 0 0 0 119 0 0 0 K Little Susitna River 556 18 44 0 0 9 0 0 0 0 0 0 K Little Susitna River above weir 469 7 19 0 0 1 0 0 0 0 0 0 K Other lakes and streams 62 0 0 0 0 428 0 0 81 2 0 0 M Chunilna Creek (Clear Creek) 846 74 157 1 0 49 0 0 12 4 0 0 M Deshka River (Kroto Creek) above weir 178 217 69 0 0 76 0 0 0 37 0 0 M Deshka River (Kroto Creek) below weir 1,030 131 3 1 0 35 0 0 0 1 0 0 M Eightmile Creek 43 1 42 0 0 26 0 0 0 0 0 0 M Fish Lake Creek and Fish Lakes (Yentna drainage) 45 16 0 0 0 0 0 0 0 0 0 0 M Indian Creek (into Yentna near Fish Lakes) 286 4 19 0 0 2 0 0 0 0 0 0 M Lake Creek 2,735 917 154 100 0 4,625 0 0 7 594 1 0 M Little Willow Creek 64 16 6 0 0 21 0 0 0 5 0 0 M Talachulitna Creek 90 11 11 37 0 531 0 0 92 87 0 0 M Talachulitna River 800 471 389 124 0 3,000 0 0 245 302 0 0 M Talkeetna River 1,549 257 192 782 0 118 0 5 419 31 0 0 M Yentna River drainage (remainder) 1,017 189 674 126 0 2,632 0 0 2,355 392 0 0 M Other Chulitna/East Susitna lakes and streams 115 3 41 101 0 64 0 0 0 22 0 0 M Other West Susitna drainage lakes and streams 153 2 33 1 0 20 0 0 1 21 79 0 M Other streams 45 11 5 0 0 380 0 22 3 175 0 0 N Bachatna Creek 99 0 91 0 0 0 0 0 44 0 0 0 N Big River 462 0 40 82 0 0 0 0 6 0 0 0 N Big River Lakes 2,947 0 224 6,075 0 0 0 0 10 0 0 0 N Chuitna River 109 2 52 7 0 43 0 0 34 0 0 0 N Coal Creek (into Beluga Lake) 66 0 0 60 0 60 0 0 1,048 1 0 0 N Crescent Lake 364 1 39 402 0 34 0 27 453 5 0 0 N Crescent River (Grecian River) 129 1 0 288 0 0 0 12 301 0 0 0 N Kamishak River 378 0 203 10 0 73 0 0 3,662 48 0 0 N Kustatan River 696 0 119 74 0 0 0 0 147 3 0 0 N Sites between N. Forelands and Susitna drainage 20 0 14 7 0 0 0 0 2 0 0 0 N Sites south of North Forelands 173 0 298 14 0 11 0 0 215 1 0 0
-continued-

66
Appendix H10.–Page 2 of 4.
Angler- Salmon Trout Dolly
Northern
Area Site days Chinooka Coho Sockeye Cutthroat Rainbow Steelhead Lake Varden Grayling Pike Sheefish N Wolverine Creek mouth (by Big River Lakes) 2,093 0 84 3,405 0 0 0 0 10 0 0 0 P Anchor River 161 1 40 0 0 2 28 0 582 0 0 0 P Deep Creek 110 5 8 0 0 2 19 0 11 0 0 0 P Kasilof River - above Highway 1,017 4 1 106 0 3 30 0 55 0 0 0 P Kasilof River - below Highway 4,222 331 1 77 2 36 32 0 157 0 0 0 P Kasilof River - guided, reach not specified 36 0 0 1 0 0 0 0 0 0 0 0 P Kenai River - Cook Inlet to Soldotna Bridge 12,875 442 241 364 0 1,565 0 0 1,447 1 0 0 P Kenai River - Soldotna Bridge to Moose R 2,526 8 66 661 0 2,985 0 0 1,497 38 0 0 P Kenai River - Moose River to Skilak outlet 6,015 11 478 1,473 0 14,017 0 19 10,765 40 0 0 P Kenai River - Skilak Inlet to Kenai Lake 8,327 4 37 1,574 0 21,301 0 2 22,802 96 0 0 P Kenai River - guided, reach not specified 83 1 2 10 0 181 0 0 201 0 0 0 P Ninilchik River 111 287 19 0 0 0 5 0 6 0 0 0 P Quartz Creek 67 0 0 41 0 54 0 0 824 0 0 0 P Russian River 443 0 49 331 0 1,583 0 0 225 0 0 0 P Other lakes 121 0 0 0 0 287 0 0 11 460 0 0 P Other streams 223 0 13 2 0 14 0 0 87 0 0 0 Q Afognak Island streams 27 0 3 0 0 0 0 0 0 0 0 0 Q American River 86 1 0 0 0 0 0 0 109 0 0 0 Q Ayakulik River - above weir 485 50 2,511 413 0 0 36 0 1,760 0 0 0 Q Browns Lagoon River 56 0 2 0 0 0 0 0 227 0 0 0 Q Buskin River 28 0 2 2 0 2 0 0 5 0 0 0 Q Dog Salmon Creek (Frazer River) 248 0 56 439 0 1 0 0 36 0 0 0 Q Karluk lake and river above weir 193 11 81 50 0 0 485 0 1,272 0 0 0 Q Saltery Creek 774 0 562 827 0 2 2 0 162 0 0 0 Q Zachar Bay streams 60 0 23 16 0 0 0 0 148 0 0 0 Q Other remote lakes 67 0 14 5 0 6 5 0 84 0 0 0 Q Other roadside lakes and streams 195 0 230 19 0 0 0 0 15 0 0 0 Q Other streams 1,076 9 1,467 505 0 109 53 0 3,803 0 0 0 R American Creek 841 0 0 39 0 2,391 0 13 12,850 99 20 0 R Becharof system 463 29 99 240 0 544 0 0 7,279 1,786 0 0 R Big Creek (into Naknek) 158 7 70 0 0 192 0 0 319 141 1 0 R Brooks Lake 12 0 0 2 0 112 0 4 4 1 0 0
-continued-

67
Appendix H10.–Page 3 of 4.
Angler- Salmon Trout Dolly
Northern
Area Site days Chinooka Coho Sockeye Cutthroat Rainbow Steelhead Lake Varden Grayling Pike Sheefish R Brooks River (into Naknek Lake) 1,051 0 8 1,416 0 6,099 0 4 536 122 1 0 R Contact Creek 363 6 7 10 0 349 0 0 7,815 1,197 0 0 R Egegik River (Becharof system) 714 18 1,277 27 0 0 0 0 53 1 0 0
R Naknek River (dwnstream frm Rapids Camp incl trib) 717 129 104 24 0 495 0 0 35 6 0 0
R Naknek River (Rapids Camp upstream to Naknek Lk, incl trib) 1,978 380 293 652 0 6,841 0 1 1,378 637 16 0
R Naknek River and Tributaries 604 0 4 628 0 2,794 0 1,351 4,871 497 30 0 R Swikshak River 143 0 574 0 0 6 0 13 4 0 0 0 R Ugashik system 316 107 39 59 0 0 0 47 3,675 391 0 0 R Other lakes 23 4 18 3 0 15 0 0 0 0 0 0 R Other streams 3,194 2,404 5,641 1,342 0 2,231 218 52 7,831 592 11 0 S Alagnak (Branch) River 2,753 1,370 3,330 824 0 5,187 0 154 1,092 1,300 5 0 S Battle River 248 0 0 283 0 1,101 0 8 17 242 0 0 S Chekok Creek 40 0 0 36 0 220 0 0 22 0 0 0 S Copper River (Lake Iliamna area) 1,826 8 4 2,000 0 18,728 0 0 2,477 77 3 0 S Funnel Creek 117 0 1 29 0 1,141 0 6 268 8 0 0 S Gibraltar River 328 0 0 205 0 3,136 0 11 30 53 0 0 S Iliamna River 517 0 0 445 0 509 0 0 4,114 18 0 0 S Kijik Lake 19 0 0 1 0 0 0 6 5 55 0 0 S Kijik River 77 0 0 0 0 0 0 0 3 549 25 0 S Kukaklek River (Big Ku) (into Alagnak) 221 4 0 16 0 1,682 0 549 29 413 14 0 S Kulik River 870 0 1 268 0 9,693 0 251 66 90 0 0 S Kvichak River 1,627 34 500 1,431 0 11,932 0 17 240 2,374 4 0 S Lake Clark 171 0 0 0 0 0 0 111 108 694 178 0 S Lake Iliamna 288 0 25 327 0 475 0 0 453 70 910 0 S Lower Talarik Creek 201 0 34 31 0 1,754 0 0 129 598 0 0 S Moraine Creek 1,074 2 32 237 0 10,476 0 206 304 1,427 22 0 S Nanuktuk Creek 245 0 0 81 0 2,133 0 9 1,015 128 0 0 S Newhalen River 289 0 25 316 0 416 0 2 83 864 5 0 S Nonvianuk Lake 38 19 1 1 0 271 0 28 0 1 0 0 S Nonvianuk River (into Alagnak) 61 2 8 0 0 613 0 23 140 25 0 0
-continued-
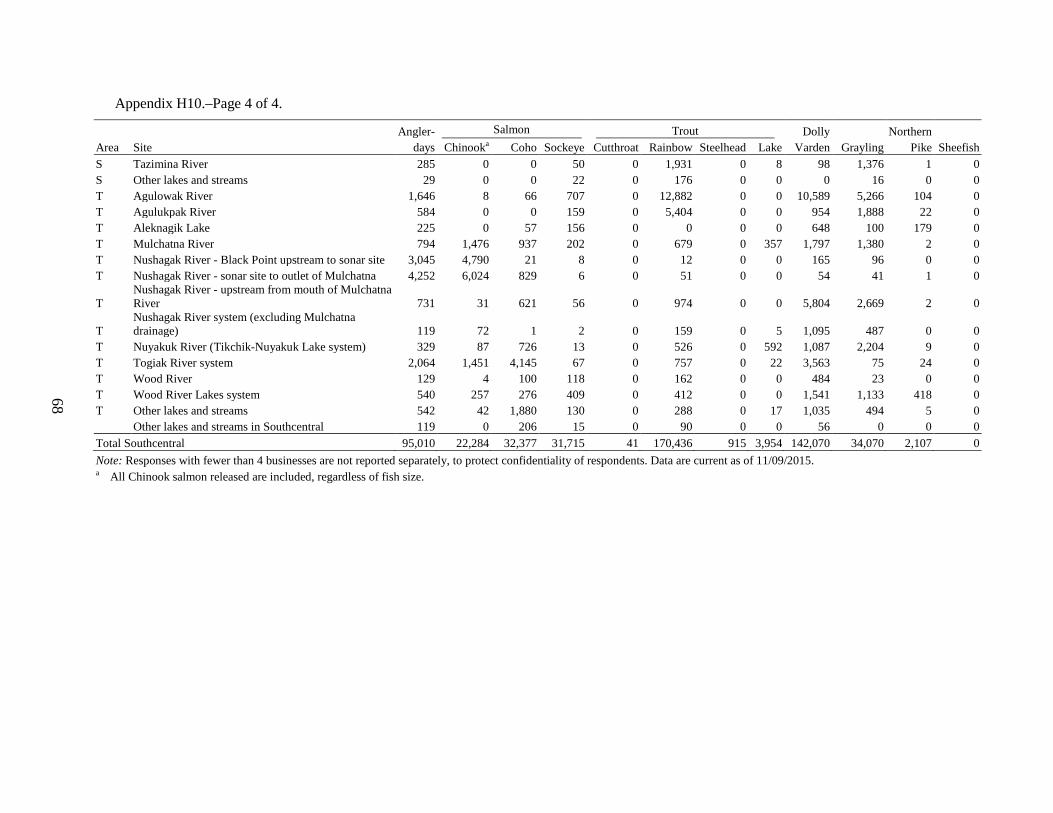
68
Appendix H10.–Page 4 of 4.
Angler- Salmon Trout Dolly
Northern
Area Site days Chinooka Coho Sockeye Cutthroat Rainbow Steelhead Lake Varden Grayling Pike Sheefish S Tazimina River 285 0 0 50 0 1,931 0 8 98 1,376 1 0 S Other lakes and streams 29 0 0 22 0 176 0 0 0 16 0 0 T Agulowak River 1,646 8 66 707 0 12,882 0 0 10,589 5,266 104 0 T Agulukpak River 584 0 0 159 0 5,404 0 0 954 1,888 22 0 T Aleknagik Lake 225 0 57 156 0 0 0 0 648 100 179 0 T Mulchatna River 794 1,476 937 202 0 679 0 357 1,797 1,380 2 0 T Nushagak River - Black Point upstream to sonar site 3,045 4,790 21 8 0 12 0 0 165 96 0 0 T Nushagak River - sonar site to outlet of Mulchatna 4,252 6,024 829 6 0 51 0 0 54 41 1 0
T Nushagak River - upstream from mouth of Mulchatna River 731 31 621 56 0 974 0 0 5,804 2,669 2 0
T Nushagak River system (excluding Mulchatna drainage) 119 72 1 2 0 159 0 5 1,095 487 0 0
T Nuyakuk River (Tikchik-Nuyakuk Lake system) 329 87 726 13 0 526 0 592 1,087 2,204 9 0 T Togiak River system 2,064 1,451 4,145 67 0 757 0 22 3,563 75 24 0 T Wood River 129 4 100 118 0 162 0 0 484 23 0 0 T Wood River Lakes system 540 257 276 409 0 412 0 0 1,541 1,133 418 0 T Other lakes and streams 542 42 1,880 130 0 288 0 17 1,035 494 5 0 Other lakes and streams in Southcentral 119 0 206 15 0 90 0 0 56 0 0 0 Total Southcentral 95,010 22,284 32,377 31,715 41 170,436 915 3,954 142,070 34,070 2,107 0 Note: Responses with fewer than 4 businesses are not reported separately, to protect confidentiality of respondents. Data are current as of 11/09/2015. a All Chinook salmon released are included, regardless of fish size.

69
Appendix H11.–Freshwater logbook angler-days and species released by area and site, Arctic-Yukon-Kuskokwim Alaska, 2014.
Angler- Salmon Trout Dolly
Northern
Area Site days Chinooka Coho Sockeye Cutthroat Rainbow Steelhead Lake Varden Grayling Pike Sheefish I Klutina River 673 309 0 60 0 4 0 0 67 7 0 0 I Other lakes and streams 264 32 0 98 0 239 0 0 1 437 0 0 U Chena Lakes Recreation Area 365 0 0 0 0 99 0 0 4 0 0 0 U Other lakes 1,086 0 0 0 0 492 0 0 20 188 0 0 U Other stocked lakes 146 0 0 0 0 53 0 0 1 0 0 0 U Other streams 1,540 0 28 0 0 0 0 0 182 8,625 53 0 V Aniak River 514 0 2,034 122 0 1,232 0 0 4,366 1,621 609 21 V Goodnews River 1,738 77 6,156 195 0 1,178 0 285 13,313 735 0 0 V Holitna River 498 0 156 50 0 11 0 0 413 294 1,101 143 V Kanektok River (Quinhagak, Chosen) 2,567 137 4,030 498 0 11,669 0 1 19,252 1,140 0 0
V Kuskokwim River drainages including Aniak River 385 6 527 16 0 2,078 0 0 2,253 1,504 35 0
V Other lakes and streams 134 1 9 1 0 566 0 52 532 171 37 0
Y Yukon River drainages downstream of Koyukuk River 1,220 4 2,064 17 0 0 0 0 2,282 14,622 7,066 14
Other lakes and streams in Arctic-Yukon-Kuskokwim 753 9 3,934 0 0 0 0 0 510 1,373 17 115
Total Arctic-Yukon-Kuskokwim 11,883 575 18,938 1,057 0 17,621 0 338 43,196 30,717 8,918 293 Note: Responses with fewer than 4 businesses are not reported separately, to protect confidentiality of respondents. Data are current as of 11/09/2015. a All Chinook salmon released are included, regardless of fish size.

70
Appendix H12.–Freshwater logbook angler-days and species released by region, Statewide, 2014.
Angler- Salmon Trout Dolly
Northern
Region days Chinooka Coho Sockeye Cutthroat Rainbow Steelhead Lake Varden Grayling Pike Sheefish Southeast 10,257 103 45,330 1,768 3,010 1,165 2,086 0 15,035 0 0 0 Southcentral 95,010 22,284 32,377 31,715 41 170,436 915 3,954 142,070 34,070 2,107 0 Arctic-Yukon-Kuskokwim 11,883 575 18,938 1,057 0 17,621 0 338 43,196 30,717 8,918 293 Total 117,150 22,962 96,645 34,540 3,051 189,222 3,001 4,292 200,301 64,787 11,025 293 Note: Data are current as of 11/09/2015. a All Chinook salmon released are included, regardless of fish size.

APPENDIX I.
SALTWATER LOGBOOK SUMMARIES BY AREA AND PORT OF OFFLOADING
71

72
Appendix I1.–Saltwater logbook participation and effort by area and port of offloading, Southeast Alaska, 2014.
Angler-days
Area Port of Offloading Businessesa Vesselsa Trips Resident Non-Res Comp Unknown Crew Anglers A Ketchikan 64 96 5,399 273 22,670 52 224 7 23,226 A Knudson Cove 18 24 1,568 62 6,528 13 77 1 6,681 A Salmon Falls 4 10 249 7 782 3 3 0 795 A Other 4 16 854 14 1,899 3 5 0 1,921 B Coffman Cove 4 4 144 11 581 13 1 0 606 B Craig 18 44 1,638 117 5,839 35 11 103 6,105 B Klawock 6 15 511 34 1,587 0 17 11 1,649 B Thorne Bay 4 8 419 35 1,486 1 3 0 1,525 B Other 20 74 3,310 444 12,900 35 39 482 13,900 C Petersburg 19 26 662 38 2,533 19 6 1 2,597 C Wrangell 7 7 143 8 497 0 2 1 508 C Other 6 8 97 0 322 21 2 2 347 D Port Alexander 4 5 164 8 530 3 1 8 550 D Sitka 82 141 7,547 566 30,873 108 91 241 31,879 D Other 12 22 554 3 1,803 4 4 12 1,826 E Angoon 8 19 634 30 2,118 12 1 2 2,163 E Auke Bay 25 40 2,303 276 9,742 23 149 6 10,196 E Juneau 24 40 717 24 2,528 3 19 4 2,578 E Other 8 17 574 20 2,362 2 6 46 2,436 F Haines\Skagway 7 8 559 42 2,113 13 7 2 2,177 G Bartlett Cove 4 5 81 5 259 24 0 8 296 G Elfin Cove 9 24 1,028 16 3,916 32 13 4 3,981 G Gustavus 13 29 1,131 43 4,635 10 5 1 4,694 G Hoonah 6 8 232 2 1,067 0 27 0 1,096 G Pelican 5 10 384 12 1,417 4 4 0 1,437 G Other 12 16 958 4 3,228 1 3 3 3,239 H Yakutat 10 13 814 223 3,306 15 10 4 3,558 Total Southeast 303 605 32,674 2,317 127,521 449 730 949 131,966 Note: Participation (number of businesses, vessels, trips, and angler-days) was determined by number of trips, not targeted species. Responses with fewer than four businesses are
not reported separately, to protect confidentiality of respondents. Data are current as of 11/09/2015. a Business and vessel regional and total counts are not additive because they can offload at multiple ports.

73
Appendix I2.–Saltwater logbook participation and effort by area and port of offloading, Southcentral Alaska, 2014.
Angler-days
Area Port of Offloading Businessesa Vesselsa Trips Resident Non-Res Comp Unknown Crew Anglers J Port Ashton 10 12 53 43 251 2 2 20 318 J Seward 58 102 4,596 10,393 25,718 272 148 1,687 38,218 J Valdez 27 31 732 1,762 2,167 39 27 65 4,060 J Whittier 18 20 580 1,270 1,866 11 16 60 3,223 J Other 5 6 134 72 535 3 1 7 618 P Anchor Point 31 36 965 940 4,152 86 44 72 5,294 P Deep Creek 52 77 2,573 3,079 10,807 136 72 38 14,132 P Homer 83 107 4,767 7,094 29,730 236 199 587 37,846 P Ninilchik 6 7 114 159 390 3 3 16 571 P Seldovia 9 9 82 46 296 0 0 6 348 P Other 10 15 272 46 914 8 1 1 970 Q Kodiak 24 27 844 571 3,439 41 11 313 4,375 Q Larsen Bay 9 20 519 77 2,050 60 9 81 2,277 Q Old Harbor 4 8 291 97 870 9 15 5 996 Q Port Lions 6 7 178 39 590 1 2 4 636 Q Other 22 30 710 71 2,721 10 11 9 2,822 R Other 7 9 68 20 170 2 0 12 204 Total Southcentral 274 407 17,478 25,779 86,666 919 561 2,983 116,908 Note: Participation (number of businesses, vessels, trips, and angler-days) was determined by number of trips, not targeted species. Responses with fewer than 4 businesses are not
reported separately, to protect confidentiality of respondents. Data are current as of 11/09/2015. a Business and vessel regional and total counts are not additive because they can offload at multiple ports.

Appendix I3.–Saltwater logbook participation and effort by region, statewide, 2014.
Angler-days
Region Businessesa Vesselsa Trips Resident Non-Res Comp Unknown Crew Anglers Southeast 303 605 32,674 2,317 127,521 449 730 949 131,966 Southcentral 274 407 17,478 25,779 86,666 919 561 2,983 116,908 Total 571 1,006 50,152 28,096 214,187 1,368 1,291 3,932 248,874 Note: Participation (number of businesses, vessels, trips, and angler-days) was determined by number of trips, not targeted
species. Responses with fewer than 4 businesses are not reported separately, to protect confidentiality of respondents. Data are current as of 11/09/2015.
a Business and vessel regional and total counts are not additive because they can offload at multiple ports.
74

75
Appendix I4.–Saltwater logbook salmon participation, effort, and fish kept and released by area and port of offloading, Southeast Alaska, 2014.
Chinook salmon
Other
Large Small Coho Sockeye Salmon
Area Port of Offloading Businessesa Vesselsa Trips Anglers Kept Released Kept Released Kept Kept Kept A Ketchikan 64 96 5,399 23,226 3,063 347 277 3,120 17,977 136 17,159 A Knudson Cove 18 24 1,568 6,681 999 69 63 1,131 6,994 37 6,592 A Salmon Falls 4 10 249 795 172 17 17 176 2,170 5 748 A Other 4 16 854 1,921 292 151 36 1,198 1,937 25 961 B Coffman Cove 4 4 144 606 74 16 8 105 1,233 6 80 B Craig 18 44 1,638 6,105 4,173 649 109 61 19,385 24 806 B Klawock 6 15 511 1,649 1,056 116 23 43 5,167 27 261 B Thorne Bay 4 8 419 1,525 136 51 0 211 2,786 18 1,145 B Other 20 74 3,310 13,900 6,839 948 83 510 28,488 60 6,415 C Petersburg 19 26 662 2,597 404 13 29 66 1,202 2 239 C Wrangell 7 7 143 508 92 19 4 151 204 1 7 C Other 6 8 97 347 82 22 0 15 677 0 22 D Port Alexander 4 5 164 550 235 49 6 5 1,025 103 11 D Sitka 82 141 7,547 31,879 30,182 6,122 207 1,503 69,929 185 3,650 D Other 12 22 554 1,826 336 30 12 82 2,714 24 393 E Angoon 8 19 634 2,163 388 111 7 780 4,186 15 779 E Auke Bay 25 40 2,303 10,196 383 19 50 485 3,522 77 2,345 E Juneau 24 40 717 2,578 123 16 7 109 560 6 197 E Other 8 17 574 2,436 195 26 12 55 2,532 25 1,086 F Haines\Skagway 7 8 559 2,177 135 27 0 1,308 1 0 0 G Bartlett Cove 4 5 81 296 25 2 0 0 27 6 25 G Elfin Cove 9 24 1,028 3,981 1,615 226 21 195 4,846 38 554 G Gustavus 13 29 1,131 4,694 1,029 45 11 100 1,930 35 473 G Hoonah 6 8 232 1,096 12 13 6 0 31 0 21 G Pelican 5 10 384 1,437 889 51 8 58 1,214 6 58 G Other 12 16 958 3,239 197 4 20 87 2,649 2 1,913 H Yakutat 10 13 814 3,558 407 61 7 53 1,789 2 8 Total Southeast 303 605 32,674 131,966 53,533 9,220 1,023 11,607 185,175 865 45,948 Note: Participation (number of businesses, vessels, trips, and angler-days) was determined by number of trips, not targeted species. Responses with fewer than 4 businesses are not
reported separately, to protect confidentiality of respondents. Data are current as of 11/09/2015. a Business and vessel regional and total counts are not additive because they can offload at multiple ports.

76
Appendix I5.–Saltwater logbook salmon participation, effort, and fish kept and released by area and port of offloading, Southcentral Alaska, 2014.
Chinook salmon
Other
Large Small Coho Sockeye Salmon
Area Port of Offloading Businessesa Vesselsa Trips Anglers Kept Released Kept Released Kept Kept Kept J Port Ashton 10 12 53 318 31 0 1 0 220 0 29 J Seward 58 102 4,596 38,218 919 58 250 56 41,175 323 3,439 J Valdez 27 31 732 4,060 4 2 4 2 946 5 112 J Whittier 18 20 580 3,223 29 3 1 4 104 11 137 J Other 5 6 134 618 0 0 4 0 11 0 76 P Anchor Point 31 36 965 5,294 185 19 43 9 117 3 75 P Deep Creek 52 77 2,573 14,132 217 27 72 8 44 7 43 P Homer 83 107 4,767 37,846 3,998 107 736 107 4,873 177 1,920 P Ninilchik 6 7 114 571 16 0 4 0 35 2 7 P Seldovia 9 9 82 348 11 1 6 0 11 0 19 P Other 10 15 272 970 41 2 10 0 47 0 4 Q Kodiak 24 27 844 4,375 1,374 14 209 45 1,181 31 179 Q Larsen Bay 9 20 519 2,277 346 90 140 40 1,047 89 21 Q Old Harbor 4 8 291 996 304 2 53 4 418 9 27 Q Port Lions 6 7 178 636 74 0 33 1 267 0 14 Q Other 22 30 710 2,822 231 11 152 136 1,824 479 153 R Other 7 9 68 204 12 0 0 0 171 0 0 Total Southcentral 274 407 17,478 116,908 7,792 336 1,718 412 52,491 1,136 6,255 Note: Participation (number of businesses, vessels, trips, and angler-days) was determined by number of trips, not targeted species. Responses with fewer than 4 businesses are not
reported separately, to protect confidentiality of respondents. Data are current as of 11/09/2015. a Business and vessel regional and total counts are not additive because they can offload at multiple ports.
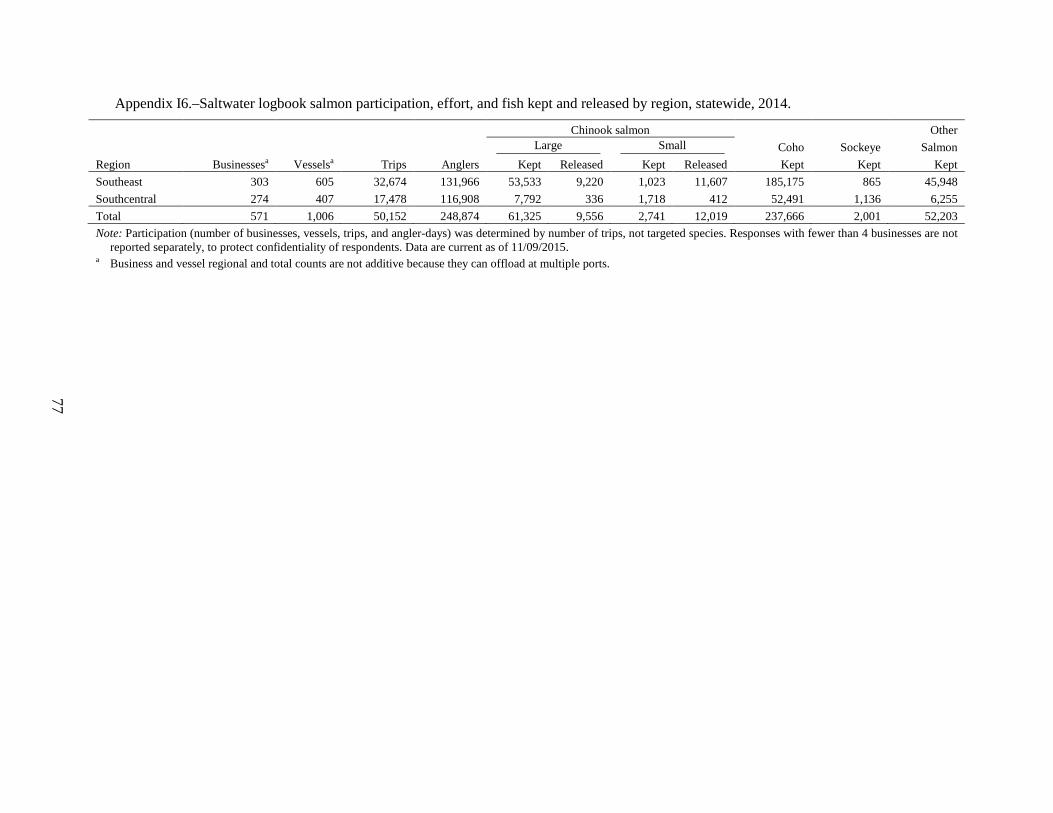
77 77
Appendix I6.–Saltwater logbook salmon participation, effort, and fish kept and released by region, statewide, 2014.
Chinook salmon
Other
Large Small Coho Sockeye Salmon
Region Businessesa Vesselsa Trips Anglers Kept Released Kept Released Kept Kept Kept Southeast 303 605 32,674 131,966 53,533 9,220 1,023 11,607 185,175 865 45,948 Southcentral 274 407 17,478 116,908 7,792 336 1,718 412 52,491 1,136 6,255 Total 571 1,006 50,152 248,874 61,325 9,556 2,741 12,019 237,666 2,001 52,203 Note: Participation (number of businesses, vessels, trips, and angler-days) was determined by number of trips, not targeted species. Responses with fewer than 4 businesses are not
reported separately, to protect confidentiality of respondents. Data are current as of 11/09/2015. a Business and vessel regional and total counts are not additive because they can offload at multiple ports.
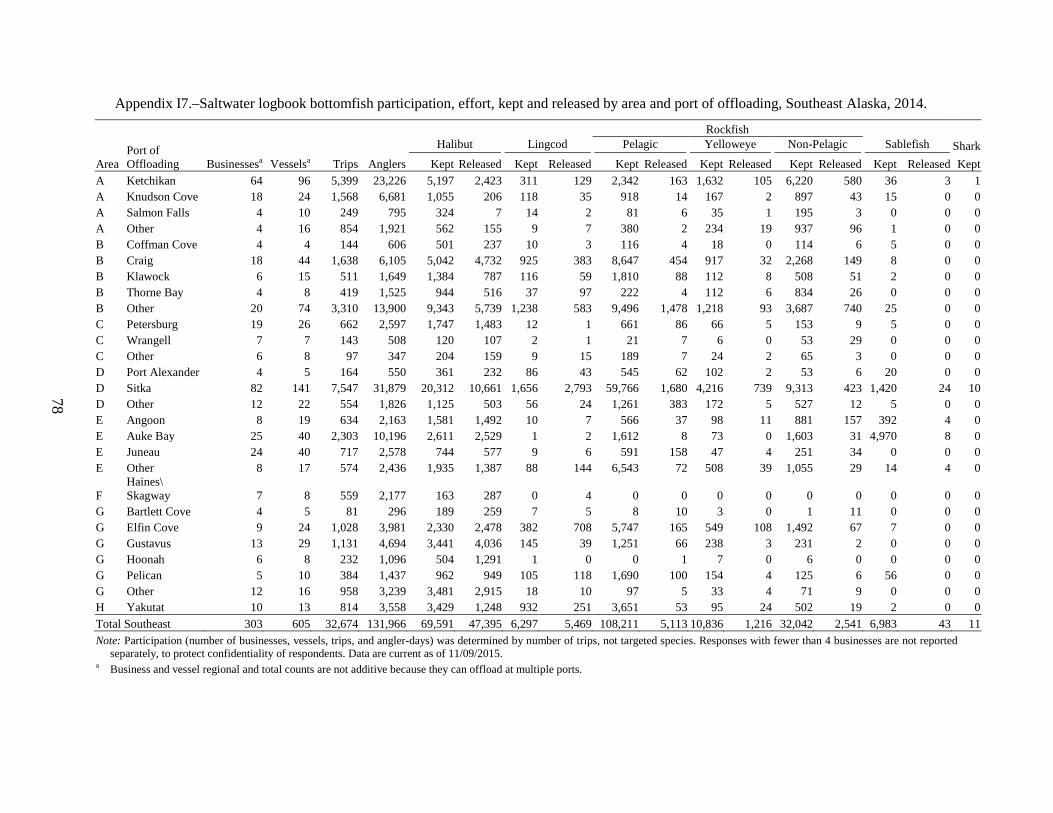
78 78
Appendix I7.–Saltwater logbook bottomfish participation, effort, kept and released by area and port of offloading, Southeast Alaska, 2014.
Rockfish
Port of Offloading
Halibut Lingcod Pelagic Yelloweye Non-Pelagic Sablefish Shark Area Businessesa Vesselsa Trips Anglers Kept Released Kept Released Kept Released Kept Released Kept Released Kept Released Kept A Ketchikan 64 96 5,399 23,226 5,197 2,423 311 129 2,342 163 1,632 105 6,220 580 36 3 1 A Knudson Cove 18 24 1,568 6,681 1,055 206 118 35 918 14 167 2 897 43 15 0 0 A Salmon Falls 4 10 249 795 324 7 14 2 81 6 35 1 195 3 0 0 0 A Other 4 16 854 1,921 562 155 9 7 380 2 234 19 937 96 1 0 0 B Coffman Cove 4 4 144 606 501 237 10 3 116 4 18 0 114 6 5 0 0 B Craig 18 44 1,638 6,105 5,042 4,732 925 383 8,647 454 917 32 2,268 149 8 0 0 B Klawock 6 15 511 1,649 1,384 787 116 59 1,810 88 112 8 508 51 2 0 0 B Thorne Bay 4 8 419 1,525 944 516 37 97 222 4 112 6 834 26 0 0 0 B Other 20 74 3,310 13,900 9,343 5,739 1,238 583 9,496 1,478 1,218 93 3,687 740 25 0 0 C Petersburg 19 26 662 2,597 1,747 1,483 12 1 661 86 66 5 153 9 5 0 0 C Wrangell 7 7 143 508 120 107 2 1 21 7 6 0 53 29 0 0 0 C Other 6 8 97 347 204 159 9 15 189 7 24 2 65 3 0 0 0 D Port Alexander 4 5 164 550 361 232 86 43 545 62 102 2 53 6 20 0 0 D Sitka 82 141 7,547 31,879 20,312 10,661 1,656 2,793 59,766 1,680 4,216 739 9,313 423 1,420 24 10 D Other 12 22 554 1,826 1,125 503 56 24 1,261 383 172 5 527 12 5 0 0 E Angoon 8 19 634 2,163 1,581 1,492 10 7 566 37 98 11 881 157 392 4 0 E Auke Bay 25 40 2,303 10,196 2,611 2,529 1 2 1,612 8 73 0 1,603 31 4,970 8 0 E Juneau 24 40 717 2,578 744 577 9 6 591 158 47 4 251 34 0 0 0 E Other 8 17 574 2,436 1,935 1,387 88 144 6,543 72 508 39 1,055 29 14 4 0
F Haines\ Skagway 7 8 559 2,177 163 287 0 4 0 0 0 0 0 0 0 0 0
G Bartlett Cove 4 5 81 296 189 259 7 5 8 10 3 0 1 11 0 0 0 G Elfin Cove 9 24 1,028 3,981 2,330 2,478 382 708 5,747 165 549 108 1,492 67 7 0 0 G Gustavus 13 29 1,131 4,694 3,441 4,036 145 39 1,251 66 238 3 231 2 0 0 0 G Hoonah 6 8 232 1,096 504 1,291 1 0 0 1 7 0 6 0 0 0 0 G Pelican 5 10 384 1,437 962 949 105 118 1,690 100 154 4 125 6 56 0 0 G Other 12 16 958 3,239 3,481 2,915 18 10 97 5 33 4 71 9 0 0 0 H Yakutat 10 13 814 3,558 3,429 1,248 932 251 3,651 53 95 24 502 19 2 0 0 Total Southeast 303 605 32,674 131,966 69,591 47,395 6,297 5,469 108,211 5,113 10,836 1,216 32,042 2,541 6,983 43 11 Note: Participation (number of businesses, vessels, trips, and angler-days) was determined by number of trips, not targeted species. Responses with fewer than 4 businesses are not reported
separately, to protect confidentiality of respondents. Data are current as of 11/09/2015. a Business and vessel regional and total counts are not additive because they can offload at multiple ports.

79 79
Appendix I8.–Saltwater logbook bottomfish participation, effort, kept and released by area and port of offloading, Southcentral Alaska, 2014.
Rockfish
Port of Offloading
Halibut Lingcod Pelagic Yelloweye Non-Pelagic Sablefish Shark Kept Area Businessesa Vesselsa Trips Anglers Kept Released Kept Released Kept Released Kept Released Kept Released Kept Released
J Port Ashton 10 12 53 318 433 44 70 10 482 1 96 0 118 0 0 0 0 J Seward 58 102 4,596 38,218 42,337 16,540 4,249 1,427 42,125 1,437 4,711 180 4,894 264 241 5 5 J Valdez 27 31 732 4,060 3,692 3,065 1,208 421 2,476 85 1,362 179 380 59 16 0 0 J Whittier 18 20 580 3,223 4,081 2,194 350 174 2,831 376 436 6 954 82 4 1 0 J Other 5 6 134 618 687 284 91 128 99 28 163 17 137 9 0 0 0
P Anchor Point 31 36 965 5,294 9,334 6,432 429 92 1,249 19 190 7 128 1 0 0 0
P Deep Creek 52 77 2,573 14,132 26,755 25,772 21 3 191 8 22 0 14 0 0 0 1 P Homer 83 107 4,767 37,846 66,959 72,955 1,683 463 13,358 565 991 14 630 92 3 2 1 P Ninilchik 6 7 114 571 963 622 36 0 178 0 45 0 5 0 0 0 0 P Seldovia 9 9 82 348 634 875 6 0 17 0 34 2 2 0 0 0 0 P Other 10 15 272 970 1,560 2,986 1 0 31 0 7 0 1 0 0 0 0 Q Kodiak 24 27 844 4,375 5,352 1,462 610 44 11,909 839 495 1 1,261 70 0 0 0 Q Larsen Bay 9 20 519 2,277 3,163 4,386 59 17 1,472 651 354 74 149 15 0 0 0 Q Old Harbor 4 8 291 996 606 277 189 36 1,380 378 116 16 58 40 3 0 0 Q Port Lions 6 7 178 636 729 188 28 1 1,005 87 44 0 38 0 0 0 0 Q Other 22 30 710 2,822 2,431 1,898 378 191 2,305 2,825 292 140 84 306 0 30 0 R Other 7 9 68 204 165 88 4 7 100 197 0 0 6 0 0 0 0 Total Southcentral 273 396 19,453 138,648 212,277 165,661 11,517 4,872 70,670 6,458 9,573 501 6,897 647 154 10 4 Note: Participation (number of businesses, vessels, trips, and angler-days) was determined by number of trips, not targeted species. Responses with fewer than 4 businesses are not
reported separately, to protect confidentiality of respondents. Data are current as of 11/09/2015. a Business and vessel regional and total counts are not additive because they can offload at multiple ports.

80
Appendix I9.–Saltwater logbook bottomfish participation, effort, kept and released by region, statewide, 2014.
Rockfish
Halibut Lingcod Pelagic Yelloweye Non-Pelagic Sablefish Shark Kept Region Businessesa Vesselsa Trips Anglers Kept Released Kept Released Kept Released Kept Released Kept Released Kept Released
Southeast 303 605 32,674 131,966 69,591 47,395 6,297 5,469 108,211 5,113 10,836 1,216 32,042 2,541 6,983 43 11 Southcentral 274 407 17,478 116,908 169,881 140,068 9,412 3,014 81,208 7,496 9,358 636 8,859 938 267 38 7 Total 571 1,006 50,152 248,874 239,472 187,463 15,709 8,483 189,419 12,609 20,194 1,852 40,901 3,479 7,250 81 18 Note: Participation (number of businesses, vessels, trips, and angler-days) was determined by number of trips, not targeted species. Responses with fewer than 4 businesses are not reported
separately, to protect confidentiality of respondents. Data are current as of 11/09/2015. a Business and vessel regional and total counts are not additive because they can offload at multiple ports.