2004-2005 Resident Hunter Effort and Harvest Report - Human
101
Resident Hunter Effort & Game Harvest Estimates for the 2004-2005 Mississippi Hunting Season Prepared for the DIVISION OF WILDLIFE MISSISSIPPI DEPARTMENT OF WILDLIFE, FISHERIES & PARKS P.O. BOX 451 JACKSON, MS 39205 By Dr. Kevin M. Hunt, Kevin D. Brunke, Edith P. Fogarty, Sharon D. Fuller, Nanda K. Joginipally, and Dawn J. Schaffer Human Dimensions & Conservation Law Enforcement Laboratory Forest & Wildlife Research Center Mississippi State University Mississippi State, MS 39762-9690 September 2006
Transcript of 2004-2005 Resident Hunter Effort and Harvest Report - Human

Resident Hunter Effort & Game Harvest Estimates for the 2004-2005 Mississippi Hunting Season
Prepared for the
DIVISION OF WILDLIFE MISSISSIPPI DEPARTMENT OF WILDLIFE, FISHERIES & PARKS
P.O. BOX 451 JACKSON, MS 39205
By
Dr. Kevin M. Hunt, Kevin D. Brunke, Edith P. Fogarty, Sharon D. Fuller, Nanda K. Joginipally, and Dawn J. Schaffer
Human Dimensions & Conservation Law Enforcement Laboratory Forest & Wildlife Research Center
Mississippi State University Mississippi State, MS 39762-9690
September 2006

i
TABLE OF CONTENTS Page TABLE OF CONTENTS................................................................................................................... i LIST OF TABLES............................................................................................................................. ii LIST OF APPENDICES.................................................................................................................... vi INTRODUCTION ............................................................................................................................. 1 METHODS ........................................................................................................................................ 2 RESULTS .......................................................................................................................................... 3 ACKNOWLEDGMENTS ................................................................................................................. 4 LITERATURE CITED ...................................................................................................................... 5 Suggested Citation: Hunt, K. M., K. D. Brunke, E. P. Fogarty, S. D. Fuller, N. K. Joginipally, and D. J. Schaffer. 2006. Resident Hunter Effort & Game Harvest Estimates for the 2004-05 Mississippi Hunting Season. Human Dimensions & Conservation Law Enforcement Laboratory Technical Document #HDCLEL-113. Forest & Wildlife Research Center, Mississippi State, MS. 93pp.
ii
LIST OF TABLES
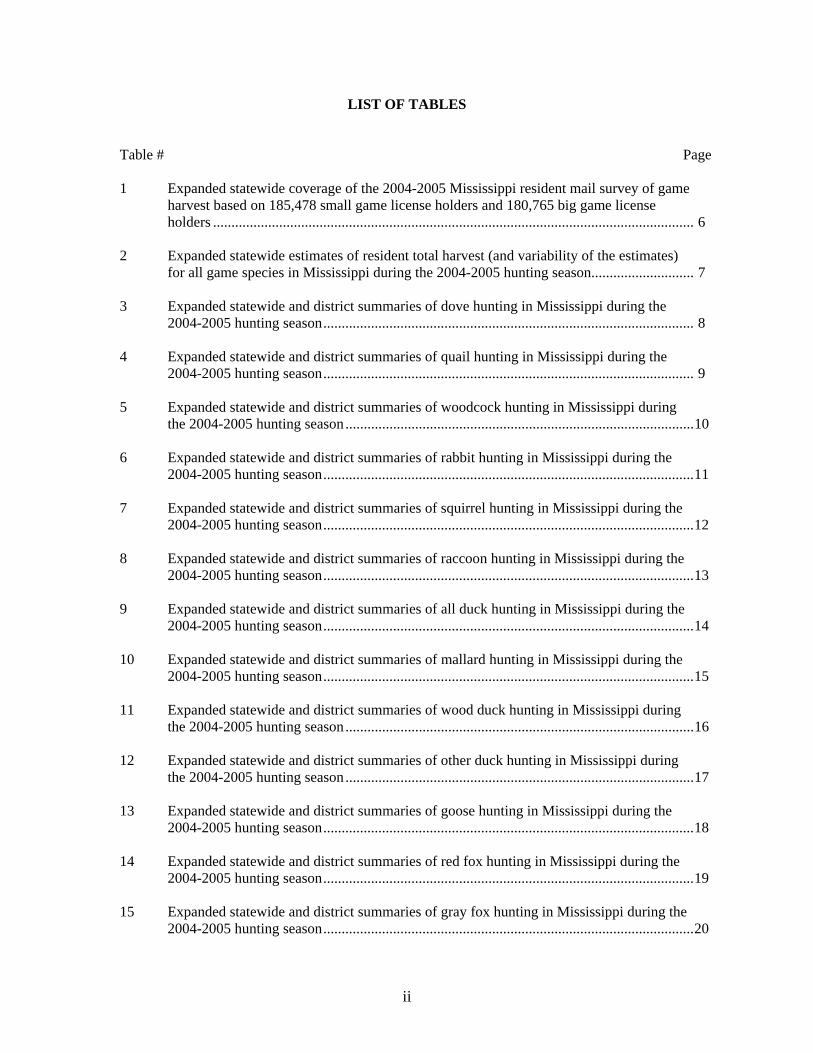
Table # Page 1 Expanded statewide coverage of the 2004-2005 Mississippi resident mail survey of game
harvest based on 185,478 small game license holders and 180,765 big game license holders ................................................................................................................................... 6
2 Expanded statewide estimates of resident total harvest (and variability of the estimates)
for all game species in Mississippi during the 2004-2005 hunting season............................ 7 3 Expanded statewide and district summaries of dove hunting in Mississippi during the
2004-2005 hunting season..................................................................................................... 8 4 Expanded statewide and district summaries of quail hunting in Mississippi during the
2004-2005 hunting season..................................................................................................... 9 5 Expanded statewide and district summaries of woodcock hunting in Mississippi during
the 2004-2005 hunting season...............................................................................................10 6 Expanded statewide and district summaries of rabbit hunting in Mississippi during the
2004-2005 hunting season.....................................................................................................11 7 Expanded statewide and district summaries of squirrel hunting in Mississippi during the
2004-2005 hunting season.....................................................................................................12 8 Expanded statewide and district summaries of raccoon hunting in Mississippi during the
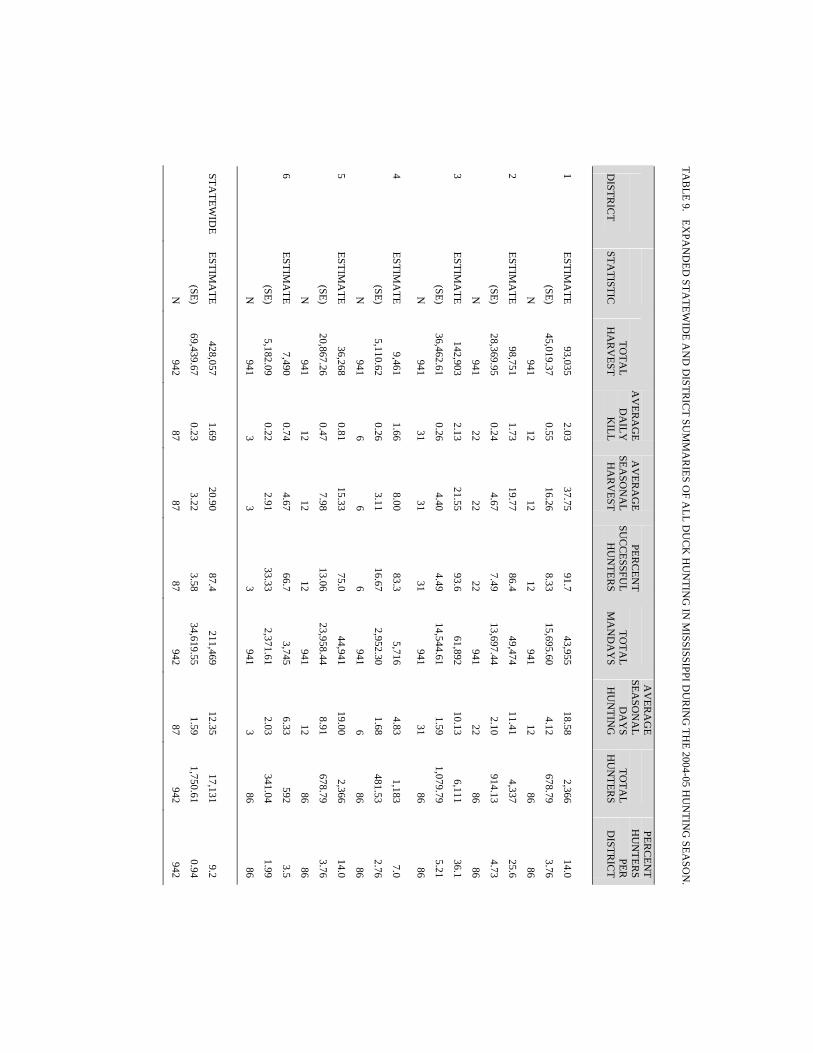
2004-2005 hunting season.....................................................................................................13 9 Expanded statewide and district summaries of all duck hunting in Mississippi during the
2004-2005 hunting season.....................................................................................................14 10 Expanded statewide and district summaries of mallard hunting in Mississippi during the
2004-2005 hunting season.....................................................................................................15 11 Expanded statewide and district summaries of wood duck hunting in Mississippi during
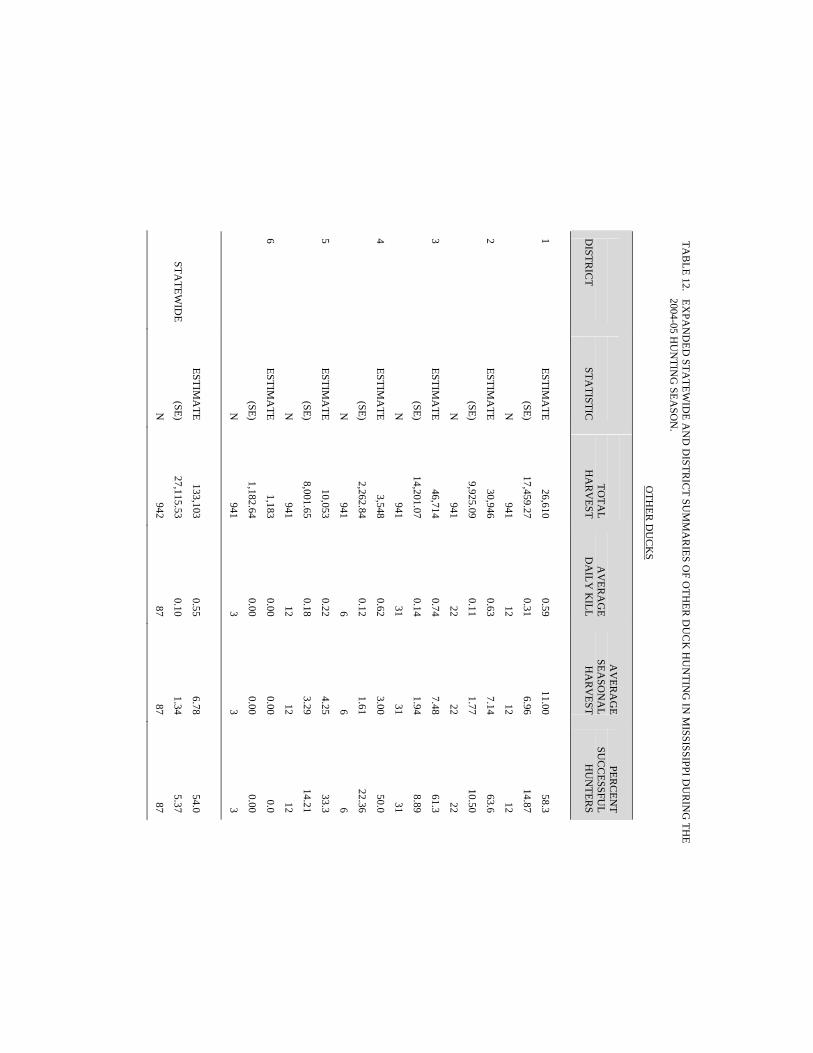
the 2004-2005 hunting season...............................................................................................16 12 Expanded statewide and district summaries of other duck hunting in Mississippi during
the 2004-2005 hunting season...............................................................................................17 13 Expanded statewide and district summaries of goose hunting in Mississippi during the
2004-2005 hunting season.....................................................................................................18 14 Expanded statewide and district summaries of red fox hunting in Mississippi during the
2004-2005 hunting season.....................................................................................................19 15 Expanded statewide and district summaries of gray fox hunting in Mississippi during the
2004-2005 hunting season.....................................................................................................20

iii
16 Expanded statewide and district summaries of bobcat hunting in Mississippi during the 2004-2005 hunting season.....................................................................................................21
17 Expanded statewide and district summaries of coyote hunting in Mississippi during the
2004-2005 hunting season.....................................................................................................22 18 Expanded statewide and district summaries of archery deer hunting in Mississippi during
the 2004-2005 hunting season...............................................................................................23 19 Expanded statewide and district summaries of archery buck and doe hunting in
Mississippi during the 2004-2005 hunting season ................................................................24 20 Expanded statewide and district summaries of primitive weapon deer hunting in
Mississippi during the 2004-2005 hunting season ................................................................25 21 Expanded statewide and district summaries of primitive weapon buck and doe hunting in
Mississippi during the 2004-2005 hunting season ................................................................26 22 Expanded statewide and district summaries of regular gun deer hunting in Mississippi
during the 2004-2005 hunting season....................................................................................27 23 Expanded statewide and district summaries of regular gun buck and doe hunting in
Mississippi during the 2004-2005 hunting season ................................................................28 24 Expanded statewide and district summaries of spring turkey hunting in Mississippi during
the 2004-2005 hunting season...............................................................................................29 25 Expanded statewide and district summaries of fall turkey hunting in Mississippi during
the 2004-2005 hunting season...............................................................................................30 26 Expanded statewide summaries of all deer, buck, doe, and turkey hunting in Mississippi
during the 2004-2005 hunting season....................................................................................31 27 Expanded statewide and district summaries of hog hunting in Mississippi during the
2004-2005 hunting season.....................................................................................................32 28 Percent of respondents who hunted in Mississippi during the 2004-2005 hunting season
(Q1) .......................................................................................................................................33 29 Percent of respondents by how many total days they hunted (Q2). Missing values were
treated as zeroes.....................................................................................................................33 30 Percent of respondents by how many days they hunted in Mississippi (Q2a). Missing
values were treated as zeroes.................................................................................................34 31 Percent of respondents by how many days they hunted elsewhere (Q2b). Missing values
were treated as zeroes............................................................................................................34 32 Percent of respondents by how many years they have been hunting (Q3)............................35

iv
33 Percent of respondents who are a member of a national hunting or conservation organization (Q4a).................................................................................................................35
33a. If yes, [See Table 33] number of organizations they belong to (Q4b) ..................................36
34 Percent of respondents who subscribe to any hunting magazines (Q5) ................................36 34a. If yes, [See Table 34] number of magazines they subscribe to (Q5a)...................................37 35. Percent of respondents by the age they had their first hunting experience (Q6) ...................38
36 Percent of respondents by who introduced them to hunting (Q7a) .......................................39 36a. Percent of respondents by who introduced them to hunting (fill in) (Q7b)...........................40
37 Percent of respondents by who they hunt with most often (Q8) ...........................................41
38 Percent of respondents by if they or someone in their household owns an all terrain
vehicle that is used for hunting (Q9) .....................................................................................41
39 Percent of respondents by their most favorite animal to hunt in Mississippi (Q10a)............42
40 Percent of respondents by their second most favorite animal to hunt in Mississippi (Q10b) ...................................................................................................................................43
41 Percent of respondents by their third most favorite animal to hunt in Mississippi (Q10c) ...44
42 Percent of respondents by if they want to legalize white-tailed deer hunting over bait for future hunting seasons in Mississippi (Q11) .........................................................................45
43 Percent of respondents by the extent they agree or disagree with statements about various attitudes toward wildlife; ranked by mean score (Q16) ........................................................46
44 Percent of respondents by the importance of statements about motivations for hunting; ranked by mean score (Q17) .................................................................................................47
45 Percent of respondents by the extent they support or oppose various squirrel hunting regulations (Q27 and Q28) ....................................................................................................48
46 Percent of respondents by how they rated hunting compared to their other outdoor recreation activities (such as fishing, camping, golfing, etc.) (Q30).....................................49
47 Percent of respondents by their age category (Q31)..............................................................49 48 Percent of respondents by their gender category (Q32) ........................................................50
49 Percent of respondents by their county of residence (Q33)...................................................50
50 Percent of respondents by their approximate annual household income category before
taxes (Q34) ............................................................................................................................53

v
51 Percent of respondents by their highest completed level of education (Q35) .......................53
52 Percent of respondents by their Spanish/Hispanic origin (Q36) ...........................................54 52a. Respondents’ specifications [See Table 54] of their Other Spanish/Hispanic origin (Q36) .....................................................................................................................................54
53 Percent of respondents by their race (Q37) ...........................................................................54 53a. If other race [See Table 55], respondents’ specification of their race (Q37) ........................55

vi
APPENDICES
Appendix Page A Questionnaire: 2005 Survey of Mississippi Resident Hunters .............................................56 B Survey correspondence with hunters for the 2005 Survey of Mississippi Resident Hunters .................................................................................................................................69 C Assessing Impacts of Hunting License Fee Increases on Hunter Participation in Mississippi.............................................................................................................................73 Figure C1. Mississippi hunters’ Willingness to Pay (demand), for a Small Game License to continue hunting in Mississippi and annual revenue created from various bid values (2003 U.S. Dollars)...........................................................................83 Figure C2. Mississippi hunters’ Willingness to Pay (demand), for an All Game License to continue hunting in Mississippi and annual revenue created from various bid values (2003 U.S. Dollars)...............................................................................................84 Figure C3. Mississippi hunters’ Willingness to Pay (demand), for a Sportsman License to continue hunting in Mississippi and annual revenue created from various bid values (2003 U.S. Dollars)...............................................................................................85 D. Willingness to Pay for MDWFP Sponsored Dove Fields .....................................................88 Table D1. Respondents’ preference for either the current dove hunting season and bag limit or a proposed increase in the dove hunting season with a reduction in bag limit (Q 18)...............................................................................................................91 Table D2. Average number of days for each of the three dove hunting seasons that respondents’ indicated to create the “ideal” 60 day dove hunting season (Q 19)..............................................................................................................................91 Table D3. Respondents’ indication of whether or not they would be willing to purchase a permit to hunt on a MDWFP Sponsored Dove Field for the 2005-2006 hunting season under the first option of being able to hunt only one field per permit per year during season one and two (Q 20) ..........................................................................91 Table D4. Respondents’ preference for the option to purchase a permit to hunt on a MDWFP Sponsored Dove Field for the 2005-2006 hunting season following the second option of being able to hunt only one field per permit on the opening two days, but any other program field the remainder of season one and two (Q 23)..............................................................................................................................91 Table D5. Respondents’ preference for purchasing a MDWFP Sponsored Dove Field permit for either option one or option two (Q 26) ..........................................................92
vii
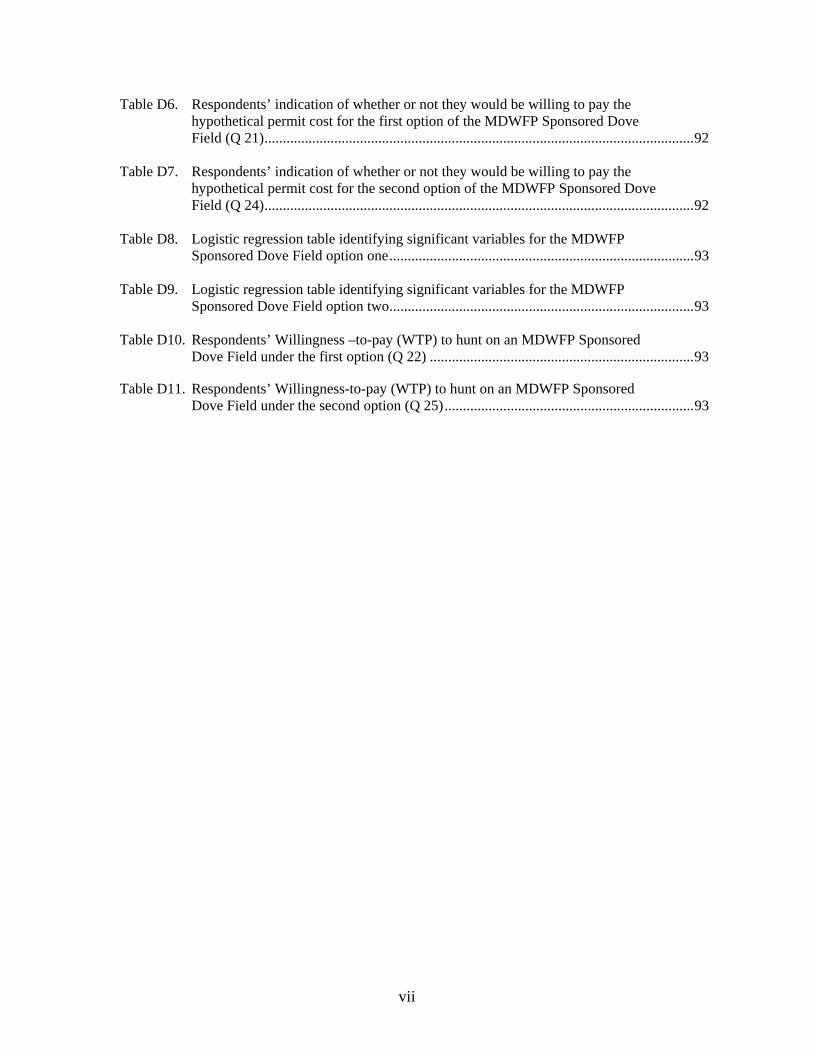
Table D6. Respondents’ indication of whether or not they would be willing to pay the hypothetical permit cost for the first option of the MDWFP Sponsored Dove Field (Q 21).....................................................................................................................92 Table D7. Respondents’ indication of whether or not they would be willing to pay the hypothetical permit cost for the second option of the MDWFP Sponsored Dove Field (Q 24).....................................................................................................................92 Table D8. Logistic regression table identifying significant variables for the MDWFP Sponsored Dove Field option one...................................................................................93 Table D9. Logistic regression table identifying significant variables for the MDWFP Sponsored Dove Field option two...................................................................................93 Table D10. Respondents’ Willingness –to-pay (WTP) to hunt on an MDWFP Sponsored Dove Field under the first option (Q 22) ........................................................................93 Table D11. Respondents’ Willingness-to-pay (WTP) to hunt on an MDWFP Sponsored Dove Field under the second option (Q 25)....................................................................93
1
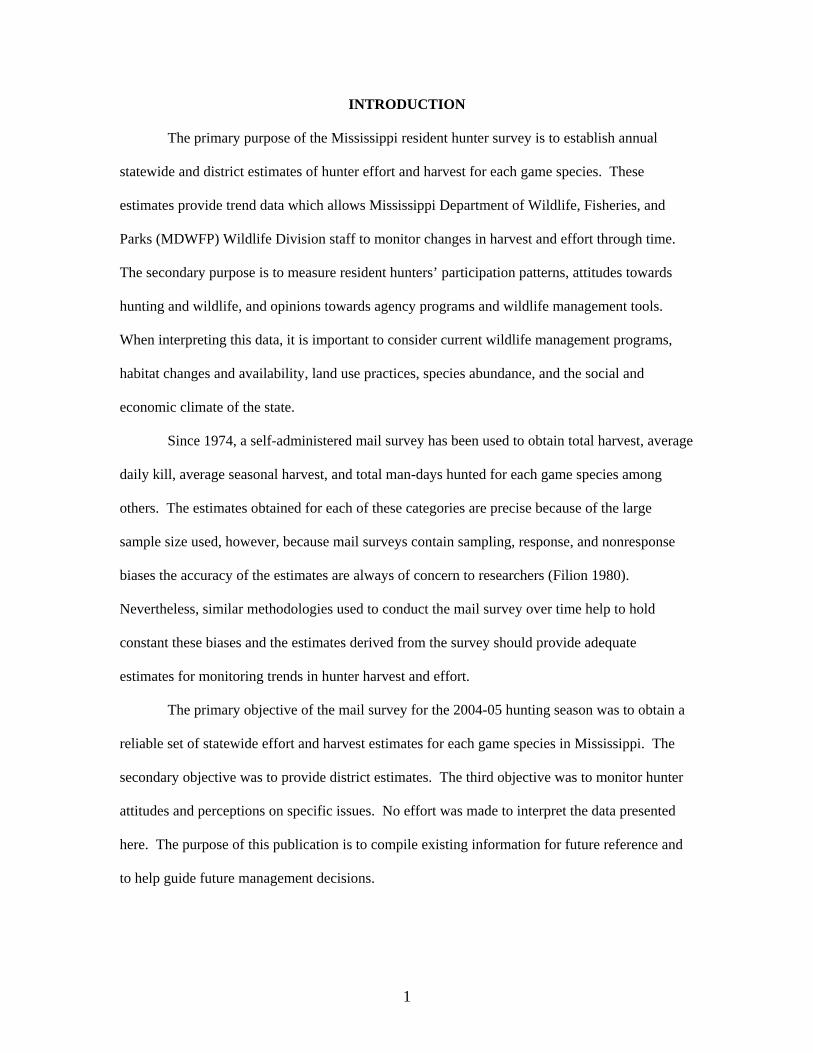
INTRODUCTION
The primary purpose of the Mississippi resident hunter survey is to establish annual
statewide and district estimates of hunter effort and harvest for each game species. These
estimates provide trend data which allows Mississippi Department of Wildlife, Fisheries, and
Parks (MDWFP) Wildlife Division staff to monitor changes in harvest and effort through time.
The secondary purpose is to measure resident hunters’ participation patterns, attitudes towards
hunting and wildlife, and opinions towards agency programs and wildlife management tools.
When interpreting this data, it is important to consider current wildlife management programs,
habitat changes and availability, land use practices, species abundance, and the social and
economic climate of the state.
Since 1974, a self-administered mail survey has been used to obtain total harvest, average
daily kill, average seasonal harvest, and total man-days hunted for each game species among
others. The estimates obtained for each of these categories are precise because of the large
sample size used, however, because mail surveys contain sampling, response, and nonresponse
biases the accuracy of the estimates are always of concern to researchers (Filion 1980).
Nevertheless, similar methodologies used to conduct the mail survey over time help to hold
constant these biases and the estimates derived from the survey should provide adequate
estimates for monitoring trends in hunter harvest and effort.
The primary objective of the mail survey for the 2004-05 hunting season was to obtain a
reliable set of statewide effort and harvest estimates for each game species in Mississippi. The
secondary objective was to provide district estimates. The third objective was to monitor hunter
attitudes and perceptions on specific issues. No effort was made to interpret the data presented
here. The purpose of this publication is to compile existing information for future reference and
to help guide future management decisions.
2
METHODS
The sampling frame for the survey consisted of resident holders of a Type 00 –
Sportsman, Type 01 – All Game Hunting and Fishing or Type 03 – Small Game Hunting and
Fishing licenses purchased during the 2004-2005 license year. A random sample of 4,000 license
holders was selected to participate in this study from the 185,478 licenses processed from July 1,
2004 – June 30, 2005.
The survey process followed the Total Design Method (TDM) prescribed by Dillman
(1978). This methodology pays particular attention to detail, persistence, and takes a personal
approach to obtaining a response. This is accomplished, in part, by using personalized letters and
envelopes processed with laser printers to simulate a first class mailing to differentiate it from
“junk mail”. The TDM uses a series of four mail-outs to help increase response rate: 1) An
introductory letter, questionnaire (APPENDIX A), and postage-paid business reply envelope (i.e.,
a complete packet) were sent; 2) Ten days after the second mailing a post card that was sent to all
hunters in the survey. The purpose of the post card was to remind hunters about the survey and to
thank those whom had already returned a completed questionnaire. A phone number was
provided on the post card in case the recipient had not received or misplaced their questionnaire
so they could request another be sent; 3) Twenty-one days after the postcard mailing, a second
complete packet was sent to all hunters who had not yet responded, and 4) Twenty-eight days
after the second complete packet was sent, a third complete mailing was sent to all hunters who
had not yet responded. Actual correspondence can be found in APPENDIX B. All surveys were
numbered using a bar coding system printed on clear adhesive labels. When surveys were
returned to Mississippi State University, the bar codes were scanned into a computer file and
assigned with a “returned” status; this prevented respondents from receiving another mailing.
Procedures for editing and data entry of returned questionnaires were similar to Steffen
(1981). Data entry involved entering data from the surveys into the computer using a Microsoft
Access data entry screen that had been previously developed. First, non-numeric responses in the

3
survey were numerically coded for preparation for data entry. After all responses were converted
into a numeric framework, responses from the surveys were data entered. The responses to the
last question of the survey, which was open-ended, were typed into an MS Access file so
comments could be queried by agency staff.
Effort and harvest estimates and their standard errors for each species were calculated for
total kill, average seasonal kill per hunter, proportion of licensed hunters, total licensed hunters,
proportion of hunters who were successful, total man-days spent hunting, average days afield per
hunter, and the average daily kill per hunter. These estimates were calculated both on a statewide
and district basis. Calculations were based on statistical programs originally developed by
Steffen (1981) for mainframe computing, modified as necessary for desktop computing using
SAS software.
RESULTS
A total of 4,000 questionnaires were mailed to resident hunters. There were a total of
1,488 useable questionnaires returned by hunters. Useable questionnaires included those who
indicated they hunted at least one species one or more days during the 2004-05 season (n=1,283),
and those who indicated they “DID NOT HUNT” on their returned survey (n=202). Thus, since
harvest estimates are extrapolated to all hunter license holders, those who indicated they did not
hunt were included in the database as hunting zero days and harvesting zero animals for each
species. Questionnaires were checked for the completeness of responses where it was found that
3 individuals indicated their refusal to participate. When non-deliverable surveys (n=879) were
excluded from consideration, an effective response rate of 47.7% was obtained.
Statewide expansions were calculated based on the 185,478 total hunting licenses sold
and accounted for by June 30, 2005. There were 185,478 individuals licensed to hunt small game
(Type 103) and 180,765 (Types 100 & 101) of these license holders also were eligible to pursue
big game (deer and turkey) during the 2004-2005 hunting season.
4
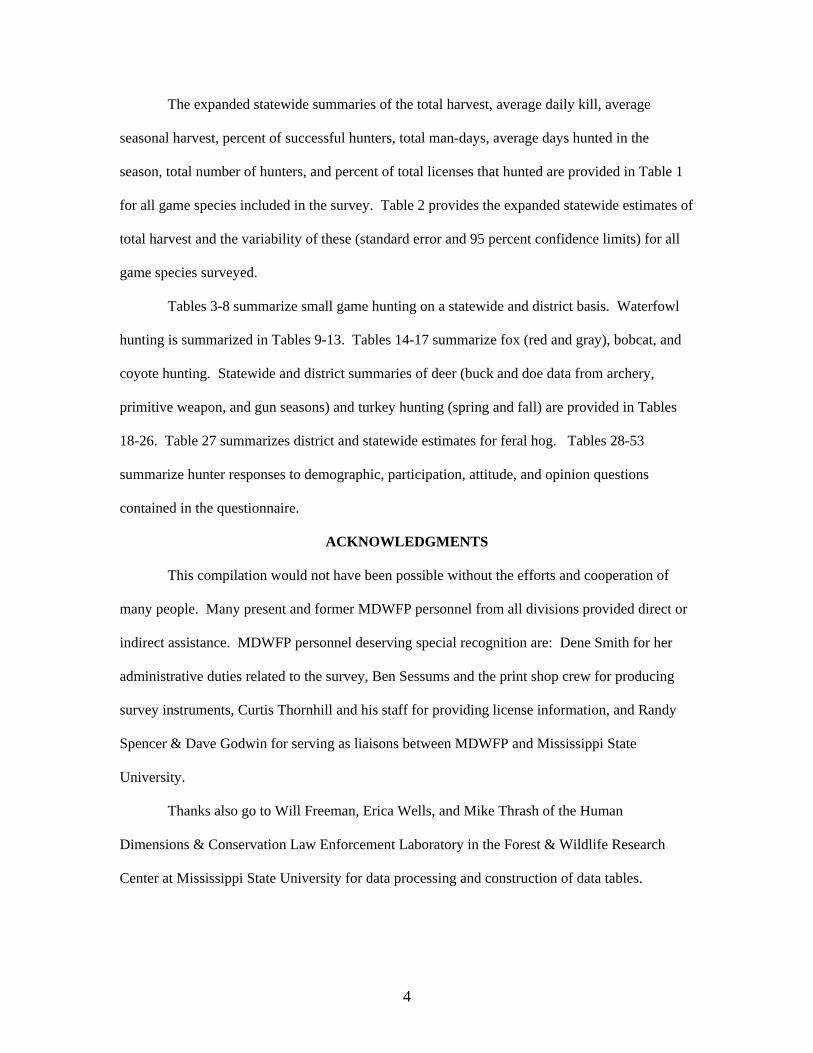
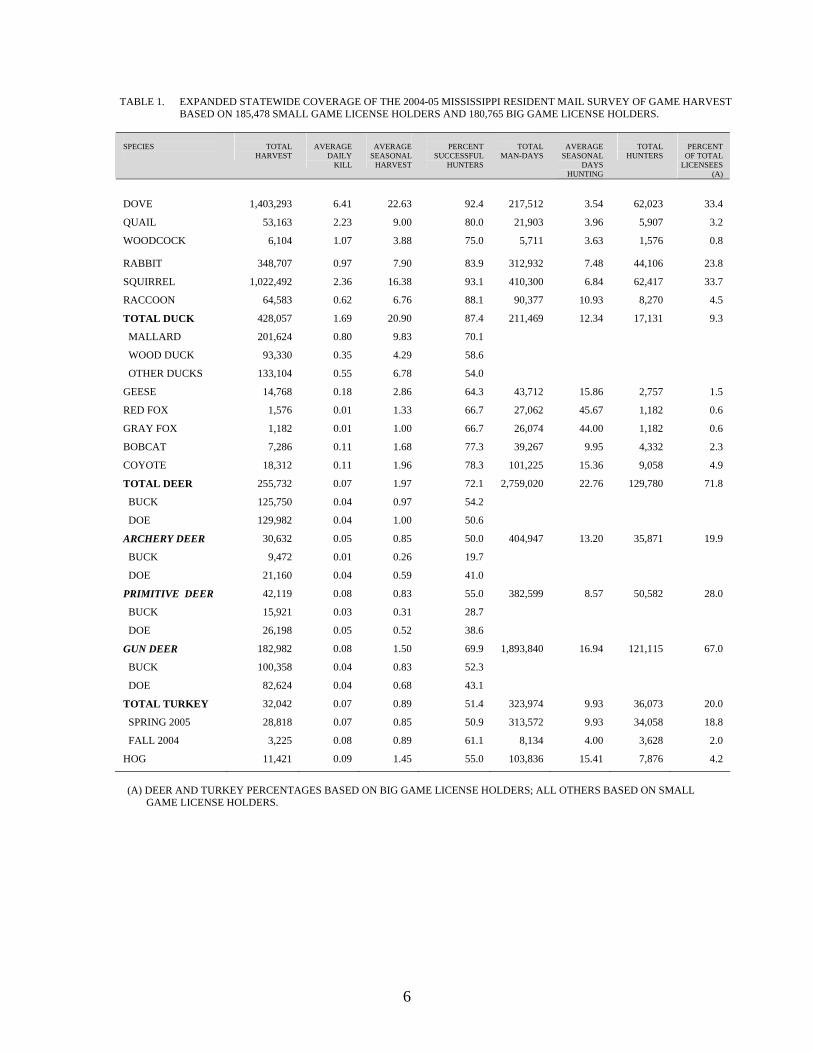
The expanded statewide summaries of the total harvest, average daily kill, average
seasonal harvest, percent of successful hunters, total man-days, average days hunted in the
season, total number of hunters, and percent of total licenses that hunted are provided in Table 1
for all game species included in the survey. Table 2 provides the expanded statewide estimates of
total harvest and the variability of these (standard error and 95 percent confidence limits) for all
game species surveyed.
Tables 3-8 summarize small game hunting on a statewide and district basis. Waterfowl
hunting is summarized in Tables 9-13. Tables 14-17 summarize fox (red and gray), bobcat, and
coyote hunting. Statewide and district summaries of deer (buck and doe data from archery,
primitive weapon, and gun seasons) and turkey hunting (spring and fall) are provided in Tables
18-26. Table 27 summarizes district and statewide estimates for feral hog. Tables 28-53
summarize hunter responses to demographic, participation, attitude, and opinion questions
contained in the questionnaire.
ACKNOWLEDGMENTS
This compilation would not have been possible without the efforts and cooperation of
many people. Many present and former MDWFP personnel from all divisions provided direct or
indirect assistance. MDWFP personnel deserving special recognition are: Dene Smith for her
administrative duties related to the survey, Ben Sessums and the print shop crew for producing
survey instruments, Curtis Thornhill and his staff for providing license information, and Randy
Spencer & Dave Godwin for serving as liaisons between MDWFP and Mississippi State
University.
Thanks also go to Will Freeman, Erica Wells, and Mike Thrash of the Human
Dimensions & Conservation Law Enforcement Laboratory in the Forest & Wildlife Research
Center at Mississippi State University for data processing and construction of data tables.

5
LITERATURE CITED
Dillman, D. A. 1978. Mail and telephone surveys: The Total Design Method. John Wiley & Sons, Inc., New York, NY. 325 pp. Filion, F. L. 1980 Humans surveys in wildlife management. Pages 441-453 in Schemitz, editor. Wildlife Techniques Manual. 4th ed. Rev. The Wildl. Soc., Washington, D.C. 686 pp. Steffen, D. E. 1981. Mississippi mail survey of game harvest and hunter effort for 1980-81. MDWFP Wildlife Division Technical Report, Jackson, MS.
6
TABLE 1. EXPANDED STATEWIDE COVERAGE OF THE 2004-05 MISSISSIPPI RESIDENT MAIL SURVEY OF GAME HARVEST BASED ON 185,478 SMALL GAME LICENSE HOLDERS AND 180,765 BIG GAME LICENSE HOLDERS.
SPECIES
TOTAL
HARVEST
AVERAGE
DAILY KILL
AVERAGE
SEASONAL HARVEST
PERCENT
SUCCESSFUL HUNTERS
TOTAL
MAN-DAYS
AVERAGE
SEASONAL DAYS
HUNTING
TOTAL
HUNTERS
PERCENT
OF TOTAL LICENSEES
(A)
DOVE
1,403,293
6.41
22.63
92.4
217,512
3.54
62,023
33.4
QUAIL 53,163 2.23 9.00 80.0 21,903 3.96 5,907 3.2
WOODCOCK 6,104 1.07 3.88 75.0 5,711 3.63 1,576 0.8
RABBIT 348,707 0.97 7.90 83.9 312,932 7.48 44,106 23.8
SQUIRREL 1,022,492 2.36 16.38 93.1 410,300 6.84 62,417 33.7
RACCOON 64,583 0.62 6.76 88.1 90,377 10.93 8,270 4.5
TOTAL DUCK 428,057 1.69 20.90 87.4 211,469 12.34 17,131 9.3
MALLARD 201,624 0.80 9.83 70.1
WOOD DUCK 93,330 0.35 4.29 58.6
OTHER DUCKS 133,104 0.55 6.78 54.0
GEESE 14,768 0.18 2.86 64.3 43,712 15.86 2,757 1.5
RED FOX 1,576 0.01 1.33 66.7 27,062 45.67 1,182 0.6
GRAY FOX 1,182 0.01 1.00 66.7 26,074 44.00 1,182 0.6
BOBCAT 7,286 0.11 1.68 77.3 39,267 9.95 4,332 2.3
COYOTE 18,312 0.11 1.96 78.3 101,225 15.36 9,058 4.9
TOTAL DEER 255,732 0.07 1.97 72.1 2,759,020 22.76 129,780 71.8
BUCK 125,750 0.04 0.97 54.2
DOE 129,982 0.04 1.00 50.6
ARCHERY DEER 30,632 0.05 0.85 50.0 404,947 13.20 35,871 19.9
BUCK 9,472 0.01 0.26 19.7
DOE 21,160 0.04 0.59 41.0
PRIMITIVE DEER 42,119 0.08 0.83 55.0 382,599 8.57 50,582 28.0
BUCK 15,921 0.03 0.31 28.7
DOE 26,198 0.05 0.52 38.6
GUN DEER 182,982 0.08 1.50 69.9 1,893,840 16.94 121,115 67.0
BUCK 100,358 0.04 0.83 52.3
DOE 82,624 0.04 0.68 43.1
TOTAL TURKEY 32,042 0.07 0.89 51.4 323,974 9.93 36,073 20.0
SPRING 2005 28,818 0.07 0.85 50.9 313,572 9.93 34,058 18.8
FALL 2004 3,225 0.08 0.89 61.1 8,134 4.00 3,628 2.0
HOG 11,421 0.09 1.45 55.0 103,836 15.41 7,876 4.2
(A) DEER AND TURKEY PERCENTAGES BASED ON BIG GAME LICENSE HOLDERS; ALL OTHERS BASED ON SMALL
GAME LICENSE HOLDERS.

TABLE 2. EXPANDED STATEWIDE ESTIMATES OF TOTAL HARVEST (AND VARIABILITY OF THE ESTIMATES) FOR RESIDENTS FOR ALL GAME SPECIES IN MISSISSIPPI DURING THE 2004-05 HUNTING SEASON.
STANDARD ERROR 95% CONFIDENCE INTERVAL
SPECIES
TOTAL
HARVEST
SE
AS % OF TOTAL
(A)
LOWER LIMIT
UPPER LIMIT
DOVE
1,403,293
126,551
9.0
1,150,193
1,656,394
QUAIL 53,163 15,388 28.9 22,389 38,937
WOODCOCK 6,104 3,078 50.4 -51 12,259
RABBIT 348,707 38,147 10.9 272,415 424,999
SQUIRREL 1,022,492 127,997 12.5 766,499 1,278,485
RACCOON 64,583 17,256 26.7 30,073 99,094
TOTAL DUCKS 428,057 69,440 16.2 289,178 566,936
MALLARD 201,624 37,277 18.5 127,072 276,176
WOOD DUCK 93,330 16,449 17.6 60,433 126,228
OTHER DUCKS 133,104 27,116 20.4 78,873 187,335
GEESE 14,768 4,650 31.5 5,469 24,067
RED FOX 1,576 880 55.8 -184 3,335
GRAY FOX 1,182 622 56.0 -63 2,425
BOBCAT 7,286 3,199 43.9 889 13,682
COYOTE 18,312 4,361 23.8 9,592 27,032
TOTAL DEER 255,732 11,495 4.5 232,743 278,720
BUCK 125,750 6,351 5.1 113,049 138,451
DOE 129,982 7,285 5.6 115,413 144,551
ARCHERY DEER 30,632 3,880 12.7 22,872 38,391
BUCK 9,472 1,854 19.6 5,764 13,180
DOE 21,160 2,741 13.0 15,680 26,641
PRIMITIVE DEER 42,119 3,870 9.2 34,379 49,858
BUCK 15,921 1,871 11.8 12,180 19,660
DOE 26,198 2,803 10.7 20,594 31,803
GUN DEER 182,982 8,257 4.5 166,469 199,496
BUCK 100,358 5,280 5.3 89,800 110,917
DOE 82,624 4,892 5.9 72,841 92,408
TOTAL TURKEY 32,042 3,509 11.0 25,025 39,060
SPRING 2005 28,818 3,290 11.4 22,238 35,398
FALL 2004 3,225 1,062 32.9 1,102 5,348
HOG 11,421 3,167 27.7 5,087 17,755
(A) %=100(SE/TOTAL HARVEST)

TAB
LE 3. EXPA
ND
ED STA
TEWID
E AN
D D
ISTRIC
T SUM
MA
RIES O
F DO
VE H
UN
TING
IN M
ISSISSIPPI DU
RIN
G TH
E 2004-05 HU
NTIN
G SEA
SON
.
DISTR
ICT
STA
TISTIC
TO
TAL
HA
RV
EST
A
VER
AG
E D
AILY
K
ILL
A
VER
AG
E SEA
SON
AL
HA
RV
EST
PER
CEN
T SU
CC
ESSFUL
HU
NTER
S
TO
TAL
MA
ND
AY
S
AV
ERA
GE
SEASO
NA
L D
AY
S H
UN
TING
TO
TAL
HU
NTER
S
PERC
ENT
HU
NTER
S PER
D
ISTRIC
T
1
ESTIMA
TE
(SE)
N
384,673
75,220.95
933
5.84
0.88
85
22.50
3.76
86
90.7
3.15
86
64,947
11,412.23
931
3.84
0.55
85
17,097
1,757.49
306
28.1
2.57
306
2 ESTIM
ATE
(SE)
N
139,755
27,705.06
933
6.70
0.62
44
15.98
2.14
44
86.4
5.23
44
20,919
3,616.41
931
2.39
0.22
44
8,748
1,287.89
306
14.4
2.01
306
3 ESTIM
ATE
(SE)
N
250,684
49,318.86
933
7.24
0.80
48
25.74
3.62
49
95.9
2.86
49
34,267
5,980.69
931
3.58
0.37
48
9,742
1,355.27
306
16.0
2.10
306
4 ESTIM
ATE
(SE)
N
253,268
51,636.34
933
6.31
0.93
66
19.30
3.22
66
95.5
2.58
66
40,243
8,199.71
931
3.06
0.51
66
13,121
1,557.70
306
21.6
2.36
306
5 ESTIM
ATE
(SE)
N
158,243
39,861.72
933
5.77
0.71
33
24.12
4.53
33
87.9
5.77
33
27,493
6,044.53
931
4.18
0.59
33
6,561
1,122.23
306
10.8
1.78
306
6 ESTIM
ATE
(SE)
N
156,056
49,138.77
933
6.71
1.25
28
28.04
7.25
28
96.4
3.57
28
23,309
6,695.57
931
4.18
0.93
28
5,567
1,036.59
306
9.2
1.65
306
STATEW
IDE
ESTIMA
TE
(SE)
N
1,403,293
126,550.18
942
6.41
0.41
311
22.63
1.76
315
92.4
1.50
315
217,512
17,277.07
938
3.54
0.23
311
62,023
2,852.57
942
33.4
1.54
942

TAB
LE 4. EXPA
ND
ED STA
TEWID
E AN
D D
ISTRIC
T SUM
MA
RIES O
F QU
AIL H
UN
TING
IN M
ISSISSIPPI DU
RIN
G TH
E 2004-05 HU
NTIN
G SEA
SON
.
DISTR
ICT
STA
TISTIC
TO
TAL
HA
RV
EST
A
VER
AG
E D
AILY
K
ILL
A
VER
AG
E SEA
SON
AL
HA
RV
EST
PER
CEN
T SU
CC
ESSFUL
HU
NTER
S
TO
TAL
MA
ND
AY
S
AV
ERA
GE
SEASO
NA
L D
AY
S H
UN
TING
TO
TAL
HU
NTER
S
PERC
ENT
HU
NTER
S PER
D
ISTRIC
T
1 ESTIM
ATE
(SE)
N
16,575
10,357.59
940
2.21
0.49 8
10.50
5.79 8
87.5
12.50 8
7,506
4,268.41
939
4.75
2.27 8
1,579
556.01
28
28.6
8.69
28
2 ESTIM
ATE
(SE)
N
8,090
5,235.27
940
4.80
0.32 2
13.67
4.91 3
100.0
0.00 3
988
814.22
939
2.50
1.50 2
592
341.40
28
10.7
5.95
28
3 ESTIM
ATE
(SE)
N
5,722
3,554.17
940
1.12
0.60 5
5.80
2.80 5
60.0
24.50 5
5,136
2,719.01
939
5.20
1.66 5
987
440.27
28
17.9
7.37
28
4 ESTIM
ATE
(SE)
N
12,628
8,290.89
940
4.27
2.18 5
12.80
6.89 5
60.0
24.50 5
2,963
1,462.49
939
3.00
0.71 5
987
440.27
28
17.9
7.37
28
5 ESTIM
ATE
(SE)
N
3,157
2,213.66
940
2.00
1.21 3
5.33
2.60 3
100.0
0.00 3
1,580
1,081.25
939
2.67
1.20 3
592
341.40
28
10.7
5.95
28
6 ESTIM
ATE
(SE)
N
5,920
4,266.52
940
2.14
1.22 4
7.50
4.50 4
75.0
25.00 4
2,765
1,502.41
939
3.50
0.87 4
790
394.00
28
14.3
6.73
28
STATEW
IDE
ESTIMA
TE
(SE)
N
53,163
15,387.17
942
2.23
0.45
28
9.00
2.08
30
80.0
7.43
30
21,902
5,687.31
940
3.96
0.73
28
5,907
1,061.71
942
3.2
0.57
942
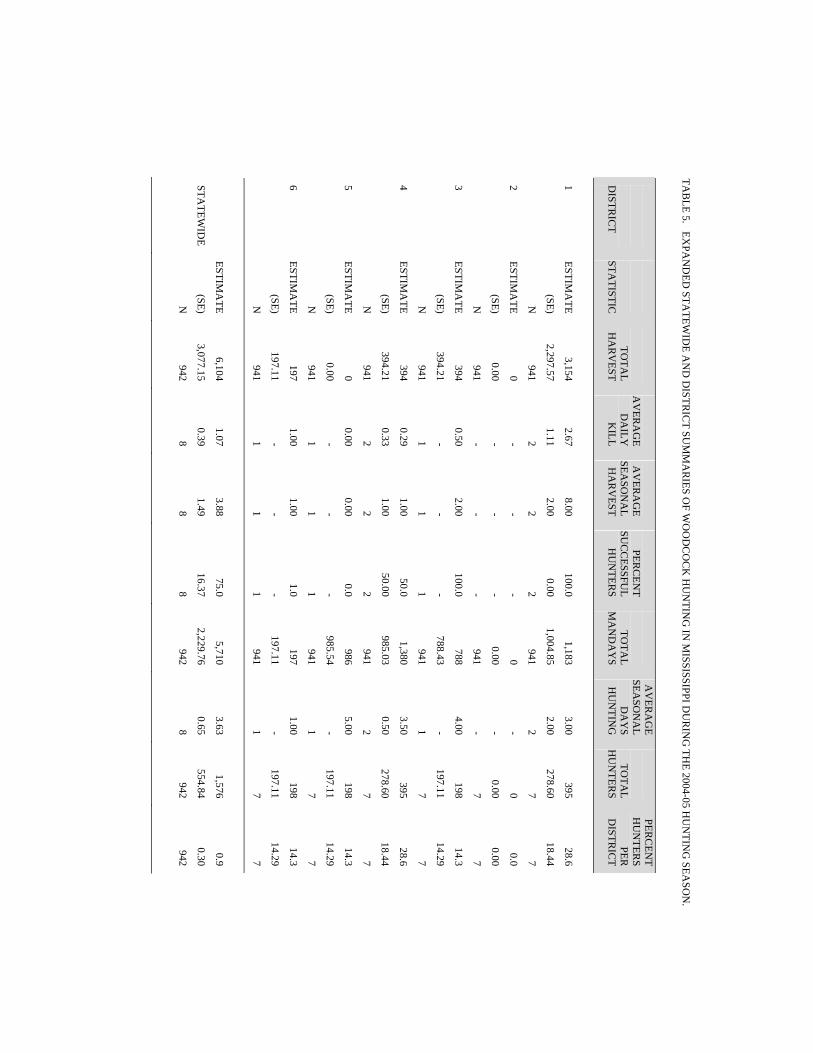
TAB
LE 5. EXPA
ND
ED STA
TEWID
E AN
D D
ISTRIC
T SUM
MA
RIES O
F WO
OD
CO
CK
HU
NTIN
G IN
MISSISSIPPI D
UR
ING
THE 2004-05 H
UN
TING
SEASO
N.
D
ISTRIC
T
STA
TISTIC
TO
TAL
HA
RV
EST
A
VER
AG
E D
AILY
K
ILL
A
VER
AG
E SEA
SON
AL
HA
RV
EST
PER
CEN
T SU
CC
ESSFUL
HU
NTER
S
TO
TAL
MA
ND
AY
S
AV
ERA
GE
SEASO
NA
L D
AY
S H
UN
TING
TO
TAL
HU
NTER
S
PERC
ENT
HU
NTER
S PER
D
ISTRIC
T
1 ESTIM
ATE
(SE)
N
3,154
2,297.57
941
2.67
1.11 2
8.00
2.00 2
100.0
0.00 2
1,183
1,004.85
941
3.00
2.00 2
395
278.60 7
28.6
18.44 7
2 ESTIM
ATE
(SE)
N
0
0.00
941
- - -
- - -
- - -
0
0.00
941
- - -
0
0.00 7
0.0
0.00 7
3 ESTIM
ATE
(SE)
N
394
394.21
941
0.50 - 1
2.00 - 1
100.0 - 1
788
788.43
941
4.00 - 1
198
197.11 7
14.3
14.29 7
4 ESTIM
ATE
(SE)
N
394
394.21
941
0.29
0.33 2
1.00
1.00 2
50.0
50.00 2
1,380
985.03
941
3.50
0.50 2
395
278.60 7
28.6
18.44 7
5 ESTIM
ATE
(SE)
N
0
0.00
941
0.00 - 1
0.00 - 1
0.0 - 1
986
985.54
941
5.00 - 1
198
197.11 7
14.3
14.29 7
6 ESTIM
ATE
(SE)
N
197
197.11
941
1.00 - 1
1.00 - 1
1.0 - 1
197
197.11
941
1.00 - 1
198
197.11 7
14.3
14.29 7
STATEW
IDE
ESTIMA
TE
(SE)
N
6,104
3,077.15
942
1.07
0.39 8
3.88
1.49 8
75.0
16.37 8
5,710
2,229.76
942
3.63
0.65 8
1,576
554.84
942
0.9
0.30
942

TAB
LE 6. EXPA
ND
ED STA
TEWID
E AN
D D
ISTRIC
T SUM
MA
RIES O
F RA
BB
IT HU
NTIN
G IN
MISSISSIPPI D
UR
ING
THE 2004-05 H
UN
TING
SEASO
N.
D
ISTRIC
T
STA
TISTIC
TO
TAL
HA
RV
EST
A
VER
AG
E D
AILY
K
ILL
A
VER
AG
E SEA
SON
AL
HA
RV
EST
PER
CEN
T SU
CC
ESSFUL
HU
NTER
S
TO
TAL
MA
ND
AY
S
AV
ERA
GE
SEASO
NA
L D
AY
S H
UN
TING
TO
TAL
HU
NTER
S
PERC
ENT
HU
NTER
S PER
D
ISTRIC
T
1 ESTIM
ATE
(SE)
N
81,634
20,554.99
927
1.06
0.20
47
8.50
1.79
48
77.1
6.13
48
72,859
18,475.96
919
7.68
1.63
47
9,605
1,350.59
209
23.0
2.92
209
2 ESTIM
ATE
(SE)
N
66,828
17,417.48
927
1.35
0.26
30
10.77
2.10
31
84.0
6.72
31
45,815
13,000.85
919
7.57
1.69
30
6,203
1,095.83
209
14.8
2.46
209
3 ESTIM
ATE
(SE)
N
52,822
22,139.85
927
1.13
0.45
18
13.20
4.82
20
95.0
5.00
20
27,045
13,853.53
919
7.44
3.49
18
4,002
885.58
209
9.6
2.04
209
4 ESTIM
ATE
(SE)
N
61,026
11,448.91
927
1.04
0.14
52
5.65
0.76
54
88.9
4.32
54
57,924
11,811.73
919
5.52
0.85
52
10,805
1,427.62
209
25.8
3.04
209
5 ESTIM
ATE
(SE)
N
36,816
9,216.40
927
1.13
0.27
29
6.13
1.09
30
80.0
7.43
30
32,494
9,180.41
919
5.55
1.22
29
6,003
1,078.61
209
14.4
2.43
209
6 ESTIM
ATE
(SE)
N
30,813
8,731.72
927
0.59
0.16
25
5.92
1.25
26
88.5
6.39
26
42,585
13,756.19
919
8.44
2.20
25
5,202
1,006.37
209
12.4
2.29
209
STATEW
IDE
ESTIMA
TE
(SE)
N
348,707
38,146.07
942
0.97
0.10
209
7.90
0.73
224
83.9
2.46
224
312,932
37,369.65
927
7.48
0.77
209
44,106
2,574.14
942
23.8
1.39
942

TAB
LE 7. EXPA
ND
ED STA
TEWID
E AN
D D
ISTRIC
T SUM
MA
RIES O
F SQU
IRR
EL HU
NTIN
G IN
MISSISSIPPI D
UR
ING
THE 2004-05 H
UN
TING
SEASO
N.
D
ISTRIC
T
STA
TISTIC
TO
TAL
HA
RV
EST
A
VER
AG
E D
AILY
K
ILL
A
VER
AG
E SEA
SON
AL
HA
RV
EST
PER
CEN
T SU
CC
ESSFUL
HU
NTER
S
TO
TAL
MA
ND
AY
S
AV
ERA
GE
SEASO
NA
L D
AY
S H
UN
TING
TO
TAL
HU
NTER
S
PERC
ENT
HU
NTER
S PER
D
ISTRIC
T
1
ESTIMA
TE
(SE)
N
183,654
51,469.27
915
2.07
0.47
64
13.94
3.56
65
96.9
2.16
65
88,333
19,817.61
905
6.73
1.28
64
13,177
1,576.03
290
22.4
2.45
290
2 ESTIM
ATE
(SE)
N
139,666
35,215.94
915
2.43
0.41
39
17.23
3.47
40
87.5
5.30
40
57,590
15,465.15
905
7.21
1.59
39
8,109
1,254.39
290
13.8
2.03
290
3 ESTIM
ATE
(SE)
N
51,083
14,183.70
915
2.28
0.51
23
10.50
2.05
24
91.7
5.76
24
22,339
6,580.75
905
4.74
1.02
23
4,865
980.49
290
8.3
1.62
290
4 ESTIM
ATE
(SE)
N
288,251
84,162.35
915
2.78
0.55
68
20.03
5.42
71
95.8
2.40
71
102,474
19,790.03
905
7.35
1.14
68
14,393
1,641.34
290
24.5
2.53
290
5 ESTIM
ATE
(SE)
N
143,315
25,804.07
915
2.30
0.35
47
14.43
1.67
49
91.8
3.95
49
62,304
12,900.76
905
6.47
0.98
47
9,933
1,381.20
290
16.9
2.20
290
6 ESTIM
ATE
(SE)
N
108,449
27,429.50
915
1.60
0.45
39
13.05
2.66
41
92.7
4.12
41
54,926
15,403.70
905
6.87
1.62
39
8,311
1,269.25
290
14.1
2.05
290
STATEW
IDE
ESTIMA
TE
(SE)
N
1,022,492
127,996.47
942
2.36
0.25
299
16.38
1.91
317
93.1
1.43
317
410,300
37,771.43
924
6.84
0.54
299
62,417
2,857.04
942
33.7
1.54
942

TAB
LE 8. EXPA
ND
ED STA
TEWID
E AN
D D
ISTRIC
T SUM
MA
RIES O
F RA
CC
OO
N H
UN
TING
IN M
ISSISSIPPI DU
RIN
G TH
E 2004-05 HU
NTIN
G SEA
SON
.
DISTR
ICT
STA
TISTIC
TO
TAL
HA
RV
EST
A
VER
AG
E D
AILY
K
ILL
A
VER
AG
E SEA
SON
AL
HA
RV
EST
PER
CEN
T SU
CC
ESSFUL
HU
NTER
S
TO
TAL
MA
ND
AY
S
AV
ERA
GE
SEASO
NA
L D
AY
S H
UN
TING
TO
TAL
HU
NTER
S
PERC
ENT
HU
NTER
S PER
D
ISTRIC
T 1
ESTIMA
TE
(SE)
N
7,309
6,012.52
939
1.00
0.22 4
9.25
6.98 4
100.0
0.00 4
7,309
5,323.40
939
9.25
5.66 4
791
394.42
39
10.3
4.92
39
2 ESTIM
ATE
(SE)
N
27,259
14,196.17
939
0.53
0.13
10
13.80
6.03
10
80.0
13.33
10
51,950
23,062.39
939
26.30
8.68
10
1,976
621.63
39
25.6
7.08
39
3 ESTIM
ATE
(SE)
N
3,556
1,601.37
939
1.00
0.47 5
1.80
0.66 5
80.0
20.00 5
1,778
859.50
939
1.80
0.37 5
988
440.74
39
12.8
5.42
39
4 ESTIM
ATE
(SE)
N
7,506
2,741.77
939
0.78
0.28
11
3.46
0.76
11
100.0
0.00
11
9,679
3,875.02
939
4.46
1.24
11
2,173
651.62
39
28.2
7.30
39
5 ESTIM
ATE
(SE)
N
10,469
5,842.73
939
1.43
0.46 9
5.89
2.80 9
88.9
11.11 9
7,309
3,374.50
939
4.11
1.40 9
1,778
590.05
39
23.1
6.84
39
6 ESTIM
ATE
(SE)
N
3,951
3,950.54
939
- - -
- - -
- - -
0
0.00
939
- - -
0
0.00
39
0.0
0.00
39
STATEW
IDE
ESTIMA
TE
(SE)
N
64,583
17,255.22
942
0.62
0.12
42
6.76
1.76
42
88.1
5.06
42
90,376
26,067.96
942
10.93
2.72
42
8,270
1,247.94
942
4.5
0.67
942
TAB
LE 9. EXPA
ND
ED STA
TEWID
E AN
D D
ISTRIC
T SUM
MA
RIES O
F ALL D
UC
K H
UN
TING
IN M
ISSISSIPPI DU
RIN
G TH
E 2004-05 HU
NTIN
G SEA
SON
.
DISTR
ICT
STA
TISTIC
TO
TAL
HA
RV
EST
A
VER
AG
E D
AILY
K
ILL
A
VER
AG
E SEA
SON
AL
HA
RV
EST
PER
CEN
T SU
CC
ESSFUL
HU
NTER
S
TO
TAL
MA
ND
AY
S
AV
ERA
GE
SEASO
NA
L D
AY
S H
UN
TING
TO
TAL
HU
NTER
S
PERC
ENT
HU
NTER
S PER
D
ISTRIC
T
1 ESTIM
ATE
(SE)
N
93,035
45,019.37
941
2.03
0.55
12
37.75
16.26
12
91.7
8.33
12
43,955
15,695.60
941
18.58
4.12
12
2,366
678.79
86
14.0
3.76
86
2 ESTIM
ATE
(SE)
N
98,751
28,369.95
941
1.73
0.24
22
19.77
4.67
22
86.4
7.49
22
49,474
13,697.44
941
11.41
2.10
22
4,337
914.13
86
25.6
4.73
86
3 ESTIM
ATE
(SE)
N
142,903
36,462.61
941
2.13
0.26
31
21.55
4.40
31
93.6
4.49
31
61,892
14,544.61
941
10.13
1.59
31
6,111
1,079.79
86
36.1
5.21
86
4 ESTIM
ATE
(SE)
N
9,461
5,110.62
941
1.66
0.26 6
8.00
3.11 6
83.3
16.67 6
5,716
2,952.30
941
4.83
1.68 6
1,183
481.53
86
7.0
2.76
86
5 ESTIM
ATE
(SE)
N
36,268
20,867.26
941
0.81
0.47
12
15.33
7.98
12
75.0
13.06
12
44,941
23,958.44
941
19.00
8.91
12
2,366
678.79
86
14.0
3.76
86
6 ESTIM
ATE
(SE)
N
7,490
5,182.09
941
0.74
0.22 3
4.67
2.91 3
66.7
33.33 3
3,745
2,371.61
941
6.33
2.03 3
592
341.04
86
3.5
1.99
86
STATEW
IDE
ESTIMA
TE
(SE)
N
428,057
69,439.67
942
1.69
0.23
87
20.90
3.22
87
87.4
3.58
87
211,469
34,619.55
942
12.35
1.59
87
17,131
1,750.61
942
9.2
0.94
942

TA
BLE 10. EX
PAN
DED
STATEW
IDE A
ND
DISTR
ICT SU
MM
AR
IES OF M
ALLA
RD
HU
NTIN
G IN
MISSISSIPPI D
UR
ING
THE 2004-05
H
UN
TING
SEASO
N.
MA
LLAR
DS
DISTR
ICT
STA
TISTIC
TOTA
L H
AR
VEST
A
VER
AG
E D
AILY
K
ILL
AV
ERA
GE
SEASO
NA
L H
AR
VEST
PERC
ENT
SUC
CESSFU
L H
UN
TERS
1
ESTIMA
TE
(SE)
N
44,349
25,151.47
941
1.00
0.38
12
18.67
9.59
12
58.3
14.87
12
2 ESTIM
ATE
(SE)
N
55,584
16,651.87
941
0.89
0.12
22
10.09
2.54
22
81.8
8.42
22
3 ESTIM
ATE
(SE)
N
70,762
19,699.55
941
1.03
0.18
31
10.45
2.50
31
87.1
6.12
31
4 ESTIM
ATE
(SE)
N
1,774
1,261.45
941
0.31
0.18 6
1.50
0.96 6
33.3
21.08 6
5 ESTIM
ATE
(SE)
N
13,798
8,584.49
941
0.31
0.19
12
5.83
3.36
12
50.0
15.08
12
6 ESTIM
ATE
(SE)
N
0
0.00
941
0.00
0.00 3
0.00
0.00 3
0.0
0.00 3
STA
TEWID
E
ESTIMA
TE
(SE)
N
201,624
37,276.15
942
0.80
0.13
87
9.83
1.80
87
70.1
4.94
87

TAB
LE 11. EXPA
ND
ED STA
TEWID
E AN
D D
ISTRIC
T SUM
MA
RIES O
F WO
OD
DU
CK
HU
NTIN
G IN
MISSISSIPPI D
UR
ING
TH
E 2004-05 HU
NTIN
G SEA
SON
.
WO
OD
DU
CK
S
D
ISTRIC
T
STA
TISTIC
TO
TAL
HA
RV
EST
A
VER
AG
E D
AILY
KILL
A
VER
AG
E SEA
SON
AL
HA
RV
EST
PERC
ENT
SUC
CESSFU
L H
UN
TERS
1
ESTIMA
TE
(SE)
N
22,076
9,414.00
941
0.44
0.12
12
8.08
3.12
12
75.0
13.06
12
2 ESTIM
ATE
(SE)
N
12,221
5,043.06
941
0.22
0.08
22
2.55
1.02
22
45.5
10.87
22
3 ESTIM
ATE
(SE)
N
25,427
9,522.13
941
0.36
0.13
31
3.61
1.38
31
54.8
9.09
31
4 ESTIM
ATE
(SE)
N
4,139
2,054.52
941
0.72
0.18 6
3.50
1.09 6
83.3
16.67 6
5 ESTIM
ATE
(SE)
N
12,418
5,545.77
941
0.28
0.14
12
5.25
1.88
12
58.3
14.87
12
6 ESTIM
ATE
(SE)
N
6,307
4,131.64
941
0.74
0.22 3
4.67
2.91 3
66.7
33.33 3
STATEW
IDE
ESTIMA
TE
(SE)
N
93,330
16,448.83
942
0.35
0.06
87
4.29
0.77
87
58.6
5.31
87
TAB
LE 12. EXPA
ND
ED STA
TEWID
E AN
D D
ISTRIC
T SUM
MA
RIES O
F OTH
ER D
UC
K H
UN
TING
IN M
ISSISSIPPI DU
RIN
G TH
E 2004-05 H
UN
TING
SEASO
N.
OTH
ER D
UC
KS
D
ISTRIC
T
STA
TISTIC
TO
TAL
HA
RV
EST
A
VER
AG
E D
AILY
KILL
AV
ERA
GE
SEASO
NA
L H
AR
VEST
PERC
ENT
SUC
CESSFU
L H
UN
TERS
1 ESTIM
ATE
(SE)
N
26,610
17,459.27
941
0.59
0.31
12
11.00
6.96
12
58.3
14.87
12
2 ESTIM
ATE
(SE)
N
30,946
9,925.09
941
0.63
0.11
22
7.14
1.77
22
63.6
10.50
22
3 ESTIM
ATE
(SE)
N
46,714
14,201.07
941
0.74
0.14
31
7.48
1.94
31
61.3
8.89
31
4 ESTIM
ATE
(SE)
N
3,548
2,262.84
941
0.62
0.12 6
3.00
1.61 6
50.0
22.36 6
5 ESTIM
ATE
(SE)
N
10,053
8,001.65
941
0.22
0.18
12
4.25
3.29
12
33.3
14.21
12
6 ESTIM
ATE
(SE)
N
1,183
1,182.64
941
0.00
0.00 3
0.00
0.00 3
0.0
0.00 3
STATEW
IDE
ESTIMA
TE
(SE)
N
133,103
27,115.53
942
0.55
0.10
87
6.78
1.34
87
54.0
5.37
87

TAB
LE 13. EXPA
ND
ED STA
TEWID
E AN
D D
ISTRIC
T SUM
MA
RIES O
F GO
OSE H
UN
TING
IN M
ISSISSIPPI DU
RIN
G TH
E 2004-05 HU
NTIN
G SEA
SON
.
DISTR
ICT
STA
TISTIC
TO
TAL
HA
RV
EST
A
VER
AG
E D
AILY
K
ILL
A
VER
AG
E SEA
SON
AL
HA
RV
EST
PER
CEN
T SU
CC
ESSFUL
HU
NTER
S
TO
TAL
MA
ND
AY
S
AV
ERA
GE
SEASO
NA
L D
AY
S H
UN
TING
TO
TAL
HU
NTER
S
PERC
ENT
HU
NTER
S PER
D
ISTRIC
T 1
ESTIMA
TE
(SE)
N
1,969
1,782.78
942
0.23
0.11 2
4.50
4.50 2
50.0
50.00 2
7,876
6,224.48
942
20.00
10.00 2
394
278.31
14
14.3
9.71
14
2 ESTIM
ATE
(SE)
N
5,119
3,509.09
942
1.13
0.22 4
2.25
0.85 4
75.0
25.00 4
1,575
834.23
942
2.00
0.41 4
788
393.17
14
28.6
12.53
14
3 ESTIM
ATE
(SE)
N
4,332
2,061.35
942
0.30
0.13 6
3.00
1.16 6
66.7
21.08 6
12,011
8,544.22
942
10.17
6.49 6
1,182
481.02
14
42.9
13.73
14
4 ESTIM
ATE
(SE)
N
0
0.00
942
- - -
- - -
- - -
0
0.00
942
- - -
0
0.00
14
0.0
0.00
14
5 ESTIM
ATE
(SE)
N
0
0.00
942
0.00 - 1
0.00 - 1
0.0 - 1
21,659
21,658.79
942
110.00 - 1
197
196.90
14
7.1
7.14
14
6 ESTIM
ATE
(SE)
N
1,378
983.99
942
1.33 - 1
4.00 - 1
1.0 - 1
591
590.69
942
3.00 - 1
197
196.90
14
7.1
7.14
14
STATEW
IDE
ESTIMA
TE
(SE)
N
14,767
4,649.55
942
0.18
0.10
14
2.86
0.76
14
64.3
13.29
14
43,711
24,095.35
942
15.86
7.95
14
2,757
731.62
942
1.5
0.40
942

TAB
LE 14. EXPA
ND
ED STA
TEWID
E AN
D D
ISTRIC
T SUM
MA
RIES O
F RED
FOX
HU
NTIN
G IN
MISSISSIPPI D
UR
ING
THE 2004-05 H
UN
TING
SEASO
N.
DISTR
ICT
STA
TISTIC
TO
TAL
HA
RV
EST
A
VER
AG
E D
AILY
K
ILL
A
VER
AG
E SEA
SON
AL
HA
RV
EST
PER
CEN
T SU
CC
ESSFUL
HU
NTER
S
TO
TAL
MA
ND
AY
S
AV
ERA
GE
SEASO
NA
L D
AY
S H
UN
TING
TO
TAL
HU
NTER
S
PERC
ENT
HU
NTER
S PER
D
ISTRIC
T
1 ESTIM
ATE
(SE)
N
0
0.00
940
- - -
- - -
- - -
0
0.00
939
- - -
0
0.00 4
0.0
0.00 4
2 ESTIM
ATE
(SE)
N
0
0.00
940
0.00 - 1
0.00 - 1
0.0 - 1
395
395.05
939
2.00 - 1
198
197.32 4
25.0
25.00 4
3 ESTIM
ATE
(SE)
N
0
0.00
940
- - -
- - -
- - -
0
0.00
939
- - -
0
0.00 4
0.0
0.00 4
4 ESTIM
ATE
(SE)
N
0
0.00
940
- - -
- - -
- - -
0
0.00
939
- - -
0
0.00 4
0.0
0.00 4
5 ESTIM
ATE
(SE)
N
592
591.95
940
0.00 - 1
1.50
1.50 2
50.0
50.00 2
21,728
21,727.99
939
110.00 - 1
395
278.90 4
50.0
28.87 4
6 ESTIM
ATE
(SE)
N
197
197.32
940
0.04 - 1
1.00 - 1
1.0 - 1
4,938
4,938.18
939
25.00 - 1
197
197.32 4
25.0
25.00 4
STATEW
IDE
ESTIMA
TE
(SE)
N
1,575
879.53
942
0.01
0.01 3
1.33
0.56 6
66.7
21.08 6
27,061
22,279.94
939
45.67
32.85 3
1,182
481.02
942
0.6
0.26
942

TAB
LE 15. EXPA
ND
ED STA
TEWID
E AN
D D
ISTRIC
T SUM
MA
RIES O
F GR
AY
FOX
HU
NTIN
G IN
MISSISSIPPI D
UR
ING
THE 2004-05 H
UN
TING
SEASO
N.
D
ISTRIC
T
STA
TISTIC
TO
TAL
HA
RV
EST
A
VER
AG
E D
AILY
K
ILL
A
VER
AG
E SEA
SON
AL
HA
RV
EST
PER
CEN
T SU
CC
ESSFUL
HU
NTER
S
TO
TAL
MA
ND
AY
S
AV
ERA
GE
SEASO
NA
L D
AY
S H
UN
TING
TO
TAL
HU
NTER
S
PERC
ENT
HU
NTER
S PER
D
ISTRIC
T
1 ESTIM
ATE
(SE)
N
0
0.00
941
- - -
- - -
- - -
0
0.00
939
- - -
0
0.00 5
0.0
0.00 5
2 ESTIM
ATE
(SE)
N
394
394.21
941
0.00 - 1
1.00
1.00 2
50.0
50.00 2
395
395.05
939
2.00 - 1
395
278.60 5
40.0
24.50 5
3 ESTIM
ATE
(SE)
N
0
0.00
941
- - -
- - -
- - -
0
0.00
939
- - -
0
0.00 5
0.0
0.00 5
4 ESTIM
ATE
(SE)
N
197
197.11
941
0.05 - 1
1.00 - 1
1.0 - 1
3,951
3,950.54
939
20.00 - 1
198
197.11 5
20.0
20.00 5
5 ESTIM
ATE
(SE)
N
197
197.11
941
0.00 - 1
0.50
0.50 2
50.0
50.00 2
21,728
21,727.99
939
110.00 - 1
395
278.60 5
40.0
24.50 5
6 ESTIM
ATE
(SE)
N
0
0.00
941
- - -
- - -
- - -
0
0.00
939
- - -
0
0.00 5
0.0
0.00 5
STATEW
IDE
ESTIMA
TE
(SE)
N
1,181
621.79
942
0.01
0.01 3
1.00
0.37 6
66.7
21.08 6
26,074
22,083.11
939
44.00
33.41 3
1,182
481.02
942
0.6
0.26
942

TAB
LE 16. EXPA
ND
ED STA
TEWID
E AN
D D
ISTRIC
T SUM
MA
RIES O
F BO
BC
AT IN
MISSISSIPPI D
UR
ING
THE 2004-05 H
UN
TING
SEASO
N.
D
ISTRIC
T
STA
TISTIC
TO
TAL
HA
RV
EST
A
VER
AG
E D
AILY
K
ILL
A
VER
AG
E SEA
SON
AL
HA
RV
EST
PER
CEN
T SU
CC
ESSFUL
HU
NTER
S
TO
TAL
MA
ND
AY
S
AV
ERA
GE
SEASO
NA
L D
AY
S H
UN
TING
TO
TAL
HU
NTER
S
PERC
ENT
HU
NTER
S PER
D
ISTRIC
T
1 ESTIM
ATE
(SE)
N
197
197.32
940
1.00 - 1
1.00 - 1
100.0 - 1
198
197.53
939
1.00 - 1
198
197.32
20
5.0
5.00
20
2 ESTIM
ATE
(SE)
N
789
482.90
940
0.30
0.23 3
1.00
0.41 4
75.0
25.00 4
1,975
1,279.18
939
3.33
1.20 3
790
394.00
20
20.0
9.18
20
3 ESTIM
ATE
(SE)
N
987
521.34
940
1.00
0.00 4
1.25
0.25 4
100.0
0.00 4
988
521.89
939
1.25
0.25 4
790
394.00
20
20.0
9.18
20
4 ESTIM
ATE
(SE)
N
1,184
557.06
940
0.15
0.07 5
1.20
0.20 5
100.0
0.00 5
7,704
4,477.93
939
7.80
3.25 5
987
440.27
20
25.0
9.93
20
5 ESTIM
ATE
(SE)
N
1,184
836.70
940
0.05
0.06 1
1.00
0.63 6
50.0
22.36 6
25,284
21,833.29
939
21.33
17.79 6
1,184
482.04
20
30.0
10.51
20
6 ESTIM
ATE
(SE)
N
0
0.00
940
- - -
- - -
- - -
0
0.00
939
- - -
0
0.00
20
0.0
0.00
20
STATEW
IDE
ESTIMA
TE
(SE)
N
7,285
3,198.17
942
0.11
0.07
20
1.68
0.66
22
77.3
9.15
22
39,266
22,510.33
940
9.95
5.40
20
4,332
913.17
942
2.3
0.49
942

TAB
LE 17. EXPA
ND
ED STA
TEWID
E AN
D D
ISTRIC
T SUM
MA
RIES O
F CO
YO
TE HU
NTIN
G D
UR
ING
THE 2004-05 H
UN
TING
SEASO
N.
D
ISTRIC
T
STA
TISTIC
TO
TAL
HA
RV
EST
A
VER
AG
E D
AILY
K
ILL
A
VER
AG
E SEA
SON
AL
HA
RV
EST
PER
CEN
T SU
CC
ESSFUL
HU
NTER
S
TO
TAL
MA
ND
AY
S
AV
ERA
GE
SEASO
NA
L D
AY
S H
UN
TING
TO
TAL
HU
NTER
S
PERC
ENT
HU
NTER
S PER
D
ISTRIC
T
1 ESTIM
ATE
(SE)
N
2,774
2,039.26
936
1.00 - 1
2.80
1.83 5
80.0
20.00 5
3,001
2,106.85
927
3.75
2.14 4
991
442.15
40
12.5
5.30
40
2 ESTIM
ATE
(SE)
N
789
482.90
940
0.20
0.12 4
1.29
0.47 7
85.7
14.29 7
3,001
1,683.96
927
3.75
1.11 4
1,388
522.60
40
17.5
6.08
40
3 ESTIM
ATE
(SE)
N
2,180
1,991.28
936
0.34
0.17 4
2.75
2.43 4
50.0
28.87 4
6,403
4,480.44
927
8.00
4.53 4
793
395.68
40
10.0
4.80
40
4 ESTIM
ATE
(SE)
N
3,765
1,232.03
936
0.55
0.11 9
1.33
0.26
12
83.3
11.24
12
4,402
1,829.08
927
2.44
0.65 9
2,378
682.40
40
30.0
7.34
40
5 ESTIM
ATE
(SE)
N
2,576
1,467.97
936
0.07
0.06 8
1.44
0.71 9
55.6
17.57 9
32,814
22,931.38
927
20.50
13.22 8
1,784
591.93
40
22.5
6.69
40
6 ESTIM
ATE
(SE)
N
2,180
1,645.38
936
0.04
<0.01 2
3.67
2.19 3
100.0
0.00 3
49,621
41,143.09
927
124.00
76.00 2
595
342.86
40
7.5
4.22
40
STATEW
IDE
ESTIMA
TE
(SE)
N
18,312
4,360.03
942
0.11
0.04
33
1.96
0.39
46
78.3
6.15
46
101,224
47,274.73
929
15.36
6.78
33
9,058
1,303.11
942
4.9
0.70
942

TAB
LE 18. EXPA
ND
ED STA
TEWID
E AN
D D
ISTRIC
T SUM
MA
RIES O
F AR
CH
ERY
DEER
HU
NTIN
G IN
MISSSISSIPPI D
UR
ING
THE 2004-05 H
UN
TING
SEASO
N.
D
ISTRIC
T
STA
TISTIC
TO
TAL
HA
RV
EST
A
VER
AG
E D
AILY
K
ILL
A
VER
AG
E SEA
SON
AL
HA
RV
EST
PER
CEN
T SU
CC
ESSFUL
HU
NTER
S
TO
TAL
MA
ND
AY
S
AV
ERA
GE
SEASO
NA
L D
AY
S H
UN
TING
TO
TAL
HU
NTER
S
PERC
ENT
HU
NTER
S PER
D
ISTRIC
T
1 ESTIM
ATE
(SE)
N
7,653
2,124.91
874
0.08
0.02
31
0.97
0.23
38
55.3
8.17
38
70,157
16,472.14
858
10.74
1.69
31
7,860
1,247.64
155
24.5
3.47
155
2 ESTIM
ATE
(SE)
N
4,137
1,198.53
874
0.06
0.01
21
0.83
0.18
24
58.3
10.28
24
50,353
13,498.79
858
11.38
1.86
21
4,964
999.79
155
15.5
2.92
155
3 ESTIM
ATE
(SE)
N
2,275
1,072.55
874
0.04
0.01
18
0.61
0.26
18
33.3
11.43
18
53,092
17,107.66
858
14.00
3.20
18
3,723
868.90
155
11.6
2.58
155
4 ESTIM
ATE
(SE)
N
6,412
2,068.40
874
0.05
0.01
33
0.84
0.24
37
48.7
8.33
37
106,816
30,619.27
858
15.36
3.59
33
7,653
1,231.85
155
23.9
3.44
155
5 ESTIM
ATE
(SE)
N
2,896
1,050.65
874
0.03
0.01
23
0.58
0.18
24
41.7
10.28
24
101,338
32,041.86
858
20.91
5.13
23
4,964
999.79
155
15.5
2.92
155
6 ESTIM
ATE
(SE)
N
1,448
900.71
874
0.06
0.05
13
0.50
0.29
14
21.4
11.38
14
14,326
5,442.73
858
5.23
1.42
13
2,896
768.08
155
9.0
2.31
155
STATEW
IDE
ESTIMA
TE
(SE)
N
30,631
3,879.78
897
0.05
0.01
147
0.85
0.09
178
50.0
3.76
178
404,947
50,628.58
866
13.20
1.32
147
35,871
2,408.48
897
19.8
1.33
897

TAB
LE 19. EXPA
ND
ED STA
TEWID
E AN
D D
ISTRIC
T SUM
MA
RIES O
F AR
CH
ERY
BU
CK
AN
D D
OE H
UN
TING
IN M
ISSISSIPPI DU
RIN
G TH
E 2004-05 H
UN
TING
SEASO
N.
B
UC
KS
D
OES
DISTR
ICT
STA
TISTIC
TO
TAL
HA
RV
EST
A
VER
AG
E D
AILY
K
ILL
A
VER
AG
E SEA
SON
AL
HA
RV
EST
PER
CEN
T SU
CC
ESSFUL
HU
NTER
S
TO
TAL
HA
RV
EST
A
VER
AG
E D
AILY
K
ILL
A
VER
AG
E SEA
SON
AL
HA
RV
EST
PER
CEN
T SU
CC
ESSFUL
HU
NTER
S
1 ESTIM
ATE
(SE)
N
2,482
967.01
874
0.03
0.01
31
0.32
0.11
38
21.1
6.70
38
5,171
1,345.69
874
0.05
0.01
31
0.66
0.14
38
50.0
8.22
38
2 ESTIM
ATE
(SE)
N
827
412.94
874
0.01
0.01
21
0.17
0.08
24
16.7
7.77
24
3,309
1,089.30
874
0.05
0.02
21
0.67
0.18
24
45.8
10.39
24
3 ESTIM
ATE
(SE)
N
414
292.33
874
0.01
<0.01
18
0.11
0.08
18
11.1
7.62
18
1,861
899.84
874
0.04
0.01
18
0.50
0.22
18
27.8
10.86
18
4 ESTIM
ATE
(SE)
N
1,861
799.01
874
0.02
<0.01
33
0.24
0.10
37
18.9
6.53
37
4,550
1,425.45
874
0.03
0.01
33
0.60
0.16
37
40.5
8.18
37
5 ESTIM
ATE
(SE)
N
827
412.94
874
0.01
<0.01
23
0.17
0.08
24
16.7
7.77
24
2,068
771.14
874
0.02
0.01
23
0.42
0.13
24
33.3
9.83
24
6 ESTIM
ATE
(SE)
N
621
462.26
874
0.02
0.02
13
0.21
0.16
14
14.3
9.71
14
827
506.13
874
0.04
0.04
13
0.29
0.16
14
21.4
11.38
14
STATEW
IDE
ESTIMA
TE
(SE)
N
9,472
1,853.91
897
0.02
<0.01
147
0.26
0.05
178
19.7
2.99
178
21,160
2,740.36
897
0.04
0.01
147
0.59
0.07
178
41.0
3.70
178

TAB
LE 20. EXPA
ND
ED STA
TEWID
E AN
D D
ISTRIC
T SUM
MA
RIES O
F PRIM
ATIV
E WEA
PON
DEER
HU
NTIN
G IN
MISSISSIPPI D
UR
ING
THE 2004-05
HU
NTIN
G SEA
SON
.
D
ISTRIC
T
STA
TISTIC
TO
TAL
HA
RV
EST
A
VER
AG
E D
AILY
K
ILL
A
VER
AG
E SEA
SON
AL
HA
RV
EST
PER
CEN
T SU
CC
ESSFUL
HU
NTER
S
TO
TAL
MA
ND
AY
S
AV
ERA
GE
SEASO
NA
L D
AY
S H
UN
TING
TO
TAL
HU
NTER
S
PERC
ENT
HU
NTER
S PER
D
ISTRIC
T
1 ESTIM
ATE
(SE)
N
7,714
1,835.59
867
0.07
0.02
40
0.79
0.15
47
48.9
7.37
47
66,721
14,618.63
848
7.83
1.23
40
9,800
1,390.89
221
21.3
2.76
221
2 ESTIM
ATE
(SE)
N
6,046
1,561.55
867
0.10
0.02
32
0.83
0.17
35
54.3
8.54
35
52,865
12,192.16
848
7.75
1.20
32
7,298
1,209.02
221
15.8
2.46
221
3 ESTIM
ATE
(SE)
N
6,046
1,616.33
867
0.09
0.02
30
0.88
0.18
33
54.6
8.80
33
62,031
17,384.47
848
9.70
2.12
30
6,881
1,175.37
221
14.9
2.40
221
4 ESTIM
ATE
(SE)
N
8,757
1,668.47
867
0.10
0.02
49
0.79
0.11
53
58.5
6.83
53
83,561
17,736.35
848
8.00
1.30
49
11,051
1,471.59
221
24.0
2.88
221
5 ESTIM
ATE
(SE)
N
5,421
1,550.23
867
0.08
0.03
29
0.84
0.19
31
51.6
9.12
31
65,442
25,600.25
848
10.59
3.73
29
6,464
1,140.57
221
14.0
2.34
221
6 ESTIM
ATE
(SE)
N
1,668
657.26
867
0.04
0.01
22
0.36
0.12
22
31.8
10.16
22
46,044
16,877.03
848
9.82
3.01
22
4,587
966.00
221
10.0
2.02
221
STATEW
IDE
ESTIMA
TE
(SE)
N
42,118
3,869.61
897
0.08
0.01
212
0.83
0.06
251
55.0
3.15
251
382,598
41,777.82
858
8.57
0.79
212
50,582
2,710.95
897
28.0
1.50
897

TAB
LE 21. EXPA
ND
ED STA
TEWID
E AN
D D
ISTRIC
T OF PR
IMA
TIVE W
EAPO
N B
UC
K A
ND
DO
E HU
NTIN
G IN
MISSISSIPPI D
UR
ING
THE 2004-05
HU
NTIN
G SEA
SON
.
BU
CK
S
DO
ES
D
ISTRIC
T
STA
TISTIC
TO
TAL
HA
RV
EST
AV
ERA
GE
DA
ILY
KILL
AV
ERA
GE
SEASO
NA
L H
AR
VEST
PERC
ENT
SUC
CESSFU
L H
UN
TERS
TO
TAL
HA
RV
EST
AV
ERA
GE
DA
ILY
KILL
AV
ERA
GE
SEASO
NA
L H
AR
VEST
PERC
ENT
SUC
CESSFU
L H
UN
TERS
1 ESTIM
ATE
(SE)
N
2,710
802.70
867
0.02
0.01
40
0.28
0.07
47
25.5
6.43
47
5,004
1,308.40
867
0.05
0.02
40
0.51
0.11
47
36.2
7.08
47
2 ESTIM
ATE
(SE)
N
2,293
687.49
867
0.04
0.01
32
0.31
0.08
35
31.4
7.96
35
3,753
1,209.72
867
0.06
0.02
32
0.51
0.14
35
34.3
8.14
35
3 ESTIM
ATE
(SE)
N
2,293
804.20
867
0.03
0.01
30
0.33
0.10
33
27.3
7.87
33
3,753
1,173.19
867
0.05
0.02
30
0.55
0.15
33
36.4
8.50
33
4 ESTIM
ATE
(SE)
N
2,919
774.24
867
0.04
0.01
49
0.26
0.06
53
26.4
6.11
53
5,838
1,200.14
867
0.06
0.01
49
0.53
0.08
53
47.2
6.92
53
5 ESTIM
ATE
(SE)
N
1,877
688.95
867
0.03
0.01
29
0.29
0.10
31
25.8
7.99
31
3,544
1,077.28
867
0.05
0.02
29
0.55
0.14
31
38.7
8.89
31
6 ESTIM
ATE
(SE)
N
1,043
465.13
867
0.02
0.01
22
0.23
0.09
22
22.7
9.15
22
626
360.71
867
0.01
0.01
22
0.14
0.08
22
13.6
7.49
22
STATEW
IDE
ESTIMA
TE
(SE)
N
15,920
1,870.34
897
0.03
<0.01
212
0.32
0.03
251
28.7
2.86
251
26,198
2,802.35
897
0.05
0.01
212
0.52
0.05
251
38.7
3.08
251
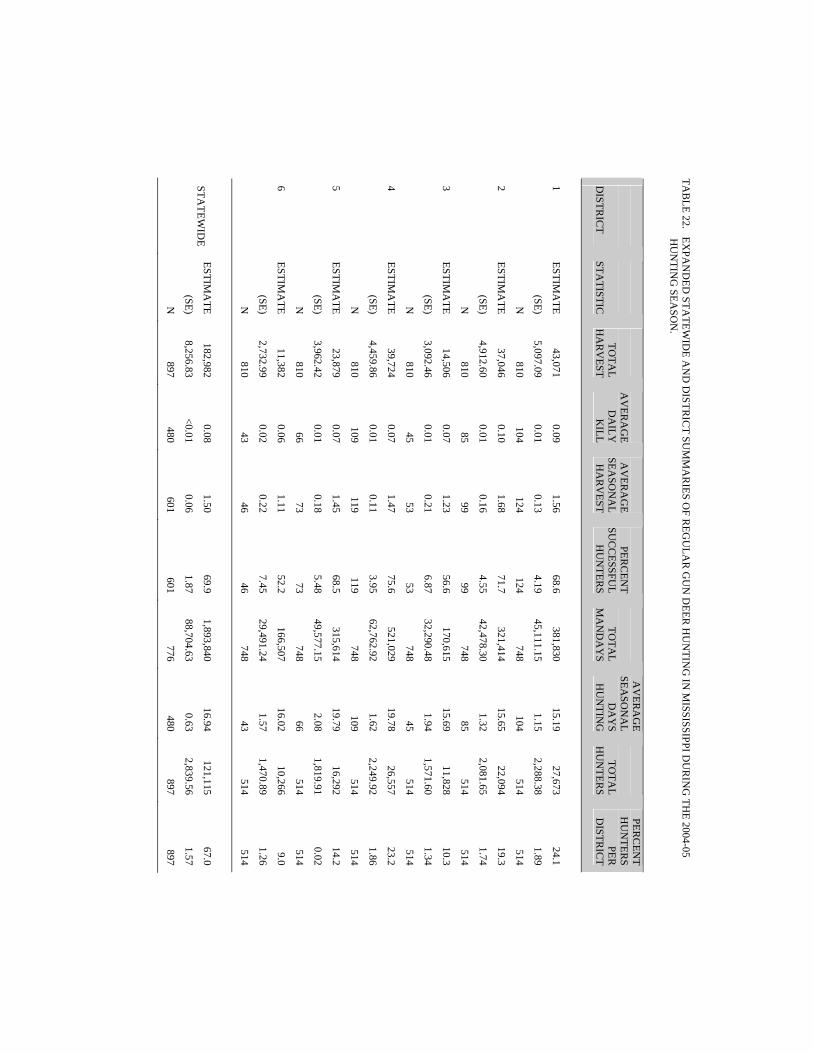
TAB
LE 22. EXPA
ND
ED STA
TEWID
E AN
D D
ISTRIC
T SUM
MA
RIES O
F REG
ULA
R G
UN
DEER
HU
NTIN
G IN
MISSISSIPPI D
UR
ING
THE 2004-05
HU
NTIN
G SEA
SON
.
DISTR
ICT
STA
TISTIC
TO
TAL
HA
RV
EST
A
VER
AG
E D
AILY
K
ILL
A
VER
AG
E SEA
SON
AL
HA
RV
EST
PER
CEN
T SU
CC
ESSFUL
HU
NTER
S
TO
TAL
MA
ND
AY
S
AV
ERA
GE
SEASO
NA
L D
AY
S H
UN
TING
TO
TAL
HU
NTER
S
PERC
ENT
HU
NTER
S PER
D
ISTRIC
T
1 ESTIM
ATE
(SE)
N
43,071
5,097.09
810
0.09
0.01
104
1.56
0.13
124
68.6
4.19
124
381,830
45,111.15
748
15.19
1.15
104
27,673
2,288.38
514
24.1
1.89
514
2 ESTIM
ATE
(SE)
N
37,046
4,912.60
810
0.10
0.01
85
1.68
0.16
99
71.7
4.55
99
321,414
42,478.30
748
15.65
1.32
85
22,094
2,081.65
514
19.3
1.74
514
3 ESTIM
ATE
(SE)
N
14,506
3,092.46
810
0.07
0.01
45
1.23
0.21
53
56.6
6.87
53
170,615
32,290.48
748
15.69
1.94
45
11,828
1,571.60
514
10.3
1.34
514
4 ESTIM
ATE
(SE)
N
39,724
4,459.86
810
0.07
0.01
109
1.47
0.11
119
75.6
3.95
119
521,029
62,762.92
748
19.78
1.62
109
26,557
2,249.92
514
23.2
1.86
514
5 ESTIM
ATE
(SE)
N
23,879
3,962.42
810
0.07
0.01
66
1.45
0.18
73
68.5
5.48
73
315,614
49,577.15
748
19.79
2.08
66
16,292
1,819.91
514
14.2
0.02
514
6 ESTIM
ATE
(SE)
N
11,382
2,732.99
810
0.06
0.02
43
1.11
0.22
46
52.2
7.45
46
166,507
29,491.24
748
16.02
1.57
43
10,266
1,470.89
514
9.0
1.26
514
STATEW
IDE
ESTIMA
TE
(SE)
N
182,982
8,256.83
897
0.08
<0.01
480
1.50
0.06
601
69.9
1.87
601
1,893,840
88,704.63
776
16.94
0.63
480
121,115
2,839.56
897
67.0
1.57
897

TAB
LE 23. EXPA
ND
ED STA
TEWID
E AN
D D
ISTRIC
T SUM
MA
RIES O
F REG
ULA
R G
UN
BU
CK
AN
D D
OE H
UN
TING
IN M
ISSISSIPPI DU
RIN
G TH
E 2004-05 H
UN
TING
SEASO
N.
BU
CK
S DO
ES
DISTR
ICT
STA
TISTIC
TO
TAL
HA
RV
EST
A
VER
AG
E D
AILY
K
ILL
A
VER
AG
E SEA
SON
AL
HA
RV
EST
PER
CEN
T SU
CC
ESSFUL
HU
NTER
S
TO
TAL
HA
RV
EST
A
VER
AG
E D
AILY
K
ILL
A
VER
AG
E SEA
SON
AL
HA
RV
EST
PER
CEN
T SU
CC
ESSFUL
HU
NTER
S
1 ESTIM
ATE
(SE)
N
21,424
2,830.09
810
0.05
0.01
104
0.77
0.08
124
51.6
4.51
124
21,647
2,923.36
810
0.05
0.01
104
0.78
0.08
124
49.2
4.51
124
2 ESTIM
ATE
(SE)
N
18,300
2,676.85
810
0.05
0.01
85
0.83
0.09
99
52.5
5.04
99
18,746
2,728.42
810
0.05
0.01
85
0.85
0.10
99
52.5
5.04
99
3 ESTIM
ATE
(SE)
N
8,257
1,832.05
810
0.04
0.01
45
0.70
0.13
53
43.4
6.87
53
6,249
1,828.26
810
0.07
0.01
45
0.53
0.14
53
30.2
6.37
53
4 ESTIM
ATE
(SE)
N
24,102
3,058.54
810
0.05
0.01
109
0.89
0.09
119
57.1
4.56
119
15,622
2,404.55
810
0.03
<0.01
109
0.58
0.08
119
39.5
4.50
119
5 ESTIM
ATE
(SE)
N
13,167
2,306.67
810
0.04
0.01
66
0.81
0.11
73
53.4
5.88
73
10,712
2,132.01
810
0.03
0.01
66
0.64
0.11
73
39.7
5.77
73
6 ESTIM
ATE
(SE)
N
7,141
2,031.16
810
0.04
0.01
43
0.70
0.17
46
39.1
7.28
46
4,240
1,234.34
810
0.03
0.01
43
0.41
0.11
46
30.4
6.86
46
STATEW
IDE
ESTIMA
TE
(SE)
N
100,358
5,279.27
897
0.04
<0.01
480
0.83
0.04
601
52.8
2.04
601
82,624
4,891.85
897
0.04
<0.01
480
0.68
0.04
601
43.1
2.02
601

TAB
LE 24. EXPA
ND
ED STA
TEWID
E AD
DISTR
ICT SU
MM
AR
IES OF SPR
ING
TUR
KEY
HU
NTIN
G IN
MISSISSIPPI D
UR
ING
THE 2004-05
HU
NTIN
G SEA
SON
.
DISTR
ICT
STA
TISTIC
TO
TAL
HA
RV
EST
A
VER
AG
E D
AILY
K
ILL
A
VER
AG
E SEA
SON
AL
HA
RV
EST
PER
CEN
T SU
CC
ESSFUL
HU
NTER
S
TO
TAL
MA
ND
AY
S
AV
ERA
GE
SEASO
NA
L D
AY
S H
UN
TING
TO
TAL
HU
NTER
S
PERC
ENT
HU
NTER
S PER
D
ISTRIC
T 1
ESTIMA
TE
(SE)
N
4,299
1,270.96
883
0.06
0.02
25
0.75
0.18
28
50.0
9.62
28
51,942
12,805.83
877
10.08
1.52
25
5,733
1,066.55
155
18.1
3.10
155
2 ESTIM
ATE
(SE)
N
4,094
1,320.29
883
0.09
0.02
21
0.91
0.23
22
54.6
10.87
22
43,697
13,148.60
877
10.10
2.17
21
4,504
948.71
155
14.2
2.81
155
3 ESTIM
ATE
(SE)
N
2,252
889.62
883
0.08
0.03
18
0.61
0.20
18
38.9
11.82
18
27,208
9,616.24
877
7.33
2.00
18
3,685
860.13
155
11.6
2.58
155
4 ESTIM
ATE
(SE)
N
8,189
1,834.23
883
0.07
0.01
46
0.83
0.15
48
50.0
7.29
48
108,418
20,512.38
877
11.44
1.42
46
9,827
1,380.01
155
31.0
3.73
155
5 ESTIM
ATE
(SE)
N
4,299
1,303.56
883
0.08
0.01
26
0.81
0.19
26
50.0
10.00
26
56,064
14,646.52
877
10.46
1.87
26
5,323
1,028.96
155
16.8
3.01
155
6 ESTIM
ATE
(SE)
N
1,843
790.88
883
0.10
0.03
13
0.69
0.24
13
46.2
14.39
13
19,169
7,306.48
877
7.15
1.96
13
2,662
733.08
155
8.4
2.23
155
STATEW
IDE
ESTIMA
TE
(SE)
N
28,818
3,289.81
897
0.07
0.01
154
0.85
0.08
169
50.9
3.86
169
313,572
32,177.56
882
9.94
0.72
154
34,058
2,361.44
897
18.8
1.31
897

TAB
LE 25. EXPA
ND
ED STA
TEWID
E AN
D D
ISTRIC
T SUM
MA
RIES O
F FALL TU
RK
EY H
UN
TING
IN M
ISSISSIPPI DU
RIN
G TH
E 2004-05 H
UN
TING
SEASO
N.
DISTR
ICT
(A)
STA
TISTIC
TOTA
L H
AR
VEST
A
VER
AG
E D
AILY
K
ILL
A
VER
AG
E SEA
SON
AL
HA
RV
EST
PEC
ENT
SUC
CESSFU
L H
UN
TERS
TOTA
L M
AN
DA
YS
AV
ERA
GE
SEASO
NA
L D
AY
S H
UN
TING
TOTA
L H
UN
TERS
PERC
ENT
HU
NTER
S PER
D
ISTRIC
T 3
ESTIMA
TE
(SE)
N
406
286.75
891
0.05
0.08 4
0.40
0.25 5
40.0
24.50 5
3,863
3,089.45
889
4.75
3.43 4
1,015
452.63
12
41.7
14.87
12
5 ESTIM
ATE
(SE)
N
203
202.88
891
0.06
0.03 4
0.25
0.25 4
25.0
25.00 4
3,457
2,216.34
889
4.25
1.97 4
812
405.07
12
33.3
14.21
12
STATEW
IDE
ESTIMA
TE
(SE)
N
3,224
1,061.50
897
0.08
0.05
10
0.89
0.21
18
61.1
11.82
18
8,133
3,850.52
889
4.00
1.49
10
3,628
846.83
897
2.0
0.47
897
(A) FA
LL TUR
KEY
HU
NTIN
G W
AS LEG
AL IN
DISTR
ICTS 2, 3, A
ND
5. (B
) CA
LCU
LATED
AS A
PERC
ENT O
F BIG
GA
ME LIC
ENSE H
OLD
ERS O
NLY
.

TAB
LE 26. EXPA
ND
ED STA
TEWID
E SUM
MA
RIES O
F ALL D
EER, B
UC
K, D
OE, A
ND
TUR
KEY
(FALL ’04 A
ND
SPRIN
G ’05) H
UN
TING
IN M
ISSISSIPPI D
UR
ING
THE 2004-05 H
UN
TING
SEASO
N
SPECIES
STA
TISTIC
TO
TAL
HA
RV
EST
A
VER
AG
E D
AILY
K
ILL
A
VER
AG
E SEA
SON
AL
HA
RV
EST
PER
CEN
T SU
CC
ESSFUL
HU
NTER
S
TO
TAL
MA
ND
AY
S
AV
ERA
GE
SEASO
NA
L D
AY
S H
UN
TING
TO
TAL
HU
NTER
S
PERC
ENT
OF TO
TAL
LICEN
SEES (A
) D
EER
ESTIMA
TE
(SE)
N
255,731
11,494.43
897
0.07
<0.01
515
1.97
0.08
644
72.1
1.77
644
2,759,020
150,372.17
768
22.76
1.10
515
129,780
2,717.51
897
71.8
1.50
897
BU
CK
ESTIM
ATE
(SE)
N
125,750
6,350.40
897
0.04
<0.01
515
0.97
0.04
644
54.2
1.97
644
DO
E ESTIM
ATE
(SE)
N
129,982
7,284.56
897
0.04
<0.01
515
1.00
0.05
644
50.6
1.97
644
TUR
KEY
ESTIM
ATE
(SE)
N
32,042
3,508.76
897
0.07
0.01
158
0.89
0.08
179
51.4
3.75
179
323,974
32,752.90
876
9.94
0.71
158
36,073
2,413.55
897
20.0
1.34
897
(A) C
ALC
ULA
TED A
S A PER
CEN
T OF B
IG G
AM
E LICEN
SE HO
LDER
S ON
LY.

TAB
LE 27. EXPA
ND
ED STA
TEWID
E AN
D D
ISTRIC
T SUM
MA
RIES O
F HO
G H
UN
TING
IN M
ISSISSIPPI DU
RIN
G TH
E 2004-05 HU
NTIN
G SEA
SON
.
DISTR
ICT
STA
TISTIC
TO
TAL
HA
RV
EST
AV
ERA
GE
DA
ILY
KILL
AV
ERA
GE
SEASO
NA
L H
AR
VEST
PERC
ENT
SUC
CESSFU
L H
UN
TERS
TO
TAL
MA
ND
AY
S
AV
ERA
GE
SEASO
NA
L D
AY
S H
UN
TING
TO
TAL
HU
NTER
S
PERC
ENT
HU
NTER
S PER
D
ISTRIC
T 1
ESTIMA
TE
(SE)
N
0
0.00
937
0.00
0.00 5
0.00
0.00 5
0.0
0.00 5
7,134
4,142.84
936
7.20
2.99 5
990
441.68
35
14.3
6.00
35
2 ESTIM
ATE
(SE)
N
198
197.95
937
0.06
0.04 3
0.33
0.33 3
33.3
33.33 3
3,369
2,249.17
936
5.67
2.33 3
594
342.49
35
8.6
4.80
35
3 ESTIM
ATE
(SE)
N
792
484.44
937
0.40
0.18 3
1.33
0.33 3
100.0
0.00 3
1,982
1,609.42
936
3.33
2.33 3
594
342.49
35
8.6
4.80
35
4 ESTIM
ATE
(SE)
N
2,375
1,506.34
937
0.08
0.09 7
1.71
0.94 7
57.1
20.20 7
28,337
23,873.71
936
20.43
16.62 7
1,386
522.04
35
20.0
6.86
35
5 ESTIM
ATE
(SE)
N
3,761
2,157.02
937
0.09
0.07 8
2.11
1.05 9
66.7
16.67 9
36,660
23,316.67
936
23.13
13..09 8
1,782
591.30
35
25.7
7.50
35
6 ESTIM
ATE
(SE)
N
2,177
1,440.10
937
0.08
0.06 8
1.38
0.82 8
37.5
18.30 8
26,355
13,238.04
936
16.63
6.36 8
1,584
557.79
35
22.9
7.20
35
STATEW
IDE
ESTIMA
TE
(SE)
N
11,420
3,166.96
942
0.09
0.04
34
1.45
0.34
40
55.0
7.97
40
103,836
36,128.35
936
15.41
4.76
34
7,876
1,219.21
942
4.2
0.66
942

33
Summary of Responses to Opinion Questions for 2004-2005 Table 28. Percent of respondents who hunted in Mississippi during the 2004-2005 hunting season (Q1)
Response Frequency Percent
YES 1145 97.4
NO 31 2.6
TOTAL 1176 100.0
n missing = 19 Table 29. Percent of respondents by how many total days they hunted (Q2). Missing values were treated as zeroes.
Response Frequency Percent
0
1-5 295 18.0
6-10 189 11.5*
11-15 157 9.6
16-20 194 11.8
21-25 125 7.6
26-30 195 11.9
31-35 64 3.9
>35 421 25.7
TOTAL 1228 100.0
Mean days hunting elsewhere = 28.4 days

34
Table 30. Percent of respondents by how many days they hunted in Mississippi (Q2a). Missing values were treated as zeroes.
Response Frequency Percent
0
1-5 211 18.8
6-10 134 11.9
11-15 110 9.8
16-20 138 12.3
21-25 91 8.1
26-30 151 13.4
31-35 20 1.8
>35 269 23.9
TOTAL 1228 100.0
Mean days hunting in Mississippi = 27.1 days Table 31. Percent of respondents by how many days they hunted elsewhere (Q2b). Missing values were treated as zeroes.
Response Frequency Percent
0
1-5 481 93.3
6-10 21 4.0
11-15 4 0.8
16-20 2 0.4
21-25 1 0.3
26-30 3 0.5
31-35 1 0.1
>35 3 0.6
TOTAL 1228 100.0
Mean days hunting elsewhere = 1.3 days
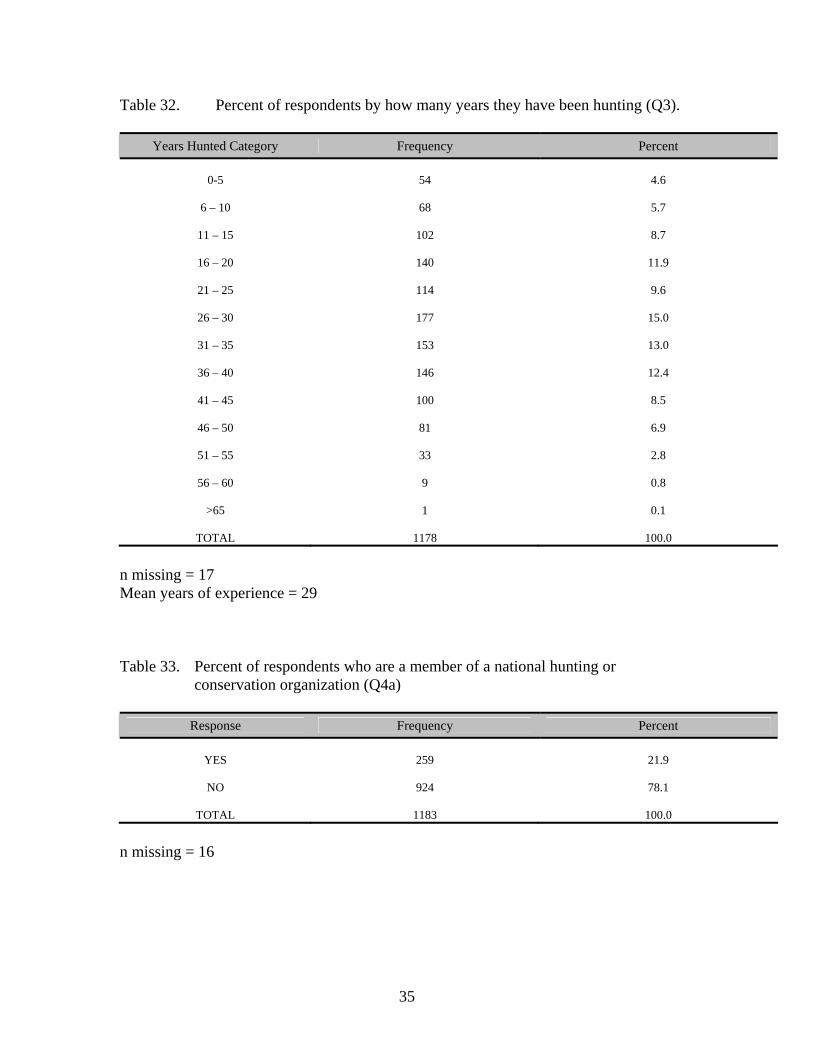
35
Table 32. Percent of respondents by how many years they have been hunting (Q3).
Years Hunted Category Frequency Percent
0-5 54 4.6
6 – 10 68 5.7
11 – 15 102 8.7
16 – 20 140 11.9
21 – 25 114 9.6
26 – 30 177 15.0
31 – 35 153 13.0
36 – 40 146 12.4
41 – 45 100 8.5
46 – 50 81 6.9
51 – 55 33 2.8
56 – 60 9 0.8
>65 1 0.1
TOTAL 1178 100.0 n missing = 17 Mean years of experience = 29 Table 33. Percent of respondents who are a member of a national hunting or conservation organization (Q4a)
Response Frequency Percent
YES 259 21.9
NO 924 78.1
TOTAL 1183 100.0 n missing = 16

36
33a. If yes, [See Table 33] number of organizations they belong to (Q4b)
Number of Organizations Frequency Percent
1 144 60.7
2 73 30.9
3 15 6.3
4 2 1.0
5 1 0.5
6 2 0.6
7 0 0.0
8 0 0.0
9 0 0.0
TOTAL 237 100.0
n missing = 11 Mean number of hunting or conservation organizations = 2 Table 34. Percent of respondents who subscribe to any hunting magazines (Q5)
Response Frequency Percent
YES 438 36.9
NO 748 63.1
TOTAL 1186 100.0 n missing = 42

37
34a. If yes, [See Table 34] number of magazines they subscribe to (Q5a)
Number of Magazines Frequency Percent
1 154 39.1
2 129 32.7
3 67 17.0
4 27 6.9
5 9 2.3
6 5 1.3
7 1 0.25
8 1 0.25
9 1 0.25
TOTAL 394 100.0 n missing = 44 Mean number of hunting magazines subscribed to = 2.1

38
Table 35. Percent of respondents by the age they had their first hunting experience (Q6)
Age Category Frequency Percent
1 – 5 124 10.5
6 – 10 547 46.3
11 – 15 354 30.0
16 – 20 98 8.3
21 – 25 15 1.3
26 – 30 17 1.4
31 – 35 13 1.1
36 – 40 5 0.4
41 – 45 4 0.3
>46 4 0.4
TOTAL 1181 100.0
n missing = 16 Mean age of first experience = 11

39
Table 36. Percent of respondents by who introduced them hunting (Q7a)
Introduced them to hunting Frequency Percent
Grandfather 126 10.5
Grandmother 0 0.0
Father 742 61.9
Mother 6 0.5
Brother 40 3.3
Sister 0 0.0
Son 1 0.1
Daughter 0 0.0
Uncle 76 6.3
Aunt 6 0.5
Cousin 19 1.6
Friend 105 8.8
Business Associate 3 0.2
Client 0 0.0
Youth Hunting Event Instructor 0 0.0
Introduced Myself 25 2.1
Other 50 4.2
TOTAL 1199 100.0
n missing = 9

40
Table 36a. Percent of respondents by who introduced them to hunting (fill in) (Q7b)
Introduced them to hunting Frequency Percent
Spouse 9 16.7
Husband 16 32.0
Wife 0 0.0
Father-in-law 4 7.7
Son-in-law 0 0.0
Nephew 0 0.0
Brother-in-law 7 14.7
Great Grandfather 1 2.3
Boyfriend 2 4.9
Stepfather 6 12.1
Grandson 1 2.3
Granddaughter 0 0.0
Fiancé 2 2.5
Landowner 2 2.5
Girlfriend 0 0.0
In-laws 0 0.0
Pastor 0 0.0
Ex-husband 1 2.3
Club 0 0.0
Grandchildren 0 0.0
TOTAL 51 100.0
n missing = 9
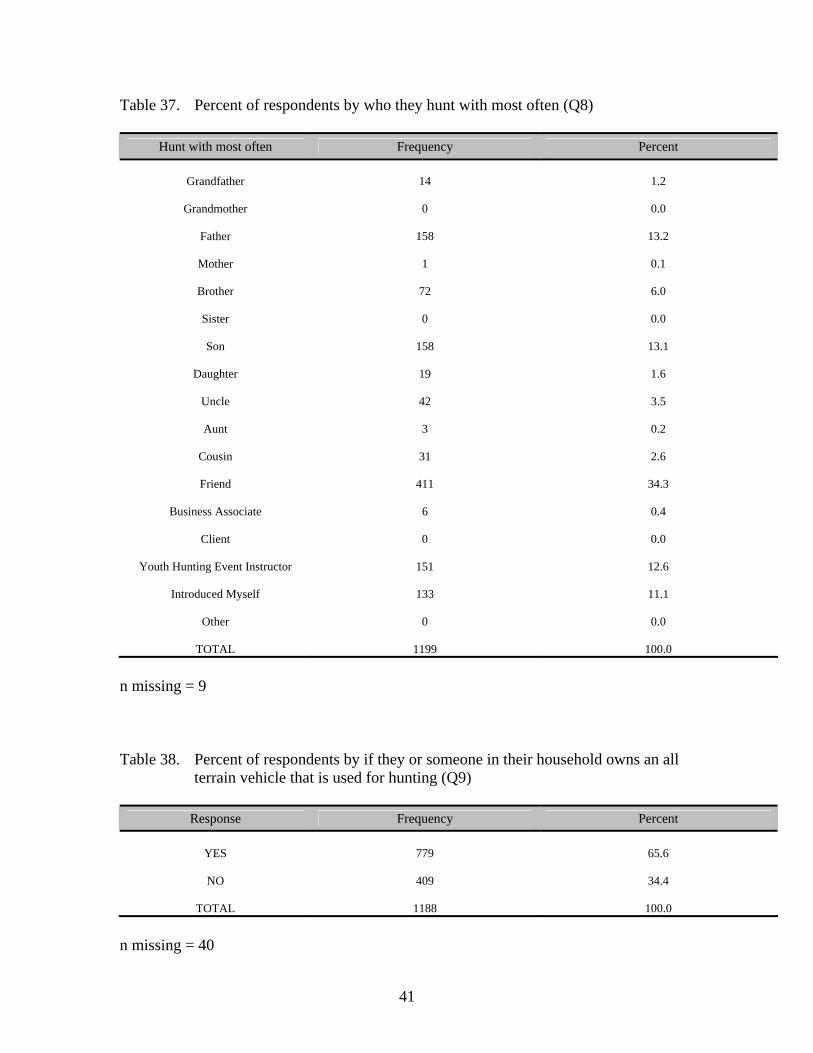
Table 42. Percent of respondents by if they want to legalize white-tailed deer hunting over bait for future hunting seasons in Mississippi (Q11)
Response Frequency Percent
YES 648 54.9
NO 532 45.1
TOTAL 1180 100.0 n missing = 48 SMALL GAME, ALL GAME, AND SPORTSMAN LICENSE WILLINGNESS TO PAY FIGURES LOCATED IN APPENDIX C
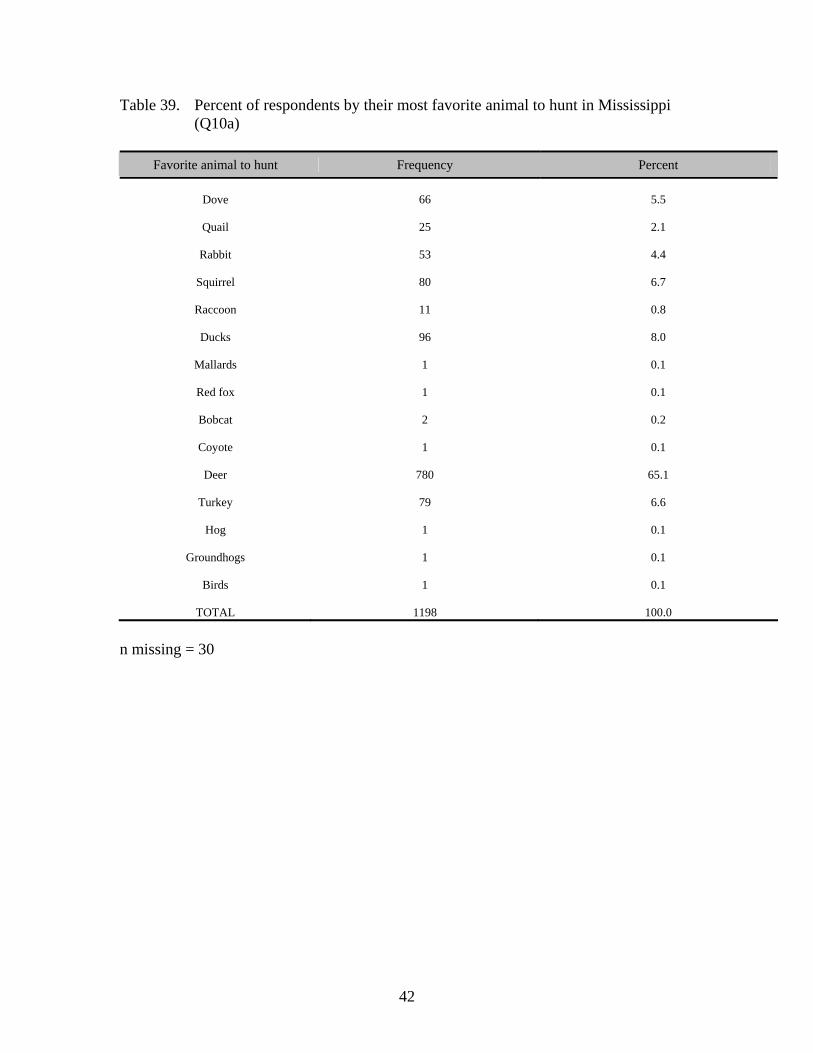
46
Table 43. Percent of respondents by the extent they agree or disagree with statements about various attitudes toward wildlife; ranked by mean score (Q16)
It is important to me personally… n Strongly Disagree
Disagree Neutral Agree
Strongly Agree Meana
To hunt game animals for recreation 1189 5.9 5.2 8.6 33.4 46.9 4 To know that wildlife exist in nature 1177 0.6 1.3 3.8 28.1 66.2 5 That wildlife are included in educational materials as the subject for learning more about nature 1190 0.4 1.0 5.4 41.6 51.3 4 To trap furbearing animals for sale of fur or pelts 1183 16.3 15.3 42.4 17.6 8.4 3 That I consider the presence of wildlife as a sign of the quality of the natural environment 1189 0.7 0.6 3.5 37.6 57.6 5 That game animals are managed for an annual harvest for human use without harming the future of the wildlife population 1195 0.9 1.3 4.2 29.4 64.2 5 That I tolerate most levels of property damage by wildlife 1197 2.9 11.1 20.9 46.7 18.4 4 That local economies benefit from the sale of equipment, supplies, or services related to wildlife recreation 1183 1.2 3.3 14.1 43.5 37.9 4 To talk about wildlife with family and friends 1191 0.3 0.4 6.2 45.1 48.0 4 To hunt game animals for food 1196 1.1 2.5 8.7 34.0 53.7 4 That I tolerate the ordinary risk of wildlife transmitting diseases to humans or domestic animals 1183 8.2 13.1 26.7 39.6 12.4 3 To observe or photograph wildlife 1188 1.5 2.1 19.5 44.4 32.5 4 To express opinions about wildlife and their management to public officials or to officials of private conservation organizations 1189 0.3 2.5 21.8 43.0 32.4 4 That I appreciate the role that wildlife plays in the natural environment 1188 0.5 0.3 4.2 38.2 56.8 5 That I understand more about the behavior of wildlife 1191 0.5 0.3 9.4 46.7 43.1 4 To see wildlife in books, movies, paintings, or photographs 1190 0.5 1.1 13.5 43.6 41.3 4 That I tolerate most wildlife nuisance problems 1196 2.8 11.1 21.5 46.2 18.4 4

47
n missing = respondents-n Mean a based on scale where 1 = strongly disagree, 2 = disagree, 3 = neutral, 4 = agree, 5 = strongly agree. Table 44. Percent of respondents by the importance of statements about motivations for hunting; ranked by mean score (Q17)
Statement n
Not at all Important
Slightly Important
Moderately Important
Very Important
Extremely Important Meana
To gain a sense of self-confidence 1190 16.2 13.2 26.7 27.8 16.1 3 To be with individuals that have values similar to mine 1188 3.0 4.4 14.9 45.2 32.5 4 To compare my hunting equipment with other hunters 1184 49.4 17.2 18.5 10.0 4.9 2 To be with people that enjoy hunting as much as I do 1176 2.2 3.9 12.6 34.4 46.8 4 To test the extent to which I can hunt 1188 13.4 13.0 27.6 26.2 19.8 3 To become better at hunting 1186 3.3 5.1 18.0 36.0 37.6 4 To get my family together for a while 1185 5.5 7.2 14.6 34.0 38.7 4 To be close to nature 1190 1.2 2.4 12.4 34.9 49.1 4 To develop my hunting skills and abilities 1193 2.0 6.4 20.7 34.7 36.2 4 To bring my family closer together 1183 5.7 7.1 14.4 32.2 40.6 4 To be challenged 1192 7.0 8.6 19.7 33.6 31.1 4 To bag an animal 1185 20.1 19.6 26.8 18.5 15.0 3 To obtain a feeling of harmony with nature 1191 5.2 7.9 21.1 36.0 29.8 4 To test my hunting equipment 1185 21.7 21.2 26.0 17.3 13.8 3 To do something with my family 1192 5.8 7.9 16.0 34.8 35.5 4 To be with my friends 1193 3.7 7.0 16.4 37.0 35.9 4 To seek peace in the outdoors 1191 2.8 3.9 14.5 32.0 46.8 4 To discuss my hunting equipment with other hunters 1186 30.4 23.1 21.3 15.0 10.2 3 To become more acquainted with wildlife 1191 3.3 6.4 20.7 40.2 29.4 4

53
Table 50. Percent of respondents by their approximate annual household income category before taxes (Q34)
Income Category Frequency Percent
Under 10,000 44 3.9
10,000-19,000 54 4.8
20,000-29,000 100 8.9
30,000-39,000 145 12.9
40,000-49,000 140 12.4
50,000-59,000 126 11.2
60,000-69,000 109 9.6
70,000-79,000 100 8.9
80,000-89,000 77 6.8
90,000-99,000 57 5.1
100,000 and above 175 15.5
TOTAL 1127 100.0
n missing = 38 Table 51. Percent of respondents by their highest completed level of education (Q35)
Education Category Frequency Percent
Elementary 20 1.7
High School 474 39.8
College 595 49.9
Graduate School 103 8.6
TOTAL 1192 100.0
n missing = 16

54
Table 52. Percent of respondents by their Spanish/Hispanic origin (Q36)
Response Frequency Percent
No, not Spanish/Hispanic 1063 98.1
Yes, Mexican, American, Chicano 6 0.5
Yes, other Spanish/Hispanic group 15 1.4
TOTAL 1084 100.0 n missing = 56 Table 52a. Respondents’ specifications [See Table 54] of their Other Spanish/Hispanic origin (Q36)
Response Frequency Percent
Hispanic 1 33.0
Puerto Rican 1 33.5
½ Hispanic/ ½ Anglo 2 33.5
TOTAL 4 100.0 n missing = 5 Table 53. Percent of respondents by their race (Q37)
Race Category Frequency Percent
WHITE OR ANGLO 1137 93.8
BLACK OR AFRICAN AMERICAN 56 4.6
NATIVE AMERICAN OR ALASKAN NATIVE 10 0.8
ASIAN OR PACIFIC ISLANDER 0 0.0
OTHER 10 0.8
TOTAL 1213 100.0
n missing = 5

55
Table 53a. If other race [See Table 55] respondents’ specification of their race (Q37)
Response Frequency Percent
Hispanic 1 16.1
White/Apache Indian 1 16.1
Italian 0 1.0
¼ Native American, ¾ White 1 17.3
White/Native American 2 17.3
White/Black 1 16.1
White/Asian or Pacific Islander 1 16.1
TOTAL 7 100.0 n missing = 502

56
Appendix A
Questionnaire: 2005 Survey of Mississippi Resident Hunters

2005 Survey of Mississippi Resident Hunters
Conducted for the Mississippi Department of Wildlife, Fisheries & Parks
by the Human Dimensions & Conservation Law Enforcement Laboratory
Forest & Wildlife Research Center Mississippi State University

2005 SURVEY OF MISSISSIPPI HUNTERS …………………………………………… PAGE 1
In the following questions, please tell us about your hunting activity and experience. The information you provide will remain strictly confidential and you will not be identified with your answers. Questions #1-10 deal with general questions about your hunting experience and preferences. 1. Did you hunt in Mississippi during the 2004-2005 hunting season (September 1, 2004-May 1, 2005)?
1 YES 2 NO – (If NO, you are welcome to fill out the remainder of the questionnaire. But, if you don’t
consider yourself a hunter please go to Question #30 on Page 10 or write “DID NOT HUNT” on the front cover and return to MSU in the postage-paid business reply envelope)
2. How many days did you hunt in the 2004-2005 hunting season?
___________________ DAYS HUNTED IN MISSISSIPPI ___________________ DAYS HUNTED ELSEWHERE
3. How many years have you been hunting?
___________________ YEARS
4. Are you a member of a national hunting or conservation organization? 1 YES --- (If YES, how many organizations? _____ ) 2 NO 5. Do you subscribe to any hunting magazines? 1 YES --- (If YES, how many? _____ ); Which is your favorite?_______________________
2 NO
6. At what age did you have your first hunting experience? ___________________ AGE OF FIRST HUNTING EXPERIENCE 7. To the best of your recollection, what individual introduced you to hunting? (Please circle only one) 1 GRANDFATHER 9 UNCLE 2 GRANDMOTHER 10 AUNT 3 FATHER 11 COUSIN 4 MOTHER 12 FRIEND 5 BROTHER 13 BUSINESS ASSOCIATE 6 SISTER 14 CLIENT 7 SON 15 YOUTH HUNTING EVENT INSTRUCTOR 8 DAUGHTER 16 INTRODUCED MYSELF 17 OTHER (please specify): ________________________

2005 SURVEY OF MISSISSIPPI HUNTERS …………………………………………… PAGE 2
8. Who do you hunt with most often now? (Please circle one to three choices below) 1 GRANDFATHER(S) 9 UNCLE(S) 2 GRANDMOTHER(S) 10 AUNT(S) 3 FATHER 11 COUSIN(S) 4 MOTHER 12 FRIEND(S) 5 BROTHER(S) 13 BUSINESS ASSOCIATE(S) 6 SISTER(S) 14 CLIENT(S) 7 SON(S) 15 MYSELF 8 DAUGHTER(S) 16 OTHER (please specify): ________________________
9. Do you or someone in your household own an all terrain vehicle (ATV) that is used for hunting? 1 YES 2 NO 10. Which animal do you most prefer to hunt in Mississippi? ____________________________ FIRST CHOICE ____________________________ SECOND CHOICE ____________________________ THIRD CHOICE Question #11 deals with the idea of legalizing white-tailed deer hunting over bait. 11. Legalizing white-tailed deer hunting over bait has been proposed in bills to the Mississippi Legislature for the past several years. Although all efforts thus far have been unsuccessful, this year the Legislature asked the Mississippi Commission on Wildlife, Fisheries, and Parks to poll hunters to determine their opinion on white-tailed deer hunting over bait. If you had to enter a polling booth today and vote on legalizing white-tailed deer hunting over bait, how would you respond to the following question: Do you want to legalize white-tailed deer hunting over bait for future hunting seasons in Mississippi? (Please circle only one) 1 YES 2 NO

2005 SURVEY OF MISSISSIPPI HUNTERS ………………………………………… PAGE 3
12. Please fill in the blocks below for each game, furbearer, or predatory species you hunted during the 2004-2005 hunting season (even if you were unsuccessful). If you hunted more than one species on a particular day, count a day for each species you hunted. Report only game, furbearer, or predatory species taken by you in Mississippi.
Species Sought
Total harvested in Mississippi in 2004-05 season
Days hunted species in
Mississippi in 2004-05 season
District Hunted Most
Dove
Quail
Woodcock
Rabbit
Squirrel
Raccoon
Bucks Does Deer (Archery)
Deer (Primitive Weapon)
Deer (Gun)
Turkey (Fall 2004)
Turkey (Spring 2005)
Mallard Wood Other Ducks
Geese
Red fox
Gray fox
Bobcat
Coyote
Feral Hog
DETERMINE DISTRICT (1-6) HUNTED MOST FROM THE MAP BELOW

2005 SURVEY OF MISSISSIPPI HUNTERS ………………………………………… PAGE 4
Questions #13-15 deal with the cost of hunting licenses and your willingness to pay for possible increases in the cost of a license. Nationwide, and in Mississippi, participation in hunting has been declining over the past few decades. Because wildlife management programs, and hunting programs & services provided by MDWFP’s Wildlife Division are funded by license sales and taxes on hunting equipment, declining license sales means loss of revenue for providing these programs and services. Unfortunately, one of the few ways to maintain the current level of wildlife management programs, and hunting programs & services would be to increase hunting license fees. The purpose of the following questions is to determine if, and/or how much YOU would be willing to pay above the cost of your current license to continue to hunt in Mississippi. Even if the values in Question #14 may seem high or low to you, please answer as carefully as possible. The information in Questions #14 and #15 will help determine how many hunters would quit hunting in Mississippi rather than pay the increase, and help the Mississippi Legislature decide on whether an increase is warranted, and, if so, what is an appropriate cost increase. 13. What type of resident hunting license did you purchase for the 2004-05 license year which began July 1, 2004 and runs through June 30, 2005? 1 SMALL GAME HUNTING ($13.00) 2 ALL GAME HUNTING/FRESHWATER FISHING ($17.00) 3 SPORTSMAN LICENSE ($32.00) 14. If the cost of the license you purchased this year (See Question #13) was $__________________ MORE next year, would you still purchase that same license at the higher cost to continue hunting in Mississippi? 1 YES 2 NO 15. How much more money, if any, would you be willing-to-pay above the cost of your current license (See Question #13) to continue hunting in Mississippi? $___________________ MORE

2005 SURVEY OF MISSISSIPPI HUNTERS …………………………………………… PAGE 5
16. Assessment of attitudes toward wildlife recreation are important because they are indicators of feelings, beliefs,
and values possessed by individuals. Please indicate to what extent you agree or disagree with the following attitude statements regarding wildlife.
Please start each statement with “It is important to me personally” a) To hunt game animals for recreation ...........................................................1 2 3 4 5 b) To know that wildlife exist in nature ............................................................1 2 3 4 5 c) That wildlife are included in educational materials as the subject
for learning more about nature......................................................................1 2 3 4 5 d) To trap furbearing animals for sale of fur or pelts ........................................1 2 3 4 5 e) That I consider the presence of wildlife as a sign of the quality of the natural environment ......................................................................................1 2 3 4 5 f) That game animals are managed for an annual harvest for human use without harming the future of the wildlife population ..................................1 2 3 4 5 g) That I tolerate most levels of property damage by wildlife...........................1 2 3 4 5 h) That local economies benefit from the sale of equipment, supplies,
or services related to wildlife recreation .......................................................1 2 3 4 5 i) To talk about wildlife with family and friends..............................................1 2 3 4 5 j) To hunt game animals for food....................................................................1 2 3 4 5 k) That I tolerate the ordinary risk of wildlife transmitting diseases to humans or domestic animals.....................................................................1 2 3 4 5 l) To observe or photograph wildlife................................................................1 2 3 4 5 m) To express opinions about wildlife and their management to public officials or to officials of private conservation organizations ............1 2 3 4 5 n) That I appreciate the role that wildlife plays in the natural environment ......1 2 3 4 5 o) That I understand more about the behavior of wildlife .................................1 2 3 4 5 p) To see wildlife in books, movies, paintings, or photographs ........................1 2 3 4 5 q) That I tolerate most wildlife nuisance problems ...........................................1 2 3 4 5
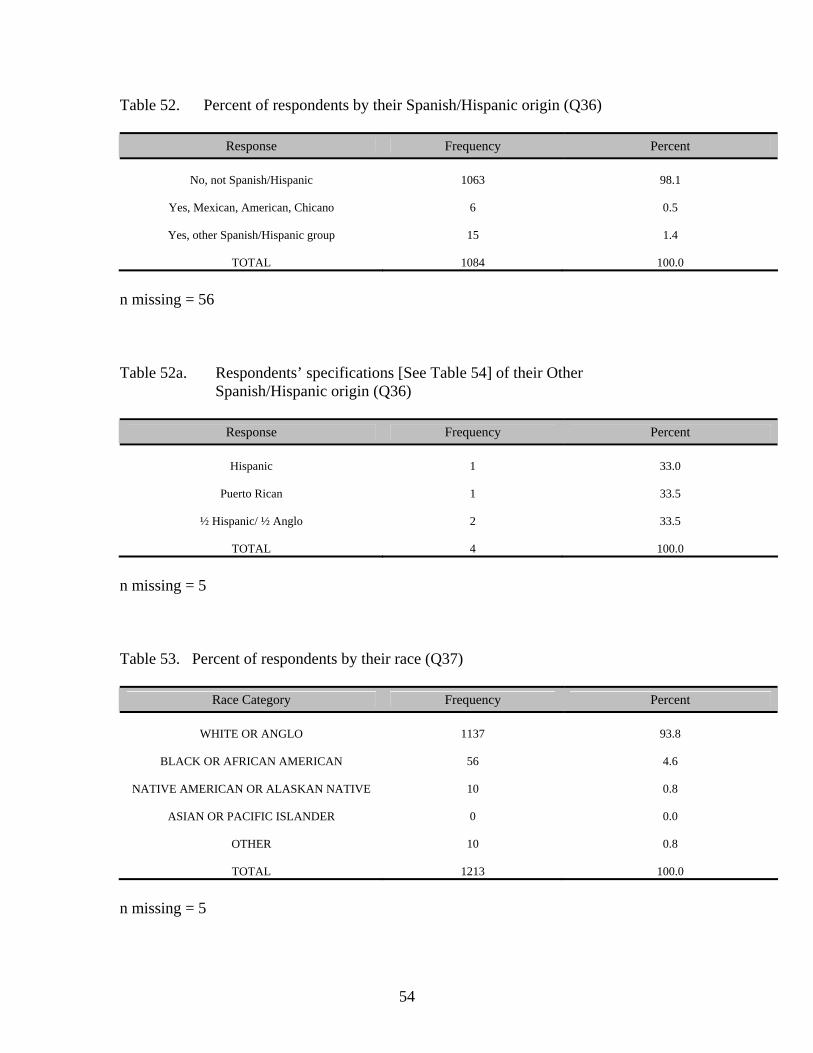
2005 SURVEY OF MISSISSIPPI HUNTERS ………………………………………… PAGE 6
17. Knowing the worth of hunting is helpful for MDWFP in justifying its budgetary needs to the Mississippi
Legislature. Identifying the types of motivations that can be achieved through hunting can also help MDWFP improve service delivery and provide more benefits. Please indicate how important each of the following items are as a reason for hunting in Mississippi.
a) To gain a sense of self-confidence................................................1 2 3 4 5 b) To be with individuals that have values similar to mine ...............1 2 3 4 5 c) To compare my hunting equipment with other hunters ................1 2 3 4 5 d) To be with people that enjoy hunting as much as I do ..................1 2 3 4 5 e) To test the extent to which I can hunt ...........................................1 2 3 4 5 f) To become better at hunting .........................................................1 2 3 4 5 g) To get my family together for a while ..........................................1 2 3 4 5 h) To be close to nature.....................................................................1 2 3 4 5 i) To develop my hunting skills and abilities ...................................1 2 3 4 5 j) To bring my family closer together...............................................1 2 3 4 5 k) To be challenged...........................................................................1 2 3 4 5 l) To bag an animal ..........................................................................1 2 3 4 5 m) To obtain a feeling of harmony with nature..................................1 2 3 4 5 n) To test my hunting equipment ......................................................1 2 3 4 5 o) To do something with my family..................................................1 2 3 4 5 p) To be with my friends...................................................................1 2 3 4 5 q) To seek peace in the outdoors.......................................................1 2 3 4 5 r) To discuss my hunting equipment with other hunters...................1 2 3 4 5 s) To become more aquainted with wildlife......................................1 2 3 4 5 t) To become more aquainted with the natural environment ............1 2 3 4 5 u) To hunt with my companions .......................................................1 2 3 4 5 v) To develop a sense of self pride ...................................................1 2 3 4 5 w) To enjoy the smells and sounds of nature .....................................1 2 3 4 5 x) To bag a specific animal, such as a trophy....................................1 2 3 4 5 y) To be with members of my hunting club/organization .................1 2 3 4 5

2005 SURVEY OF MISSISSIPPI HUNTERS ………………………………………… PAGE 7
Questions #18-26 deal with dove hunting in Mississippi. If you do not dove hunt or don’t have an interest in dove hunting, please go to Question #27 on Page 9. 18. Currently, the dove hunting season in Mississippi is open for 60 days. Hunters are allowed to harvest 15 or fewer doves per day. Some hunters tell us that they would like the opportunity to hunt for doves on more days, and are willing to reduce the daily bag limit to do so. If you had your choice which of the following day and bag limit combination would you prefer? 1 I PREFER THE CURRENT 60 DAY/15 BIRD BAG LIMIT 2 I PREFER A 70 DAY/12 BIRD BAG LIMIT 19. Currently, the dove hunting season is broken up into 3 seasons, each having up to 20 days of hunting depending on the year. Some hunters tell us they would like to hunt more days in one season rather than the other two. If you had the opportunity to set the number of days for each of the three seasons, how many days would you assign to each in YOUR ideal dove hunting season under the current 60 day season framework? 2004-05 DOVE SEASON YOUR IDEAL DOVE SEASON SEASON 1: 16 DAYS SEASON 1: __________ DAYS SEASON 2: 15 DAYS SEASON 2: __________ DAYS SEASON 3: 29 DAYS SEASON 3: __________ DAYS TOTAL: 60 DAYS TOTAL: 60 DAYS During the 2004-05 hunting season, MDWFP began providing fee-hunting opportunities on a few “MDWFP Sponsored Dove Fields.” These fields are specially managed dove habitat tracts on private lands, and are certified as bait-free by MDWFP. Hunters request a particular program field, and stand in that field to hunt. Fields and stands are awarded on a first come, first serve basis. Currently, the permit ($50) allows the holder to hunt under the following regulations: * The permit allows hunters to hunt the assigned field/stand on Mondays, Wednesdays, and Saturdays after 12:00 p.m. during the first and second dove seasons. * The permit allows for no more than two shooters per stand, of which only one may be an adult. Two youths may be able to hunt from a stand but only under the direct supervision of a non-hunting licensed adult, 21 years old or older. One limit of doves is allowed per hunter per day. The price of one permit covers the youth hunter(s). Although only a limited number of fields were managed this year, the MDWFP Wildlife Division and participating hunters felt the program was successful at producing a quality dove hunting opportunity, and they would like to expand the program statewide. The purpose of Questions #20-22 is to determine if YOU have an interest in participating in this fee-based dove hunting opportunity, and how much you would be willing-to-pay for the opportunity. Money collected from the fees goes directly back into the dove hunting program.

2005 SURVEY OF MISSISSIPPI HUNTERS ………………………………………… PAGE 8
20. Would you be interested in paying a fee for a permit to hunt next year on a MDWFP Sponsored Dove Field under the conditions described on Page #7? 1 YES 2 NO --- (Please go to Question # 23) 21. If the cost of the fee was $__________________, would you still be willing to pay this amount to hunt on a MDWFP Sponsored Dove Field? 1 YES 2 NO 22. How much money would you be willing-to-pay to hunt on an MDWFP Sponsored Dove Field under the regulations described on Page #7? $ ___________________ WILLING TO PAY The MDWFP Wildlife Division is also discussing alternatives to the current regulations on MDWFP Sponsored Dove Fields that may attract a greater number of hunters. Specifically, they are discussing starting the “MDWFP Dove Club." Club membership would consist of a permit to allow you to hunt an MDWFP Sponsored Dove Field and stand you requested on the first two days of the first season. After the first two days, you could hunt on any other MDWFP Sponsored Dove Field in the state every Monday, Wednesday, and Saturday of the first and second dove season. Other regulations would be the same as those listed on Page 7. 23. Would you be interested in paying a fee for a permit to hunt next year on a MDWFP Sponsored Dove Field under the conditions described above? 1 YES 2 NO --- (Please go to Question #27 on Page 9) 24. If the cost of the fee was $__________________ would you be willing-to pay this amount to hunt on a MDWFP Sponsored Dove Field under the above regulations? 1 YES 2 NO 25. How much money would you be willing-to-pay to hunt on an MDWFP Sponsored Dove Field under the above regulations? $ ___________________ WILLING TO PAY 26. If you answered YES to both Questions #20 and #23, which of the two would you prefer for next year’s dove hunting season? (Please circle only one) 1 BEING ABLE TO HUNT ONLY ONE FIELD PER PERMIT PER YEAR DURING SEASON ONE AND TWO. 2 BEING ABLE TO HUNT ONLY ONE FIELD PER PERMIT ON THE OPENING TWO DAYS, BUT ANY OTHER PROGRAM FIELD THE REMAINDER OF SEASON ONE AND TWO.

2005 SURVEY OF MISSISSIPPI HUNTERS ………………………………………… PAGE 9
Questions #27-29 deal with squirrel hunting in Mississippi. If you do not squirrel hunt or don’t have an interest in squirrel hunting, please go to Question #29 below. 27. Currently, there are three zones used for squirrel hunting in Mississippi. The Zone 1 (North) season starts October 1st, Zone 2 (Central) starts in mid October and Zone 3 (South) starts at the end of October. However, they all close at on the same date, meaning hunters in Zones 2 and 3 have fewer days to hunt. These Zones were set up by the Mississippi Legislature because of concerns over the presence of bot flies in squirrels in early to mid-October in Zones 2 and 3, respectively. However, some hunters in Zones 2 and 3 tell us that bot flies do not bother them and they would like to start hunting October 1st like they do in Zone 1. Please indicate whether you support or oppose removing squirrel zones altogether and having a statewide squirrel season that starts October 1st. 1 Strongly Oppose 2 Oppose 3 Neutral 4 Support 5 Strongly Support 28. Some hunters have told us that they would like to have an additional squirrel hunting season that occurs sometime in late Spring or early Summer. States that have similar late seasons have found little evidence to suggest that such a late season negatively impacts squirrel populations. Please indicate whether you would support or oppose establishing a late Spring or early Summer squirrel hunting season in Mississippi? 1 Strongly Oppose 2 Oppose 3 Neutral 4 Support 5 Strongly Support 29. What do you think MDWFP can do to improve its Wildlife Management Areas (WMA) for small game hunters? (Please use the space provided below for your suggestions)

2005 SURVEY OF MISSISSIPPI HUNTERS ………………………………………… PAGE 10
The following questions will help us to know more about hunters. The information you provide will remain strictly confidential and you will not be identified with your answers.
30. Compared to your other outdoor recreation activities (such as fishing, camping, golfing, etc...) would you rate hunting as:
(Please circle only one answer) 1 YOUR MOST IMPORTANT OUTDOOR ACTIVITY 2 YOUR SECOND MOST IMPORTANT OUTDOOR ACTIVITY 3 YOUR THIRD MOST IMPORTANT OUTDOOR ACTIVITY 4 NONE OF THE ABOVE 31. What is your age? _______________________ YEARS 32. Are you? 1 MALE 2 FEMALE 33. In what county do you reside? _______________________ COUNTY 34. What is your approximate annual household income before taxes? 1 Under $10,000 7 $60,000 - $69,999 2 $10,000 - $19,999 8 $70,000 - $79,999 3 $20,000 - $29,999 9 $80,000 - $89,999 4 $30,000 - $39,999 10 $90,000 - $99,999 5 $40,000 - $49,999 11 $100,000 and ABOVE 6 $50,000 - $59,999 35. What is your highest completed level of education? (Please circle only one answer) 1 2 3 4 5 6 7 8 9 10 11 12 13 14 15 16 17 18 19 20 21 22+ elementary high school college graduate school 36. Are you of Spanish/Hispanic origin? 1 NO, NOT SPANISH/HISPANIC 2 YES, MEXICAN, MEXICAN AMERICAN, CHICANO 3 YES, OTHER SPANISH/HISPANIC GROUP (Please specify: _________________________) 37. What is your race? 1 WHITE OR ANGLO 2 BLACK OR AFRICAN AMERICAN 3 NATIVE AMERICAN OR ALASKAN NATIVE 4 ASIAN OR PACIFIC ISLANDER 5 OTHER (Please specify:_____________________________ )

2005 SURVEY OF MISSISSIPPI HUNTERS ………………………………………… PAGE 11
38. Was this survey completed by the person to whom it was addressed? 1 YES 2 NO Is there anything else you would like to share with us about hunting in Mississippi? Your contribution of time to this study is greatly appreciated. Please return your completed questionnaire in the postage paid business reply envelope as soon as possible. Thank You. Mississippi State University Department of Wildlife and Fisheries Mississippi State, MS 39762-9690 5/05

69
Appendix B
Survey correspondence with hunters for the 2005 Survey of Mississippi Resident Hunters

70
10000
Department of Wildlife and Fisheries
Box 9690 Mississippi State, MS 39762-9690 July 25, 2005 John Doe 123 Buck Drive Fawn, MS 30759 Dear John: In conjunction with the Mississippi Department of Wildlife, Fisheries, and Parks (MDWFP) we are conducting a study of resident hunters in Mississippi and we need your help. We conduct this study each year to determine the attitudes and opinions of Mississippi hunters and the amount of game harvested in Mississippi during the previous hunting season. The enclosed survey is designed to tell us about your hunting activity, attitudes towards various wildlife management issues, and game harvest in last year’s hunting season (2004-2005). This year’s survey focuses more so on small game hunting than previously, but also contains an important vote on hunting white-tailed deer over bait, and your willingness to pay for possible future license increases. The results of both questions will be presented to the Mississippi Legislature as they discuss these issues in the upcoming 2006 congressional session. The information you provide will also be useful in evaluating wildlife management in Mississippi, and will allow MDWFP to better represent the views of hunters to the MDWFP Commission and Mississippi Legislature. Although the survey is completely voluntary, you are one of a small number of hunters selected to participate in this study and we hope that you will take the 15-30 minutes necessary to complete the survey and be part of the wildlife management process. It is important that YOU and no one else complete the questionnaire. Your responses are important to us whether you hunt often or just occasionally. If you bought a license but did not hunt last year, please write “DID NOT HUNT” on the front cover and send it back to us. That will prevent you from receiving follow-up letters from us, and help us to complete the study. All responses will be strictly confidential, and you will not be identified with your answers. Your answers will be grouped with other respondents in a non-identifiable manner. The survey has an identification number for mailing purposes only. This is so we can remove your name from the mailing list once we receive it. After you complete the questionnaire, please return it to Mississippi State University in the postage-paid, business reply envelope as soon as possible. If you should have any questions about this research project, please feel free to contact me at Mississippi State University at (662) 325-4153. For additional information regarding human participation in research, please feel free to contact the MSU Regulatory Compliance Office at (662) 325-3994. Thank you in advance for your cooperation. We hope that your 2005-06 hunting season is a safe and successful one. Sincerely,
Dr. Kevin M. Hunt Assistant Professor & Director Human Dimensions & Conservation Law Enforcement Laboratory

71
10000
Department of Wildlife and Fisheries
Box 9690 Mississippi State, MS 39762-9690 August 19, 2005 John Doe 123 Buck Drive Fawn, MS 30759 Dear John: About three weeks ago, I sent you a survey of Mississippi hunters. As of today, I have not yet received your completed questionnaire. If you have recently returned your survey, please accept my thanks. The success and accuracy of this study depends on you and the others who have yet to respond. Those who have not responded may represent a completely different portion of the hunting public than those who have sent in their questionnaires and have different attitudes, hunting patterns and harvest rates. I ask for your help in making sure my results are representative of all hunters in Mississippi. In case you misplaced your survey, I’ve enclosed another one. The survey is designed to tell me about your hunting activity, attitudes towards various wildlife management issues, and game harvest in last year’s hunting season (2004-2005). The information you provide will be useful in evaluating wildlife management in Mississippi, and will allow the Mississippi Department of Wildlife, Fisheries & Parks (MDWFP) to better represent the views of hunters to the MDWFP Commission and Mississippi Legislature. If you did not hunt during the 2004-2005 hunting season please write DID NOT HUNT on the front of the questionnaire and mail it back to me so I can take your name off the mailing list. Although the survey is completely voluntary, you are one of a small number of hunters selected to participate in this study and I hope that you will take the 15-30 minutes necessary to complete the survey and be part of the wildlife management process. All of your responses will be held in the strictest confidence with me at MSU, and you will not be identified with your answers. No one at MDWFP will ever know your name or responses as I group your answers with other respondents in a non-identifiable manner. After you complete the questionnaire, please return it to Mississippi State University in the postage-paid, business reply envelope as soon as possible. If you should have any questions about this research project, please feel free to contact me at Mississippi State University at (662) 325-4153. Thank you in advance for your cooperation. I hope that your 2005-06 hunting season is a safe and successful one. Sincerely,
Dr. Kevin M. Hunt Assistant Professor & Director Human Dimensions & Conservation Law Enforcement Laboratory

72
10000
Department of Wildlife and Fisheries
Box 9690 Mississippi State, MS 39762-9690 October 7, 2005 John Doe 123 Buck Drive Fawn, MS 30759 Dear John: About a month ago, I sent you a survey of Mississippi hunters. As of today, I have not yet received your completed questionnaire. With the tragic disasters of Hurricane Katrina & Rita, I know there are other issues far more significant that you may be facing at this time. For that reason, I am empathetic to your situation and hope that you will respond only if you can. Please forgive me if this survey mailing has offended you, but the business of the State and University must go on despite the obstacles we all must face. If you have recently returned your survey, please accept my thanks. The success and accuracy of this study depends on you and the others who have not yet responded. Those who have not responded may represent a completely different portion of the hunting public than those who have, and have different attitudes, hunting patterns and harvest rates. I ask for your help in making sure my results are representative of all hunters in Mississippi. In case you misplaced your survey, I’ve enclosed another one. If you did not hunt during the 2004-2005 hunting season please write DID NOT HUNT on the front of the questionnaire and mail it back to me so I can take your name off the mailing list. Although the survey is completely voluntary, you are one of a small number of hunters selected to participate in this study and I hope that you will take the 15-30 minutes necessary to complete the survey and be part of the wildlife management process. After you complete the questionnaire, please return it to Mississippi State University in the postage-paid, business reply envelope as soon as possible. If you should have any questions about this research project, please feel free to contact me at Mississippi State University at (662) 325-4153. Thank you in advance for your cooperation during this difficult time for our State and Nation. I wish you the best and hope you will still be able to enjoy this year’s hunting season. Sincerely,
Dr. Kevin M. Hunt Assistant Professor & Director Human Dimensions & Conservation Law Enforcement Laboratory

73
Appendix C
Assessing Impacts of Hunting License Fee Increases on Hunter Participation in Mississippi
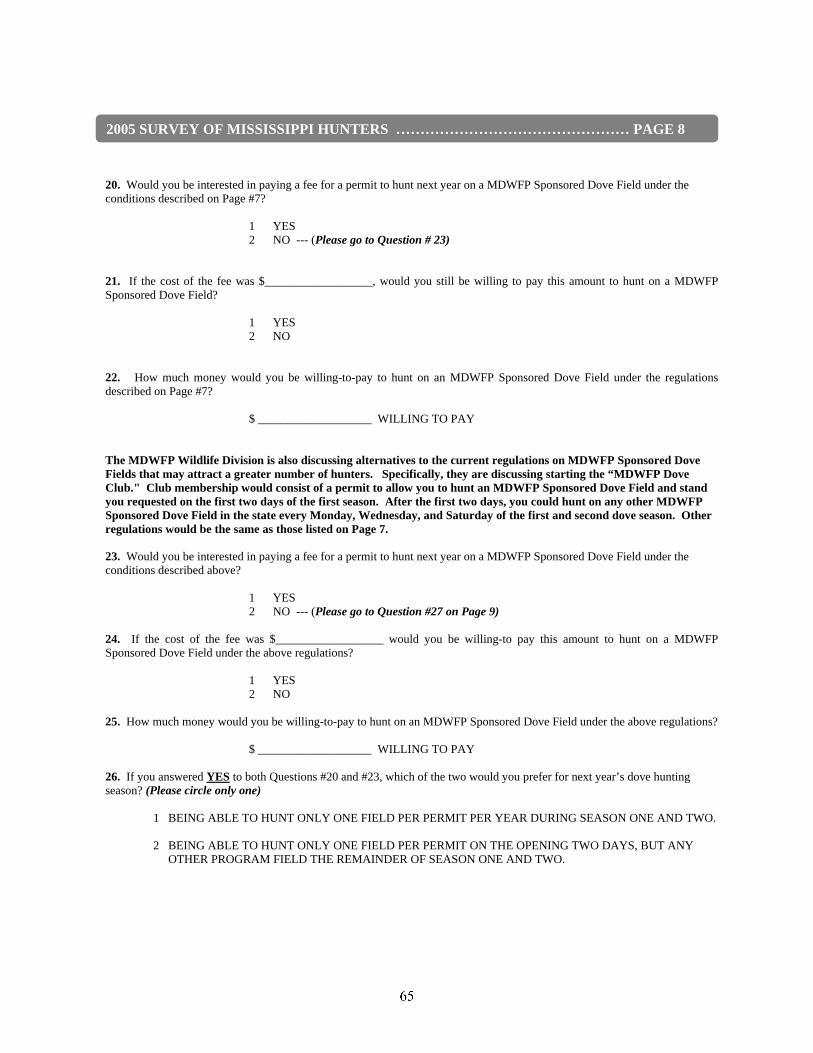
74
Abstract
Hunting participation rates have continued to decline in the United States causing a reduction in funding
for state wildlife and fisheries agencies, this reduction in funding was due to a reduction in hunting
license purchases. Increasing license fees may alleviate the funding problem, but past research has shown
that this practice may decrease future hunter participation. The Willingness to Pay (WTP) for an increase
in hunting licenses in Mississippi was determined using the Contingent Valuation Method (CVM)
through a survey of 2004-2005 Mississippi resident hunters. The WTP of Small Game, All Game, and
Sportsman licenses were assessed. Median bid value, where 50% of hunters would agree to pay for the
increase, maximum bid value, and annual revenue created from each license type were calculated. The
Small Game median bid value was $66.81, creating $164,697.00 in revenue, and the maximum bid value
was $80.25, creating $169,065.00 in revenue, while displacing 57% of hunters. The All Game median
bid value was $68.50, creating $2,502,631.00 in revenue, and the maximum bid value was $185.00
creating $3,934,214.00 in revenue while displacing 71% of hunters. The Sportsman median bid value
was $123.50, creating $6,671,896.00 in revenue, and the maximum bid value was $229.50, creating
$8,267,295.00 in revenue while displacing 67% of hunters. Hunter displacement must be taken into
consideration due to a potential decrease in hunting participation, economic impacts, political support,
and conservation efforts.
Introduction
The U. S. population has slowly transformed from a rural agrarian society into an urbanized and
technology-driven society, which has led to a decline in hunter recruitment and interest in hunting (Miller
and Vaske 2003). Since 1975, fishing and hunting recreation has decreased by 18% (Enck, Decker, and
Brown 2000). Despite this decline, Mississippi hunting participation increased by less than 5%, from
1991 to 1996 (Enck, Decker, and Brown 2000). In 2001, only 6% of the U.S. population participated in
hunting, yet Mississippi had one of the highest percentages of participation, with 12% of the population
purchasing a hunting license (USDOI and USDOC 2001). Consequences of this decline could affect

75
several important areas, such as agency funding, political support for consumptive wildlife uses, and
support for conservation efforts.
All state wildlife agencies have depended on the user pay/user benefit system of the Federal Aid in
Wildlife Restoration Act (Decker, Brown, and Siemer 2001). Some states may increase their state budget
for wildlife and fishery programs by way of state taxes, but all states received a certain percentage of
funding through the Wildlife Restoration Act (Decker, Brown, and Siemer 2001). The more hunting
licenses a state can sell, the more funding the agency can receive; therefore, if participation has decreased,
so will the funding.
One method to make up for the loss of funding could be to increase the price of a hunting license,
but a potential drawback for increasing hunting license fees would be the possibility of a decrease in
future hunters (Sutton, Stoll, and Ditton 2001). In Alabama, an increase of hunting and fishing license
fees, which did increase the agency revenue, was followed by a decline in license sales (Mehmood,
Zhang, and Armstrong. 2003). Fedler and Ditton’s (2001) statewide survey of Texas anglers stated that a
fee increase was one leading cause of a decrease in angler participation rates.
Constraints
Generation of revenue through license fees has allowed agencies to afford facility maintenance,
salaries, and to fund research, but the fee may be viewed as a constraint to hunter participation. A
constraint influences whether or not an individual participates in an activity, such as hunting or fishing
(More and Stevens 2000). Constraints to hunting participation included license cost, user fees, lack of
hunting opportunity, lack of prior hunting experience, and demographic variables, such as race or age
(Fedler and Ditton 2001, Miller and Vaske 2003). If a hunter considered a license fee increase to be
unreasonable, or a constraint, he/she may decide to leave hunting and become involved in other activities,
such as golf or sporting events. Furthermore, this situation may decrease the chance for the hunter to pass
on the ‘tradition’ of hunting to the next generation. Enck, Decker, and Brown’s (2000) study suggested
that trends in hunting participation indicated that less hunter recruitment and retention was occurring,
which inferred a continued decrease in hunting participation. If this trend continued, hunting participation

76
could diminish, further upsetting the financial support for state agencies. In a study conducted by Sutton,
Stoll, and Ditton (2001), it was found that for every dollar increase in an angler license fee, the license
sales would decrease by less than 5%. Monetary constraints were considered to be a factor in the
reduction of angler license purchases (Sutton, Stoll and Dinton 2001).
It has been shown that user fees may exclude those with lower incomes from using publicly owned
resources, which included wildlife (More and Stevens 2000). Overall, African Americans and Hispanics
have lower incomes than Caucasians, and most live in urban areas, both of which are factors that
influence hunting participation (Hunt and Ditton 2002). According to the study conducted by Johnson,
Bowker, and Cordell (2001), time and money are two of the most influential constraints when it comes to
minorities participating in outdoor recreation, including hunting. Washburne (1978) considered the
Theory of Marginality, which states that the African American participation in outdoor recreation was
low because of socioeconomic discrimination and poverty, and that activity cost was the most often cited
reason for a lack of participation. Gender and income have been variables in hunter recruitment,
participation, and retention (Johnson, Bowker, and Cordell 2001). In 2001, less than 10% of those who
hunted in Mississippi were women (USDOI and USDOC 2001).
As the demographics of the U.S. change, another effect may be a decrease in the political support
that fish and wildlife agencies and hunting organizations receive from the public. Ballot measures on
restricting consumptive wildlife uses have already occurred in some states, such as Massachusetts (Minnis
1998). Wildlife policy may be affected more by the values held by the public and less by sound research.
The effect of fee increases must be thoroughly studied when an agency debates an increase in hunter
license fees due to the potential erosion of future hunting participation rates.
Even though the U.S. population has been shifting towards a racial plurality, hunting is dominated
by Caucasians, and as the percentage of Caucasians decreases, the percentage of those participating in
hunting could decrease (Enck, Decker, and Brown 2000). Several hunting categories, such as large game,
have had increasing participation rates, while others have been in decline, such as the small game hunters
which have decreased by 40% since 1991 (Enck, Decker, and Brown 2000). In 2001, 88% of Mississippi

77
hunters were Caucasian, which comprised the largest component of big game hunters, and 11% were
African American, who comprised mainly the small game hunter category (USDOI and USDOC 2001).
Nationally, 37% of African American hunters hunted squirrel (Sciurus spp.), while only 16% of
Caucasians hunted squirrel (USDOI and USDOC 2004). The same pattern was seen for rabbits
(Sylvilagus spp.) where 45% African Americans hunted rabbit, versus 16% of the Caucasian hunters
(USDOI and USDOC 2004).
Hunting Licenses
In Mississippi, there were three hunting licenses. The Small Game license, which allowed one to
hunt squirrel, rabbit, Northern bobwhite (Colinus virginianus), raccoon (Procyon lotor), opossum
(Didelphis virginiana), and bobcat (Lynx rufus), is $13.851 (MDWFP 2005). The All Game license was
$18.851 and allowed one to hunt all game, including small game (MDWFP 2005). The Sportsman
license, which was considered to be the best value, is $33.851, allowed one to hunt all game, including
small game, and provided a fall turkey permit, archery permit, and primitive weapon permit (MDWFP
2005).
Objectives
To address how an increase in hunting licenses affected hunting participation, the Contingent
Valuation Method (CVM) was used to calculate the Willingness to Pay (WTP) for the increase. The
WTP was the amount one was willing to pay for certain goods or services and the CVM method
attempted to value a resource through WTP. The objective of this study was to determine if an increase in
hunting fees would potentially decrease future hunters, how many hunters would be displaced, and assess
WTP for higher license fees.
Procedures and Methods
The development and mailing of an 11 page self-administered questionnaire was conducted
through the Human Dimensions and Conservation Law Enforcement Laboratory (HDCLEL) of
Mississippi State University. This study was funded by the Mississippi Department of Wildlife, 1 Includes a $1.85 processing and agent fee.

78
Fisheries, and Parks to determine the feasibility of a hunting license fee increase. Questions elicited
information on hunting experiences and preferences, legalized white-tailed deer baiting, harvest numbers,
WTP for license increases, attitudes towards wildlife recreation, and sociodemographic information.
A sample of 1,000 hunters from each license type (n=3000) was selected from the
MDWFP 2003-2004 hunter license file and was used to survey those participating in the 2004-
2005 hunting season. Survey procedures followed a modified Dillman (1978) method, where the
number of mail-outs was increased from three to four, and a reminder postcard was not used. The
first mailing consisted of a survey, response envelope and introductory letter, explaining the
purpose and benefits of the research, supporting organizations, contact information, Institutional
Review Board approval number, and a confidentiality statement. The second survey mailing took
place 21 days after the initial mailing, and contained a thank you letter for completing the survey,
and also reminded non-respondents to fill out and return the survey as soon as possible. After the
second mailing, respondents from the Gulf Coast counties of Jackson, Harrison and Hancock
were removed due to Hurricane Katrina. Forty-six days and sixty-three days after the initial
mailing, a third and a fourth mailing were conducted. These mailings were geared only towards
non-respondents and consisted of another copy of the survey, a response envelope, and another
introductory letter restating the importance and confidentiality of participation.
Models used for calculating WTP, demand curves, and expected hunter displacement
were adapted from research conducted by Sutton, Stoll, and Ditton (2001). Bid values, or the
license fee increase, were randomly assigned to each hunter and ranged from a $3 to $200
increase for Small Game licenses, a $3 to $300 increase for All Game licenses and a $3 to $500
increase for Sportsman licenses. There was no change in the “goods” offered, such as an
increased hunting season or more hunting areas. WTP values were used to determine the
probabilities of a hunter purchasing a license at the higher bid value price. Logistic regression
was used to find the probability of a respondent paying for a higher hunting license fee.
Independent variables were 1) race, 2) income, 3) age, 4) importance of hunting when compared

79
to other activities, 5) gender, 6) education, 7) affiliation with a non-governmental organization, 8)
subscription to a hunting magazine and 9) the hypothetical license cost.
Once the significant variables were identified, demand curves were created following the
Sutton, Stoll, and Ditton (2001) model to determine the relationship between the license cost and
number of licenses purchased for each type of license. The expected number of licenses
purchased for each bid value was calculated by multiplying the predicted probability of those who
indicated they would purchase a license at the higher bid value by the number of actual hunters
from the 2004-2005 hunting season. The probability of the number of licenses purchased was
created from the logistic regression model. If the Small Game License fee was increased by $10,
the regression model would predict that the probability of a hunter purchasing a Small Game
license would be 0.77. This probability would be multiplied by the actual number of Small Game
licenses purchased during the 2004-2005 hunting season (0.77 x 4928 = 3821) in order to get the
expected number of licenses purchased at that particular bid value. The number of hunters
displaced by license increase, revenue created from the median bid value (median revenue = bid
value where 50% of the hunters agreed to purchase the increased license x number of license
sold), and maximum amount of revenue created was calculated.
Results
The effective response rate of the hunters who purchased a Small Game license was
52.8%, with 264 non-deliverables. The effective response rate of the hunters who purchased an
All Game license was 45.0%, with 227 non-deliverables. The effective response rate of the
hunters who purchased a Sportsman license was 59.0%, with 123 non-deliverables.
The median bid value that hunters who purchased a Small Game license would pay to
continue hunting in Mississippi was $66.81. At this value, 50% of hunters would be displaced.
Revenue created from this bid value would be $164,697. If the agency wanted to maximize
revenue created from increased bid values, maximum revenues would be $169,065 by increasing
80
the license fee to $80.25 (Figure C1). This would displace 57% of hunters. The revenue
difference between the median and maximum bid value of the Small Game license was $4,376.
The median bid value that hunters who purchased an All Game license would pay to continue
hunting in Mississippi was $68.50. At this value, 50% of hunters would be displaced. Revenue created
from this bid value would be $2,502,631. If the agency wants to maximize revenue created from
increased bid values, maximum revenues would be $3,934,214 by increasing the licenses by $185 (Figure
C2). This would displace 71% of hunters that purchase an All Game license. The revenue difference
between the median and maximum bid value was $1,431,582.
The median bid value that hunters who purchased a Sportsman license would pay to continue
hunting in Mississippi was $123.50. At this value, 50% of the hunters would be displaced. Revenue
created from this bid value would be $6,671,896. If the agency wants to maximize revenue created from
increased bid values, maximum revenues would be $8,267,295 by increasing the licenses by $229 (Figure
C3). This would displace 67% of hunters that purchased a Sportsman license. The revenue difference
between the median and maximum bid value was $1,595,399.
Discussion
If an agency wanted to increase revenues created from hunting licenses, the agency would need to
consider the possibility of displacing hunters and potentially reducing the rate of future hunting
participation. A participation decrease may influence political and funding decisions made by governing
bodies over the agency. Management decisions such as population control may be affected if there is a
decline in hunting participation. Also, the agency may direct more of their funds towards non-
consumptive wildlife uses, such as wildlife watching and urban wildlife programs.
One method for increasing license fees may be to identify a revenue goal needed for the upcoming
fiscal year. If the agency’s goal revenue was $100,000, then they may consider increasing each license
type fee. If they increased the Small Game license fee by $25, the All Game license fee by $13, and the
Sportsman license fee by $78, this increase would bring in approximately $112,000 above the current
revenue. By increasing each amount, the total number of hunters displaced would be approximately
81
76,000. If the agency decided this was not an acceptable amount of displaced hunters, they could reduce
the license cost until an acceptable amount of displaced hunters was identified. The agency may decide to
increase one or two of the license fees but not all three, depending on the estimated hunter displacement.
With this in mind, overall political and public support for consumptive wildlife uses may decline as
the public becomes less involved with hunting. For example, in Mississippi, if the Small Game license
fee was increased, and a decrease in participation resulted, there may be a decrease in African American
participation since 36% of Mississippians are African Americans and comprise 11% of Mississippi
hunters (USDOI and USDOC 2001, USCB 2000). The increased cost may become a perceived barrier for
some African Americans, thereby decreasing hunting participation (Washburne 1978). Also, this
decrease may decrease the African American political support for consumptive wildlife uses. Hunting
may be viewed as a wealthy Caucasian dominated activity; therefore, the African American community
may not support or promote funding for consumptive wildlife uses.
Another consequence for increasing license fees could be the potential increase in poaching.
Hunters may view the increase as unacceptable and hunt illegally. Hunting regulations have been in place
to manage the consumptive use of wildlife at a sustainable harvest level. There are many reasons why a
person participates in hunting, such as to collect trophies or to provide substance, but sometimes hunting
regulations interfere with what may be viewed as a tradition or right to hunt (Decker, Brown and Siemer
2001). If hunting licenses are increased, this may have an effect on those that view hunting as a
traditional right and inadvertently increase the poaching of wildlife.
A decrease in hunting participation may affect the amount of federal money the state receives
through the Federal Aid in Wildlife Restoration Act. During the 2004 fiscal year, Mississippi received
over $3.5 million from the Wildlife Restoration Act for use in hunter education programs and habitat
management, rehabilitation, and research (USDOI and USFWS 2005). The amount of federal aid is
dependent on the number of hunting licenses sold, so the amount the state would receive would decline.
Fish and wildlife agencies must consider all possible effects of increasing the license fees for hunting,
how it will affect future hunter participation, revenue, and political support.

82
Through this study, hunting in Mississippi was shown to be greatly valued. The Small Game
license was the most valued license, with the Sportsman license the second most valued. It was expected
that the Sportsman license would be the most valued since it allows one to hunt all types of game and
includes the turkey and the primitive weapon permit. Further studies would need to be conducted to
identify the motivations for the preferences of one license type over the other.
There are some considerations that should be given to the limitations of this study. In Mississippi,
fishing permits are included with hunting licenses, but anglers were not included in the sample. Only
those stating that they hunted during the 2004-2005 season were included, which may have an effect on
the WTP rates and probabilities. Angler participation rates would need to be taken into account when
considering increasing license fees. A fee increase may affect angler participation in a similar way. The
response rate was most likely decreased by the effects of Hurricanes Katrina and Rita. The amount of
financial support derived from the Federal Aid in Wildlife Restoration Act was not taken into
consideration during this project, but it would have a substantial influence on the entire amount of
funding a state has for a fish and wildlife agency.
Summary
A portion of agency funding was determined by the number of licenses sold. Increasing license
fees was one way to generate more annual revenues for the agency, but this increase may have
detrimental effects on hunter participation rates. This study has illustrated that theoretically Mississippi
license fees can be almost doubled with a risk of only losing 50% of current hunters. To maximize
revenue, if an agency was willing to lose a larger percentage of hunters, it may increase its fees
dramatically. An increase in revenue may be temporary, but the declining hunter participation may be
permanent. This effect should be weighed heavily before the determination of a license fee increase,
because future funding and political influences may be affected.
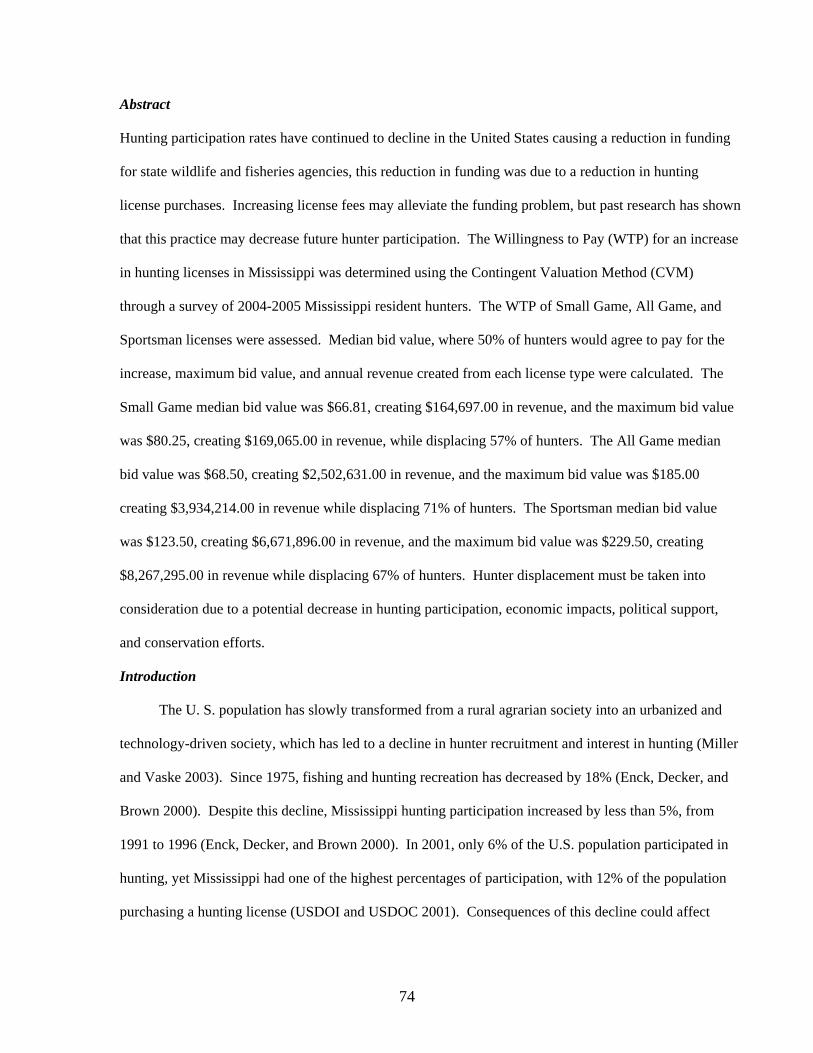
83
Figure C1. Mississippi hunters’ Willingness to Pay (demand), for a Small Game License to continue hunting in Mississippi and annual revenue created from various
bid values (2003 U.S. Dollars)
0
50
100
150
200
250
0 1,000 2,000 3,000 4,000 5,000 Licenses Purchased
Bid Value ($)
0
20,000
40,000
60,000
80,000
100,000
120,000
140,000
160,000
180,000
Annual Revenue ($)
DemandRevenue
Willingness to Pay for the Small Game License

84
Figure C2. Mississippi hunters’ Willingness to Pay (demand), for an All Game License to continue hunting in Mississippi and annual revenue created from various bid values (2003 U.S. Dollars)
0
50
100
150
200
250
300
350
0 10,000 20,000 30,000 40,000 50,000 Licenses Purchased
Bid Value ($)
0
500
1,000
1,500
2,000
2,500
3,000
3,500
4,000
4,500
Annual Revenue ($1,000)
DemandRevenue
Willingness to Pay for the All Game License

85
Figure C3. Mississippi hunters’ Willingness to Pay (demand), for a Sportsman License to continue hunting in Mississippi and annual revenue created from various bid values (2003 U.S. Dollars)
0
100
200
300
400
500
600
0 20,000 40,000 60,000 80,000
Bid Value ($)
0
1,000
2,000
3,000
4,000
5,000
6,000
7,000
8,000
9,000
Annual Revenue ($1,000)
DemandRevenue
Licenses Purchases
Willingness to Pay for the Sportsman License

86
References Decker, J. D., T.L. Brown, and W. F. Siemer. 2001. Restoration of wildlife species. Human
Dimensions of Wildlife Management in North America. The Wildlife Society, Bethesda, Maryland.
Dillman, D. A. 1978. Mail and telephone surveys. The Total Design Method. John Wiley and
Sons, New York, New York. Enck, J. W., D. J. Decker, and T. L. Brown. 2000. Status of hunter recruitment and retention in the United States. Wildlife Society Bulletin 28(4): 817-824. Fedler, A. J. and R. B. Ditton. 2001. Dropping out and dropping in: A study of factors for changing recreational fishing participation. North American Journal of Fisheries Management 21: 283-292.
Hunt, K. M. and R. B. Ditton. 2002. Freshwater fishing participation patterns of racial and ethnic groups in Texas. North American Journal of Fisheries Management22: 52-65.
Johnson, C. Y., J. M. Bowker, and K. Cordell. 2001. Outdoor recreation constraints: An examination of race, gender and rural dwelling. Southern Rural Society 17: 111-133. Mehmood S., D. Zhang, and J. Armstrong. 2003. Factors associated with declining hunting license sales in Alabama. Human Dimensions of Wildlife 8: 243-262. Miller, C. A. and J. J. Vaske. 2003. Individual and situational influences on declining hunter effort in Illinois. Human Dimensions of Wildlife 8: 263-276. Minnis, D. L. 1998. Wildlife policy-making by the electorate: An overview of citizen- sponsored ballot measures on hunting and trapping. Wildlife Society Bulletin 26(1): 75-83.
Mississippi Department of Wildlife, Fisheries, and Parks (MDWFP). 2005. Resident hunting license prices. Outdoor Digest. Jackson, Mississippi. More, T. and T. Stevens. 2000. Do user fees exclude low-income people from resource-based recreation? Journal of Leisure Research 32(3): 341-357. Sutton, S. G., J. R. Stoll, and R. B. Ditton. 2001. Understanding anglers' willingness to pay increased fishing license fees. Human Dimensions of Wildlife 6: 115- 130. Washburne, R. F. 1978. Black under-participation in wild land recreation: Alternative explanations. Leisure Sciences 1(2): 175-189 U.S. Census Bureau (USCB). 2000. State and county quick facts: Mississippi. Census 2000. U.S. Department of the Interior (USDOI), and Fish and Wildlife Service, U.S. Department of Commerce (USDOC). 2005. U. S. Fish and Wildlife Service final apportionment of Pittman-Robertson Wildlife Restoration funds for fiscal year 2005.
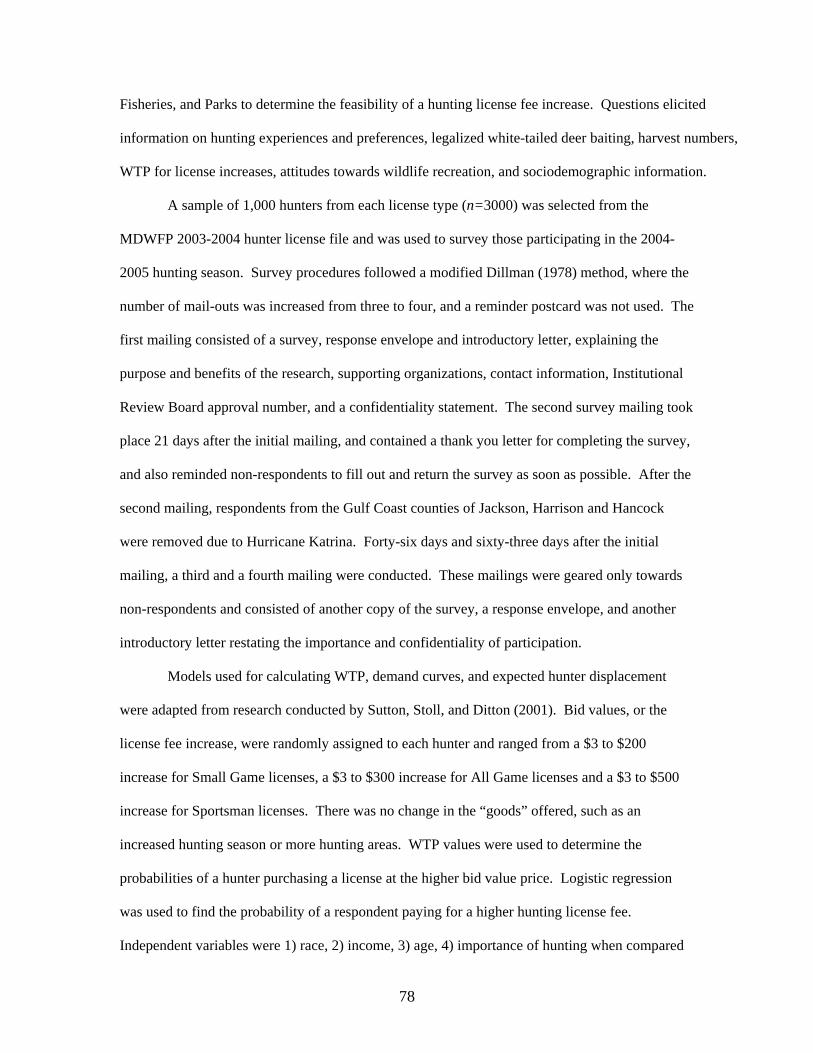
87
U.S. Department of the Interior (USDOI), Fish and Wildlife Service, U.S. Department of Commerce (USDOC), and U.S. Census Bureau. 2001. National survey of fishing, hunting, and wildlife-associated recreation: Mississippi.
U.S. Department of the Interior (USDOI), Fish and Wildlife Service, U.S. Department of Commerce (USDOC), and U.S. Census Bureau. 2004. Participation and Expenditure patterns of African American, Hispanic and female hunters and anglers.
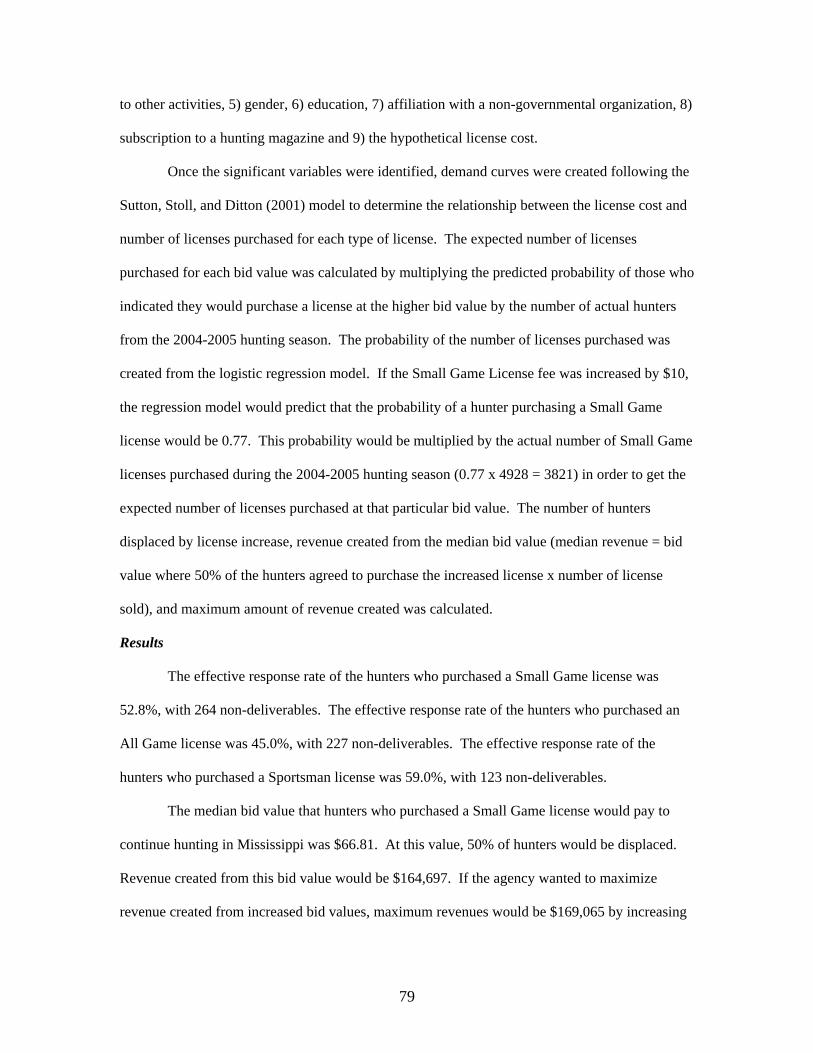
88
Appendix D
Willingness to Pay for MDWFP Sponsored Dove Fields

89
The Contingent Valuation Method (CVM), as described earlier in Appendix C, was used to
estimate willingness to pay (WTP) for two different types of dove hunting permits (Sutton, Stoll,
and Ditton, 2001). Both permits would allow hunting on MDWFP sponsored fields on private
lands that would be managed for dove and certified as bait-free. The permits would be issued on
a first-come basis and the hunter would pick the stand or field of their choice. The first option
was introduced for the 2004-2005 hunting season at a cost of $50 and allowed hunting on the
chosen stand/field on Mondays, Wednesdays, and Saturdays after 12:00 p.m. during the first and
second dove seasons. The second option was under consideration as an alternative and called the
“MDWFP Dove Club.” This option would allow the member to hunt on the MDWFP sponsored
dove stand/field of choice for the first two days of the first season. Afterwards, the member
would be allowed to hunt on any other MDWFP sponsored dove field in the state every Monday,
Wednesday, and Saturday of the first and second dove seasons.
In a self-administered mail questionnaire, dove hunters (Tables D1 and D2) and those
interested in dove hunting were asked if they would be willing to purchase a permit to hunt under
each option (Tables D3 and D4). These hunters were also asked if they would prefer purchasing
a permit for either option one or option two (Table D5). Dove hunters and those persons
interested in dove hunting were also asked what they would be willing to pay for each option.
Hypothetical permit costs for both options were randomly assigned to each hunter and ranged
from $2-$50 (Tables D6 and D7). Logistic regression was used to identify the significant
variables that affected respondents’ WTP for the MDWFP sponsored dove permit and to estimate
the median permit costs (where 50% of the hunters agreed to purchase the permit). In the original
logistic regression model, 1) the independent variables included total days hunted, 2) dove
harvested per day, 3) total dove harvest, 4) total days of dove hunting, 5) years hunting, 6)
membership to a hunting or conservation organization, 7) preference of current hunting season or
preference for an extended hunting season with a reduced bag limit, 8) hypothetical permit cost,
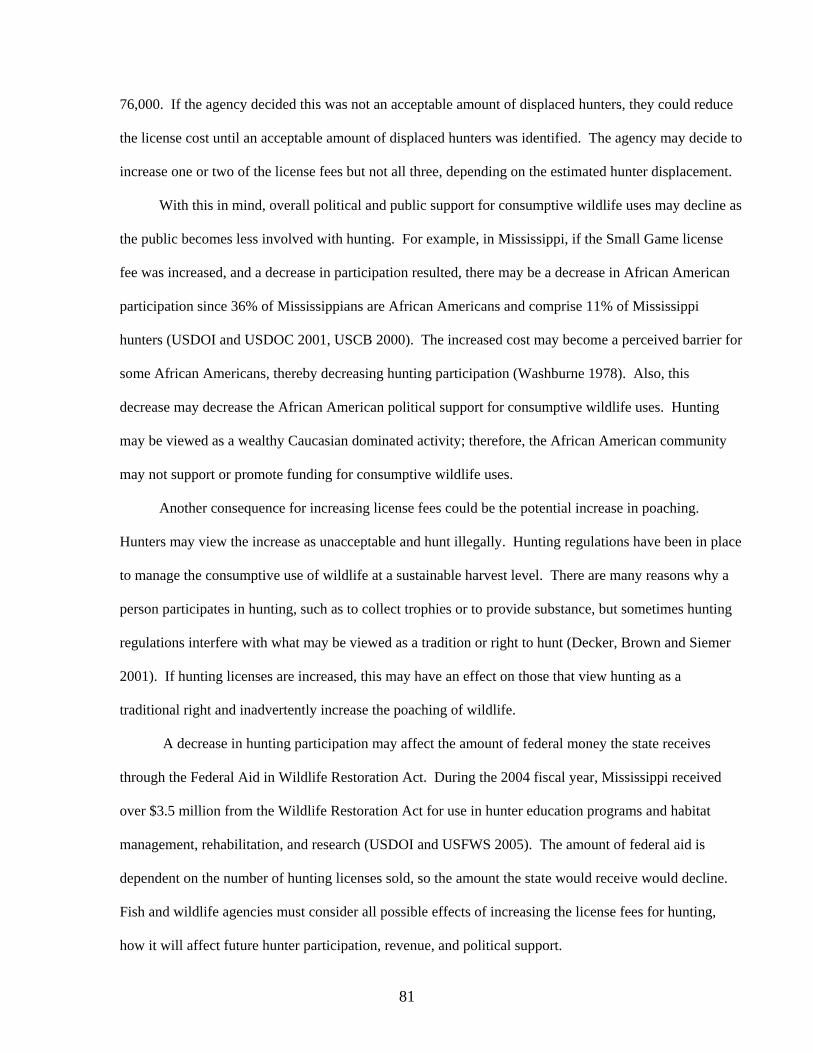
90
9) socioeconomic information, 10) age, 11) gender, and 12) personal importance of hunting as an
outdoor activity.
Logistic regression was used to reduce the original model by identifying only the
significant variables that affected respondents’ WTP (Table D8). The significant variables for the
first option were hypothetical permit cost (P < 0.0001) and respondents’ annual gross household
income (P = 0.0005). Significant variables for the second option (Table D9) were hypothetical
permit cost (P < 0.0001) and total dove harvest from the previous season (P = 0.0089). For both
options, hypothetical permit cost was negatively related to respondents’ WTP (i.e., as permit cost
increased, the likelihood of a hunter purchasing a permit declined). For the first option,
respondents’ income was positively related to WTP. For the second option, respondents’ total
dove harvest for the season was positively related to WTP. The estimated median cost was
$55.96 for the first option and $33.90 for the second option. When an open ended question asked
about their WTP for a permit the respondents’ mean WTP for the first option was $23.44 (Table
D10) and $21.13 (Table D11) for the second option.
Reference
Sutton, S. G., J. R. Stoll, and R. B. Ditton. 2001. Understanding anglers' willingness to pay increased fishing license fees. Human Dimensions of Wildlife 6: 115- 130.
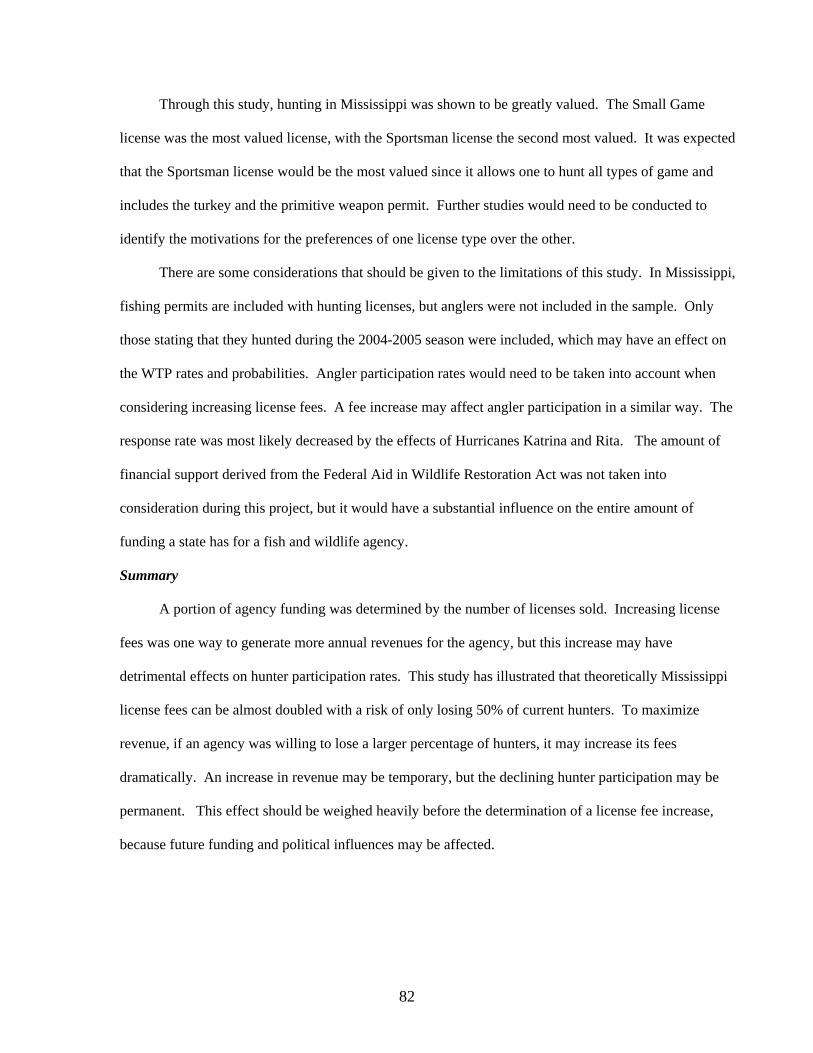
91
Table D1. Respondents’ preference for either the current dove hunting season and bag limit or a proposed increase in the dove hunting season with a reduction in bag limit (Q 18) Dove Hunting Season n Percent I prefer the current 60 day/15 bird bag limit 647 72.3 I prefer a 70 day/12 bird bag limit 248 27.7 Total 895 100.0 Table D2. Average number of days for each of the three dove hunting seasons that respondents’ indicated to create the “ideal” 60 day dove hunting season (Q 19)
Season Frequency Mean Standard Deviation 1 728 19.96 8.72 2 705 17.04 5.18 3 694 22.33 8.18
Table D3. Respondents’ indication of whether or not they would be willing to purchase a permit to hunt on a MDWFP Sponsored Dove Field for the 2005-2006 hunting season under the first option of being able to hunt only one field per permit per year during season one and two (Q 20)
Purchase Under First Option n Percent
Yes 452 49.7 No 458 50.3
Total 910 100.0 Table D4. Respondents’ preference for the option to purchase a permit to hunt on a MDWFP Sponsored Dove Field for the 2005-2006 hunting season following the second option of being able to hunt only one field per permit on the opening two days, but any other program field the remainder of season one and two (Q 23)
Purchase Under Second Option n Percent Yes 428 48.5 No 455 51.5
Total 883 100.0

92
Table D5. Respondents’ preference for purchasing a MDWFP Sponsored Dove Field permit for either option one or option two (Q 26) Option n Percent Option 1: Being able to hunt only one field per permit per year during season one and two. 71 15.8 Option 2: Being able to hunt only one field per permit on the opening two days, but any other program field the remainder of season one and two. 378 84.2 Total 449 100.0 Table D6. Respondents’ indication of whether or not they would be willing to pay the hypothetical permit cost for the first option of the MDWFP Sponsored Dove Field (Q 21)
Hypothetical Permit Cost ($) Yes No Total
2 80.7 19.3 100.0 3 70.7 29.3 100.0 4 76.1 23.9 100.0 6 70.6 29.4 100.0 8 79.6 20.4 100.0 12 77.5 22.5 100.0 17 75.6 24.4 100.0 24 60.4 39.6 100.0 35 66.7 33.3 100.0 50 51.6 48.4 100.0
Table D7. Respondents’ indication of whether or not they would be willing to pay the hypothetical permit cost for the second option of the MDWFP Sponsored Dove Field (Q 24)
Hypothetical Permit Cost ($) Yes No Total 2 77.8 22.2 100.0 3 80.6 19.4 100.0 4 78.6 21.4 100.0 6 80.8 19.2 100.0 8 69.4 30.6 100.0 12 67.2 32.8 100.0 17 65.0 35.0 100.0 24 52.6 47.4 100.0 35 44.6 55.4 100.0 50 37.5 62.5 100.0

93
Table D8. Logistic regression table identifying significant variables for the MDWFP Sponsored Dove Field option one Variable Estimate Std. Err. Wald Chi-square P-value Intercept 0.693 0.227 9.320 0.002 Hypothetical permit cost -0.025 0.006 17.022 <0.001 Income 0.109 0.031 11.980 0.001 Model Chi-square 26.480 <0.001 Number of observations 593 Table D9. Logistic regression table identifying significant variables for the MDWFP Sponsored Dove Field option two Variable Estimate Std. Err. Wald Chi-square P-value Intercept 1.154 0.207 31.103 <0.001 Total doves harvested for the season 0.017 0.007 6.676 0.010 Hypothetical permit cost -0.045 0.008 31.362 <0.001 Model Chi-square 42.457 <0.001 Number of observations 366 Table D10. Respondents’ Willingness-to-pay (WTP) to hunt on an MDWFP Sponsored Dove Field under the first option (Q 22)
WTP ($) n Percent 0 92 16.7
1-10 143 26.0 11-20 107 19.4 21-30 64 11.6 31-40 31 5.6 41-50 78 14.2 51-60 5 0.9 > 61 31 5.6 Total 551 100.0
Mean amount respondents were willing to pay = $23.44. Table D11. Respondents’ Willingness-to-pay (WTP) to hunt on an MDWFP Sponsored Dove Field under the second option (Q 25)
WTP ($) n Percent 0 80 15.5
1-10 161 31.2 11-20 93 18.0 21-30 71 13.7 31-40 25 4.8 41-50 59 11.4 51-60 4 0.8 > 61 24 4.6 Total 517 100.0
Mean amount respondents were willing to pay = $21.13.