Continuity Equation Model of the Predicted Drastic Retreat ...
Upload
hoangkhanhCategory
view
221download
3
ESM 121
Water Scienceand Management
Exercise 3:
Mass Balance, System’s Operation and Water Allocation Policies
Samuel Sandoval Solis, PhD
1

ContentsPart I – Continuity Equation: Conservation of Mass....................................................................................2
Introduction.............................................................................................................................................2
Water Mass Balance................................................................................................................................2
Part II – System’s Operation and Water Allocation Policies.........................................................................5
Introduction.............................................................................................................................................5
Defining the water allocation policies.....................................................................................................7
Water User: River................................................................................................................................7
Water User: User 3..............................................................................................................................8
Water User: User 1 and 2..................................................................................................................11
Linking the Water Allocation policy with the Mass Balance Model.......................................................13
First Method......................................................................................................................................13
Second Method.................................................................................................................................14
1

Part I – Continuity Equation: Conservation of Mass
The aim of this exercise is to exercise section is to provide basic concepts of water balance using Pajaro Valley as a case of study. You will perform a simple water balance to estimate inputs (It) Outputs (Ot) and change in storage (ΔSt) You will estimate these terms considering a simple water supply system: one river, one aquifer and three water users (irrigation, rural and Watsonville city).
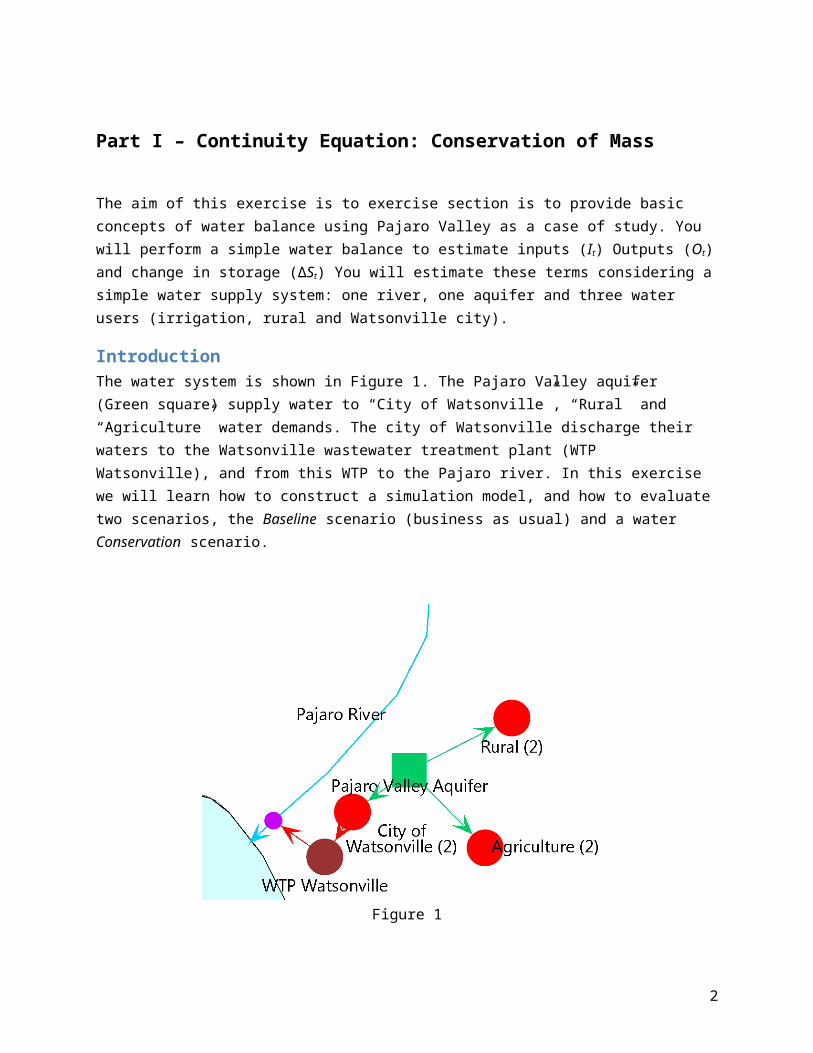
IntroductionThe water system is shown in Figure 1. The Pajaro Valley aquifer (Green square) supply water to “City of Watsonville”, “Rural” and “Agriculture” water demands. The city of Watsonville discharge their waters to the Watsonville wastewater treatment plant (WTP Watsonville), and from this WTP to the Pajaro river. In this exercise we will learn how to construct a simulation model, and how to evaluate two scenarios, the Baseline scenario (business as usual) and a water Conservation scenario.
Figure 1
Water Mass BalanceThe Spreadsheet Ex_3 shows the annual water demand for the City of Watsonville (Municipal), for rural communities (Rural) and for Agriculture (Agriculture). It also shows the estimated aquifer recharge to the Pajaro aquifer. In addition, it also has data of the Pajaro River headflow. Consider an initial aquifer storage of 900 million m3.
To be turned in:
2
I.- Baseline Scenario
1) Show a table of the calculated aquifer storage using a mass balance procedure
St−St−1=It−Ot
2) Using the same equation estimate the flow of the Pajaro River to the ocean, considering that about 66% of the Municipal demand of Watsonville is a return flow to Pajaro River. Show a table with these results.
II.- Water Savings Scenario
1) Show a table and a graph of the calculated aquifer storage using a mass balance procedure
St−St−1=It−Ot
2) Using the same equation estimate the flow of the Pajaro River to the ocean, considering that about 66% of the Municipal demand of Watsonville is a return flow to Pajaro River. Show a table with these results.
III.- Comparison of both methods
1) Create a chart (line chart) when you show both aquifer storages. 2) What is the time step of the input data for this analysis? Years? Months?3) In which scenario the aquifer storage is larger? 4) Why? What terms in the mass balance equation change?5) Investigate about the concepts of aquifer safe yield and groundwater overdraft?6) Do the policies of water conservation improve the problem of the overdraft? 7) Is the overdraft problem solved?8) Take a look at the following figures and mention what other type of problem is causing
overdraft?
3
Do you think the space left in the aquifer storage by fresh water is left empty or is it occupied by other type of liquid?
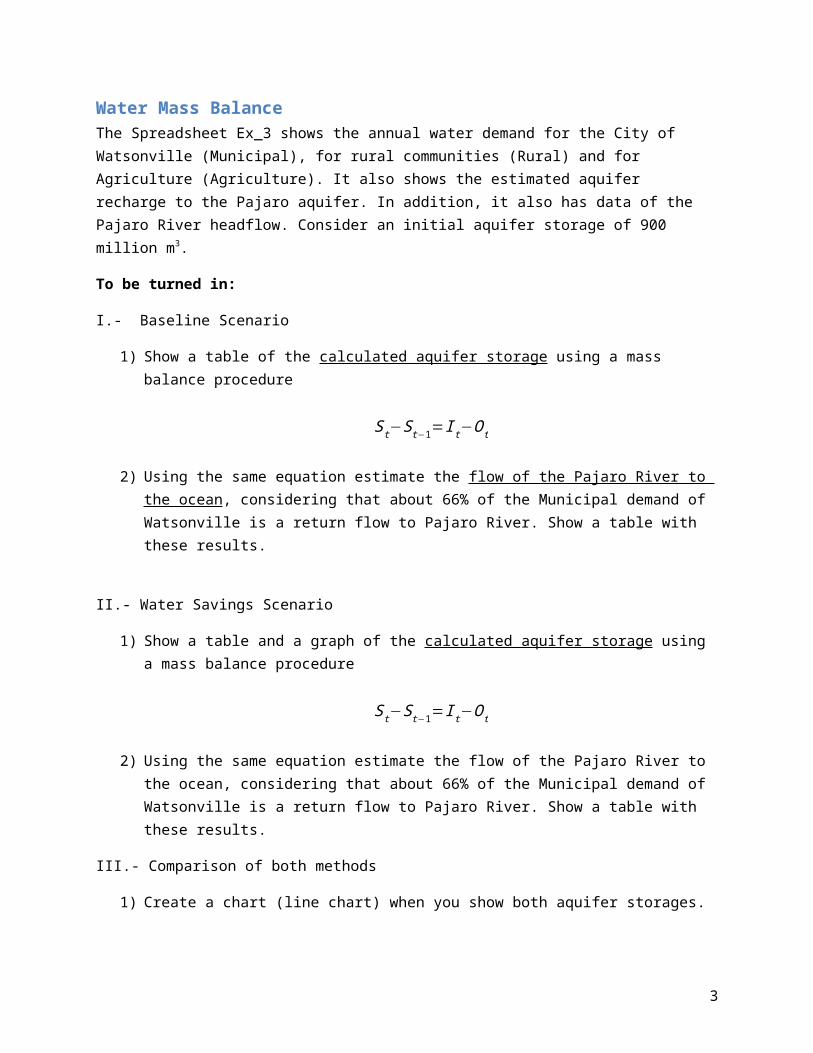
9) Same questions different figure. Take a look at the following figure and mention what other type of problem is causing overdraft? Explain your reasoning for your answer.
Do you think the space left in the aquifer storage by fresh water is left empty or is it occupied by other type of liquid, or is it compressed? Explain your reasoning for your answer.
4

Part II – System’s Operation and Water Allocation PoliciesThe aim of this exercise section is to explore basic concepts of operating and allocation policies. Using the water available for each user, you will define equations that allocate water for the river and among 3 users.
IntroductionThe water system is shown in Figure 1. There are 4 main water demands with different water requirements and priorities (Table 1).
Water DemandsPriority 1 3 3 2Name River User 1 User 2 User 3Nickname (Qt) (X1t) (X2t) (X3t)Volume 2 2.5 3 5
Figure 1This is description of the water allocation policy for the system shown in Figure 1.
River has the first priority, at least 2 units of water should be left in the river (if available) before the rest of the users can take their water demand. Once the water demand of all the user have been supplied, if there is any water available, then the remaining water will be left in the river.
User 3 has the second priority, and once the River has met its demand, then User 3 will take as much water up to meet its water demand, which is 5 units.
User 1 and User 2 share both the 3rd priority in the system. Once River and User 3 have met their water demands, then User 1 and User 2 will take as much water as they can in the same proportion up to their water demand is fulfilled, User 1 = 2.5 units of water and User 2 = 3 units of water.
To solve this exercise of water operation and allocation policy; first, you will estimate the allocation policy (Step 1), and second, you will copy and paste the formulas OR lookup this allocation policy when you are running the calculations (Step 2).
Qtin
5
Figure 2. Step 1, water allocation policy and Step 2, mass balance model.
Step 1
Step 2
6

Defining the water allocation policies.
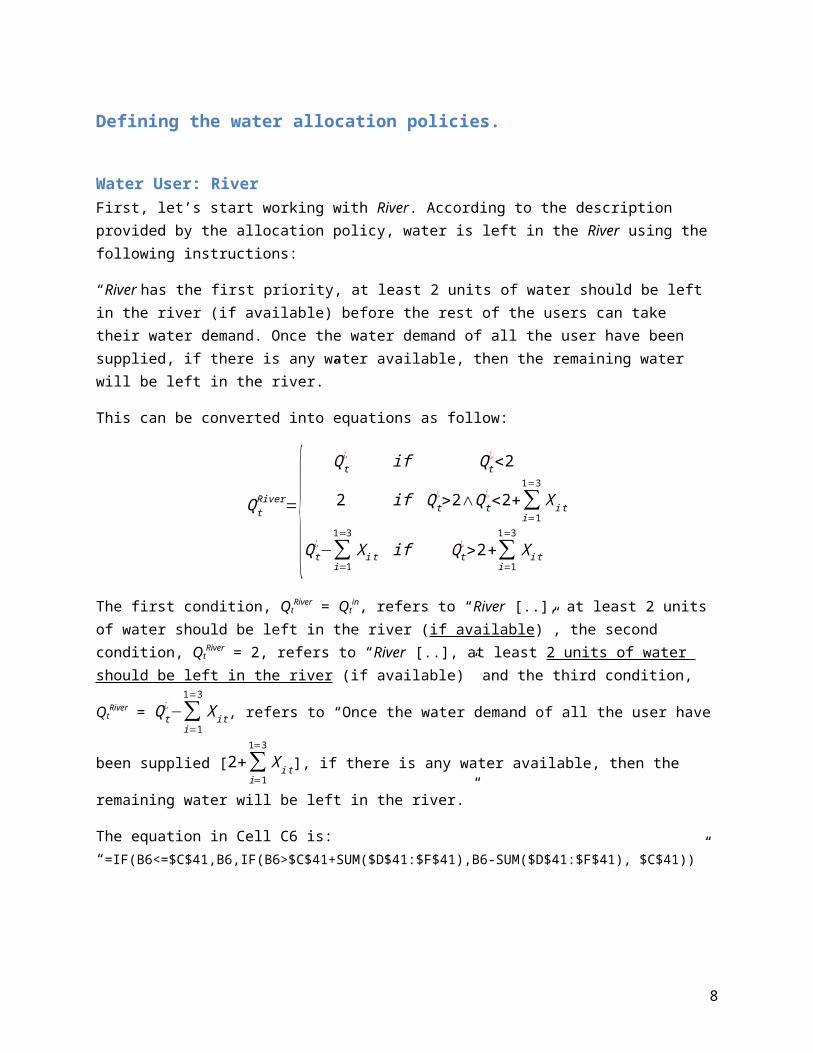
Water User: River First, let’s start working with River. According to the description provided by the allocation policy, water is left in the River using the following instructions:
“River has the first priority, at least 2 units of water should be left in the river (if available) before the rest of the users can take their water demand. Once the water demand of all the user have been supplied, if there is any water available, then the remaining water will be left in the river.”
This can be converted into equations as follow:
QtRiver={
Qt¿ if Qt
¿<2
2 if Qt¿>2∧Q t
¿<2+∑i=1
1=3
X i t
Qt¿−∑
i=1
1=3
X i t if Qt¿>2+∑
i=1
1=3
X i t
The first condition, QtRiver = Qt
in, refers to “River [..], at least 2 units of water should be left in the river (if available)”, the second condition, Qt
River = 2, refers to “River [..], at least 2 units of water should be left in
the river (if available)” and the third condition, QtRiver = Qt
¿−∑i=1
1=3
X i t, refers to “Once the water demand of
all the user have been supplied [2+∑i=1
1=3
X it], if there is any water available, then the remaining water will
be left in the river.”
The equation in Cell C6 is: “=IF(B6<=$C$41,B6,IF(B6>$C$41+SUM($D$41:$F$41),B6-SUM($D$41:$F$41), $C$41))”
7

Figure 3
The first part of this equation, grey box, refers to the first condition, the green box refers to the third condition, and if none of the previous conditions applied, then it applies the result from condition 2.
River t={Qt
¿ if Qt¿<2
2 if Qt¿>2∧Qt
¿<2+∑i=1
1=3
X it
Qt¿−∑
i=1
1=3
X i t if Qt¿>2+∑
i=1
1=3
X i t
Figure 4
Copy and paste this equation for the remaining of the column.
Figure 5
8
Water User: User 3According to the description provided by the allocation policy, User 3 has the second priority, and once the River has met its demand, then User 3 will take as much water up to its water demand is fulfilled, which is 5 units.
This can be converted into equations as follow:
X3 t={ 0 if Qt¿≤2
5 if Qt¿≥Qt
River+X3 t
Qt¿−Qt
River if Qt¿>Qt
River∧Qt¿<Qt
River+X3 t
The first condition, X3t=0, refers to “User 3 has the second priority, and once the River has met its demand, then User 3 […];” the second condition, X3t=5, refers to “User 3 [..] will take as much water up to meet its water demand, which is 5 units.” and the third condition, X3t=Qt
in-QtRiver refers to “User 3 […]
will take as much water up to its water demand is fulfilled, which is 5 units.”
The equation in Cell F6 is: “=IF(B6<=$C$41,0,IF(AND(B6>$C$41,B6<$C$41+$F$41),B6-$C$41,$F$41))”
Figure 6
The first part of this equation, grey box, refers to the first condition, the green box refers to the third condition, and if none of the previous conditions applied, then it applies the result from condition 2.
9

X3 t={ 0 if Qt¿≤2
5 if Qt¿≥Qt
River+X3 t
Qt¿−Qt
River if Qt¿>Qt
River∧Qt¿<Qt
River+X3 t
Figure 7
Copy and paste this equation for the remaining of the column.
Figure 8
10

Water User: User 1 and 2According to the description provided by the allocation policy, User 1 and User 2 share both the 3rd priority in the system. Once River and User 3 have met their water demands, then User 1 and User 2 will take as much water as they can in the same proportion up to meet their water demand, User 1 = 2.5 units of water and User 2 = 3 units of water.
For User 1, this can be converted into equations as follow:
X1 t={ 0 if Qt¿≤Qt
River+X3 t
2.5 if Qt¿−(QtRiver+X3 t )>X1 t+X2 t
(Qt¿−(Q tRiver+X3t ))×( X2t
X1 t+X2 t ) if Q t¿−(QtRiver+X3 t )<X1 t+X2 t∧Qt
¿>QtRiver+X3 t
For User2, this description can be converted unto equations as follows:
X2 t={ 0 if Qt¿≤Qt
River+X3 t
3 if Qt¿−(QtRiver+X3 t )>X 1t+X2 t
(Qt¿−(Q tRiver+X3 t ))×( X1 t
X1 t+X2 t ) if Qt¿−(QtRiver+X3 t )<X1 t+X2 t∧Qt
¿>QtRiver+X 3t
The first condition, X1t=0, refers to “Once River and User 3 have met their water demands , then User 1 and User 2 will take […];” the second condition, X1t=2.5, refers to “[…] User 1 and User 2 will take as much water as they can in the same proportion up to meet their water demand, User 1 = 2.5 units of water and User 2 = 3 units of water” and the third condition, refers to “[…] User 1 and User 2 will take as much water as they can in the same proportion up to meet their water demand, User 1 = 2.5 units of water and User 2 = 3 units of water”
The equation for User 1 in Cell D6 is: “=IF(B6<=$C$41+$F$41,0,IF(B6-($C$41+$F$41)>=$D$41+$E$41,$D$41,(B6-($C$41+$F$41))*($D$41/($D$41+$E$41))))”
11
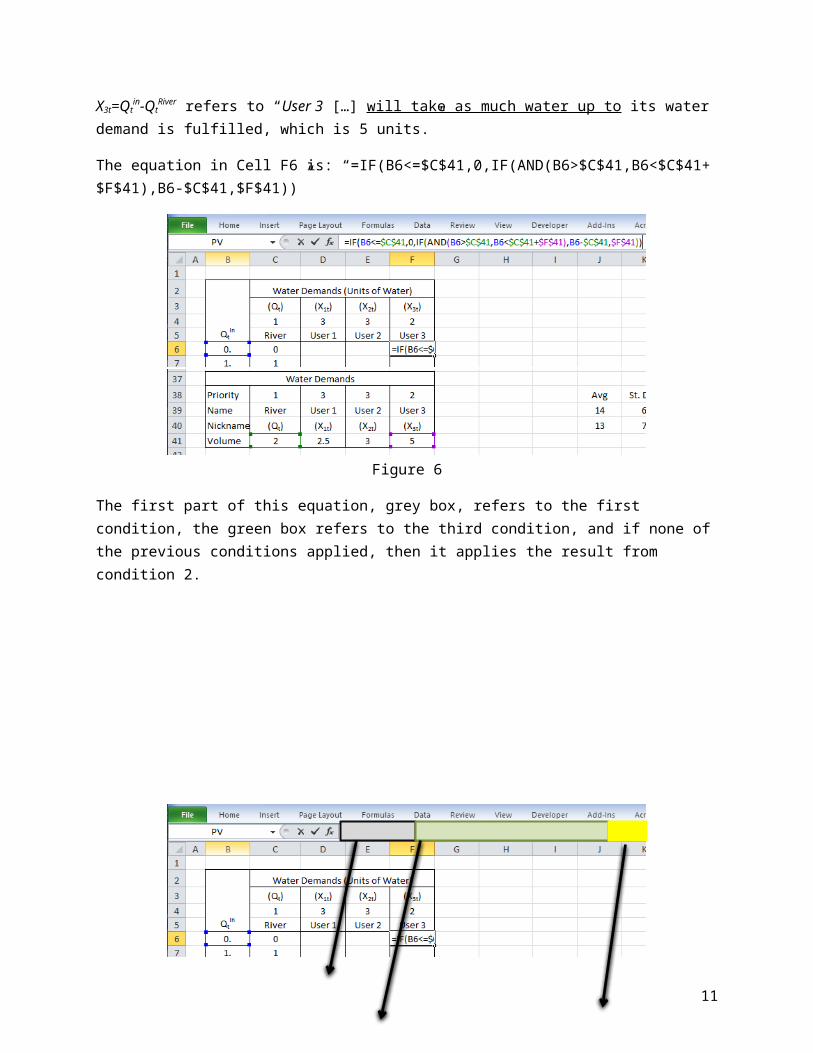
Figure 9
The first part of this equation, grey box, refers to the first condition, the green box refers to the third condition, and if none of the previous conditions applied, then it applies the result from condition 2.
X1 t={ 0 if Qt¿≤Qt
River+X3 t
2.5 if Qt¿−(QtRiver+X3 t )>X1 t+X2 t
(Qt¿−(Q tRiver+X3t ))×( X2t
X1 t+X2 t ) if Q t¿−(QtRiver+X3 t )<X1 t+X2 t∧Qt
¿>QtRiver+X3 t
The equation for User 2 is very similar to User 1, in Cell E6 is: “=IF(B6<=$C$41+$F$41,0,IF(B6-($C$41+$F$41)>=$D$41+$E$41,$E$41,(B6-($C$41+$F$41))*($E$41/($D$41+$E$41))))”
Copy and paste this equation for the remaining of the column.
12
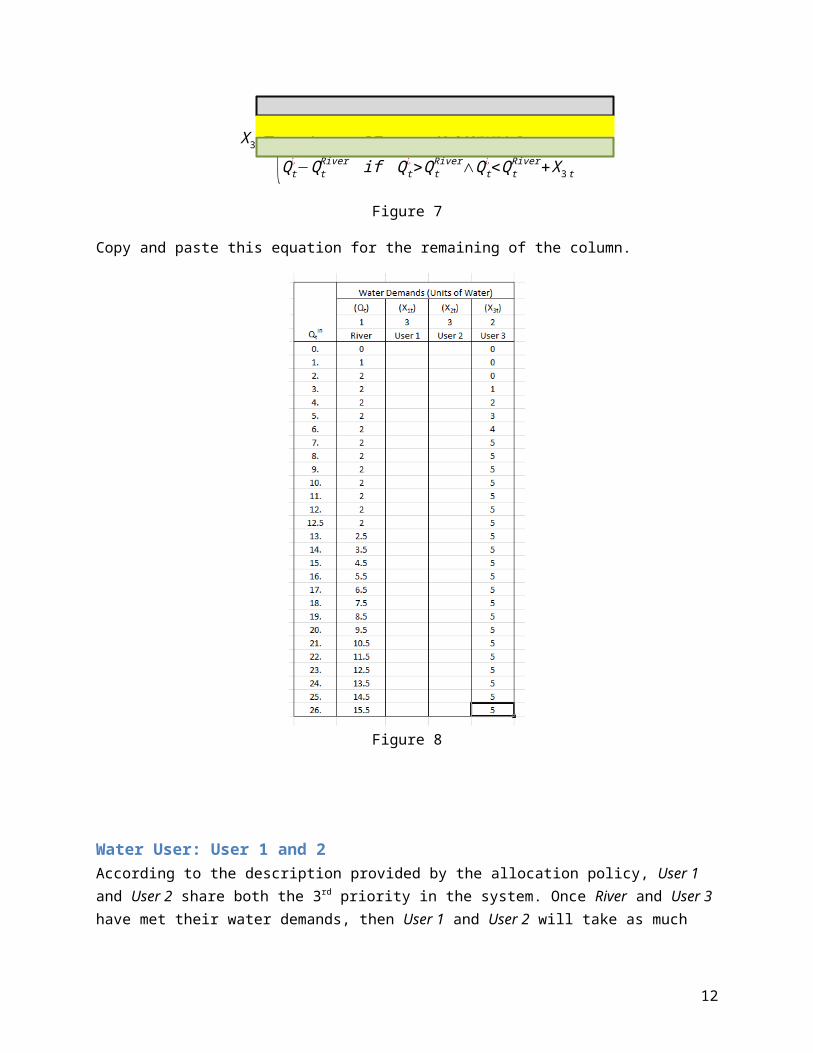
Figure 10
The graph should look like:
13
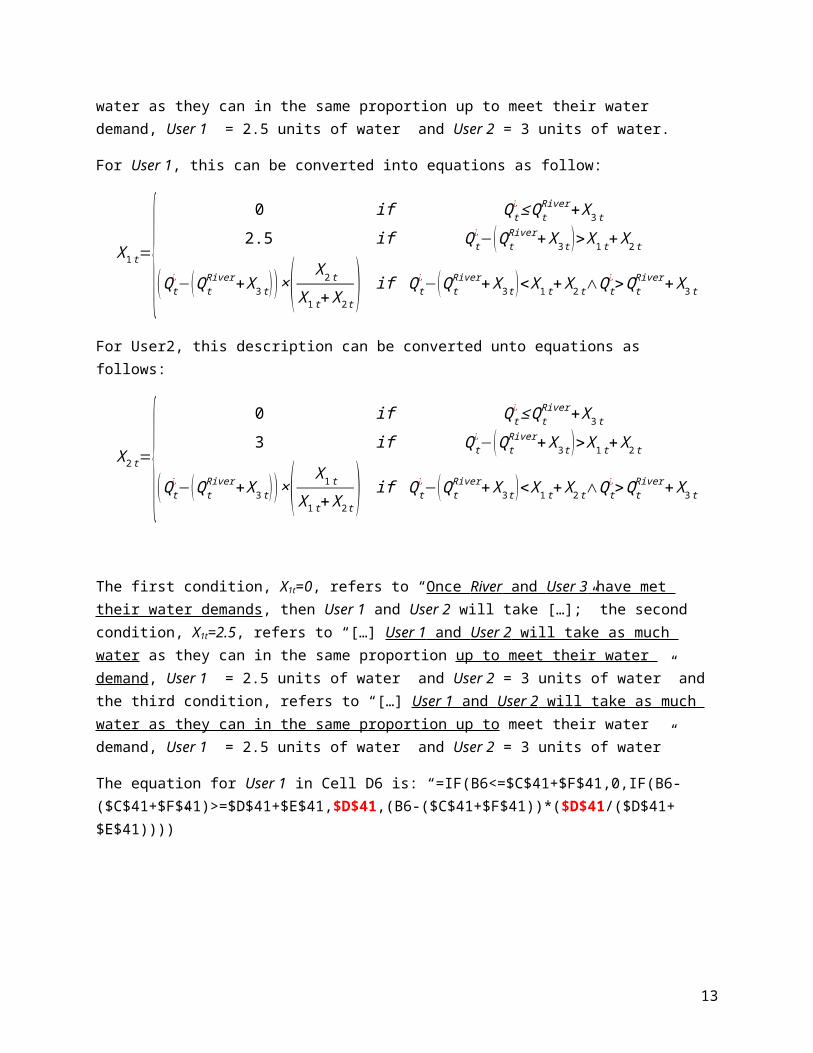
Figure 11
Linking the Water Allocation policy with the Mass Balance Model
There are two methods to use the allocation policy that was just derived into the mass balance model. Use EITHER of the following two methods, but only chose one, the one that you feel more comfortable using.
First MethodThe easiest way is to select cells C6 to F6 (C6:F6), copy (CTrl+C) and paste the formulas on cells into cells D45 to G45 (D45:G45).
Figure 12. On the left, Copy (Ctrl+C) cells C6 to F6, and paste them (Ctrl+V) into cells D45 to G45
And then use these cells (D45:G45) to copy then through the rest of the table.
14

Figure 13
Second MethodThe second way to do this, is a little bit more elegant, but still the same principle. This method is used, and it is very helpful, when managing large amount of water users. In this case, what you want is to have control of the water allocating policy in one table (B6:F33) and to recall values from this table in the mass balance model (B45:H65). You can create a “lookup” command that will find the values estimated in the allocation policy table. In cell D45, let’s insert a command that will look up for the value of Qt
River in the table water allocation table using the following equation:
“=VLOOKUP($C45,$B$6:$F$33,2,TRUE)”
What the previous command means, is that excel will lookup vertically (“VLookup”) for the Qtin value of
cell C45 (in this case 14) in the first column (it always start looking in the first column) of the table specified by the cell coordinates “$B$6:$F$33” (the green box in the following figure), and it will retrieve the value of column number 2 of the specified table, which is Qt
River, in this case for 14 is 3.5. When using this command, make sure to specify the column number that you want values to retrieve, and excel will always use the first column as the column to lookup for numbers, in this case, it will look for the “approximate” value in cell C45 on the first column of the table specified, that’s why at the end of the command you need to write “TRUE”.
15

Figure 14
For User 1, X1t, use the following equation in cell E45: “=VLOOKUP($C45,$B$6:$F$33,3,TRUE)”
For User 2, X2t, use the following equation in cell F45: “=VLOOKUP($C45,$B$6:$F$33,4, TRUE)”
For User 3, X3t, use the following equation in cell G45:” =VLOOKUP($C45,$B$6:$F$33,5, TRUE)”
Results from the Mass Balance model should look like the following pictures
16

Figure 15
Figure 16
To be turned in:
I .- For the River System.
1) Show a table like the one calculated in Figure 15 and the series of graphs calculated in Figure 16 2) Change the value of the River water demand (Qt
River ) to 4 units in cell C41. Show a table like the one calculated in Figure 15 and the series of graphs calculated in Figure 16. Does the water supply for User 3 change? How? Does it have less water supplied or more? Elaborate why there is a conflict with human and environmental water supply.
17

II.- For the River and Reservoir System
The same file has a system set up with a reservoir, with capacity K=25 units, and initial storage S0= 7 units, as shown below.
Water DemandsPriority 1 3 3 2Name River User 1 User 2 User 3
Nickname (Qt) (X1t) (X2t) (X3t)Volume 2 2.5 3 5
Figure 15
The only difference in the allocation policy is that for User 1, User 2 and User 3, you will have to substitute St-1+Qt
in instead of Qtin in each of the conditionals. For River, Qt
River, the water allocation changes as follow:
QtRiver={Qt
¿+St−1 if Q t¿+S t−1<2
2 if Qt¿+St−1≥2
In addition, reservoir spills must be calculated (Column G, Cells G6:G40) as follow:
QtSpill={ 0 if St−1+Q t
¿≤K+QtRiver+∑
i=1
i=3
X ¿
(S t−1+Qt¿)−(K+Qt
River+∑i=1
i=3
X ¿) if S t−1+Qt¿>K+Qt
River+∑i=1
i=3
X ¿
1) Please write down a paragraph explaining in plain words how the operation for River has changed, such as the one used in the River System:
18

“River has the first priority, at least 2 units of water should be left in the river (if available) before the rest of the users can take their water demand. [Insert here how the water allocation policy has changed for River].”Hint: In order for the river to receive extra water, does the reservoir have to spill?
2) Calculate the spills (Column G, Cells G6:G40) using the equation provided above.
3) Estimate the table for the water allocation policy (cells B2:H40) and show this table.
4) Estimate in column D the St-1+Qtin
.
5) Use any of the two methods explained above to link the water allocation policy table with the mass balance model for the River (E59:E79), User 1 (F59:F79), User 2 (G59:G79) and User 3 (H59:H79).
6) Using the mass balance equation, estimate the reservoir storage through every time step (I59:I79). Remember that the storage can’t exceed the storage capacity K=25 units.
7) Use any of the two methods explained above to link the water allocation policy table with the mass balance model for Reservoir spills (J59:J79),
8) Display the mass balance results, like figure 15 and 16.
9) Similarly, does the water supply for Users 1, 2 and 3 improved if the reservoir is built? Show a comparison of the water supply for both systems (With and without a reservoir Qt
River = 2 units in both calculations)
10) What about the River? Does the river improve their water supply?
19