Part 111 Background paper for the working group...
32
Part 111 Background paper for the working group sessions" ---_------_____ 151 * Working group B: Multistage production character of extensive grazing
Transcript of Part 111 Background paper for the working group...

Part 111 Background paper for the working group sessions"
---_------_____ 151 * Working group B: Multistage production character of extensive grazing

I 152

Working group B: Multistage production character of extensive grazing
Grasslands of Indonesia and the effect of animals on their stability
by Graeme J. Blair, University of N e w England, Armidale, Australia. Tatang lbrahim and Daniel Bulo, Balai Penelitian Ternak, Bogor, I nd o nesi a. Wenten Rudolf, Udayana University, Denpasar, Bali, Indonesia.
Grasslands of Indonesia One of the major difficulties encountered in estimating the area of grassland in a country is to arrive at some concensus as to what constitutes grassland. Nel1 and Rollinson (1974) presented estimates of the grassland area of Indonesia which varied from 4.10m ha to 25.34m ha. Clearly there is a need to reach agreement on what constitutes the various land classification units if survey data is to be of use to planners, etc. Soepraptohardjo (1 972) mapped the savanna and savanna woodland area as shown in Figure 1. The estimate of such area varied slightly depending on whether the planimeter or cut and weight method was used. Estimates of the grassland area in various regions has been made by Soepraptohardjo (1972) and Schwaar (1973). There is general agreement between both authors except for the provinces of Sulawesi, Nusa Tenggara and Irian Jaya (Table
Part of this variation in estimated grassland area can be attributed to incomplete survey data but a major source of variation appears to result from differing definitions of grassland. Examples of the definition of the ‘grassland’ area used in various surveys in,Indonesia is presented in Table 2.
1).
Table I: Estimated area of grassland in various regions of Indonesia.
Region Area of grassland (m.ha) as estimated by: Schwaar (1 973) Soepraptohardjo (1972)
Java and Madura Sumatra Kalimantan Sulawesi Bali Nusa Tenggara Maluku Irian Jaya
0.40 7.20 5.53 3.96 0.24 2.52 0.81 ,
0.44
0.44 7.25 5.29 4.67 0.21 3.78 0.18 0.04
Indonesia 21.09 23.51
153
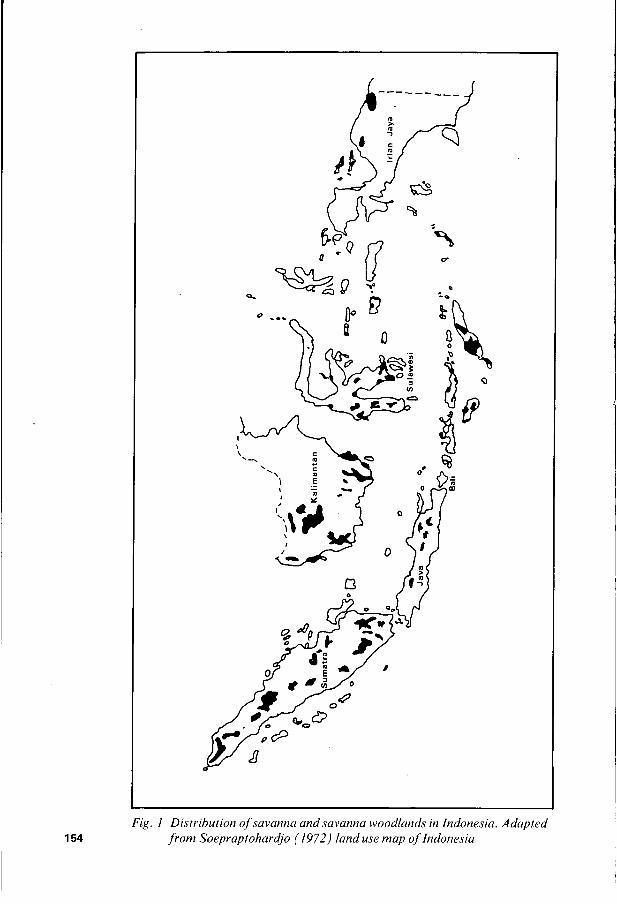
Fig. I Distribution ojsavanna andsavanna woodlunds in Indonesia. Adapted 154 j r o m Soepraptohardjo (1972) land use map ofIndonesia
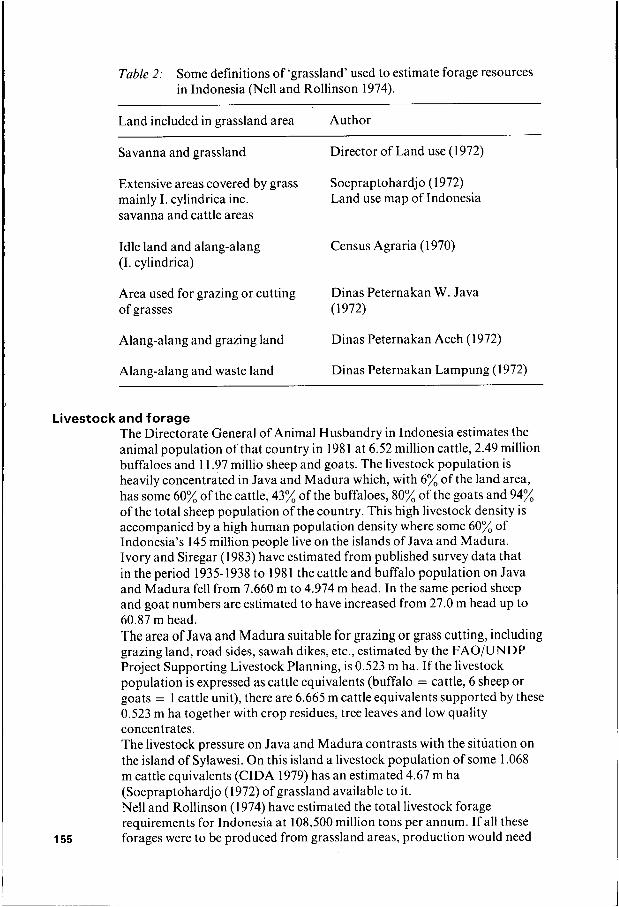
Table 2: Some definitions of ‘grassland’ used to estimate forage resources in Indonesia (Nel1 and Rollinson 1974).
~~
Land included in grassland area
Savanna and grassland
Author
Director of Land use ( 1 972)
Extensive areas covered by grass mainly I. cylindrica inc. savanna and cattle areas
Soepraptohardjo (1972) Land use map of Indonesia
Idle land and alang-alang (I. cylindrica)
Census Agraria (1 970)
Area used for grazing or cutting of grasses ( 1 972)
Dinas Peternakan W. Java
Alang-alang and grazing land Dinas Peternakan Aceh ( 1 972)
Alang-alang and waste land Dinas Peternakan Lampung (1972)
Livestock and forage The Directorate General of Animal Husbandry in Indonesia estimates the animal population of that country in 1981 at 6.52 million cattle, 2.49 million buffaloes and 1 1.97 millio sheep and goats. The livestock population is heavily concentrated in Java and Madura which, with 6% of the land area, has some 60% of the cattle, 43% of the buffaloes, 80% of the goats and 94% of the total sheep population of the country. This high livestock density is accompanied by a high human population density where some 60% of Indonesia’s 145 million people live on the islands of Java and Madura. Ivory and Siregar (1983) have estimated from published survey data that in the period 1935-1938 to 1981 the cattle and buffalo population on Java and Madura fell from 7.660 m to 4.974 m head. In the same period sheep and goat numbers are estimated to have increased from 27.0 m head up to 60.87 m head. The area of Java and Madura suitable for grazing or grass cutting, including grazing land, road sides, sawah dikes, etc., estimated by the FAO/UNDP Project Supporting Livestock Planning, is 0.523 m ha. If the livestock population is expressed as cattle equivalents (buffalo = cattle, 6 sheep or goats = 1 cattle unit), there are 6.665 m cattle equivalents supported by these 0.523 m ha together with crop residues, tree leaves and low quality concentrates. The livestock pressure on Java and Madura contrasts with the situation on the island of Sylawesi. On this island a livestock population of some 1 .O68 m cattle equivalents (CIDA 1979) has an estimated 4.67 m ha (Soepraptohardjo (1972) of grassland available to it. Nel1 and Rollinson (1974) have estimated the total livestock forage requirements for Indonesia at 108,500 million tons per annum. If all these forages were to be produced from grassland areas, production would need 155

to be 4.61 t/ha. The major areas of grassland are found in Sumatra and Sulawesi and these areas provide the greatest opportunity for expansion of livestock enterprises. Much of the grassland is classified by Soepraptohardjo (1 972) as savanna or savanna woodland which has formed following the destruction of the primary forest. These grasslands are maintained in many areas by dry season fires and this, together with poor grazing and cutting management, leads to the invasion by Imperata cylindrica. It has been estimated that 16m ha of land in Indonesia has Imperata cylindrica either as a dominant or minor component of the grassland with an annual increase of O. 15m ha, mostly as a result of shifting cultivation practices (Soerjani 1970). Little research has occurred in the savanna areas of Indonesia with no extensive systematic study of their botanical composition, ecology and seasonal variation in yield and quality. The botanical composition of savanna areas on the larger islands in the Nusa Teggara region has been surveyed by Bonnemaison (1961). He found that the best grazing lands were dominated by Paspalum spp., Axonopus compressus, Chloris barbata and Eleusine indica with only a few legume species such as Desmodium heterophyllum, Rhynchosia minima and Indigofera spp. The tall savannas are dominated by Themeda, Sorghum, Heteropogon, Chrysopogon and Imperata species and contain additional legume species such as Urarin lagopodioides, Atylosia scarabaeoides and Alysicarpus spp. Less dominant grass species include Andropogon spp., Polytrias amaura, Dichanthium caricosum, agrostis spp., Panicum spp., and Setaria spp. Prawiradiputra et al. (1979) surveyed the botanical composition of three grassland areas in South Sulawesi. The dominant species were Paspalum conjugatum and Axonopus compressus, suggesting that these areas had been overgrazed. In Irian Jaya the main native or naturalized species are Andropogon acciculatus, Impera tu cylindrica, Axonopus compressus, Cynodon dactylon and Paspalum conjugatum with other important species including Polytrias amaura, Themeda spp., Saccharum spontanum and Heteropogon contortus occurring in the less heavily grazed savanna areas. Because Imperata cylindrica (called alang-alang in Indonesia) is such a dominant species in the savanna areas of Indonesia and an important weed of cultivation, it has received the most research interest. Many papers have been written on its biology, ecology and chemical control in plantation crops (see ‘Proceedings of Workshop on alang-alang’ by BIOTROP, Bogor, Indonesia, 1980) and its role in animal production in South East Asia has been reviewed by Falvey (198 I) . The most obvious method of increasing the productivity of alang-alang dominated savannas is through the introduction of better legume and grass species through oversowing or partial or complete renovation. The introduction of legumes is a first step in low cost extensive pasture improvement.
The effect of fertilizers and animals on pastures Experiments conducted by Blair et al. (1978) showed that the yields of oversown Centrosema pubescens could be increased substantially by the application of sulfatic fertilzer (Table 3). The increased yield of Centro 156
I
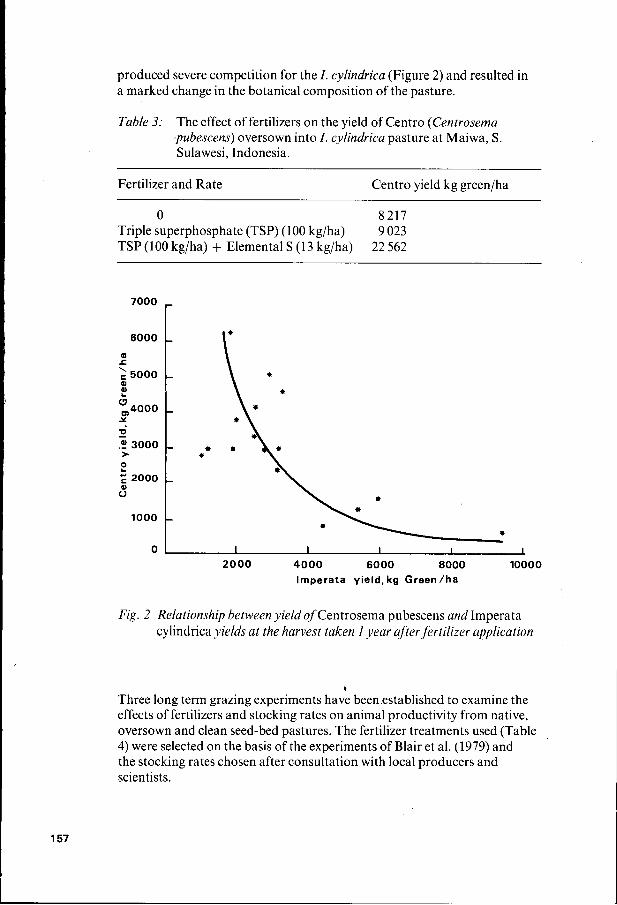
produced severe competition for the I . cylindrica (Figure 2) and resulted in a marked change in the botanical composition of the pasture.
Table 3: The effect of fertilizers on the yield of Centro (Centrosema -pubescens) oversown into I. cylindrica pasture at Maiwa, S. Sulawesi, Indonesia.
Fertilizer and Rate Centro yield kg green/ha
O 8 217 9 023
22 562 Triple superphosphate (TSP) (100 kg/ha) TSP (100 kg/ha) + Elemental S (1 3 kg/ha)
7000 r 6000
L
z4000 * o ,E 3000 >.
t; 2000 (Y o
1000
0 1 I I I I 1
2000 4000 6000 8000 10000 lmperata yield, kg Green/ha
Fig. 2 Relationship between yield of Centrosema pubescens and Imperata cylindrica yields at the harvest taken I year after fertilizer application
e
Three long term grazing experiments have been established to examine the effects of fertilizers and stocking rates on animal productivity from native, oversown and clean seed-bed pastures. The fertilizer treatments used (Table 4) were selected on the basis of the experiments of Blair et al. (1979) and the stocking rates chosen after consultation with local producers and scientists.

Table 4: Treatment combinations used in Indonesia in grazing experiments.
Treatment
Maiwa and Siwa Kabaru Pasture Type
Native (all sites) O or 30 kg S/ha/yr as Elemental S 0.5 or 1 Au*/ha
O or 25 kg TSP/ha/yr
0.5 or 1 Au/ha
Oversown (Siwa and Karabu) kg S/ha/yr O or 50 kg TSP/ha/yr Year 1 2 3 4 A O 0 0 0 B 15 15 15 15 C 30 15 15 15 D 30 30 30 30
1 or 2 au/ha 1 or 1.5 Au/ha
, Prepared seed-bed (all sites)
kg S/ha/yr Year 1 2 3 4 A O 0 0 0 B 15 15 15 15 C 30 15 15 15 D 45 30 30 30
O or 50 kg TSP/ha/yr
2 or 3 Au/ha A** 1.5 or 2 Au/ha B** I or 1.5 Au/ha
* Au = weaner heifer 150-200 kg liveweight a t the start of each grazing year.
** A = Siratro dominant pasture. B = I . cylindrica dominant pasture.
Stocking rates are varied by altering plot size to give three animals/ plot. Stock are maintained on the pasture throughout the year. Because of the difference in total rainfall and distribution throughout the year a t each site (Table 5), grazing pressure varies markedly both between sites and within years at each site. P
Table 5: Mean monthly and total rainfall (mm) at each grazing site.
Location J F M A M J J A S O N D T o t a l
Maiwa(Rappang) 133 140 170 375 230 150 120 50 110 133 120 75 1906 Siwa (Sengkans) 175 128 93 66 51 35 122 232 297 223 255 100 1777 Kabaru(Melo1o) 154 145 132 96 39 49 26 5 1 8 47 116 818

100
90
80
70
6 0
5 0
40
30
20
10
O
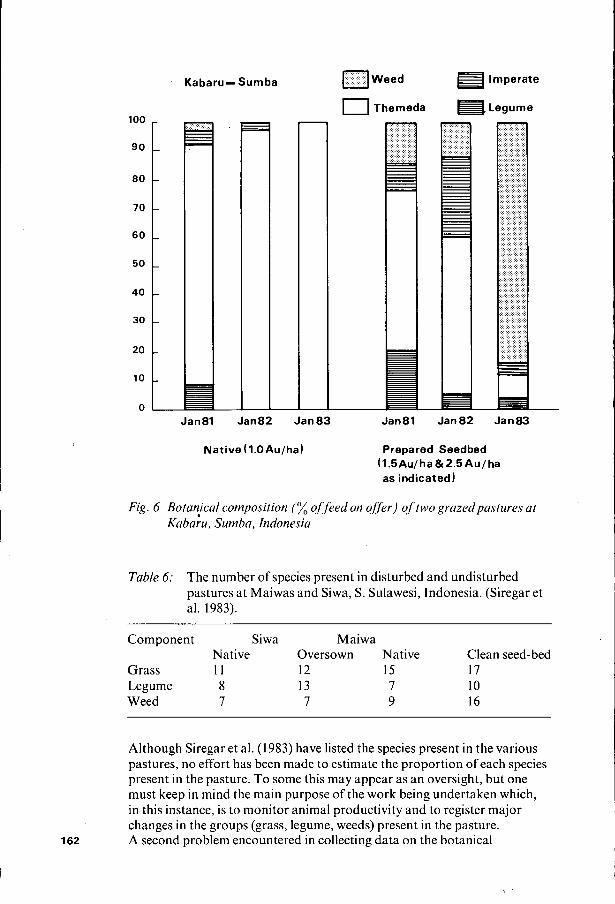
K a b a r u l Sumba 0 Weed lmperate
0 Themeda Legume
Jan81 Jan82 Jan83 Jan81 Jan82 Jan83
Native (l.OAu/ha) Prepared Seedbed (1.5AuIha & 2 . 5 A u f ha as indicated)
Fig. 6 Botanical composition of feed on o f f r ) of two grazedpastures at K a b a k , Sumba, Indonesia
Table 6: The number of species present in disturbed and undisturbed pastures at Maiwas and Siwa, S. Sulawesi, Indonesia. (Siregar et al. 1983).
Component Siwa Maiwa
Grass 1 1 12 15 17
Weed 7 7 9 16
Native Oversown Native Clean seed-bed
Legume 8 13 7 I O
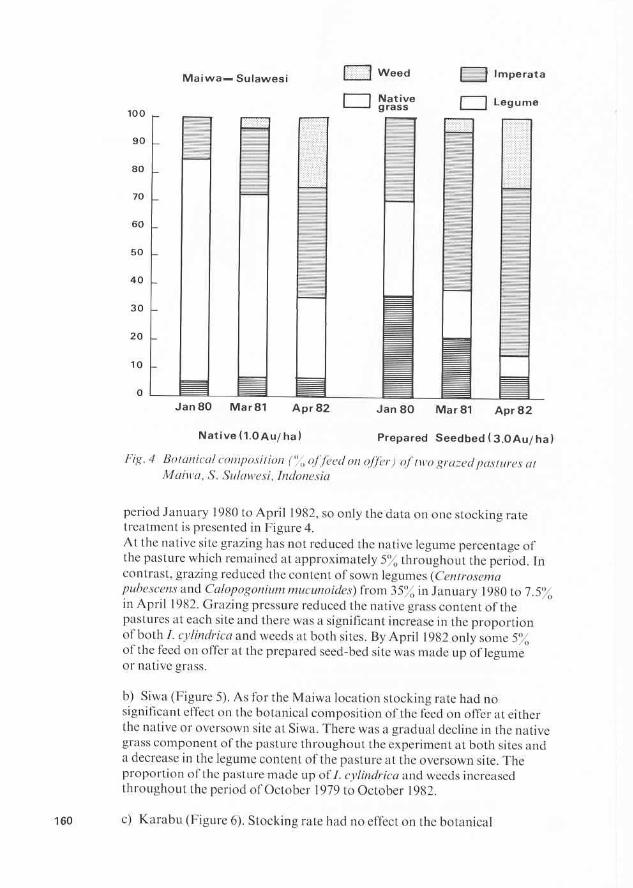
Although Siregar et al. (1983) have listed the species present in the various pastures, no effort has been made to estimate the proportion of each species present in the pasture. To some this may appear as an oversight, but one must keep in mind the main purpose of the work being undertaken which, in this instance, is to monitor animal productivity and to register major changes in the groups (grass, legume, weeds) present in the pasture. A second problem encountered in collecting data on the botanical 162
composition of feed on offer is that one is measuring what remains after grazing rather than what is actually growing. Despite the large number of grazing experiments conducted throughout the world there is still no universally acceptable method of overcoming this problem. At one extreme there is the use of enclosures but this has the deficiency that the growth of some species in the enclosure may be very different from that in the grazed pasture. At the other extreme there is the use of oesophageal fistulated animals. In this case, the separation of ingests into botanical components presents its own set of problems.
References Blair, G.J., Paulillin, P. and Samosir, S. (1978). Theeffect ofsulfur fertilization on the yield and botanical composition of pastures in S. Sulawesi, Indonesia. Agron. J . 70: 559-562. Bonnemaison, P. (1961). Report to the Government of Indonesia on Grassland and Fodder Development. FAO No. 1448. CIDA. Sulawesi Regional Development Study. V01.2. Canadian International Development Agency. Falvey, J.L. ( 1 98 1). Imperata cylindrica and animal production in South East Asia. Haydock, K.P. and Shaw, N.H. (1975). The comparative yield method for estimating dry matter yield of pasture. Aust. J. Exp. Agric. Anim. Husb.
Ivory, D. and Siregar, M.E. (1983). Forage Research in Indonesia: Past and Present. KKU-FFTC Seminar ‘Recent Advances in Pasture Research in S.E. Asia’. Bangkok, Thailand. August 1983. Nell, A.J. and Rollinson, D.H.L. (1974). The requirements and availability of livestock feed in Indonesia. UNDP/FAO Project INS/72/009 Supporting Livestock Planning Working Paper. Prawiradiputra, B.R. Siregar, M.E. and Manurung, T. (1 979). Komposisi botanis padang rumput alam dis tiga daerah penggembalaan di Sulawesi Selatan. Bull L.P. Peternakan 22: 1 - 17. Schwaar, D.C.( 1973). Land capability appraisal Indonesia - Land use appraisal, FAO. Bogor, Indonesia. Siregar, M.E. Bambang, R. Prawiradiputra, B.R., Nurhayati and Kuswandi (1983). The effect of pasture management on species presence in pastures at Siwa and Maiwa, S. Sulawesi. Ilmu dan Peternakan 1 (3). Soepraptohardjo, M. (1 970) Alang-alang (Imperata cylindrica ( L ) Beuuv.). Pattern of growth as related to its problem of control. BIOTROP Bull. No. I .
15: 663-670.
Bogor, Indonesia. Soepraptohardjo, M. (1972). The land use map of Indonesia Research Inst., Bogor, Indonesia.
972. Soil
163

1 64 I

1 Evaluation rangeland as fees I resource for livestock production
by J.J.M.H. Ketelaars Centre for Agrobiological Research, Wageningen, The Netherlands.
I Introduction Rangeland evaluation is often based on available biomass without taking into account differences in quality for ruminant nutrition. Even in a very recent paper on pastoralism and pastoral economics (Lamprey, 1983), carrying capacity of ecoclimatic zones in Africa for both animal and human populations were derived solely from biomass data, completely disregarding differences in nutritional quality in different pastures. An evaluation based on this concept is clearly of limited value. In fact, i t could be misleading as there is generally a negative correlation between quality and quantity of herbage produced as already illustrated in the preceding paper. That presentation emphasized that this rule especially applies to tropical semi-arid rangelands which again will be the pastures of reference for this second paper.
1 I
Animal production is determined both by quantity and quality of available feed resources. Feed quality is, however, a relative notion. For production or even for maintenance feed quality or feed value may be negative, for survival feed value will almost always be positive. Nitritional quality therefore obviously depends on the plane of nutrition which is aimed at. So, low quality as is common for most of the time on semi-arid pastures, should not be considered in absolute terms, but in relation to a certain production system; and clearly animals will die much sooner if feed is completely lacking than if feed is of whatever low quality. Thus the total amount of feed produced cannot be ignored in an evaluation of rangelands; in fact it will remain of primary concern. However, a more complete assessment of productive potential for different systems of livestock production requires a careful consideration of nutritional quality of available feed resources in relation to the required plane of nutrition.
The fact that feed value is related to the desired plane of nutrition is well recognized in intensive livestock production systems. For more extensive systems using primarily feed resources from rangelands, much less insight seems to exist - at least within the scientific community - in the relation between level and type of ruminant production on the one hand (high output vs. low output, beef operation vs. dairy operation, sheep vs. cattle) and quality of available feed resources on the other hand. However, it is by no means less important. For instance minimum requirements for feed quality will be different for a profitable level of production in a large scale beef cattle operation than for a viable pastoral economy in which a continuous milk supply is a major production goal. It could thus be postulated that for each type of livestock enterprise with its present technology and labour availability some minimum level of primary production in terms of both quantity and quality of feed resources is necessary for survival. So, a more detailed system 165

of rangeland evaluation should recognize feed quality as a basis for distinguishing differences in pasture potential for various systems.of livestock production.
This observation points to two broad areas of research. First a better understanding is necessary of individual animal performance in relation to the seasonally changing quantity and quality of available feed resources in a certain system. Secondly, we should investigate the critical levels of individual performance which determine the feasibility of a certain livestock enterprise. In combination, this analysis should lead to a more meaningful land suitability assessment for different systems of livestock production. For example, the annual weight increase of growing cattle will be a function of nutritional quality of the available forage. Depending on production costs per head and the price of meat, this rate of weight gain and the resultant slaughter age may make a fattening unit profitable or not. Similarly to annual weight changes, calving rate and milk yield per head are a function of the nutritional regime or, in other words, strongly environmentally determined. These characteristics, in combination with the age of first calving, the reproductive life length and the seasonal distribution of calvings, determine the minimum number of female cattle, a pastoral family needs to survive on essentially a milk diet. This minimum number varies in relation to small changes in its compounding characteristics as for instance shown by the herd productivity models of Dah1 and Hjort (1976). It must be concluded that the effect of pasture biomass on both animal and human populations cannot be evaluated without prior knowledge of nutritional quality and its effect on animal productivity. This paper concentrates on quality aspects of rangeland production from a ruminant nutritional point of view. As part of our ongoing systems research into primary and secondary production of semi-arid pastures we shall try to develop some general concepts with regard to ruminant nutrition on natural rangelands. This research is part of a joint project between the ‘Centre for Agrobiological Research’, Wageningen, the ‘International Livestock Centre for Africa’, Addis Ababa, and the ‘Institut du Sahel’, Bamako.
Nutritional limits to ruminant prodution In the absence of pests and diseases animal production is largely a function of the intake of digestible nutrients. Identifying the limits to animal production is therefore synonymous to establishing absolute limits to the uptake of nutrients from a given feed source. This takes us to the basic question of control of feed intake in ruminants, a subject ofextensive research over the last four decades. This research has resulted in a large body of information on factors, affecting feed intake, but a consistent overall theory of control mechanisms is still lacking. Two important concepts have been stressed in past and current reviews on this topic: 1) the existence of a physical control operating on most roughages and 2) the existence of a physiological control associated with highly digestible concentrate diets. The essential idea underlying a physical control of feed intake is the assumption that the large indigestible portion of most roughages restricts animal consumption of dry matter and consequently of digestible dry matter. So,,the capacity to process indigestible matter would 166
I

167
be the limiting factor for the uptake of digestible nutrients. A physiological control could be operative in situations where demand for nutrients (for maintenance and production) would be met from available, highly digestible feed. The animal then would not be restricted by feed composition, but by its physiological potential to absorp and utilize digestible nutrients. Evidence for the existence of such a physical control on feed intake is derived from the often observed positive correlation between dry matter intake and feed digestibility. However, examination of available experiments soon reveals that this relation varies widely, so that there is no unique and absolute relation between dry matter intake and feed digestibility. One could argue that such variability could be expected on the basis of differences in eating capacity, rumen volume and passage rate between individual animals or breeds of animals. However, a more careful examination may offer an alternative explanation.
As we hope to demonstrate in the next paragraphs, feed intake of growing cattle can be explained from the relative availability of energy and protein in the feed and the capacity of the animal to utilize energy and protein in a certain ratio. Evidence is presented that feed intake and consequently production of growing cattle on natural feeds is almost always protein- limited. We will not present a full discussion on the pros and cons for a physical regulation of feed intake, but a few remarks seem appropriate. If the theory of a physical control would be valid, ruminants would be anatomically ill- structured: there stomach size would be inadequate to take full profit of available low quality feeds as they are common in their natural environment. From an evolutionary point of view they would appear to be very inefficient as their reproductive success and chances of survival could be greatly enhanced by a simple anatomical adaptation. To create an animal with a bigger stomach and consequently a higher eating capacity would not even require genetic changes as shown by the observed flexibility in gut size in response to changes in nutrient demand within the same animal, for instance during lactation. So, one could hypothesize that a physical restriction on feed intake in a natural environment is unlikely to be of great importance. Offering animals aspecific feeds, i.e. feeds which they do not select in a natural environment, as is probably often done in trials with sheep, may change this picture.
The second remark deals with the experimental work Conrad, Pratt and Hibbs (1964), who strongly emphasized the distinction between a physical and a physiological control of feed intake in lactating cattle. Their results have been widely quoted and used in cattle production models. However, as shown by Mertens (1973), their statistical analysis of data was incorrect. Re-analysis of their original data is necessary to determine whether their conclusions are appropriate. In order to clear up current opinions about the relation between feed intake and feed composition we decided to collect from the literature experiments, which measured feed intake in growing cattle. Selection criteria were only a few: animals should be in a growing fase, non-lactating and non-pregnant,
168 I
feeds should be all roughage, not processed or chemically treated, except for coarse chopping, digestibility should be measured in vivo. The data were used irrespective of breed or location. So the collection includes data of both temperate and tropical animal breeds feeding on temperate as well as tropical grasses and legumes. This was deliberately done in order to obtain sufficient data to discover all possible patterns between intake and feed composition, which could otherwise be obscured by the large experimental variation caused by the complexity of feed intake mechanisms.
The results from this literature review are first presented in the relation between intake of digestible dry matter on a metabolic weight basis (DDMI) and nitrogen concentration of the feed (%N). This relation was preferred above a relation between DDMI and digestibility (DIG), because nitrogen concentration is a reliable and objective feed characteristic, which unlike digestibility is independent of animal characteristics (type, level of intake). Moreover, our knowledge of the dynamics of nitrogen in crops and vegetations is much more accurate than that of digestibility. If a simple relation between feed intake and nitrogen content could be established this would allow a rapid translation of this type of knowledge into animal productivity data. The relation between DDMI and %N of the feed is shown in the upper right hand quadrant of Figure 1. To us it was surprising that such a heterogeneous data source results in a fairly clear relation between the maximum intake of digestible dry matter and the nitrogen concentration of the feed. Evidence that the line drawn in the first quadrant indeed represents an upper limit to intake of digestible dry matter, at least up to about 1.3 %N of the feed is reinforced by results from feeding trials of Elliott (1967) in Zimbabwe. In an experiment with growing heifers he fed animals three different levels of digestible protein in four different rations of increasing digestibility. To obtain these 12 combinations of digestible crude protein and dry matter digestibility he used Rhodes grass hay of O.5%N and different concentrate mixtures. The aim of his experiments was to examine how much energy (digestible dry matter) growing cattle would be able to consume at fixed levels of protein supply. At the two lower levels ofprotein supply he found a maximum energy uptake, which at the upper protein level did not seem to be reached yet. We re- analysed his data to obtain the relation between DDMI and %N and those results, indicated by the connected points in Figure 1, fitted the general picture very well. We shall now proceed with an explanation for this maximum intake of digestible dry mater at a given nitrogen concentration in the feed.
For this purpose we plotted in the lower right hand quadrant of Figure 1, sharing the nitrogen concentration axis with the upper quadrant, the nitrogen intake of the same feeds increasing in downward direction, again expressd on a metabolic weight basis. Now we can observe the trend in DDMI and nitrogen intake for a range of feeds at a constant nitrogen concentration, but of increasing digestibility. For this range of feeds intake of digestible dry matter increases as the result of both a higher dry matter intake and a higher digestibility, whereas the intake of nitrogen increases only due to
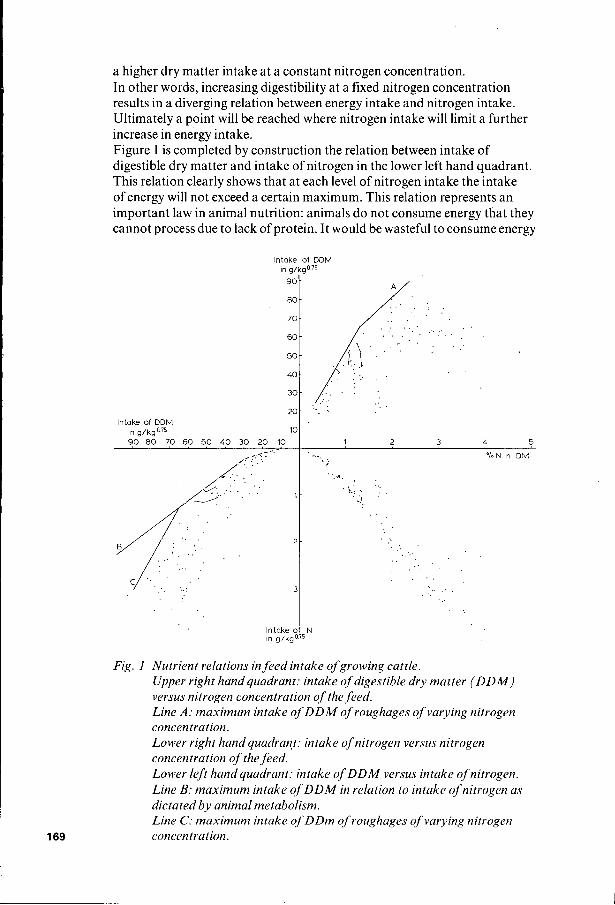
a higher dry matter intake at a constant nitrogen concentration. In other words, increasing digestibility at a fixed nitrogen concentration results in a diverging relation between energy intake and nitrogen intake. Ultimately a point will be reached where nitrogen intake will limit a further increase in energy intake. Figure 1 is completed by construction the relation between intake of digestible dry matter and intake of nitrogen in the lower left hand quadrant. This relation clearly shows that at each level of nitrogen intake the intake of energy will not exceed a certain maximum. This relation represents an important law in animal nutrition: animals d o not consume energy that they cannot process due to lack of protein. It would be wasteful to consume energy
Intake of DDM in g/kg0l5
90
80
70
60
50
40
30
20
-
-
-
-
-
-
-
-
. . . .
.. .. . . .
I Intake of N in g/kg0l5
Fig. 1 Nutrient relations in feed intake of growing cattle. Upper right hand quadrant: intake of digestible dry matter ( D D M ) versus nitrogen concentration of the feed. Line A: maximum intake o f D D M of roughages of varying nitrogen concentration. Lower right hand quadrant: intake of nitrogen versus nitrogen concentration of the feed. Lower left hand quadrant: intake of DDM versus intake of nitrogen. Line B: maximum intake of DDM in relation to intake of nitrogen as dictated by animal metabolism. Line C: maximum intake of DDm of roughages of varying nitrogen concentration.

170 I
which only requires energy to get rid of. The animal would presumably even be poisoning itself, if it did not have a protective mechanism against over- consumption of energy.
At first glance one could conclude that only feeds of which intake data are close to the maximum lines in Figure I , are really nitrogen deficient. But in view of experience with nitrogen supplementation this is very unlikely. So the next step in our analysis is to examine the energy intake of feeds of similar digestibility at widely varying nitrogen concentrations. For this purpose we plotted part of the data in more detail in Figures 2 and 3 , distinguishing four digestibility classes, chosen in such a way that a maximum number of feeds over a range of nitrogen concentrations is included. From Figures 2 and 3 , a certain pattern seems to emerge: within one digestibility class energy intake first increases steeply with increasing nitrogen concentration up to a certain nitrogen concentration after which a much
Intake of DDM in g/kg 0.75 90
80
70
6 0
50
40
30
2 0
10
O
6" 0 O0 6" 0 O0
A
c ' dg=0.85 0 .
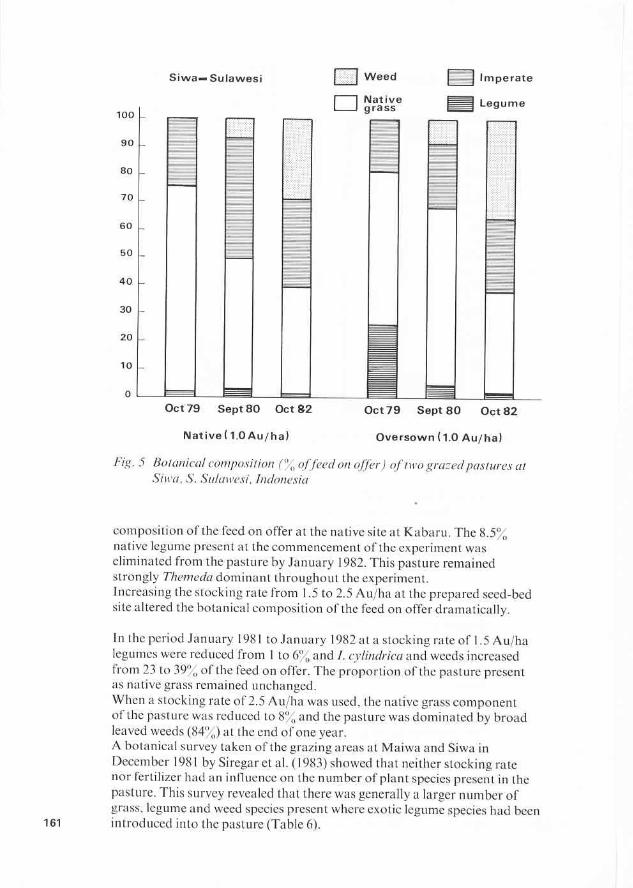
A
O O 0 0 = digestibility 44 - 47 OIO
A = 54 - 57 010
X = 58 - 61 O/o
o = 63 - 66 O/o
o o cm
I I I I
1 2 3 4 O f o N in DM
Fig. 2 lntcike of digestible dry twitter versus nitrogen concentration of'tlie,fced n t , fo ur levels of' digest ib ilitj) . Line A : maximum intuke Of'DDM ofroughages of varying nitrogen concentrution Lines B and C: estiniated intake of DDMfion1,feeds of 55% digestibility and protein degrudubility of80 and 850/, respectively
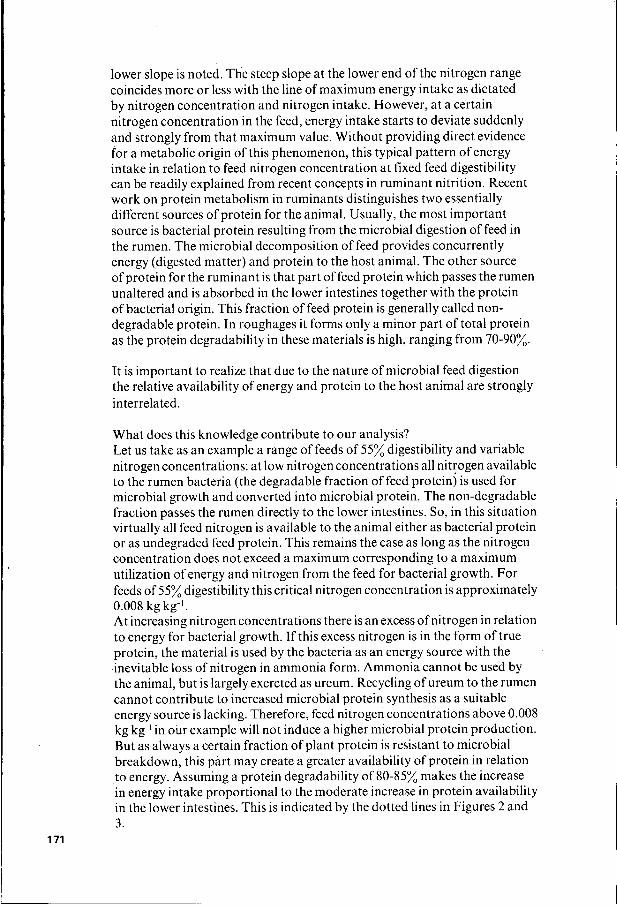
lower slope is noted. The steep slope at the lower end of the nitrogen range coincides more or less with the line of maximum energy intake as dictated by nitrogen concentration and nitrogen intake. However, at a certain nitrogen concentration in the feed, energy intake starts to deviate suddenly and strongly from that maximum value. Without providing direct evidence for a metabolic origin of this phenomenon, this typical pattern of energy intake in relation to feed nitrogen concentration at fixed feed digestibility can be readily explained from recent concepts in ruminant nitrition. Recent work on protein metabolism in ruminants distinguishes two essentially different sources of protein for the animal. Usually, the most important source is bacterial protein resulting from the microbial digestion of feed in the rumen. The microbial decomposition of feed provides concurrently energy (digested matter) and protein to the host animal. The other source of protein for the ruminant is that part of feed protein which passes the rumen unaltered and is absorbed in the lower intestines together with the protein of bacterial origin. This fraction of feed protein is generally called non- degradable protein. In roughages it forms only a minor part of total protein as the protein degradability in these materials is high, ranging from 70-90%.
It is important to realize that due to the nature of microbial feed digestion the relative availability of energy and protein to the host animal are strongly interrelated.
What does this knowledge contribute to our analysis? Let us take as an example a range of feeds of 55% digestibility and variable nitrogen concentrations: at low nitrogen concentrations all nitrogen available to the rumen bacteria (the degradable fraction of feed protein) is used for microbial growth and converted into microbial protein. The non-degradable fraction passes the rumen directly to the lower intestines. So, in this situation virtually all feed nitrogen is available to the animal either as bacterial protein or as undegraded feed protein. This remains the case as long as the nitrogen concentration does not exceed a maximum corresponding to a maximum utilization of energy and nitrogen from the feed for bacterial growth. For feeds of 55% digestibility this critical nitrogen concentration is approximately 0.008 kg kg-'. At increasing nitrogen concentrations there is an excess of nitrogen in relation to energy for bacterial growth. If this excess nitrogen is in the form of true protein, the material is used by the bacteria as an energy source with the ,inevitable loss of nitrogen in ammonia form. Ammonia cannot be used by the animal, but is largely excreted as ureum. Recycling of ureum to the rumen cannot contribute to increased microbial protein synthesis as a suitable energy source is lacking. Therefore, feed nitrogen concentrations above 0.008 kg kg-' in our example will not induce a higher microbial protein production. But as always a certain fraction of plant protein is resistant to microbial breakdown, this part may create a greater availability of protein in relation to energy. Assuming a protein degradability of 80-85% makes the increase in energy intake proportional to the moderate increase in protein availability in the lower intestines. This is indicated by the dotted lines in Figures 2 and 3.
171

Intake of DDM in glkgO.75 90
80
7 0
60
50
40
30
20
10
-
-
-
-
-
-
-
-
-
/ / *
h
a , / " o O 0
o = digestibility 44 - 47 "10 a = 54 - 57 "/o
X = 58 - 61 " lo
* = 63 - 66 "/o
O O 0 O 8 O
I I I I I
O . 1 2 3 4 Intake of N in g/kg0.75
Fig. 3 Intake of digestible dry matter versus intake of nitrogen at four levels of feed digestibility. Line A : maximum intake of DDM of roughages Lines B and C: estimated intake of DDMfrom feeds ofSS% digestibility andprotein degradability of 80 and 85% respectively Line D: maximum intake o fDDM as dictated by animal metabolism
' Considering again the general course of energy intake in relation the nitrogen intake we can conclude that intake of natural feeds can be explained from the relative availability of energy and protein to the animal. We do not need the concept of rumen fill as a regulating mechanism to explain the relation between intake and feed digestibility. This relationship is, at least within our animal category, not a causal one: digestibility is closely associated with energy availability and efficiency of microbial protein synthesis and thus with a certain ratio of protein and energy availability, which is eventually the underlying causal factor explaining energy intake. Digestibility of the feeds used to construct Figures 1 ,2 and 3 ranged from below 40% to 78%. The level of energy intake increased up to a digestibility of about 65%. A higher digestibility at similar nitrogen concentrations apparently does not increase energy intake. This absence of a further response may seem somewhat unexpected at first sight. A possible explanation involved consideration of the efficiency of microbial protein synthesis. 172
From the relation between DDMI and nitrogen intake one may calculate microbial protein yield in the rumen at different levels of feed nitrogen concentration and digestibility, if several assumptions are made.
These assumptions are: - ifenergy intake reaches a maximum at a given nitrogen intake, all feed nitrogen is available to the animal either as microbial protein'or as undegraded feed protein; in this case nitrogen losses as ammonia from the ruminal system are negligible; - of the total apparently digested matter a fixed proportion is de- graded in the rumen; this part is usually called rumen fermentable matter and estimated at 65% of the apparently digested matter; - the degradability of plant protein is assumed to be constant at 80%; - finally the contribution of internally recycled nitrogen (in saliva and gastric secretions) to the available pool for microbial growth is considered; as detailed information was lacking, two alternative estimates of bacterial protein synthesis were made: first we neglected internally recycled nitrogen, then we set it at 20% of feed nitrogen in which case microbial nitrogen can be as high as total feed nitrogen; the true microbial protein yield will be somewhere between two expremes.
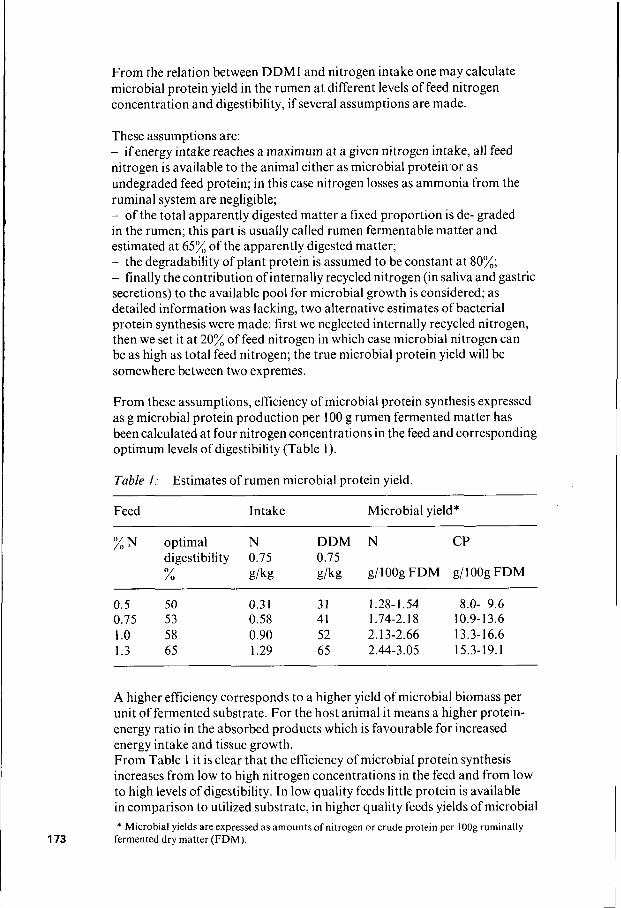
From these assumptions, efficiency of microbial protein synthesis expressed as g microbial protein production per 100 g rumen fermented matter has been calculated at four nitrogen concentrations in the feed and corresponding optimum levels of digestibility (Table I).
Table 1: Estimates of rumen microbial protein yield.
Feed Intake Microbial yield*
% N optimal N DDM N CP digestibility 0.75 0.75 % g/kg g/kg g/IOOg FDM g/lOOg FDM
~~
0. 5 50 0.3 I 31 1.28- 1.54 8.0- 9.6 0.75 53 0.58 41 1.74-2.18 10.9-1 3.6 1 .o 58 0.90 52 2.13-2.66 13.3-16.6 1.3 65 1.29 65 2.44-3.05 15.3-19.1
A higher efficiency corresponds to a higher yield of microbial biomass per unit of fermented substrate. For the host animal it means a higher protein- energy ratio in the absorbed products which is favourable for increased energy intake and tissue growth. From Table 1 i t is clear that the efficiency of microbial protein synthesis increases from low to high nitrogen concentrations in the feed and from low to high levels of digestibility. In low quality feeds little protein is available in comparison to utilized substrate, in higher quality feeds yields of microbial * Microbial yields are expressed as amounts of nitrogen or crude protein per I Oog ruminally
173 fermented dry matter (FDM).
protein are larger for the same amount of digested substrate. The major cause of a low efficiency at low levels of digestibility and low nitrogen concentrations is probably a high recycling of microbial nitrogen within the rumen: the protein of deadmicrobes is reutilized by new individuals. The highest efficiencies in Table 1 are in close agreement with experimental data of microbial yields on high quality roughage. For instance Hagemeister, Lupping and Kaufmann (198 I ) found 15-19 g microbial protein per 100 g fermentable organic matter in lactating cows offered rations of SO-lOO% roughage. Higher yields (up to 22 g) were found in concentrate diets. However, the review of ARC (1 980) includes data for roughages even higher than 22 g per 100 g fermentable organic matter (FOM). For calculating the protein supply of all feeds ARC uses an average of 19 g per 100 g FOM which seems much too high for low quality feeds.
To expand our relation of maximum energy intake versus nitrogen concentration of the feed we assumed that for feeds of 65% digestiblility and 1.3%N, microbial protein synthesis reaches its maximum efficiency. Then applying again the concept of protein degradability we calculated the maximum energy intake for feeds of 65% digestibility and increasing nitrogen concentration. Protein degradability was set at 80%. These calculations result in the upper lines of Figures 2 and 3 . Now we have obtained a graphical relation which gives us the maximum intake of energy for growing cattle from feeds ranging between 0.002 and 0.02 N kg-' dry matter. A second step could be to establish the same relation for suboptimum levels of digestibility. However, for the moment we shall retain only the first relation.
An important conclusion from the foregoing analysis for rangeland evaluation is the fact that both plant and animal production on many natural grasslands are dominated by one element: nitrogen. To assess pasture productivity the availability of nitrogen is the key point to assess animal productivity, the true availability of protein is the major determinant. The latter, however, is not easily measured from feed characteristics as it results from dynamic processes in the rumen, in other words from an interaction of feed, microbes and host animal. What our data do suggest, however, is that true protein availability for practical purposes might be assessed from three feed parameters: nitrogen concentration, digestibility and protein degradability. More work has to be done to develop a complete model for energy intake of growing cattle using these parameters in the most appropriate way.
Now we shall return to the theme of our introduction: the assessment of differences in rangeland potential due to differences in nutritional quality for livestock production. As our analyses referred to growing cattle we will estimate expected cumulative weight changes under various conditions of pasture growth. These estimates are preliminary as several parameter values have yet to be confirmed. The emphasis therefore is on the magnitude of differences in animal production due to differences in nutritional regime over a year rather 174

than on absolute values. To put it in a different way, the question is to what extent pastures from different ecological zones are comparable in terms of individual animal performance. To answer this question a series of assumptions has to be made which will be explained later. First, we have to translate the relation of maximum intake of energy and nitrogen versus nitrogen concentration of the feed into terms of daily weight changes for young growing cattle.
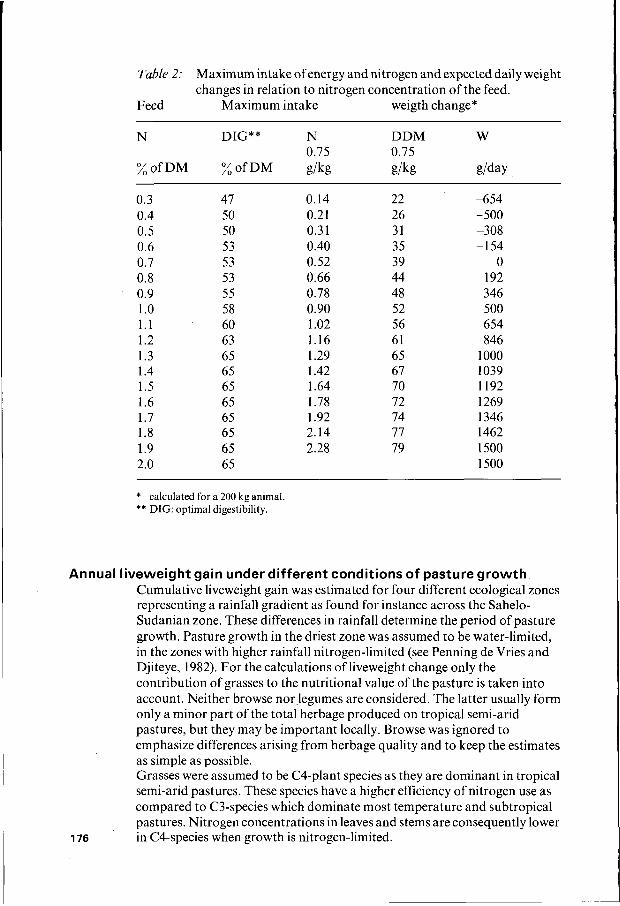
Intake of energy and nitrogen and expected daily weight changes As our calculations are aimed at establishing limits to animal performance, given a set of external conditions, we tried to find minimum nitrogen requirements to support maintenance and various levels of weight change. We decided to use as a reference animal a young bullock of a large breed, initially weighing 200 kg and having a genetic potential for growth of 1.5 kg liveweight gain per day. For tropical regions this would apply to a cross- bred steer, as most indigeneous breeds will have smaller size and lower potential growth rates. To establish the relation between feed intake and weight change three assumptions were made: - the relation between intakes of energy, nitrogen and weight change is a
continuous linear both above and below maintenance; - nitrogen requirements for maintenance are 0.5 g kg-0,75; - nitrogen requirements for 1 kg weight gain are 1.3 g kg-0,7Sfor animals
The first assumption is supported by experimental results of Elliott et al. (1961 a and b) and Hendricksen et al. (1982). From a theoretical point of view one would expect a curvilinear relation if the digestible matter had always the same net energy value. In that case the efficiency of digestible energy would be higher below maintenance than above maintenance. However, with changing maximum intakes of digestible dry matter its quality and net energy value also change, which explains the linearity of the relation. Nitrogen requirements for maintenance are based on feeding trials summarized by ARC (1 980) and on a review by Preston (1972). The concurrent intake of energy is higher than generally accepted for maintenance i.e. 35 g DDM kg-0,75. But as pointed out by Broster and Oldham (1981) minimum intakes of energy and nitrogen do not occure simultaneously. Nitrogen requirements for weight gain are also based on feeding trials summarized by ARC (1980). With these assumptions the values in Table 2 have been calculated. Most stricking is the extreme sensitivity of animal performance to changes in nitrogen concentration of feed below 0.01 3 kg kg-'. This sensitivity has substantial effects on any calculation of cumulative weigth gain over a prolonged period if based solely on nitrogen concentration of the feed. So, we should repeat that the data of Table 2 only apply to those situations where the conversion efficiency of feed nitrogen to true protein availability is at its maximum. This assumes at each nitrogen concentration adequate digestibility as indicated approximately in Table 2.
between 200 and 300 kg liveweight.
175
Table
Feed
2: Maximum intake ofenergy and nitrogen and expected daily weight changes in relation to nitrogen concentration of the feed.
Maximum intake weigth change*
N DIG** N DDM w 0.75 0.75
% o f D M % o f D M g/kg gikg glday
0.3 0.4 0.5 0.6 0.7 0.8 0.9 1 .o 1.1 1.2 1.3 1.4 1.5 1.6 1.7 1.8 1.9 2.0
47 50 50 53 53 53 55 58 60 63 65 65 65 65 65 65 65 65
O. 14 0.21 0.3 1 0.40 0.52 0.66 0.78 0.90 1 .o2 1.16 1.29 1.42 1.64 1.78 1.92 2.14 2.28
22 26 31 35 39 44 48 52 56 61 65 67 70 72 74 77 79
-654 -500 -308 -1 54
O 192 346 500 654 846
1 O00 1039 1192 1269 1346 1462 1500 1500
* calculated for a 200 kg animal ** DIG: optimal digestibility.
Annual liveweight gain under different conditions of pasture growth. Cumulative liveweight gain was estimated for four different ecological zones representing a rainfall gradient as found for instance across the Sahelo- Sudanian zone. These differences in rainfall determine the period of pasture growth. Pasture growth in the driest zone was assumed to be water-limited, in the zones with higher rainfall nitrogen-limited (see Penning de Vries and Djiteye, 1982). For the calculations of liveweight change only the contribution of grasses to the nutritional value of the pasture is taken into account. Neither browse norlegumes are considered. The latter usually form only a minor part of the total herbage produced on tropical semi-arid pastures, but they may be important locally. Browse was ignored to emphasize differences arising from herbage quality and to keep the estimates as simple as possible. Grasses were assumed to be C4-plant species as they are dominant in tropical semi-arid pastures. These species have a higher efficiency of nitrogen use as compared to C3-species which dominate most temperature and subtropical pastures. Nitrogen concentrations in leaves and stems are consequently lower in CCspecies when growth is nitrogen-limited. 176

Most crucial for our extimates was to assess the maximum nitrogen concentration in the diet of cattle under a set of environmental conditions. For the period of active pasture growth diet nitrogen concentration was set equal to the nitrogen concentration of green leaves which are the plant organs having the highest nitrogen concentration. For the period without pasture growth, diet nitrogen concentration was derived from the composition of dry leaves, which provide the most nitritious material at that time. For these assumptions on the diet, only two parameters had to be specified: nitrogen concentration in green leaves and in dry leaves. Here again we tried to be optimistic so as to find the maximum individual weight gain from grass pastures under various conditions. With regard to green leaf composition it was assumed that at the start of the growing season nitrogen concentration in green leaf is 0.025 kg kg-l. In the course of the season it drops dramatically in response to diminishing availability of nitrogen from the soil. If pasture growth is ultimately limited by nitrogen availability, the nitrogen concentration in green leaves will fall to 0.01 kg kg-l. It is assumed that this lower level is reached halfway throught the growing season. The value of 0.01 does not represent the lower limit for live leaves; nitrogen concentrations below 0.008 kg kg-'can be found under severe nitrogen stress. Nitrogen concentrations in green leaves in the course of the first half of the growing season were interpolated somewhat arbitrarily from data of Mclvor (198 I) . The nitrogen concentration in dry leaves was estimated at 0.005 kg kg-l if growth was nitrogen-limited. It remains constant throughout the dry season. For conditions where pasture growth is restricted by water availability as in the driest zone of our example, the nitrogen content of dry herbage was fixed at 0.014 kg kg-l. This value was derived as an average from actual field data published by Penning de Vries and Djitèye (1982). As is obvious from Table 3 differences in cumulative weigth gain appear to be quite large. However, individual estimates may be biased because of the assumption that digestibility is non-limiting. Moreover, the growth function was not adjusted for weigths close to mature size. If digestibility is not taken into account weight gain for the driest zone will certainly be overestimated as 65% digestibility of the dry herbage is probably too high. Assuming 55% digestibility would bring cumulative weight gain to 237 kg, which is still much higher than the other numbers in Table 3.
Summarizing the findings from Table 3 the following conclusions may be drawn: - opportunities for liveweight gain are greatest in situations where pasture growth is limited by water, i.e. in the northern Sahelian zone; the favourable nitrogen concentration of the dry herbage allows prolonged periods of weight gain, whereas in other situations weight loss is inevitable; - cumulative liveweight gain is lowest in situations where a short growing season coincides with low nitrogen concentrations in the dry herbage due to nitrogen-deficient growth conditions; this refers to annual rangelands in the southern Sahelian zone; - regional differences in liveweight gain from pastures will be largest in the true Sahelian zone (200-600 mm rainfall); these differences are primarily caused by variations in the relative availability of water and nitrogen for 177
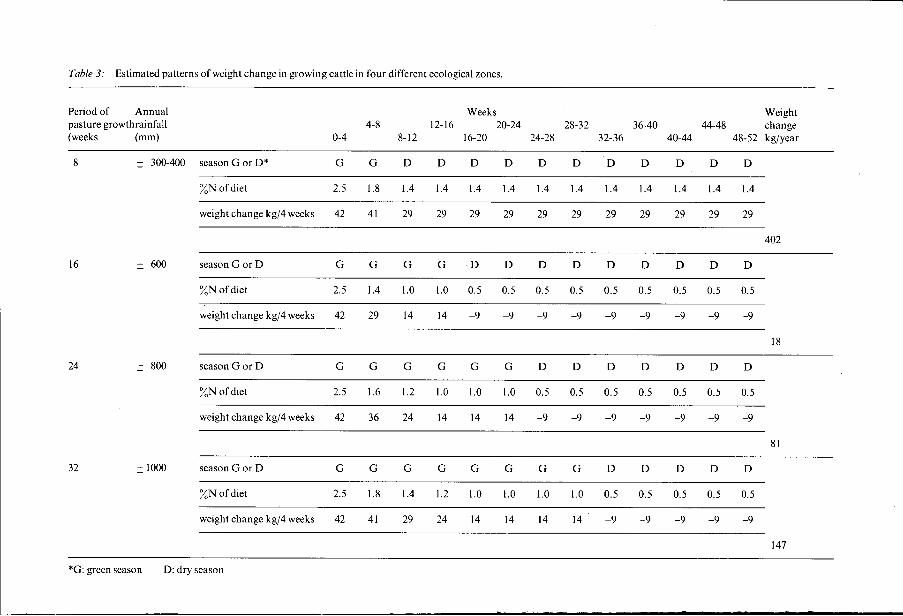
Table 3: Estimated patterns of weight change in growing cattle in four different ecological zones.
Period of Annual pasture growthrainfall (weeks ("1
Weeks Weight 4-8 12-16 20-24 28-32 36-40 44-48 change
0-4 8-12 16-20 24-28 32-36 40-44 48-52 kg/year
16
24
32
8 k 300-400
600
k 800
f 1000
season G or D* G G D D D D D D D D D D D
%N of diet 2.5 1.8 1.4 1.4 1.4 1.4 1.4 1.4 1.4 1.4 1.4 1.4 1.4
weightchangekg14weeks 42 41 29 29 29 29 29 29 29 29 29 29 29
402
season G or D G G G G D D D D D D D D D
%N of diet 2.5 1.4 1.0 1.0 0.5 0.5 0.5 0.5 0.5 0.5 0.5 0.5 0.5
weightchangekg/4weeks 42 29 14 14 -9 -9 -9 -9 -9 -9 -9 -9 -9
18
season G or D G G G G G G D D D D D D D
%N of diet 2.5 1.6 1.2 1.0 1.0 1.0 0.5 0.5 0.5 0.5 0.5 0.5 0.5
weightchangekg/4weeks 42 36 24 14 14 14 -9 -9 -9 -9 -9 -9 -9
81
season G or D G G G G G G G G D D D D D
XN of diet 2.5 1.8 1.4 1.2 1.0 1.0 1.0 1.0 0.5 0.5 0.5 0.5 0.5
weightchangekg/4weeks 42 41 29 24 14 14 14 14 -9 -9 -9 -9 -9
147
*G: green season D: dry season
pasture growth; the same holds for the year-to-year variation in individual liveweight gain from the same pasture as the nitrogen concentration in the dry herbage may show substantial differences between years mainly related to variations in rainfall.
I Conclusions
I To return to our basic question Ire may safely conclude that rangelands of semi-arid regions will show large differences in animal productivity due to differences in the nutritional value of the herbage produced. To illustrate the magnitude of these differences in just another way: to attain a minimum shaughter weight of 400 kg would require from less than one year under favourble conditions to ten years in the worst case. It seems unlikely that a major part of this relative difference would be compensated by the contribution of non-grass materials. Estimates of liveweight gain from Table 3 may be compared with actual measurements as reported in the literature. As many factors are involved in such comparisons, only a few comments will be made at this stage. The favourable pattern of weight gain in the northern Sahelian zone is partly confirmed by data of Klein (1981). In an area with, on average, 320 mm rainfall the animals gained weight over a period of up to 8 months in a year, i.e. much longer than the actual growing season. Total weight gain, excluding
amounted to 100 kg. This rather low figure as compared to our estimates may be partly related to the growth characteristics of the Azawak breed. Higher weight gains for an area with similar rainfall (median 303 mm) in Australia are reported by Wilson and Graetz (1980). They measured cattle production on a semi-arid saltbush community. After weaning, Hereford calves gained weight continuously up to a total of 200 kg in the nex 12 months. The nitrogen concentration in the diet was always over 0.01 kg kg-'.
I
I
.
I the weight loss of the transitional period between green and dry season,
The low potential for growth in the southern Sahelian zone is confirmed by data of De Leeuw et al. (1983). With confined grazing, animals gained 87 kg in the rainy season and lost subsequently 72 kg in the dry season, showing a net gain of 15 kg only. Data for the two wettest zones may be compared with an analysis of liveweight gain for two Australian sites with similar periods of pasture growth (McGown et al., 1981). Only data of unfertilized grass pastures were included in the analysis. The average cumulative liveweight gain was 50 kg and 88 kg for 24 and 32 green weeks, respectively. The estimates in Table 3 are 1.6 and 1.7 times these averages and are comparable to the maximum gain to be expected from the scatter in individual measurements. Combining theoretical and practical evidence we conclude that a ten-fold difference in annual weight gain for growing cattle on native semi-arid and sub-humid pastures is not unlikely.,This is certainly too much to be ignored in the evaluation of rangeland for livestock production.
Summary
179 In the evaluation of rangeland potential, primary production is of prime importance. However, major differences in herbage quality for ruminant

nutrition exist, if feed resources from rangelands are compared. These quality differences may have a strong influence on expected animal production from semi-arid pastures. An attempt is made to predict the magnitude of variation in annual liveweight gain of growing cattle under various conditions of pasture growth. To establish an objective basis forpredicting weight gain, feed intake of growing cattle was considered in relation to feed characteristics. From an analysis of feeding trials it is shown that energy intake of growing cattle is primarily a function of true availability of protein to the animal. As the protein supply to the ruminant is complicated by the action of the rumen microbial system, protein availability cannot be measured directly from the feed. However, it is suggested that for practical purposes this parameter may be derived from the nitrogen concentration, the digestibility and the protein degradability of the feed. From the analysis of feed intake data a relation was derived between maximum energy intake and nitrogen concentration of the feed. This relation was used to predict maximum liveweight gain from a given nitrogen concentration in the diet. Assuming typical nitrogen concentrations for green leaf and dry leaf under various conditions of pasture growth, cumulative liveweight gain was estimated for four ecological zones, representing a rainfall gradient as found for instance across the Sahelo-Sudanian zone. Estimates show that a ten-fold difference in annual liveweight gain is probably not uncommon.
Ref erences ARC, 1980. The nutrient requirements of ruminant livestock. Broster, W.H., Oldham, J.D., 1981. Protein quantity and quality for the UK dairy cow. In: Recent developments in ruminant nutrition. Eds.: W. Haresign and D.J.A. Cole. Conrad, H.R., Pratt, A.D., Hibbs, J.W., 1964. Regulation of feed intake in dairy cows. I. Change in importance of physical and physiological factors with increasing digestibility. J. Dairy Sci. 47, 54. Dahl, G., Hjort, A., 1976. Having herds. Pastoral herd growth and household economy. Stockholm studies in Social Antropology. De Leeuw, P.N. 1983. In: Recherches sur les systemes des zones arides du Mali: resultats preliminaires, p. 160. Eds.: R.T. Wilson, P.N. de Leeuw and C. de Haan. Elliott, R.C., 1967. Voluntary intake of low-protein diets by ruminants. I. Intake of food by cattle. J. Agr. Sci. 69,35. Elliott, R.C., Fokkema, K. 1961a. Herbage.consumption studies on beef cattle. I. Rhod. Agr. J., 58,49. Elliott, R.C., Fokkema, K., Frence, C.H., 1961b. Herbage consumption studies on beef cattle. 11. Rhod. AGr. J., 58, 124. Hagemeister, H., Luepping, W., Kaufmann, W., 1981. Microbial protein synthesis and digestion in the high-yielding dairy cow. In: Recent developments in ruminant nutrition. Eds.: W. Haresign and D.J.A. Cole. Hendricksen, R., Rickert, K.G. Ash, A.J., McKeon, G.M., 1982. Beef production model. In: Animal production in Australia. Proc. of the Australian Soc. of Animal Production, Vol. 14. Klein, H.D., 1981. Contribution a l’estimation de la production sur pâturage 180
sahélien au Niger. Rev. Elev. Méd. vet. Pays trop., 34,211. Lamprey, H.F., 1983. Pastoralism yesterday and today: the over-grazing problem. In: Tropical savannas. Ed.: F. Bourlière. McGown, R.L., Gillard., P., Winks, L., Williams, W.T., 1981. Theclimatic potential for beef cattle production in tropical Australia. Part 11. Liveweight change in relation to agroclimatic variables. Agr. Syst. 7, 1. McIvor, J.G., 1981. Seasonal changes in the growth, dry matter distribution and herbage quality of three native grasses in northern Queensland. Aust. J. Exp. Agric. Anim. Husb. 21,600. Mertens, D.R., 1973. Application of theoretical mathematical models to cell wall digestion and forage intake in ruminants. Thesis Cornel1 University. Penning de Vries, F.W.T., Djitèye, M.A., 1982. La productivité des pâturages sahéliens. Preston, R.L., 1972. Cited by L.D. Satter and R.E. Roffler, 1981. In: Recent developments in ruminant nutrition. Eds.: W. Haresign and D.J.A. Cole. Wilson, A.D., Graetz, R.D. 1980. Cattle and sheep production on an Atriplex vesicaria (Saltbush) community. Aust. J . Agric. Res. 31,369.

182