Regulating Carbon Dioxide under Section 111(d) of the ... · Regulating Carbon Dioxide under...
19
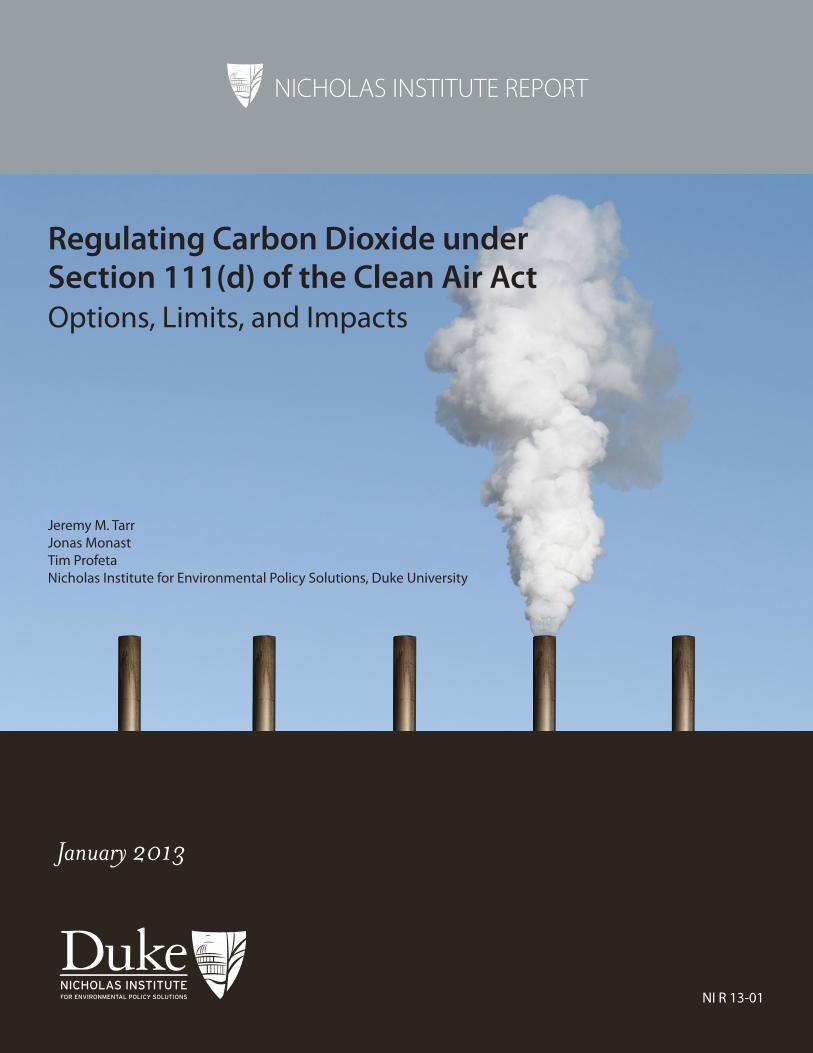
NICHOLAS INSTITUTE REPORT NICHOLAS INSTITUTE FOR ENVIRONMENTAL POLICY SOLUTIONS NI R 13-01 Regulating Carbon Dioxide under Section 111(d) of the Clean Air Act Options, Limits, and Impacts January 2013 Jeremy M. Tarr Jonas Monast Tim Profeta Nicholas Institute for Environmental Policy Solutions, Duke University
-
Upload
phungquynh -
Category
Documents
-
view
215 -
download
1
Transcript of Regulating Carbon Dioxide under Section 111(d) of the ... · Regulating Carbon Dioxide under...
NICHOLAS INSTITUTE REPORT
NICHOLAS INSTITUTEFOR ENVIRONMENTAL POLICY SOLUTIONS NI R 13-01
Regulating Carbon Dioxide under Section 111(d) of the Clean Air ActOptions, Limits, and Impacts
January 2013
Jeremy M. TarrJonas MonastTim ProfetaNicholas Institute for Environmental Policy Solutions, Duke University

Nicholas Institute for Environmental Policy SolutionsReport
NI R 13-01January 2013
Regulating Carbon Dioxide under Section 111(d) of the Clean Air Act
Options, Limits, and ImpactsJeremy M. TarrJonas MonastTim Profeta
Nicholas Institute for Environmental Policy Solutions, Duke University
NICHOLAS INSTITUTEFOR ENVIRONMENTAL POLICY SOLUTIONS
How to cite this reportJeremy M. Tarr, Jonas Monast & Tim Profeta, Nicholas Inst. for Envtl. Policy Solutions, Duke Univ., Regulating Carbon Dioxide under Section 111(d) of the Clean Air Act: Options, Limits, and Impacts
(2013), http://nicholasinstitute.duke.edu/climate/policydesign/regulating-carbon-dioxide-under-section-111d.
The authors thank Carrie Jenks of M.J. Bradley & Associates, Megan Ceronsky of the Environmental Defense Fund, Dallas Burtraw of Resources for the Future, and Etan Gumerman
of the Nicholas Institute for their valuable input during the development of this paper.
Regulating Carbon Dioxide under Section 111(d) of the Clean Air Act: Options, Limits, and Impacts
Contents
I. Background on Greenhouse Gas Regulations under the Clean Air Act ................................................... 5
A. New Source Performance Standard ................................................................................................................................5
B. CO2 Emissions from Existing Sources ............................................................................................................................6
II. Economic and Other Impacts of 111(d) Policy Design ............................................................................ 7
A. Regional Impacts of a Unit-Specific Requirement ........................................................................................................8
B. Regional Impacts of Flexibility Mechanisms ..................................................................................................................9
C. Balancing National Uniformity with Regional Differences ...................................................................................... 11
III. Supply-Side and Demand-Side Efficiency ..............................................................................................11
A. Supply-Side Efficiency .................................................................................................................................................... 11
1. Efficiency Potential Is Source-Specific .................................................................................................................. 12
2. New Source Review ................................................................................................................................................. 13
B. End-Use Efficiency .......................................................................................................................................................... 13
IV. Legal Uncertainty ......................................................................................................................................14
A. Specificity of EPA Guidelines ........................................................................................................................................ 15
B. Crediting Reductions “Beyond the Fence Line” ......................................................................................................... 16
C. Increasing Stringency of 111(d) Requirements .......................................................................................................... 17
IV. Conclusion .................................................................................................................................................17
Nicholas Institute
5
Regulating Carbon Dioxide under Section 111(d) of the Clean Air Act: Options, Limits, and Impacts
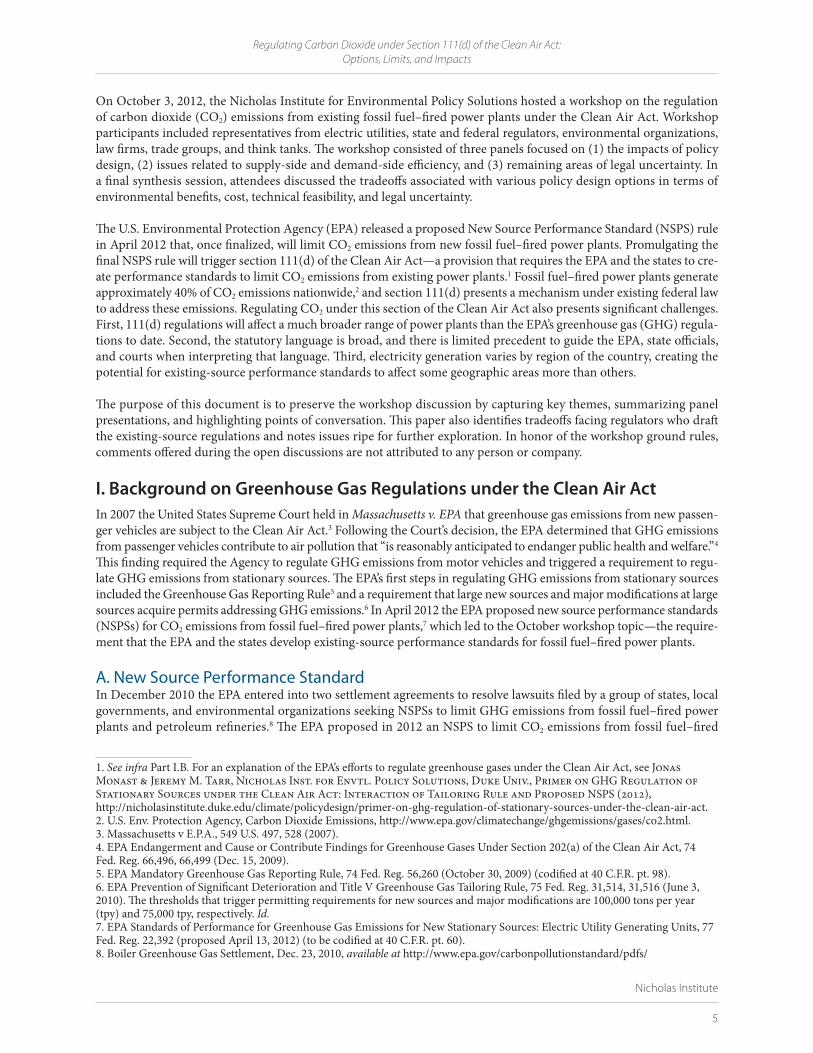
On October 3, 2012, the Nicholas Institute for Environmental Policy Solutions hosted a workshop on the regulation of carbon dioxide (CO2) emissions from existing fossil fuel–fired power plants under the Clean Air Act. Workshop participants included representatives from electric utilities, state and federal regulators, environmental organizations, law firms, trade groups, and think tanks. The workshop consisted of three panels focused on (1) the impacts of policy design, (2) issues related to supply-side and demand-side efficiency, and (3) remaining areas of legal uncertainty. In a final synthesis session, attendees discussed the tradeoffs associated with various policy design options in terms of environmental benefits, cost, technical feasibility, and legal uncertainty.
The U.S. Environmental Protection Agency (EPA) released a proposed New Source Performance Standard (NSPS) rule in April 2012 that, once finalized, will limit CO2 emissions from new fossil fuel–fired power plants. Promulgating the final NSPS rule will trigger section 111(d) of the Clean Air Act—a provision that requires the EPA and the states to cre-ate performance standards to limit CO2 emissions from existing power plants.1 Fossil fuel–fired power plants generate approximately 40% of CO2 emissions nationwide,2 and section 111(d) presents a mechanism under existing federal law to address these emissions. Regulating CO2 under this section of the Clean Air Act also presents significant challenges. First, 111(d) regulations will affect a much broader range of power plants than the EPA’s greenhouse gas (GHG) regula-tions to date. Second, the statutory language is broad, and there is limited precedent to guide the EPA, state officials, and courts when interpreting that language. Third, electricity generation varies by region of the country, creating the potential for existing-source performance standards to affect some geographic areas more than others.
The purpose of this document is to preserve the workshop discussion by capturing key themes, summarizing panel presentations, and highlighting points of conversation. This paper also identifies tradeoffs facing regulators who draft the existing-source regulations and notes issues ripe for further exploration. In honor of the workshop ground rules, comments offered during the open discussions are not attributed to any person or company.
I. Background on Greenhouse Gas Regulations under the Clean Air ActIn 2007 the United States Supreme Court held in Massachusetts v. EPA that greenhouse gas emissions from new passen-ger vehicles are subject to the Clean Air Act.3 Following the Court’s decision, the EPA determined that GHG emissions from passenger vehicles contribute to air pollution that “is reasonably anticipated to endanger public health and welfare.”4 This finding required the Agency to regulate GHG emissions from motor vehicles and triggered a requirement to regu-late GHG emissions from stationary sources. The EPA’s first steps in regulating GHG emissions from stationary sources included the Greenhouse Gas Reporting Rule5 and a requirement that large new sources and major modifications at large sources acquire permits addressing GHG emissions.6 In April 2012 the EPA proposed new source performance standards (NSPSs) for CO2 emissions from fossil fuel–fired power plants,7 which led to the October workshop topic —the require-ment that the EPA and the states develop existing-source performance standards for fossil fuel–fired power plants.
A. New Source Performance StandardIn December 2010 the EPA entered into two settlement agreements to resolve lawsuits filed by a group of states, local governments, and environmental organizations seeking NSPSs to limit GHG emissions from fossil fuel–fired power plants and petroleum refineries.8 The EPA proposed in 2012 an NSPS to limit CO2 emissions from fossil fuel–fired
1. See infra Part I.B. For an explanation of the EPA’s efforts to regulate greenhouse gases under the Clean Air Act, see Jonas Monast & Jeremy M. Tarr, Nicholas Inst. for Envtl. Policy Solutions, Duke Univ., Primer on GHG Regulation of Stationary Sources under the Clean Air Act: Interaction of Tailoring Rule and Proposed NSPS (2012),http://nicholasinstitute.duke.edu/climate/policydesign/primer-on-ghg-regulation-of-stationary-sources-under-the-clean-air-act.2. U.S. Env. Protection Agency, Carbon Dioxide Emissions, http://www.epa.gov/climatechange/ghgemissions/gases/co2.html. 3. Massachusetts v E.P.A., 549 U.S. 497, 528 (2007). 4. EPA Endangerment and Cause or Contribute Findings for Greenhouse Gases Under Section 202(a) of the Clean Air Act, 74 Fed. Reg. 66,496, 66,499 (Dec. 15, 2009).5. EPA Mandatory Greenhouse Gas Reporting Rule, 74 Fed. Reg. 56,260 (October 30, 2009) (codified at 40 C.F.R. pt. 98).6. EPA Prevention of Significant Deterioration and Title V Greenhouse Gas Tailoring Rule, 75 Fed. Reg. 31,514, 31,516 (June 3, 2010). The thresholds that trigger permitting requirements for new sources and major modifications are 100,000 tons per year (tpy) and 75,000 tpy, respectively. Id.7. EPA Standards of Performance for Greenhouse Gas Emissions for New Stationary Sources: Electric Utility Generating Units, 77 Fed. Reg. 22,392 (proposed April 13, 2012) (to be codified at 40 C.F.R. pt. 60).8. Boiler Greenhouse Gas Settlement, Dec. 23, 2010, available at http://www.epa.gov/carbonpollutionstandard/pdfs/
Regulating Carbon Dioxide under Section 111(d) of the Clean Air Act: Options, Limits, and Impacts
Nicholas Institute
6
power plants. The Clean Air Act requires that an NSPS apply to a “category of sources,” and the EPA defined the cat-egory for the proposed GHG rule to include large electric-utility steam-generating units (e.g., coal-fired facilities) and combined-cycle units (e.g., natural gas–fired combined-cycle turbines). These units are collectively referred to as “TTTT sources,” after the Code of Federal Regulations section that will define the category.9
The proposed NSPS covers only new fossil fuel–fired units in the continental United States that supply over 25 MW net electrical output for an electric utility company to sell.10 The rule neither applies to modifications nor to units with preconstruction permits approved by April 13, 2012, provided that construction begins within 12 months of that date.11 If finalized, the proposed performance standard will prohibit affected units from emitting more than 1,000 pounds of CO2 per megawatt hour.12 This output-based performance standard is achievable with modern combined-cycle natural gas turbines, but coal-fired units are not likely to achieve this standard without utilizing carbon capture technologies.13
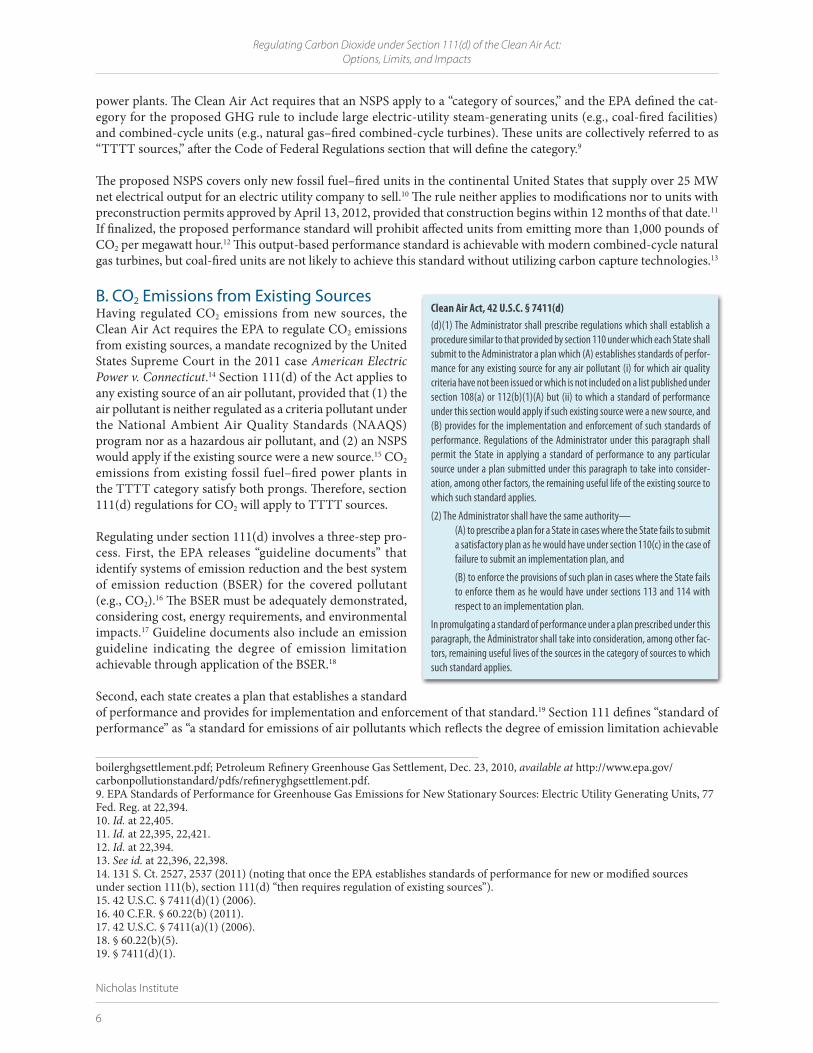
B. CO2 Emissions from Existing SourcesHaving regulated CO2 emissions from new sources, the Clean Air Act requires the EPA to regulate CO2 emissions from existing sources, a mandate recognized by the United States Supreme Court in the 2011 case American Electric Power v. Connecticut.14 Section 111(d) of the Act applies to any existing source of an air pollutant, provided that (1) the air pollutant is neither regulated as a criteria pollutant under the National Ambient Air Quality Standards (NAAQS) program nor as a hazardous air pollutant, and (2) an NSPS would apply if the existing source were a new source.15 CO2 emissions from existing fossil fuel–fired power plants in the TTTT category satisfy both prongs. Therefore, section 111(d) regulations for CO2 will apply to TTTT sources.
Regulating under section 111(d) involves a three-step pro-cess. First, the EPA releases “guideline documents” that identify systems of emission reduction and the best system of emission reduction (BSER) for the covered pollutant (e.g., CO2).16 The BSER must be adequately demonstrated, considering cost, energy requirements, and environmental impacts.17 Guideline documents also include an emission guideline indicating the degree of emission limitation achievable through application of the BSER.18
Second, each state creates a plan that establishes a standard of performance and provides for implementation and enforcement of that standard.19 Section 111 defines “standard of performance” as “a standard for emissions of air pollutants which reflects the degree of emission limitation achievable
boilerghgsettlement.pdf; Petroleum Refinery Greenhouse Gas Settlement, Dec. 23, 2010, available at http://www.epa.gov/carbonpollutionstandard/pdfs/refineryghgsettlement.pdf. 9. EPA Standards of Performance for Greenhouse Gas Emissions for New Stationary Sources: Electric Utility Generating Units, 77 Fed. Reg. at 22,394. 10. Id. at 22,405. 11. Id. at 22,395, 22,421.12. Id. at 22,394. 13. See id. at 22,396, 22,398.14. 131 S. Ct. 2527, 2537 (2011) (noting that once the EPA establishes standards of performance for new or modified sources under section 111(b), section 111(d) “then requires regulation of existing sources”).15. 42 U.S.C. § 7411(d)(1) (2006).16. 40 C.F.R. § 60.22(b) (2011).17. 42 U.S.C. § 7411(a)(1) (2006).18. § 60.22(b)(5).19. § 7411(d)(1).
Clean Air Act, 42 U.S.C. § 7411(d)(d)(1) The Administrator shall prescribe regulations which shall establish a procedure similar to that provided by section 110 under which each State shall submit to the Administrator a plan which (A) establishes standards of perfor-mance for any existing source for any air pollutant (i) for which air quality criteria have not been issued or which is not included on a list published under section 108(a) or 112(b)(1)(A) but (ii) to which a standard of performance under this section would apply if such existing source were a new source, and (B) provides for the implementation and enforcement of such standards of performance. Regulations of the Administrator under this paragraph shall permit the State in applying a standard of performance to any particular source under a plan submitted under this paragraph to take into consider-ation, among other factors, the remaining useful life of the existing source to which such standard applies.
(2) The Administrator shall have the same authority—(A) to prescribe a plan for a State in cases where the State fails to submit a satisfactory plan as he would have under section 110(c) in the case of failure to submit an implementation plan, and
(B) to enforce the provisions of such plan in cases where the State fails to enforce them as he would have under sections 113 and 114 with respect to an implementation plan.
In promulgating a standard of performance under a plan prescribed under this paragraph, the Administrator shall take into consideration, among other fac-tors, remaining useful lives of the sources in the category of sources to which such standard applies.
Nicholas Institute
7
Regulating Carbon Dioxide under Section 111(d) of the Clean Air Act: Options, Limits, and Impacts
through the application of the [BSER].”20 Notably, states play a significant role under section 111(d). It is the states, not the EPA, that establish standards of performance and determine how covered entities within their borders will meet those standards, though states use EPA guidance as a reference. In the third and final step, each state submits to the EPA a section 111(d) plan, which the Agency approves or denies based upon whether the plan satisfies the criteria laid out in the EPA’s guidelines. If a state fails to submit a plan or submits a plan that the EPA determines is unsatisfactory, the EPA may develop a plan for the state.21
The EPA has regulated air pollutants under section 111(d) just a handful of times. The combination of this limited precedent and the statute’s general language provides the EPA with a broad array of policy design options to consider when determining the BSER, guiding the development of state plans, and evaluating the adequacy of those plans. One design option could include an EPA emission guideline in the form of a unit-specific emission rate applicable to each individual generation unit.22 Another potential design option, such as company-wide averaging, would permit states to use flexible plans that do not contain a unit-specific compliance requirement. The statutory language may permit a third option, which would include a flexible framework that places an obligation on each individual unit. The EPA interpreted section 111(d) to allow this third option in the Clean Air Mercury Rule, which included a market-based approach to reduce mercury emissions.23
II. Economic and Other Impacts of 111(d) Policy DesignAssessing possible impacts of section 111(d) regulations on CO2 emissions is challenging because so much about the forthcoming regulations is uncertain. The EPA’s environmental protection goals, technical feasibility, and projected cost all will affect the stringency of the regulations. Uncertainty also stems from unresolved questions about whether the EPA and the states will regulate subgroups of covered sources differently and whether the rules will measure compliance on a unit-specific basis. To account for this uncertainty, modeling experts presenting in the first workshop panel employed various analytical approaches to assess possible impacts of various policy design frameworks for 111(d) regulations.
Etan Gumerman of the Nicholas Institute presented findings comparing the regional impacts under a unit-specific requirement, a trading system, and a plan incorporating end-use energy efficiency. Dallas Burtraw of Resources for the Future (RFF) examined the economic effects of utilizing a single national standard compared with regional standards under a tradable performance standard framework. Finally, Dan Lashof offered a preview of a proposal for section 111(d) regulations being developed by the Natural Resources Defense Council (NRDC). The discussion below high-lights the findings of Gumerman and Burtraw, as NRDC’s proposal and modeling results were not ready for public dissemination at the time of the workshop.24
At the outset, the presenters emphasized that their assumptions are not predictions regarding EPA regulations and do not necessarily reflect the EPA’s current thinking on section 111(d). Each presenter highlighted his assumptions and clarified that actual 111(d) regulations could vary significantly from these assumptions. Despite these caveats, the mod-els highlighted three broad observations about the possible effects of various policy designs:
1. A national, unit-specific requirement would likely lead to significantly different impacts, including compliance costs, across geographic regions.
2. The incorporation of flexible mechanisms—such as averaging, trading, or incorporating renewables and energy efficiency—into state plans would likely have different impacts across geographic regions.
3. Regulatory design could seek to balance regional differences with the goal of national uniformity.
20. § 7411(a)(1).21. § 7411(d)(2).22. See e.g., 40 C.F.R. § 60.82 (2011) (subjecting each covered sulfuric acid production unit to an emission rate of 4 pounds sulfur dioxide per ton of acid produced). 23. Clean Air Mercury Rule, 70 Fed. Reg. 28,606, 28,606 (May 18, 2005).24. For a detailed explanation of the NRDC proposal see Daniel A. Lashof et al., Natural Res. Def. Council, Closing the Power Plant Carbon Pollution Loophole: Smart Ways the Clean Air Act Can Clean Up America’s Biggest Climate Polluters (2012), http://www.nrdc.org/air/pollution-standards/files/pollution-standards-report.pdf.
Regulating Carbon Dioxide under Section 111(d) of the Clean Air Act: Options, Limits, and Impacts
Nicholas Institute
8
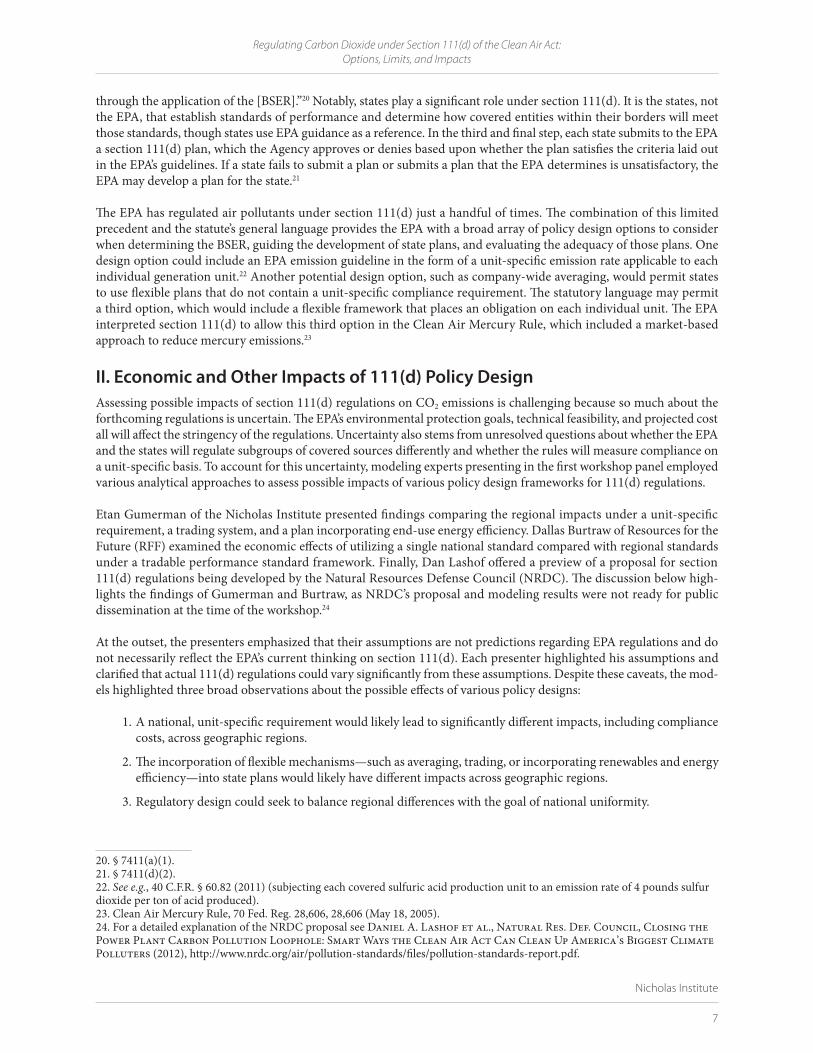
A. Regional Impacts of a Unit-Specific RequirementRequiring compliance on a unit-by-unit basis with no flexibility may affect regions differently in terms of unit retire-ments and CO2 reductions. Gumerman analyzed the impacts of policy design on coal-fired electricity generating units located in the Eastern Interconnection power grid (fig. 1).
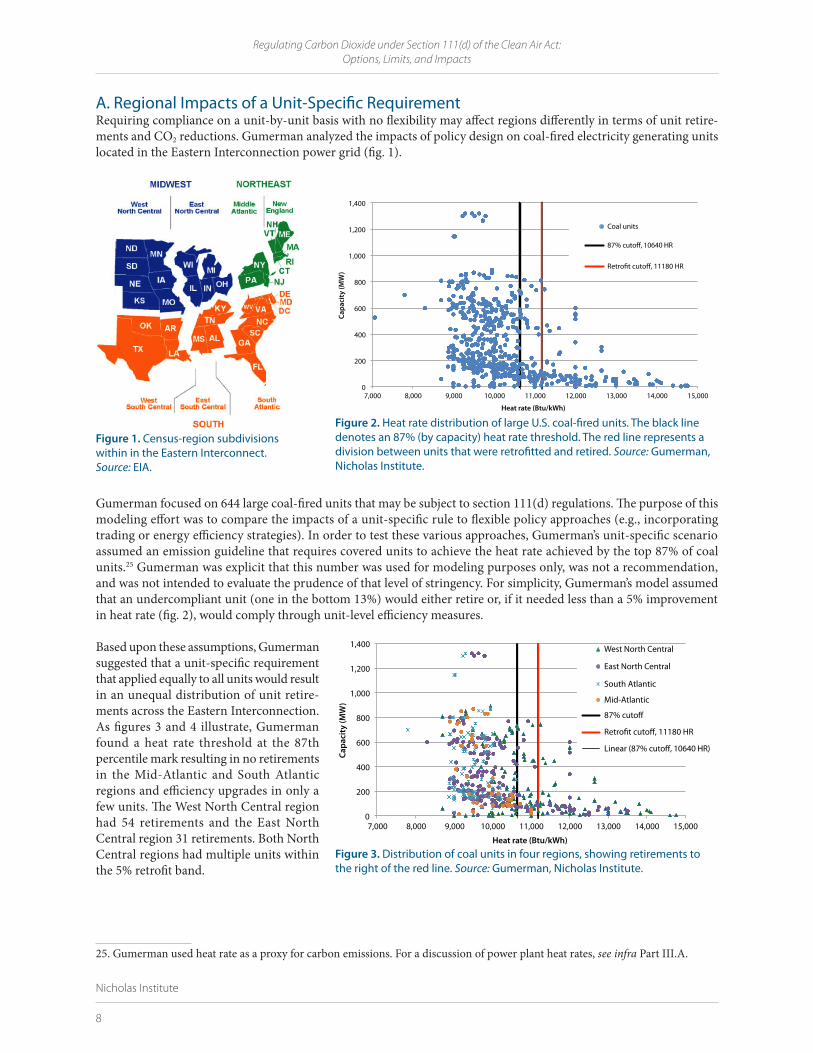
Gumerman focused on 644 large coal-fired units that may be subject to section 111(d) regulations. The purpose of this modeling effort was to compare the impacts of a unit-specific rule to flexible policy approaches (e.g., incorporating trading or energy efficiency strategies). In order to test these various approaches, Gumerman’s unit-specific scenario assumed an emission guideline that requires covered units to achieve the heat rate achieved by the top 87% of coal units.25 Gumerman was explicit that this number was used for modeling purposes only, was not a recommendation, and was not intended to evaluate the prudence of that level of stringency. For simplicity, Gumerman’s model assumed that an undercompliant unit (one in the bottom 13%) would either retire or, if it needed less than a 5% improvement in heat rate (fig. 2), would comply through unit-level efficiency measures.
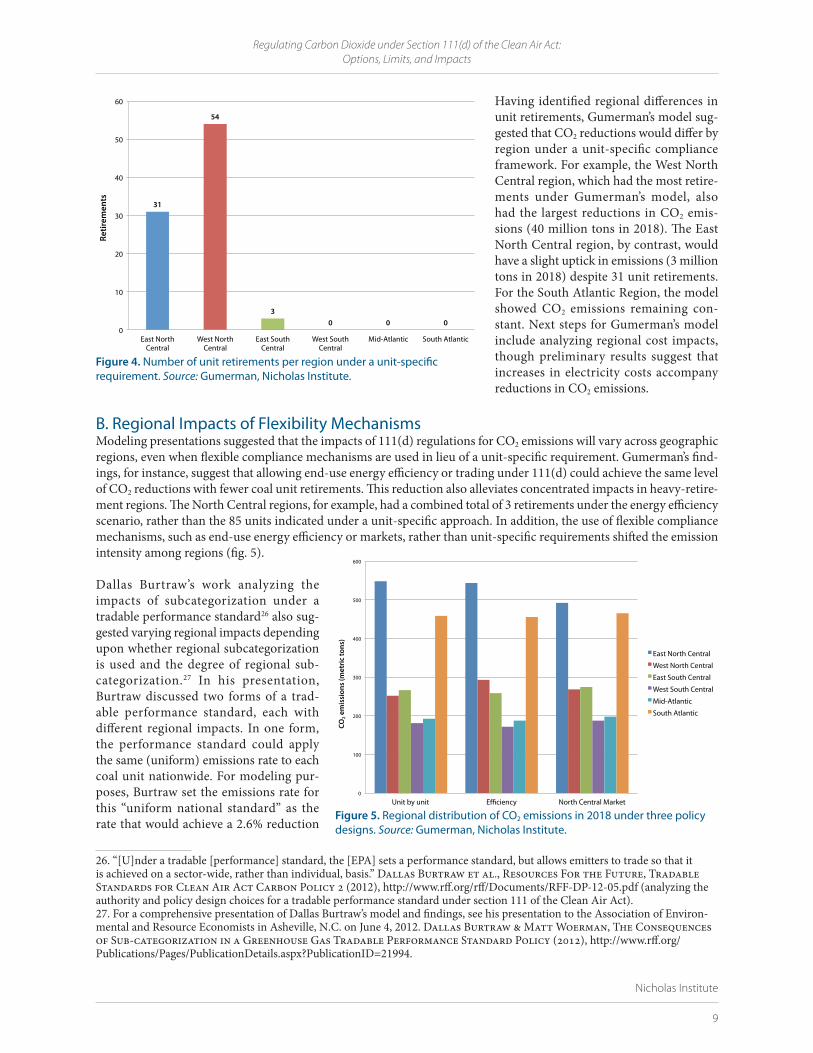
Based upon these assumptions, Gumerman suggested that a unit-specific requirement that applied equally to all units would result in an unequal distribution of unit retire-ments across the Eastern Interconnection. As figures 3 and 4 illustrate, Gumerman found a heat rate threshold at the 87th percentile mark resulting in no retirements in the Mid-Atlantic and South Atlantic regions and efficiency upgrades in only a few units. The West North Central region had 54 retirements and the East North Central region 31 retirements. Both North Central regions had multiple units within the 5% retrofit band.
25. Gumerman used heat rate as a proxy for carbon emissions. For a discussion of power plant heat rates, see infra Part III.A.
Figure 1. Census-region subdivisions within in the Eastern Interconnect. Source: EIA.
Figure 3. Distribution of coal units in four regions, showing retirements to the right of the red line. Source: Gumerman, Nicholas Institute.
0
200
400
600
800
1,000
1,200
1,400
7,000 8,000 9,000 10,000 11,000 12,000 13,000 14,000 15,000
Capa
city
(MW
)
Heat rate (Btu/kWh)
West North Central
East North Central
South Atlantic
Mid-Atlantic
87% cuto�
Retro�t cuto�, 11180 HR
Linear (87% cuto�, 10640 HR)
0
200
400
600
800
1,000
1,200
1,400
7,000 8,000 9,000 10,000 11,000 12,000 13,000 14,000 15,000
Capa
city
(MW
)
Heat rate (Btu/kWh)
Coal units
87% cuto�, 10640 HR
Retro�t cuto�, 11180 HR
Figure 2. Heat rate distribution of large U.S. coal-fired units. The black line denotes an 87% (by capacity) heat rate threshold. The red line represents a division between units that were retrofitted and retired. Source: Gumerman, Nicholas Institute.
Nicholas Institute
9
Regulating Carbon Dioxide under Section 111(d) of the Clean Air Act: Options, Limits, and Impacts
Having identified regional differences in unit retirements, Gumerman’s model sug-gested that CO2 reductions would differ by region under a unit-specific compliance framework. For example, the West North Central region, which had the most retire-ments under Gumerman’s model, also had the largest reductions in CO2 emis-sions (40 million tons in 2018). The East North Central region, by contrast, would have a slight uptick in emissions (3 million tons in 2018) despite 31 unit retirements. For the South Atlantic Region, the model showed CO2 emissions remaining con-stant. Next steps for Gumerman’s model include analyzing regional cost impacts, though preliminary results suggest that increases in electricity costs accompany reductions in CO2 emissions.
B. Regional Impacts of Flexibility MechanismsModeling presentations suggested that the impacts of 111(d) regulations for CO2 emissions will vary across geographic regions, even when flexible compliance mechanisms are used in lieu of a unit-specific requirement. Gumerman’s find-ings, for instance, suggest that allowing end-use energy efficiency or trading under 111(d) could achieve the same level of CO2 reductions with fewer coal unit retirements. This reduction also alleviates concentrated impacts in heavy-retire-ment regions. The North Central regions, for example, had a combined total of 3 retirements under the energy efficiency scenario, rather than the 85 units indicated under a unit-specific approach. In addition, the use of flexible compliance mechanisms, such as end-use energy efficiency or markets, rather than unit-specific requirements shifted the emission intensity among regions (fig. 5).
Dallas Burtraw’s work analyzing the impacts of subcategorization under a tradable performance standard26 also sug-gested varying regional impacts depending upon whether regional subcategorization is used and the degree of regional sub-categorization.27 In his presentation, Burtraw discussed two forms of a trad-able performance standard, each with different regional impacts. In one form, the performance standard could apply the same (uniform) emissions rate to each coal unit nationwide. For modeling pur-poses, Burtraw set the emissions rate for this “uniform national standard” as the rate that would achieve a 2.6% reduction
26. “[U]nder a tradable [performance] standard, the [EPA] sets a performance standard, but allows emitters to trade so that it is achieved on a sector-wide, rather than individual, basis.” Dallas Burtraw et al., Resources For the Future, Tradable Standards for Clean Air Act Carbon Policy 2 (2012), http://www.rff.org/rff/Documents/RFF-DP-12-05.pdf (analyzing the authority and policy design choices for a tradable performance standard under section 111 of the Clean Air Act). 27. For a comprehensive presentation of Dallas Burtraw’s model and findings, see his presentation to the Association of Environ-mental and Resource Economists in Asheville, N.C. on June 4, 2012. Dallas Burtraw & Matt Woerman, The Consequences of Sub-categorization in a Greenhouse Gas Tradable Performance Standard Policy (2012), http://www.rff.org/Publications/Pages/PublicationDetails.aspx?PublicationID=21994.
Figure 4. Number of unit retirements per region under a unit-specific requirement. Source: Gumerman, Nicholas Institute.
31
54
3 0 0 0
0
10
20
30
40
50
60
East North Central
West North Central
East South Central
West South Central
Mid-Atlantic South Atlantic
Retir
emen
ts
Figure 5. Regional distribution of CO2 emissions in 2018 under three policy designs. Source: Gumerman, Nicholas Institute.
0
100
200
300
400
500
600
Unit by unit E ciency North Central Market
CO
2 em
issi
ons
(met
ric
tons
)
East North Central
West North Central
East South Central
West South Central
Mid-Atlantic
South Atlantic
Regulating Carbon Dioxide under Section 111(d) of the Clean Air Act: Options, Limits, and Impacts
Nicholas Institute
10
in total national CO2 emissions from a national baseline by 2020. Burtraw’s model shows that the emissions rates of the most efficient electric generating units would fall below this emissions rate, while the emissions rates of inefficient units would exceed the standard. Highly efficient units would comply without retrofits and there-fore would have no compliance costs.
In an alternative form, the performance standard could incorporate regional subcategorization, rather than apply a uniform standard nationwide. Under this subcategorization method, the standard might subject each unit in a region to the emission rate that would result in a cer-tain percent reduction (e.g., 2.6%) of total regional emissions from a regional base-line by a certain date (e.g., 2020). Burtraw’s model shows that regional subcategorization could reduce overall transfers of wealth among producers and regions but increase total compliance costs. It could shift the compliance burden from inefficient regions to efficient regions, compared with a uniform national standard. For example, because of the differ-ence in performance benchmarks (fig. 6), the average unit in an efficient region might comply without modifications under a national standard but have to reduce emissions under a policy with regional subcategorization. Conversely, an inefficient unit may have to improve an emission rate dramatically under a national approach but only moderately under a region-based emission rate. In this way, regions with efficient units bear a higher cost burden under a trad-able performance standard with regional subcategorization (and even higher costs with state-level subcategorization) compared with a uniform national standard.
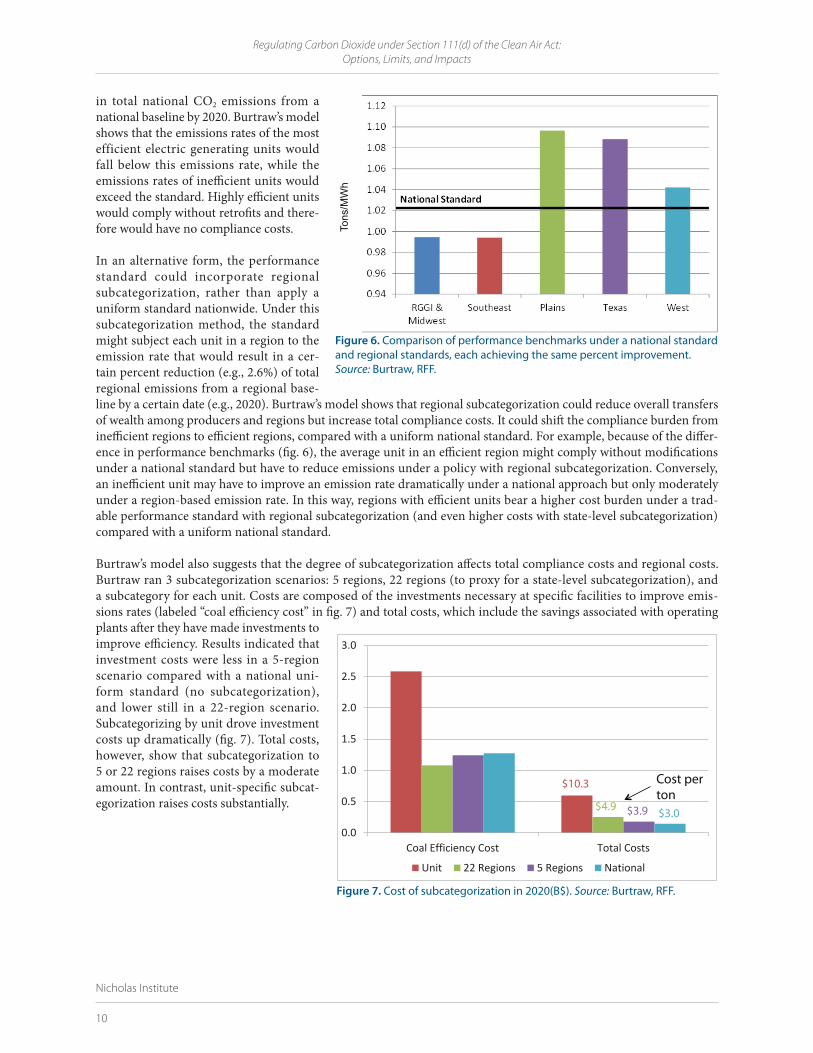
Burtraw’s model also suggests that the degree of subcategorization affects total compliance costs and regional costs. Burtraw ran 3 subcategorization scenarios: 5 regions, 22 regions (to proxy for a state-level subcategorization), and a subcategory for each unit. Costs are composed of the investments necessary at specific facilities to improve emis-sions rates (labeled “coal efficiency cost” in fig. 7) and total costs, which include the savings associated with operating plants after they have made investments to improve efficiency. Results indicated that investment costs were less in a 5-region scenario compared with a national uni-form standard (no subcategorization), and lower still in a 22-region scenario. Subcategorizing by unit drove investment costs up dramatically (fig. 7). Total costs, however, show that subcategorization to 5 or 22 regions raises costs by a moderate amount. In contrast, unit-specific subcat-egorization raises costs substantially.
Figure 6. Comparison of performance benchmarks under a national standard and regional standards, each achieving the same percent improvement. Source: Burtraw, RFF.
Tons
/MW
h
0.0
0.5
1.0
1.5
2.0
2.5
3.0
Coal Efficiency Cost Total Costs
Unit 22 Regions 5 Regions National
$10.3 Cost per ton
$4.9 $3.9 $3.0
Figure 7. Cost of subcategorization in 2020(B$). Source: Burtraw, RFF.
Nicholas Institute
11
Regulating Carbon Dioxide under Section 111(d) of the Clean Air Act: Options, Limits, and Impacts
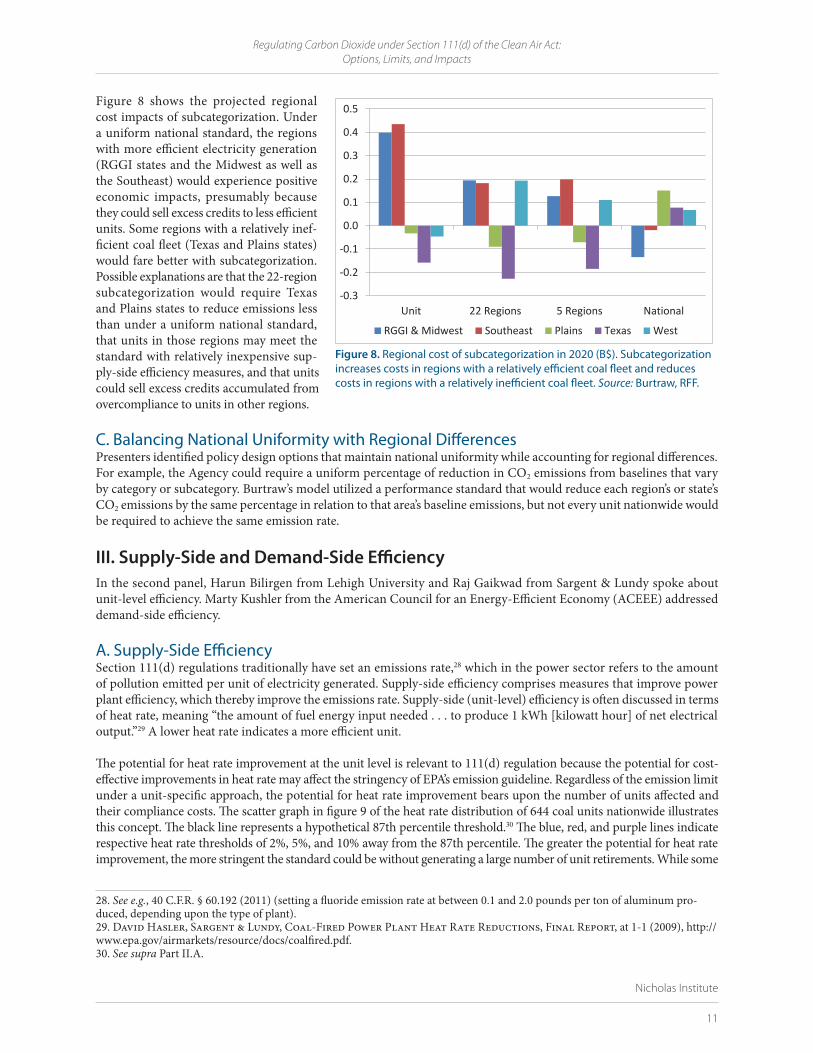
Figure 8 shows the projected regional cost impacts of subcategorization. Under a uniform national standard, the regions with more efficient electricity generation (RGGI states and the Midwest as well as the Southeast) would experience positive economic impacts, presumably because they could sell excess credits to less efficient units. Some regions with a relatively inef-ficient coal fleet (Texas and Plains states) would fare better with subcategorization. Possible explanations are that the 22-region subcategorization would require Texas and Plains states to reduce emissions less than under a uniform national standard, that units in those regions may meet the standard with relatively inexpensive sup-ply-side efficiency measures, and that units could sell excess credits accumulated from overcompliance to units in other regions.
C. Balancing National Uniformity with Regional DifferencesPresenters identified policy design options that maintain national uniformity while accounting for regional differences. For example, the Agency could require a uniform percentage of reduction in CO2 emissions from baselines that vary by category or subcategory. Burtraw’s model utilized a performance standard that would reduce each region’s or state’s CO2 emissions by the same percentage in relation to that area’s baseline emissions, but not every unit nationwide would be required to achieve the same emission rate.
III. Supply-Side and Demand-Side EfficiencyIn the second panel, Harun Bilirgen from Lehigh University and Raj Gaikwad from Sargent & Lundy spoke about unit-level efficiency. Marty Kushler from the American Council for an Energy-Efficient Economy (ACEEE) addressed demand-side efficiency.
A. Supply-Side EfficiencySection 111(d) regulations traditionally have set an emissions rate,28 which in the power sector refers to the amount of pollution emitted per unit of electricity generated. Supply-side efficiency comprises measures that improve power plant efficiency, which thereby improve the emissions rate. Supply-side (unit-level) efficiency is often discussed in terms of heat rate, meaning “the amount of fuel energy input needed . . . to produce 1 kWh [kilowatt hour] of net electrical output.”29 A lower heat rate indicates a more efficient unit.
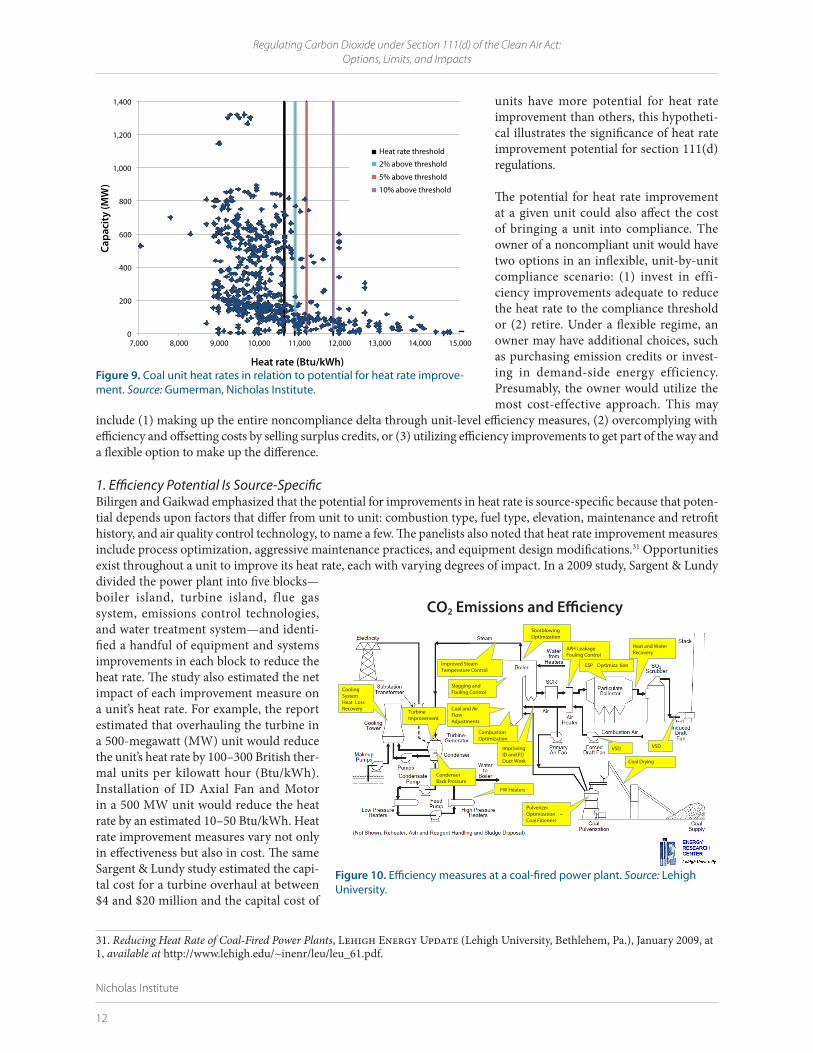
The potential for heat rate improvement at the unit level is relevant to 111(d) regulation because the potential for cost-effective improvements in heat rate may affect the stringency of EPA’s emission guideline. Regardless of the emission limit under a unit-specific approach, the potential for heat rate improvement bears upon the number of units affected and their compliance costs. The scatter graph in figure 9 of the heat rate distribution of 644 coal units nationwide illustrates this concept. The black line represents a hypothetical 87th percentile threshold.30 The blue, red, and purple lines indicate respective heat rate thresholds of 2%, 5%, and 10% away from the 87th percentile. The greater the potential for heat rate improvement, the more stringent the standard could be without generating a large number of unit retirements. While some
28. See e.g., 40 C.F.R. § 60.192 (2011) (setting a fluoride emission rate at between 0.1 and 2.0 pounds per ton of aluminum pro-duced, depending upon the type of plant).29. David Hasler, Sargent & Lundy, Coal-Fired Power Plant Heat Rate Reductions, Final Report, at 1-1 (2009), http://www.epa.gov/airmarkets/resource/docs/coalfired.pdf.30. See supra Part II.A.
Figure 8. Regional cost of subcategorization in 2020 (B$). Subcategorization increases costs in regions with a relatively efficient coal fleet and reduces costs in regions with a relatively inefficient coal fleet. Source: Burtraw, RFF.
-‐0.3
-‐0.2
-‐0.1
0.0
0.1
0.2
0.3
0.4
0.5
Unit 22 Regions 5 Regions National
RGGI & Midwest Southeast Plains Texas West
Regulating Carbon Dioxide under Section 111(d) of the Clean Air Act: Options, Limits, and Impacts
Nicholas Institute
12
units have more potential for heat rate improvement than others, this hypotheti-cal illustrates the significance of heat rate improvement potential for section 111(d) regulations.
The potential for heat rate improvement at a given unit could also affect the cost of bringing a unit into compliance. The owner of a noncompliant unit would have two options in an inflexible, unit-by-unit compliance scenario: (1) invest in effi-ciency improvements adequate to reduce the heat rate to the compliance threshold or (2) retire. Under a flexible regime, an owner may have additional choices, such as purchasing emission credits or invest-ing in demand-side energy efficiency. Presumably, the owner would utilize the most cost-effective approach. This may
include (1) making up the entire noncompliance delta through unit-level efficiency measures, (2) overcomplying with efficiency and offsetting costs by selling surplus credits, or (3) utilizing efficiency improvements to get part of the way and a flexible option to make up the difference.
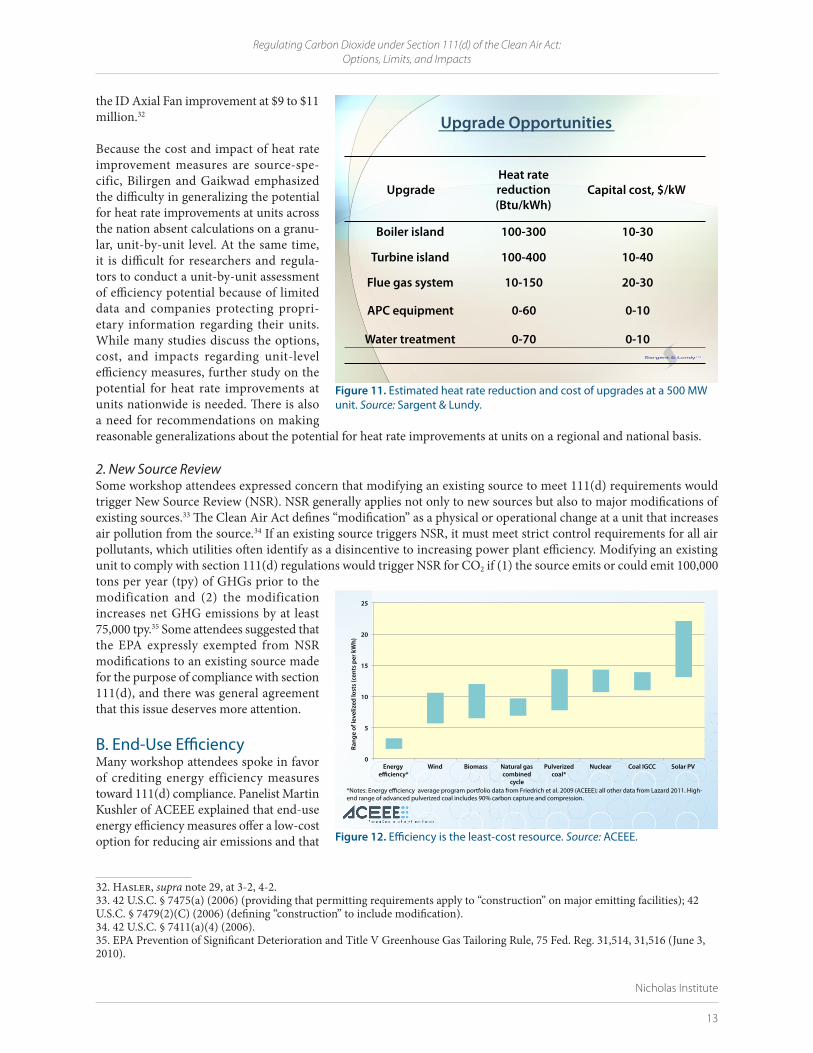
1. Efficiency Potential Is Source-SpecificBilirgen and Gaikwad emphasized that the potential for improvements in heat rate is source-specific because that poten-tial depends upon factors that differ from unit to unit: combustion type, fuel type, elevation, maintenance and retrofit history, and air quality control technology, to name a few. The panelists also noted that heat rate improvement measures include process optimization, aggressive maintenance practices, and equipment design modifications.31 Opportunities exist throughout a unit to improve its heat rate, each with varying degrees of impact. In a 2009 study, Sargent & Lundy divided the power plant into five blocks—boiler island, turbine island, flue gas system, emissions control technologies, and water treatment system—and identi-fied a handful of equipment and systems improvements in each block to reduce the heat rate. The study also estimated the net impact of each improvement measure on a unit’s heat rate. For example, the report estimated that overhauling the turbine in a 500-megawatt (MW) unit would reduce the unit’s heat rate by 100–300 British ther-mal units per kilowatt hour (Btu/kWh). Installation of ID Axial Fan and Motor in a 500 MW unit would reduce the heat rate by an estimated 10–50 Btu/kWh. Heat rate improvement measures vary not only in effectiveness but also in cost. The same Sargent & Lundy study estimated the capi-tal cost for a turbine overhaul at between $4 and $20 million and the capital cost of
31. Reducing Heat Rate of Coal-Fired Power Plants, Lehigh Energy Update (Lehigh University, Bethlehem, Pa.), January 2009, at 1, available at http://www.lehigh.edu/~inenr/leu/leu_61.pdf.
0
200
400
600
800
1,000
1,200
1,400
7,000 8,000 9,000 10,000 11,000 12,000 13,000 14,000 15,000
Capa
city
(MW
)
Heat rate (Btu/kWh)
Heat rate threshold
2% above threshold
5% above threshold
10% above threshold
Figure 9. Coal unit heat rates in relation to potential for heat rate improve-ment. Source: Gumerman, Nicholas Institute.
CO2 Emissions and E�ciency
Coal and Air Flow Adjustments
Combustion Optimization
Sootblowing Optimization
Slagging and Fouling Control
APH Leakage Fouling Control
ESP Optimiza tion
Improving ID and FD Duct Work Coal Drying
Heat and Water Recovery
Pulverizer Optimization – Coal Fineness
VSD
Improved Steam Temperature Control
VSD
Condenser Back Pressure
Turbine Improvement
FW Heaters
Cooling System Heat Loss Recovery
Figure 10. Efficiency measures at a coal-fired power plant. Source: Lehigh University.
Nicholas Institute
13
Regulating Carbon Dioxide under Section 111(d) of the Clean Air Act: Options, Limits, and Impacts
the ID Axial Fan improvement at $9 to $11 million.32
Because the cost and impact of heat rate improvement measures are source-spe-cific, Bilirgen and Gaikwad emphasized the difficulty in generalizing the potential for heat rate improvements at units across the nation absent calculations on a granu-lar, unit-by-unit level. At the same time, it is difficult for researchers and regula-tors to conduct a unit-by-unit assessment of efficiency potential because of limited data and companies protecting propri-etary information regarding their units. While many studies discuss the options, cost, and impacts regarding unit-level efficiency measures, further study on the potential for heat rate improvements at units nationwide is needed. There is also a need for recommendations on making reasonable generalizations about the potential for heat rate improvements at units on a regional and national basis.
2. New Source ReviewSome workshop attendees expressed concern that modifying an existing source to meet 111(d) requirements would trigger New Source Review (NSR). NSR generally applies not only to new sources but also to major modifications of existing sources.33 The Clean Air Act defines “modification” as a physical or operational change at a unit that increases air pollution from the source.34 If an existing source triggers NSR, it must meet strict control requirements for all air pollutants, which utilities often identify as a disincentive to increasing power plant efficiency. Modifying an existing unit to comply with section 111(d) regulations would trigger NSR for CO2 if (1) the source emits or could emit 100,000 tons per year (tpy) of GHGs prior to the modification and (2) the modification increases net GHG emissions by at least 75,000 tpy.35 Some attendees suggested that the EPA expressly exempted from NSR modifications to an existing source made for the purpose of compliance with section 111(d), and there was general agreement that this issue deserves more attention.
B. End-Use EfficiencyMany workshop attendees spoke in favor of crediting energy efficiency measures toward 111(d) compliance. Panelist Martin Kushler of ACEEE explained that end-use energy efficiency measures offer a low-cost option for reducing air emissions and that
32. Hasler, supra note 29, at 3-2, 4-2.33. 42 U.S.C. § 7475(a) (2006) (providing that permitting requirements apply to “construction” on major emitting facilities); 42 U.S.C. § 7479(2)(C) (2006) (defining “construction” to include modification).34. 42 U.S.C. § 7411(a)(4) (2006).35. EPA Prevention of Significant Deterioration and Title V Greenhouse Gas Tailoring Rule, 75 Fed. Reg. 31,514, 31,516 (June 3, 2010).
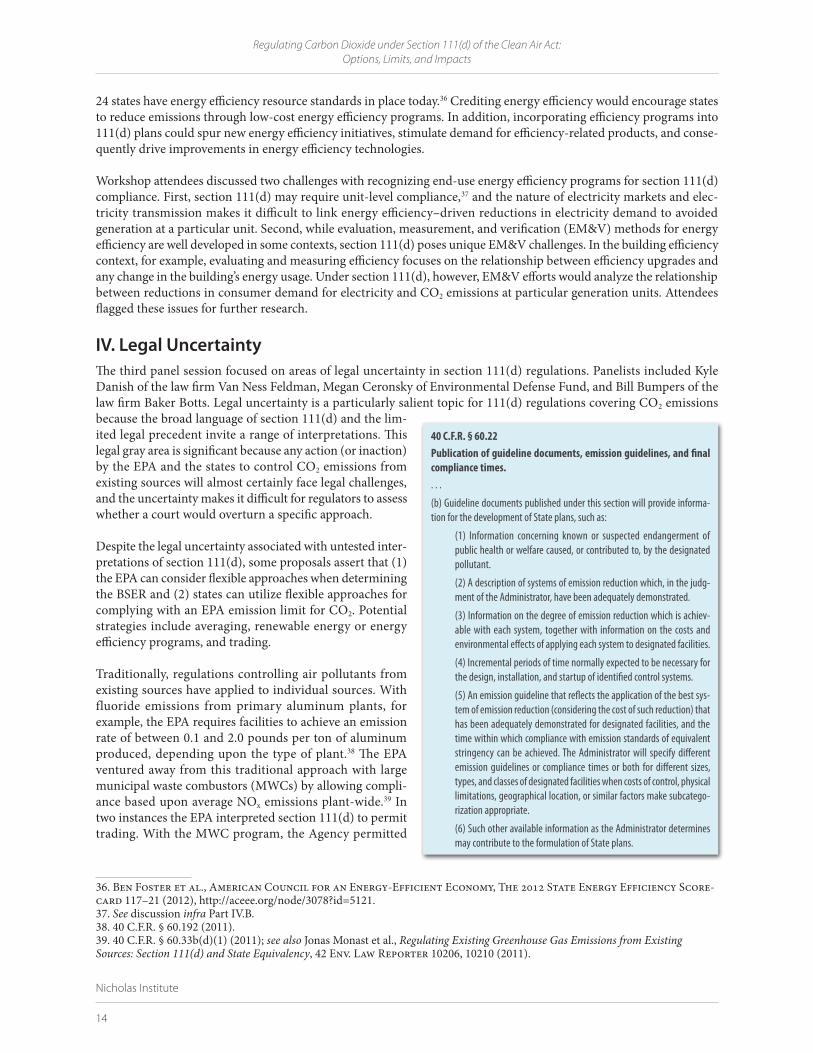
Figure 11. Estimated heat rate reduction and cost of upgrades at a 500 MW unit. Source: Sargent & Lundy.
Upgrade Opportunities
Upgrade Heat rate reduction (Btu/kWh)
Capital cost, $/kW
Boiler island 100-300 10-30
Turbine island 100-400 10-40
Flue gas system 10-150 20-30
APC equipment 0-60 0-10
Water treatment 0-70 0-10
Figure 12. Efficiency is the least-cost resource. Source: ACEEE.
0
5
10
15
20
25
Energy e�ciency*
Wind Biomass Natural gas combined
cycle
Pulverized coal*
Nuclear Coal IGCC Solar PV
Rang
e of
leve
lized
lost
s (c
ents
per
kW
h)
*Notes: Energy e ciency average program portfolio data from Friedrich et al. 2009 (ACEEE); all other data from Lazard 2011. High-end range of advanced pulverized coal includes 90% carbon capture and compression.
Regulating Carbon Dioxide under Section 111(d) of the Clean Air Act: Options, Limits, and Impacts
Nicholas Institute
14
24 states have energy efficiency resource standards in place today.36 Crediting energy efficiency would encourage states to reduce emissions through low-cost energy efficiency programs. In addition, incorporating efficiency programs into 111(d) plans could spur new energy efficiency initiatives, stimulate demand for efficiency-related products, and conse-quently drive improvements in energy efficiency technologies.
Workshop attendees discussed two challenges with recognizing end-use energy efficiency programs for section 111(d) compliance. First, section 111(d) may require unit-level compliance,37 and the nature of electricity markets and elec-tricity transmission makes it difficult to link energy efficiency–driven reductions in electricity demand to avoided generation at a particular unit. Second, while evaluation, measurement, and verification (EM&V) methods for energy efficiency are well developed in some contexts, section 111(d) poses unique EM&V challenges. In the building efficiency context, for example, evaluating and measuring efficiency focuses on the relationship between efficiency upgrades and any change in the building’s energy usage. Under section 111(d), however, EM&V efforts would analyze the relationship between reductions in consumer demand for electricity and CO2 emissions at particular generation units. Attendees flagged these issues for further research.
IV. Legal UncertaintyThe third panel session focused on areas of legal uncertainty in section 111(d) regulations. Panelists included Kyle Danish of the law firm Van Ness Feldman, Megan Ceronsky of Environmental Defense Fund, and Bill Bumpers of the law firm Baker Botts. Legal uncertainty is a particularly salient topic for 111(d) regulations covering CO2 emissions because the broad language of section 111(d) and the lim-ited legal precedent invite a range of interpretations. This legal gray area is significant because any action (or inaction) by the EPA and the states to control CO2 emissions from existing sources will almost certainly face legal challenges, and the uncertainty makes it difficult for regulators to assess whether a court would overturn a specific approach.
Despite the legal uncertainty associated with untested inter-pretations of section 111(d), some proposals assert that (1) the EPA can consider flexible approaches when determining the BSER and (2) states can utilize flexible approaches for complying with an EPA emission limit for CO2. Potential strategies include averaging, renewable energy or energy efficiency programs, and trading.
Traditionally, regulations controlling air pollutants from existing sources have applied to individual sources. With fluoride emissions from primary aluminum plants, for example, the EPA requires facilities to achieve an emission rate of between 0.1 and 2.0 pounds per ton of aluminum produced, depending upon the type of plant.38 The EPA ventured away from this traditional approach with large municipal waste combustors (MWCs) by allowing compli-ance based upon average NOx emissions plant-wide.39 In two instances the EPA interpreted section 111(d) to permit trading. With the MWC program, the Agency permitted
36. Ben Foster et al., American Council for an Energy-Efficient Economy, The 2012 State Energy Efficiency Score-card 117–21 (2012), http://aceee.org/node/3078?id=5121.37. See discussion infra Part IV.B.38. 40 C.F.R. § 60.192 (2011).39. 40 C.F.R. § 60.33b(d)(1) (2011); see also Jonas Monast et al., Regulating Existing Greenhouse Gas Emissions from Existing Sources: Section 111(d) and State Equivalency, 42 Env. Law Reporter 10206, 10210 (2011).
40 C.F.R. § 60.22Publication of guideline documents, emission guidelines, and final compliance times.. . .
(b) Guideline documents published under this section will provide informa-tion for the development of State plans, such as:
(1) Information concerning known or suspected endangerment of public health or welfare caused, or contributed to, by the designated pollutant.
(2) A description of systems of emission reduction which, in the judg-ment of the Administrator, have been adequately demonstrated.
(3) Information on the degree of emission reduction which is achiev-able with each system, together with information on the costs and environmental effects of applying each system to designated facilities.
(4) Incremental periods of time normally expected to be necessary for the design, installation, and startup of identified control systems.
(5) An emission guideline that reflects the application of the best sys-tem of emission reduction (considering the cost of such reduction) that has been adequately demonstrated for designated facilities, and the time within which compliance with emission standards of equivalent stringency can be achieved. The Administrator will specify different emission guidelines or compliance times or both for different sizes, types, and classes of designated facilities when costs of control, physical limitations, geographical location, or similar factors make subcatego-rization appropriate.
(6) Such other available information as the Administrator determines may contribute to the formulation of State plans.
Nicholas Institute
15
Regulating Carbon Dioxide under Section 111(d) of the Clean Air Act: Options, Limits, and Impacts
states to allow credit trading among MWC plants,40 and in the Clean Air Mercury Rule, the Agency created a market-based model rule.41 While the D.C. Circuit struck down the mercury rule in 2008, it did so for rea-sons unrelated to the section 111(d) trading program.42 To date, no court has ruled upon the legality of a sec-tion 111(d) trading program. Thus, the legal viability of incorporating flexibility into state plans for compliance with section 111(d) regulations is largely untested.
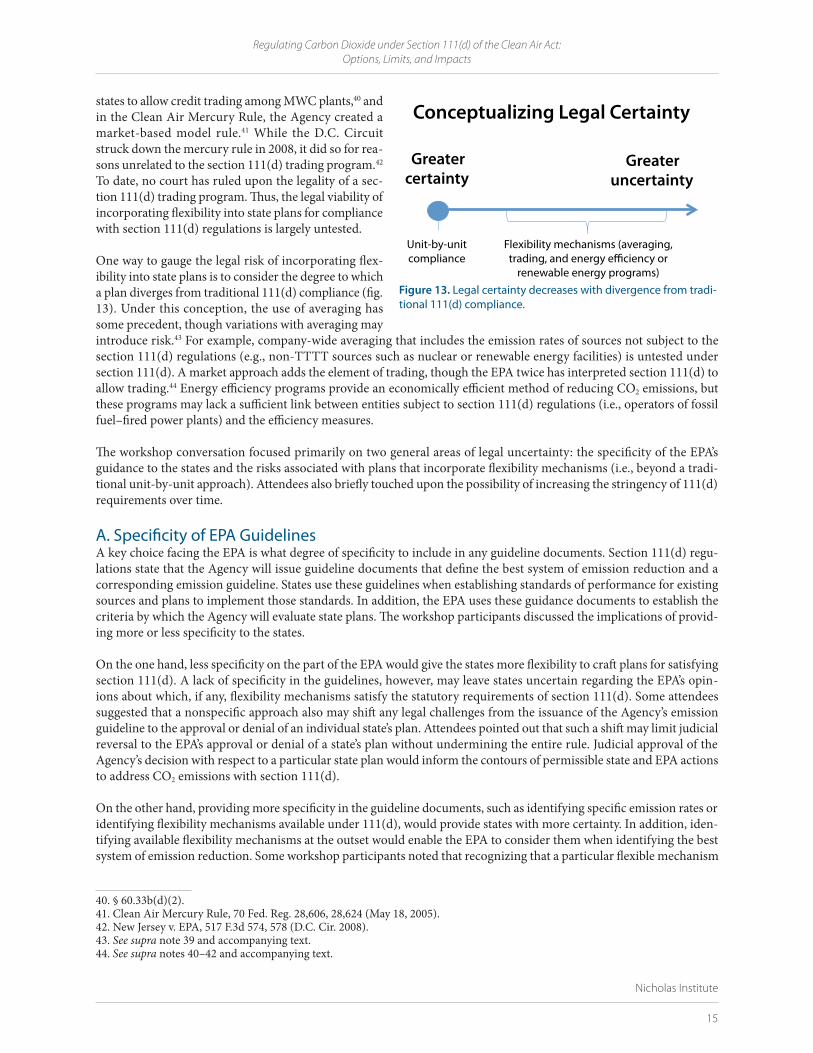
One way to gauge the legal risk of incorporating flex-ibility into state plans is to consider the degree to which a plan diverges from traditional 111(d) compliance (fig. 13). Under this conception, the use of averaging has some precedent, though variations with averaging may introduce risk.43 For example, company-wide averaging that includes the emission rates of sources not subject to the section 111(d) regulations (e.g., non-TTTT sources such as nuclear or renewable energy facilities) is untested under section 111(d). A market approach adds the element of trading, though the EPA twice has interpreted section 111(d) to allow trading.44 Energy efficiency programs provide an economically efficient method of reducing CO2 emissions, but these programs may lack a sufficient link between entities subject to section 111(d) regulations (i.e., operators of fossil fuel–fired power plants) and the efficiency measures.
The workshop conversation focused primarily on two general areas of legal uncertainty: the specificity of the EPA’s guidance to the states and the risks associated with plans that incorporate flexibility mechanisms (i.e., beyond a tradi-tional unit-by-unit approach). Attendees also briefly touched upon the possibility of increasing the stringency of 111(d) requirements over time.
A. Specificity of EPA GuidelinesA key choice facing the EPA is what degree of specificity to include in any guideline documents. Section 111(d) regu-lations state that the Agency will issue guideline documents that define the best system of emission reduction and a corresponding emission guideline. States use these guidelines when establishing standards of performance for existing sources and plans to implement those standards. In addition, the EPA uses these guidance documents to establish the criteria by which the Agency will evaluate state plans. The workshop participants discussed the implications of provid-ing more or less specificity to the states.
On the one hand, less specificity on the part of the EPA would give the states more flexibility to craft plans for satisfying section 111(d). A lack of specificity in the guidelines, however, may leave states uncertain regarding the EPA’s opin-ions about which, if any, flexibility mechanisms satisfy the statutory requirements of section 111(d). Some attendees suggested that a nonspecific approach also may shift any legal challenges from the issuance of the Agency’s emission guideline to the approval or denial of an individual state’s plan. Attendees pointed out that such a shift may limit judicial reversal to the EPA’s approval or denial of a state’s plan without undermining the entire rule. Judicial approval of the Agency’s decision with respect to a particular state plan would inform the contours of permissible state and EPA actions to address CO2 emissions with section 111(d).
On the other hand, providing more specificity in the guideline documents, such as identifying specific emission rates or identifying flexibility mechanisms available under 111(d), would provide states with more certainty. In addition, iden-tifying available flexibility mechanisms at the outset would enable the EPA to consider them when identifying the best system of emission reduction. Some workshop participants noted that recognizing that a particular flexible mechanism
40. § 60.33b(d)(2).41. Clean Air Mercury Rule, 70 Fed. Reg. 28,606, 28,624 (May 18, 2005).42. New Jersey v. EPA, 517 F.3d 574, 578 (D.C. Cir. 2008).43. See supra note 39 and accompanying text.44. See supra notes 40–42 and accompanying text.
Figure 13. Legal certainty decreases with divergence from tradi-tional 111(d) compliance.
Conceptualizing Legal Certainty
Unit-by-unit compliance
Flexibility mechanisms (averaging, trading, and energy e ciency or
renewable energy programs)
Greater certainty
Greater uncertainty
Regulating Carbon Dioxide under Section 111(d) of the Clean Air Act: Options, Limits, and Impacts
Nicholas Institute
16
could qualify as the BSER could justify a more stringent emissions limit. Some participants also posited that because flexible mechanisms control CO2 more cost-effectively than the traditional inflexible alternative, failure to identify a flexible mechanism as the BSER would leave the EPA vulnerable to the legal argument that it did not choose the “best system” of emission reduction. As described above, however, the Agency could be challenged for endorsing a flexible approach as the BSER. In addition, using a flexible framework could subject the EPA to political risk if members of Congress feel that the EPA is attempting to impose a carbon market on the states.
B. Crediting Reductions “Beyond the Fence Line”Workshop attendees tended to agree that mandating unit-by-unit compliance would carry minimal legal risk under the statute. There also was general agreement that the most significant area of legal uncertainty involves moving from a unit-by-unit approach to any approach that allows greater flexibility (i.e., moving beyond the fence line of the unit). The pivotal legal question is whether the term “best system of emission reduction” allows regulators to design a plan that does not require each unit itself to achieve specific lev-els of emission reductions. If the answer to that question is affirmative, then participants felt there is relatively less legal risk associated with choosing among flexible approaches, such as averaging, trading, or allowing energy efficiency or renewable energy to count towards compliance. Participants’ views diverged, however, when it came to assessing the relative risk associated with the range of flexible mechanisms.
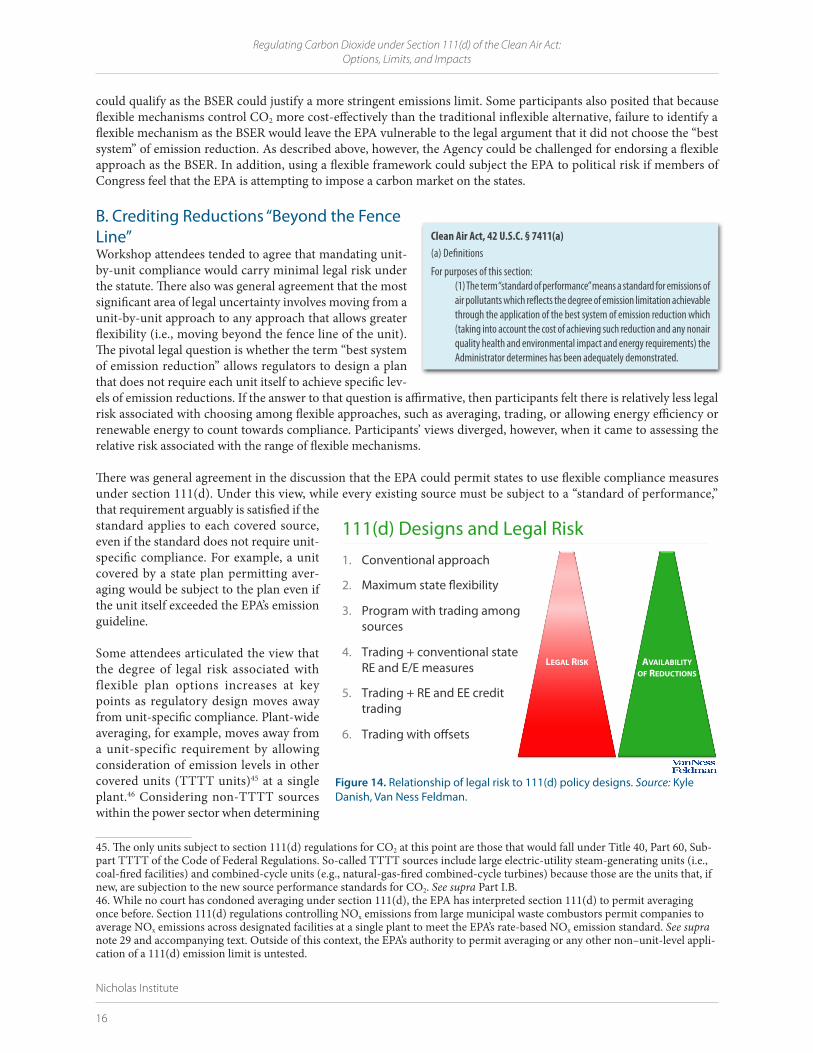
There was general agreement in the discussion that the EPA could permit states to use flexible compliance measures under section 111(d). Under this view, while every existing source must be subject to a “standard of performance,” that requirement arguably is satisfied if the standard applies to each covered source, even if the standard does not require unit-specific compliance. For example, a unit covered by a state plan permitting aver-aging would be subject to the plan even if the unit itself exceeded the EPA’s emission guideline.
Some attendees articulated the view that the degree of legal risk associated with flexible plan options increases at key points as regulatory design moves away from unit-specific compliance. Plant-wide averaging, for example, moves away from a unit-specific requirement by allowing consideration of emission levels in other covered units (TTTT units)45 at a single plant.46 Considering non-TTTT sources within the power sector when determining
45. The only units subject to section 111(d) regulations for CO2 at this point are those that would fall under Title 40, Part 60, Sub-part TTTT of the Code of Federal Regulations. So-called TTTT sources include large electric-utility steam-generating units (i.e., coal-fired facilities) and combined-cycle units (e.g., natural-gas-fired combined-cycle turbines) because those are the units that, if new, are subjection to the new source performance standards for CO2. See supra Part I.B.46. While no court has condoned averaging under section 111(d), the EPA has interpreted section 111(d) to permit averaging once before. Section 111(d) regulations controlling NOx emissions from large municipal waste combustors permit companies to average NOx emissions across designated facilities at a single plant to meet the EPA’s rate-based NOx emission standard. See supra note 29 and accompanying text. Outside of this context, the EPA’s authority to permit averaging or any other non–unit-level appli-cation of a 111(d) emission limit is untested.
Figure 14. Relationship of legal risk to 111(d) policy designs. Source: Kyle Danish, Van Ness Feldman.
111(d) Designs and Legal Risk 1. Conventional approach
2. Maximum state exibility
3. Program with trading among sources
4. Trading + conventional state RE and E/E measures
5. Trading + RE and EE credit trading
6. Trading with o sets
4
LEGAL RISK AVAILABILITY OF REDUCTIONS
Clean Air Act, 42 U.S.C. § 7411(a)(a) Definitions
For purposes of this section: (1) The term “standard of performance” means a standard for emissions of air pollutants which reflects the degree of emission limitation achievable through the application of the best system of emission reduction which (taking into account the cost of achieving such reduction and any nonair quality health and environmental impact and energy requirements) the Administrator determines has been adequately demonstrated.
Nicholas Institute
17
Regulating Carbon Dioxide under Section 111(d) of the Clean Air Act: Options, Limits, and Impacts
111(d) compliance introduces additional legal uncertainty. Suppose a state’s implementation plan permits company-wide averaging that includes new units and/or renewable sources, which are not TTTT sources. Because section 111(d) regulations apply to TTTT sources only, it is unclear that the Clean Air Act permits TTTT sources to comply by using CO2 emission levels at non-TTTT sources. Considering emission levels at non-TTTT sources also presents legal uncertainty because the EPA has never credited out-of-category sources and doing so is untested in court. Participants discussed the possibility of avoiding the legal uncertainty by keeping the compliance obligation on the TTTT units, with the assumption that renewable energy generation, dispatch shifts, and end-use energy efficiency could reduce overall electricity generation at TTTT sources, thereby reducing overall emissions. In a market system, for example, the compliance obligation of surrendering emission allowances remains on the TTTT source, but actions at non-TTTT sources (e.g., increased generation of renewables) can reduce the covered source’s emissions and the requisite number of allowances it must surrender.
Interstate cooperation, such as an interstate trading program, may raise another legal question because 111(d) regulations contemplate state-specific state implementation plans (SIPs). Interstate trading would require regional com-munication and SIP coordination among states that are not provided for in the Act. Looking beyond the power sector when evaluating compliance by a TTTT source may require another legal jump. Certain offsets, such as agricultural sequestration, avoided deforestation projects, and reducing vehicle emissions, would fall into this category. Crediting offsets may violate section 111(d) because entities subject to 111(d) for CO2 emissions are in the power sector and permitting offsets would allow those entities to comply with an emission standard through actions in a completely different sector.
C. Increasing Stringency of 111(d) RequirementsAttendees also raised the possibility of 111(d) requirements becoming more stringent over time. First, the discussion explored the issues raised by the EPA releasing an emission limit of increasing stringency. In the Clean Air Mercury Rule, for example, the EPA identified one limit for 2010 and a tighter limit for 2018,47 but the EPA’s authority to issue an emissions schedule of increasing stringency is untested in court. Nevertheless, if a trading mechanism constitutes a BSER and can achieve a degree of emission limitation that increases over time, a state-established standard of perfor-mance arguably must reflect that emission limit. Second, attendees discussed the possibility of the EPA requiring states to revise 111(d) standards at a later date and noted that the issue requires further investigation.
IV. ConclusionThe EPA is statutorily obligated under section 111(d) of the Act to regulate CO2 emissions from existing power plants. This mandate provides an opportunity for the EPA to regulate a large portion of domestic CO2 emissions while provid-ing states the flexibility to develop cost-effective compliance plans. Discussion at the stakeholder workshop highlighted many known factors in regulating existing sources of CO2 emissions. For instance, the broad statutory language and limited legal precedent provide the EPA and states opportunities to interpret section 111(d) in new ways. In addition, the impact of 111(d) regulations will vary across regions and largely depend upon policy design. Section 111(d) also requires the EPA to determine the best system of emission reductions and corresponding emission limit, the appropriate degree of specificity for guideline documents, which flexibility mechanisms to accept in state plans, and how broadly to read the statutory language. The stakes are high, and it is uncertain how the EPA’s interpretation of section 111(d) will fare under judicial scrutiny. What is clear is that the final rule for existing sources will affect environmental integrity, compliance costs, business certainty, long-term investment decisions for the electric sector, and the legal stability of the regulations.
47. Clean Air Mercury Rule, 70 Fed. Reg. 28,606, 28,606 (May 18, 2005).

Regulating Carbon Dioxide under Section 111(d) of the Clean Air Act: Options, Limits, and Impacts
Nicholas Institute
18
the Nicholas InstituteThe Nicholas Institute for Environmental Policy Solutions at Duke University is a nonpartisan institute founded in 2005 to help decision makers in gov-ernment, the private sector, and the nonprofit community address critical environmental challenges. The Institute responds to the demand for high-quality and timely data and acts as an “honest broker” in policy debates by convening and fostering open, ongoing dialogue between stakeholders on all sides of the issues and providing policy-relevant analysis based on academic research. The Institute’s leadership and staff leverage the broad expertise of Duke University as well as public and private partners world-wide. Since its inception, the Institute has earned a distinguished reputation for its innovative approach to developing multilateral, nonpartisan, and economically viable solutions to pressing environmental challenges.
for more information please contact:
Nicholas Institute for Environmental Policy SolutionsDuke UniversityBox 90335Durham, North Carolina 27708919.613.8709919.613.8712 [email protected]
copyright © 2013 Nicholas Institute for Environmental Policy Solutions