Parkwood Elementary School (0879) -...
88
1 Parkwood Elementary School (0879) PL 221 PLAN 2016-2019 SCHOOL YEAR
Transcript of Parkwood Elementary School (0879) -...

1
Parkwood Elementary School (0879)
PL 221 PLAN
2016-2019 SCHOOL YEAR

2
Submitted: Fall, 2016 Table of Contents
Title Page Executive Summary (Description of school, purpose, achievements)
• Cultural Competency • Parental Participation • Attendance • Safe and Disciplined Learning Environment • Technology
3 4 4 5 5 7
Curriculum and Instruction Titles and descriptions of Assessment Summary of Comprehensive Needs Assessment Mission, Vision, Beliefs Leadership Team Strategies to Attract High-Quality, Highly-Qualified Teachers Opportunities for Shared Decision Making Three-Year Goals Implementation of School Wide Reform-Data Summary and Action Plans
• Data Wise- ELA • Data Wise- Math • Data Wise- School Culture/PRIDE
Implementation of Schoolwide Reform/Strategies to Serve At-Risk Learners Preschool Transition Plan Statutes to be Waived
8 9 10 10 11 11 13 14 15 15 18 21 23 24 26
Appendix • School Data • Survey Data link • Literacy Framework • Parent Involvement Policy • Parent-Student-Teacher Compact • Professional Development Plan • Highly Qualified Staff Documentation • Schoolwide Behavior Expectations • Comprehensive Needs Assessment • School Planning Review Team • Building Level Assurance Form
27 27 29 30 36 30 40 45 49 50 87 88

3
Executive Summary
(Overview) School and Community Description Parkwood Elementary School is a K-5 public education facility. Parkwood Elementary is one of 12 elementary schools under the jurisdiction of the Greater Clark County School Corporation. The corporation has three middle schools and three high schools strategically located to serve a geographically and ethnically diverse community. The Greater Clark County Schools is situated in southeastern Indiana; its southern border is the Ohio River and across the river is Louisville, Kentucky. The Greater Clark community is an area of mixed income with 55% of the students receiving free or reduced lunch. The Parkwood community is comprised of single family dwellings and 8 apartment complexes. Student Demographics The current population of Parkwood Elementary School is about 560 students. The population is slightly down from last school year and falls short of the highest enrollment of 593 in 2006.
’11-‘12
’12-‘13
’13-‘14
’14-‘15
’15-‘16
’16-‘17
Black 11% 10% 9% 8.5% 9% 8% Hispanic 37% 39% 47% 52% 57% 53% White 45% 44% 37% 33% 30% 30% Multi 5% 6% 7% 6.5% 8% 8%
In the fall of 2001, 32% of the students received free and reduced lunch. In the fall of 2016, just under 90% of the students are receiving free and reduced lunch.

4
Cultural Competency Parkwood Elementary is committed to being a culturally responsive school and believes in fostering a dedicated and caring staff that use instructional strategies and practices that reflect the unique demographic of our school and culture. For the 2016-2017 school year, our school is 53% Hispanic. Our school has a high ELL population and currently have five ELL teachers and one ELL tutor to meet the needs of our language learners. Parkwood Elementary teachers and staff are committed to learning best practices in the area of the language learning and development. We have dedicated a full time ELL teacher that primarily supports in the kindergarten classrooms to ensure the language development of our students new to the country and those who have limited language proficiency. This also helps our students and families make a smooth transition to school with a great emphasis on communication and family involvement. Our ELL tutor also serves in the capacity of building relationships with all of our Hispanic families as a community liaison. He helps translate documents, makes personal phone calls and connections, as well as attends events to support our families. Our staff receives professional development at the beginning of each school year, facilitated by our ELL team to provide our teachers with specific strategies related to the WIDA standards and Can-Do Descriptors. This training was conducted in August of 2016. Our ELL staff also provides instructional guidance on how to support our language learners across the curriculum and to be culturally responsive to the different aspects of each individual race and ethnicity. Each year, Parkwood Elementary school has a Cultural Fair in the spring to promote diversity education and acceptance. At the fair, students and families are able to view different artifacts from around the world as well as participate in different cultural activities. Students and families also get the opportunity to interact with people from different countries. This event is co-sponsored by Indiana University Southeast as a partnership to increase our cultural education. Parent Participation Parkwood Elementary School Hosts multiple events throughout the school year to increase parent participation. We frequently use the School Messenger system to inform parents of activities happening at the school. During Back-to-School night in July, a total of 453 students attended with at least one parent or guardian.

5
The Parkwood PTO meets monthly and is involved in many student centered activities at the school. The PTO hosts a movie night at the school and sponsors a tailgate lunch on a quarterly basis. The PTO also supports our Enrichment Clubs, which meet each semester and allow an opportunity for students to participate in special after-school projects tailored to their interests. The school hosts math and literacy nights where parents are invited to engage with teachers in supporting student achievement. These events take place each semester and families learn specific strategies on how to help their students at home with literacy and math. Parkwood Elementary has a Community Committee that meets to plan these events and meets on a regular basis to ensure we are effectively finding ways to keep parents involved with our students. The school partners with Communities in Schools to help support working parents with before and after school supervision. English Language Parent Nights are scheduled throughout the year and focus on supporting language acquisition through a home and school partnership. Additionally, there is an adult English Language Learner course on the school grounds in which many of our parents participate. Attendance Our student attendance percentage rate for the 2015-16 school year was 95.4%, slightly above the district average. For the 2016-2017 school year, our goal will be to meet or exceed 96% attendance. Student attendance is part of our school wide expectations through our Positive Behavior Intervention System, and we have a plan to increase our attendance rates. We promote student attendance by recognizing those students with perfect attendance each quarter. We discuss the importance of attendance and arriving to school on time at our school wide assemblies. Our Student Accounts Manager, a member of our office staff, makes personal phone calls daily to check on student attendance and works with our families who need assistance with regard to being on time to school and making transportation arrangements. Safe and Orderly Environment (PRIDE) Parkwood Elementary proudly is part of the PRIDE initiative in Greater Clark County Schools. Part of the PRIDE (Persistence, Respectfulness, Initiative, Dependability, & Efficiency) initiative is to create school wide expectations to ensure that students demonstrate PRIDE. At Parkwood Elementary, we have

6
created a school wide matrix that defines our positive behavior expectations for each area of our building. This system was created by our Building Leadership Team and was revised for the 2016-17 school year. Each classroom follows our school wide expectations and these are clearly displayed throughout our building. To ensure that all of our students demonstrate PRIDE, out students receive a PRIDE score on their quarterly report cards. At Parkwood, we want all of our students to receive the top PRIDE score. We have created special incentives to promote positive behavior and pride. Each quarter, our students work towards earning a PRIDE score from 0-2. Any students receiving a 1 or 2, are able to participate in a school wide celebration each quarter. In the 2015-16 school year, our average PRIDE score at Parkwood was 1.3. Our goal for 2016-17 is 1.5. Our plan to increase our PRIDE scores is to promote our school wide PRIDE initiative and reward students with quarterly celebrations. Students who do not meet the PRIDE goal, will receive instruction through a character building class. Additionally, we promote school wide PRIDE by recognizing classrooms who are following our school wide expectations. Every staff member in the building can give classrooms a special award called a Doubloon when they observe positive behaviors. Classrooms will have individual goals for doubloons. When the class earns enough doubloons, they earn a special Pirate Pete. The classroom is recognized on our school announcements and receives a Pirate Pete to display in the hallways and in our classrooms. Teachers reward their class with special activities and privileges when they earn a Pirate Pete. The Doubloon and Pirate Pete award system is how we recognize our students and classes that demonstrate PRIDE and positive behavior. The last layer of support to ensure a safe and orderly learning environment is our PBIS (Positive Behavior Intervention and Support) team. This team meets on a regular basis to discuss those students who may need additional supports or interventions in order to be successful behaviorally at our school. This team looks at student data and helps to devise specific plans to address behavior. In the 2015-16 school year, Parkwood had 86.2% of the students without any behavior referral to the office. Our goal for the 2016-2017 school year is to increase our percentage to 88%. We plan to achieve this through our efforts with our revised school wide expectations and PRIDE initiative, along with our PBIS team to support students who need additional support and intervention.

7
For overall security, the school uses the Raptor system to scan visitors. The campus remains locked during school hours and all visitors must report through the office for screening. Further, the school conducts monthly fire drills, quarterly intruder drills, and a tornado drill each semester. Teachers all possess a copy of the emergency plan and are required to review all procedures with their students. Technology Greater Clark is using technology to create authentic learning experiences and to empower all learners to take ownership of their learning. Teachers and students leverage tools like interactive whiteboards, ActivInspire, HP Chromebooks, Google Classroom, Google Apps for Education, online textbooks, Symbaloo, IXL, EasyTech, Remind, Class Dojo and more in partnership with our goal clarity curriculum maps to support student learning. All technology integration and professional development is incorporated inside of our Numeracy, Literacy, and College and Career Readiness frameworks. At Parkwood Elementary, technology is used to enhance student learning on a daily basis. All students attend a weekly technology class in our computer lab, taught by a certified teacher. Students are exposed to various types of programs and software as well as learning digital citizenship as part of our PRIDE initiative. Our third grade through fifth students all have their own Chromebook device as part of our district’s one to one program. Students learn how to utilize educational apps, digital textbooks, and presentation programs. Many of our teachers set up Google classrooms where all materials and assignments are shared. Our teachers utilize several programs to enhance our curriculum and instruction such as Learning IXL to support math, and Scholastic IREAD to support literacy. Students also have online textbook access through McGraw-Hill. Many of our classrooms also have IPADs to utilize during independent time and to enhance the literacy and math instructional blocks. Our teachers utilize several computer assessment programs to help pinpoint instructional needs such as STAR reading, STAR math, and Scholastic SRI. We have several technology enhanced intervention programs that some students participate; Read 180 and Systems 44.

8
Curriculum and Instruction
GCCS curriculum is aligned with state standards. Curriculum information is located in the main office as well as on the Greater Clark County Website. All certified staff has been trained and using the Greater Clark Pacing Guide for their grade level. Elementary teachers in grades K-5 have pacing guides for: Language Arts, Math, Science, and Social Studies which are aligned to the 2014 Indiana College and Career Standards. Maps. Performance data linked to the maps is routinely reviewed to guide process for improving instruction and aligning the formative assessment process. Curriculum development occurs in the following areas: Language Arts Mathematics Science/Health Social Studies Library Media Skills Music Art Physical Education Technology Education In order to understand the level of implementation of key programs and strategies, implementation data are collected and analyzed as evidenced by observations, walk-throughs, collaboration, and student work samples. Students failing ISTEP+ participate in remediation during the school day, after school programs and/or intersession. Supplemental programs are monitored and evaluated with assessments. Student grades and report cards are aligned with Indiana Academic Standards and ISTEP+ as evidenced by correlations of student grades with scores on ISTEP+. The interventions that will address critical areas will include: full-day kindergarten, tiered small group instruction (IMPACT Groups), extended school year (Intersessions), the use of class-size reductions teachers, and after school programming run by Communities in Schools.

9
Titles and Descriptions of Assessment Instruments-Component 1 Comprehensive Needs Assessment
ELA Reading/Writing: Writing Benchmark Assessments – These assessments focus on Indiana College and Career State Standards. They provide students with exposure to writing prompts in specific genres. Teachers score the writing assessments with the Indiana Writing Rubric (Gr. 2-5) and a 6 Traits Writing Rubric (Gr. K-1). Kdg. – Gr. 5 teachers administer, score and analyze Writing Assessments four times per year.
Aimsweb - Gr. K -1 teachers administer Aimsweb Literacy screening 3 times per year. Students who score red/yellow on Aimsweb Reading screening will be progress monitored using Aimsweb every two weeks.
STAR - Gr 2-5 teachers will administer STAR Reading screening 3 times per year. Students who score red/yellow on STAR Reading screening will be progress monitored using STAR Reading every two weeks.
Running Records - (K-2) Teachers will administer running records using McGraw Hill benchmark and progress monitoring materials or other similar materials to determine a guided reading level for those students. Students will be progress monitored using running records at least monthly.
Common Quarterly Assessments – Grades K-5 teachers utilize CQA assessments aligned to standards and a corporation prescribed pacing of skills/standards on a biweekly basis to assess ELA standards taught. Students not meeting mastery level on the CQA and Learning Check assessments will be remediated in small group and given the opportunity to retake assessments following remediation.
Math: Aimsweb - Gr. K -1 teachers administer Aimsweb Math screening 3 times per year. Students who score red/yellow on Aimsweb Math screening will be progress monitored using Aimsweb every two weeks. STAR - Gr 2-5 teachers will administer STAR Math screening 3 times per year. Students who score red/yellow on STAR Reading screening will be progress monitored using STAR Math every two weeks. Technology: 21st Century Skills - Grade 5 teachers administer and analyze technology skills results at the end of each school year.

10
Component 1 Comprehensive Needs Assessment A summary of current data and action plans are embedded within the Data Wise Templates for ELA, Mathematics, and School Culture. The most recent Comprehensive Needs Assessment conducted by the Parkwood School Improvement Committee is included in the Appendix.
Mission, Vision, and Beliefs Mission Statement The mission of Parkwood Elementary School is to work together to ensure academic success for all students. Vision Parkwood Elementary School will be a place where: - Students are excited to learn. - All students are challenged. - Students and staff learn from their mistakes and are not afraid to try new things. - All staff members are positive. - Students know what their strengths are and teachers build on those strengths. - Parents are involved in classrooms that are warm and inviting. - The various learning styles of our students are recognized and valued. - Students are engaged in a variety of learning experiences. - Students and teachers use technology on a daily basis

11
Leadership Team
NAME POSITION Brandon Winebrenner Principal
Brooke Schlise Assistant Principal Sabrina Lage Academic Improvement
Coordinator Todd Bledsoe 5th Grade Level Leader
Christa Isenburg 4th Grade Level Leader/ Parent
Cathy Davis 3rd Grade Level Leader Sarah Barlowe 2nd Grade Level Leader Danielle Yanez 1st Grade Level Leader Ashley Fortson K Grade Level Leader
Teri Fry ELL Teacher Carole Hoeppner Special Education
Teacher
SWP Component #5: Strategies to Attract High Quality, Highly Qualified Teachers to this School Human Resource information and GCCS positions are posted and regularly updated on the District website. The Greater Clark County Schools provides a competitive salary base for beginning teachers with no years of teaching experience. Teacher salaries are locally competitive. Teacher salaries are increased when a Master’s degree or 30 additional hours above the Master’s degree is acquired. Certified staff receives benefits and may carry family options with additional contributions. Efforts are made to recruit bilingual staff members who demonstrate cultural awareness and competency in working with diverse populations. The Greater Clark County Schools is committed to having Academic Improvement Coaches (AIC) who work to support and mentor new teachers. New teachers in the schools will have support from an AIC who is assigned in the same school. This will provide more continuous support related to the school’s specific school

12
improvement plan and school improvement goals and strategies. Additionally, the school corporation employs a district wide Reading Coach to support teachers with the implementation of a comprehensive Literacy Framework. District wide Instructional Coaches support with the implementation of the Balanced Math Framework, as well as technology integration. Weekly collaboration is scheduled to provide ongoing grade level support for all grade level teachers. Grade level teachers and special resource teachers participate in grade level collaboration weekly. This collaboration focuses on examining assessments that monitor progress in reading, writing and math and the student’s level of use of key strategies that teachers focus on. Teachers review how students are using the strategies and discuss how to revise and refine their modeling of those key strategies in order to impact student performance on the next formative assessment. During collaboration time, teachers use the data to reflect on current practices, expand, refine, and build new skills that focus on meeting school improvement goals and help address barriers to implementing key reform strategies in the school improvement plan. This infrastructure for job-embedded professional development provides teachers support for progress monitoring of students and allows them access to their teaching peers on a regular basis that is facilitated, focused, and outcome based. Faculty wide professional development is delivered on a weekly basis and is focused on three areas. The first area of focus is on the comprehensive Literacy Framework with emphasis on Guided Reading. The second area of focus is on the implementation of the Balanced Math Framework. The third area of focus is on school culture through a Positive Behavior Intervention and Support system. This professional development includes on-line modules from the Indiana Department of Education. Staff receives appropriate professional development resources such as books and publications to support study group discussions. Professional development is monitored through regular classroom observations with feedback and support. Parkwood Elementary works in partnership with Indiana University Southeast to develop prospective teachers through practicum and student teaching opportunities. These prospective teachers are encouraged to engage in all of our professional development sessions, observe grade level and department collaborations, and learn from highly qualified teachers. Students in the IUS program demonstrating the desired skills of a high-quality teacher are encouraged to apply for available positions.

13
Opportunities for Shared Decision Making-SWP Component 8 Building Leadership Team Parkwood Elementary has bi-weekly building leadership team meetings to discuss academic assessment results, discuss progress towards our goals and school plan implementation, as well as plan professional development to meet these goals. Meeting notes are kept and stored on our shared Google drive as well as in the principal’s office. School Intervention Team Parkwood has a behavior and academic intervention team that meets to discuss the students who are struggling to meet academic or behavior expectations. This team helps to create a plan for tier 2 and 3 interventions as well as monitors the progress of these interventions. This team meets twice per month and all notes and records are maintained on the shared Google drive as well as kept in the principal’s office. School Culture- PBIS Committee Parkwood has a team in place that is responsible for driving Positive Behavior Intervention and Support (PBIS) as part of the overall Greater Clark PRIDE initiative. This team has worked to establish common schoolwide expectations and collaborates to make decisions related to school culture. The team plans and prepares for quarterly activities to reward students for consistently meeting expectations. This team also generates and presents professional development to the staff as associated with school culture. The PBIS Committee reviews and analyzes student behavior data to drive decisions that will create an environment conducive to improvement of student achievement.

14
Three-year Goals 2016-19
Goal 1: English/Language Arts Goal: By Spring 2017 >80% of students in grades 3-5 will meet State Standard in ELA as measured by ISTEP+ Goal: By Spring 2019 > 85% of students in grades 3-5 will meet State Standard in ELA as measured by ISTEP+/ISTAR. Goal: By Spring 2017 > 85% of students in grades 3 will meet State Standard in Reading as measured by IREAD3. Goal: By Spring 2019 > 90% of students in grades 3 will meet State Standard in Reading as measured by IREAD3. Emphasis will be on growth in the following subgroups: Low Socioeconomic Status, ELL, and Hispanic. Our goal at Parkwood is to exceed the state average by two or more percent in each of these subgroups in ELA. Goal 2: Mathematics Goal: By Spring 2017> 80 % of students in grades 3-5 will meet State Standard in Mathematics as measured by ISTEP+. Goal: By Spring 2019> 85% of students in grades 3-5 will meet State Standard in Mathematics as measured by ISTEP+/ISTAR. Emphasis will be on growth in the following subgroups: Low Socioeconomic Status, ELL, and Hispanic. Our goal at Parkwood is to exceed the state average by two or more percent in each of these subgroups in Math. Goal 3: College and Career (PRIDE) Goal: By Spring 2019> 31% of 5th graders will earn a Work Ethic Certificate and the school wide average PRIDE score will be 1.5. Goal: By Spring 2019> 50% of 5th graders will earn a Work Ethic Certificate and the school wide average PRIDE score will be 1.8.

15
Implementation of School-Wide Reform Continued-SWP Component 2 a-d
Data Summary and Action Plan Data Wise Action Plan
School: Parkwood Elementary School
Grade Level/Subject Area: English Language Arts
Area of Focus: Parkwood will focus on implementing daily guided reading instruction as part of the literacy framework. Teachers at Parkwood will receive professional development on the guided reading templates from The Next Steps in Guided Reading by Dr. Jan Richardson.
Data Overall Data: Spring ELA ISTEP results show that 59.6% of all 3-5 students passed ISTEP+. Spring 2016 IREAD3 results show that 80% of our 3rd grade students are proficient. Based on this information, Parkwood will focus on core guided reading instruction to ensure that our students become proficient readers in grades K-5. Data for Core Instruction: We will utilize our common grade level Learning Checks and our district Common Quarterly Assessments to assess our students’ proficiency on core grade level instruction and use the results to drive focus lesson instruction and plan for re-teaching. Data for Small Group Instruction & Impact: We will utilize several different types of reading assessments to analyze our students’ ability to read and process text. We will give and analyze Running Records to monitor progress, screen grades 3-5 using SRI, and/or STAR Lexile levels three times per year as a benchmark.
2016 ISTEP+ Performance (% of Students who Passed ELA ISTEP+): 59.6% 2017 ISTEP+ Performance Goal (% of Students who Passed ELA ISTEP+): 80%
2016 STAR (% of Students at Grade Level on Reading): 49.6% 2017 STAR Goal (% of Students at Grade Level Reading): 80%
2016 ELA CQA Mastery: 56% 2017 ELA CQA Mastery Goal: 80%
What is the Learner-Centered Problem? Students at Parkwood are not proficient in the area of literal comprehension and retell. Students enter Parkwood with very little exposure to print, little

16
background experiences, and most have not had a pre-school experience. Students also have limited vocabulary and many are not proficient in English. All of these factors contribute to our students struggling with basic comprehension of text.
What is the Problem of Practice? For the past several years, literacy skills have been taught in isolation. By the time students are in intermediate grades, the average student can read fluently and accurately, but without understanding. As a result, they lack the stamina to comprehend grade level texts.
What Instructional Strategy will be implemented to reach goal? Teachers will follow the 90 minute literacy block with fidelity which includes a whole class reading focus lesson teaching the grade level core standards, along with a whole class word study lesson, and guided reading groups. Teachers will implement daily guided reading instruction as part of the literacy framework with an emphasis on specific literal comprehension strategies, based on the models in The Next Steps in Guided Reading by Dr. Jan Richardson. Teachers will also work with the Parkwood literacy coach and district literacy coaches to plan effective reading focus lessons and guided reading lessons. Teachers will observe and be observed by the literacy coach and will be provided with feedback to improve instruction. Teachers will receive specific professional development at the school level focused on the reading focus lesson and guided reading as well as attend the district level professional development. Some specific literal comprehension strategies we will focus on in grades 2-5 are Stop, Think, and Paraphrase, and Green & Red Level Question techniques. As our students become proficient with retell and literal comprehension, we will move towards more inferential and interpretive comprehension strategies. For grades K-1, guided reading lessons will focus on specific word solving strategies as well as retelling strategies such as The Five Finger Retell. During guided reading instruction, all grades will focus on increasing our students’ vocabulary knowledge by directly teaching vocabulary strategies during the guided reading lesson. Increasing our students’ vocabulary will be an on-going effort across all grade levels.
Task (What specific tasks will you implement to reach goal?)
When (will you complete task?)
Who (will be responsible?)
• Provide professional development on the guided reading lesson framework.
August-September August 2016
AIC/Administration Grade Levels Teachers Administration

17
• Purchase Next Steps in Guided Reading for all grade levels and to do a book study to support classroom implementation.
• Provide on-going training and support with the implementation of guided reading groups by modeling and coaching.
• Participate in professional development focused on the literacy framework provided by the district.
• Re-design how we provide reading intervention for at-risk students.
• Analyze reading behaviors and pinpoint specific needs utilizing the Assessment Summary Chart by Dr. Jan Richardson.
• Provide professional development on specific literal comprehension strategies and retelling strategies (STP, 5 Finger Retell, Green/Red Questions)
• Provide time for teachers to collaborate about guided reading groups and students’ progress.
September-May August-May September October 2016 3 times per year, and as needed October, January, and as needed As needed during period 0 and grade level common plan times.
Teachers/AIC/Administrators Administration/AIC/Teachers Administration/Teachers Administrators/AIC/Teachers AIC/Teachers Administrators/AIC Administrators

18
Data Summary and Action Plan Data Wise Action Plan
School: Parkwood Elementary School
Grade Level/Subject Area: Mathematics
Area of Focus: Number Sense Routines for K-2, Problem Solving 3-5 Parkwood Elementary will incorporate the Balanced Math Framework across all grade levels. The primary grades will focus on Number Sense routines as a daily portion of the math block, while intermediate grades will work on problem solving strategies with multi-step problems.
Data Overall Data: In the spring 2016 ISTEP+, Parkwood scored 41.9% overall in Math. Our third graders scored 34.7% and fourth grade 31.1%. Based on this data, we will focus on solidifying our Daily Math Review Instruction as part of our Balanced Math program school wide and focus on number sense routines in our primary grades. Data for Core Instruction: We will utilize district created Common Quarterly Assessments to measure our student learning on core standards, along with teacher created Learning Checks. We will also use Daily Math Review Quizzes to assess students’ understanding of previous concepts. Date for Small Group Instruction & Impact: We will utilize STAR Math, along with Learning Checks to help plan for re-teaching, math intervention groups, as well as math enrichment instruction.
2016 ISTEP+ Performance (% of Students who Passed Math ISTEP+): 41.9% 2017 ISTEP+ Performance Goal (% of Students who Passed Math ISTEP+): 80%
2016 STAR (% of Students at Grade Level in Math): 67% 2017 STAR Goal (% of Students at Grade Level in Math): 80%
2016 Math CQA Mastery: 66% 2017 Math CQA Mastery Goal: 80%
What is the Learner-Centered Problem? The majority of Parkwood students are limited in Number Sense and struggle with understanding the relationships between numbers. By the time students reach intermediate grades, the average student demonstrates a weakness in problem solving skills, due to lack of conceptual understanding. In particular, they struggle with multi-step problems.

19
What is the Problem of Practice? While most teachers have a DMR routine, there has not been a common school-wide set of DMR expectations. Further, pacing is rushed and number sense is not mastered.
What Instructional Strategy will be implemented to reach goal? Professional development in the area of Daily Math Review will be a focus in all grades, as well as Number Sense Routines for grades K-2. For Daily Math Review, we will focus on two problems per day with a strong emphasis on the error analysis process, writing quality key concept statements, and teaching students how to collaborate with their peers about how they solved the problems using mathematical language and terms. We will teach students how to explain their thinking and show their thinking in a variety of ways. We will continue to develop and teach specific problem solving strategies in grades 3-5 to build problem solving capacity and conceptual understanding. Our K-2 teachers will study the book Number Sense Routines by Jessica Shumway. Our leadership team will provide some professional development during period zero regarding the strategies presented in the book and how they can be successfully incorporated into the daily math block. We will also meet to analyze the math Common Quarterly Assessments to identify strengths and weaknesses and plan for re-teaching as well as intervention once per quarter.
Task (What specific tasks will you implement to reach goal?)
When (will you complete task?)
Who (will be responsible?)
• Provide specific professional development on Daily Math Review
• Implement a uniform, school-wide DMR expectation
• Purchase Number Sense Routines for primary grades to support effective classroom instruction.
• Incorporate Math Fact Mastery
September September September 2016 January
Administration Teachers District Math Coach Administration Teachers District Math Coach Administration

20
• Provide professional development on specific number sense routines.
• Teach specific number sense routines for 5-10 minutes as part of the daily math block in all K-2 classrooms.
• Intermediate grades focus on problem solving in a daily routine, starting with one step and then building to multi-step problems
• Provide professional development on Conceptual Lessons.
• Provide follow up professional development on Daily Math Review & Number Sense Routines.
November November
November
January
January-March
Administration/Math Coaches/Teachers Administrators/Math Coaches K-2 Classroom Teachers/Support Staff (SPED teachers & ELL) 3-5 Teachers/Support Staff Administrators/Math Coaches Administrators/Math Coaches

21
Data Summary and Action Plan Data Wise Action Plan
School: Parkwood Elementary School
Grade Level/Subject Area: PRIDE
Area of Focus: (Need an Action Plan Form for PRIDE) Parkwood Elementary School will develop and implement a three tier Positive Behavior Intervention and Support (PBIS) system that will focus on the development of a positive learning culture.
Data (Need Specific Data for PRIDE) Office Referrals 15/16: 196 Attendance rate 15/16: 95.4% PRIDE score average 15/16: 1.3 Work Ethic Certificates earned 15/16: 19%
2016 PRIDE Results (Behavior Referrals): 196 2017 PRIDE Goal (Behavior Referrals): 177
What is the Learner-Centered Problem? Most of the students entering Parkwood as a kindergartener are not ready to learn. These students have never experienced a school setting before and need to be taught how to be effective students. Many are unaccustomed to routines and behavioral expectations in a learning environment. Further, many need modelling of social skills and support in developing a strong command of the English Language.
What is the Problem of Practice? While Parkwood had previously set common classroom rules and volume levels, a set of common school-wide expectations were never established. Further, modeling of expectations of behavior in all school settings did not occur.
What Instructional Strategy will be implemented to reach goal? Parkwood Elementary School will implement the Positive Behavior Intervention and Support model (PBIS)

22
Task (What specific tasks will you implement to reach goal?)
When (will you complete task?)
Who (will be responsible?)
• Establish School-wide Expectations and model routines and expected behaviors during the first two weeks of IMPACT.
• Establish a PRIDE committee to plan monthly activities focused on PRIDE to promote student attendance, engagement, and behavior.
• Implement a school-
wide positive behavior support program.
• Use PBIS/SWIS to log and track behavior referrals
• Use PBIS data to identify areas of need.
• Develop Tier II and Tier III behavior system
• Utilize the TPEC process to address habitual attendance issues
First Quarter 2016-17 First Quarter 2016-17 Fully Implemented by Fall 2017 First Quarter 2016-17 First Quarter 2016-17 Fully Implemented by Fall 2017 September 2016
Administrators Teachers Support Staff Administration PRIDE Committee SAM/Administration PRIDE Committee PRIDE Committee SAM/Administration

23
Implementation of School-Wide Reform Continued-SWP Component 2 e-h
Strategies to Serve Underserved Populations: The following research based strategies have been implemented to increase the amount and quality of learning time and specifically address the learning needs of low achieving students. Read 180 Read 180 is a reading intervention program designed for students who are reading below proficient in grades 4-5. Read 180 helps students in the specific areas of reading comprehension, vocabulary, and spelling. Read 180 is a 90 minute intensive intervention provided as a supplement to the core literacy block and consists of research based comprehension instruction strategies within a motivating, technology enhanced program. Transition Classrooms Transition classrooms are designed to provide a smaller class size and additional supports for struggling learners. Many of our ELL students are clustered into these classrooms and receive additional small group support. Title 1 Program One intervention teacher services grades 1-5, and two intervention teachers provide intensive intervention in grades 4-5 by instructing leveled guided reading groups, Read 180, and additional instruction for students below grade level in reading during our reading impact program. These interventionists also support struggling students in math during small group math impact. ELL Program Five ELL teachers support our English Language Learners in grades K-5. These teachers provide language acquisition groups, language support, as well as provide additional supports by co-teaching lessons in the areas of reading and math. These teachers receive on-going professional development and training provided by our district coordinator. One ELL tutor provides small group supplemental support for ELL students, as well as serves as a community liaison to our ELL families providing resource information, translation, and helping to build a bridge between our ELL families and school.

24
IREAD program The Scholastic IREAD program is a comprehensive, research based computer program that provides instruction in the five components of reading for grades K-2. This technology based program is available in all of our K-2 classroom and students have the opportunity to log on and receive 20-30 minute sessions. Teachers also receive on-going professional development regarding the use and successful implementation of the program. Program Monitoring Progress monitoring strategies include Scholastic SRI, STAR Reading & Math, AIMS WEB, McGraw-Hill Text Reading, and common learning checks. Student performance on these assessments will be used to monitor student achievement, as well as to inform and adjust instruction within these special programs and interventions. Parkwood Elementary has developed a comprehensive school improvement plan to address all the state and federal accountability requirements. The plan reflects specific strategies we have identified to reach our achievement goals. Research based instructional strategies are being implemented based on our professional development plan in order to ensure that our school plan and goals are met. The content taught is based on the Indiana College and Career Ready Standards. Our district has developed pacing guided in the area of ELA and Math to directed correlate and align to these standards.
Pre-School Transition Plan-SWP Component 7
Pre-School Program Parkwood Elementary has two half-day pre-school classes that primarily serve special needs students, as well as low income students. Other general education students are included as well through an application process. Each spring, parents in our school are notified of kindergarten round-up through letters, postings on social media, and the district website. The purpose of the round-up is to welcome parents and families to our school as they have the opportunity to register their eligible students. Parkwood hosts Camp Kindergarten as part of the kindergarten round-up process. Kindergarten teachers explain expectations as well as introduce the parents to the State Standards taught throughout the school year. To ensure a smooth transition

25
to kindergarten, parents and students tour the school, visit our cafeteria, as well as receive important information regarding transportation and services offered at Parkwood.

26
No statutes and/or rules will be waived by
Parkwood Elementary School.
Fall, 2016 Year

27
Appendix
Data Parkwood Key Outcomes
Student Achievement District School Goal Actual
State Assessments 2015-16 2015-16 2016-
17 2016-17
% of Students Passing ELA section of ISTEP+ 3-10 *61.8% *59.6% 70.0%
% of Students Passing Math section of ISTEP+ 3-10 *53.5% *41.9% 55.0%
% of students passing IREAD3 *93%% *80.6% 90.0% WIDA EL Proficiency Growth (Students with multiple yr. data) 71.0% 80.0%
Accountability GRADE District School Goal Actual
2015-16 2015-16 2016-
17 2016-17
School Grade - Accountability C B A
District School Goal Actual
District Assessments 2015-16 2015-16 2016-
17 2016-17
Technology - 21st Century Skill - Gr.5 67.0% 61.0% 77%
District School Goal Actual
Work Ethic 2015-16 2015-16 2016-
17 2016-17
% of Grade 5 Students earning Certificate 31% 19% 31.0%
Three - Year Data State Dist Total School 3-Year Elem 3-5 Goal
ISTEP 2014-15 2014-15 2012-
13 2013-14 2014-
15 2015-16 % of Students Passing ELA section of ISTEP+ 3-5 69.0% 69.0% 74.1% 77.9% 56.7% 77.9% % of Students Pass+ on ELA section of ISTEP+ 3-5 19.0% 18.0% 8.9% 7.5% 9.0% 7.5% % of Students Passing Math section of ISTEP+ 3-5 65.0% 59.0% 76.75 74.6% 47.6% 74.6% % of Students Pass+ on Math section of ISTEP+ 3-5 24.0% 18.0% 24.9% 22.0% 14.0% 22.0% % of Students Passing Social Studies section of ISTEP+ 5 NA NA 46.8% 59.4% NA 59.4%

28
% of Students Passing Science section of ISTEP+ 4 69.0% 63.0% 60.0% 61.4% 60.0% 61.4%
Three - Year Data State Dist Total School 3-Year Elem 3-5 Goal
ISTEP 2014-15 2014-15 2012-
13 2013-14 2014-
15 2015-16
Growth Model Language Arts Performance 63.8% 74.5% 77.5%% 58.0% 77.50% % of Students in Bottom 25% at High Growth-ELA 42.5% 40.0% 26.7% 38.7%% 67.6% 38.70% % of Students in Top 75% at High Growth-ELA 36.2% 33.2% 29.9% 34.9%% 37.4% 34.9%%
Overall Group with Low Growth-ELA <39.8% 34.5% 36.8% 28.2% 21.5% 28.2%
Growth Model Math Performance 56.0% 77.2% 76.2% 48.9% 76.2% % of Students in Bottom 25% at High Growth-Math 44.9% 36.6% 46.7% 61.3% 43.2% 61.3% % of Students in Top 75% at High Growth-Math 39.2% 33.9% 55.7% 50.6% 49.5% 50.6%
Overall Group with Low Growth-Math <42.4% 35.9% 17.8% 15.8% 23.3% 15.8%
GRADE Dist. 2015
2012-13 2013-14
2014-15
Goal 2016
School Grade - Accountability D B B B B
Three - Year Data State Dist School 3-Year Elem 3-5 Goal
IREAD 3 2014-15 2014-15 2012-
13 2013-14 2014-
15 2015-16
% of students passing IREAD3 90.7% 92.6% 83.0% 84.6% 76.2% 78.2%
Three - Year Data State Dist District 3-Year Current
DEMOGRAPHIC DATA 2014-15 2014-15 2012-
13 2013-14 2014-
15 2015-16
Free and Reduced Lunch 49.2% 56.9% 87.8% 88.4% 87.2% 88.1%
Percent Special Education 14.9% 16.3% 14.1% 14.8% 14.2% 17.0%
Percent English as a Second Language 5.5% 6.6% 34.3% 36.6% 33.6% 44.1%
Ethnicity 29.8% 34.8% 58.2% 65.0% 67.3% 70.2%
Enrollment 1,046,026 10,591 490 533 568 584
29
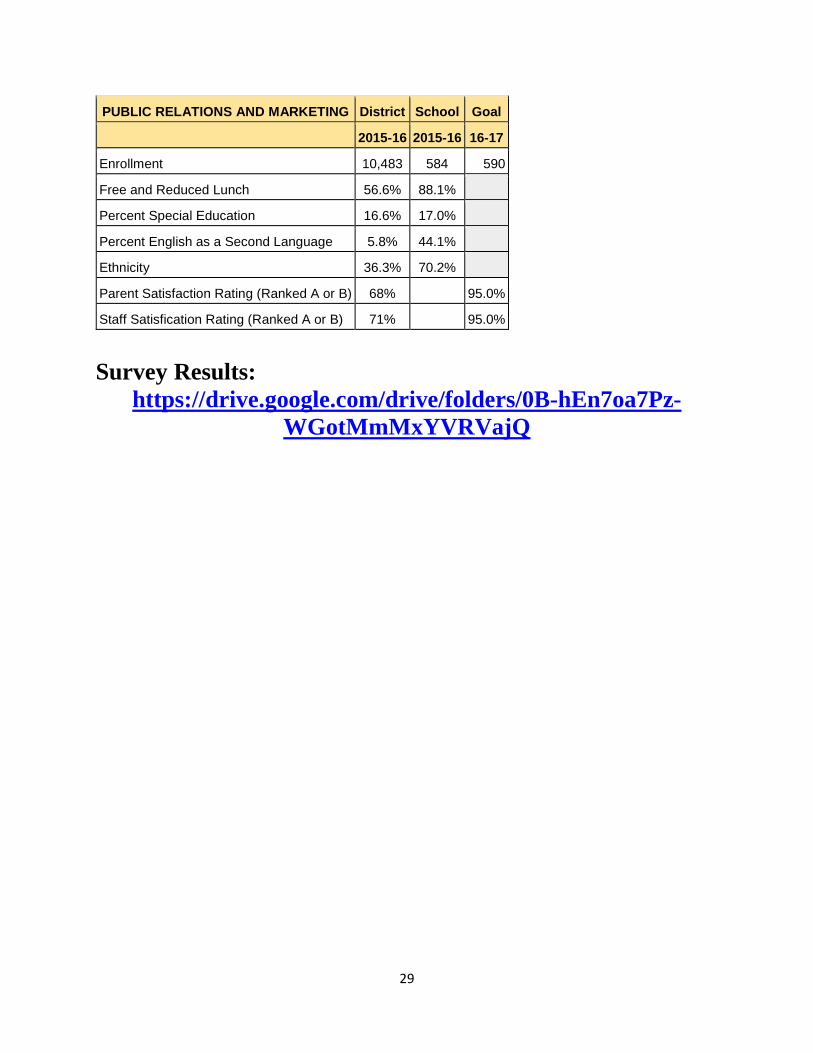
PUBLIC RELATIONS AND MARKETING District School Goal
2015-16 2015-16 16-17
Enrollment 10,483 584 590
Free and Reduced Lunch 56.6% 88.1%
Percent Special Education 16.6% 17.0%
Percent English as a Second Language 5.8% 44.1%
Ethnicity 36.3% 70.2%
Parent Satisfaction Rating (Ranked A or B) 68% 95.0%
Staff Satisfication Rating (Ranked A or B) 71% 95.0%
Survey Results:
https://drive.google.com/drive/folders/0B-hEn7oa7Pz-WGotMmMxYVRVajQ

30
GCCS Literacy Framework 90 Minute Literacy Block (Kindergarten - 2)
Time Guidelines Intent Notes
10-20 minutes Focused Mini Lesson Gradual Release of Responsibility-
I do, we do, you do
Intentional, explicit instruction on the Daily Learning Target
Includes visual representation (Anchor Chart)
20 minutes Word Work
Kindergarten
Focus on Foundation standards
Grade 1
Build on foundations with emphasis on phonics & fluency
Grade 2
Advanced Phonics, Fluency, Comprehension
Gradual Release of Responsibility-
I do, we do, you do
20 minutes
Variables that may influence gaps: student needs, class size, amount of time in literacy block.
Guided Reading Group
Kindergarten
Focus is Basic story elements independently (5 standards)
Grade 1
Focus Shifts to a balance of foundations, RL, and RN with an emphasis on phonics and fluency
5-6 students using gradient text (levelled texts) that are at the student's’ instructional level (100 points higher than their independent level)

31
Grade 2
Comprehension shifts to more complex thinking through the text independently
This happens while not in groups
Independent/Shared Reading
Writing - Interactive/ Constructive Response
Appropriate levelled text Writing journals
Gradual Release of Responsibility-
I do, we do, you do
30 - 45 Minute Writing Block
Time Intent Notes
Writer’s Workshop 6+1 Writing Traits
Writing Process
SPECIAL ED
Co-teaching during core
Guided Reading – Specially Designed Instruction (SDI) and/or
Push in/ Pull out – SDI (supports IEP)
ELL
Co-teaching during core, push in/pull out Language Acquisition Support (supports ILP)

32
90 Minute Literacy Block (3rd and 4th Grade)
Time Guidelines Intent Notes
10-20 minutes Focused Mini Lesson Gradual Release of Responsibility-
I do, we do, you do
Intentional, explicit instruction on the Daily Learning Target
Includes visual representation (Anchor Chart)
20 minutes Word Work Gradual Release of Responsibility-
I do, we do, you do
20 minutes
Variables that may influence grps: student needs, class size, amount of time in literacy block.
Guided Reading Group 5-6 students using gradient text (levelled texts) that are at the student's’ instructional level (100 points higher than their independent level)
This happens while students are not in
groups
Independent/Shared Reading
Writing - Constructive Response to Text
Appropriate Levelled Texts
Writing Journals
Cornell Notes
Complex Thinking/ Work products
Gradual Release of Responsibility-
I do, we do, you do

33
30 - 45 Minute Writing Block (3rd and 4th Grade)
Time Intent Notes
Writer’s Workshop 6+1 Writing Traits
Writing Process
SPECIAL ED
Co-teaching during core
Guided Reading – Specially Designed Instruction (SDI) and/or
Push in/ Pull out – SDI (supports IEP)
ELL
Co-teaching during core, push in/pull out Language Acquisition Support (supports ILP)
90 Minute Literacy Block (5th and 6th Grade)
Time Intent Notes
10-20 minutes Focused Mini Lesson
Gradual Release of Responsibility-
I do, we do, you do
Intentional, explicit instruction on the Daily Learning Target
Includes visual representation (Anchor Chart)
20 minutes Word Work Gradual Release of Responsibility-
I do, we do, you do
20 minutes
(*elem - 3 groups per day)
(ms - 2 groups per )
Guided Reading Group 5-6 students using gradient text (levelled texts) that are at the student's’ instructional level (100 points higher than their independent level)

34
*Variables that may influence grps: student needs, class size, amount of time in literacy block.
Guided reading needs to be 40-45 minutes (two groups per day).
This happens while students are not in groups
Independent/shared Reading
Writing - Constructive Response
Appropriate Levelled Texts
Writing Journals
Cornell Notes
Complex Thinking/ Work products
Gradual Release of Responsibility-
I do, we do, you do
30 - 45 Minute Writing Block (5th and 6th Grade)
Time Intent Notes
Writer’s Workshop 6+1 Writing Traits
Writing Process
SPECIAL ED
Co-teaching during core
Guided Reading – Specially Designed Instruction (SDI) and/or
Push in/ Pull out – SDI (supports IEP)
ELL
Co-teaching during core, push in/pull out Language Acquisition Support (supports ILP)

35
30 Minute IMPACT Block (K - 5th Grade)
Tier Intent Resources
1 Literacy enrichment/acceleration during IMPACT time with Gen Ed teacher
Self-Directed
Product oriented/project based
Each gen ed teacher should have a Tier 1 and Tier 2 group in classroom during IMPACT in order to maintain appropriate sizes of Tier 2 groups to be effective (see below)
● GT programming ● Gradient texts appropriate to lexile
levels
2 Read 180 4th & 5th Grade Only
(400+ lexile)
(90 minutes)
2 Sub-skill reading deficits with gen ed teacher ● LLI Guided Reading ● McGraw-Hill Reading
Intervention (all components)
3 Expert will pull out students to deliver an intensive reading intervention specific to the
sub-skill deficit (phonemic awareness, vocabulary, phonics, fluency,
comprehension) as supported by data
● McGraw-Hill Reading Intervention
● Barton Program-Need trainings (PA/phonics)
● Read Naturally (FL) ● Words Their Way
(phonics/fluency) ● LIPS – Need training (PA)
3 Systems 44 Below 400 Lexile
As a rule, in order for IMPACT groups to be most effective: Tier 2 groups no more than 6 – 8 per group, Tier 3 groups should be no more than 3 – 5 students per group

36

37

38

39
Title I Compact

40
2016-2017 Professional Development Plan Week Professional Development Group
July 25-29 July 25th ELearning Conference July 26th Kick-off at CHS July 27th Building Meeting
District
Principal August 1-5 Quarterly Focus: Guided Reading
Week One: Data Wise Goal Setting Primary Running Records Training Planning IEP/ILP Support
Principal/AP
Grade Level Grade Level
August 8-12
Quarterly Focus: Guided Reading Week Two: Guided Reading Review of ISTEP Data Identify ISTEP Target groups Intermediate Running Records Training
Principal/AP/AIC
Data Teams Grade Level Grade Level
August 15-19
Quarterly Focus: Guided Reading Week Three: Data Wise Planning Problem of Practice and Learner Centered Data Wise Template
Principal/AP
Grade Level Data Teams
August 22 - 26
Quarterly Focus: Guided Reading Week Four: ELL/ILP Training Grade Level Collaboration Data Wise Focus
ELL Coordinator/ELL Teachers
Grade Level Data Teams
August 29-September 2
Quarterly Focus: Guided Reading Week Five: GCCS Foundation Grade Level Collaboration Data Wise Focus
Principal/Coordinator
Grade Level Data Teams
September 6 - 9 NO SCHOOL, Sept. 5
Quarterly Focus: Guided Reading Week Six: Balanced Math- DMR Training Focus Lesson- Whole Faculty Guided Reading Training
Principal/Math Coach
Literacy Coach AP/AIC/GL Teams
September 12 - 16
Quarterly Focus: Guided Reading Week Seven: HR Benefits Meeting Grade Level Collaboration Data Wise Focus
HR Representative
Grade Level Data Teams
September 19 -23
Quarterly Focus: Guided Reading Week Eight: PBIS Planning District PD Day PD Day Debriefing
Principal/AP/PBIS Team
District Grade Level
September 26-30
Quarterly Focus: Guided Reading Week Nine: Guided Reading Reflection Grade Level Collaboration Data Wise Focus
Principal/AP/AIC
Grade Level Data Teams

41
October 17 - 21
Quarterly Focus: Focus Lessons and DMR Week one: Focus Lessons Grade Level Collaboration Data Wise Focus
Principal/AP/AIC Grade Level Data Teams
October 24 - 28
Quarterly Focus: Focus Lessons and DMR Week Two: Focus Lessons Grade Level Collaboration Data Wise Focus
Principal/AP/AIC
Grade Level Data Teams
October 31 -November 4
Quarterly Focus: Focus Lessons and DMR Week Three: DMR Grade Level Collaboration Data Wise Focus
Principal/AP/AIC
Grade Level Data Teams
November 7 - 11 Teacher only Nov.8
Quarterly Focus: Focus Lessons and DMR Week Four: DMR Grade Level Collaboration Data Wise Focus
Principal/AP/AIC
Grade Level Data Teams
November 14 - 18
Quarterly Focus: Focus Lessons and DMR Week Five: DMR Grade Level Collaboration Data Wise Focus
Principal/AP/AIC
Grade Level Data Teams
November 21 - 22 NO SCHOOL, Nov. 23 - 25
Quarterly Focus: Focus Lessons and DMR Week Six: PBIS Planning
Principal/AP/PBIS Team
November 28-December 2
Quarterly Focus: Focus Lessons and DMR Week Seven: Mental Math Grade Level Collaboration Data Wise Focus
Principal/AP/AIC
Grade Level Data Teams
December 5 - 9
Quarterly Focus: Focus Lessons and DMR Week Eight: Data Grade Level Collaboration Data Wise Focus
Principal/AIC/BLT
Grade Level Data Teams
December 12 - 16
Quarterly Focus: Focus Lessons and DMR Week Nine: Reflection Grade Level Collaboration Data Wise Focus
Principal/AIC/BLT
Grade Level Data Teams

42
January 3 - 6
Quarterly Focus: Conceptual Lessons and Problem Solving
Week One: Conceptual Lessons Grade Level Collaboration Data Wise Focus
Principal/Math Coach Grade Level Data Teams
January 9 -13
Quarterly Focus: Conceptual Lessons and Problem Solving
Week Two: Conceptual Lessons Grade Level Collaboration Data Wise Focus
Principal/Math Coach Grade Level Data Teams
January 17 - 20 NO SCHOOL, Jan. 16
Quarterly Focus: Conceptual Lessons and Problem Solving
Week Three: Conceptual Lessons Grade Level Collaboration Data Wise Focus
Principal/Math Coach Grade Level Data Teams
January 23 -27
Quarterly Focus: Conceptual Lessons and Problem Solving
Week Four: Conceptual Lessons Grade Level Collaboration Data Wise Focus
Principal/Math Coach Grade Level Data Teams
January 30 - February 3
Quarterly Focus: Conceptual Lessons and Problem Solving
Week Five: Conceptual Lessons Grade Level Collaboration Data Wise Focus
Principal/Math Coach Grade Level Data Teams
February 6 - 10
Quarterly Focus: Conceptual Lessons and Problem Solving
Week Six: Conceptual Lessons Grade Level Collaboration Data Wise Focus
Principal/Math Coach Grade Level Data Teams
February 13 - 17
Quarterly Focus: Conceptual Lessons and Problem Solving
Week Seven: Multi-Step Problem Solving Grade Level Collaboration Data Wise Focus
Principal/Math Coach Grade Level Data Teams
February 21 - 24 NO SCHOOL or snow make up– Feb. 20
Quarterly Focus: Conceptual Lessons and Problem Solving
Week Eight: PBIS Planning Grade Level Collaboration Data Wise Focus
Principal/AP/PBIS Team Grade Level Data Teams
February 27-March 3
Quarterly Focus: Conceptual Lessons and Problem Solving
Week Nine: Multi-Step Problem Solving Grade Level Collaboration Data Wise Focus
Principal/Math Coach Grade Level Data Teams

43
March 6 -10
Quarterly Focus: Conceptual Lessons and Problem Solving
Week Ten: Poster Method Problem Solving Grade Level Collaboration Data Wise Focus
Principal/Math Coach Grade Level Data Teams
March 13 -17
Quarterly Focus: Conceptual Lessons and Problem Solving
Week Eleven: Poster Method Problem Solving Grade Level Collaboration Data Wise Focus
Principal/Math Coach Grade Level Data Teams
April 3 - 7
Quarterly Focus: PBIS- Three Tier Behavior System
Week One: Building Data Review for PRIDE Grade Level Collaboration Data Wise Focus
Principal/AP/PBIS Team Grade Level Data Teams
April 10 -14
Quarterly Focus: PBIS- Three Tier Behavior System
Week Two: PRIDE- Classroom Strategies Grade Level Collaboration Data Wise Focus
Principal/AP/PBIS Team Grade Level Data Teams
April 17 -21
Quarterly Focus: PBIS- Three Tier Behavior System
Week Three: PRIDE- Classroom Strategies Grade Level Collaboration Data Wise Focus
Principal/AP/PBIS Team Grade Level Data Teams
April 24 - 28
Quarterly Focus: PBIS- Three Tier Behavior System
Week Four: Tier II/III Behavior Grade Level Collaboration Data Wise Focus
Principal/AP/PBIS Team Grade Level Data Teams
May 1 -4
NO SCHOOL or snow make up– May 5
Quarterly Focus: PBIS- Three Tier Behavior System
Week Five: Tier II/III Behavior Grade Level Collaboration Data Wise Focus
Principal/AP/PBIS Team Grade Level Data Teams
May 8 - 12
Quarterly Focus: PBIS- Three Tier Behavior System
Week Six: Overall School Culture Grade Level Collaboration Data Wise Focus
Principal/AP/PBIS Team Grade Level Data Teams
May 15 - 19
Quarterly Focus: PBIS- Three Tier Behavior System
Week Seven: End of Year Planning Grade Level Collaboration Data Wise Focus
Principal/AP/PBIS Team Grade Level Data Teams

44
May 22 - 26
Quarterly Focus: PBIS- Three Tier Behavior System
Week Eight: End of Year Planning Grade Level Collaboration Data Wise Focus
Principal/AP/PBIS Team Grade Level Data Teams
May 30-June 1
NO SCHOOL– May 29 Last student day- June 1
Quarterly Focus: PBIS- Three Tier Behavior System
End of Year
Principal/AP

45
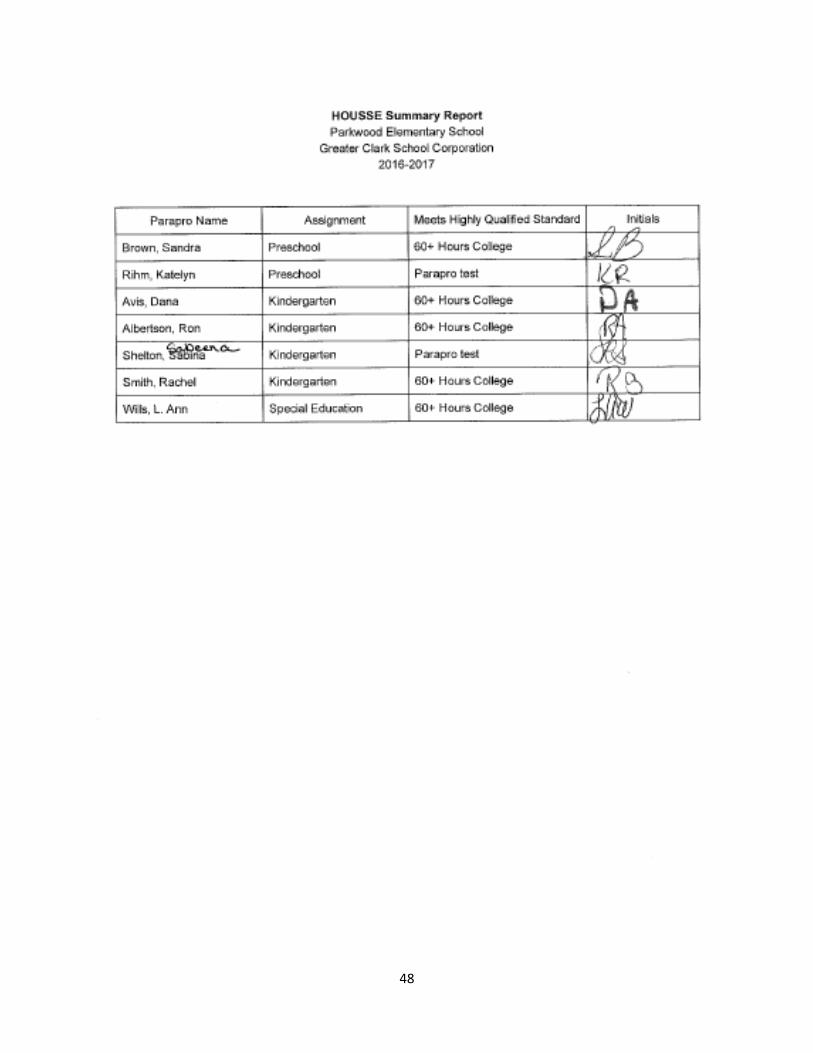
Highly Qualified Staff Teachers in All Content Areas SWP-Component 3
Highly Qualified Teachers in all Core/ Academic Areas
The Greater Clark County Schools (GCCS) ensures that teachers hired for positions are “highly qualified” in academic subjects in which they are the primary instructor and requirements under the No Child Left Behind Act. Application for positions with the Greater Clark County Schools and initial screening process for holding the appropriate licensure in the teaching area is conducted through the Central Office. Hiring of staff for the Greater Clark County Schools elementary, middle and high school is conducted by the Greater Clark County Schools through the Central Office, building level principal and staff consisting of grade level representation. Background checks are conducted prior to hiring.
All GCCS teachers take the High Objective Uniform State Standard of Evaluation/ HOUSSE and new teachers must take the PRAXIS II. Original records of these are kept at the school where the teacher is assigned the position and a copy is on file at Central Office. The Greater Clark County Schools annually submits “highly qualified” data/information regarding every certified employee teaching core academic subjects via the STN Application Center at www.doe.state.in.us. New teachers participate in the “mentor” program as required by the State of Indiana and overseen by the Division of Professional Standards.
Paraprofessionals must pass the Parapro Test or have 60 hours of college credit. Instructional assistants are hired as substitutes for one month. If the non-certified/substitute person passes the Parapro Test during the first month, then he/she is hired with a “highly qualified” paraprofessional contract. The Greater Clark County Schools provides a competitive salary base for paraprofessionals. Paraprofessional salaries competitively increase incrementally with each year of experience.
Qualifications of teachers and paraprofessionals are reviewed and updated bi-annually to meet NCLB requirements using HOUSSE (High Objective Uniform State Standard of Evaluation) Summary Report. When principals update the “highly qualified” information twice during the year, principals sign off that they have verified current information as accurate for teachers and paras as meeting highly qualified under federal law l07-110, Section 119, as mandated by the No Children Left Behind Act of 2001. This HOUSSE Summary Report is filed with Highly Qualified records and documentation is kept on file at the schools and Central Office.

46

47
48

49
Schoolwide Expectations

50
Comprehensive Needs Assessment Summary
Through the Comprehensive Needs Assessment in Fall, 2010 we determined that our focus needs to be on:
• Extending student learning time • Obtaining more accurate and useful data regarding interventions • Maximizing the benefits of the use of Goal Clarity Windows
In addition the following areas of concern will be considered as we plan professional development and collaboration:
• Attention to highly able students • Guidelines for homework • Rubrics and exemplars • Effectiveness of school schedule
CNA: Assessment
Assessment Q1. How many/what % of students meet state standards? Have mastered which skills?
Grade 3:
Answer: In English/Language Arts, 58/77 students passed ISTEP in Spring 2009. In Math, 45/77 students passed ISTEP in Spring 2009. In English/Language Arts, 64/81 students passed ISTEP in Spring 2010. In Math, 58/81 students passed ISTEP in Spring 2010.
Data Statements:
According to Spring 2009 ISTEP data, 58/77 students or 75% met the state standards for third grade English Language Arts.
According to Spring 2009 ISTEP data, 45/77 students or 58% met the state standards for third grade math.
According to Spring 2010 ISTEP data, 64/81 students or 79% met the state standards for third grade English Language Arts.
According to Spring 2010 ISTEP data, 58/81 students or 72% met the state standards for third grade math.
Grade 4:

51
Answer: 79% of students meet state standards in English Language Arts. 72% of students meet state standards in math.
Data Statements:
ISTEP+ 2010 Assessment:
ELA = 79% (64/81) of 3rd graders passed.
Math = 72% (58/81) of 3rd graders passed.
Grade 5:
Answer: The percentage of student passing ISTEP increased from 2009 to 2010.
In ELA the percent passing each standard ranged from 71 to 74%.
In Math the percent passing each standard ranged from72% to 84% with Number Sense being the lowest.
Data Statements:
For ELA 60% (48/80) met state standard in Spring 2009 and 69% (62/90) in Spring 2010
For Math 66% (53/80) met state standard in Spring 2010 and 77% (69/90) in Spring 2010.
Assessment Q2. Are some groups not performing as well as others?
KDG:
As could be expected our Hispanic students are performing at a lower level on beginning of year assessments but by the end of the year there is not one group that is significantly below the others.
Grade 1:
Answer:
Data Statements: Language Arts
# of students identified as Special Needs: 22 Students

52
Benchmark: 36% (8/22) of the first grade students identified as special needs are performing at grade level as evidenced in the Beginning of the Year benchmark data on DIBELS
Strategic: 36% (8/22) of the first grade students identified as special needs are performing at a strategic level as evidenced in the Beginning of the Year benchmark data on DIBELS
Intensive: 27% (6/22) ) of the first grade students identified as special needs are performing at an intensive level as evidenced in the Beginning of the Year benchmark data on DIBELS
Data Statements: Math
# of students identified as Special Needs: 22 Students
Benchmark: 18% (4/22) of the first grade students identified as special needs are performing at grade level as evidenced in the Beginning of the Year benchmark data on MCLASS Math.
Strategic: 55% (12/22) of the first grade students identified as special needs are performing at a strategic level as evidenced in the Beginning of the Year benchmark data on MCLASS Math.
Intensive: 27% (6/22) of the first grade students identified as special needs are performing at an intensive level as evidenced in the Beginning of the Year benchmark data on MCLASS Math
Grade 2:
Answer: Yes. Most subgroups in 2nd grade, with the exception of Black, scored well in the DIBELS ORF in 07-08 and 08-09. In 09-10 there was no disaggregation of subgroups available to reference.
Data Statements:
• From EOY 2008 to EOY 2009 DIBELS reports, the following data indicates: 1. 5 out of 7 subgroups had a growth of a minimum of 5 percentage points in students at or
above benchmark 2. The subgroup Black showed a loss of 1 percentage point (46% to 45%) in percent of students
at benchmark; and the Hispanic subgroup showed a loss of 5 percentage points (73% in 2008 to 68% in 2009.

53
• Terra Nova data reports slight gains in percentage of students at benchmark (50th percentile) in white and black subgroups from 06/07 to 08/09.
Grade 3:
Answer: The Limited English, Hispanic and African American subgroups did not perform as well as their grade level peers in 2009 in English Language Arts. The Limited English, Hispanic and African American subgroups did not perform as well as their grade level peers in 2009 in Math. The Free and Reduced Lunch, Limited English, Hispanic and African American subgroups did not perform as well as their grade level peers in 2010 in English Language Arts. All subgroups except White performed lower than their grade level peers in 2010 in Math, with Limited English being the lowest scoring group.
Data Statements:
According to Spring 2009 ISTEP data, Limited English, Hispanic and African American subgroups received scores lower than the grade level average in English Language Arts.
According to Spring 2009 ISTEP data, Limited English, Hispanic and African American subgroups received scores lower than the grade level average in Math.
According to Spring 2010 ISTEP data, The Free and Reduced Lunch, Limited English, Hispanic and African American subgroups received scores lower than the grade level average in English Language Arts.
According to Spring 2010 ISTEP data, all subgroups scored lower than the grade level average in Math except the white subgroup.
Grade 4:
Answer: Special Education and White students perform better in English Language Arts than free and reduced lunch, LEP, Black, and Hispanic students. White, Special Education, and free and reduced lunch students perform better in Math than LEP, Black, and Hispanic students

54
Data Statements:
4
Grade 5:
Answer: Special Education and LEP subgroups do not perform as well as other subgroups in ELA.
Data Statements:
• As shown on Spring 2010 ISTEP+, 31% of special education students were performing at mastery in ELA.
• As shown on Spring 2010 ISTEP+, 58% of LEP students were performing at mastery in ELA.
Groups Spring 2010
ELA
Spring 2010
Math
Sp Edn 11/13 85% 9/13 69%
Free/Red 43/55 78% 37/55 67%
LEP 12/19 63% 7/19 37%
Black 5/8 62% 5/8 62%
White 34/36 94% 32/36 89%
Hispanic 16/23 70% 11/23 48%
Assessment Q3. What are the critical errors made by students below mastery?
KDG:
In reading/writing the students are most likely to have difficulty with letter sound relationships especially in the middle and end of words. In math the difficulty is in knowing what comes before and after a number.
Grade 1:
Answer:
LA: Students do not apply the knowledge of segmented skills in the areas of phonemic awareness and phonics to text reading in order to demonstrate comprehension of the text.
MATH: Students lack the skills in the area of number sense.
Data Statements:

55
LA: 51% (47/93) of the first grade students are performing below mastery as evidenced in the Beginning of the Year data on DIBELs
MATH: 68% (64/94) of the first grade students are performing below mastery as evidenced in the Beginning of the Year data on MCLASS Math
Grade 2:
Answer: Most students in 2010 made critical errors with story structure and lacked details in their benchmark writing assessments.
Data Statement: 38/78 (49%) students lacked details as the critical error in their benchmark writing assessments at the end of the 2009-2010 school year.
Grade 3:
Answer: Critical errors made by students were in the vocabulary section and on the writing applications adding details. Also critical errors were made in computation, geometry and applied math.
Data Statements:
According to Spring 2010 ISTEP data, the lowest scores in English Language Arts were vocabulary and writing applications in third grade. 19/81 Students or 23% scored a 3 on writing applications. With adding details being their critical error.
According to Spring 2010 ISTEP data, the lowest scores in Math were in geometry, computation and applied math for the third grade.
Grade 4:
Answer: Most students below mastery in ELA had trouble with the writing section of the ISTEP test. Many of the critical errors made in writing were not following the prompt directions, not including many details and examples in their writing, or not finishing the writing prompt.
Most students below mastery in MATH had trouble with the problem solving section of the ISTEP test. Many of the critical errors made in math problem solving were not following the problem directions, making errors in computation that caused errors in subsequent problems, not answering the question asked in the problem, not showing work, and basic computation errors.

56
Student Below Mastery ELA Score
Critical Errors Made ELA
Below Mastery MATH Score
Critical Errors Made MATH
Student A 379 Did not follow writing prompt directions
391 Basic computation errors;
Problem Solving- Did not answer question s asked
Student B 334 Incomplete writing prompt; lacks details, examples in writing
256 Problem Solving- Continued computation errors; Did not answer question s asked.
Student C 345 Problem Solving- Did not show work; incorrect answers; did not answer question asked
Student D 416 Lacking details and examples in writing
Student E 365 Problem Solving-did not answer question asked; Continued computation errors in problem solving. Basic Computation errors
Students A-E are mainstream classroom students without an IEP of any kind.
Grade 5:
Answer: The critical errors made by students working below mastery include responding to nonfiction text and writing applications. The critical errors made by students working below mastery in math include measurement, problem solving, and computation.
Data Statements:
• As shown on the Spring 2010 ISTEP+, students did not respond to all parts of the writing and extended response prompts.
• As shown on the Spring 2010 ISTEP+, students made computation errors when answering questions. • As shown on the Spring 2010 ISTEP+, students did not choose correct operations to solve multi-step
problems.

57
• As shown on the Spring 2010 ISTEP+, students were not able to make generalizations or draw conclusions from nonfiction text to support their answers.
Assessment Q4. Are students showing adequate yearly progress; are #s of students not-passing decreasing/fewer?
KDG: Students are showing adequate yearly progress. The number of students reaching benchmark levels is at least staying the same and in some cases increasing.
Grade 1:
Answer:
DIBELS results 2010-11 compared to 2009-10
Data Statements:
LA: 2010–11 49% (46/93) of the first grade students were at benchmark.
MATH: 2010–11 32% (30/94) of the first grade students were at benchmark.
Grade 2:
Answer to part one of the question: Terra Nova data has been inconsistent across time; showing increases in proficiency some years and decreases in others.
Data Statements:
From 07/08 to 08/09, the percent of students at proficiency in Reading on Terra Nova increased. The percent of students at proficiency in Vocabulary decreased, but not significantly. There were two fewer students at proficiency, which represents 2 %.
• In 08/09, 48 of 81 students (59%) was an increase of 11% over 07/08 scores of 39 of 81 (48%).
From 08/09 to 09/10 numbers of students at proficiency in Terra Nova Reading and Vocabulary dropped significantly.

58
• Reading scores dropped by 11 % • Vocabulary scores dropped by 18%
From 07-08 to 08-09, the percent of students at benchmark or above in DIBELS Oral Reading Fluency at EOY increased by 2 %.
However from 08-09 EOY to 09-10 EOY there was a decrease in percentage of students at benchmark or above, based on DIBELS ORF.
• From DIBELS ORF EOY reports: 07-08 showed 68% of students at benchmark, while 08-09 showed 70% at or above benchmark.
• The DIBELS ORF EOY report from 09-10 reflected a decrease to 62% of students at benchmark or above.
So far, 10-11 is showing an increase of students performing at or above benchmark in DIBELS ORF.
• Fall 2010 DIBELS ORF data reflects 73% of the students at benchmark or above.
Answer to part two of the question: Are the numbers of students not passing decreasing? The two forms of data used are contradicting. Terra Nova indicates that the number of students not passing has actually increased overall over the past 3 years; however that data does not show a consistent trend. DIBELS data shows that the percentage of students not passing IS decreasing (with the exception of the 09-10 data) Terra Nova – Percent of students NOT making the 50th percentile
The year Reading Vocabulary
07-08 52% 36%
08-09 41% 38%
09-10 52% 56%
DIBELS – Percent of students NOT at benchmark (yellow and red kids)
07-08 32%
08-09 30%
09-10 38%
10-11 (Fall) 27%
Grade 3:
Answer: In English Language Arts and math, the third grade showed adequately yearly progress from 2009-2010.

59
Data Statements:
According to Spring 2009 and 2010 ISTEP data, Parkwood students increased the percent passing in English Language Arts from 75% to 79%.
According to Spring 2009-2010 ISTEP data, Parkwood students increased the percent passing in Math from 58% to 72%.
Grade 4:
Answer: Yes, there is evidence of students making adequate yearly progress.
Data Statement:
Grade 5:
Answer: The percentage of students not passing ISTEP+ has decreased.
Data Statements:
• In Spring 2009, 60% of fifth graders passed ISTEP+ in ELA. • In Spring 2010, 69% of fifth graders passed ISTEP+ in ELA. • In Spring 2009, 66% of fifth graders passed ISTEP+ in Math. • In Spring 2010, 77% of fifth graders passed ISTEP+ in Math.
Assessment Q5. How well are students meeting standards in non-ISTEP+ grades? Errors?
KDG: The percentage of students meeting benchmark levels in reading is about 88%.
Grade 1:
Answer: Using Goal Clarity Window data, DIBELS and mClass Math data students are mastering standards in ELA more proficiently than they are mastering math standards.
Data Statements:

60
LA: 73% (69/94) of the 1st grade students are meeting state standards as evidenced in the Beginning of the Year benchmark data on DIBELS.
MATH: 31% (30/96) of the 1st grade students are meeting state standards as evidenced in the Beginning of the Year benchmark data on mClass Math.
Grade 2:
Answer: Most students in 2010 are meeting Language Arts and Math standards according to Goal Clarity Assessment data.
Data Statements: As reflected in 2010 Goal Clarity Data statements for fall of 2010 to present, in 6 of 8 assessments given, (75% ) of the time we had 80% or more of students proficient in English/Language Arts standards.
In 5 of 8 assessments given, (62%) of the time, 80% or more of the students were proficient in Math standards Assessment Q6. How many students read at/above gr. level? W/ comprehension?
KDG:
In the spring 2010 85% of the students were proficient or above proficient on TRC.
Grade 1:
Answer:
TRC data
Data Statements:
Benchmark: 49% (46/93) of the first grade students were benchmark level as evidenced in the Beginning of the Year data on TRC
Strategic: 30% (28/93) of the first grade students were strategic level as evidenced in the Beginning of the Year data on TRC
Intensive: 20% (19/93) of the first grade students were intensive level as evidenced in the Beginning of the Year data on TRC

61
Grade 2:
Answer: The following statistics are based on current TRC (Text Reading Comprehension) data from mCLASS:
Grade Level Statistics
19/63 (30%) were in red
11/63 (17%) were in yellow
30/63 (48%) were not reading with comprehension at or above grade level
19/63 (30%) were in green
14/63 (22%) were in blue
33/63 (52%) were reading with comprehension at or above grade level
Grade 3:
80% of third grade students mastered comprehension standard on ISTEP.
Grade 4:
Answer: 45% of fourth grade students are reading at or above grade level with comprehension.
Data Statements: This is based on SRI – Scholastic Reading Inventory gives a lexile level on students.
These scores are from October 2010. 4th grade students should be at a lexile level between 600 and 900.
Students scoring 600 or above Students scoring below 600
4th Grade 33/74 - 45% 41/74 - 55%

62
Grade 5:
Answer: According to SRI (Scholastic Reading Inventory), and using a Lexile level of 750 or above, approximately 50% of the fifth grade students tested are reading at or above grade level with comprehension.
Note: A few students were absent or encountered technology issues when trying to log on.
Data Statements:
As shown on the November 2010 SRI data, 36/72 (50%) of the fifth grade students tested are reading at or above grade level
Assessment Q7. Do students w/ As, Bs, & Cs on report cards pass ISTEP+ (elem)?
KDG:NA Grade 1: Answer: Using Beginning of the year mClass data and grades on the first quarter report card there is not a consistent correlation between grades and the assessment.
Data Statements: LA
Benchmark Students: 46 Students
A’s 72% 33/46
A’s/B’s 20 % 9/46
A’s/B’s/C’s 7% 3/46
Strategic Students: 28 Students
A’s 39% 11/28
A’s/B’s 61% 17/28
A’s/B’s/C’s 0%
Intensive Students: 19 Students
A’s 37% 7/19

63
A’s/B’s 32% 6/19
A’s/B’s/C’s 11% 2/19
MATH
Benchmark Students: 30 Students
A’s 93% 28/30
A’s/B’s 7% 2//30
A’s/B’s/C’s
Strategic Students: 54 Students
A’s 65% 35/54
A’s/B’s 20% 11/54
A’s/B’s/C’s 7% 4/54
Intensive Students: 13 Students
A’s 15% 2/13
A’s/B’s 38% 5/13
A’s/B’s/C’s 23% 3/13
Grade 4: Answer: Most students with A’s and B’s passed ELA ISTEP+. Half of students with C’s passed ELA ISTEP+. All students with A’s passed Math ISTEP+. Most students with B’s passed Math ISTEP+. Few students with C’s passed Math ISTEP+.
Data Statements: Taken from 3rd grade I-Step+ 2010.
ELA Math
Grade Passed
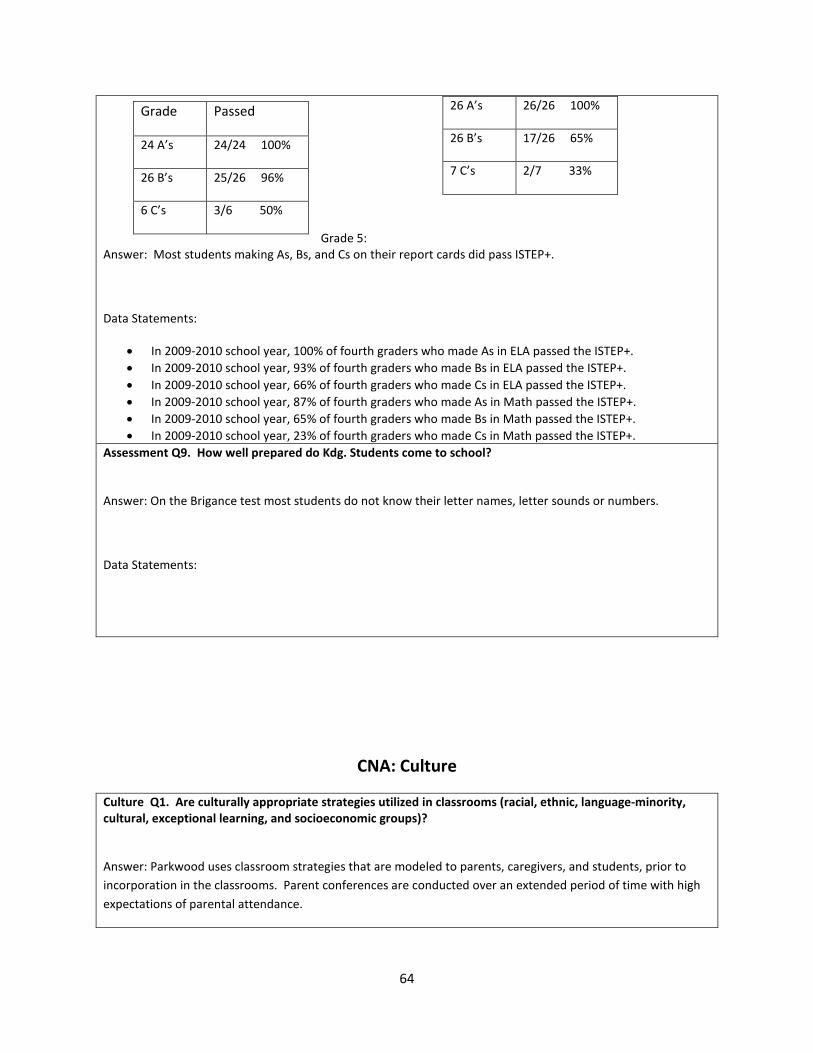
64
Grade 5: Answer: Most students making As, Bs, and Cs on their report cards did pass ISTEP+.
Data Statements:
• In 2009-2010 school year, 100% of fourth graders who made As in ELA passed the ISTEP+. • In 2009-2010 school year, 93% of fourth graders who made Bs in ELA passed the ISTEP+. • In 2009-2010 school year, 66% of fourth graders who made Cs in ELA passed the ISTEP+. • In 2009-2010 school year, 87% of fourth graders who made As in Math passed the ISTEP+. • In 2009-2010 school year, 65% of fourth graders who made Bs in Math passed the ISTEP+. • In 2009-2010 school year, 23% of fourth graders who made Cs in Math passed the ISTEP+.
26 A’s 26/26 100%
26 B’s 17/26 65%
7 C’s 2/7 33%
Grade Passed
24 A’s 24/24 100%
26 B’s 25/26 96%
6 C’s 3/6 50%
Assessment Q9. How well prepared do Kdg. Students come to school?
Answer: On the Brigance test most students do not know their letter names, letter sounds or numbers.
Data Statements:
CNA: Culture
Culture Q1. Are culturally appropriate strategies utilized in classrooms (racial, ethnic, language-minority, cultural, exceptional learning, and socioeconomic groups)?
Answer: Parkwood uses classroom strategies that are modeled to parents, caregivers, and students, prior to incorporation in the classrooms. Parent conferences are conducted over an extended period of time with high expectations of parental attendance.

65
Data Statements: Parkwood’s attention to details, dedication to parent involvement and student enrichment is noted in: 51% attendance for Family Literacy Nights, 86% attendance for parent conferences, 50% attendance for Parent Training through CAPE Grant for Family Dynamic Classes, and attendance of students for Enrichment Clubs, Extra curricular activities, and athletic intramurals.
Culture Q2. Is the number of student disruptions kept to a minimum so that learning time for students is maximized?
Answer: Student disruptions are kept to a minimum at Parkwood. We have a building wide 90 minute block for Literacy built into each grade levels schedule. We have a building wide discipline in our handbook and the plan is further explained in the student planners.
Data Statements: Parkwood has a building wide discipline plan in our handbook and the plan is explained in our student planners. Schedules are communicated to parents in the fall. Tardy students are an ongoing issue for our school, with an average of 1.45 in 4 Quarters. Two teachers are participating in a Corporation wide Discipline Program with implementation expected in 2011. Parkwood had 0 students expelled in 09-10 and 18 students were suspended from class.
Culture Q3. Do we have a safe learning environment?
Answer: Parkwood parents and staff feel students are safe while attending school. Parents and staff fee students and staff are safe while in their classrooms and during school events.
Data Statements: 83% of our parent reported on a survey they felt their child was safe at Parkwood. 97 % of the staff felt safe attending events at school. Refer to the survey results:
• 88% of certified staff felt that safety concerns, when reported, are handled in a timely manner, as based on the Greater Clark County Schools Spring Survey 2010.
• 97% of certified staff and 68% of classified staff felt safe when attending school events; 83% of the parents believed their child felt safe at school events, as based on the Greater Clark County Schools Spring Survey 2010.
• 100% of certified staff and 65% of classified staff felt safe in the school cafeteria; 88% of the parents believed their child felt safe in the cafeteria, as based on the Greater Clark County Schools Spring Survey 2010.
• 66% of the certified staff and 69% of the classified staff felt safe outside the building before and after school; 83% of the parents believed their child felt safe outside before and after school, as based on the Greater Clark County Schools Spring Survey 2010.

66
• 94% of certified staff and 65% of classified staff felt safe when monitoring or supervising student-group activities, as based on the Greater Clark County Schools Spring Survey 2010.
• 100% of certified staff and 63% of classified staff felt safe in the classrooms or work areas; 91% of parents believed their child felt safe in the classroom, as based on the Greater Clark County Schools Spring Survey 2010.
• 94% of certified staff and 63% of classified staff felt safe in the hallways during class changes; 87% of parents believed that their child felt safe in the hallways during class changes, as based on the Greater Clark County Schools Spring Survey 2010.
• 97% of certified staff said that Parkwood adults intervene in any unsafe situation they observe and that they would intervene in any such situation, as based on the Greater Clark County Schools Spring Survey 2010.
• 94% of certified staff said staff was visible during class changes or at times when students are out of the classroom, as based on the Greater Clark County Schools Spring Survey 2010.
• 85% of parents believed that their child felt safe in the school restrooms, as based on the Greater Clark County Schools Spring Survey 2010.
• 77% of parents believed that their child felt safe when participating in activities before or after school, as based on the Greater Clark County Schools Spring Survey 2010.
Culture Q4. How well are our rules or procedures for behavior followed?
Answer: Procedures and Rules for behavior are followed and modeled by 96 % of students at Parkwood.
Data Statements: Parkwood’s blue line and building wide rules, procedures and routines have had a positive impact on our “Common Area” behavior issues as is evident by the decrease in referrals. Parkwood had only 18 students suspended from class and 0 students expelled in 2009-2010. Documents stated that of 33 events that required formal disciplinary measures: 18 students were referred .Parkwood had 10 students who were referred for single incidents and 8 students had multiple incidents, during this time period of documentation (2009-2011).
Culture Q5. How do we inform families about state standards, student performance, grade level expectations, class policies & procedures?
Answer: Parkwood has a multi-leveled process of communicating with parents, written notices, technology, and person to person. Communication with parents is offered weekly, monthly, quarterly, and yearly at Parkwood.

67
Data Statements: Parkwood incorporates the use of web pages, student planners with the student and parent handbooks inside, newsletters (weekly and monthly) from the office and some individual teacher newsletters, parent conferences: formally twice a year, more often on an as needed basis. Brochures, leaflets, and report cards are all translated for parents and caregivers as needed. All formal testing information is communicated with home several times in multi-packaged communications and translated when necessary. Back – to- school nights are scheduled for the first few weeks of school, so procedures are modeled and explained to parents and students. Teachers model, role-play, explain, and discuss classroom procedures, rules, and routines the first weeks of school and review after our Winter Break.
Culture Q6. What level of attendance do we have at parent conf. Open house, other?
Answer: Parkwood has a high percentage of attendance for formal parent conferences and for Family Literacy Nights.
Data Statements: Parkwood has a 94% attendance for our twice a year formal parent conferences. Parkwood has a 51 % attendance for our Family Literacy Nights. We Schedule Back-to-school nights for grade level, at the beginning of the year. Our parents attend our after school athletic, extra-curricular events, programs, performances, and competitions; although, no formal attendance records are collected. Our parents have come together to form a PTO for Parkwood. The leaders have planned, organized, and implemented several fund raisers, evening events for students and families. They have become involved with the routines of Parkwood and attend our Friday Morning Assemblies to promote fund raisers, recognize students, and reach out to our students, families, and staff. These events and programs have been very successful and well attended.
Culture Q7. What business partnerships do we have? With what outcomes? Role in decision-making?
Answer: Parkwood has good working partnerships with the CAPE Group, New Neighbors Organization, DARE Program, and PNC Bank.
Data Statements: Parkwood has been working with CAPE for several successful years and has now expanded services at Parkwood. New Neighbors has become a more involved and in house organization for us. DARE has stepped up their participation and involvement with more school/student relationship and guidance programs.
These organizations have a high impact on our future planning, schedule planning, and goal development for our student and parent involvement plans
CNA: Curriculum

68
Curriculum Q1. Is curriculum aligned with state standards? Instruction? Are curriculum maps completed, reviewed and updated regularly?
Answer: The Goal Clarity Windows used to guide curriculum are aligned with the Indiana State Academic Standards. Instruction is based on the focus standard used to create the GCW. Standards have been mapped on a calendar to assure every standard is addressed. Goal Clarity Windows are created and completed by teachers on the Rubicon Atlas website during weekly grade level meetings and submitted to the principal the week prior to instruction. GCW are reviewed by administration using the Rubicon Atlas website. GCW will be updated before they are used in the Spring and Fall of 2011.
Data Statements:
• As shown on Atlas Rubicon, 100% of teachers align the grade level curriculum with the Indiana state standards.
• As shown on Atlas Rubicon, 100% of teachers of teacher complete and update the Goal Clarity Windows regularly.
Curriculum Q2. Is staff fully implementing key programs trained in?
Answer: Most staff members have had the Voyager training. Most staff members are not currently implementing this program in their classrooms.
Data Statements:
• As shown on a teacher survey given in Fall 2010, 22/31 (71%) of teachers have had the Voyager training.
• As shown on a teacher survey given in Fall 2010, 9/31 (29%) of teachers have not had the Voyager training.
• As shown on a teacher survey given in Fall 2010, 15/22 (68%) of teachers do not currently use the Voyager training in their classrooms.
• As shown on a teacher survey given in Fall 2010, 8/22 (36%) of teachers do currently use the Voyager training in their classrooms.
Curriculum Q3. How are Goal Clarity Windows being used?

69
Answer: Goal Clarity Windows are monitored by weekly submission to the principal. Goal Clarity Windows are posted to Rubicon Atlas where they can be viewed by all GCCS teachers, as well as administration. Goal Clarity Windows are used to guide daily instruction.
Data Statements:
As shown on Rubicon Atlas and documented in teacher lesson plans, 34/34 (100%) of teachers use Goal Clarity Windows to guide daily instruction.
Curriculum Q4. Are rubrics and exemplars being developed and used by teachers AND Students: Are state rubrics posted and used by students?
Answer: Most teachers use rubrics in math, literacy, and writing. Sometimes teachers use rubrics in science and social studies.
Data Statements: As shown on the teacher surveys given during the Fall of the 2010-2011 school year:
Math
• 2/25 (8%) of teachers never use rubrics • 5/25 (20%) of teachers sometimes use rubrics • 11/25 (44%) of teachers often use rubrics • 7/25 (28%) of teachers always use rubrics
Literacy
• 2/29 (7%) of teachers never use rubrics • 7/29 (24%) of teachers sometimes use rubrics • 11/29 (38%) of teachers often use rubrics • 9/29 (31%) of teachers always use rubrics
Writing
• 2/29 (7%) of teachers never use rubrics • 4/29 (14%) of teachers sometimes use rubrics • 15/29 (52%) of teachers often use rubrics • 8/29 (28%) of teachers always use rubrics
Science
• 13/25 (52%) of teachers never use rubrics • 11/25 (44%) of teachers sometimes use rubrics • 1/25 (4%) of teachers often use rubrics • 0/25 (0%) of teachers always use rubrics
Social Studies
• 15/25 (60%) of teachers never use rubrics

70
• 9/25 (36%) of teachers sometimes use rubrics • 1/25 (4%) of teachers often use rubrics • 0/25 (0%) of teachers always use rubrics
Answer: Sometimes students use rubrics in math, literacy, and writing. Students rarely use rubrics in science and social studies. Data Statement: As shown on the teacher surveys given during the Fall of the 2010-2011 school year:
*The data below shows the percent of classrooms that have students use rubrics*
Math
• 7/25 (28%) never use rubrics • 15/25 (60%) sometimes use rubrics • 3/25 (12%) often use rubrics • 0/25 (0%) always use rubrics
Literacy
• 5/29 (17%) never use rubrics • 18/29 (62%) sometimes use rubrics • 6/29 (21%) often use rubrics • 0/29 (0%) always use rubrics
Writing
• 3/29 (10%) never use rubrics • 12/29 (42%) sometimes use rubrics • 11/29 (38%) often use rubrics • 3/29 (10%) always use rubrics
Science
• 14/25 (56%) never use rubrics • 9/25 (36%) sometimes use rubrics • 2/25 (8%) often use rubrics • 0/25 (0%) always use rubrics
Social Studies
• 17/25 (68%) never use rubrics • 7/25 (28%) sometimes use rubrics • 1/25 (4%) often use rubrics • 0/25 (0%) always use rubrics
Curriculum Q5. Are students provided technology classes? How often? How assessed?
Answer: Students are provided with consistent technology instruction provided by the technology teacher, Kerri Black. Students attend technology class once a week, for three quarters of the year. During one quarter of the year, students receive technology instruction twice a week, due to scheduling. Students are assessed

71
weekly through technology teacher observations. Students are also assessed two to five times per quarter on introduced skills.
Data Statements:
• As shown on the 2010-2011 daily schedule, 100% of students, grades k-5, attend technology class in the special area rotation once weekly.
• As shown on Rubicon Atlas, 100% of students, grades k-5, are provided with technology instruction. Curriculum Q6. How many/what percent of students are enrolled in Advanced Placement and or Honor courses? Served by the corporation’s highly Able program?
Answer: Very few students are served by the corporation’s highly-able program.
Data Statements: 4/505 (.8%) students at Parkwood Elementary School are enrolled in GCCS highly able program.
CNA: Intervention
Intervention Q1. Are extended time interventions (i.e., tutoring, summer school, supplemental classes) increasing student learning?
Answer:
Grade 1: The extended interventions that our 1st grade students have been able to take advantage of are supplemental services as a Kindergarten and Tier 2 Intervention groups.
The students that have been serviced in Kindergarten with supplemental services are listed on the attached spreadsheet along with the 1st grade students participating in a Tier 2 intervention group during this first semester.
Grade 2: Extended time is increasing student learning in second grade.
Grade 3: There is insufficient data at this time know if extended time services are increasing student learning in third grade. There is only one set of Acuity data to evaluate at this time.
Grade 4: About half of the fourth grade students that attended extended time interventions increased Acuity scores from Spring to Fall 2010.

72
Grade 5:At the fifth grade level students’ scores are improving on ISTEP after attending extended time programs.
Data Statements:
12 students received supplemental services in Kindergarten and are registered in a Parkwood 1st grade this year:
6/12 – 50%: Benchmark – BOY Grade 1
4/12 – 33%: Strategic – BOY Grade 1
2/12 – 17%: Intensive – BOY Grade 1
10/11 current second grade students received scores of proficient or above proficient at the end of the extended time on end of year DIBELS.
16/24 students or 67% of third graders passed at least one area of the Fall 2010 Acuity after receiving extended time services.
12/21 or 57% of fourth grade students improved on at least one area of Acuity from Spring 2010 to Fall 2010 after receiving extended time services.
23/26 students or 88% of fifth graders’ scores improved from ISTEP 2009-ISTEP 2010.
Intervention Q2. What data is used to identify students, programs and personnel for our intervention program?
Answer: Kindergarten: DIBELS testing and teacher observation, mclass reading, and mclass math, Goal Clarity-may do intervention test.
First Grade: The data used to identify students for our intervention program is DIBELS – Nonsense Word Fluency (NWF) for the Beginning of the Year benchmark assessment and then DIBELS – Oral Reading Fluency (ORF) from the Middle of the Year benchmark assessment. Text Reading Comprehension (TRC) is also taken into consideration to determine students for our intervention program.
Programs for our intervention program have been determined by Reading First in prior years – Voyager Passport and Houghton Mifflin Early Success. These two programs have continued to be used as no new programs have been introduced to us with training and materials to support implementation.

73
Personnel for our intervention program are determined by staffing decided by the principal. One special needs coordinator is designated to support 1st grade as is one ESL certified teacher. Schedules for these support personnel are directed toward the students with most need.
Second Grade: Students are placed in intervention based on DIBELS ORF and TRC.
Third Grade: In third grade we use ORF and TRC from the end of second grade to identify students in need of intervention. After Acuity is given in October, we will look at this data in addition to GCW data to determine which students are in need of intervention. We will be looking at the students at the end of each quarter to decide what intervention will best suit each child in need. In third grade we look at the students’ scores on end of second grade ORF and TRC to determine which intervention program will best suit the groups with similar needs. Right now we use third grade passport (either comprehension or word study), the model classroom, or soar to success.
In determining which personnel for our programs, we look at which classroom teacher has the most students in their homeroom class for each of the groups. That teacher usually does the group to cut down on transition time. However, students also go with the ESL teacher for the grade level if that is their need or the Special Ed teacher for the grade level if that is their need.
Fourth Grade: ISTEP data and Acuity scores are used to place or move students in or out of Intervention within a classroom Intervention group as well as another teacher’s group (depending on ability grouping) . Teacher observation and previous Intervention placement is also considered. Some students are tested by teachers using ORF Benchmark testing, running records, SRI, and Acuity Reading.
Fifth Grade: ISTEP and Acuity data are used to identify students in need of intervention.
Data Statements:
3/6 or 50% of grade levels use DIBELS measures to place students in intervention groups.
3/6 or 50% of grade levels use ISTEP and Acuity scores to place students into intervention groups.
Intervention Q3. How often is student data reviewed for intervention groups?
Answer: Kindergarten: Data is reviewed each 9 weeks.
First Grade: Student data is reviewed every nine weeks.
Second Grade: Data is reviewed at the end of each quarter to determine if new placements need to be made.
Third Grade: Data is reviewed “officially” for intervention groups at the close of each quarter. However, if something is not working it can be reviewed on a case by case basis and slight changes can be made.
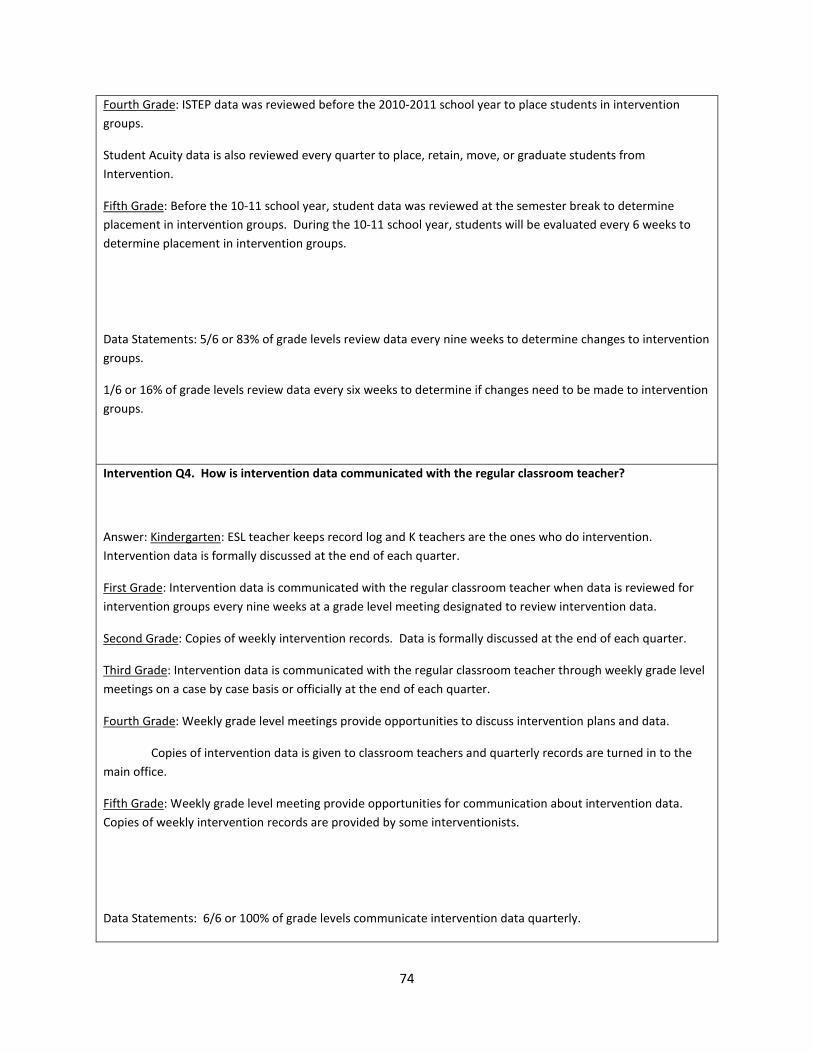
74
Fourth Grade: ISTEP data was reviewed before the 2010-2011 school year to place students in intervention groups.
Student Acuity data is also reviewed every quarter to place, retain, move, or graduate students from Intervention.
Fifth Grade: Before the 10-11 school year, student data was reviewed at the semester break to determine placement in intervention groups. During the 10-11 school year, students will be evaluated every 6 weeks to determine placement in intervention groups.
Data Statements: 5/6 or 83% of grade levels review data every nine weeks to determine changes to intervention groups.
1/6 or 16% of grade levels review data every six weeks to determine if changes need to be made to intervention groups.
Intervention Q4. How is intervention data communicated with the regular classroom teacher?
Answer: Kindergarten: ESL teacher keeps record log and K teachers are the ones who do intervention. Intervention data is formally discussed at the end of each quarter.
First Grade: Intervention data is communicated with the regular classroom teacher when data is reviewed for intervention groups every nine weeks at a grade level meeting designated to review intervention data.
Second Grade: Copies of weekly intervention records. Data is formally discussed at the end of each quarter.
Third Grade: Intervention data is communicated with the regular classroom teacher through weekly grade level meetings on a case by case basis or officially at the end of each quarter.
Fourth Grade: Weekly grade level meetings provide opportunities to discuss intervention plans and data.
Copies of intervention data is given to classroom teachers and quarterly records are turned in to the main office.
Fifth Grade: Weekly grade level meeting provide opportunities for communication about intervention data. Copies of weekly intervention records are provided by some interventionists.
Data Statements: 6/6 or 100% of grade levels communicate intervention data quarterly.

75
4/6 or 67% of grade levels communicate intervention data with the regular classroom teacher when needed at weekly grade level meetings.
4/6 or 67% of grade levels communicate intervention data with the regular classroom teacher through weekly intervention records.
Intervention Q5. What methods are used to evaluate and track the effectiveness of intervention initiatives?
Answer: Kindergarten: DIBELS progress monitoring is used to track the effectiveness of intervention initiatives.
First Grade: The methods used to evaluate and track the effectiveness of intervention initiatives are collaborative conversations around the intervention data during designated grade level meetings.
Second Grade: Second Grade uses the progress monitoring and benchmark data from ORF and TRC to monitor the effectiveness of intervention.
Third Grade: We are using ORF and TRC to evaluate and track the effectiveness of the model classroom interventions. We are using weekly assessments (goal clarity window tests) and Acuity to evaluate and track the effectiveness of the other interventions.
Fourth Grade: ISTEP and Acuity data are used to track effectiveness. Some teachers use ORF Benchmark testing, running records, or SRI to determine effectiveness of intervention initiatives.
Fifth Grade: Acuity and ISTEP data are used to track effectiveness of interventions. The model classroom teacher also uses ORF and TRC scores to monitor and track the effectiveness of intervention.
Data Statements: 4/6 or 67% of grade levels use DIBELS data to monitor and track the effectiveness of intervention initiatives.
3/6 or 50% of grade levels use Acuity to evaluate and track the effectiveness of intervention initiatives.
2/6 or 33% of grade levels use ISTEP to evaluate and track the effectiveness of intervention initiatives.
1/6 or 17% of grade levels are using the goal clarity window assessments to help monitor and track the effectiveness of intervention initiatives.
5/5 or 100% of model classroom teachers are using TRC an ORF to evaluate and track the effectiveness of intervention initiatives.

76
CNA: Pedagogy
Pedagogy Q1. Is consistent language & strategies used across grades & classes within grades?
Answer: Yes, with regard to methodologies we’ve adopted such as: 4-Square Writing format, and Balanced Math, and Larry Bell’s Twelve Powerful Words. We also use consistent language in the instruction of our mastery standards in ELA and Math per the development of vocabulary for Goal Clarity Windows.
Data Statements: Meeting record forms and the Goal Clarity Windows document the use of consistent language within grade levels in both ELA and Math, as planned through GCW. Evidence of the consistent language in our instruction would be found in lesson plans and principal observation feedback.
Pedagogy Q2. How much time is spent in teach, guided practice, independent practice?
According to the data collected from an instructional audit at Parkwood Elementary School, teachers indicated that on average during reading 45% of the time is used for teach, 35% used as guided practice, and 20% of the time is used for independent practice.. The data indicated that on average during math 38% of the time is used for teach, 41% of the time used as guided practice, and 21% of the time is used for independent practice.
Area of Instruction: Average amount of time spent during Reading:
Average amount of time spent during Math:
Teach 45% 38%
Guided Practice 35% 41%
Independent Practice 20% 21%
Data Statements:
Collected Data:
Teach
Percentage of School Time Number of Teachers Reporting for Reading
Number of Teachers Reporting for Math

77
15% 0 4
20% 1 3
25% 1 1
30% 2 0
33% 1 0
35% 1 2
40% 6 3
50% 10 6
60% 5 3
Guided Practice
Percentage of School Time Number of Teachers Reporting for Reading
Number of Teachers Reporting for Math
20% 3 3
25% 4 4
30% 6 2
33% 1 0
35% 0 1
40% 6 4
45% 3 0
50% 3 3
70% 1 3
75% 0 1
Independent Practice
Percentage of School Time Number of Teachers Reporting for Reading
Number of Teachers Reporting for Math

78
5% 0 2
10% 5 1
15% 4 4
20% 11 6
25% 5 5
30% 0 3
33% 1 0
45% 0 1
50% 1 0
* Data collected from instructional audit
Pedagogy Q3. What methodologies are used consistently in our building?
Answer: There are several methods that are used consistently across our grade levels.
Uninterrupted literacy block
Targeted interventions
Modeling
Guided practice
Immediate corrective feedback
Differentiating according to data results
Graphic organizers
Mini lessons
Conferencing in Writing
Highlighting
Check items off a plan (writing)
Daily Math Review

79
Explicit instruction
Problem solving steps
Monitoring and fix-up
Balancing all components of literacy
Balancing all components of math
Planners
Homework folders
4-Square Writing Organizer
Data Statements: As reported in the current PL221 School Improvement Plan, as well as teacher interviews, the above-listed methods are used consistently across the grade levels.
Q4. Do we have guidelines for homework that are consistent in each classroom? How do we ensure guidelines are adhered to?
Answer: Each teacher at Parkwood has his/her own set of guidelines, procedures, and consequences for assigning and managing homework assignments. Some grade levels are uniform across the grade level, but most teachers have their own set of standards for this.
Data Statements:
As reported by teachers in interviews during the Fall of 2010, the following statements reflect the way homework assignments are assigned and managed. Evidence is available in the notes from teachers’ initial contacts with parents that outline expectations as well as homework records in some classrooms.
Kindergarten First Grade Second Grade Third Grade Fourth Grade Fifth Grade Given 2-4x week Given 4x week Given 4x week 4x week Given daily Checked daily;
Checked daily, parent signature required. Kids make it up in a variety of ways.
Some check to see that it’s done; some grade it; some take the recess time away
Checked daily; some give an extra day, some have consequence
Use a HW folder – lose all recess if not done- tchrs check for completion not accuracy
Checked daily; those who didn’t do HW stay in and do it at recess
Use planners Staple a HW sheet into planners
Planners and assignment sheets
Use planners
Same subjects given daily
Reading, Math, Spelling daily
Same subjects given daily
Same subjects consistently for homework
Spelling, Reading, Math daily – 1 paper per night
Usually a reading and a math assignment; varies

80
There was a wide variety of ways to ensure guidelines – some teachers require it to be completed the next night, some take off points, some have students do it recess, some have no consequence for not doing homework. Teachers are consistent within their own individual classrooms regarding how they handle it.
Q5. What strategies are used to ensure student engagement?
Answer: While there is a wide variety of strategies used to promote engagement and active participation, most are used consistently among the faculty. The individual contributions are in the table with the data statement and show the overlap of strategies across the building.
Data Statements: As reported in teacher interviews and reflected in lesson plans for fall, 2010: strategies for engagement of students are as follows: (further evidence of these can be found in Goal Clarity Windows and Principal’s Observation feedback)
PreSchool / Kindergarten First Grade Second Grade Third Grade Fourth Grade Fifth Grade
Quick pace whiteboards Document cams whiteboards Document cams Dry erase
Lots of opportunities to respnd movement Tapes and CDs Pinch papers Videos & clips Manipulatives,
including
counters, cubes,
opinion sticks
Variety of activities Doc cams Word/letter cards
partnering Charting
Pointers Hand signals Whiteboards Teacher feedback
Shaving Cream on desks
Hand signals Manipulatives Yes/no sticks
A lot of movement & up/down Lots of visuals Response cups All stu respond Concrete objects
Student copies
Vary teacher voice level Tapes and CDs Response cards Turn and talk Visuals Turn and talk
Lots of visuals Cooperative groups/partners
Hand signals, etc. All senses used Pantomime
Topics related to their lives Proximity Gr. Organizers Hand signals
Instruction – multi sensory Small groups Activities for movement
Rewards
Exit tickets
Songs
Power Points

81
CNA: Planning
Planning Q1. Do students have enough time to learn?
Answer:
No, students do not have enough time to learn.
Data Statements:
Our school schedule is set up to give students the following number of minutes in each area daily:
90 minute reading block
75 minute math block
15 minute content area block
30 minute intervention block
30 or 45 minute writing block
*The daily schedule IS aligned with corporation expectations.
Of the 19 teachers that answered the survey question “Do students have enough time to learn?”
• 11 answered NO • 6 did not answer yes or no, but commented that some students have enough time but others do not. • 2 answered YES – one commented “for the most part”
*6 teachers commented that time is a problem for struggling students – they especially do not have enough time to master the material.
*3 teachers commented that the amount of content that we are teaching in the given amount of time is too much for students to retain. Maybe the solution is to teach fewer more focused standards.
Planning Q2. Does the school schedule enhance or hinder learning? Time on task?
Answer:

82
The school schedule is amenable to learning if time on task is maximized and students are mastering the concepts equally. Students are hindered by the schedule if time allotted in the schedule does not produce mastery of the material for some students.
Data Statements: Time on task under many circumstances is reduced by frequent transitioning of students to other groups and classrooms throughout the building. Some students have enough time while others do not. Time is a problem for struggling students etc.
Planning Q 3. How are paraprofessionals & special program staff used to support student learning?
Answer:
Each of the four kindergarten classrooms has a full time paraprofessional.
They help to get materials ready and help by checking students when they finish work. They conduct small groups in reading and math so the students receive more individual attention and practice. They help individuals who require extra help understanding different concepts. They read stories and conduct activities for the whole group when the teacher is giving the DIBELS, mClass Reading, or mClass Math tests.
The special education teachers plan programs to meet the special needs students’ IEPs. The special education paraprofessionals help students individually and in small groups. The speech teachers help their students individually and in small groups. The ESL teachers help students in small groups and by translating instructions and notes to parents. The Media Clerk helps organize and pull books so students can participate in the Reading Counts program.
Janet Clark provides a number of services to help student learning. She provides a homework club and works individually with students having issues which might interfere with learning.
Michelle Palmer works with CIS (Communities In Schools). One of her duties is to provide day care after school each day. At that time, she helps students with homework assignments.
I.U.S. works with Parkwood with the New Neighbor Program. Training is given to teachers to help them know how to work with ELL students. A number of students from I.U.S. help once a week in the classrooms working with individual or small groups of ELL students.

83
Dr. Frey and several others from U of L Kent School of Social Work are helping train teachers in the First Steps to Success program. This helps teachers and students deal with behavior issues which affect student learning.
Special Area teachers in Art, Music, Technology, and Gym are all supporting student learning in their areas. They also use extra periods to come into the classrooms and provide small group instruction.
Data Statements:
Planning Q4. Are school improvement strategies monitored on a regular basis?
Answer:
Yes, school improvement strategies are monitored on a regular basis.
Data Statements:
Intervention: Intervention records and data
Curriculum Mapping: Posted Online
Meeting record forms from grade level meetings; Staff meetings; Leadership meetings
Goal Clarity Windows – Posted on Rubicon
Data Walls: track students progress (visual)
Data Binders: each teacher has a binder of his/her class.
ELA Reading/Writing

84
Balanced Literacy: Phonemic Awareness, Phonics, Vocabulary, Fluency, Comprehension are taught daily as evident in lesson plans.
Applied Benchmark Assessments – These assessments focus on Indiana Standards and
provide students with exposure to open-ended response questions. Teachers score the
applied assessments with the Indiana Standards Rubric.
Kdg. – Gr. 5 teachers administer, score and analyze Applied ELA three times per year.
Gr. 3-5 teachers administer Scholastic Reading Inventory (SRI) three times a year.
DIBELS Grades K-2 teachers administer and analyze DIBELS and Reading 3D three times a year
Progress Monitor for DIBELS bi-weekly
Acuity - Grades 3- 5 teachers administer and analyze Acuity ELA three times per year
Math
Balanced Math: Poster Method, Mental Math, Daily Math Review, Conceptual Units, Monitoring student scores
Applied Benchmark Assessments: These assessments focus on Indiana Standards and provide students with exposure to open-ended response questions. Teachers score the applied assessments with Rubrics designed from Indiana Standards.
Kdg. -Gr. 5 teachers administer, score and analyze performance based/ applied assessments (problem solving with ISTEP+ format) three times a year.
DIBELS - Grades K-2 teachers administer and analyze DIBELS Math three times a year.
Acuity - Grades 3- 5 teachers administer and analyze Acuity Math three times a year.

85
Science/Social Studies
Acuity - Grade 4 teachers administer and analyze Acuity Science two times per year.
Acuity - Grade 5 teachers administer and analyze Acuity Social Studies two times per year.
Planning Q5. How is shared leadership demonstrated in the building? What opportunities are available for teacher leaders?
Answer:
At Parkwood Elementary we have a building leadership team, which consists of our principal, Title 1 coordinator, and at least 1 teacher from each grade level. Our leadership team meets once a week after school to discuss and make decisions about our school. The representative from each grade level then reports important information back to the grade level teachers.
Data Statements:
The teachers on the leadership team, as well as other teachers, are given opportunities to participate in trainings in both academic and behavioral areas. Teachers are also given opportunities to report back to the other teachers in the building during our period zero collaboration time. This year we have teachers involved in:
• Goal Clarity Window training • Leadership Academy • FOSS training (science) • Positive Behavior Supports training • Balanced Math training
Parkwood staff lead the following student activities: • Basketball • Cheerleading • Dance Team • Student Council • After School Enrichment Clubs • Nature Club • Sport Intramurals • Wrestling • PNC Student Bank
• PTO meetings and activities

86
CNA: Professional Development
Q1. What is the relationship of student achievement, state standards, & professional dev?
Answer: There was an increase in Math ISTEP scores for the 2009-2010 school year. Balanced Math was implemented after teachers attended several PD’s. GCW required teachers to focus more in depth on a state standard. As a result of GCW teachers collaborate and are able to acknowledge which students are not at a mastery level. Using the data, teachers and staff can then work intensely with students to help them obtain mastery status on a specific academic standard.
Q2. What impact has PD had on classroom practice? How do we know? How do we evaluate impact?
Answer: Implementing daily math review into the classroom has offered data to teachers that help drive instruction. GCW PD has required teachers to focus on core standards and teach deeply. GCW assessments are tracked and discussed through grade level meetings. Through various discussions, teachers become aware of what techniques worked and what did not. They can take this information back to their classrooms and implement different instructional strategies.
Q3. What kinds of collaboration exist? How effective is each?
Answer: Weekly collaboration exists during grade level meetings. This provides an opportunity for
teachers to develop strategies that will be implemented in classroom instruction. This also gives teachers time to discuss strategies that were effective and not effective. We acknowledge that we are trying to work together to raise students achievement, although time is an issue restricting collaboration.
Q4. Does PD increase cultural competency?
Answer: PD does increase our cultural competency. Through our Ruby Payne PD, teachers are more aware of things that students go through beyond the classroom doors. New Neighbors has given us strategies that help us teach our students with limited vocabulary/ background knowledge. ESL coordinators have provided resources to the staff in order to familiarize them with common Spanish phrases.

87

88