Parking Meter and Time Limit Preliminary...
30
DECEMBER 12, 2011 Parking Meter and Time Limit Preliminary Evaluation
Transcript of Parking Meter and Time Limit Preliminary...

DECEMBER 12, 2011
Parking Meter and Time Limit
Preliminary Evaluation

PARKING METER AND TIME LIMIT PRELIMINARY EVALUATION/ PAGE 2
DECEMBER 12, 2011
Executive Summary The following report evaluates the effects of new SFpark parking meters and extended time limits on
meter revenue and parking meter-related citations during the first six months of 2011, before SFpark
made any demand-responsive meter rate adjustments.
As part of SFpark, the SFMTA has installed new, credit card-enabled meters at about 7,000 of the City’s
26,800 metered parking spaces since early 2010. The SFMTA also extended time limits at SFpark meters
to four hours, and in some places time limits were eliminated altogether. The new meters had the
following effects:
Parking meter-related citations decreased by 35 percent at the new meters compared to a 21
percent decrease at meters that were not upgraded.
Net meter revenue (not including parking meter-related citations) increased by 20 percent at the
new meters, compared to the rest of the City’s older meters that generated 7 percent less
revenue than the previous year.
Extending time limits in April tripled the net revenue increase at the new meters from 11 percent
in January through March to 37 percent in May and June.
Adding together meter revenue and meter-related citations, the new meters are generating more
revenue than meters that were not upgraded compared to last year. Combined revenue at the
new meters decreased by about 3 percent, while combined revenue decreased by 14 percent at
meters that were not upgraded.
In 2012 the SFMTA will evaluate whether the new meters lower coin collection or meter maintenance
costs, the effect of demand-responsive pricing, as well as complete a more thorough, longer-term
evaluation of how SFpark has affected overall parking revenues, whether from meters, citations, garages,
parking tax, or other sources.

PARKING METER AND TIME LIMIT PRELIMINARY EVALUATION/ PAGE 3
DECEMBER 12, 2011
Overview
As part of SFpark, the San Francisco Municipal Transportation Agency (SFMTA) has installed new
meters that accept both coins and SFMTA parking cards as well as credit cards at about 7,000 of San
Francisco’s 26,800 metered on-street parking spaces since the start of 2010. This report evaluates the
effects of those new parking meters. It compares data from over 4,500 metered parking spaces that had
old meters from January to June 2010 and new meters from to January to June 2011, and also evaluates
the effects of lengthening parking time limits (implemented in April 2011) in SFpark areas. Specifically,
this report evaluates how:
New parking meters affected gross and net meter revenue
New parking meters affected parking meter-related citations
Longer time limits affected parking meter revenue
Longer time limits affected parking meter-related citations
New meters and longer time limits affected parking behavior (e.g., overall occupancy and how
long people park)
In addition to enabling the SFMTA to implement SFpark, the new meters are part of the agency’s strategy
to make paying for parking more convenient, and shift parking revenue away from parking tickets and
towards payment at the meter. At older parking meters that only accept coins and SFMTA parking cards,
compliance rates are relatively low, and citations are common. By making it easier to pay – both by
accepting credit cards and by extending time limits – the SFMTA hopes to increase compliance and
reduce the need for citations. Just as the SFMTA is working to reduce fare evasion on Muni, the agency
is striving to increase compliance at the meter.
Evaluating the new meters This report evaluates the new parking meters in comparison to the older meters they have replaced. It
uses several metrics, including revenue, operation costs, citations, and parking space occupancy levels.
Parking revenue and citations vary from year to year for a variety of reasons. In order to control for this,
the report also includes an evaluation of the same revenue metrics for meters that were not upgraded.
This provides a clearer picture of how much revenue has varied across the city for other reasons, and
how much of the variance is uniquely attributable to the new meters or extended time limits.
The key question for this report is whether increases in revenue at the new parking meters make up for
the added cost of operating them and for any lost revenue as a result of fewer citations, all other factors
being equal. The report does not analyze changes to coin collection costs because data is not yet
available, but these costs may decrease at new meters.

PARKING METER AND TIME LIMIT PRELIMINARY EVALUATION/ PAGE 4
DECEMBER 12, 2011
This report is presented with the caveat that this is a preliminary analysis, and while some trends are
evident, this report is by no means conclusive. In 2012, the agency will update its evaluation of their
performance.
Chart 1: Year-over-year change in revenue: 2010-2011
Findings
1. New meters increased gross revenue. Gross revenue at the new meters increased by 29
percent in the first half of 2011 compared to the old meters in place during the first half of 2010.
New fees associated with the new meters, such as credit card fees and data transmission fees,
reduced the total revenue gain by about a third. Accounting for these additional costs, the net
increase in revenue compared to 2010 was about 20 percent. During the same period, revenue at
meters that were not upgraded decreased by 7 percent.
o Credit cards accounted for about a quarter of the total number of transactions at the new
meters, but over half the revenue, because people who used credit cards tended to
purchase larger amounts of time.
o Areas with higher meter rates, like Fisherman’s Wharf and Downtown, had larger
percentage increases in revenue as a result of the new meters compared to areas with
lower rates like the Mission and the Marina.
‐80%
‐60%
‐40%
‐20%
0%
20%
40%
60%
January February March April May June
Yea
r-O
ver-
Ye
ar C
han
ge
in R
even
ue:
201
0-20
11
Meters upgradedto smart meters(gross)
Meters upgradedto smart meters(net)
Old meters thatwere notupgraded
Citations atmeters that wereupgraded tosmart meters
Citations atmeters that werenot upgraded tosmart meters

PARKING METER AND TIME LIMIT PRELIMINARY EVALUATION/ PAGE 5
DECEMBER 12, 2011
2. Longer time limits further increased revenue. The combination of accepting credit cards and
extending time limits increased revenue. Extending the time limits to four hours or removing them
altogether at the new meters doubled the year-over-year increase in gross revenue from about 20
percent in January through March 2011 (before time limits were extended at SFpark meters) to
about 46 percent in May and June 2011 (after time limits were extended at SFpark meters).
3. New parking meters reduced parking citations. Parking meter-related citations dropped by 35
percent at the new meters compared to 2010, compared to a 21 percent drop at meters that were
not upgraded. The combined revenue from meters and citations at the new meters was 3 percent
lower than in 2010, compared to the meters that were not upgraded, which had a 14 percent
decrease.
The new meters shifted the ratio of revenue towards greater income from payment at the meter
and less from citations. In 2010, at the old meters, 55 percent of revenue came from payment,
with 45 percent from citations. In 2011, after the new meters were installed, 70 percent of
revenue was from meter payment, with 30 percent from citations.
4. New parking meters and extended time limits did not significantly change parking
behavior. During the analysis period, parking occupancy and length of stay did not change
significantly in areas with new meters and longer time limits, even though meter revenue
increased.

PARKING METER AND TIME LIMIT PRELIMINARY EVALUATION/ PAGE 6
DECEMBER 12, 2011
Meter Data Evaluation Methodology
Meters included in the sample San Francisco uses two types of next-generation meters on its streets that accept credit cards. The first
model is a single-space meter, similar in appearance to traditional parking meters, and the other model is
a multi-space meter that manages several spaces from one machine. Both accept credit cards in addition
to coins and the SFMTA parking card, and both immediately transmit transaction data back to the SFpark
database. They are also both capable of being programmed remotely, and can charge different rates at
different times of day.
This report compares the performance of the older parking meters in the first six months of 2010 with the
performance of the new meters at the same parking spaces in the first six months of 2011. This includes
about 4,300 single-space meters and 55 multi-space meters that manage about 230 parking spaces. Not
all new parking meters are included in the sample; some were installed in spaces that did not previously
have parking meters, and others were installed after the start of the full six-month evaluation period.
All of the parking spaces included in the sample meet the following criteria:
Must have been previously covered by a MacKay single-space meter (which do not accept credit
cards) for the entire period between January 1, 2010 to June 30, 2010
Must have been covered by a new meter that accepts credit cards for the entire period between
January 1, 2011 and June 30, 2011
Must be in an SFpark pilot area
Must be an automobile parking space (motorcycle parking is not included)
Just under two-thirds of San Francisco’s parking meters that accept credit cards meet all of the above
criteria, for a total of about 4,513 total spaces (4,284 single-space IPS meters and 35 Duncan multi-space
meters covering about 229 parking spaces). Revenue data for meters that were not upgraded is also
included in many of the following sections for comparison to the new meters.
In this report, IPS sample meters or single-space sample meters refer to the 4,284 spaces covered by
IPS meters that meet all the criteria above. Duncan sample meters or multi-space sample meters refer
to the 229 parking spaces covered by multi-space Duncan parking meters that meet all the criteria above.
For both samples, year-over-year comparisons are based on comparison to the exact same parking
spaces in the first half of 2010, which were then covered by MacKay single-space parking meters that did
not accept credit cards. Taken together, the single-space sample meters and the multi-space sample
meters comprise the full smart meter sample of 4,513 meters. All of the meters in the smart meter
sample are SFpark meters, though some SFpark meters are not included in the sample. In addition,
MacKay sample meters refer to the 16,032 spaces covered by older MacKay meters that were not
upgraded in 2011 and did not have their time limits extended, and thus serve as a citywide control group.
The MacKay sample meters do not accept credit cards.

PARKING METER AND TIME LIMIT PRELIMINARY EVALUATION/ PAGE 7
DECEMBER 12, 2011
Figure 1: Parking meters evaluated in this report
New IPS parking meter New Duncan parking meter Older MacKay parking meter

Figure 2: All of the shown be
SFpark pilo
next-generatielow.
t areas
on meters ev
PAR
valuated in thi
KING METER
s report are lo
AND TIME LIM
ocated in the
MIT PRELIMIN
D
seven SFpar
NARY EVALUA/ PA
DECEMBER 12
rk pilot areas
ATIONAGE 8
2, 2011
,
PARKING METER AND TIME LIMIT PRELIMINARY EVALUATION/ PAGE 9
DECEMBER 12, 2011
Meter Revenue
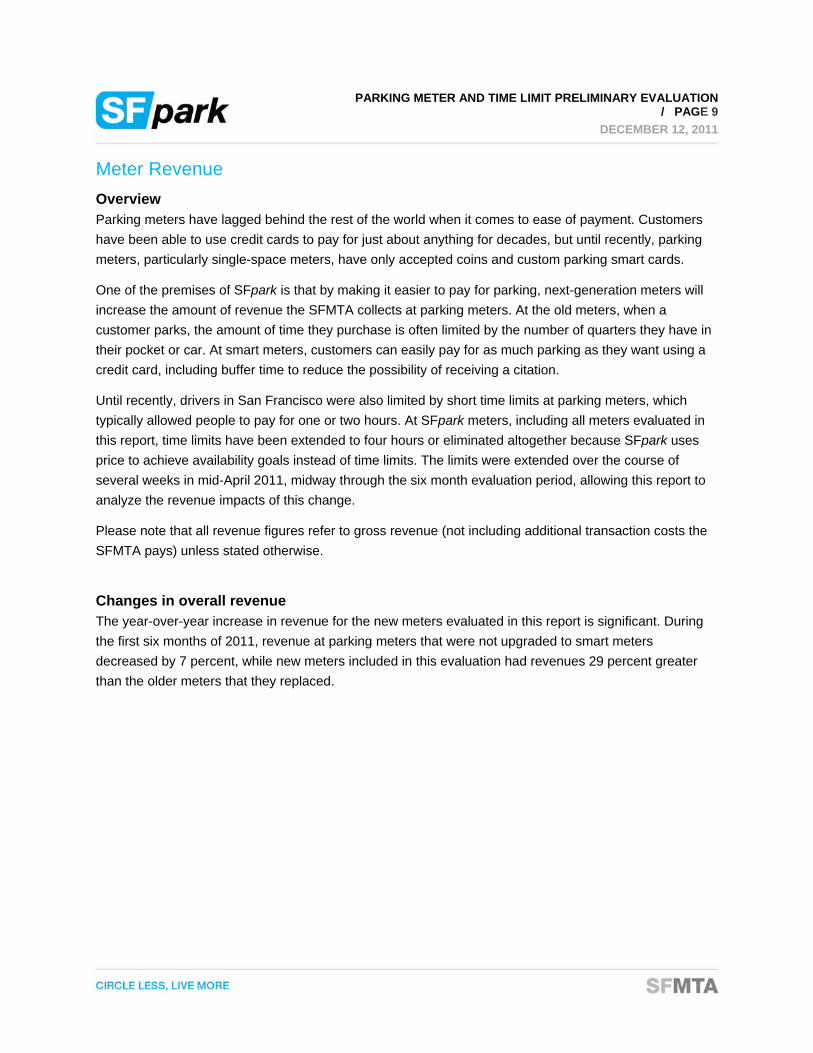
Overview Parking meters have lagged behind the rest of the world when it comes to ease of payment. Customers
have been able to use credit cards to pay for just about anything for decades, but until recently, parking
meters, particularly single-space meters, have only accepted coins and custom parking smart cards.
One of the premises of SFpark is that by making it easier to pay for parking, next-generation meters will
increase the amount of revenue the SFMTA collects at parking meters. At the old meters, when a
customer parks, the amount of time they purchase is often limited by the number of quarters they have in
their pocket or car. At smart meters, customers can easily pay for as much parking as they want using a
credit card, including buffer time to reduce the possibility of receiving a citation.
Until recently, drivers in San Francisco were also limited by short time limits at parking meters, which
typically allowed people to pay for one or two hours. At SFpark meters, including all meters evaluated in
this report, time limits have been extended to four hours or eliminated altogether because SFpark uses
price to achieve availability goals instead of time limits. The limits were extended over the course of
several weeks in mid-April 2011, midway through the six month evaluation period, allowing this report to
analyze the revenue impacts of this change.
Please note that all revenue figures refer to gross revenue (not including additional transaction costs the
SFMTA pays) unless stated otherwise.
Changes in overall revenue The year-over-year increase in revenue for the new meters evaluated in this report is significant. During
the first six months of 2011, revenue at parking meters that were not upgraded to smart meters
decreased by 7 percent, while new meters included in this evaluation had revenues 29 percent greater
than the older meters that they replaced.

PARKING METER AND TIME LIMIT PRELIMINARY EVALUATION/ PAGE 10
DECEMBER 12, 2011
Chart 2: Change in gross parking meter revenue in first six months of 2010 and 2011: Smart meter
sample and MacKay sample meters
Table 1: Average gross revenue per meter: Smart meter sample
Average Revenue Per Meter
Month 2010 2011 Change
January $133 $167 26%
February $137 $166 21%
March $167 $192 15%
April $159 $194 22%
May $152 $229 50%
June $161 $228 42%
TOTAL $909 $1,176 29%
‐30%
‐20%
‐10%
0%
10%
20%
30%
40%
50%
60%
January February March April May June
MacKaysample
Smart metersample(gross)

PARKING METER AND TIME LIMIT PRELIMINARY EVALUATION/ PAGE 11
DECEMBER 12, 2011
Chart 3: Average gross revenue per meter: Smart meter sample
On the whole, the old meters that were replaced by the next-generation meters were not unusual in their
revenue performance prior to being upgraded.
The MacKay meters that were later upgraded to smart meters averaged $152 in monthly revenue
in the first six months of 2010, compared to the MacKay meters that were not upgraded, which
averaged $131 during the period (a 16 percent difference).
In the first six months of 2011, the MacKay sample meters decreased to $123, while the smart
meter sample meters increased to $196 (59 percent higher than the MacKay sample average
during that period).
Changes in payment mode Today, about a quarter of San Francisco’s meters accept credit cards, a change from early 2010 when
customers could only pay with coins and SFMTA parking cards. The citywide average amount of credit
card revenue per month has increased steadily throughout 2011, without reducing coin or parking card
revenue in the process. Average credit card revenue nearly doubled between January and June, even as
combined parking card and coin revenue held steady.
$0
$50
$100
$150
$200
$250
January February March April May June
2010
2011

PARKING METER AND TIME LIMIT PRELIMINARY EVALUATION/ PAGE 12
DECEMBER 12, 2011
Table 2: Average revenue per meter by payment mode in 2011: Smart meter sample
Revenue
Month Credit Card
Parking Card
Coin Total
January $68 $18 $80 $167
February $70 $17 $79 $166
March $82 $20 $90 $192
April $93 $20 $81 $194
May $128 $19 $82 $229
June $129 $20 $79 $228
Chart 4: Average revenue per meter by payment mode in 2011: Smart meter sample
At the next-generation meters that accept credit cards, credit card payments have captured the majority
of payment by value:
At smart meter sample meters, credit card payments accounted for 57 percent of revenue in June
2011.
$0
$20
$40
$60
$80
$100
$120
$140
January February March April May June
Credit Card
Parking Card
Coin
PARKING METER AND TIME LIMIT PRELIMINARY EVALUATION/ PAGE 13
DECEMBER 12, 2011
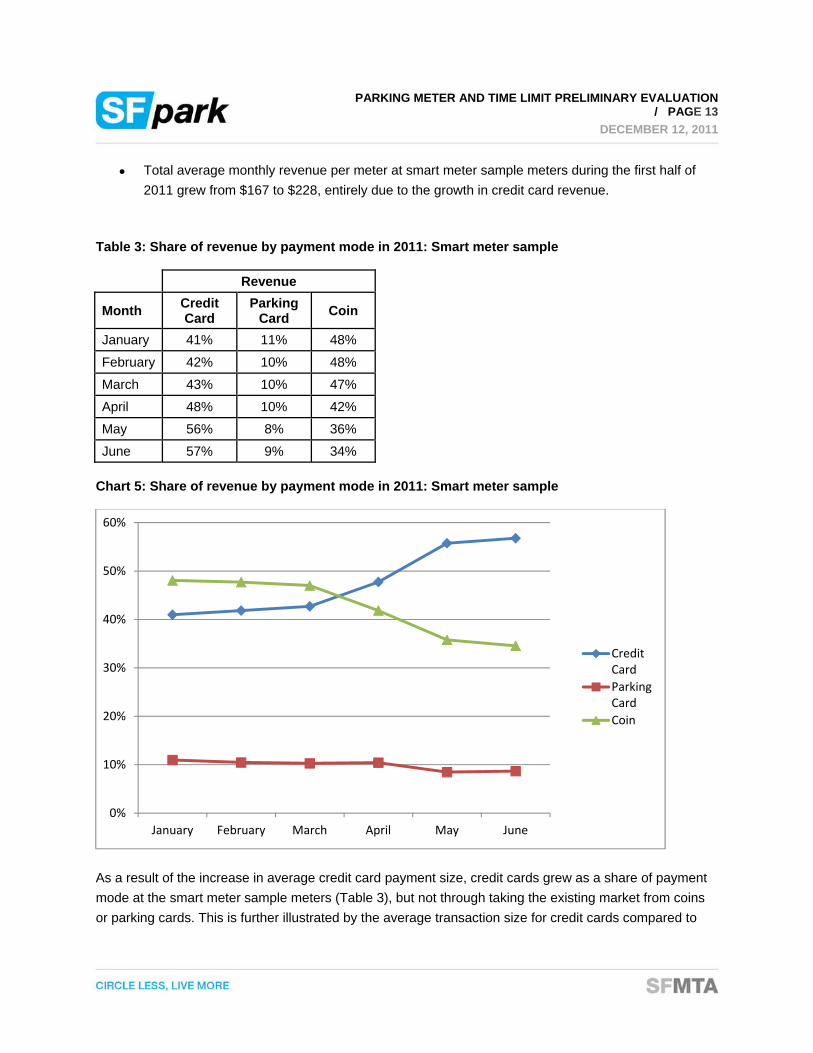
Total average monthly revenue per meter at smart meter sample meters during the first half of
2011 grew from $167 to $228, entirely due to the growth in credit card revenue.
Table 3: Share of revenue by payment mode in 2011: Smart meter sample
Revenue
Month Credit Card
Parking Card
Coin
January 41% 11% 48%
February 42% 10% 48%
March 43% 10% 47%
April 48% 10% 42%
May 56% 8% 36%
June 57% 9% 34%
Chart 5: Share of revenue by payment mode in 2011: Smart meter sample
As a result of the increase in average credit card payment size, credit cards grew as a share of payment
mode at the smart meter sample meters (Table 3), but not through taking the existing market from coins
or parking cards. This is further illustrated by the average transaction size for credit cards compared to
0%
10%
20%
30%
40%
50%
60%
January February March April May June
CreditCard
ParkingCard
Coin

PARKING METER AND TIME LIMIT PRELIMINARY EVALUATION/ PAGE 14
DECEMBER 12, 2011
parking cards and coins: while credit cards averaged $4 or more by June 2011 at smart meter sample
meters, coin transactions averaged well under $2.
The introduction of credit cards seems to have enabled customers to pay for much more parking than
they could in the past with coins: a customer can easily pay for $4 of parking with a credit card, but the
equivalent payment in cash would require 16 quarters – far more than most people have readily available.
Changes in payment by area The revenue performance of the new parking meters is notably correlated to meter rates, with revenue at
higher-rate areas increasing by larger percentages than revenue at lower-rate areas. The smart meter
sample meters are spread across seven different neighborhoods, corresponding with SFpark’s pilot
areas. These are the Civic Center, Downtown, Fisherman’s Wharf, the Marina, the Mission, and South
Embarcadero.
Table 4: Change in revenue by area in the first six months of 2010 and 2011: Smart meter sample
Area Average Hourly Rate
Year-over-year
revenue growth
Fillmore $2.00 9%
Marina $2.00 7%
Mission $2.00 7%
Civic Center $2.65 35% Fisherman's Wharf
$2.99 40%
Downtown $3.45 37% South Embarcadero
$3.48 69%

PARKING METER AND TIME LIMIT PRELIMINARY EVALUATION/ PAGE 15
DECEMBER 12, 2011
Chart 6: Change in revenue by area in the first six months of 2011 compared to 2010 (with average hourly rate in parentheses): Smart meter sample
One possible explanation for the variance in meter revenue by rate area is that at meters with higher
rates, customers are more likely to use their credit card and are therefore more able to add extra time to
avoid a ticket. Previously, customers may not have had enough coins to add their desired cushion. This
effect is especially strong with extended time limits, which allow customers to add even more cushion
time.
Effects of time limit changes In addition to installing new parking meters that make it easier to pay, the SFMTA extended the time limits
for parking at all SFpark meters. Previously, most meters allowed people to park for just one or two hours.
During the course of April 2011, time limits at all SFpark meters were either extended to four hours, or the
time limit was removed altogether.
Extending the time limits appears to be responsible for a large increase in revenue at these meters in the
months after the change:
In the first three months of 2011, prior to the extended time limits, revenue at the smart meter
sample meters included in this evaluation increased by 26 percent in January, 21 percent in
0%
10%
20%
30%
40%
50%
60%
70%
80%
Fillmore($2.00)
Marina ($2.00) Mission($2.00)
Civic Center($2.65)
Fisherman'sWharf ($2.99)
Downtown($3.45)
SouthEmbarcadero
($3.48)

PARKING METER AND TIME LIMIT PRELIMINARY EVALUATION/ PAGE 16
DECEMBER 12, 2011
February, and 15 percent in March, compared to the same months the previous year, before the
installation of smart meters (see Table 1).
In the two full months after time limits were extended, May and June, revenue at the smart meter
sample meters increased by 50 percent and 42 percent respectively compared to 2010 (see
Table 1).
While the smart meters were already greatly outperforming their predecessors before time limits
were extended, the time limit extension seems to have doubled the increase at the smart meter
sample meters.

PARKING METER AND TIME LIMIT PRELIMINARY EVALUATION/ PAGE 17
DECEMBER 12, 2011
Chart 7: Number of transactions by payment mode in 2011: Smart meter sample
Chart 8: Average transaction size by payment mode in 2011: Smart meter sample
0
100,000
200,000
300,000
400,000
500,000
600,000
700,000
800,000
January February March April May June
Coin
Parking Card
Credit Card
$0.00
$0.50
$1.00
$1.50
$2.00
$2.50
$3.00
$3.50
$4.00
$4.50
January February March April May June
Credit Card
Parking Card
Coin
Total

PARKING METER AND TIME LIMIT PRELIMINARY EVALUATION/ PAGE 18
DECEMBER 12, 2011
An analysis of the total number of transactions per month and the average transaction size reveals the
following:
The number of transactions stayed about the same at the new meters (Chart 7), but this was
coupled with a large increase in the average transaction size (Chart 8).
Credit cards payments grew faster as a share of total revenue at the new meters after the time
limit change in April (Table 3).
There are two likely explanations for the increase in transaction size:
Extended time limits, in conjunction with the ability to pay with a credit card, may have eliminated
some meter feeding. Instead of filling a meter with coins to their maximum amount every few
hours, more customers may now be simply paying for all the time they want at once.
The increase in overall parking revenue seen at the new meters after time limits were extended
may also be the result of the same phenomenon discussed in the previous section: like the ability
to pay with a credit card, extended time limits give customers more flexibility to err on the side of
caution and pay for more time than they anticipate using, as opposed to coin transactions with
shorter time limits, which restrict customers’ ability to pay for larger amounts of time. (Meters do
not zero-out when customers overpay, however, so the next person to park at a space may not
have to pay as much, since some time may remain on the meter. This would tend to reduce
transaction sizes.)
There is one more important consideration in evaluating the effect of extended time limits. When time
limits were extended in April at new meters included in this evaluation, the default payment amount for
credit cards was increased. Before April, the credit card default amount was $0.25, and customers could
increase their purchase amount in $0.25 intervals. After April, the default credit card amount was set to
two hours’ worth of parking, which varies in cost depending on the rate area. For instance, meters that
charge $2 an hour were set to a default of $4, and meters that charge $3 an hour were set to a default of
$6. Customers can still adjust the payment amount in $0.25 increments.
It is likely that the default amount affected how much time customers chose to purchase, although it is not
possible to separate out the effect of the changed default time from the effect of extended time limits,
since they were rolled-out simultaneously.

PARKING METER AND TIME LIMIT PRELIMINARY EVALUATION/ PAGE 19
DECEMBER 12, 2011
Meter Costs
Overview The new features of next-generation parking meters come with new costs. There are five primary ongoing
fees associated with the new meters that the older meters do not have: a communications services fee
(essentially a wireless data plan), a gateway fee for each credit card transaction, merchant fees and
activity charges for credit card payment processing, and a licensing fee for the meter management
system software associated with the new meters.
This section evaluates how much of the revenue growth at the new meters was offset by these new fees.
This does not include certain important factors, such as changes in maintenance cost and coin collection
cost, since there is not adequate data available yet.
Table 5: Ongoing Costs: IPS sample meters and Duncan sample meters
Fee IPS Duncan Communications services fees
$24/year per meter
$420/year per meter
MMS licensing fees
$18/year per meter
N/A (bundled with communications)
Gateway fee $0.16 per transaction
$0.06 per transaction
Merchant fees Varies Varies
Bank of America activity charges
Varies Varies
Some of these fees are fixed at a per-meter annual rate, and others are per-transaction (or a hybrid of
both) (Table 5). Because some costs are fixed, the share of total revenue that goes towards fees declines
as transaction sizes increase.
In the following charts and tables, “gross revenue” refers to the total amount of revenue collected at the
meters, and “net revenue” refers to revenue minus all of the costs described above (not including
collection costs).
None of the meters had these additional costs in the first half of 2010 (aside from collection costs), so this
report does not distinguish “gross revenue” and “net revenue” for that period. This is also the case for the
MacKay sample meters, which do not have additional costs (aside from collection).

PARKING METER AND TIME LIMIT PRELIMINARY EVALUATION/ PAGE 20
DECEMBER 12, 2011
Results
The added costs associated with the next-generation meters considered in this evaluation are less than
their additional revenue.
Table 6: Gross and net revenue during the first six months of 2010 and 2011: Duncan sample
meters and IPS sample meters
IPS Sample Meters Revenue ($1,000s)
Duncan Sample Meters Revenue ($1,000s)
Combined Smart Meter Sample Meters
Revenue ($1,000s)
Month 2010 2011
(gross) 2011 (net) 2010
2011 (gross)
2011 (net) 2010
2011 (gross)
2011 (net)
January $576 $722 $666 $24 $31 $28 $600 $753 $694 February $592 $716 $660 $26 $33 $30 $618 $750 $690 March $725 $824 $760 $30 $44 $40 $755 $867 $801 April $687 $831 $769 $31 $45 $41 $718 $876 $811 May $660 $986 $925 $27 $47 $43 $687 $1,033 $969
June $696 $986 $925 $29 $41 $38 $726 $1,028 $962 Total $3,937 $5,065 $4,705 $167 $240 $220 $4,104 $5,308 $4,925
Table 7: Percent increase in gross and net revenue during the first six months of 2011 compared
to 2010: Duncan sample meters and IPS sample meters
IPS Sample Meters Duncan Sample
Meters Combined Smart
Meter Sample
Month
2011 Gross
Increase
2011 Net
Increase
2011 Gross
Increase
2011 Net
Increase
2011 Gross
Increase
2011 Net
IncreaseJanuary 25% 16% 28% 16% 26% 16% February 21% 11% 28% 16% 21% 12% March 14% 5% 45% 33% 15% 6% April 21% 12% 47% 35% 22% 13% May 50% 40% 70% 57% 50% 41% June 42% 33% 39% 28% 42% 33% Total 29% 20% 44% 31% 29% 20%

PARKING METER AND TIME LIMIT PRELIMINARY EVALUATION/ PAGE 21
DECEMBER 12, 2011
Chart 9: Change in total parking meter revenue (gross and net) in first six months of 2010 and
2011: MacKay sample meters and smart meter sample
At the IPS meters included in this evaluation (4,282 single-space meters):
New fees were equivalent to about a third of the additional revenue the meters brought in
compared to 2010. In total, the new fees associated with the IPS sample meters added up to
$0.36 million in the first six months of 2011, while the total growth in revenue was $1.13 million
during that period (Table 6).
After fees, net revenue grew by 20 percent compared to 2010, before the smart meters were in
place.
In the two months after time limits were extended, IPS meter net revenue – total revenue minus
extra fees – grew by 36 percent.
At the Duncan meters included in this evaluation (covering 229 parking spaces):
Fees were equivalent to about 28 percent of the increase in revenue. New fees totaled $20,406
during the first six months of 2011, and the total year-over-year increase in revenue was $72,871.
After fees, net revenue grew by 31 percent.
The higher share of fees at Duncan meters may be partially due to the much smaller fleet size.
‐30%
‐20%
‐10%
0%
10%
20%
30%
40%
50%
60%
January February March April May June
MacKay sample Smart meter sample (gross) Smart Meter Sample (net)

PARKING METER AND TIME LIMIT PRELIMINARY EVALUATION/ PAGE 22
DECEMBER 12, 2011
Table 8: Net change in revenue per space in first six months of 2011 compared to first six months
of 2010: Duncan sample meters and IPS sample meters
Net increase in revenue per space
Month
IPS sample meters
Duncan sample meters
Combined smart meter
sample January $21 $17 $21
February $16 $18 $16
March $8 $44 $10
April $19 $47 $21
May $62 $68 $62
June $53 $36 $52
Total $179 $229 $182
As Table 8 illustrates, the net increase in revenue per parking space over just half a year is sizeable –
$182 for the smart meter sample meters – particularly after time limits were extended in mid-April.
These results suggest that, while credit cards come with additional fees for the SFMTA, their additional
revenue more than offset their costs. Enabling customers to pay with credit cards also enables them to
purchase more time, which ultimately covers the extra fees and increases customer convenience and
satisfaction.

PARKING METER AND TIME LIMIT PRELIMINARY EVALUATION/ PAGE 23
DECEMBER 12, 2011
Citations
Overview One of the goals of SFpark is to make paying for parking more convenient and shift the share of parking
revenue that comes from citations towards that from payment at the meter. After introducing meters that
accept credit cards and coins, as well as extending parking time limits, citation issuance has decreased
more at SFpark meters than the citywide average.
Interpreting the citation data The citation data in this analysis presents information about the number and value of parking meter-
related citations issued, not the amount actually collected, since not all citations are paid in full. As a
result, the actual share of revenue from citations is somewhat smaller than included here.
It is also important to note that citation rates increased by $2 on April 1, 2010. For example, citations that
used to be $53 increased to $55 and citations that used to be $63 increased to $65. Monthly citation
revenue data was not readily available before March 2010, so this only affects one month of data, and
has a relatively small impact compared to other factors. The multi-space sample meters are not included
in this analysis because of their very small sample size (229 parking spaces) and the difficulty of
determining citation location data for them.
Results As anticipated, parking meter-related citations decreased once SFpark meters were installed, roughly in
proportion to the net increase in revenue from payment at the meters. The net effect was a small drop in
revenue (from meter payment plus citations) compared to the previous year. This compares very
favorably, however, to meters that were not upgraded, which had a much larger decrease in total revenue
(meter payments plus citations), despite a smaller decrease in citation revenue.

PARKING METER AND TIME LIMIT PRELIMINARY EVALUATION/ PAGE 24
DECEMBER 12, 2011
Table 9: Value of citations issued in March through June of 2010 and 2011: MacKay sample meters
Citation Revenue
Month 2010 2011 Change
March $1,786,913 $1,506,085 -16%
April $1,715,800 $872,080 -49%
May $1,469,855 $1,371,485 -7%
June $1,276,680 $1,163,195 -9%
Table 10: Net revenue per meter in March through June of 2010 and 2011, including citation
revenue and regular revenue: MacKay sample meters
Citation Value Per Meter Meter Revenue
Total Revenue Per Meter (Payment and Citations)
Change in Total Revenue Per
Meter
Month
2010 Citation Revenue
2011 Citation Revenue
2010 Meter
Revenue
2011 Meter
Revenue
Total Revenue
2010
Total Revenue
2011 $ %
March $111 $94 $145 $120 $256 $214 -$42 -16%
April $107 $54 $134 $123 $241 $177 -$64 -27%
May $92 $86 $131 $130 $223 $216 -$7 -3%
June $80 $73 $133 $127 $212 $199 -$13 -6%
Total $390 $306 $543 $500 $933 $807 -$126 -14%
Table 11: Value of citations issued in March through June of 2010 and 2011: IPS sample meters
Citation Revenue
Month 2010 2011 Change
March $627,550 $448,890 -28%
April $585,495 $258,460 -56%
May $543,450 $369,450 -32%
June $446,925 $356,505 -20%

PARKING METER AND TIME LIMIT PRELIMINARY EVALUATION/ PAGE 25
DECEMBER 12, 2011
Table 12: Number of citations in the first six months of 2010 and 2011: IPS sample meters
Number of Citations
Month 2010 2011 Change
January 7,445 7,513 1%
February 9,406 7,094 -25%
March 10,840 7,411 -32%
April 9,815 4,258 -57%
May 9,088 6,068 -33%
June 7,480 5,840 -22%
Table 13: Net revenue per meter in March through June of 2010 and 2011, including citation
revenue and regular revenue: IPS sample meters
Citation Value Per Meter
Net Meter Revenue (after subtracting
costs)
Total Revenue Per Meter (payment and citations)
Change in Total Revenue Per
Meter
Month
2010 Citation Revenue
2011 Citation Revenue
2010 Meter
Revenue
2011 Meter
Revenue
Total Revenue
2010
Total Revenue
2011 $ %
March $148 $106 $169 $178 $317 $283 -$34 -11%
April $138 $61 $160 $180 $298 $240 -$58 -19%
May $128 $87 $154 $216 $282 $303 $21 7%
June $105 $84 $163 $216 $268 $300 $32 12%
Total $519 $338 $646 $789 $1,165 $1,126 -$39 -3%
Overall revenue impacts:
At the single-space SFpark meters, the average value of citations issued per meter decreased by
35 percent in early 2011 compared to the same period in 2010, before SFpark meters were
installed.
Factoring in the increased revenue from payment at the meter, net revenue was down by 3
percent at single-space SFpark meters.
Despite the small net decrease in revenue, SFpark meters outperformed parking meters that
were not upgraded, which had a smaller drop in the value of citations issued (21 percent) but also
had a significant drop in revenue from payment at the meter, leading to a net revenue decrease
of 14 percent.

PARKING METER AND TIME LIMIT PRELIMINARY EVALUATION/ PAGE 26
DECEMBER 12, 2011
Thus, while the city’s older parking meters had a net decrease of 14 percent in revenue from payment at
the meter and citations, the SFpark meters had a smaller decrease of 3 percent. Citation revenue has
been decreasing at parking meters for the past several years, but it is not being offset by increased
revenue from the meters themselves at the city’s older meters.
SFpark meters have also improved the ratio of revenue from payment at the meters versus citations:
In March through June of 2010, before SFpark meters were installed, the ratio of revenue from
payment at the meter was 55 percent at spaces that were eventually upgraded. Revenue from
citations was 45 percent.
In March through June 2011, after SFpark single-space meters were installed in those spaces,
the ratio of revenue from payment at the meter increased to 70 percent, with 30 percent of
revenue from citations.
At meters that were not upgraded, the ratio of revenue from payment at the meter was 58 percent
in March through June 2010 and increased to 62 percent in March through June 2011.
While the ratio of payment to value of citations issued improved somewhat at meters that were
not upgraded, the increase was much smaller than at SFpark meters, and was mostly due to a
decrease in citations, without a corresponding increase in revenue from payment at the meter.
Effects of extending time limits:
With only two months of data available before and after the change, respectively, it is difficult to
draw conclusions, but from the limited data available, extending time limits appears to increase
revenue from payment at the meter without decreasing citations.
As Table 11 and Table 12 illustrate, extending the time limits at SFpark meters does not seem to
have decreased citations. There is significant variability in the number and size of citations
written, but little evidence that extending time limits in late April 2011 led to a decrease in citations
in the following two months.
As a result, net revenue from citations and payment at the meter at the single-space SFpark
meters was about 10 percent higher in these two months than it was in the previous year.
While metered spaces that were upgraded to SFpark meters had a greater decrease in value of citations
issued than the city’s older meters did between 2010 and 2011 (35 percent versus 21 percent), it is
impossible to determine how much of the difference is due to the new meters, and how much is
attributable to other factors, including meter location.

PARKING METER AND TIME LIMIT PRELIMINARY EVALUATION/ PAGE 27
DECEMBER 12, 2011
Table 14: Value of citations issued by area in March-June 2010 and 2011: IPS sample meters
Total Value of Citations Issued Average Citation Value per Meter
Area (and hourly rate)
Meter Count 2010 2011
% Change 2010 2011
Area 1: Downtown ($3.50) 1,573 $699,925 $541,580 -23% $445 $344 Area 2: Downtown Periphery ($3.00) 362 $137,658 $78,170 -43% $380 $216 Area 3: Neighborhoods ($2.00) 1,848 $1,041,710 $665,645 -36% $564 $360 Area 4: Fisherman's Wharf ($3.50) 461 $323,140 $146,855 -55% $701 $319
Total 4,244 $2,202,433 $1,432,250 -35% $519 $337
Table 15: Value of citations issued by area in March-June 2010 and 2011: MacKay sample meters
Total Value of Citations Issued Average Citation
Revenue per Meter Area (and hourly rate)
Meter Count 2010 2011
% Change 2010 2011
Area 1: Downtown ($3.50) 2,185 $1,236,051 $914,680 -26% $566 $419 Area 2: Downtown Periphery ($3.00) 2,841 $973,047 $820,960 -16% $343 $289 Area 3: Neighborhoods ($2.00) 11,006 $4,040,150 $3,177,205 -21% $367 $289
Total 16,032 $6,249,248 $4,912,845 -21% $390 $306
Further examination of the citation data by area reveals some surprising results at the new meters. At
meters that were not upgraded, citation value declined relatively evenly at all rate areas (see Table 15).
Downtown meters had the largest decrease in citation value, while citations at the neighborhood main
streets declined somewhat less. The patterns at SFpark meters are notably different: high-rate meters in
Downtown actually had a smaller drop in citation value than downtown meters that were not upgraded (23
percent versus 26 percent), while neighborhood meters posted a sharper drop (36 percent) (see Table
15). The new meters downtown not only had the largest gains in payment revenue, they also had less
precipitous drops in citation value, suggesting that SFpark meters did not necessarily cause an additional
decline in citations despite bringing in additional payment revenue.
The new meters seem to have had a more direct impact on citations at Fisherman’s Wharf, which used to
have the highest value of citations issued per meter in the city. At those meters, revenue from payment at
the meter increased by 40 percent, but value of citations issued decreased by 55 percent. The
introduction of the new meters seems to have aided visitors in complying with the rules, ultimately

PARKING METER AND TIME LIMIT PRELIMINARY EVALUATION/ PAGE 28
DECEMBER 12, 2011
generating roughly the same net revenue as the previous year. It is likely that by making it easier for
visitors to pay for parking, the SFMTA has made it much easier for visitors to avoid parking tickets, and
thus improve their overall experience in San Francisco.
Many other types of parking-related citations across the city have decreased in the past several years, for
reasons that are not fully known, in some cases by even larger percentages than the drop at SFpark
meters. Clearly, additional undetermined factors are involved. This warrants further examination in the
future. The SFMTA Enforcement Division reports that enforcement levels and deployment patterns were
roughly the same between 2010 and 2011, so changes in enforcement patterns do not appear to be a
significant factor in this citywide drop in citations.

PARKING METER AND TIME LIMIT PRELIMINARY EVALUATION/ PAGE 29
DECEMBER 12, 2011
Occupancy
Overview The SFMTA began collecting occupancy data at metered parking spaces in SFpark pilot areas in early
2011, using electronic sensors installed in the pavement. Occupancy data is not available for 2010, so it
is not possible to compare occupancy at the new meters to the previous year, before the new meters
were installed. However, this data can be used to analyze the impacts of extending time limits at SFpark
meters during April 2011. There are also two neighborhoods that have parking sensors but still have older
meters: the Inner Richmond and West Portal. Time limits were not extended at these meters, so they
serve as an occupancy data control group to the SFpark meters.
The “before” period includes weekdays from February 10, 2011 to March 31, 2011. The “after” period
includes weekdays from May 1, 2011 to June 30, 2011.
This evaluation is preliminary and does not take into account other factors, such as possible seasonal
variations in parking demand, which later analysis will evaluate.
Results Preliminary occupancy data reveals that:
Overall occupancy at single-space parking meters that accept credit cards increased by about 5
percent after time limits were extended, while overall occupancy increased by less than 1 percent
at West Portal and Inner Richmond meters, where time limits were not extended.
After time limits were extended, a larger share of parking sessions lasted more than an hour. At
meters that switched to no time limits and meters that switched to four-hour time limits, the
average share of parking sessions of more than four hours increased by about the same amount.
The increase in parking occupancy after time limits were extended at single-space next-
generation meters (5 percent) was much smaller than increase in gross revenue, which was
about 25 percent (in addition to the increase in revenue that accompanied the installation of
meters that accept credit cards).
Table 20: Change in share of parking sessions by length of stay before and after time limit
change: IPS sample meters and control meters
Average Length of Stay
Singe-space meters: 4 hours
Singe-space meters: No limit
Control Meters
<1 hour -3.7% -1.9% -1.7% 1-2 hours 1.2% 0.1% 0.7% 2-4 hours 1.3% 0.4% 0.5% 4-8 hours 0.6% 0.8% 0.2% 8+ hours 0.5% 0.5% 0.2%

PARKING METER AND TIME LIMIT PRELIMINARY EVALUATION/ PAGE 30
DECEMBER 12, 2011
Table 21: Average occupancy before and after time limit change
New Time Limit Before After
4 hours 61% 66%
No Limit 59% 64%
Control (No change) 70% 71%
These results suggest that extended time limits may have increased overall occupancy and parking
session lengths slightly.