
Park Road 22 Access Management Study Corpus Christi, · PDF fileskysail ketch cobo de bara...
26
Park Road 22 Access Management Study Corpus Christi, Texas Prepared for: Corpus Christi Metropolitan Planning Organization Prepared by: HDR Engineering, Inc. Texas P.E. Registration No. F-754 May 13, 2011 This report was funded in part through grant[s] from the Federal Highway Administration [and Federal Transit Administration], U.S. Department of Transportation. The views and opinions of the authors [or agency] expressed herein do not necessarily state or reflect those of the U. S. Department of Transportation.
Transcript of Park Road 22 Access Management Study Corpus Christi, · PDF fileskysail ketch cobo de bara...

Park Road 22 Access Management Study Corpus Christi, Texas
Prepared for:
Corpus Christi Metropolitan Planning Organization
Prepared by:
HDR Engineering, Inc. Texas P.E. Registration No. F-754
May 13, 2011
This report was funded in part through grant[s] from the Federal Highway Administration [and Federal Transit Administration], U.S. Department of Transportation. The views and opinions of the authors [or agency] expressed herein do not necessarily state or reflect
those of the U. S. Department of Transportation.

Corpus Christi Metropolitan Planning Organization
Park Road 22 Access Management Study Chapter 1 – Introduction
1-1
CHAPTER 1 – INTRODUCTION
HDR was retained by the Corpus Christi Metropolitan Planning Organization (CCMPO) to
identify potential improvements for the intersections along the Park Road (PR) 22 corridor. This
report documents the study methodology and evaluation of existing (2010) and future year
(2035) traffic operations along the PR 22 corridor between Aquarius St and Whitecap
Boulevard. This chapter describes the study background and purpose. Chapter 2 describes the
VISSIM model coding methodology. Chapters 3, 4, and 5 identify existing traffic conditions and
present analysis results, describe the anticipated future conditions based on network changes
and expected traffic patterns, and evaluate alternative improvement scenarios for the corridor.
1.1 STUDY BACKGROUND
The PR 22 corridor between Aquarius Street and Whitecap Boulevard is located in the Mustang-
Padre Island area in the easternmost part of the City of Corpus Christi, offshore from the
mainland.
The PR 22 corridor between Aquarius Street and Whitecap Boulevard experiences significant
tourist traffic in the summer season, spring break and holidays. In particular, the intersections
of SH 361 and Whitecap Boulevard experience high delay and queues during these times. The
City is planning for significant future traffic growth on the island due to future developments
and population growth in the area. The 2004 Mustang-Padre Island Area Development Plan
shows high population and development growth on the island over the next 25 years. With the
projected development, the current traffic conditions would deteriorate in the future if the
appropriate steps are not taken to accommodate the additional growth. HDR has proposed
intersection and signal timing improvements at the intersections along the corridor to improve
traffic flow and reduce delay in the future year of 2035.
1.2 STUDY PURPOSE
The purpose of this study is to develop a comprehensive traffic simulation model using the
microscopic computer simulation software, VISSIM, for the PR 22 Corridor. The models were
developed to evaluate 2010 existing conditions along the corridor and analyze alternatives
including the implementation of innovative signal timing and intersection designs at the
intersections. The results of this study will be used as a results-oriented planning tool for the
CCMPO and the City of Corpus Christi to make planning decisions regarding this corridor.
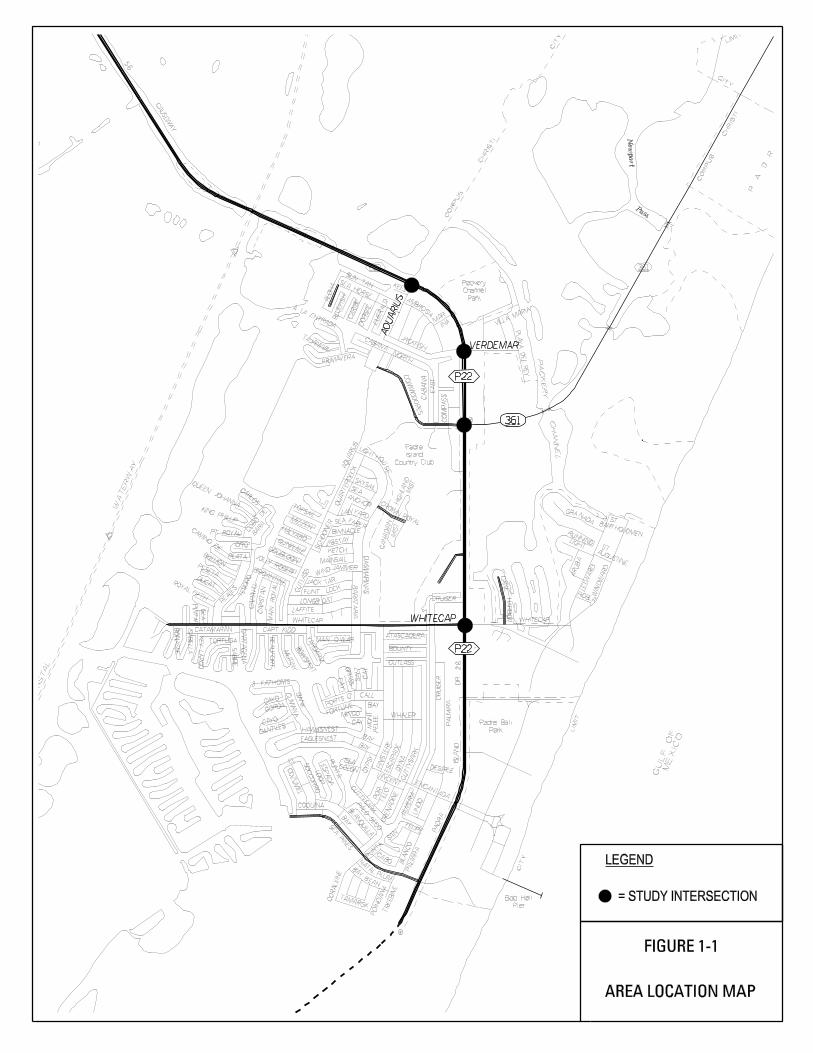
1.3 STUDY AREA
The overall project study area is along PR 22 between Aquarius Street and Whitecap Boulevard
as shown in Figure 1.
2.8
Padre
Island
Country Club
Bob Hall
Pier
KEEL
INAM
AR-
CARLO
S
TE
SO
RO
BULLION
DUCAT
CA
RT
AG
EN
A
YA
RD
AR
M
BO
WSPR
IT
MU
TIN
Y
BE
AU
FO
RT
TORTUGA
ISA
BE
LL
A
BO
NA
SS
E
CAYO
GORDA
CAYO
CANTILES
CO
ZU
ME
L
CU
TTY
SARK
ES
PA
DA
LO
OP
PU
NT
A
ISLACOLON G
YP
SY
FIN
IST
ER
EE
SC
AP
AD
ED
YN
AC
UT
TY
SA
RK
AL
ME
RIA
PA
LO
SEC
O
BLA
NQ
UILLA
SEA
PIN
ES
CIT
Y
LIM
IT
M
E
X
ROBLA
AR
UB
A
CA
NE
HA
RB
OR
WHITECAP
STBARTHOLOMEN
PA
CK
ER
Y
CH
AN
NE
L
CABANANORTH
TAJAMAR
CA
BA
NA
EA
ST
CA
NA
DIA
NM
IST
MIS
T
HIG
HL
AN
D
LIGHT
SKYSAIL
KETCH
CO
BO
DE
BA
RA
DA
SM
AR
INA
S
QUEEN JOHANNAKING PHILLIP
PLATA
CAM
INO
DE
PESETA
REA
LES
ROYAL FIFTH
ISL
A
PIN
TA
CATAMARAN
KE
Y L
AR
GO
SA
BR
E
3
CRUISER
PA
LM
IRA
SO
CC
OR
RO
EL
COQUINA
BA
Y
VINCENT
PO
R-
TIL
LO
GR
EN
AD
INE
LIN
DO
PA
LM
IRA
BL
AN
CO
SAN
FELIPE
PUN
TA
CO
RA
LV
INE
TAMARISK
PO
INC
IAN
AT
RE
EB
INE
A LA ENTRADA
BA
RA
TA
RIA
AQ
UA
RIU
S
QU
AR
TE
RD
EC
K
SC
HO
ON
ER
CU
TL
AS
S
DOUBLOONJOLLY ROGERBRIGANTINE
CA
RA
VE
LC
AP
ST
AN
MA
IN R
OY
AL
LAFFITE
FLINT LOCK
JACK TAR
MAINSAIL
TOPSAILMIZZENHALYARD
GUNWALE
BINNACLE
SEA FARER
LAN YARD
ATASCADERA
BOUNTY
CUTLASS
CALL
MINGO
CAY
GR
AS
S
CA
Y
MO
NT
PE
LE
E
HAWKSNEST
EAGLESNESTBAY
BAY
BA
NK
CU
MA
NA
WIN
DW
AR
D
LE
EW
AR
D
ENCANTADA
CR
UIS
ER
DESIREE
SUN TANSEA HORSE
AL
OH
AB
LU
EF
ISH
CA
RIB
ED
OR
SA
L
EM
ER
AL
DA
QU
AR
IUS
CO
MP
AS
S
CO
MM
OD
OR
ES
PL
AY
A D
EL
RE
Y
PRIMAVERA
FATHOM’S
WHITECAP
PORTS O’
IN
TR
AC
OA
ST
AL
WA
TE
RW
AY
PA
DR
E
CIT
Y
CH
RIS
TI
CO
RPU
S
CH
RIST
I
CIT
Y
LIMIT
CO
RPU
S
New
port
Pass
Packery
Channel
Park
VILLA MARIA
CA
USE
WA
Y
5.6
P22
361P22
361
Padre Bali
Park
P22
GRA NADA
ST AUGUSTINE
RUNNINGLIGHT
AMBROSIA
SEA ANCHOR CROW
N ROYAL
JIBSTAY
JAMMERWIND
VERDEMAR
JACKFISH
HOU
SE
PT ROYAL
ORO
CAPT KIDD
SA
LT
CA
Y
BAY
FORTUNE
WHALER
BA
YB
EAN
CABON
AT
ALPLUM
MAN O’ WAR
LONGB OAT
PA
DR
A
ISL
AN
DD
R
D
LEGEND
= STUDY INTERSECTION
GU
LF
OF
ME
XIC
O
WHITECAP
361
VERDEMAR
FIGURE 1-1
AREA LOCATION MAP

Corpus Christi Metropolitan Planning Organization Park Road 22 Access Management Study Chapter 2 – VISSIM Coding Methodology
2-1
CHAPTER 2 – VISSIM MODEL CODING METHODOLOGY
2.1 COMPUTER SIMULATION The study area was simulated using the microscopic simulation model VISSIM Version 5.10-06. VISSIM has main two components: a traffic simulator and a signal state generator. The traffic simulator is a microscopic traffic flow simulation model which includes car following and lane change logic. The signal state generator is signal control software that uses detector information from the traffic simulator and updates the status of the traffic signals on a discrete time step basis. VISSIM is classified as a microscopic simulation model because it models vehicles and other components as individual units and updating them every tenth of a second. After defining the street geometry, traffic control and vehicular volumes, VISSIM outputs several measures of effectiveness (MOEs) such as average delay, queue length, speed, emission statistics, etc. that can then be used as a basis for comparison of alternatives. VISSIM also has a user friendly 3D animation tool which can be used to show the existing and future transportation network in 3D animation form. This chapter discusses the modeling approach and the methodology for modifying VISSIM model parameters to account for roadway network changes in the study area. The study methodology complied with the principles contained in the Federal Highway Administration’s “Traffic Analysis Toolbox III: Guidelines for Applying Traffic Microsimulation Software”, (Ref. 1) and Highway Capacity Manual, (Ref. 2). 2.2 ANALYSIS METHODOLOGY 2.2.1 Computer Simulation
One of the most important analytical tools of traffic engineering is microsimulation software. A transportation system simulation by means of a simulation model allows the prediction of the effects of modified lane configurations, traffic control and any changes made in a transportation system on the system’s operational performance. Operational performance is measured in terms of MOEs, which include average vehicle speed, vehicle stops, delays, vehicle hours of travel, vehicle miles of travel, fuel consumption, and several other measures. The MOEs provide useful input in the selection of future alternative improvements to handle issues related to traffic such as traffic congestion, delay, queues, etc. VISSIM is capable of simulating individual vehicle behavior in a roadway network and is capable of simulating the operation of signalized intersections. VISSIM applies interval-based simulation to describe traffic operations. Each vehicle is a distinct object whose characteristics are updated every tenth of a second. Each variable control device (such as traffic signals) and each event are registered and updated every tenth of a second. In addition, each vehicle is identified by category (auto, carpool, truck, or bus) and by type. Additionally, specific driver

Corpus Christi Metropolitan Planning Organization Park Road 22 Access Management Study Chapter 2 – VISSIM Coding Methodology
2-2
behavioral characteristics are assigned to specific vehicles and the roadways such as freeway and arterial street. The major features of the VISSIM model are identified as follows:
Link types and connectors
Fleet components (bus, truck, car)
Load factor (number of passengers/vehicle)
Automobile routing and turning movement
Priority rules (right of way designations)
Stop and yield signs
Pretimed/actuated signal control 2.2.2 Model Parameters
The traffic flow model used by VISSIM is a discreet, stochastic, time step based microscopic model, with driver-vehicle-units (DVU) as single entities. The model contains a psycho-physical car following model for longitudinal vehicle movement and a rule-based algorithm for lateral movements (lane changing). The model is based on the continuous work of Wiedemann (1974, 1991). Vehicles follow each other in an oscillating process. As a faster vehicle approaches a slower vehicle on a single lane, it has to decelerate. The action point of conscious reaction depends on the speed difference, distance, and driver-dependant behavior. On multi-lane links, faster moving vehicles check whether they can improve their position by changing lanes. If so, they check the possibility of finding acceptable gaps on neighboring lanes. Car following and lane changing together form the traffic flow model, comprising the basis of VISSIM. Numerous default and user input parameters are used by the VISSIM model but are too detailed to include in this report. More detailed information regarding these parameters can be found in the VISSIM user’s manual. 2.2.3 Model Development
Field observations and aerial photographs were used to obtain accurate geometrics. Year 2010 traffic volume counts collected in the field during November of 2010 were used for developing the existing condition models. The major component inputs for the PR 22 corridor VISSIM models include the following:
Roadway Geometrics – The first step in defining a network is describing the network geometry. VISSIM uses the concept of links and connectors to define the roadway network. Links are one-directional segments of streets or freeways, and connectors are usually the intersection of two or more links. In the case of a two-way street, each roadway block would consist of two one-directional links as shown in Figure 2-1.

Corpus Christi Metropolitan Planning Organization Park Road 22 Access Management Study Chapter 2 – VISSIM Coding Methodology
2-3
Volume Data – For the VISSIM analysis, the balanced origin-destination trip tables were prepared based on 2010 traffic volume counts collected in the field and the forecasted traffic information provided by the Corpus Christi MPO. Entry and exit volumes at the periphery of the network were obtained from intersection TMCs, since entry volumes are coded as input when building the model, and exit volumes are used to calibrate the model to ensure appropriate distribution of traffic through the simulated network.
Traffic Control – Existing conditions analysis involved coding of traffic signal phasing, timing, and coordination in Synchro, a microcomputer traffic signal coordination software program developed by Trafficware. This traffic signal information was then imported into the VISSIM model to simulate the operation of existing signalized intersections. Signal timings were optimized using Synchro in the future No-Build and Build scenarios.

Corpus Christi Metropolitan Planning Organization Park Road 22 Access Management Study Chapter 2 – VISSIM Coding Methodology
2-4
FIGURE 2-1 INTERSECTION LINK TO CONNECTOR DIAGRAM
(A) Typical VISSIM Intersection
(B) Typical Intersection Converted to VISSIM Link-Connector Diagram
Corpus Christi Metropolitan Planning Organization Park Road 22 Access Management Study Chapter 2 – VISSIM Coding Methodology
2-5
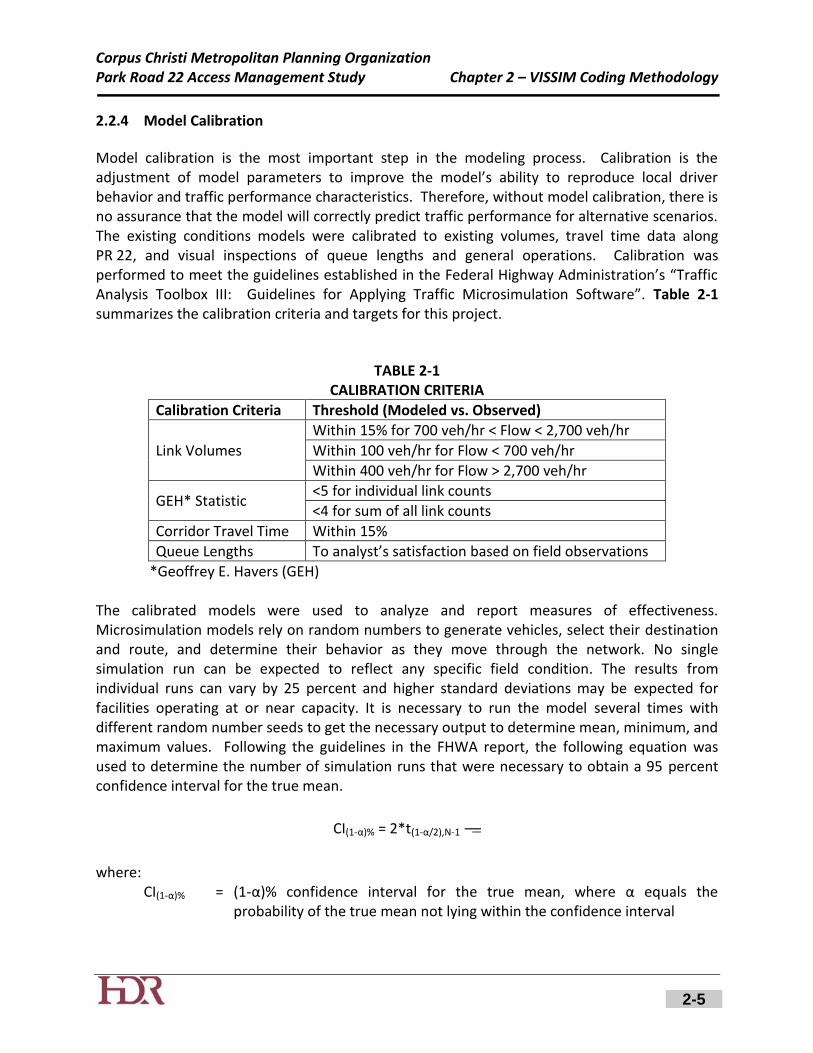
2.2.4 Model Calibration
Model calibration is the most important step in the modeling process. Calibration is the adjustment of model parameters to improve the model’s ability to reproduce local driver behavior and traffic performance characteristics. Therefore, without model calibration, there is no assurance that the model will correctly predict traffic performance for alternative scenarios. The existing conditions models were calibrated to existing volumes, travel time data along PR 22, and visual inspections of queue lengths and general operations. Calibration was performed to meet the guidelines established in the Federal Highway Administration’s “Traffic Analysis Toolbox III: Guidelines for Applying Traffic Microsimulation Software”. Table 2-1 summarizes the calibration criteria and targets for this project.
TABLE 2-1
CALIBRATION CRITERIA
Calibration Criteria Threshold (Modeled vs. Observed)
Link Volumes
Within 15% for 700 veh/hr < Flow < 2,700 veh/hr
Within 100 veh/hr for Flow < 700 veh/hr
Within 400 veh/hr for Flow > 2,700 veh/hr
GEH* Statistic <5 for individual link counts
<4 for sum of all link counts
Corridor Travel Time Within 15%
Queue Lengths To analyst’s satisfaction based on field observations
*Geoffrey E. Havers (GEH) The calibrated models were used to analyze and report measures of effectiveness. Microsimulation models rely on random numbers to generate vehicles, select their destination and route, and determine their behavior as they move through the network. No single simulation run can be expected to reflect any specific field condition. The results from individual runs can vary by 25 percent and higher standard deviations may be expected for facilities operating at or near capacity. It is necessary to run the model several times with different random number seeds to get the necessary output to determine mean, minimum, and maximum values. Following the guidelines in the FHWA report, the following equation was used to determine the number of simulation runs that were necessary to obtain a 95 percent confidence interval for the true mean.
CI(1-α)% = 2*t(1-α/2),N-1
where: CI(1-α)% = (1-α)% confidence interval for the true mean, where α equals the
probability of the true mean not lying within the confidence interval
Corpus Christi Metropolitan Planning Organization Park Road 22 Access Management Study Chapter 2 – VISSIM Coding Methodology
2-6
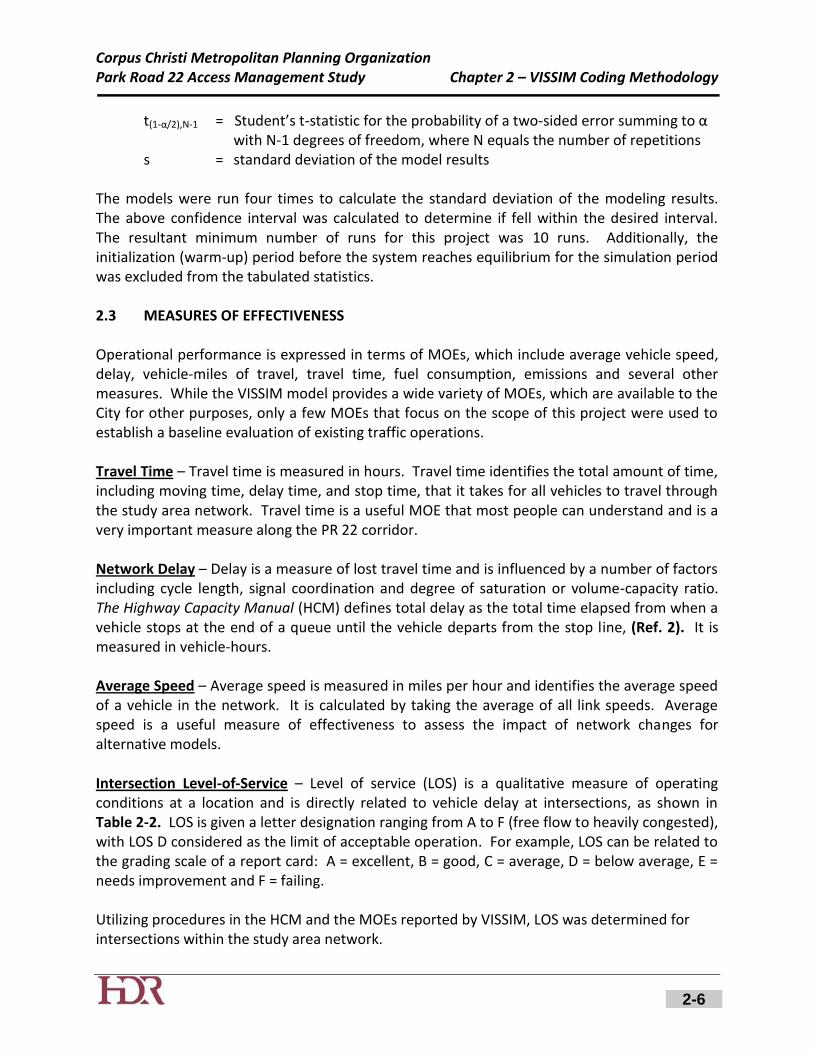
t(1-α/2),N-1 = Student’s t-statistic for the probability of a two-sided error summing to α with N-1 degrees of freedom, where N equals the number of repetitions
s = standard deviation of the model results The models were run four times to calculate the standard deviation of the modeling results. The above confidence interval was calculated to determine if fell within the desired interval. The resultant minimum number of runs for this project was 10 runs. Additionally, the initialization (warm-up) period before the system reaches equilibrium for the simulation period was excluded from the tabulated statistics. 2.3 MEASURES OF EFFECTIVENESS Operational performance is expressed in terms of MOEs, which include average vehicle speed, delay, vehicle-miles of travel, travel time, fuel consumption, emissions and several other measures. While the VISSIM model provides a wide variety of MOEs, which are available to the City for other purposes, only a few MOEs that focus on the scope of this project were used to establish a baseline evaluation of existing traffic operations. Travel Time – Travel time is measured in hours. Travel time identifies the total amount of time, including moving time, delay time, and stop time, that it takes for all vehicles to travel through the study area network. Travel time is a useful MOE that most people can understand and is a very important measure along the PR 22 corridor. Network Delay – Delay is a measure of lost travel time and is influenced by a number of factors including cycle length, signal coordination and degree of saturation or volume-capacity ratio. The Highway Capacity Manual (HCM) defines total delay as the total time elapsed from when a vehicle stops at the end of a queue until the vehicle departs from the stop line, (Ref. 2). It is measured in vehicle-hours. Average Speed – Average speed is measured in miles per hour and identifies the average speed of a vehicle in the network. It is calculated by taking the average of all link speeds. Average speed is a useful measure of effectiveness to assess the impact of network changes for alternative models. Intersection Level-of-Service – Level of service (LOS) is a qualitative measure of operating conditions at a location and is directly related to vehicle delay at intersections, as shown in Table 2-2. LOS is given a letter designation ranging from A to F (free flow to heavily congested), with LOS D considered as the limit of acceptable operation. For example, LOS can be related to the grading scale of a report card: A = excellent, B = good, C = average, D = below average, E = needs improvement and F = failing. Utilizing procedures in the HCM and the MOEs reported by VISSIM, LOS was determined for intersections within the study area network.

Corpus Christi Metropolitan Planning Organization Park Road 22 Access Management Study Chapter 2 – VISSIM Coding Methodology
2-7
TABLE 2-2 LEVEL OF SERVICE DEFINITIONS FOR INTERSECTIONS
Level-of-Service (LOS)
Control Delay (sec/veh)
Description Signalized
Intersections Unsignalized Intersections
A 10.0 10.0
Very low vehicle delays, free traffic flow, signal progression extremely favorable, most vehicles arrive during given signal phase.
B 10.1 to 20.0 10.1 to 15.0 Good signal progression, more vehicles stop and experience higher delays than for LOS A.
C 20.1 to 35.0 15.1 to 25.0 Stable traffic flow, fair signal progression, significant number of vehicles stop at signals.
D 35.1 to 55.0 25.1 to 35.0
Noticeable traffic congestion, longer delays and unfavorable signal progression, many vehicles stop at signals.
E 55.1 to 80.0 35.1 to 50.0
Limit of acceptable vehicle delay, unstable traffic flow, poor signal progression, traffic near roadway capacity, frequent cycle failures.
F > 80.0 > 50.0
Unacceptable delay, extremely unstable flow, heavy congestion, traffic exceeds roadway capacity, stop-and-go conditions.
Source: Highway Capacity Manual, Transportation Research Board, 2000.
Corpus Christi Metropolitan Planning Organization Park Road 22 Access Management Study Chapter 3 – Existing Conditions
3-1
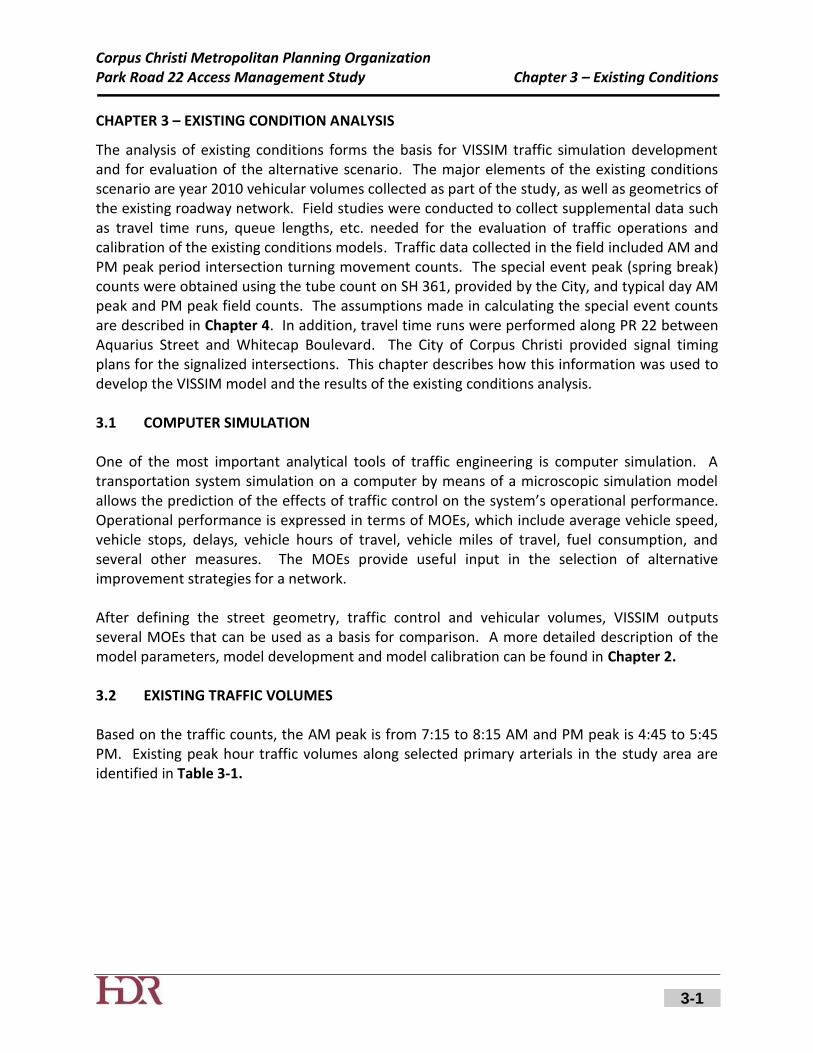
CHAPTER 3 – EXISTING CONDITION ANALYSIS
The analysis of existing conditions forms the basis for VISSIM traffic simulation development and for evaluation of the alternative scenario. The major elements of the existing conditions scenario are year 2010 vehicular volumes collected as part of the study, as well as geometrics of the existing roadway network. Field studies were conducted to collect supplemental data such as travel time runs, queue lengths, etc. needed for the evaluation of traffic operations and calibration of the existing conditions models. Traffic data collected in the field included AM and PM peak period intersection turning movement counts. The special event peak (spring break) counts were obtained using the tube count on SH 361, provided by the City, and typical day AM peak and PM peak field counts. The assumptions made in calculating the special event counts are described in Chapter 4. In addition, travel time runs were performed along PR 22 between Aquarius Street and Whitecap Boulevard. The City of Corpus Christi provided signal timing plans for the signalized intersections. This chapter describes how this information was used to develop the VISSIM model and the results of the existing conditions analysis. 3.1 COMPUTER SIMULATION One of the most important analytical tools of traffic engineering is computer simulation. A transportation system simulation on a computer by means of a microscopic simulation model allows the prediction of the effects of traffic control on the system’s operational performance. Operational performance is expressed in terms of MOEs, which include average vehicle speed, vehicle stops, delays, vehicle hours of travel, vehicle miles of travel, fuel consumption, and several other measures. The MOEs provide useful input in the selection of alternative improvement strategies for a network. After defining the street geometry, traffic control and vehicular volumes, VISSIM outputs several MOEs that can be used as a basis for comparison. A more detailed description of the model parameters, model development and model calibration can be found in Chapter 2. 3.2 EXISTING TRAFFIC VOLUMES Based on the traffic counts, the AM peak is from 7:15 to 8:15 AM and PM peak is 4:45 to 5:45 PM. Existing peak hour traffic volumes along selected primary arterials in the study area are identified in Table 3-1.
Corpus Christi Metropolitan Planning Organization Park Road 22 Access Management Study Chapter 3 – Existing Conditions
3-2
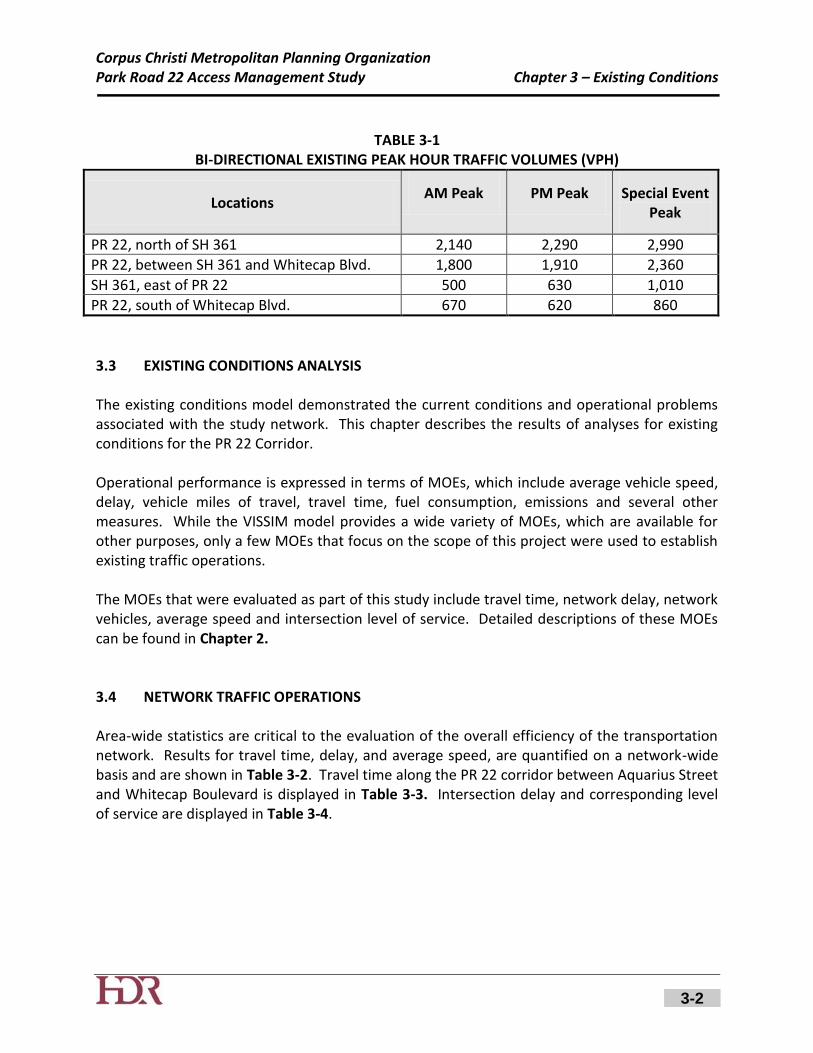
TABLE 3-1
BI-DIRECTIONAL EXISTING PEAK HOUR TRAFFIC VOLUMES (VPH)
Locations AM Peak PM Peak Special Event
Peak
PR 22, north of SH 361 2,140 2,290 2,990
PR 22, between SH 361 and Whitecap Blvd. 1,800 1,910 2,360
SH 361, east of PR 22 500 630 1,010
PR 22, south of Whitecap Blvd. 670 620 860
3.3 EXISTING CONDITIONS ANALYSIS The existing conditions model demonstrated the current conditions and operational problems associated with the study network. This chapter describes the results of analyses for existing conditions for the PR 22 Corridor. Operational performance is expressed in terms of MOEs, which include average vehicle speed, delay, vehicle miles of travel, travel time, fuel consumption, emissions and several other measures. While the VISSIM model provides a wide variety of MOEs, which are available for other purposes, only a few MOEs that focus on the scope of this project were used to establish existing traffic operations. The MOEs that were evaluated as part of this study include travel time, network delay, network vehicles, average speed and intersection level of service. Detailed descriptions of these MOEs can be found in Chapter 2. 3.4 NETWORK TRAFFIC OPERATIONS Area-wide statistics are critical to the evaluation of the overall efficiency of the transportation network. Results for travel time, delay, and average speed, are quantified on a network-wide basis and are shown in Table 3-2. Travel time along the PR 22 corridor between Aquarius Street and Whitecap Boulevard is displayed in Table 3-3. Intersection delay and corresponding level of service are displayed in Table 3-4.
Corpus Christi Metropolitan Planning Organization Park Road 22 Access Management Study Chapter 3 – Existing Conditions
3-3
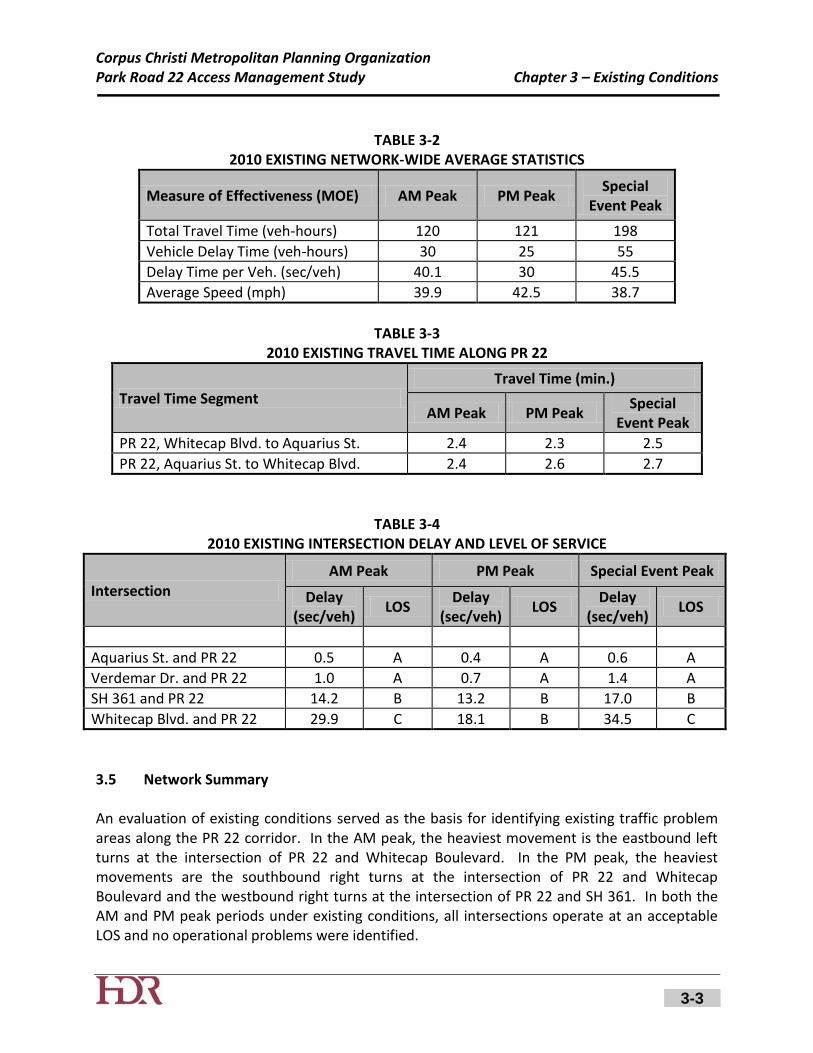
TABLE 3-2
2010 EXISTING NETWORK-WIDE AVERAGE STATISTICS
Measure of Effectiveness (MOE) AM Peak PM Peak Special
Event Peak
Total Travel Time (veh-hours) 120 121 198
Vehicle Delay Time (veh-hours) 30 25 55
Delay Time per Veh. (sec/veh) 40.1 30 45.5
Average Speed (mph) 39.9 42.5 38.7
TABLE 3-3
2010 EXISTING TRAVEL TIME ALONG PR 22
Travel Time Segment Travel Time (min.)
AM Peak PM Peak Special
Event Peak
PR 22, Whitecap Blvd. to Aquarius St. 2.4 2.3 2.5
PR 22, Aquarius St. to Whitecap Blvd. 2.4 2.6 2.7
TABLE 3-4 2010 EXISTING INTERSECTION DELAY AND LEVEL OF SERVICE
Intersection AM Peak PM Peak Special Event Peak
Delay (sec/veh)
LOS Delay
(sec/veh) LOS
Delay (sec/veh)
LOS
Aquarius St. and PR 22 0.5 A 0.4 A 0.6 A
Verdemar Dr. and PR 22 1.0 A 0.7 A 1.4 A
SH 361 and PR 22 14.2 B 13.2 B 17.0 B
Whitecap Blvd. and PR 22 29.9 C 18.1 B 34.5 C
3.5 Network Summary An evaluation of existing conditions served as the basis for identifying existing traffic problem areas along the PR 22 corridor. In the AM peak, the heaviest movement is the eastbound left turns at the intersection of PR 22 and Whitecap Boulevard. In the PM peak, the heaviest movements are the southbound right turns at the intersection of PR 22 and Whitecap Boulevard and the westbound right turns at the intersection of PR 22 and SH 361. In both the AM and PM peak periods under existing conditions, all intersections operate at an acceptable LOS and no operational problems were identified.

Corpus Christi Metropolitan Planning Organization Park Road 22 Access Management Study Chapter 3 – Existing Conditions
3-4
Based on the existing traffic model MOEs, the special event peak experiences the most queuing and delay. The heaviest movements during the special event peak are the eastbound left turn and southbound right turn at the intersection of PR 22 and Whitecap Boulevard and the westbound right turn at the intersection of PR 22 and SH 361. While delay and queuing are greater in the special event peak compared to the weekday AM and PM peak periods, all intersections operate at an acceptable LOS.
Corpus Christi Metropolitan Planning Organization Park Road 22 Access Management Study Chapter 4 – No-Build Condition Analysis
4-1
CHAPTER 4 – 2035 NO-BUILD CONDITION ANALYSIS
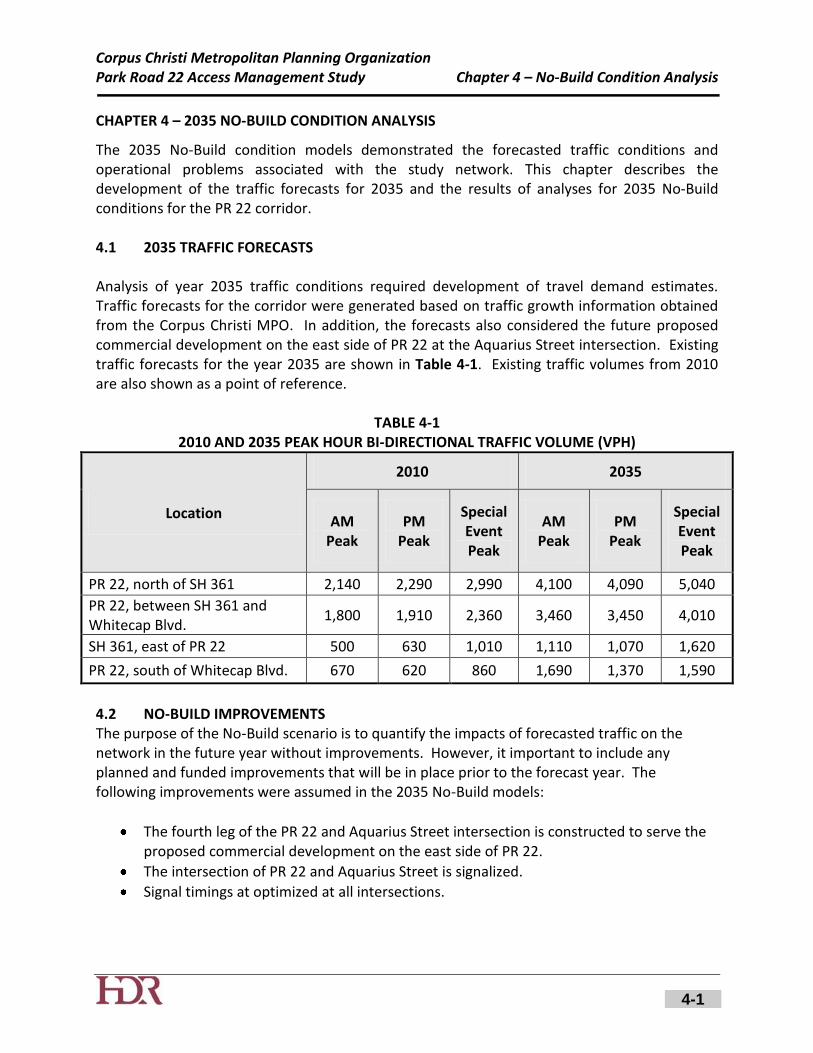
The 2035 No-Build condition models demonstrated the forecasted traffic conditions and operational problems associated with the study network. This chapter describes the development of the traffic forecasts for 2035 and the results of analyses for 2035 No-Build conditions for the PR 22 corridor. 4.1 2035 TRAFFIC FORECASTS Analysis of year 2035 traffic conditions required development of travel demand estimates. Traffic forecasts for the corridor were generated based on traffic growth information obtained from the Corpus Christi MPO. In addition, the forecasts also considered the future proposed commercial development on the east side of PR 22 at the Aquarius Street intersection. Existing traffic forecasts for the year 2035 are shown in Table 4-1. Existing traffic volumes from 2010 are also shown as a point of reference.
TABLE 4-1
2010 AND 2035 PEAK HOUR BI-DIRECTIONAL TRAFFIC VOLUME (VPH)
Location
2010 2035
AM Peak
PM Peak
Special Event Peak
AM Peak
PM Peak
Special Event Peak
PR 22, north of SH 361 2,140 2,290 2,990 4,100 4,090 5,040
PR 22, between SH 361 and Whitecap Blvd.
1,800 1,910 2,360 3,460 3,450 4,010
SH 361, east of PR 22 500 630 1,010 1,110 1,070 1,620
PR 22, south of Whitecap Blvd. 670 620 860 1,690 1,370 1,590
4.2 NO-BUILD IMPROVEMENTS The purpose of the No-Build scenario is to quantify the impacts of forecasted traffic on the network in the future year without improvements. However, it important to include any planned and funded improvements that will be in place prior to the forecast year. The following improvements were assumed in the 2035 No-Build models:
The fourth leg of the PR 22 and Aquarius Street intersection is constructed to serve the proposed commercial development on the east side of PR 22.
The intersection of PR 22 and Aquarius Street is signalized.
Signal timings at optimized at all intersections.

Corpus Christi Metropolitan Planning Organization Park Road 22 Access Management Study Chapter 4 – No-Build Condition Analysis
4-2
4.3 MEASURES OF EFFECTIVENESS Operational performance is expressed in terms of measures of effectiveness (MOEs), which include average vehicle speed, delay, vehicle miles of travel, travel time, fuel consumption, emissions and several other measures. While the VISSIM model provides a wide variety of MOEs, only a few MOEs that focus on the scope of this project were used to establish future traffic operations. The MOEs that were evaluated as part of this study include travel time, network delay, network vehicles, average speed and intersection level of service. Detailed descriptions of these MOEs can be found in Chapter 2. 4.4 NETWORK TRAFFIC OPERATIONS Area-wide statistics are critical to the evaluation of the overall efficiency of the transportation network. Results for travel time, delay, and average speed are displayed in Table 4-2. Vehicular travel time along PR 22 during the study periods under 2010 and 2035 No-Build Conditions is shown in Table 4-3. Average delay and intersection LOS for 2010 and 2035 No-Build conditions are shown in Table 4-4 and Table 4-5.
TABLE 4-2 NETWORK-WIDE AVERAGE STATISTICS
Measure of Effectiveness
2010 Existing 2035 No-Build
AM Peak
PM Peak Special Event Peak
AM Peak
PM Peak
Special Event Peak
Total Travel Time (veh-hours)
120.2 121.4 197.7 412.5 328.2 616.5
Vehicle Delay Time (veh-hours)
30.2 24.9 54.6 216.7 129.7 387.1
Delay Time per Veh. (sec/veh)
40.1 30.0 45.5 134.9 77.6 197.7
Average Speed (mph)
39.9 42.5 38.7 23.3 29.8 18.6

Corpus Christi Metropolitan Planning Organization Park Road 22 Access Management Study Chapter 4 – No-Build Condition Analysis
4-3
TABLE 4-3 TRAVEL TIME ALONG PR 22
Travel Time Segment
2010 Existing 2035 No-Build
AM Peak
PM Peak
Special Event Peak
AM Peak
PM Peak
Special Event Peak
Travel Time (min.)
Northbound Whitecap Blvd. to Aquarius St.
2.4 2.3 2.5 4.0 2.8 3.1
Southbound Aquarius St. to Whitecap Blvd.
2.4 2.6 2.7 3.2 3.5 6.5
TABLE 4-4
2010 EXISTING INTERSECTION DELAY AND LEVEL OF SERVICE
Intersection
AM Peak PM Peak Special Event Peak
Delay (sec/veh)
LOS Delay
(sec/veh) LOS
Delay (sec/veh)
LOS
PR 22/Aquarius St. 0.5 A 0.4 A 0.6 A
PR 22/Verdemar Dr. 1.0 A 0.7 A 1.4 A
PR 22/SH 361 14.2 B 13.2 B 17.0 B
PR 22/Whitecap Blvd. 29.9 C 18.1 B 34.5 C
TABLE 4-5
2035 NO-BUILD INTERSECTION DELAY AND LEVEL OF SERVICE
Intersection AM Peak PM Peak Special Event Peak
Delay (sec/veh)
LOS Delay
(sec/veh) LOS
Delay (sec/veh)
LOS
PR 22/Aquarius St. 22.0 C 18.5 B 24.2 C
PR 22/Verdemar Dr. 2.9 A 2.6 A 21.0 C
PR 22/SH 361 38.8 D 28.5 C 35.9 D
PR 22/Whitecap Blvd. 80.3 F 48.7 D 100.4 F
4.5 NETWORK SUMMARY As shown in the above tables, traffic operations deteriorate significantly in the 2035 No-Build scenarios. Network delay increases by approximately 623 percent, 420 percent, and 604 percent under 2035 No-Build conditions compared to 2010 existing conditions during the AM peak, PM peak, and special event periods, respectively. Travel time along PR 22 between

Corpus Christi Metropolitan Planning Organization Park Road 22 Access Management Study Chapter 4 – No-Build Condition Analysis
4-4
Aquarius Street and Whitecap Boulevard increases by approximately 49 percent, 28 percent, and 82 percent under 2035 No-Build conditions during the AM peak, PM peak, and special event periods, respectively, compared to 2010 existing conditions. Under 2035 No-Build conditions, the intersection of PR 22 and Whitecap Boulevard operates at LOS F during the AM peak and special event periods, compared to LOS C under 2010 existing conditions. Extensive queuing was observed for the southbound right turns and the eastbound left turns at this intersection. Intersection delay also increases significantly at the intersection of PR 22 and SH 361 especially in the southbound direction which results in long queues on PR 22.

Corpus Christi Metropolitan Planning Organization Park Road 22 Access Management Study Chapter 5 – Evaluation of Alternatives
5-1
CHAPTER 5 – EVALUATION OF ALTERNATIVES
The existing conditions and 2035 No-Build scenario results are described in Chapters 3 and 4 of the report. The purpose of the Build alternative was to identify innovative low-cost improvements that would provide travel time and delay savings to vehicles along the PR 22 corridor in the future as traffic volumes continue to increase. HDR considered a wide-range of options from signal timing optimization to reconfiguration of intersections using innovative concepts. The recommended improvements and analysis results are summarized in this chapter. 5.1 DEVELOPMENT OF ALTERNATIVES After performing a review of the geometric and right-of-way constraints along PR 22 along with the forecasted traffic volumes along the corridor, HDR developed a recommended alternative to assist the Corpus Christi MPO in identifying low-cost alternatives to improve mobility along the corridor. The proposed improvements are a combination of innovative solutions along with more traditional improvements and are summarized below. PR 22 and Aquarius Street
Construct a northbound right turn lane on PR 22 with 150 feet of storage. PR 22 and Verdemar Drive
Construct northbound and southbound left turn lanes with 200 feet of storage to remove left-turning vehicles from the through lanes.
PR 22 and SH 361
Convert the intersection to a superstreet concept. This concept would reroute left turn and through movements from SH 361 to U-turns located north and south of SH 361 along PR 22.
Convert signal timing to two-phase operation giving increased green time to the north-south movements on PR 22.
Signalize the U-turns located approximately 700 feet north and south of SH 361 along PR 22.
PR 22 and Whitecap Boulevard
Optimize signal timing.
Provide channelization for the southbound right turn lane to allow movement to operate as a free-flow movement.
Construct an eastbound right turn lane with 150 feet of storage (to move right turns out of left/through shared lane).

Corpus Christi Metropolitan Planning Organization Park Road 22 Access Management Study Chapter 5 – Evaluation of Alternatives
5-2
5.2 BENEFITS OF SUPERSTREET CONFIGURATION A superstreet intersection is a type of intersection that prohibits cross-street traffic on the minor street approach from making left turn or though movements. The minor cross street traffic must turn right and proceed to the upstream U-turn to continue in the motorist’s desired direction. Studies have shown that the superstreet intersection reduces the likelihood of crashes, especially head-on and right-angle crashes, by significantly reducing the number of conflict points at an intersection. The superstreet intersection also simplifies the signal timing at the intersection to two-phase operation which therefore provides more green time to the major street traffic.
FIGURE 5-1: SUPERSTREET CONFIGURATION
Simulations of superstreet intersection configurations conducted by the FHWA show that overall travel time can be significantly reduced compared to standard configurations. In addition to travel time reductions, other benefits of superstreet configurations include improved safety due to fewer conflict points and less delay for major street movements 5.3 SUPERSTREET APPLICATION ALONG PR 22 CORRIDOR For the Alternative scenario, implementation of a superstreet intersection was evaluated for the intersection of PR 22 and SH 361. The initial assessment included preliminary evaluation using the FHWA’s Alternative Intersections Selection Tool. In addition, a feasibility analysis was performed to determine if the superstreet footprint fit within the existing pavement footprint

Corpus Christi Metropolitan Planning Organization Park Road 22 Access Management Study Chapter 5 – Evaluation of Alternatives
5-3
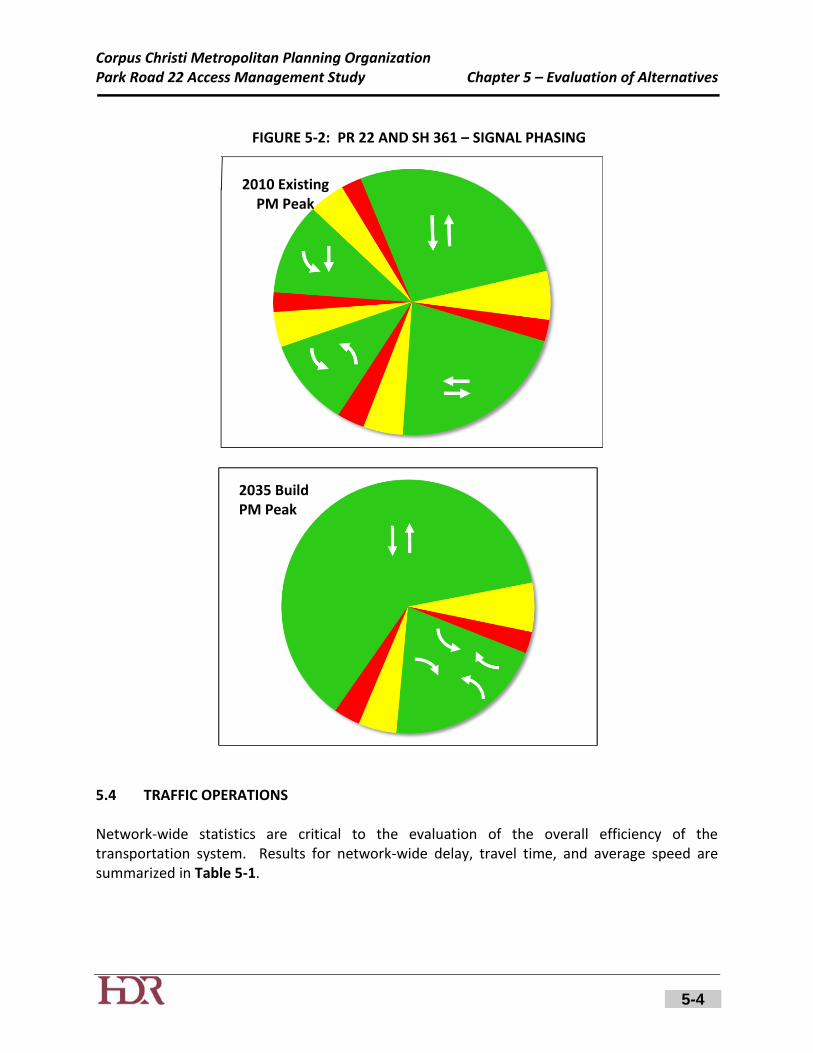
or with minor pavement additions. Due to the existing wide median on PR 22, the existing intersection layout provides a good footprint for the superstreet intersection. In addition, the existing traffic volumes and patterns (i.e., low cross-street left and through movements) make it compatible for the superstreet intersection. The highest turn movements at this intersection are the southbound left-turns and the westbound right-turns which operate efficiently with a superstreet concept. The intersection was tested using Synchro and VISSIM to evaluate necessary turn bay storage requirements and determine optimized signal timing. Finally, the Alternative scenario was evaluated using VISSIM to determine the impact of the superstreet on the intersection as well as the impact on moving vehicles through the PR 22 corridor. In addition to the intersection of PR 22 and SH 361, the intersection of PR 22 and Whitecap Boulevard was also evaluated for conversion to an innovative concept. This intersection was evaluated using the FHWA’s Alternative Intersections Selection Tool. However, due to the traffic volumes and patterns at this intersection, it is not an ideal candidate for a superstreet concept. The intersection of PR 22 and Whitecap Boulevard has a significant eastbound left turn movement on the cross-street and therefore would not lend itself to conversion to a superstreet intersection. A continuous flow intersection (CFI) was also evaluated at this intersection however the traffic volume patterns (i.e., heavy southbound right turn and eastbound left turn) make it unsuitable for a CFI. Due to the traffic patterns at this intersection, HDR evaluated traditional turn lane improvements as well as innovative signal timing techniques which were carried forward to the Build models. As stated previously, one of the biggest benefits of the superstreet intersection is the ability to run a simple two-phase operation at the intersection which in turn provides more green time to the major street movements. The charts shown below in Figure 5-2 show an example of the phase reallocation for the intersection of PR 22 and SH 361 before and after the implementation of the superstreet, demonstrating the additional green time that can be provided to the major street through traffic to achieve more throughput.
Corpus Christi Metropolitan Planning Organization Park Road 22 Access Management Study Chapter 5 – Evaluation of Alternatives
5-4
FIGURE 5-2: PR 22 AND SH 361 – SIGNAL PHASING
5.4 TRAFFIC OPERATIONS Network-wide statistics are critical to the evaluation of the overall efficiency of the transportation system. Results for network-wide delay, travel time, and average speed are summarized in Table 5-1.
2010 Existing PM Peak
2035 Build PM Peak

Corpus Christi Metropolitan Planning Organization Park Road 22 Access Management Study Chapter 5 – Evaluation of Alternatives
5-5
TABLE 5-1 NETWORK-WIDE STATISTICS
Measure of Effectiveness
2010 Existing 2035 No-Build 2035 Build
AM Peak
PM Peak
Special Event
AM Peak
PM Peak
Special Event
AM Peak
PM Peak
Special Event
Total Travel Time (veh-hours)
120.2 121.4 197.7 412.5 328.2 616.5 341.5 308.1 417.9
Vehicle Delay Time (veh-hours)
30.2 24.9 54.6 216.7 129.7 387.1 140.9 106.8 174.7
Delay Time per Veh (sec/veh)
40.1 30.0 45.5 134.9 77.6 197.7 89.3 65.1 88.8
Average Speed (mph)
39.9 42.5 38.7 23.3 29.8 18.6 28.7 32.1 28.8
Travel time along the PR 22 corridor is an important measure of effectiveness since it provides exclusive access to/from the mainland. Table 5-2 displays the corridor travel time along PR 22 between Aquarius Street and Whitecap Boulevard for the existing, No-Build, and Build conditions.
TABLE 5-2 TRAVEL TIME STATISTICS
Travel Time Segment 2010 Existing 2035 No-Build 2035 Build
AM Peak
PM Peak
Special Event
AM Peak
PM Peak
Special Event
AM Peak
PM Peak
Special Event
Travel Time (min.)
Northbound Whitecap Blvd. to Aquarius St.
2.4 2.3 2.5 4.0 2.8 3.1 3.3 2.7 2.8
Southbound Aquarius St. to Whitecap Blvd.
2.4 2.6 2.7 3.2 3.5 6.5 3.2 3.2 3.6
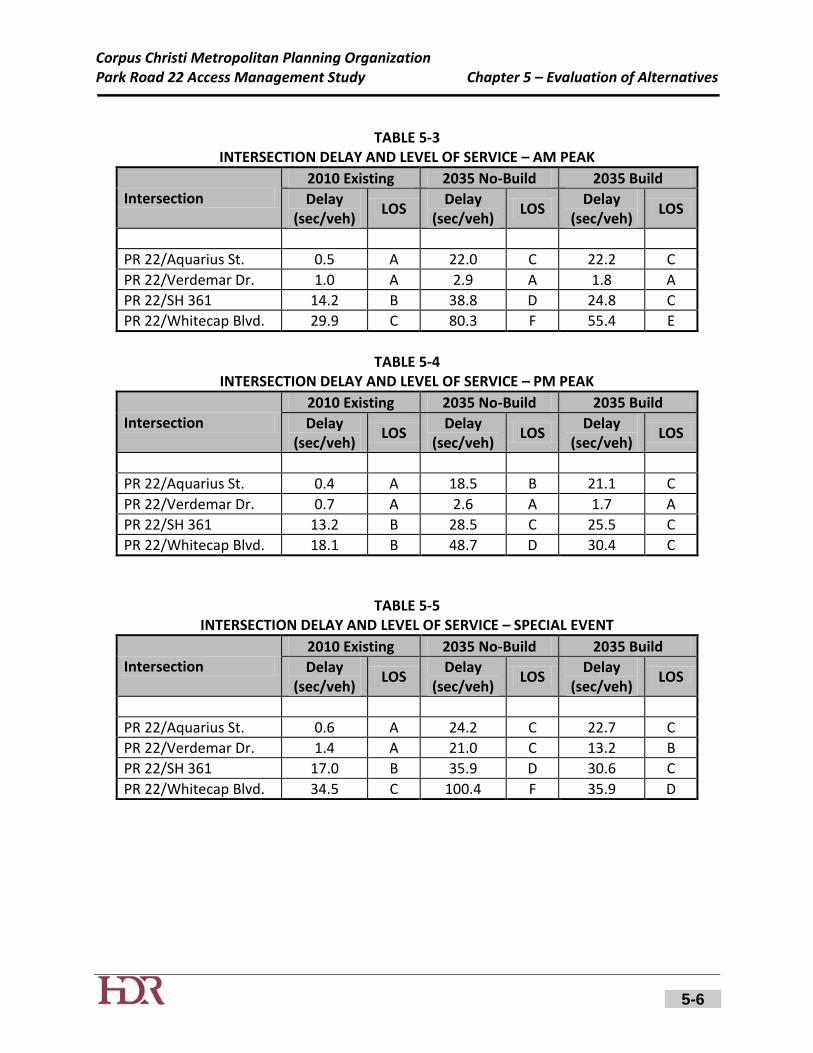
Intersection LOS was compiled to provide a comparison of alternatives on an intersection level. Table 5-3 through Table 5-5 display the intersection delay and LOS for each scenario for the AM peak, PM peak, and special event periods, respectively.
Corpus Christi Metropolitan Planning Organization Park Road 22 Access Management Study Chapter 5 – Evaluation of Alternatives
5-6
TABLE 5-3 INTERSECTION DELAY AND LEVEL OF SERVICE – AM PEAK
Intersection 2010 Existing 2035 No-Build 2035 Build
Delay (sec/veh)
LOS Delay
(sec/veh) LOS
Delay (sec/veh)
LOS
PR 22/Aquarius St. 0.5 A 22.0 C 22.2 C
PR 22/Verdemar Dr. 1.0 A 2.9 A 1.8 A
PR 22/SH 361 14.2 B 38.8 D 24.8 C
PR 22/Whitecap Blvd. 29.9 C 80.3 F 55.4 E
TABLE 5-4
INTERSECTION DELAY AND LEVEL OF SERVICE – PM PEAK
Intersection
2010 Existing 2035 No-Build 2035 Build
Delay (sec/veh)
LOS Delay
(sec/veh) LOS
Delay (sec/veh)
LOS
PR 22/Aquarius St. 0.4 A 18.5 B 21.1 C
PR 22/Verdemar Dr. 0.7 A 2.6 A 1.7 A
PR 22/SH 361 13.2 B 28.5 C 25.5 C
PR 22/Whitecap Blvd. 18.1 B 48.7 D 30.4 C
TABLE 5-5 INTERSECTION DELAY AND LEVEL OF SERVICE – SPECIAL EVENT
Intersection 2010 Existing 2035 No-Build 2035 Build
Delay (sec/veh)
LOS Delay
(sec/veh) LOS
Delay (sec/veh)
LOS
PR 22/Aquarius St. 0.6 A 24.2 C 22.7 C
PR 22/Verdemar Dr. 1.4 A 21.0 C 13.2 B
PR 22/SH 361 17.0 B 35.9 D 30.6 C
PR 22/Whitecap Blvd. 34.5 C 100.4 F 35.9 D
Corpus Christi Metropolitan Planning Organization Park Road 22 Access Management Study Chapter 5 – Evaluation of Alternatives
5-7
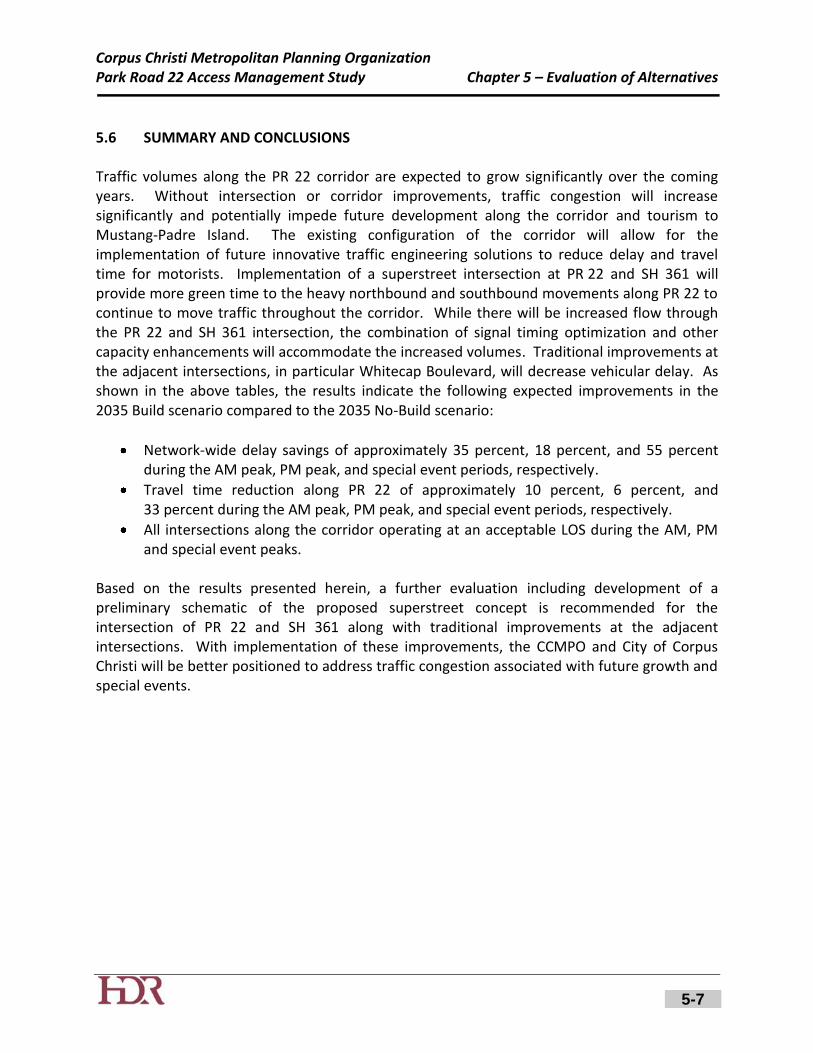
5.6 SUMMARY AND CONCLUSIONS Traffic volumes along the PR 22 corridor are expected to grow significantly over the coming years. Without intersection or corridor improvements, traffic congestion will increase significantly and potentially impede future development along the corridor and tourism to Mustang-Padre Island. The existing configuration of the corridor will allow for the implementation of future innovative traffic engineering solutions to reduce delay and travel time for motorists. Implementation of a superstreet intersection at PR 22 and SH 361 will provide more green time to the heavy northbound and southbound movements along PR 22 to continue to move traffic throughout the corridor. While there will be increased flow through the PR 22 and SH 361 intersection, the combination of signal timing optimization and other capacity enhancements will accommodate the increased volumes. Traditional improvements at the adjacent intersections, in particular Whitecap Boulevard, will decrease vehicular delay. As shown in the above tables, the results indicate the following expected improvements in the 2035 Build scenario compared to the 2035 No-Build scenario:
Network-wide delay savings of approximately 35 percent, 18 percent, and 55 percent during the AM peak, PM peak, and special event periods, respectively.
Travel time reduction along PR 22 of approximately 10 percent, 6 percent, and 33 percent during the AM peak, PM peak, and special event periods, respectively.
All intersections along the corridor operating at an acceptable LOS during the AM, PM and special event peaks.
Based on the results presented herein, a further evaluation including development of a preliminary schematic of the proposed superstreet concept is recommended for the intersection of PR 22 and SH 361 along with traditional improvements at the adjacent intersections. With implementation of these improvements, the CCMPO and City of Corpus Christi will be better positioned to address traffic congestion associated with future growth and special events.
Corpus Christi Metropolitan Planning Organization Park Road 22 Access Management Study References
1. Traffic Analysis Toolbox Volume III: Guidelines for Applying Traffic Microsimulation Modeling Software, Federal Highway Administration, June 2005.
2. Highway Capacity Manual, (SR 209), Transportation Research Board, Washington, D.C., 1994.
3. VISSIM, Version 5.10-06, PTV Planung Transport Verkehr AG, Karlsruhe, Germany,
January 2008.