Parametric joint modelling of longitudinal and survival data
PARAMETRIC MODELLING FOR THE MITIGATION OF URBAN HEAT
ISLAND EFFECT: A MODEL PROPOSAL
A THESIS SUBMITTED TO THE GRADUATE SCHOOL OF NATURAL AND APPLIED SCIENCES
OF
MIDDLE EAST TECHNICAL UNIVERSITY
BY
BEGÜM SAKAR
IN PARTIAL FULFILLMENT OF THE REQUIREMENTS
FOR
THE DEGREE OF MASTER OF SCIENCE IN
URBAN DESIGN
IN CITY AND REGIONAL PLANNING
AUGUST 2018


Approval of the thesis:
PARAMETRIC MODELLING FOR THE MITIGATION OF URBAN HEAT
ISLAND EFFECT: A MODEL PROPOSAL
submitted by Begüm Sakar in partial fulfillment of the requirements for the degree of Master of Science in Urban Design in City and Regional Planning,
Middle East Technical University by,
Prof. Dr. Halil Kalıpçılar
Dean, Graduate School of Natural and Applied Sciences
Prof. Dr. Çağatay Keskinok
Head of Department, City and Regional Planning
Assoc. Prof. Dr. Olgu Çalışkan Supervisor, City and Regional Planning Dept., METU
Examining Committee Members:
Prof. Dr. Adnan Barlas Department of City and Regional Planning, METU
Assoc. Prof. Dr. Olgu Çalışkan Department of City and Regional Planning, METU
Assist. Prof. Dr. Meltem Şenol Balaban Department of City and Regional Planning, METU
Assist. Prof. Dr. Yücel Can Severcan Department of City and Regional Planning, METU
Assist. Prof. Dr. Aktan Acar Department of Architecture, TOBB UET
Date: 13.08.2018

iv
I hereby declare that all information in this document has been obtained and
presented in accordance with academic rules and ethical conduct. I also declare
that, as required by these rules and conduct, I have fully cited and referenced all
material and results that are not original to this work.
Name, Last Name: Begüm Sakar
Signature :
v
ABSTRACT
PARAMETRIC MODELLING FOR THE MITIGATION OF URBAN HEAT
ISLAND EFFECT: A MODEL PROPOSAL
Sakar, Begüm
M.S., Urban Design, Department of City and Regional
Supervisor: Assoc. Prof. Dr. Olgu Çalışkan
August 2018, 132 pages
Morphological characteristics of urban settlements as the outcome of the long-term
planning decisions influence microclimatic conditions of our cities and more
specifically induces the “Urban Heat Island” (UHI) effect, which generates many
undesirable conditions in the living environment. In the very context of global
warming that generate intensive UHI in the cities, any change in the thermal balance
of the urban environment is associated with the main parameters of urban geometry.
This is actually the issue that necessitates more research for the mitigation of heat
island intensity by design. In this regard, this study investigates the potentials of
computational modelling for analyzing the key morphological components of urban
areas, and generating alternative typologies of urban fabric to mitigate UHI intensity.
From this standpoint, the current research proposes a parametric model to provide
urban design and planning practice with a computational and generative basis in the
way of a robust morphological perspective to the mitigation of UHI effect.
Since the development of UHI has a strong correlation with the “Sky View Factor”
(SVF) value, the methodological framework of this research is formed on the basis of

vi
the SVF measurement to estimate UHI intensity via parametric modelling. The
alternative form compositions and configurations are generated to simulate different
conditions of heat island intensity in accordance with the different values of the basic
parametric indicators (i.e. building height, coverage ratio, setback distance), which are
utilized as the basic building codes in the spatial planning system in Turkey. The
integration of computation and form generation within an algorithmic model,
essentially, suggests an effective integration of morphology (analysis) and design to
be applied on actual urban context.
In this framework, Mustafa Kemal Neighborhood, one of the recent urban
transformation site in Ankara is selected as the case study area for the application of
the proposed model. Rather than searching for an ideal urban form, the model
application focuses on the generation of the best performing form alternatives with
regards to the focused issue of UHI effect. From the generative perspective of urban
design, the methodological framework with the proposed model is believed to provide
a kind of “Decision Support System” (DSS) in planning on the way of the development
of an evidence-based urban design approach in practice.
Keywords: Parametric Modelling, Generative Urban Design, Urban Heat Island
vii
ÖZ
KENTSEL ISI ADASI ETKİSİ AZALTIMINDA PARAMETRİK
MODELLEME: BİR MODEL ÖNERİSİ
Sakar, Begüm
Yüksek Lisans, Kentsel Tasarım, Şehir ve Bölge Planlama Bölümü
Tez Yöneticisi: Doç. Dr. Olgu Çalışkan
Ağustos 2018, 132 sayfa
Yoğun kentsel dönüşüm süreçleri doğrultusunda biçimlenen kent formunun değişen
morfolojik karakteri, kentlerin iklimsel koşullarını etkileyerek birçok olumsuz sonuca
yol açabilmektedir. Küresel ısınma bağlamında bu olumsuz etkilerin başında “Kentsel
Isı Adası” (KIA) gelmektedir. Kentlerde ısı adası oluşumunu koşullayan kentsel
geometrinin değişkenleri kentin termal dengesinde de değişime neden olabilmektedir.
Bu değişim, ısı adası yoğunluğunun tasarım yoluyla azaltılmasına yönelik daha fazla
araştırma yapılmasınına yönelik gereği açığa çıkarmıştır. Bu bağlamda, söz konusu
çalışma, kentsel alanların morfolojik bileşenlerini analiz ederek ısı adası etkisini
azaltmaya yönelik alternatif kentsel doku tipolojileri üretmek üzere hesaplamalı
(computational) modelleme yöntemlerinin potansiyellerini araştırmaktadır. Bu açıdan
mevcut araştırma, kentsel tasarım ve planlama uygulamalarında KIA etkisinin
azaltılmasına yönelik, çözümsel (analitik) ve üretken (generative) nitelikte morfolojik
bir yöntemsel bakış açısını sağlamak için parametrik bir model önerisinde
bulunmaktadır.
Kentsel Isı Adası (KIA) oluşumu ile “Gökyüzü Görüş Açısı” (GGA) arasında güçlü

viii
bir ilişki olduğundan, bu araştırmanın metodolojik çerçevesi, parametrik modelleme
aracılığıyla kentsel alanlarda GGA ölçümü yaparak KIA yoğunluğunu hesaplamak
üzerine kurgulanmıştır. Isı adası oluşumundaki farklılıkları test etmek üzere,
Türkiye’deki mekânsal planlama pratiğinde yer alan yapılaşma kodları (bina
yüksekliği, taban alanı, çekme mesafesi, vb.) temel form değişkenleri olarak modele
girdi kullanılmış ve alternatif kentsel doku tipolojileri üretilmiştir. Algoritmik model
tabanında entegre edilen hesaplama ve form üretim modeli aynı zamanda, kentsel
bağlamda uygulanabilecek analiz ve tasarım aşamalarını bütünleştirme potansiyeline
sahiptir.
Bu kapsamda, önerilen modelin uygulanması için Ankara'daki kentsel dönüşüm
alanlarından biri olan Mustafa Kemal Mahallesi örnek çalışma alanı olarak seçilmiştir.
Yapılan çalışma, ‘ideal’ bir kentsel formun ortaya konması yerine, KIA sorununa
yönelik olarak en iyi performansı gösteren form alternatiflerinin üretilmesini
hedeflemektedir. Hesaplamalı ve üretken model altlığı doğrultusunda önerilen
metodolojik çerçevesinin, planlamada bir tür “Karar Destek Sistemi” (KDS)
oluşturarak kanıta dayalı kentsel tasarım yaklaşımının geliştirilmesine de katkı
sağlayacağı savlanmaktadır.
Keywords: Parametrik Modelleme, Üretken Kentsel Tasarım, Kentsel Isı Adası

ix
To who encourage me…

x
ACKNOWLEDGEMENTS
This thesis has been completed with the guidance, support and help of several people
who have contributed throughout the process.
I would like to express my deepest gratitude to my advisor, Assoc. Prof. Dr. Olgu
Çalışkan for all his incredible guidance, encouragement and patient throughout this
research. I would not complete this thesis without his contribution and assistance. I
would also like to thank the examining committee, Prof. Dr. Adnan Barlas, Assist.
Prof. Dr. Meltem Şenol Balaban, Assist. Prof. Dr. Yücel Can Severcan and Assist.
Prof. Dr. Aktan Acar for their valuable comments and suggestions.
In particular, I owe special thanks to Ayşem Şebnem Ötkür for her help and guidance
throughout this year. I would not improve my writing skill without her incredible
personality and teaching method. I would also like to offer my special thanks to Y.
Baver Barut for his help whenever I need it.
I would like to express my gratitude to the members of METU MUD and Research
Collective team. I would also like to offer my special thanks to my beloved friends
Derya Yılmaz and Busen Özgür for their presence and support. I am also thankful to
H. Eren Efeoğlu, Neşe Aydın and Damla Karagöz for their contribution.
Lastly, I would like to express my sincere gratitude to my beloved mother, Yasemin
Sakar for her unlimited love and support in every stage of my life. I owe her everything
I have. I am also heartily thankful to Yalçın Akyel for being so caring and supportive.
Thanks to him, I was able to overcome all problems even if I didn’t believe I could. I
appreciate him for his endless patience and moral support.

xi
TABLE OF CONTENTS
ABSTRACT ................................................................................................................. v
ÖZ .............................................................................................................................. vii
ACKNOWLEDGEMENTS ......................................................................................... x
TABLE OF CONTENTS ............................................................................................ xi
LIST OF TABLES .................................................................................................... xiii
LIST OF FIGURES .................................................................................................. xiv
1. INTRODUCTION ................................................................................................ 1
1.1. Definition of the Research Problem............................................................... 1
1.2. Aims and Objectives of the Research ............................................................ 3
1.3. Method of the Research ................................................................................. 4
1.4. Structure of the Research ............................................................................... 5
2. URBAN HEAT ISLAND PHENOMENON ........................................................ 7
2.1. Definition of Urban Heat Island .................................................................... 7
2.1.1. Formation of UHI .................................................................................. 11
2.1.1.1. Physical Principles of Energy Balance ........................................... 12
2.1.1.2. Energy Balance Differences between Urban and Rural Areas ....... 15
2.1.2. Causes of UHI ....................................................................................... 18
2.1.2.1. Urban Population ............................................................................ 19
2.1.2.2. Urban Geometry ............................................................................. 20
2.1.2.3. Thermal Properties of Urban Surfaces ........................................... 24
2.1.2.4. Lack of Vegetation Areas ............................................................... 27
2.1.2.5. Anthropogenic Heat Release .......................................................... 31
2.1.3. Negative Impacts of UHI and Need For Mitigation ............................. 32
2.2. The Relation between UHI and Urban Geometry ....................................... 35
2.2.1. Characterizing Indicators of Urban Geometry ...................................... 35
2.2.1.1. Aspect Ratio (H/W) ........................................................................ 35

xii
2.2.1.2. Sky View Factor (SVF) .................................................................. 39
2.2.1.3. Orientation ...................................................................................... 45
2.2.2. Calculation of UHI Intensity based on Urban Geometry ...................... 49
2.3. Evaluation of UHI Related Studies in the Literature ................................... 52
2.3.1. Previous Studies on UHI ....................................................................... 52
2.3.1.1. Measurement Related Studies ........................................................ 53
2.3.1.2. Simulation Related Studies ............................................................. 54
2.3.2. The Overall Critics on Existing Methods of UHI ................................. 57
3. PARAMETRIC MODELLING FOR THE ANALYSIS AND SIMULATION
OF UHI: A MODEL PROPOSAL ......................................................................... 59
3.1. Methodical Approach ................................................................................... 59
3.2. Parametric Modelling: Tools and Techniques ............................................. 61
3.3. Definition of Computational Framework for the Mitigation of UHI ........... 66
3.3.1. Algorithmic Definitions of the Morphological Indicators of UHI ........ 66
3.3.2. Algorithmic Setting of Analysis ............................................................ 71
3.3.3. Algorithmic Setting of Simulation ........................................................ 77
4. APPLICATION OF THE MODEL IN ACTUAL URBAN CONTEXT:
PERFORMANCE ASSESSMENT OF AN URBAN TRANSFORMATION ...... 87
4.1. Case Study Area: Mustafa Kemal Neighborhood ........................................ 88
4.2. Case Study Analysis: SVF Calculation ........................................................ 93
4.3. Simulation Application for the Mitigation of UHI Effect ........................... 98
4.3.1. Generation of Form Variations ............................................................. 99
4.3.2. Overview of the Findings .................................................................... 111
5. CONCLUSION ................................................................................................ 113
5.1. The Main Problematic Issues to Revisit .................................................... 113
5.2. Main Findings and Contributions of the Research .................................... 116
5.3. Main Limitations of the Research .............................................................. 118
5.4. Recommendations for Future Studies ........................................................ 120
REFERENCES ......................................................................................................... 123

xiii
LIST OF TABLES
TABLES
Table 2.1: World’s population by size of settlement, 2016 and 2030.......................... 7
Table 2.2: Albedo values of surface materials ........................................................... 26
Table 2.3: Examination of measurement-based studies ............................................. 53
Table 2.4: Examination of simulation-based studies ................................................. 56
Table 3.1: The comparison of SVF extraction models .............................................. 76
Table 4.1: Simulation results of the first scenario.................................................... 100
Table 4.2: Simulation results of the second scenario ............................................... 105
Table 4.3: Simulation results of the third scenario .................................................. 107
Table 4.4: Simulation results of the fourth scenario ................................................ 109

xiv
LIST OF FIGURES
FIGURES
Figure 2.1: Spatial distribution of surface and air temperatures ................................ 11
Figure 2.2: Energy conversion system in the environment ........................................ 12
Figure 2.3: Schematic depiction of energy balance components ............................... 14
Figure 2.4: Energy balance of rural and suburban areas ............................................ 17
Figure 2.5: Daily heating/cooling rates and air temperature changes in urban and
rural areas ................................................................................................................... 18
Figure 2.6: The relation between UHI intensity (∆Tu-r(max)) and population (log P)
for North American (a) and European (b) cities ........................................................ 20
Figure 2.7: Schematic depiction of an urban canyon ................................................. 22
Figure 2.8: The reflection of incoming radiation from different surfaces ................. 23
Figure 2.9: Daily surface temperatures of different colored panels ........................... 27
Figure 2.10: Daily energy fluxes for two configurations of canyon depth and
evaporation area ......................................................................................................... 28
Figure 2.11: Temperature reductions in Sacramento and Phoenix with additional tree
cover in summer period .............................................................................................. 29
Figure 2.12: The rise in air temperature in proportion to the distance from green area
during day-time and night-time .................................................................................. 30
Figure 2.13: The calculation of H/W ratio for a symmetrical canyon ....................... 36
Figure 2.14: The calculation of H/W ratio for non-uniform buildings ...................... 36
Figure 2.15: The calculation of H/W ratio for an asymmetrical canyon .................... 37
Figure 2.16: The relation between H/W ratio and UHI intensity ............................... 38
Figure 2.17: The hourly variations of the air temperature in different canyon profiles
(Source: Bakarman and Chang, 2015) ....................................................................... 39
Figure 2.18: The relation between SVF values and emitted long-wave radiation ..... 40
Figure 2.19: Schematic depiction of the SVF calculation .......................................... 41
xv
Figure 2.20: Image-based SVF calculation process ................................................... 43
Figure 2.21: Energy balances of canyon surfaces based on hourly measurements ... 46
Figure 2.22: Advection of the canyon air volume due to the wind direction: N-north,
S-south, V-variable .................................................................................................... 47
Figure 2.23: Schematic depiction of flow patterns .................................................... 48
Figure 2.24: UHI intensity distribution according to the model of Oke (1981) and to
the new statistical model ............................................................................................ 50
Figure 2.25: Comparison of estimated heat island intensities by different models ... 51
Figure 2.26: Generated form samples based on the best density distribution ............ 55
Figure 3.1: Schematic depiction of the workflow ...................................................... 61
Figure 3.2: Rhinoceros and Grasshopper softwares with basic explanations ............ 63
Figure 3.3: Fitness process of the Galapagos tool...................................................... 65
Figure 3.4: Schematic depiction of the effect of morphological parameters on the
visibility of sky ........................................................................................................... 67
Figure 3.5: Definition of basic elements of morphological components ................... 68
Figure 3.6: Schematic depiction of algorithmic attributions ...................................... 69
Figure 3.7: Algorithmic definition of Building Coverage Ratio (BCR) and Floor Area
Ratio (FAR) ................................................................................................................ 70
Figure 3.8: The detection process of the measurement point and areas (Phase 1)..... 72
Figure 3.9: The projection process of the buildings on the hemisphere (Phase 2) .... 73
Figure 3.10: The SVF extraction from the fisheye image model (Phase 3) ............... 74
Figure 3.11: The SVF extraction from the hemispherical projection model (Phase 3)
.................................................................................................................................... 75
Figure 3.12: The comparison of SVF measurement results of the different number of
buildings ..................................................................................................................... 77
Figure 3.13: Workflow of the algorithmic setting of the simulation ......................... 78
Figure 3.14: The SVF simulation based on the building height ................................ 79
Figure 3.15: The SVF simulation based on the distance parameter ........................... 80
Figure 3.16: Different form configurations for the same ‘distance simulation’ result
.................................................................................................................................... 81
Figure 3.17: The SVF simulation based on the building size .................................... 82
Figure 3.18: The SVF simulation based on the Floor Area Ratio (for all buildings) 83

xvi
Figure 3.19: The SVF simulation based on the Floor Area Ratio (for each building)
.................................................................................................................................... 84
Figure 3.20: Different form configurations for the same ‘FAR simulation’ result .... 85
Figure 4.1: Land use situation of Mustafa Kemal Neighborhood in 1970 ................. 89
Figure 4.2: Land use situation of Mustafa Kemal Neighborhood in 1997 ................. 90
Figure 4.3: Land use situation of Mustafa Kemal Neighborhood in 2005 ................. 90
Figure 4.4: Satellite image of Mustafa Kemal Neighborhood in 2018 ...................... 90
Figure 4.5: 2023 Master Plan decisions for central-west area of Ankara .................. 91
Figure 4.6: Case study area selection from Mustafa Kemal neighborhood ............... 91
Figure 4.7: Satellite images of the case study area for 2005 (a) and 2018 (b) years . 92
Figure 4.8: Comparison of the figure-ground map of the informal housing area (a)
and the transformed housing area (b) ......................................................................... 92
Figure 4.9: Comparison of the street network of the informal housing area (a) and the
transformed housing area (b) ...................................................................................... 93
Figure 4.10: Algorithmic setting of the building selection for each measurement
point ............................................................................................................................ 94
Figure 4.11: Application of the algorithmic set of analysis on the area ..................... 95
Figure 4.12: Algorithmic setting of the analysis phase of the proposed model ......... 96
Figure 4.13: Detail sections from the SVF calculations............................................. 96
Figure 4.14: Comparison of measurement results (SVF and UHI intensity) of
informal and actual urban transformation areas ......................................................... 97
Figure 4.15: Comparison of simulation results for the first scenario ....................... 101
Figure 4.16: Design variations for the first scenario (from 1st to 6th generation) ... 103
Figure 4.17: Design variations for the first scenario (from 7th to 15th generation) 104
Figure 4.18: Comparison of simulation results for the second scenario .................. 106
Figure 4.19: Comparison of simulation results for the third scenario ...................... 108
Figure 4.20: Comparison of simulation results for the fourth scenario ................... 110
Figure 4.21: Comparison of the actual morphology of the area before and after
transformation (top row) with the alternative form variations generated by the
simulation (bottom row) ........................................................................................... 111

1
CHAPTER 1
INTRODUCTION
1.1. Definition of the Research Problem
Urban climate affects urban livability which is influenced by the complexity of
physical and morphological characteristics of cities such as urban form and geometry,
urban density, thermal properties of urban surfaces and the availability of vegetation
coverage. The intrinsic physical nature of the cities as the cumulative outcome of all
of these factors, result in subtle differentiations in the particular conditions of urban
microclimate. Urban Heat Island (UHI) is one of the prominent issue discussed by
spatial researchers on performativity differentiation based on urban morphology.
Defined as differentiation in the air temperature between urban areas and its
surroundings, the phenomenon of Urban Heat Island (UHI) is considered one of the
major issues regarding the perceived spatial quality urban environments. The
development of larger heat island intensity causes climate modifications from local to
global scale. At least 1°C rise in air temperature of cities has a knock-on effect on the
global warming. In fact, this warming trend has negative impacts on the environment
both ecological and economical, and on the human health (Erell et al., 2011;
Santamouris et al., 2001). Emerging problems from increased UHI effect in urban
areas, essentially, call for specification of the influential factors on the change in the
thermal balance of the environment as an outcome of the urbanization.
Urban geometry, one of the most influential factors in the development of heat island
intensity, has been evaluated, and its critical effects have been proved by several
studies, so far. Accordingly, the variation on the main parameters of urban geometry,

2
which are defined as form, location, orientation, height of the buildings and spaces
between them influence air temperature, wind speed and direction, and the amount of
radiation absorbed and emitted. Over the years, researchers have established numerous
correlations between geometrical features of urban areas and the ambient air
temperature to overcome the issue of characterizing the calculation of UHI in regard
to the urban geometry. In order to represent that relation, the aspect ratio (H/W), which
is based on the height-to-width ratio of urban canyons, and sky view factor (SVF),
which is based on the ratio of visibility of sky from the ground level, are the prominent
morphological indicators used in order to simulate urban canyons, and to estimate the
UHI intensity in the areas of investigation.
In order to specify the real effect of urban geometry indicators on UHI, and to
determine the increase in the air temperature due to any change in the geometrical
features, many studies have been conducted by using measurement tools on the actual
urban areas. Since those models have become a focus of measurement-based studies,
the lack of predictive tools for the simulation of UHI intensity has emerged in the
research field. Then, simulation-based studies have come into the agenda to
experiment the influence of urban geometry on the air temperature through different
scenarios, and to test various form configurations to mitigate the UHI effect. In
addition to benefits of improved simulation tools to estimate heat island intensity for
different urban areas by using three-dimensional urban geometry data, they have also
weakness in generating from configurations and searching better solutions in terms of
mitigation of UHI intensity. Limitations on the number of tested scenarios, estimations
based on specific simulated areas, non-flexible tools, and restrictions on the form
generations by computational design tools necessitate the development of new tools
and techniques to enable designers and planner in building a robust perspective on
climate responsive urban design.
Since the development of parametric modelling tools, designers have enormous ability
to generate numerous form configurations and design alternatives, and to create set of
algorithms for analyzing design problems to guide finding better solutions. Since
parametric modelling provides infinite possibilities, such as searching, generating,

3
analyzing and operating design settings, it has gained a wide acceptance in the field of
architectural and urban design. Nevertheless, despite its increasing use in design
practice, its use in spatial analysis and research has fallen limited and insufficient.
Considering its wide range of opportunities, the current research argues that parametric
modeling can be explored in order to come up with an efficient integration between
analysis and design on the basis of a possible generative approach to the issue of urban
heat island. Since urban geometry-based UHI studies are generally specialized either
on measurement or on simulation techniques, the current analytical tools are not
integrated with each other. Therefore, in specific urban areas, design proposals for heat
island mitigation cannot be generated according to the exact result of morphological
analysis that leads to the inability of the applications to achieve better solutions. In
other words, the studies fall short to test the various development alternatives based
on certain for indicators in certain contexts. Thus, to tackle these shortcomings, a
model proposal that combines analysis and design processes to mitigate UHI intensity
is suggested as response to the essential problem statement of the research.
1.2. Aims and Objectives of the Research
The aim of this research is to investigate the potentials of parametric modelling for
analyzing morphological components of urban areas, and testing the design solutions
to mitigate the Urban Heat Island (UHI) effect. By developing a parametric approach,
following the calculation of UHI intensity in urban areas, one could proceed the design
process to generate form compositions and configurations according to the analysis
results.
The proposed integrative parametric model of analysis and design aims to provide
designers an effective calculation of UHI intensity through various form generations,
simultaneously, via the computational algorithms. Thus, this research will bring an
analytical and generative perspective to urban design and planning while opening up
a methodological discussion on the problematic issue of urban heat island (UHI).
Within this context, for the demonstration of the applicability of the proposed

4
parametric model, and for the integration of parametric modelling with urban design
and urban planning practices, this model will be applied and experienced in an actual
urban context.
In the urban context selection, Ankara, which has a tendency to develop and transform
rapidly on the southwestern corridor, is taken into consideration due to the land use of
that corridor and its surroundings has been remarkably changed by upper scale plans,
and implementation plan decisions. One of the developed part of this corridor where
public institutions, business centers and residential-office mixed projects area mainly
took place in recent years, Mustafa Kemal neighborhood, is exposed to many
alterations from 1970s to 2010s. Recently, the declaration of this area as an urban
transformation and regeneration project allows to make a comparison between
demolished informal fabric, renewed formal fabric and design alternatives to be
generated by the model in regard to their contribution to the UHI effect. Therefore the
main aim of this study is to compare various form variations according to the same
plan decisions to search for better solutions to mitigate UHI intensity.
In this framework, the main research problems can be stated as follows:
– How can the adaptation of UHI studies into parametric modelling provided?
– Which morphological indicators can be redefined within parametric modelling for
analyzing UHI effect in actual urban areas?
– Can various form compositions and configurations be generated by parametric
modelling to mitigate the UHI intensity with regards to the settled (parametric)
indicators of development planning system in Turkey (i.e. height, FAR, coverage,
setback distance)?
– How can the integration of analysis and design processes be provided as an
effective and flexible tool in urban design and planning practices?
1.3. Method of the Research
The research stands on a model proposal as a synthesis of analysis and simulation
5
processes via parametric modeling tools, which are incorporated into Rhinoceros and
Grasshopper softwares. Parametric modelling can be defined as a computational
design approach based on evaluation and generation of form compositions and design
alternatives by controlling input and output parameters. This generative tool allows
designers and researchers to build up and develop algorithms for analyzing and
generating form variations depending on their design problems.
In this research, the proposed model aims to achieve the combination of Sky View
Factor (SVF) calculation, which is described as the ratio of the visibility of the sky
from a point on the urban surfaces depending on the interception of the near located
urban structures, by analyzing morphological components, and form generation by
maximizing the obtained SVF values in order to mitigate heat island intensity. To that
end, a wide range of literature on the UHI studies, the effect of urban geometry on the
UHI development and calculation methods based on geometrical features of urban
areas is reviewed in order to come up with an original SVF calculation method as the
main part of the research study.
Following the literature review, the first phase of the proposed model, which is named
as the analysis phase, is constructed in the parametric modelling software by defining
algorithmic setting of morphological indicators to develop SVF calculation algorithms.
Then, in the second phase, a set of computational algorithm is defined for the
simulation process to generate form variations by maximizing SVF values to achieve
minimum heat island intensity. Consequently, the research method aims provide a new
technique to simulate UHI effect in different urban design scenarios that will enhance
the discussion on the typological formations in this regard.
1.4. Structure of the Research
This research is composed of five chapters. It begins with an introductory chapter on
the main research problem of this study, which is a model proposal as a synthesis of
analysis and simulation for urban design, while giving research questions and
methodological approach to draw the framework of the thesis.

6
Chapter 2 starts with a comprehensive literature review on the Urban Heat Island
(UHI) phenomenon, and summarizes the process of the formation of UHI effect, main
causes of the heat island intensity and its relation with urban geometry. After
explaining the characterization of urban geometry indicators, the UHI calculation
methods based on urban geometry are examined. A comparison between the different
methodologies is made to decide which calculation method to be used in this research.
Also, by means of a critical review of the previous studies, their methodologies has
been discussed to specify the major components of the proposed model.
In the following chapter, the model proposal for the mitigation of UHI effect is
introduced by defining computational framework of this study. Algorithmic setting of
analysis and simulation processes are given in detail along with the explanation of the
application on hypothetical urban canyon, which is defined as a basic unit of urban
surfaces, and characterizing urban areas by its repetition. For the demonstration of the
applicability of the proposed parametric model, and for the integration of parametric
modelling with urban design and urban planning practices, Chapter 4 gives the detail
of the application of this proposal on an actual urban context.

7
CHAPTER 2
URBAN HEAT ISLAND PHENOMENON
2.1. Definition of Urban Heat Island
Today, more than half of the world's population living in urban areas has been growing
more rapidly than the world population growth rate. Within the next two decades, the
growth rate of urban population, which is 1.8, is expected to double while the growth
rate of world population is 1 (UN, 2001).
According to the results of United Nation’s (2017) world population projection, the
world has roughly 7.6 billion inhabitants and it will reach 8.5 billion by the end of
2030. Estimations show that while the urban population will continue to increase from
54% to 60% by 2030, the rural population will gradually decrease. In developed
countries, the majority of the population (74%) lives in urban areas, so the growth rate
of these countries is expected to increase slowly rather than less developed countries
(UN, 2016).
Table 2.1: World’s population by size of settlement, 2016 and 2030 (Source: UN, 2016)
Number of
settlements
Population
(millions)
Percentage of
world population
Number of
settlements
Population
(millions)
Percentage of
world population
Urban .. 4034 54,5 .. 5058 60,0
10 million or more 31 500 6,8 41 430 8,7
5 to 10 million 45 308 4,2 63 434 5,2
1 to 5 million 436 861 11,6 558 1128 13,4
500.000 to 1 million 551 380 5,1 731 509 6,0
Fewer than 500.000 .. 1985 26,8 .. 2257 26,8
Rural .. 3371 45,5 .. 3367 40,0
2016 2030

8
As a result of the increase in population and urbanization, urban settlements have
expanded and sprawled on the outskirts of cities and thus, land use has changed.
Following this alteration, human activities and industrial developments increased
energy demand and fossil fuel consumption, which lead to production of waste and air
pollutants. The emissions of CO2 and greenhouse gases in the urban environment has
risen significantly between industrial revolution and modern period. By 2010, the
emission concentrations had risen from 260 ppm to 400 ppm (UN, 2011).
With regard to growth of the cities many problems emerged. To illustrate, air pollution
and global temperatures increased, approximately 50% of wetlands and forests of the
world were lost, many lands were altered to agriculture field, and many countries
destroyed their green areas for urban development (MEA, 2005). For instance, in New
York City, 20% of forestlands were eradicated because of increasing urban density
during the 1990s (Santamouris, 2004). Thus, urbanization became responsible for the
pressure on the environment and climatic conditions of Earth.
Urban areas dramatically affect not only global but also local climates. The expansion
of the boundaries of the urban areas on their environs causes modification on surface
cover of rural characteristics. In addition to the change of surface cover, such as
establishing impermeable surfaces instead of vegetation, increase in urban roughness
also affects the circulation of heat, water vapor and greenhouse gases, which leads to
climatic differences between urban areas and its surroundings (Yüksel, 2005).
Cities create new environmental conditions by changing the parts of nature where they
were located. They alter the geographical, ecological and atmospheric characteristics
of the region, so the city acquires its own, specific climatic environment which is called
‘Urban Microclimate’ (Akay, 1996). In other words, it can be defined as a shift from
natural environment to man-made environment.
As Givoni (1989) states,
“The climatic conditions in a man-made urban environment may differ appreciably
from those in the surrounding natural or rural environs.. each urban man-made

9
element: buildings, roads, parking areas, factories, etc.. creates around and above it
a modified climate with which it interacts.”
Urban microclimate, which is formed by the complexity of morphological conditions
of urban areas, influences temperature, air pressure, wind, humidity and precipitation
of the prevailing region climate (Yılmaz, 2013). Krusche et al. (1982) revealed that, in
urban areas, the average annual precipitation is 5-10% higher, humidity is 6% lower,
air temperature is 1-2°C warmer, wind speed is 20-30% lower, cloudiness is 5-10%
higher and level of atmospheric pollution is 10 or 25 times greater than their rural
surroundings (Yüksel, 2005). In addition, sunshine duration is 10-20% lower
(Landsberg, 1981).
The differentiation in air temperature, which can be observed as higher values in the
urban areas, has been the subject of many studies as an Urban Heat Island phenomenon
since it had negative impacts on thermal comfort and human health. In the 17th
century, the rise of health concern stemming from increase of heat and air pollution
conduced to detection of air temperature difference between urban and rural areas.
However, at the beginning of the 19th century, the need for observation and indication
of temperature and how it is affected by urban areas was brought up in a study by Luke
Howard. He recorded daily temperature data for more than two decades in urban and
rural areas of London and generated a basis for UHI definition from examination of
highest and lowest daily temperatures. Afterwards, he associated heat difference to
urban density by determining that densely located buildings are warmer than widely
spaced ones and revealed the spatial distribution and variation of temperature (Stewart,
2011).
The UHI studies spread from Europe to other regions of the world, such as North
America and Japan, following Howard’s findings. In fact, in the 1900s, the foremost
reason for disseminating heat island knowledge is the growth of urbanization. The shift
of the most of the world population to urban areas has raised the consciousness about
the effect of human being on climatic environment (Stewart, 2011). In other words,
the literature shifted its focus to the anthropogenic effects on heat island. For example,

10
Kalma (1974) developed a map of Sydney showing the spatial distribution of
anthropogenic heat flux.
In the modern period of UHI investigation, progress in understanding of heat island
formation provided by Oke’s studies. Oke (1988a) linked the magnitude of heat island
effect to the energy balance of urban areas, and improved the knowledge of the
association with the urban microclimate. He has also conducted numerous studies
about physical causes of the formation of UHI, and thus has correlated it to the urban
population, weather condition, thermal properties of surface materials and urban
canyon geometry. Following his studies, several researchers have contributed to the
field as providing estimation of heat island intensity and mitigation strategies for that.
As a result of all these studies, warmth characteristics of surface and air temperatures
in the environment are described according to urban areas and its surroundings. The
temperature difference between them is called as Urban Heat Island (UHI) intensity.
It has been explored in certain ways, such as thermal image capturing by remote
sensing, data collection from weather stations and ground-based measurements. In
urban areas, the mean air temperature is determined be minimum 1 to 3°C warmer than
suburban or rural areas, and it can be reach up to 10 - 12 degrees (EPA 2008; Oke,
1973). The magnitude of the heat island intensity may vary from to day/night time,
winter/summer period, tropical/arid climate or other weather conditions. Nevertheless,
the best time for the measurement is cloudless and calm sky conditions in the summer
period because of the warming effect of the solar radiation can be observed in
maximum level. For example, in Gothenburg, Sweden, the UHI effect was estimated
3.5°C in winter and 6°C in summer time (Santamouris et al., 2001). Oke and East
(1971) observed that nocturnal heat island intensity in Montreal, Canada was nearly
10.5°C. Sani (1973) also conducted a study for heat island effect of Kuala Lumpur in
different sky conditions, and found that the city was warmer 2 - 2.2°C in cloudy day,
but under clear sky it was close to 5°C.
11
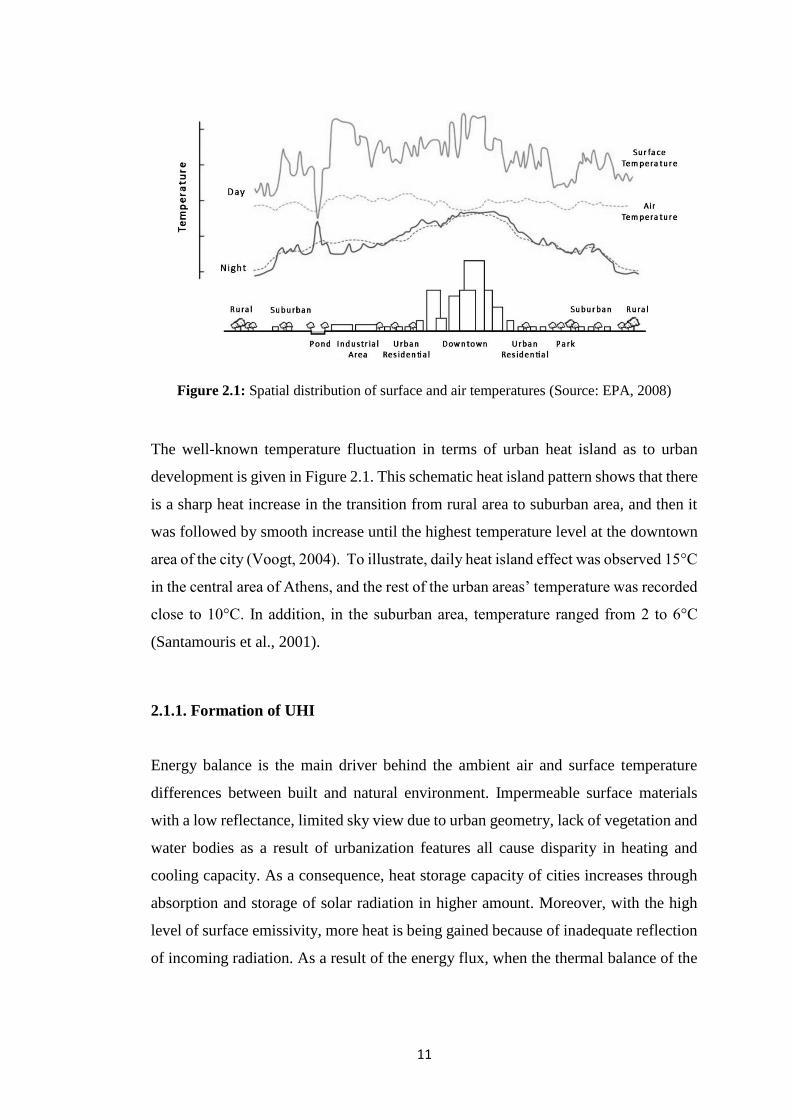
Figure 2.1: Spatial distribution of surface and air temperatures (Source: EPA, 2008)
The well-known temperature fluctuation in terms of urban heat island as to urban
development is given in Figure 2.1. This schematic heat island pattern shows that there
is a sharp heat increase in the transition from rural area to suburban area, and then it
was followed by smooth increase until the highest temperature level at the downtown
area of the city (Voogt, 2004). To illustrate, daily heat island effect was observed 15°C
in the central area of Athens, and the rest of the urban areas’ temperature was recorded
close to 10°C. In addition, in the suburban area, temperature ranged from 2 to 6°C
(Santamouris et al., 2001).
2.1.1. Formation of UHI
Energy balance is the main driver behind the ambient air and surface temperature
differences between built and natural environment. Impermeable surface materials
with a low reflectance, limited sky view due to urban geometry, lack of vegetation and
water bodies as a result of urbanization features all cause disparity in heating and
cooling capacity. As a consequence, heat storage capacity of cities increases through
absorption and storage of solar radiation in higher amount. Moreover, with the high
level of surface emissivity, more heat is being gained because of inadequate reflection
of incoming radiation. As a result of the energy flux, when the thermal balance of the

12
environment turns into positive, the heat of the environment increases and it conduces
to development of Urban Heat Island effect (Erell et al., 2011; Oke, 1988a;
Santamouris et al., 2001).
2.1.1.1. Physical Principles of Energy Balance
Principles of energy balance system are based on Thermodynamics Law (Ashrafizadeh
and Tan, 2018). In Einstein’s words, “Energy cannot be created or destroyed, it can
only be changed from one form to another.” It means that the incoming energy flux
can only be converted to outgoing energy and stored energy (Santamouris et al., 2001).
Energy input = Energy output + Energy storage
In the environment, energy is transferred from natural and artificial surfaces to the
atmosphere and vice versa (Oke, 1988a). Energy gains of surfaces consist of
absorption of both short-wave and long-wave radiation. Especially, from the short-
wave radiation, surface materials can get a huge amount of heat (Brunt, 1952; Tymkow
et al., 2013). However, it also depends on the ability of reflection. As seen in Figure
2.2, some of the rays from the sun are trapped and some are reflected. The less
reflection ratio becomes, the more absorption amount becomes. Thus, substances
warm up (Erell et al., 2011). According to the physics laws, when a substance heats
up, the ambient air temperature increases (Bergman et al., 2011). Higher air
temperature in the urban environment can be explained by overheated urban surfaces,
such as roofs, pavements and facades, causing heat transmission to the air (EPA, 2008).
2008).
Figure 2.2: Energy conversion system in the environment (Source: personal drawing)
13
As a result of increased warmth of surfaces, objects emit long-wave radiation which is
measured as a level of emissivity (Oke, 1988a). Warmer surfaces radiate more infrared
energy, which explains fundamentals of remote sensing (Mather and Koch, 2011; Oke,
1987). Infrared scanners on thermal remote sensors sense surface temperature
differences between urban and rural areas. Therefore, satellite images of cities have
been used to quantify surface UHI intensity (Dousset, 1992; Voogt and Oke, 2003).
Apart from energy gain, energy can be lost from surfaces via convection,
evapotranspiration and advection. Convection is a process of heat transmission
through flow of fluids from surfaces (Bejan, 2013). In urban areas, convective heat
transfer from impermeable and dry surfaces causes rising air temperature. However,
energy lost by evapotranspiration from moist surfaces does not result in more heat
increase (Erell et al., 2011). In evapotranspiration, vegetation areas use stored energy
to release heat in the form of water vapor (Suomi, 2014). Energy losses can also be
caused by advection, which is defined as horizontal air flow transporting heat or
moisture between different land covers (Erell et al., 2011; Santamouris et al., 2001).
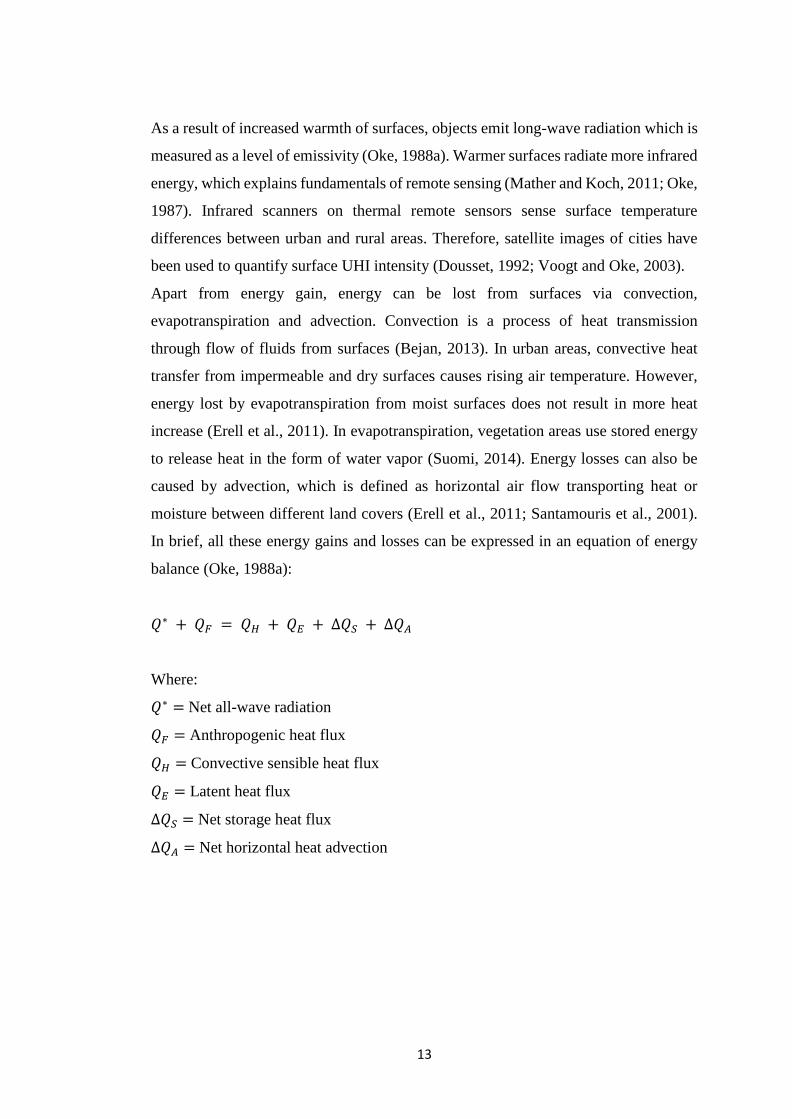
In brief, all these energy gains and losses can be expressed in an equation of energy
balance (Oke, 1988a):
𝑄∗ + 𝑄𝐹 = 𝑄𝐻 + 𝑄𝐸 + ∆𝑄𝑆 + ∆𝑄𝐴
Where:
𝑄∗ = Net all-wave radiation
𝑄𝐹 = Anthropogenic heat flux
𝑄𝐻 = Convective sensible heat flux
𝑄𝐸 = Latent heat flux
∆𝑄𝑆 = Net storage heat flux
∆𝑄𝐴 = Net horizontal heat advection

14
Figure 2.3: Schematic depiction of energy balance components (Source: Erell et al., 2011)
Figure 2.3 illustrates energy balance is provided by the transfer of its components
between urban surfaces and different layers of the atmosphere. Oke (1976) classified
them into two main layers in relation to different types of UHI formation. Firstly,
Urban Canopy Layer (UCL), which is observed between the buildings and limited by
their heights. Secondly, Urban Boundary Layer (UBL), which extends from the top of
the UCL to a distance where urban areas effects cannot be perceived. Due to spatial
variations of urban surfaces, wide spectrum of energy fluxes occur above UCL (Oke,
1988a).
In detail, net radiation (𝑄∗) is comprised of subtraction of emitted radiation from the
sum of received solar radiation. Thus, the amount of net radiation depends on thermal
properties of surface materials (Erell et al., 2011; Santamouris et al., 2001). In addition
to radiation-caused heat, human activities also contribute as anthropogenic heat flux
(𝑄𝐹) to warm up. It can be quantified by per capita energy consumption (Oke, 1988a).
In general, the role of anthropogenic heat and net horizontal heat advection (∆𝑄𝐴) are
considered negligible in the calculation of energy balance (Cleugh and Oke, 1986).
Convective sensible heat flux (𝑄𝐻) and latent heat flux (𝑄𝐸) are most significant
components of energy balance in respect of UHI development. Sensible heat is

15
convection process from dry urban surfaces (concrete buildings, asphalt pavements,
etc.) to the atmosphere when they have temperature differences between them. In built-
up areas, absorbed radiation is converted to sensible heat because of limited
evaporation surfaces that results in air temperature increases. On the contrary, moist
urban surfaces, such as vegetated and irrigated lands, convert energy as latent heat
through evapotranspiration (Erell et al., 2011; Oke, 1988a; Pearlmutter et al., 2009).
Oke et al. (1999) have demonstrated that latent heat composed only 4% of the net
radiation in central area of Mexico City. Nonetheless, 58% of the net radiation is stored
as heat by urban fabric, and remain amount, which is 38%, is released as sensible heat
due to lack of available moisture. Therefore, the equilibrium between sensible heat and
latent heat fluxes depends on permeability and humidity of urban environment.
Additionally, another important component is net storage heat flux (∆𝑄𝑆), which is
storage of surplus energy as heat by urban fabric during daytime (Erell et al., 2011).
The high level of storage heat is based on surface types and their thermal properties.
For example, the heat storage capacity of impervious surfaces, such as pavements, is
higher than green spaces’ capacity (Grimmond and Oke, 2002). Such surfaces trap
energy easily all day and store them. They have small changes in their surface
temperatures during night, so the heat is maintained (Oke, 1988a).
2.1.1.2. Energy Balance Differences between Urban and Rural Areas
Energy balance of urban areas differentiates from rural areas because of the impacts
of urban development on energy fluxes. Due to low evaporation rates and high level
of absorption by impermeable surfaces, different amount of energy fluxes, such as
sensible heat flux, latent heat flux and storage heat flux, have emerged (Cleugh and
Oke, 1986; Oke, 1988a; Santamouris et al., 2001). For instance, heat storage flux,
which is a significant indicator about air temperature, was observed in a rural area as
one-third of an urban area. Nevertheless, the amount of latent heat of rural area was
indicated three times as high as urban area (Suomi, 2014).

16
In addition, energy fluxes not only differentiate between urban and rural areas but also
can vary according to land use. In urban centers, particularly, heat release slows down,
energy lost cannot occur in a significant level, and then heat goes up. As Clarke et al.
(1982) state, sensible heat shows an increase from approximately 140-150 𝑊/𝑚2 for
a rural area to 200 𝑊/𝑚2 for an urban residential area and to 300 𝑊/𝑚2 an urban
commercial area, which is the most built-up site. As a result of these changes in energy
fluxes, air temperature becomes higher in urban areas rather than rural areas so all
cause UHI formation.
Temperature differences between urban and rural areas can be explained by two main
reasons for improving better understanding of UHI development. Firstly the type and
amount of energy transfer from surfaces can change depending on land cover,
permeability of surfaces, availability of moisture, urban geometry and thermal
properties of urban surfaces. Despite the fact that both urban and rural areas receive
the same amount of solar radiation, urban areas store higher amount of heat while rural
areas release higher amount of latent heat (Erell et al., 2011; Santamouris et al., 2001).
Cleugh and Oke (1986) have demonstrated that rural and suburban areas have different
energy flux densities between them. As seen in Figure 2.4, the net radiation gain of
suburban area is greater than rural. The reason is that natural surfaces of rural area
release latent heat and sensible heat instead of storing energy as heat. On the contrary,
in suburban area, buildings and other dry surfaces store huge amount of heat.
Therefore, air temperature can be sensed higher in suburban area.

17
Figure 2.4: Energy balance of rural and suburban areas (Source: Cleugh and Oke, 1986)
On the other hand, the second reason is based on energy transfer speed. In other words,
urban and rural areas have different heating and cooling rates because of their surface
varieties (Oke, 1982; Yılmaz, 2013). In general, during daytime, urban surfaces store
huge amount of heat and release sensible heat. It can be considered as positive net
radiation. After sunset, surfaces started to reach a balance with storage heat loss, and
it goes on during a night. Day after, energy balance become positive again with
recharging of heat storage (Erell et al., 2011). The important thing in energy transfer
process is to cool of surfaces in a short time before heat gain in the next morning.
Oke (1982) have shown that the foremost reason for increasing air temperature in
urban areas is that rural areas cool faster than urban areas. In the afternoon, the heat

18
balance between urban and rural areas seems steady as given in Figure 2.5. As the
sun’s effect decreases, rural area is cooling down when urban area preserves its
warmth. After, both areas continue to release heat during night but they have maximum
temperature difference at that time, which is called UHI intensity (∆𝑇𝑢−𝑟). In fact,
nighttime formed UHI intensity is known as nocturnal UHI.
Figure 2.5: Daily heating/cooling rates and air temperature changes in urban and rural areas
(Source: Oke, 1982)
2.1.2. Causes of UHI
In the formation of UHI, changes in the thermal balance of the environment can be
defined as the main influential factor. The magnitude of the heat island intensity may
vary to the climate, geographic location and urban layout of the cities. In particular,
outcomes of the urbanization, such as densely built-up areas, radiative urban geometry,
increased human activities due to population growth, anthropogenic heat release via
energy consumption, the replacement of natural ground coverages by low reflective
surfaces, demolition of moist surfaces or vegetation areas, and reduced wind speed
within the streets, cause temperature increase and make cities warmer than their

19
surroundings. These modifications in urban areas create complex radiation exchange
between the surfaces and the atmosphere, and thus contribute to more intensive heat
island effect (EPA, 2008; Oke et al., 1991; Santamouris et al., 2001).
2.1.2.1. Urban Population
The growth of urban population leads to increase in the air temperature due to dense
urban areas and surface materials of built-up areas (Oke, 1976). Therefore, population
size is used as a criterion to determine heat island effect. Many studies examined the
effect of population on the magnitude of UHI. According to Chandler (1964), a relation
between them does not exist. However, Sundborg (1950) demonstrated a relevance for
the first time (Oke, 1973). Because of certain limitations of Sundborg’s model, Oke’s
proposal has been the most well-known model.
Oke (1973) established a strong correlation between the logarithm of the population
and temperature differences for North American and European cities. Minimal
temperature increase, which is at least 1 degree, was observed even in 1000 habitant
villages. This increase may further was recorded to be as high as 12°C depending on
the growth of population size. According to these observations, new equations were
formulated for calculation of the UHI intensity for different regions.
The equation for North American cities is as follows:
∆𝑇𝑢−𝑟 = 2.96 log 𝑃 − 6.41
The equation for European cities is as follows:
∆𝑇𝑢−𝑟 = 2.01 log 𝑃 − 4.06

20
Figure 2.6: The relation between UHI intensity (∆𝑇𝑢−𝑟(𝑚𝑎𝑥)) and population (log P) for North
American (a) and European (b) cities (Source: Oke, 1973)
2.1.2.2. Urban Geometry
Urban geometry is defined as one of the most important reasons for the development
of heat island effect. In particular, form, location, orientation, height of the buildings
and spaces between them are the main parameters of the urban geometry. It has also
been characterized by the repetition of urban canyons, which are consist of horizontal
and vertical elements of urban fabric. Such building implementations as an
urbanization features are responsible for the alteration both on the microclimate and

21
the energy balance of the environment.
Urban canyon is recognized as a basic unit of urban surfaces, and thus it has been the
subject of numerous studies. The energy balance of urban canyons, which consist of
building surfaces, canyon floor and the air volume between the buildings, is mainly
influenced by its own geometry. As the depth of the urban canyon (length of the
canyon and height of the buildings) has changed, energy fluxes on the surfaces directly
affect the air temperature in the canyon (Nunez and Oke, 1977; Santamouris et al.,
2001). Therefore, heat island intensity is getting greater with the repetition of this
effect throughout the city. For the first time, Nunez and Oke (1977) evaluated a model
of energy balance in the urban canyon and its formulation as a result of the
measurement on an experimental canyon during a summer period in Vancouver.
According to this measurement, the main influential factors on the heat gain are found
as canyon geometry and canyon orientation.
The energy balance of an urban canyon is written as:
𝑄∗ = 𝑄𝐻 + 𝑄𝐸 + 𝑄𝐺
Where:
𝑄∗ = Net all-wave radiation flux (𝑊/𝑚2)
𝑄𝐻 = Sensible heat flux to the air (𝑊/𝑚2)
𝑄𝐸 = Latent heat flux (𝑊/𝑚2)
𝑄𝐺 = Subsurface heat flux (𝑊/𝑚2)
The ratio between the main parameters of urban canyon that mentioned before as
height (H), width (W) and length (L) are defined to determine the depth level of the
canyon. To illustrate, a shallow canyon is considered as below 0.5 H/W ratio while a
deep canyon has H/W ratio over 2. In addition, length of the canyons are also defined
with the use of L/H ratio (Bakarman and Chang, 2015; Shishegar, 2013).

22
Figure 2.7: Schematic depiction of an urban canyon (Source: Nunez and Oke, 1977)
Many studies clearly showed that the surface temperature is the urban canyon is higher
by 10-13°C than the air temperature. Moreover, the air volume inside the canyon have
greater temperature compared to the air flow, which has unchanged wind speed by any
obstruction, above the canyon. During the day-time, net radiation balance of an urban
canyon becomes positive so the air in the canyon is warmed up. Additionally, due to
the geometry of the canyon limited sky view and heat release through emissivity, a
remarkable heat loss cannot occur. As the canyon gets deeper, the rate of heat loss is
slower, and the air temperature is sensed higher (Santamouris et al., 2001). According
to Pearlmutter’s (2009) study, when the canyon depth is doubled (from single building
height to double height), density of net radiation flux (𝑄∗) is increased by 50 𝑊/𝑚2
showing that heat is stored in there.
In general, the effect of urban geometry on the magnitude of UHI effect can be
explained by two main reasons. Firstly, high amount of absorbed radiation by urban
structures causes rise in the air temperature. Increased irradiated surface area,
configuration of buildings and rugosity of roof level have a significant impact on that
increase. Before urban development, surfaces were exposed to the same amount of
solar radiation, and they could directly reflect the incoming rays. However, addition
of new horizontal and vertical surfaces in urban areas, such as building walls and roofs,
total surface area was increased. Their warming effect is exponentially greater because
of that surfaces trap not only incoming short-wave radiation from the atmosphere but
also reflected radiation from building surfaces. This transition of radiation between

23
buildings is called as multiple reflection, which is mainly caused by configuration of
buildings. In built-up areas, when high-rise buildings are located too close to each other
or deeper canyons are arranged, reflected incoming radiation is absorbed again and
again by building surfaces instead of released to the atmosphere as seen in Figure 2.8
(Erell et al., 2011; Yılmaz, 2013).
Figure 2.8: The reflection of incoming radiation from different surfaces (Source: personal
drawing)
On the other hand, created various heights by buildings increase the roughness of urban
surfaces that result in high level of absorption. To avoid interception of reflection by
another facade, uniformity of roof level should be provided like North African cities
with same height buildings and flat roof level. In brief, all these multiple reflections
and absorptions result in an increase in both surface temperature of the buildings and
air temperature between them (Erell et al., 2011).
Secondly, another impact of urban geometry is that weakened ventilation throughout
canyons. In heat island studies, the continuity of prevailing wind for providing heat
extraction or advection from canyons has gained importance. Generally, wind has a
certain speed and flow pattern over the terrain until it encounters with an urban
structure. Any change in an urban canyon, such as alteration in building height or street
width, causes extreme modifications in the direction and cooling effect of the air flow
(Santamouris et al., 2001; Shishegar, 2013). To ensure the cooling effect, Oke (1988b)
has specified threshold wind speeds for different air flow patterns, which are
characterized by H/W ratios. The velocity inside the canyon should be higher than the
threshold value that is calculated approximately between 1.5-2 m/s for medium

24
(H/W<2) canyons. Many investigations with the use of air flow simulations or field
measurements demonstrated that the wind speed is significantly decreased in the
deeper canyons. Even shallow canyons have a negative impact on that.
Moreover, the importance of wind direction that can be parallel or perpendicular to the
canyon is established by many studies. For instance, Arkon and Özkol (2013) have
estimated that perpendicular wind angle to the canyon axis caused 3 m/s decrease in
the velocity. According to Priyadarsini and Wong’s (2006) parametric study on the
modification of urban geometry and air flow, when high-rise buildings were located
strategically, the temperature decreased by 1°C with parallel air flow and 90% increase
in the velocity. For perpendicular flow, the velocity was also increase and the air
temperature decreased by 1.1°C in an urban canyon which has a larger H/W ratio.
2.1.2.3. Thermal Properties of Urban Surfaces
Thermal properties of urban surface coverages are differentiated from rural ground
coverages. In fact, surface materials are characterized by their heating and cooling
capacity, thermal conductivity, emissivity and reflectivity due to their impact on
energy balance of the environment. The reflectivity of incoming solar radiation of
surfaces, which is called albedo, is one of the most important consideration in heat
island studies. All these thermal properties have an influential role in the formation of
surface temperature. Higher surface temperatures are responsible for the increase in
the air temperature and UHI effect because of the use of inappropriate materials in
urban areas (EPA, 2008; Santamouris et al., 2001; Erell et al., 2011).
One of the thermal characteristics of surface materials is defined as thermal
conductivity, which is an amount of energy that substances can store during daytime.
The level of thermal conductivity determines heating or cooling capacities of surfaces
(Oke, 1987). The combination of thermal conductivity and heating capacity of
materials constitute a measure of thermal admittance showing the reaction of surfaces
to the incoming radiation. Materials with high level thermal admittance denote small
changes in their surface temperature because of the heat is stored by the substances

25
(Oke, 1988). In brief urban surfaces have high level of thermal
conductivity/admittance than rural areas that indicates the reason of the air and surface
temperature differences between them. Another thermal property is the level of
emissivity that taken into less consideration due to it has smaller impact on heat island
intensity than other parameters (Santamouris et al., 2001). Oke et al. (1991)
demonstrated that increase of emissivity level from 0.85 to 0.1 results in 0.4°C increase
in the UHI development. Unlike this effect, differentiated thermal admittance of urban
and rural surfaces causes 2°C increase in the heat island intensity.
Apart from other thermal parameters, the albedo of artificial and natural materials
influences their energy fluxes according to reflectivity levels (Erell et al., 2011).
Albedo can be defined as a fraction indicating that the reflectance of solar radiation
from surface to the atmosphere. Due to the main forces behind the energy balance in
the environment is amount of absorption or reflection of solar radiation, any small
changes in albedo value can alter the heat balance (Banihashemi, 1995). As the albedo
increases, the reflectivity increases, and thus the surface is not overheated. It means
that lower surface temperatures caused by higher albedo values.
The albedo value is within a range of 0 to 1, where represent all incoming solar
radiation is absorbed whereas 1 means that radiation is completely reflected. In other
words, these values denote black and white colors, respectively. (Şimşek, 2013;
Banihashemi, 1995). Because of that albedo and surface temperature may vary in a
wide range when surface coverages are in different colors, for example, white facades
were found to be 3°C colder than the other different colored facades (Parker and
Barkaszi, 1997). Taha et al. (1992) documented a report about albedo values and
temperatures in different surface materials in summer period. They found that white
covered surface has an albedo of 0.72 is 45°C cooler than black covered one, which
has an albedo close to 0.08. Moreover, another white surface (0.62 albedo) is just 5°C
warmer than ambient air temperature while darker surface (0.09 albedo) is 30°C
warmer.
Many investigations are conducted about the range of albedo values in relation to air

26
and surface temperatures, and their main focus was on the pavement and roof
materials. Table 2.2 gives compiled results of studies about albedo values of different
materials and ground coverages in urban areas. Accordingly, conventional paving
materials have an albedo of 0.05 to 0.35 (asphalt and concrete) so it means that they
can reflect only 5 - 35% incoming radiation. However, their reflectivity can change by
turning lighter color overtime because of the weather condition or pollution (EPA,
2012). In addition, the surface temperature of asphalts is measured 5-8°C higher than
other pavement materials, such as concrete and slab (Asaeda et al., 1996; Santamouris
et al., 2001).
Table 2.2: Albedo values of surface materials (Source: Santamouris et al., 2001)
To increase reflectivity and thermal performance of roof surfaces, light colored tints
are tended to use as roof coatings. Thus, albedo of conventional roofs can be increased
from 0.2 to 0.7, and its temperature can be reduced by a significant amount (Akbari et
al., 2006). To quantify surface temperatures of different colored coatings, Backenstow
(1987) measured panels’ heat under clear and cloudy sky conditions. As a result of that
the highest temperature is determined for black colored (70°C) in high heat absorption
day, which is a cloudless day. As given in Figure 2.9, surface temperature of darker
panel is followed by beige and white colored surfaces that are approximately 55°C and
40°C, respectively. Despite the reduction in the amount of incoming radiation due to
weather conditions, both measurements show that grey or black surfaces have always
higher temperatures than lighter colored ones (Taha et al., 1992; Santamouris et al.,
2001).
Surface Albedo Surface Albedo
Asphalt (fresh) 0.05 - (aged) 0.2 White 0.50-0.90
Concrete 0.10-0.35 Red, brown, green 0.20-0.35
Whitewashed stone 0.80 Black 0.02-0.15
Light-colored brick 0.30-0.50
Red brick 0.20-0.30 Light-colored sand 0.40-0.60
Dark brick 0.20 Dry sand 0.20-0.30
Limestone 0.30-0.45 Wet sand 0.10-0.20
Dark cultivated soils 0.07-0.10
Tile 0.10-0.35 Deciduous plants 0.20-0.30
Slate 0.10 Grass and leaf mulch 0.05
Corrugated iron 0.10-0.16 Dry grass 0.30
Higly reflective roof 0.6-0.7 Wood (oak) 0.10
Pavements Paints
Roofs
Ground coverages

27
Figure 2.9: Daily surface temperatures of different colored panels (Source: Taha et al., 1992)
In many research, the mean albedo values of urban and rural areas were measured by
remote sensing correspondingly heat island effect, instead of measuring one by one
surface materials of albedo. For example, urban areas have nearly 0.14 albedo because
of the domination of darker surfaces compared to rural areas, which have 0.05 lower
value. Moreover, American, European and North African cities have different albedo
values according to their density, urban geometry and roof color. In general, American
and European cities are tend to use dark colored roofs so their albedo in within a range
of 0.10-0.20. On the contrary, dense, low-rise and white colored buildings/roofs with
African cities have change in 0.30-0.45 (Taha, 1997; Erell et al., 2011).
2.1.2.4. Lack of Vegetation Areas
Green areas have a significant role as a natural cooling mechanism in the urban
environment. They contribute to creating lower temperatures through evaporative heat
loss. However, in urban areas, vegetation areas are considerably reduced because of
the replacement of natural surfaces by artificial ones. Undoubtedly, urban areas can be
considered as dry fields due to domination of concrete buildings and asphalt
pavements. In the absence of vegetation areas, urban surfaces exhibit moisture-
reducing characteristics. As a consequence, diminished latent heat release by moist
surfaces induce UHI development (Akbari et al., 1992; Sailor, 1994; Santamouris et
28
al., 2001; Erell et al., 2011).
The effect of vegetation areas on air and surface temperatures is related to the energy
balance of the environment, and is compound of two main causes. One of them is that
they reduce penetration of incoming solar radiation to surfaces by shading. In other
words, they provide solar protection to areas and prevent surface heating during
summer period (Santamouris et al., 2001). Otherwise, radiation can be absorbed by
surfaces, and thus it contributes to the increase of air temperature by releasing sensible
heat, instead of absorbed by trees (Erell et al., 2011). Another reason is based on energy
transfer to the latent heat flux by evapotranspiration. In vegetated surfaces, high level
of evaporative cooling effect causes an increase in the release of latent heat while
decreasing sensible heat (Santamouris et al., 2001; Akbari et al., 1992).
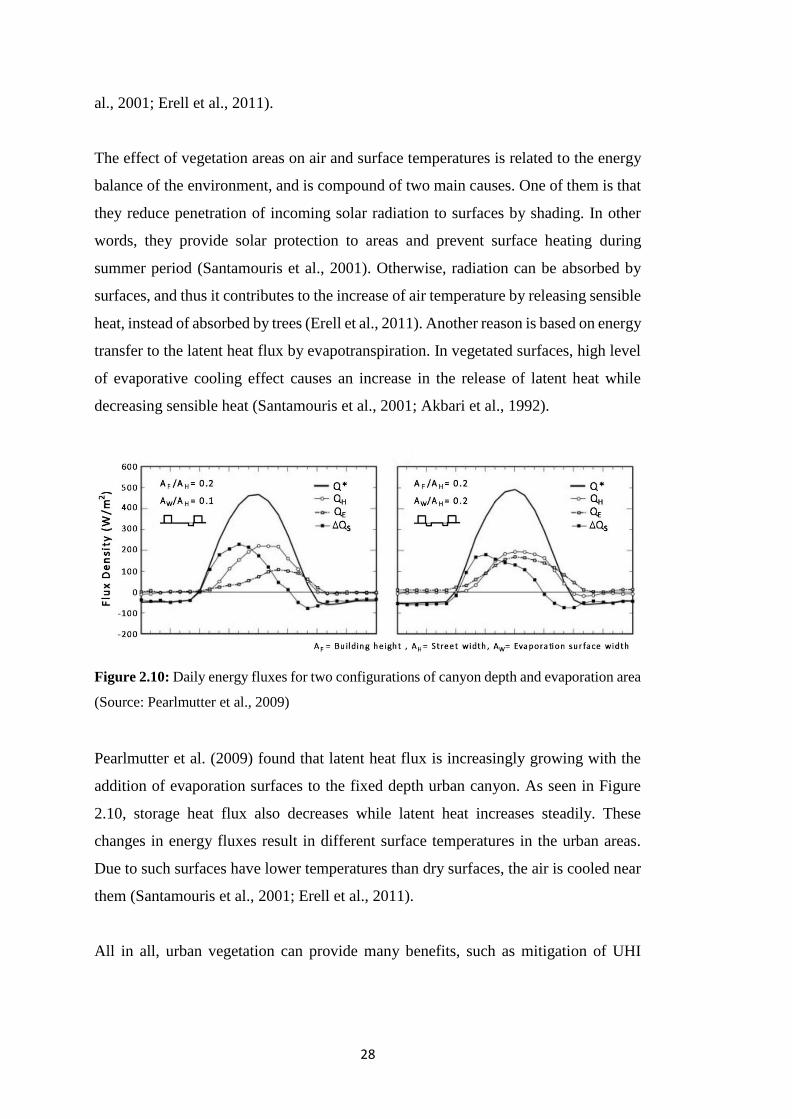
Figure 2.10: Daily energy fluxes for two configurations of canyon depth and evaporation area
(Source: Pearlmutter et al., 2009)
Pearlmutter et al. (2009) found that latent heat flux is increasingly growing with the
addition of evaporation surfaces to the fixed depth urban canyon. As seen in Figure
2.10, storage heat flux also decreases while latent heat increases steadily. These
changes in energy fluxes result in different surface temperatures in the urban areas.
Due to such surfaces have lower temperatures than dry surfaces, the air is cooled near
them (Santamouris et al., 2001; Erell et al., 2011).
All in all, urban vegetation can provide many benefits, such as mitigation of UHI

29
effect, reducement of energy demand for cooling and improvement of air quality
(Sailor, 1994; Erell et al., 2011). Many studies have been performed about the cooling
effect of vegetation and have shown that, in urban areas, parks are generally 2-8°C
cooler than their surroundings (Duckworth and Sandberg, 1954; Huang et al., 1990;
Akbari et al., 1992; Taha et al., 1991). For instance, in Montreal, urban parks have
2.5°C lower temperature than nearby areas (Santamouris et al., 2001). Moreover,
Alavipanah et al. (2015) identified remarkable cooling effect according to proportion
of vegetation cover which is between 70-80% per square kilometer. The temperature
difference between vegetation areas and fully covered (100%) built-up areas is
observed 4.5°C in 2012. In another study, shading and evaporative cooling effects of
trees on temperature reduction are calculated by computer simulations. In these
simulations, which are shown in Figure 2.11, tree coverage is increased by 10% and
25%, and thus decrease in temperature in Sacramento is estimated approximately 2-5
°C (Akbari et al., 1992).
Figure 2.11: Temperature reductions in Sacramento and Phoenix with additional tree cover in
summer period (Source: Akbari et al., 1992)
In addition, the magnitude of the cooling effect of green areas generally depends on
plants type, vegetated field size and its location. Their effect on air temperature can be
observed from nearest plot area to wider urban areas within the framework of UHI
effect. According to Jauregui (1990), the cooling effect of an urban park in Mexico,
with an area of 500 ha, has an impact on city-scale which is about 2 km. However,

30
Honjo and Takakura (1991) reported that when the wind speed is weak, cool air can
only be perceived up to 300 m. Similarly, Takebayashi (2017) conducted a study about
a measurement of the change in air temperature in regard to distances from vegetation
areas. Estimations show that the range of rise in the air temperature is related to both
distance and wind speed. As shown in Figure 2.12, the most significant rise in air
temperature is occurred in the lowest wind speed in spite of being close to the
vegetation area. Furthermore, the increase in ambient air temperature of urban areas
has become stable when the distance from the green area is more than 30 meters.
Figure 2.12: The rise in air temperature in proportion to the distance from green area during
day-time and night-time (Source: Takebayashi, 2017)
According to Bilgili (2009), when the park sizes are similar, their cooling distances
may vary according to the plant types. As a result of his research on cooling effects of
green areas in Ankara, he found that the cooling effect from Kurtuluş Park reached
about 200 meters, while Gençlik Park was limited to a distance of 50 meters. Although
the vegetation areas are spatially equivalent in both parks, types of plants are
differently arranged. While Kurtuluş Park is composed of broadleaf tall trees, Gençlik
Park is dominated by grasses, which have reduced cooling distances than tree canopies.
As Shahidan (2011) reported, tree density have an influence on microclimate and
thermal balance of the surrounding urban environment. Instead of small green areas
and grasslands, the variation of tree canopies can create different and effective cooling
distances.
Apart from urban parks, in local scale, green roofs also have an impact on UHI

31
mitigation. Green roofs are used to reduce heat storage instead of standard roofing
materials. For instance, a mesoscale modeling of green roof indicates that the ambient
air temperature, which is reached 30°C on a hot summer day, is lowered by 1°C
through reduced sensible heat flux by 52% compared to the darker roof (Scherba,
2011). Conventional roof surfaces with low reflectivity can heat to 65°, while the air
temperature reaches 35° during the summer (Karaosman, 2006). These roofs are
always warmer than ambient air temperature in their environment. In contrast to that,
green roofs can prevent air and roof surfaces from getting warmed by providing
moisture balance. In other words, they provide protection against overheating, and thus
the heat transfer between outside and interior of the building is delayed. Therefore,
they can be considered as an increased vegetation areas in urban areas that helps to
reduce heat island effect (Zareiyan, 2011).
2.1.2.5. Anthropogenic Heat Release
Urbanization is responsible for artificial heat release due to energy demand of human
activities. The magnitude of anthropogenic heat release mainly related to heating or
cooling of buildings, industrial activities, fuel combustion from vehicles (or in general,
transportation system) and human metabolism, which is considered less important
(Oke, 1988; Santamouris et al., 2001; Erell et al., 2011). The heat release from these
sources in urban areas contributes to increase in air temperature and UHI effect. Taha
(1997) estimated that anthropogenic heat can increase UHI intensity by 2-3 degrees.
To quantify anthropogenic heat release, population density or energy consumption
data of building sector or transportation system are regarded. In comparison of energy
usage in Seoul, Incheon and Gyeonggi, Lee et al. (2008) found that anthropogenic heat
fluxes are 55, 53, and 28 W m−2, respectively. Moreover, it depends on climate zones
and spatial organization of cities. Firstly, climate zones play a determinant role in
energy consumption. Anthropogenic heat varies dramatically between low-latitude
and mid-latitude cities because of their warm and cold seasons are completely different
from each other (Suomi, 2014; Heiple, 2007; Chrysoulakis and Grimmond, 2016). In
low-latitude zone, tropical and arid climates prevail in cities where warm weather is

32
sensed all months (Money, 2000). Such cities have largest anthropogenic heat release
in summer due to exceeded cooling need or their magnitude can remain in high level
throughout the year (Suomi, 2014; Quah and Roth, 2012). Nevertheless, in mid-
latitude cities, which are dominated by cold winter, increased heating demand that
causes greater amount of anthropogenic heat rather than cooling demand in summer
for the same city (Sailor and Lu, 2004). To illustrate, the anthropogenic heat rates in
US cities in the summer and winter seasons are estimated 20-40 W/m and 70-210 W/m,
respectively (Hosler and Landsberg, 1977).
In brief, largest anthropogenic heat values can be defined differently as wintertime or
summertime fluxes according to cities. Apart from climate conditions, another factor
is associated with urban land-use distribution. In general, anthropogenic heat release
is observed dramatically high level in the city centers, and it gradually decreases to the
outskirts of the city. For instance, in London, heat flux exceed 400 W/m2 in the city
center, but in the fringe of the city the value is estimated 60 W/m2. Additionally, the
impact of anthropogenic heat on UHI is quantified in central London 1-1.5°C for
different seasons (Bohnenstengel et al., 2014). According to Cao et al. (2018), highest
daily temperatures in the downtown of Guangzhou City in China caused by
anthropogenic heat release which is more remarkable in high density residential area,
and it is followed by commercial/industrial area and lastly low density residential area.
On the contrary, in Singapore, estimation results of anthropogenic heat variability in
common land use types show that commercial area has the most significant
anthropogenic heat flux. The maximum values of commercial area, high density
residential area and low density residential area are measured around 113 W7m2,
17W/m2 and 13 W/m2, respectively. In addition, because of the cooling demand, the
major source of heat flux is determined as buildings in each area (Quah and Roth,
2012).
2.1.3. Negative Impacts of UHI and Need For Mitigation
The development of larger heat island intensity, due to growth of urban density,
unsustainable urban development, and release of human related heat and greenhouse

33
gas emissions to the atmosphere from urban areas, causes climate modifications from
local to global scale. At least 1°C rise in air temperature of cities has a knock-on effect
on the global warming. In fact, this warming trend has negative impacts on the
environment both ecological and economical, and on the human health. In particular,
high temperatures in urban areas are responsible for the increase in energy
consumption, air pollution and for the decrease in thermal comfort in public space.
Moreover, it poses a risk for human health because of the respiratory effects of air
pollutants and morbidity or mortality risks of extreme heat waves. Therefore,
mitigation of UHI effect should be taken into consideration as a necessity for the
community well-being (Erell et al., 2011; Santamouris et al., 2001; Shahmohamadi et
al., 2010).
One of the negative effects of the UHI is that higher urban temperatures exacerbate
energy consumption due to their effect on outdoor conditions influence the indoor
climate, especially in the summer period of hot climates. Although, in hot-arid
climates, heat island intensity reduces energy demand for heating in winter seasons,
cooling demand induces more energy consumption in summer (Santamouris et al.,
2001; Wong and Chen, 2009). On the contrary, as a result of a climatic simulation that
shows changes in heating and cooling energy demands for European cities to increase
in the global warming by 2°C, the electricity consumption for heating will be reduced
up to 5.2%. Because of the domination of continental climate in Northern Europe
countries, heating demand is more than the need for cooling in there (Damm et al.,
2017). Moreover, in tropical climates, the magnitude of heat island and the amount of
building energy consumption are crucial concerns because of the cooling demand
continues throughout the year (Wong and Chen, 2009). Typical building energy
consumptions in tropical climates were estimated that the most dominant was air
conditioning, which comprised of 56% of the total consumption (Katili et al., 2015).
In addition, Tham (1993) demonstrated that a reduction of 2°C with air conditioning
in the building, in Singapore, caused 11.8 % more energy consumption. As a result of
the development of UHI effect, increased cooling demand requires more energy
production, which has several side effects, such as higher energy cost, thermal
pollution and toxic gas emission from power plants (Arnab et al., 2013).

34
Another negative impact is that increased air temperatures influence concentration and
dispersion of air pollution. While pollutants are released from combustion of fossil
fuels, power plants and industrial activities, warm air accelerates photochemical
reactions between them. Once these reactions occur, they tend to be trigger for more
reactions, to contribute to the formation of smog, to increase ozone concentration and
heat intensify. Therefore, higher air temperatures and air pollutions can aggravate each
other (Santamouris et al., 2001; Wong and Chen, 2009). Besides that, release of
emissions to generate electricity is the major problem for the environment and human
health. The main emissions are carbon dioxide, carbon monoxides, nitrogen oxides,
sulphur dioxide, etc. are considered to increase greenhouse gas effect and global
warming (Arnab et al., 2013). They can also directly affect human health through
respiration. For instance, according to a study about the relation between air pollution
and patient registration in Athens, it was found that when the air pollution increased
three times, the number of patients who applied for respiratory disorders doubled
(Santamouris et al., 2001).
In addition to health problems related to air pollution, the magnitude of UHI can lead
to heat-stress injuries and heat related mortalities. Several studies have focused on heat
related mortality with few cases. One of them is that heat-related deaths in summer
period of 1999 in Chicago were associated with risk factors, and it was found that 47%
of them were over 65 years and most of them were living alone (Naughton et al., 2002).
In France, 2003, the extremely hot summer caused a dramatic increase in mortality.
Fouillet et al. (2006) reported that deaths were directly related to heat wave, and also
respiratory and cardiovascular disorders conduced to a high death rate. Moreover,
Stafoggia et al. (2006) compared mortality datasets from hospital to meteorological
data (temperature and humidity) and documented that heat waves increased the risk of
mortality by 34% in Italy.
Because of all these negative effects, the UHI intensity should necessarily mitigated,
especially both in hot-rid and tropical climates. Reducement of surface and air
temperatures in urban areas may provide many benefits to the entire community, such
as saving in electricity consumption with reducement of cooling demand, decrease in

35
smog accumulation and decrease in the risk of heat related diseases and deaths. The
mitigation of heat island effect can also provide enhancement of thermal comfort in
open urban spaces that may attract more people to use and get social interaction with
each other.
2.2. The Relation between UHI and Urban Geometry
Urban geometry has a certain effect on the urban microclimate and on the development
of the UHI intensity. During a day, incoming short-wave radiation is absorbed by urban
structures and stored as heat in them. After the sunset, daytime warmed up urban
surfaces start to emit long-wave radiation and to release heat during a night. However,
urban geometry have a crucial role in the heat loss rate of the gained heat. When the
components of urban canyon geometry (building height, street width, etc.) generate
deep canyons, sky view becomes limited, and thus radiation loss occurs lower than
open spaces. In other words, as a result of restricted long-wave radiation and heat loss
by 3D geometrical configuration of urban fabric, residual heat contributes to the
formation of nocturnal heat island (Hammerle et al., 2011a; Lopez et al., 2016; Oke,
1981; Unger, 2009). Therefore, these energy exchanges can be linked to the variables
of urban canyons, and canyon geometry can be characterized by three main indicators,
which have been demonstrated to have a significant impact on the UHI by several
studies, that are aspect ratio, sky view factor and building orientation.
2.2.1. Characterizing Indicators of Urban Geometry
2.2.1.1. Aspect Ratio (H/W)
Among many factors that induce to the UHI development, one of the most important
causes is urban geometry is mainly measured by the aspect ratio. Because of urban
canyons are composed of building blocks and linear spaces (streets) between them,
aspect ratio of a canyon, or in other words, building height to street width (H/W) ratio
has been found to be a significant factor contributing to UHI intensity (Bakarman and

36
Chang, 2015; Takkanon, 2016).
In heat island studies, three-dimensional urban geometry data are transformed to the
two-dimensional sections to calculate H/W ratio. For symmetrical canyons, only the
ratio of mean building height to the street width is considered, but length of the
building should be regarded for the evaluation of asymmetrical canyons (Goh and
Chang, 1999; Takkanon, 2016). The calculations of H/W ratio for different canyon
configurations are given in Figure 2.13-15.
Figure 2.13: The calculation of H/W ratio for a symmetrical canyon (Source: personal
drawing)
Figure 2.14: The calculation of H/W ratio for non-uniform buildings (Source: personal
drawing)

37
Figure 2.15: The calculation of H/W ratio for an asymmetrical canyon (Source: personal
drawing)
In general, an increase in the H/W ratio as a result of created deep canyons in urban
areas, contributes to development of UHI effect. Oke (1981) demonstrated a strong
and linear relationship between H/W ratio and heat island intensity. As seen in figure
2.16, when height-to-width ratio of an urban canyon was measured as 2, the UHI
intensity had reached up to 12 degrees. However, the temperature difference due to
H/W ratio may vary according to climate zones and weather conditions of cities. In
fact, in tropical and continental (mid-latitude zone) climates, high H/W ratio causes an
increase in heat island intensity. On the contrary, in hot-arid cities, deep canyons
(H/W>2) can conduce to decrease in the air temperature and the heat island effect.
Oke (1981) simulated this relation for European and North American cities, and his
estimation has been approved by many studies. One of them is Nakata and Souza
(2013) conducted a study for five selected sites from central area in Brazil. According
to this study, the ambient air temperature in the highest H/W ratio (0.5) canyon was
measured 5.5°C higher than the rural area. To define this relation between them a new
formulation was developed which estimates that as a canyon gets deeper and narrower
(H/W>2), the temperature difference may rise to 10 degrees. The other is based on a
developed formulation for tropical cities, but the results are quite consistent with Oke’s

38
estimation. To illustrate, in Bangkok, weather data were collected from different urban
canyons both in wet season (July) and cool season (December). As a result of this
study, Takkanon (2016) reported that when the H/W ratio was within a range of 0.20
to 0.30, intensity of heat island was observed to be between 5°C and 8°C. Moreover,
UHI intensity was measured 9°C for a canyon with a H/W ratio of 1. Therefore, the
relation between them was established with a linear model which gives R² values for
both wet season and cool season as 0.49 and 0.45, respectively. It means that the
magnitude of UHI effect is depended on urban geometry (aspect ratio) by 45 to 49%.
Figure 2.16: The relation between H/W ratio and UHI intensity (Source: Oke, 1981)
Apart from this general view of enhancing effect of deep canyons on UHI, Bakarman
and Chang (2015) demonstrated that, in the hot-arid climates, deep canyons in compact
urban fabric have a cooling effect due to its shade-providing configuration. In the city
of Riyadh, Saudi Arabia, it was found that while the air temperature in the shallow
canyon was 52°C, which was 15% higher than the rural area, deep canyon’s
temperature was measured as 47°C as seen in Figure 2.17. Because of shallow canyons
in urban forms, which are characterized by low-rise buildings and wide streets, are
exposed to extreme level of incoming solar radiation, ground surface in there warmed
quickly and reached by 66°C as a peak value. As the canyon profile gets deeper,
directly incoming solar radiation to the ground coverage is restricted, and thus a

39
decrease in the air and surface temperatures can be observed during a day.
In addition, a change in the height-to-width ratio of urban canyons influences the
formation of diurnal and nocturnal heat islands. For instance, shallow canyons absorb
greater amount of incoming radiation that leads to an increase in the diurnal UHI effect.
On the contrary, deep canyons store huge amount of heat due to trapped radiation
through multiple reflection, and that results in the intensification of nocturnal heat
islands (Bakarman and Chang, 2015; Montavez et al., 2008).
Figure 2.17: The hourly variations of the air temperature in different canyon profiles (Source:
Bakarman and Chang, 2015)
2.2.1.2. Sky View Factor (SVF)
The Sky View Factor (SVF) is widely used as an important measure of urban geometry
for the estimation of UHI effect. It determines the ratio of emitted long-wave radiation
from urban surfaces to the atmosphere. Therefore, the fraction of the visibility of the
sky from a point on the urban surfaces depending on the interception of the near located
urban structures, is represented as a SVF values, which is within a range of 0 to 1. The
SVF value of 1 means that the sky is unobstructed and completely visible, but if it is
0, the sky is completely blocked. For example, Unger (2009) measured SVF values
both for relatively open area (0.97), which is surrounded by low-rise buildings, and for
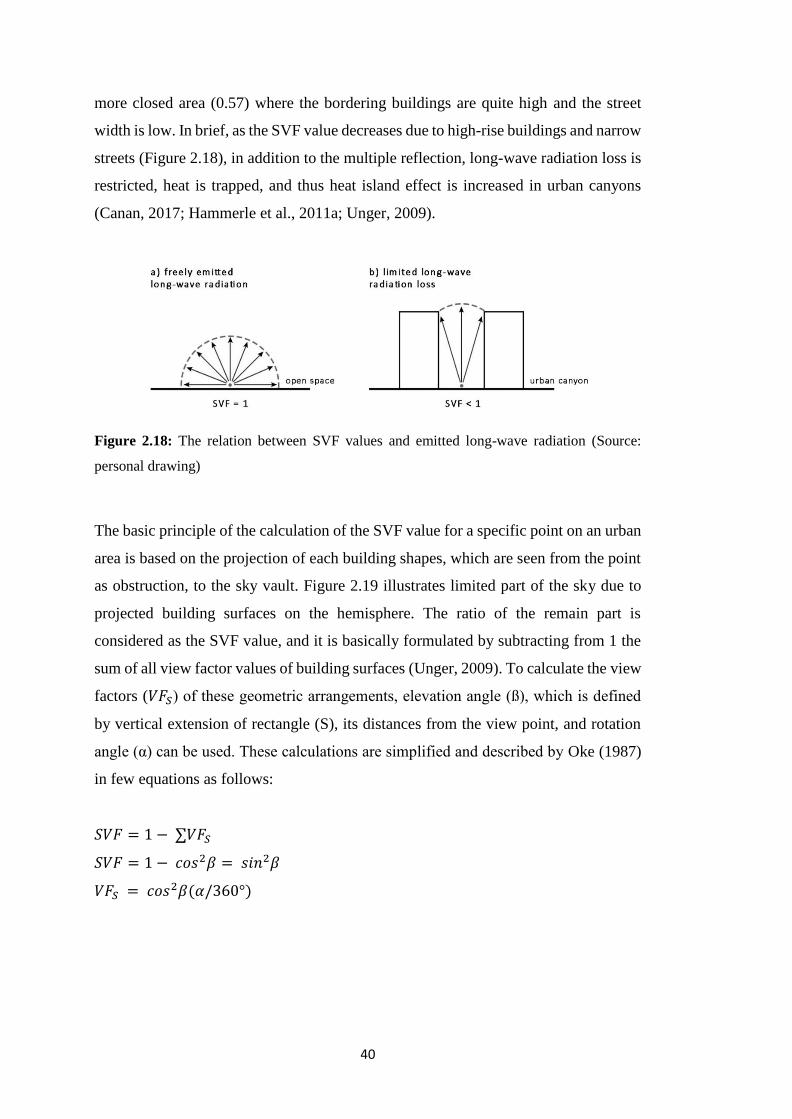
40
more closed area (0.57) where the bordering buildings are quite high and the street
width is low. In brief, as the SVF value decreases due to high-rise buildings and narrow
streets (Figure 2.18), in addition to the multiple reflection, long-wave radiation loss is
restricted, heat is trapped, and thus heat island effect is increased in urban canyons
(Canan, 2017; Hammerle et al., 2011a; Unger, 2009).
Figure 2.18: The relation between SVF values and emitted long-wave radiation (Source:
personal drawing)
The basic principle of the calculation of the SVF value for a specific point on an urban
area is based on the projection of each building shapes, which are seen from the point
as obstruction, to the sky vault. Figure 2.19 illustrates limited part of the sky due to
projected building surfaces on the hemisphere. The ratio of the remain part is
considered as the SVF value, and it is basically formulated by subtracting from 1 the
sum of all view factor values of building surfaces (Unger, 2009). To calculate the view
factors (𝑉𝐹𝑆) of these geometric arrangements, elevation angle (ß), which is defined
by vertical extension of rectangle (S), its distances from the view point, and rotation
angle (α) can be used. These calculations are simplified and described by Oke (1987)
in few equations as follows:
𝑆𝑉𝐹 = 1 − ∑𝑉𝐹𝑆
𝑆𝑉𝐹 = 1 − 𝑐𝑜𝑠2𝛽 = 𝑠𝑖𝑛2𝛽
𝑉𝐹𝑆 = 𝑐𝑜𝑠2𝛽(𝛼/360°)

41
Figure 2.19: Schematic depiction of the SVF calculation (Source: Unger, 2009)
Apart from Oke’s (1987) formulation, a more exact analytical model was developed
by Johnson and Watson (1984) that defines SVF value by analyzing geometric features
and radiation fluxes of urban canyons. This calculation is based on the fraction of long-
wave radiation that reaches to the sky vault from canyon surfaces (Chen et al., 2012;
Cheung et al., 2016). It can be given by an equation:
𝛹𝑆 =1
𝜋𝑅2∫ 𝑐𝑜𝑠𝜑𝑑𝑆
𝑆𝑣
Where:
𝛹𝑆 = The sky view factor
𝑅 = Radius of the sky hemisphere (m)
𝑆𝑉 = The sky vault seen from the canyon ground
𝜑 = The angle between the canyon ground and the sky vault radius to area
𝑑𝑆 = Area of the sky seen from the canyon ground (m²)
To calculate the SVF values in urban areas, several image-based manual and
computational methods have been developed by many researchers. Image-based
methods for identifying the SVF require the use of fisheye lenses to obtain
hemispherical photographs. Two-dimensional images of an urban canyon can be

42
captured from the center of the canyon and 1-1.5 meters above the street surface to
represent how the sky is seen from there (Cheung et al. 2016; Hammerle et al., 2011a;
Liao and Cavaleri, 2014). Otherwise, if photos are taken on different sides of
horizontal plane or on the ground level, calculation of SVF values may give inaccurate
results. For example, Cheung et al. (2016) investigated effects of different
measurement points on the SVF results. They found that when the canyon was very
symmetric, SVF values of each point, which are left side (0.126), center (0.190) and
right side (0.126) of the canyon, were similar. However, in the asymmetric canyon,
remarkable differences between them were observed. Also, as the height of the
measurement point was close to the ground level, SVF was calculated lower than the
upper measuring point’s value, but there was no essential difference between them.
Image-based methods have been evolved from manual to digital calculating processes.
The most basic one is called as Steyn method, which is based on manually annulus
counting in a divided fisheye image by polar grid and their summation. On the
contrary, Rayman method processes digitized fisheye images through pixel counting.
That type of pixel calculators designate darker colors for shapes, which are perceived
as obstacle to the sky view, and the remain area is colored to white. Therefore, selected
white pixels can be used for the calculation of SVF values in a specific urban area
(Hammerle et al., 2011b; Liao and Cavaleri, 2014). To illustrate, CCL model in
MATLAB software converts images to only black and white colored pixels (Cheung
et al., 2016). As seen in Figure 2.20, all urban structures, such as buildings, trees and
street lights, are represented as black and visible part of the sky is shown as white.
Also, to calculate SVF, photos can be converted to the grayscale and be separated black
and white pixels carefully by graphic softwares, then geometric variables can be
calculated by GIS software (Shaker and Drezner, 2010).

43
Figure 2.20: Image-based SVF calculation process (Source: adjusted from Hammerle et al.,
2011b)
Additionally, fisheye images can be completely evaluated by using of ArcGIS
software. The design of ArcView Script is based on Steyn method, so the basis of the
calculation is adjusted to the count of annular rings (Hammerle et al., 2011a). The steps
of the SVF calculation can be expressed as follows:
𝑆𝑉𝐹𝑚𝑎𝑥𝑖 =𝜋
2sin(
𝜋(𝑖 − 0.5)
2𝑛) cos(
𝜋(𝑖 − 0.5)
2𝑛)
𝛼𝑖 = (𝑇𝑡𝑜𝑡𝑎𝑙 − 𝑇𝑜𝑏𝑠) / (𝜋𝑟22 − 𝜋𝑟1
2)
𝑆𝑉𝐹𝑖 = 𝑆𝑉𝐹𝑚𝑎𝑥𝑖𝛼𝑖
2𝜋
Where:
𝑆𝑉𝐹𝑖 = Result of the total SVF value
𝑆𝑉𝐹𝑚𝑎𝑥𝑖 = Maximum SVF value
𝛼𝑖 = Obstructed angle in ring ‘i’
𝑇𝑡𝑜𝑡𝑎𝑙 = Total area of annular ring
𝑇𝑜𝑏𝑠 = Obstructed area in the same ring
𝑟1 𝑎𝑛𝑑 𝑟2 = Radii of the inner and outer limits of the ring
𝑖 = Number of actual rings
𝑛 = Count of annular rings
Apart from image-based methods, computational methods using 3D building database

44
are more widely preferred (Matuschek and Matzarakis, 2010). In addition to the SVF
calculation, software tools also provide climatologic analyses, such as sunshine
duration, thermal comfort and radiation fluxes of the urban environment. By using 3D
urban geometry data, SVF values can be rapidly estimated for each selected view point
in an urban area. For example, Sky Helios, which is one of the most well-known
softwares, can be considered as a developed model of the Rayman method. This tool
generates a virtual fisheye image from a chosen view point, and then it calculates SVF
values like Rayman’s workflow by using graphic processor (Hammerle et al., 2011a).
Additionally, SOLWEIG software is widely used for the estimation of SVF values and
spatial variations of mean radiant temperature in urban areas. It also provides a
simulation interface for the effect of sky view factor on the temperature distribution
(Lau et al., 2015). The other one is that Townscope software is basically designed for
sky visibility and solar access analyses. For instance, by using Townscope, Kakon and
Nobuo (2009) calculated average SVF values for selected roads and the amount of
solar radiation being exposed.
As a result of many research, a strong linear correlation between the SVF and the UHI
effect has been proven. Comparison of collected air temperatures at different urban
sites and calculated SVF values shows that urban geometry has a significant impact on
the distribution of the average air temperature (Svenson, 2004). In addition, Yuan and
Chen (2011) confirmed the effect of sky view factor on the mean air temperature in
their study in Hong Kong. It was demonstrated that when the SVF value was calculated
as 0.10-0.15, the air temperature was measured to be 30.5°C. However, in selected
urban sites where the sky view factor increased to 0.85, the ambient air temperature
decreased to 27.5-28°C. The relation between them was defined as a 0.1 increase in
the SVF value results in a 0.4°C decrease in the mean air temperature (𝑇𝑚𝑒𝑎𝑛). Also, a
new equation was developed for the calculation of 𝑇𝑚𝑒𝑎𝑛 in tropical climate cities that
is stated as:
𝑇𝑚𝑒𝑎𝑛 = 3.82 𝑆𝑉𝐹 + 31.02
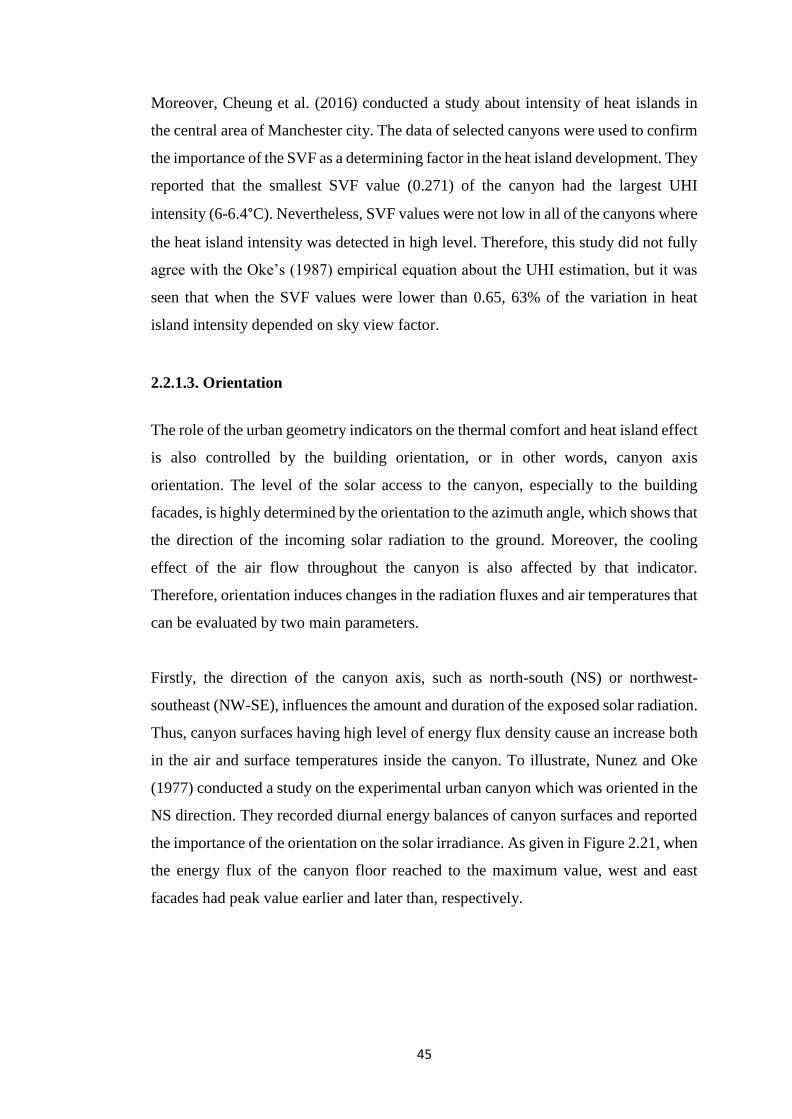
45
Moreover, Cheung et al. (2016) conducted a study about intensity of heat islands in
the central area of Manchester city. The data of selected canyons were used to confirm
the importance of the SVF as a determining factor in the heat island development. They
reported that the smallest SVF value (0.271) of the canyon had the largest UHI
intensity (6-6.4°C). Nevertheless, SVF values were not low in all of the canyons where
the heat island intensity was detected in high level. Therefore, this study did not fully
agree with the Oke’s (1987) empirical equation about the UHI estimation, but it was
seen that when the SVF values were lower than 0.65, 63% of the variation in heat
island intensity depended on sky view factor.
2.2.1.3. Orientation
The role of the urban geometry indicators on the thermal comfort and heat island effect
is also controlled by the building orientation, or in other words, canyon axis
orientation. The level of the solar access to the canyon, especially to the building
facades, is highly determined by the orientation to the azimuth angle, which shows that
the direction of the incoming solar radiation to the ground. Moreover, the cooling
effect of the air flow throughout the canyon is also affected by that indicator.
Therefore, orientation induces changes in the radiation fluxes and air temperatures that
can be evaluated by two main parameters.
Firstly, the direction of the canyon axis, such as north-south (NS) or northwest-
southeast (NW-SE), influences the amount and duration of the exposed solar radiation.
Thus, canyon surfaces having high level of energy flux density cause an increase both
in the air and surface temperatures inside the canyon. To illustrate, Nunez and Oke
(1977) conducted a study on the experimental urban canyon which was oriented in the
NS direction. They recorded diurnal energy balances of canyon surfaces and reported
the importance of the orientation on the solar irradiance. As given in Figure 2.21, when
the energy flux of the canyon floor reached to the maximum value, west and east
facades had peak value earlier and later than, respectively.

46
Figure 2.21: Energy balances of canyon surfaces based on hourly measurements (Source:
Nunez and Oke, 1977)
In addition, Lau et al. (2015) investigated the effect of canyon orientation on the spatial
variation of mean air temperature (𝑇𝑚𝑒𝑎𝑛). Urban canyons were simulated in the
different rotation angles, such as 0°, 22.5° and 45°. In the non-rotated canyon, the
highest air temperature (near 60°C) was observed on the south-facing building
surfaces, and the lowest temperature, which was below 50°C, was estimated along the
north facades. Moreover, the result of the comparison of the canyon directions shows
that while NE-SW oriented canyon had the highest air temperature (58.1°C), NW-SE
oriented one had the lowest value (52°C).

47
Secondly, street orientation has a significant impact on the temperature reduction
through air flow. The air flow, with a specific speed and direction coming from the
external environment, interacts with canyon surfaces or passes through to the end of
the canyon. The warm air can be transported into the canyon or out of from there by
means of advection, which is highly depended on the air flow patterns inside the
canyon. The air flow possibilities can be categorized into three types that are parallel
flow, cross-angle flow and perpendicular flow. For the case of parallel flow, Nunez
and Oke (1977) estimated the importance of the wind direction for the NS (north-
south) oriented canyon. Figure 2.22 shows that when the warm air blows from the
south, advection occurs at the low level, but heat transport from the canyon air volume
increases with the cooling effect of the northern wind.
Figure 2.22: Advection of the canyon air volume due to the wind direction: N-north, S-south,
V-variable (Source: Nunez and Oke, 1977)
In addition to the advective transport from the canyon air volume, surface heat can also
be removed from building facades by convenient wind speed and direction according
to the canyon orientation. Gülten (2014) simulated building orientation to calculate
heat island potential in different cases of wind speed and direction. For the WE (west-
east) oriented canyon, when the wind direction was west, heat island potential was
estimated near 30°C even the wind speed was high (5.85 m/s). On the contrary,
northwestern wind at low speed (3.4 m/s) had a greater cooling effect than the west
wind that resulted in the estimation of air temperature as 20°C.

48
Another simulation result based on the hourly estimation shows that parallel wind flow
with the speed of 6.25 m/s had not any effect on the air temperature inside the canyon.
After an hour, despite being at the same wind speed with the parallel flow, cross-angle
flow approximately dropped surface and air temperatures by 10 and 5 degrees,
respectively. Figure 2.23 illustrates that how the orientation effects the temperature
reduction by modifying air flow. According to the simulation, parallel flows cannot
reduce both surface and air temperatures due to wind does not interact with the canyon
walls. When the canyon axis oriented to the cross-angle flow, for example NS oriented
canyon with NE wind direction, the wind firstly hits on the north-facing facades, and
then move on to the south-facing surfaces. Therefore, a decrease in the surface
temperature can be occurred by the interaction of wind and building facades, also this
effect will be greater with an increase in the wind speed.
Figure 2.23: Schematic depiction of flow patterns (Source: personal drawing)
On the other hand, Gülten (2014) found that a perpendicular flow, which means wind
blows perpendicular to the canyon axis, does not have any cooling effect in the canyon
air volume. To illustrate, for NS oriented canyon, the east and west winds lose their
velocity when they try to get into the canyon. At that time, as the amount of absorbed
solar radiation increases, the air temperature of the canyon rises in spite of the wind
flow. However, Nunez and Oke (1977) stated that perpendicular wind flow over the
canyon develops a vortex circulation between the buildings that may leads to remove
of the heat from the canyon air volume. Therefore, Nunez and Oke’s prediction may
be substantiated if the wind speed is above a threshold value.
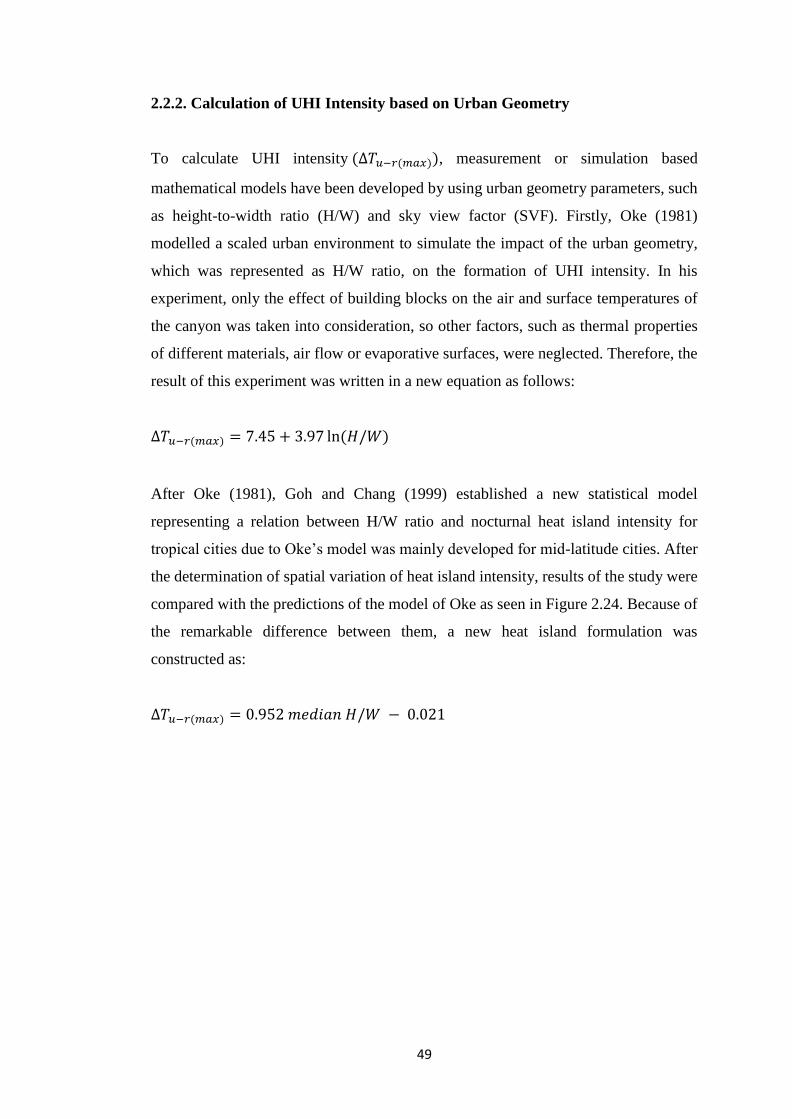
49
2.2.2. Calculation of UHI Intensity based on Urban Geometry
To calculate UHI intensity (∆𝑇𝑢−𝑟(𝑚𝑎𝑥)), measurement or simulation based
mathematical models have been developed by using urban geometry parameters, such
as height-to-width ratio (H/W) and sky view factor (SVF). Firstly, Oke (1981)
modelled a scaled urban environment to simulate the impact of the urban geometry,
which was represented as H/W ratio, on the formation of UHI intensity. In his
experiment, only the effect of building blocks on the air and surface temperatures of
the canyon was taken into consideration, so other factors, such as thermal properties
of different materials, air flow or evaporative surfaces, were neglected. Therefore, the
result of this experiment was written in a new equation as follows:
∆𝑇𝑢−𝑟(𝑚𝑎𝑥) = 7.45 + 3.97 ln(𝐻/𝑊)
After Oke (1981), Goh and Chang (1999) established a new statistical model
representing a relation between H/W ratio and nocturnal heat island intensity for
tropical cities due to Oke’s model was mainly developed for mid-latitude cities. After
the determination of spatial variation of heat island intensity, results of the study were
compared with the predictions of the model of Oke as seen in Figure 2.24. Because of
the remarkable difference between them, a new heat island formulation was
constructed as:
∆𝑇𝑢−𝑟(𝑚𝑎𝑥) = 0.952 𝑚𝑒𝑑𝑖𝑎𝑛 𝐻/𝑊 − 0.021

50
Figure 2.24: UHI intensity distribution according to the model of Oke (1981) and to the new
statistical model (Source: Goh and Chang, 1999)
Apart from that a research of Nakata and Souza (2013) showed relevance with Oke’s
(1981) finding. Also, they suggested a new model as an adjustment of Oke’s model
according to measurement results in the city of Sao Jose do Rio Preto. After the
application of both models, their results were compared to validate the applicability of
the new model. Figure 2.25 illustrates that the results of the calculation of UHI
intensity by the adjusted model are considerably similar to the measurement results.
Additionally, the temperature difference between Oke’s model and the adjusted model
can be reached at the highest level (1.6°C) when the height-to-width ratio is within a
range of 0.25 to 0.5. The lowest level of the heat island intensity difference (0.2°C)
can be observed in urban canyons where the H/W ratio is between 1 and 2,
respectively. The equation for adjusted model as follows:
𝑦 = 0.802𝑥 + 1.4574
Where:
𝑦 = The result of the adjusted model
𝑥 = The result of the Oke’s model
𝑦 = 0.802 [7.45 + 3.97 ln(𝐻/𝑊)] + 1.4574

51
Figure 2.25: Comparison of estimated heat island intensities by different models (Source:
Nakata and Souza, 2013)
In addition to the use of H/W ratio as an urban geometry indicator in the calculation
of the UHI intensity, sky view factor (SVF) is also used due to it’s a significant
determinant factor depending on the context of the study. To demonstrate the
correlation between them, Oke (1987) formulated a new equation using SVF (𝜓𝑠𝑘𝑦)
as a measure:
∆𝑇𝑢−𝑟(𝑚𝑎𝑥) = 15.27 − 13.88 𝜓𝑠𝑘𝑦
Among many studies which have been conducted to confirm the influence of view
factor on the development of UHI, Cheung et al. (2016) found that a linear relation
between them for both in summer and winter seasons. Moreover, they suggested a new
equation to obtain stronger linearity with a higher coefficient of determination (R²)
value that corresponds to measurement results. Equations for the estimation of the
maximum heat island intensity in summer and winter periods are compatible with the
results of Oke’s (1987) model that can be expressed as:
𝑈𝐻𝐼(𝑚𝑎𝑥)𝑠𝑢𝑚𝑚𝑒𝑟 = 6.75 − 3.03 𝑆𝑉𝐹
𝑈𝐻𝐼(𝑚𝑎𝑥)𝑤𝑖𝑛𝑡𝑒𝑟 = 4.25 − 2.39 𝑆𝑉𝐹

52
2.3. Evaluation of UHI Related Studies in the Literature
2.3.1. Previous Studies on UHI
Because the UHI effect induces many problems in the urban environment, several
studies have been conducted to provide a comprehensive understanding about urban
characteristics affecting the development of heat island intensity. The associated
factors of UHI have been investigated in many aspects, and analyzed their effect on
air and surface temperatures. All these studies were performed from the macro scale
to micro scale. To illustrate, in macro scale and meso scale studies, for the assessment
of the surface urban heat island (SUHI), spatial and temporal variations in surface
temperatures and contributed factors were defined by using statistical datasets and
remote sensing images. The use of satellite images to analyze land use, total area of
vegetation covers or surface temperatures indicate the sensitivity factors of UHI
parameters. Accordingly, many studies validated that urban expansion with an increase
in the total area of impervious ground covers has a remarkable effect on the increase
in surface temperatures.
Apart from surface temperature determinations, many studies also have been analyzed
daily (diurnal and nocturnal), seasonal or annual air temperature differences with
related to thermal properties of surface materials, vegetation areas, land use
(residential, commercial and industrial areas), building density and canyon geometry
in local or micro scales. To demonstrate the effect of these parameters on the air
temperature and UHI intensity, measurement-based studies have been conducted. On
the other hand, to estimate negative effects for different urban scenarios, to examine
the relation between urban geometry indicators and heat island, and to develop a
model, from estimation to implementation, for the mitigation of UHI effect simulation
softwares have been preferred. Therefore, UHI studies within the scope of urban
geometry can be categorized into two main part as measurement-based studies and
simulation-based studies.

53
2.3.1.1. Measurement Related Studies
Measurement-based studies are fictionalized to investigate the effect of urban
geometry indicators, such as height-to-width (H/W) ratio and sky view factor (SVF),
on the formation of UHI intensity. To determine the influential factor of geometrical
features, urban canyons with different H/W ratios and SVF values are selected,
carefully. As a result of several regression analyses of these dependent and
independent variables, a linear relation between urban geometry and heat island
intensity is validated with fairly high coefficient of determination (R²) values.
Table 2.3: Examination of measurement-based studies
Author Urban Geometry
Indicator Method Findings
Bakarman
and Chang
(2015)
H/W ratio
(shallow canyon:
0.42)
(deep canyon: 2.20)
Measurement of air
(from roof and inside the
canyon) and surface
temperatures (walls,
roofs, floor) with
sensors.
Determination of an increase in
the air and surface temperatures
due to a decrease in the H/W
ratio.
Cheung et al.
(2016)
SVF values
(within a range of
0.3 to 0.9)
Calculation of SVF
values with the use of
fisheye images in
MATLAB.
Determination of the max. UHI
intensity (6°C) with the min.
SVF value (0.3) in summer
nights, and correlation of a
linear relation between them.
(R²=0.63)
Takkanon
(2016)
H/W ratio
(within a range of
0.06 to 0.95)
Measurement of the
hourly air temperatures
by a mobile weather
station along the roads.
Demonstration of a linear
relation between H/W ratio and
nocturnal UHI intensity.
(for wet season R²=0.49)
(for cool season R²= 0.47)
Yuan and
Chen (2011)
SVF values
(within a range of
0.15 to 0.85)
Calculation of SVF
values with 3D building
data in ArcGIS.
Demonstration of a linear
relation (R²=0.73) between SVF
and UHI intensity, and
estimation of 0.4°C decrease in
the air temperature due to 0.1
increase in the SVF value.

54
2.3.1.2. Simulation Related Studies
Apart from real-time measurement studies in urban areas, many researchers have
conducted simulation studies to develop an estimation tool for UHI intensity to
investigate the influence of urban geometry on air temperature for different scenarios,
and to generate various form configurations to mitigate the UHI effect. Generally, for
the simulation process, or related to the case study, for the optimization process,
morphological indicators are used to be input data, and thus the output data, which has
been reached from the modification of input parameters, provides many estimations
for the development of UHI effect.
One of these studies, Gülten (2014) evaluated urban heat island effect in high density
urban areas by using a computational fluid dynamics (Ansys Fluent) software.
Simulations were made for different scenarios, which are determined to height-to-
width ratio (0.5, 1 and 2) and orientation of urban canyons. In order to define the
impact of velocity, traffic flow, vegetation, and surface material properties on the
magnitude of heat island intensity, each variable was added to the simulation one-by-
one. Therefore, estimation results were compared with each other, and their effect on
the UHI development were discussed on their own terms.
One of these studies, Chokachian et al. (2017) proposed a generative method to
determine the relation of UHI and solar access with urban forms by developing a tool
in Grasshopper software, which is defined as a visual programming interface. To
generate urban forms (600 form samples) with some limitations, set of geometric
circumstances, such as block size, floor number and floor height, were defined, first of
all. Then, after the simulation, identified H/W ratios are used to calculate UHI intensity
using Oke’s (1981) formulation. The application of developed method shows a strong
relation between floor area ratio and heat island intensity, and thus a new equation is
suggested as follows:

55
𝑈𝐻𝐼 = 7.45 + 3.97 ln (3.2 𝐹𝐴𝑅(1 +
𝑤𝑥
)²
𝑤) ≅ 12.08 + 3.97 (ln 𝐹𝐴𝑅 + 2 ln (1 +
𝑤
𝑥) − ln 𝑤)
Where:
𝐹𝐴𝑅 = 𝐹𝑙𝑜𝑜𝑟 𝑎𝑟𝑒𝑎 𝑟𝑎𝑡𝑖𝑜
𝑤 = 𝐶𝑎𝑛𝑦𝑜𝑛 𝑤𝑖𝑑𝑡ℎ
𝑥 = 𝐵𝑢𝑖𝑙𝑑𝑖𝑛𝑔 𝑠𝑖𝑧𝑒
The other one is Hu et al. (2016) developed a parametric modelling to mitigate the
UHI effect through optimization of SVF values in urban areas. This method was
evaluated with the use of genetic algorithm in Rhinoceros software. Firstly, to
represent the compact urban form, various form distributions were generated
according to some restrictions, such as plot number, plot size, range of the floor area
ratio and certain length of building setbacks. Secondly, as seen in Figure 2.26, the
optimization process proceeded on these form configurations (around 1275 samples)
to find the max. SVF value which represents min. magnitude of the UHI intensity. As
a result of this simulation, optimum solution for the mitigation of UHI effect was
emerged as a rough urban form. Because of the overall design algorithm was based on
the maximization of average SVF value in the experiment area, high-building density
in the central area with low SVF value was recommended. Therefore, the periphery
area high SVF value conduced an increase in average SVF value of the whole area.
Figure 2.26: Generated form samples based on the best density distribution (Source: Hu et al.,
2016)

56
Table 2.4: Examination of simulation-based studies
Author Urban Geometry
Indicator Method Findings
Chokachian
et al. (2017)
- H/W ratio
- FAR (floor area
ratio)
Development of a
mathematical generative
methodology to calculate
UHI intensity by using urban
form in a software.
Estimation of a relation
between geometric parameters
(building height, street width,
FAR) and UHI intensity.
Hamdi and
Schayes
(2008)
- H/W ratio
(0.43 and 1.50)
- SVF values
(within a range of
0.47 to 0.70)
Simulation of diurnal
variations of the UHI
intensity through TVM
model.
Estimation of a decrease in
UHI intensity with high H/W
ratio, and 0.4°C decrease in
UHI due to each 0.1 increase
in SVF.
Hu et al.
(2016) SVF values
- Calculation of SVF values
with the shadow projection
method for a large number of
urban form samples.
- Optimization of SVF
values of urban forms to
mitigate UHI intensity
Generation of a compact
density distribution form in the
center of the experimental area
to produce high SVF value of
the whole area.
Lau et al.
(2015)
- H/W ratio
(0.5 - 1 - 2 - 3 - 4)
- Street
orientation
(rotation angle: 0°
- 22.5° - 45°)
Simulation of the mean air
temperature according to
geometrical features by
using SOLWEIG.
- Determination of the highest
air temperature (58.1°C) in the
lowest H/W ratio (0.5) canyon
and 45° rotated canyon.
- Exemplification of the
importance of urban geometry
to exposure to solar radiation.
Montavez et
al. (2008)
H/W ratio
(within a range of
0.11 to 5)
Simulation of an energy
transfer process of urban
canyon models
- Determination of a high
potential of the urban
geometry to generate UHI
intensity (4-12°C
Nakata-Osaki
et al. (2015)
H/W ratio
(within a range of
0.25 to 2.02)
- Simulation of a
hypothetical scenario by the
recognition of input data.
- Computation of the model
and application of the
algorithm through GIS tool
Suggestion of a developed tool
to simulate UHI intensity in
different urban scenarios.

57
2.3.2. The Overall Critics on Existing Methods of UHI
Literature review on the Urban Heat Island (UHI) studies shows that several research
projects are based on the measurement of air and surface temperatures, energy fluxes,
and other artificial and natural environmental conditions to establish their effects on
the magnitude of heat island intensity. Actually, the main purpose of these studies can
be interpreted as a search for a set of knowledge to mitigate the UHI effect in urban
areas. Defining influential indicators and estimating relations between these indicators
and heat island magnitude provide data for the future studies, and also suggest
mitigation strategies by controlling these causing factors. In addition to the
measurement-based studies, simulation-based ones help designers to evaluate the
impact of variables (components of urban geometry, climatic conditions, material
properties, etc.) on the UHI intensity. Moreover, simulation softwares can estimate air
and surface temperatures for different urban scenarios that provides a foresight before
the design and planning processes. However, estimation results are not enough to
produce better solutions and form configurations to mitigate heat island intensity,
particularly in the field of urban geometry. Since the tested scenarios are set by users
with limited number of morphological features, the acquired evaluations from the
simulation softwares are inadequate to offer alternative design recommendations.
Briefly, the overall critics on existing methods of UHI in the context of urban geometry
related studies can be defined as follows:
– Estimation results as a decrease or increase in heat island intensity with
specified geometrical features (height-to-width ratio, SVF value and
orientation degree) are limited with a few scenarios
– Simulation softwares generally evaluates specified conditions by designers,
and thus they tend to establish alterations in the air temperature in regard to
restricted samples
– For mitigation of the UHI effect, previous studies suggest only strategies or
specific rates that based on their case areas instead of achieve better form
solutions
– Simulation-based studies have the lack of searching design proposals from a
wide range of geometrical features to achieve a minimum heat island intensity

58

59
CHAPTER 3
PARAMETRIC MODELLING FOR THE ANALYSIS AND SIMULATION
OF UHI: A MODEL PROPOSAL
3.1. Methodical Approach
Evaluation of the overall critics on the existing methods of urban geometry based UHI
studies shows that simulation-related methods are insufficient in generating form
compositions to mitigate heat island intensity. Instead of measuring geometrical
features to estimate the UHI effect with a limited number of scenarios determined by
the designer, such as 0.5-1-2 height-to-width ratios, the search for UHI mitigation
requires new methodical approaches to achieve alternative scenarios, which will be
produced beyond the designers’ limits. To meet this demand, parametric modelling
can be considered as an effective tool that allows designers to response their own
needs. By using parametric modelling, many geometric components can be analyzed
and form configurations can be generated in regard to design problem through a
customized set of algorithms. Thus, in this context, a parametric model is developed
to response the research problem of this study.
The methodological approach of this study stands on a synthesis of analysis and
simulation processes. To mitigate UHI intensity in urban areas, the proposed model
provides the combination of SVF calculation by analyzing morphological components,
and form generation by maximizing the obtained SVF values at the same platform. In
other words, designers will be able to proceed analysis and design process by running
a set of algorithm in the parametric modelling software. By means of this proposal, the
effect of urban geometry on the UHI development can be revealed, and measurement

60
results can be utilized to produce design solutions that mitigate heat island intensity.
Also, this proposal offers urban designers and planners a set of possible design
outcomes that is more than producing an optimal solution.
The proposed parametric model consists of analysis and simulation phases. Figure 3.1
illustrates the workflow of the model with detail explanations of each step. As
mentioned earlier, literature review indicates that urban geometry indicators have a
strong relationship with the magnitude of the UHI effect. To calculate heat island
intensity, a few equations were developed by using geometrical parameters, such as
height-to-width ratio (H/W) and sky view factor (SVF) value. Because H/W ratio is a
representation of three-dimensional building data as two-dimensional sections, the use
of H/W ratio in the analysis would not be an accurate selection for the parametric
approach that is based on 3D modeling. Therefore, SVF calculation for the estimation
of heat island intensity is determined as a main part of the methodology. Additionally,
to calculate UHI intensity by using average SVF value, Oke's (1981) equation will be
used. Briefly, at the first phase, the layout of the design area will be defined according
to their component, and then will be analyzed to calculate SVF value and UHI
intensity.
As seen in Figure 3.1, at the second phase, which is named as simulation, Genetic
algorithm will step in to generate form alternatives by maximizing SVF value or
minimizing UHI intensity. As a result of the simulation, a list of maximized SVF
results with their design proposals will be given by the algorithm. Since the simulation
tends to find much better solutions, designers will be able to choose any design
alternative from the wide range of proposals.

61
Figure 27: Schematic depiction of the workflow
3.2. Parametric Modelling: Tools and Techniques
The complex conditions of architectural design and urban design necessitate the
emergence of new approaches and tools in the design process with the development of
computational systems. Up to the present, decision making mechanism of the design
process has static and solid structure. After the emergence of parametric modelling,
the understanding of design principles has been shifted to the more flexible and
generative process. As Schumacher (2014) states that the new form of design process
is based on generation and selection from a set of created alternatives via parametric
modelling. This new era of the design field that provides the formation of alternative
solutions, generation of many design forms, manipulation of design entities by using
a set of specified parameters and algorithms (Dino, 2012).
As opposed to conventional design process, parametric modelling provides designers
to specify parameters in regard to their design concepts, and allows to make changes
by controlling input and output parameters interactively. Because the modelling
software is principally created as a responsive system, as any changes on the

62
parameters are made by designers, the whole design can be updated automatically by
the model.
Parametric modelling can be defined as a computational design approach that is
principally based on algorithmic settings. A set of instructions need to defined as an
algorithm to compute input values, and transform them to produce output values.
Using parameters and algorithms, to generate geometric forms with mathematical
operations, and to create a finite set of possible solutions, forms the ground of
parametric thinking. It provides an ability of searching better solutions, sorting the
findings, generating alternative from configurations, and operating all of them in a
connected platform (Dino, 2012). Therefore, parametric modelling can be taken into
consideration as a fast-growing and a powerful method, which produces new
architectural and urban morphologies in a constant diversity, and enhances design
variations beyond the limits with the creativity level of designers.
Parametric modelling tools provide flexibility, diversity, and efficiency by form
generation with generative and adaptive design system. Designers have an ability to
manipulate parameters in any condition, and test generic options for different design
scenarios. Due to defined parameters are connected with each other, they can interact
easily in any change and reflect the new results according to the manipulation. Also,
designers can improve the design process by searching and producing new shapes and
forms. One of the outcomes of the generative design system is the formation of
countless complex compositions, which cannot be produced easily by other design
softwares. Thus, parametric modelling tools help designers to improve their
imagination, and various form generation capacity.
Rhinoceros and Grasshopper softwares are utilized for parametric modelling.
Rhinoceros is a 3D-modelling program, which visualizes algorithmic scripts as a three-
dimensional model. Grasshopper is a visual interface, which is built inside Rhinoceros
software. In other words, Grasshopper is a developed plug-in for algorithmic design
scripting, and it can be used through Rhinoceros application. These tools control
geometrically defined the urban environment by introducing them to written

63
algorithms and mathematical operations. Creating algorithms is only allowed on the
Grasshopper canvas via its component tab, as seen in Figure 3.2. The component tab
includes all parameters, mathematical operations, geometrical elements, and
optionally attached add-ons that provide to create geometries by algorithms. The
canvas is, in this context, a workplace where designers can create a set of algorithms,
and control all the scripted design algorithms to form geometrical components. Also,
canvas requires to set a connection between components in order to make transaction
data.
Figure 3.2: Rhinoceros and Grasshopper softwares with basic explanations
Parametric design tools contain numerous plug-ins and add-ons, which are constantly
created by designers. For example, DIVA is a developed plug-in for Rhinoceros by
members of Graduate School of Design at Harvard University. This plug-in offers a
daylighting and energy modelling for buildings and urban landscapes. Another
environmental performance provider add-on is named as Ladybug tool. Ladybug
allows designers to import and analyze weather data, and to run radiation, sun-path
and daylighting simulations. Apart from environmental analysis tools, one of the most
important tools of Grasshopper softwares is Galapagos, which can be defines as

64
Genetic Algorithm that provides from generation and optimization. The basic
proceeding principles of Genetic Algorithm can be described as follows:
– Distributing a population over the specified domain set
– Testing this domain in regard to achievement minimization or maximization
– Generating a population with selected solutions from test results
– Applying the fittest selection on the manipulation
– Using last generation results to create the next generation (Musleh, 2012)
Due to the nature of Genetic Algorithm, it tends to find fittest genomes to achieve
better solutions, and thus Galapagos tries to optimize the test results at each generation.
As seen in Figure 3.3, the fitness process can be observed by the Galapagos editor.
This editor window shows, at the top of the screen, the number of generations on the
x-axis, shows the fitness level on the y-axis, and represents average fitness value with
red line for each generation results. Additionally, yellow and orange colored buffer
zones give an information about the strongest/weakest genomes and standard deviation
for each generation, respectively. The light purple rectangle, which can be moved by
user, shows selected generation. To illustrate, to get maximized values from the
simulation results for first generation, this rectangle should be moved to 1 on the x-
axis. At the bottom of the window, selected genomes and the list of maximized or
minimized results are represented. In the fitness process, from the test of first
generation to the last generation, the fittest genome is tried to select from the gene
pool. While the selected genomes have not been optimized in the first generation, the
fittest genome has been reached for each population test at the eight generation.
Therefore, towards to end of the process, the yellow and orange colored zones are
getting smaller because of the maximization results are reduced to almost a single or
similar set of values by the optimization process.
Depending on the context of the design problem, Galapagos tends to run for indefinite
duration, so users have to put some limitations by specifying indicators. To illustrate,
for an urban area, when a designer wants to maximize the building density, building
height should be determined within a range of values. Also, Galapagos allows

65
designers to use selection and mutation operations, and to control the number of
population per generation, number of generation and duration of the simulation
according to the problem solutions. Because Galapagos has an ability to solve complex
problems by testing any changes in each parameter, to achieve fittest solutions, and to
generate alternative form configurations, this tool has been widely preferred by
designers. Genetic Algorithm offers designers to explore new design compositions and
different configurations by investigating as much as possible amount of arrangements
with defined input parameters. Thus, designers can select better or fitter solutions from
a list of full of alternatives, at the earlier stage design. Having a real-time feedback
from the software also improves and steers designers’ decisions through the process
(Musleh, 2012).
Figure 3.3: Fitness process of the Galapagos tool
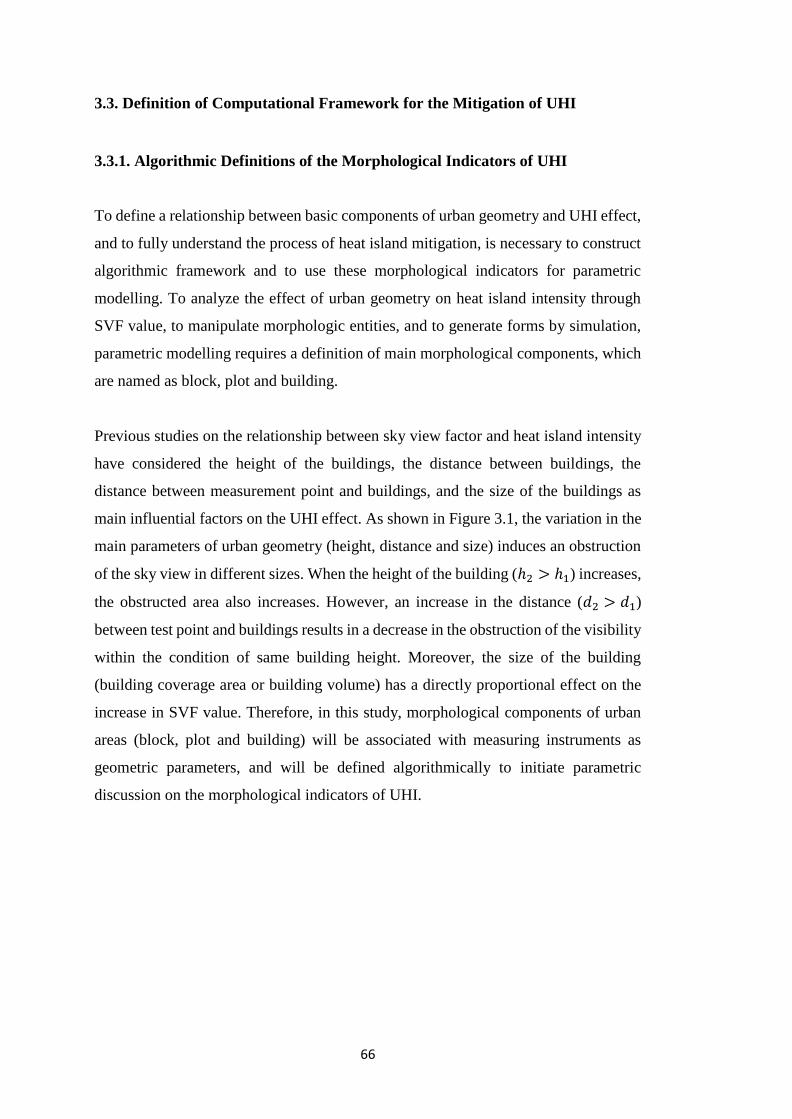
66
3.3. Definition of Computational Framework for the Mitigation of UHI
3.3.1. Algorithmic Definitions of the Morphological Indicators of UHI
To define a relationship between basic components of urban geometry and UHI effect,
and to fully understand the process of heat island mitigation, is necessary to construct
algorithmic framework and to use these morphological indicators for parametric
modelling. To analyze the effect of urban geometry on heat island intensity through
SVF value, to manipulate morphologic entities, and to generate forms by simulation,
parametric modelling requires a definition of main morphological components, which
are named as block, plot and building.
Previous studies on the relationship between sky view factor and heat island intensity
have considered the height of the buildings, the distance between buildings, the
distance between measurement point and buildings, and the size of the buildings as
main influential factors on the UHI effect. As shown in Figure 3.1, the variation in the
main parameters of urban geometry (height, distance and size) induces an obstruction
of the sky view in different sizes. When the height of the building (ℎ2 > ℎ1) increases,
the obstructed area also increases. However, an increase in the distance (𝑑2 > 𝑑1)
between test point and buildings results in a decrease in the obstruction of the visibility
within the condition of same building height. Moreover, the size of the building
(building coverage area or building volume) has a directly proportional effect on the
increase in SVF value. Therefore, in this study, morphological components of urban
areas (block, plot and building) will be associated with measuring instruments as
geometric parameters, and will be defined algorithmically to initiate parametric
discussion on the morphological indicators of UHI.

67
Figure 28: Schematic depiction of the effect of morphological parameters on the visibility of
sky
Parametric modelling necessitate an algorithmic transformation of each design units,
which are imported as layouts to Rhinoceros software or completely drawn at there, to
set up algorithms for computations of design areas. Hence, to be able to analyze
geometric features, to search, select and sort a set of values, and to manipulate or
generate forms, morphological components of urban areas should be introduced to
Grasshopper software through specification of their basic element, such as surface,
edge, centroid and corner. This transformation of knowledge from two-dimensional
drawings to the algorithmic tools allows the designers to have a control over the design
process, and makes this process more flexible and interventional. Figure 3.5 illustrates
the algorithmic definitions of basic elements within this study’s framework. Blocks
are defined by surface (area) and corner (point), plots are defined by surface (area) and
centroid (point), and buildings are specified by surface (area), corner (point) and
centroid (point). Street layout is not specifically taken into consideration due to the
space between the blocks can provide the measurement information of street width,
but the midline of the street, which is named as spine, is defined by line and segments
(point).

68
Figure 3.529: Definition of basic elements of morphological components
One of the parametric modelling tools is that Genetic Algorithm requires definition of
a set of operations regarding morphological parameters for the simulation.
Determination of the effect of parameters on the SVF value, simulation of different
scenarios, and generation of forms in order to mitigate UHI effect can be operated via
algorithmic attributions, which are the basic tools of Grasshopper software. These
tools (extrude, move and scale) work with the direction of x-y-z coordinates, and make
alterations on the height of the buildings, location of the buildings and size of the
buildings.

69
Figure 3.6: Schematic depiction of algorithmic attributions
Searching form configurations and better solutions in the context of heat island
mitigation, defined limitations or controller indicators are crucially necessary due to
the nature of Genetic Algorithm. Therefore, firstly, morphological parameters can be
classified as variable and stable components. To illustrate, building height, floor area
of the building, building volume, and distances between buildings are considered as
variables, while the main layout of an urban area, block and street organization, street
width, block size, and building numbers are defined as stable ones. Thus, this
categorization may help designers to cope with the design complexity.
Secondly, morphological indicators to control these parameters are determined
referring to the regulations of Turkish planning system. In Turkey, planning
regulations for 1/1000 scaled urban areas are enforced through Implementation
Development Plans. These plans include 3 essential metrics, which are Building
Coverage Ratio (BCR), Floor Area Ratio (FAR) and Hmax, providing a control
mechanism over the building density in urban areas. One of them is that Building
coverage Ratio (BCR) can be detailed as the ratio of the building coverage (footprint)
area to the plot area. In other words, that ratio helps to calculate the purposed building
area within the total gross area. The other one is that Floor Area Ratio (FAR) represents

70
the ratio of total building floor area to the plot area. Since FAR is determined by the
measurement of the horizontal (surface) area and its vertical distribution, that ratio can
inform designers about the building density of three-dimensional urban environment.
Apart from BCR and FAR, the other metric, Hmax also indicates the urban density
through providing a limitation on the building height.
In this study, BCR and FAR are determined as controller indicators in the simulation
process for generating many design alternatives to achieve increases SVF value to
mitigate heat island intensity. For different scenarios, to modify the measurement of
height, distance and size, Building Coverage Ratio and Floor Area Ratio are
algorithmically defined as given in Figure 3.7.
Figure 30: Algorithmic definition of Building Coverage Ratio (BCR) and Floor Area Ratio
(FAR)

71
3.3.2. Algorithmic Setting of Analysis
To calculate SVF value in urban areas, a new technique that is based on algorithmic
calculation of geometric features is developed through Rhinoceros and Grasshopper
softwares. Geometric components of urban areas were quantified by specialized
algorithm, and then for each viewpoints SVF values were computed depending on
hemispheric projection of buildings. With the help of this algorithmic model, visibility
factors of urban canyons, distribution of SVF values in the complex urban
environments, and the magnitude of UHI intensities at those areas can be evaluated
and compared with each other easily.
The proposed analytical model is constructed on a hypothetical urban layout that
consists of two blocks, and its plot and buildings. Thus, users are required to import
layout of a site as an input data to run this analysis in order to import 3D model to
Rhinoceros. Nevertheless, 3D building database can be introduced easily to the
algorithm, as well. This proposal calculates SVF values with three main steps, which
are detection (measuring points and areas), projection and extraction (SVF values).
The first phase is that detection can be defined as a decision-making algorithm for
selecting the measurement points, the plots and the buildings that are visible to test
point where the SVF calculation is to be made in the urban areas. Figure 3.8 illustrates
the process of Phase 1, which is composed of measurement point detection, frontal
facade detection and closest buildings selection steps. Firstly, to define the test point
for the measurement, a spine is generated through the exact center of the buildings due
to the calculation of SVF values may give more accurate results when they are
observed from the center of the canyon. To ensure the uniformity of the distribution of
all SVF measuring points in the area, the spine is divided into equal distances instead
of equal segments. Additionally, to avoid the positive influences of empty spaces on
the visibility of sky, end points of the spine can be removed. Therefore, the remaining
points on the spine are used as measuring points. Also, these ground level test points
are selected to obtain more precise projection on the hemisphere, because there is no
essential difference between the ground level measurement and 1-1.5 meters above the

72
ground measurement SVF results.
Secondly, because of the SVF values are only measured between the buildings that
border the canyon axis, the visible areas from the measurement point should be
detected. Therefore, within this step, detection of frontal facades is generated by the
algorithm due to restraining of unwanted plots and buildings selection. Detection of
frontal plots is formulated by the comparison of the distance between two blocks, and
the distance between measurement point and plots. Thus, the closer than the specified
distance plots are selected. After the plot detection, as a final step, closest buildings to
the test point are defined due to reduction of the buildings that are out of calculation.
In addition, since the formulation is based on the amount of closest points to the test
point, the generated algorithm enables users to choose number of buildings for SVF
calculation.
Figure 3.8: The detection process of the measurement point and areas (Phase 1)
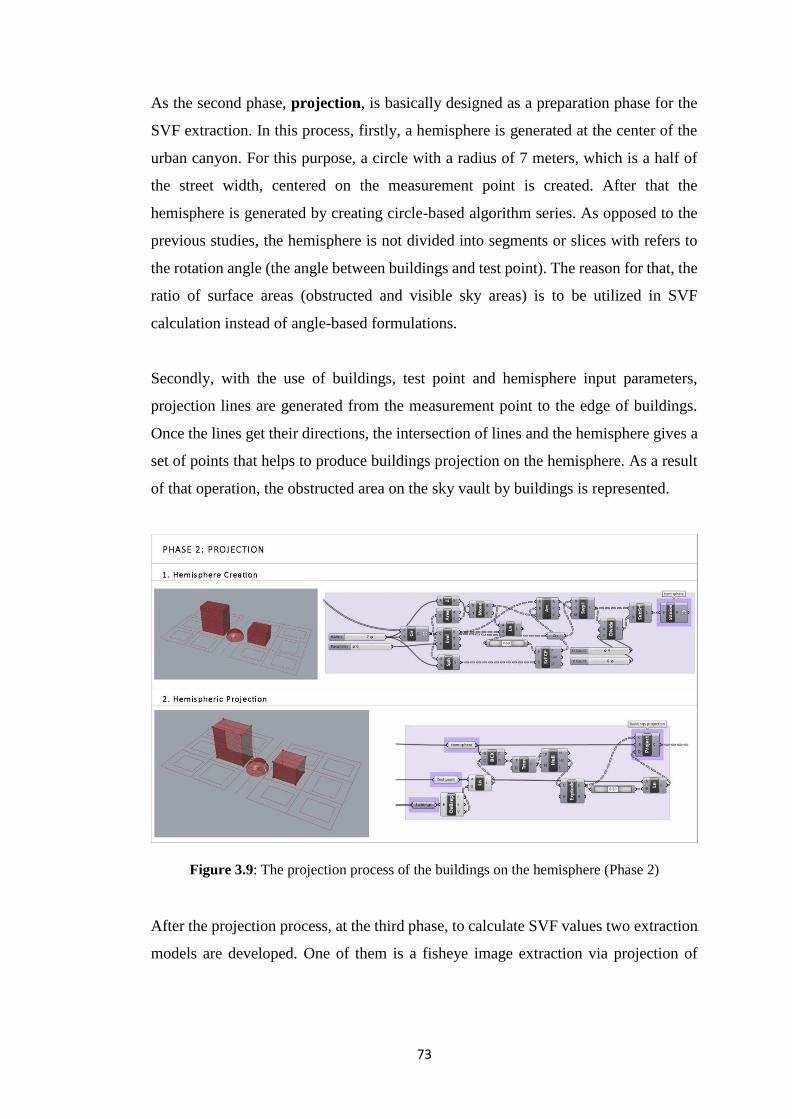
73
As the second phase, projection, is basically designed as a preparation phase for the
SVF extraction. In this process, firstly, a hemisphere is generated at the center of the
urban canyon. For this purpose, a circle with a radius of 7 meters, which is a half of
the street width, centered on the measurement point is created. After that the
hemisphere is generated by creating circle-based algorithm series. As opposed to the
previous studies, the hemisphere is not divided into segments or slices with refers to
the rotation angle (the angle between buildings and test point). The reason for that, the
ratio of surface areas (obstructed and visible sky areas) is to be utilized in SVF
calculation instead of angle-based formulations.
Secondly, with the use of buildings, test point and hemisphere input parameters,
projection lines are generated from the measurement point to the edge of buildings.
Once the lines get their directions, the intersection of lines and the hemisphere gives a
set of points that helps to produce buildings projection on the hemisphere. As a result
of that operation, the obstructed area on the sky vault by buildings is represented.
Figure 3.9: The projection process of the buildings on the hemisphere (Phase 2)
After the projection process, at the third phase, to calculate SVF values two extraction
models are developed. One of them is a fisheye image extraction via projection of

74
buildings on a flat surface, and the other one is a hemispherical SVF extraction from a
3D model. The first model is that fisheye image extraction represents a flat image
showing the visibility of the sky like image-based SVF calculation methods. The SVF
(𝜓𝑠𝑘𝑦) value can be computed by the subtraction of the ratio of circle area, which
represents an unobstructed and clearly visible sky, and the total area of projected
buildings from 1. Then, the UHI (∆𝑇𝑢−𝑟(𝑚𝑎𝑥)) intensity can be calculated with the use
of Oke’s (1987) formulation, which is given as follows:
𝜓𝑠𝑘𝑦 = 1 − 𝐴𝑜𝑏𝑠/𝐴𝑡𝑜𝑡𝑎𝑙
∆𝑇𝑢−𝑟(𝑚𝑎𝑥) = 15.27 − 13.88 𝜓𝑠𝑘𝑦
Figure 3.10: The SVF extraction from the fisheye image model (Phase 3)

75
Figure 3.11: The SVF extraction from the hemispherical projection model (Phase 3)
The second developed model to quantify SVF values is based on the hemispherical
extraction that can achieve more accuracy results than the fisheye image model.
Because of the nature of two-dimensional images of projected urban areas (fisheye
images), the sky vault (hemisphere) is represented as a 2D circular flat area. Therefore,
surface areas of the hemisphere (2𝜋𝑟2) and the circle (𝜋𝑟2) are differentiated from
each other, and thus their sky view factors and heat island intensities result in different
values.
The results of the area calculations, sky view factor and heat island intensity
computations of produced two models are compared in Table 3.1. In the fisheye image
extraction model, the obstructed area by buildings is measured as 31.21 square meter
while the hemispherical model calculates the obstructed area with the same buildings
is 76.44 square meter, however the projection surfaces (circle and hemisphere) also
increase in a similar manner. As a result of the calculation, 0.04 unit difference
between SVF values and 0.63 degree difference between UHI intensities are detected
within this experiment. The evaluation of generated models improves the
understanding of the accuracy of different SVF computation models. Although fisheye
image extraction model is not completely accurate for the SVF and UHI

76
determinations, this model offers a possibility to calculation of SVF values in urban
areas like capturing real fisheye-photography, and to compare SVF result from other
image-based studies, which are widely preferred by researchers.
Table 3.1: The comparison of SVF extraction models
Fisheye Image Model Hemispherical Model
Building 1 20.90 m² 45.71 m²
Building 2 10.31 m² 30.73 m²
Total area of buildings 31.21 m² 76.44 m²
Projected surface area 153.93 m² (circle) 307.87 m² (hemisphere)
SVF value 0.79 0.75
UHI intensity 4.20 °C 4.83 °C
Furthermore, this experimental model is defined by analyzing the nearest two
buildings to the measurement point for the hypothetical urban area. Therefore, heat
island intensity is calculated by using a single SVF value measured in the canyon, but
when the algorithm for the analysis is implemented to an actual urban area, UHI
intensity should be calculated by averaging the SVF values of each measurement point.
Additionally, this algorithmic setting of SVF analysis offers a flexible testing
opportunity to users via changing in the number of buildings to be measured with a
simple move on the number slider.
Figure 3.12 illustrates the differentiation of the building amounts according to their
distances to the measurement point. When the slider is moved from 2 to 6, closest six
buildings to the test point will be automatically selected, and the analysis runs
immediately. In other words, in a short time, additional buildings are projected on the
hemisphere and the new SVF value is calculated. For example, the SVF value for two
buildings selection was calculated as 0.75, but with the addition of four buildings the
SVF result decreased to 0.56. Briefly, this algorithmic model on Grasshopper is
designed to be open to intervention by users, and thus parameters, such as the number

77
of measurement points, distances between these points, and the number of plots and
buildings, for the calculation of sky view factor and heat island intensity, depends on
users’ decisions.
Figure 3.12: The comparison of SVF measurement results of the different number of buildings
3.3.3. Algorithmic Setting of Simulation
Proposing a parametric model, to find better form configurations and to get most
achievable SVF values for the mitigation of UHI intensity, requires an algorithmic
setting of the simulation performance. In order to do that, Galapagos, the evolutionary
solver, is used to test input parameters and to generate alternative or better geometric
forms. Algorithmic sets are organized into two steps, which are differentiated from
each other by the addition of limitations. The first step is principally designed to
evaluate morphological parameters (height, distance, size) via Genetic Algorithm. For
each parameter, simulation is set to run for searching the effect of each change in the
value of the parameters on the visibility of sky. To illustrate, the simulation tool

78
(Galapagos) slightly changes the number slider, which connects to the height
measurement, and finds out which building height is better for the maximization of the
SVF value. Therefore, appropriate and various design results can be obtained
according to the changes in the urban geometry parameters.
The second step is a developed set of algorithm that originated from the first step for
providing an integration between parametric modelling and enforced planning
regulations, and improving the applicability of this simulation tool on the actual urban
areas. Thus, the definition of Building Coverage Ratio (BCR) and Floor Area Ratio
(FAR) are transformed as a limitation into an algorithmic script. The addition of these
algorithms will limit the Genetic Algorithm tool to generating form configurations,
and will ensure that changes on the parameters will stick to the specified building
density ratios by Implementation Development Plans.
Figure 3.13: Workflow of the algorithmic setting of the simulation

79
Simulations of morphological parameters are designed separately from each other to
establish their influences on the sky view factor one-by-one. One of these parameter
is that height has a remarkably effect on the visibility of sky, which is demonstrated
by the simulation. Galapagos tries to find most appropriate building height to
maximize SVF value with a given range of height. As a result of this simulation, best
genomes representing the lowest building height (approximately one-storey building
height) are selected to achieve the maximum value (SVF=0.80). According to the
determined population number for the simulation, Genetic Algorithm sorts a list of
better genomes as many as the population number. The worst genome, which is located
at the bottom of the list, shows the minimum SVF result (SVF=0.62) among the better
ones.
Figure 3.14: The SVF simulation based on the building height
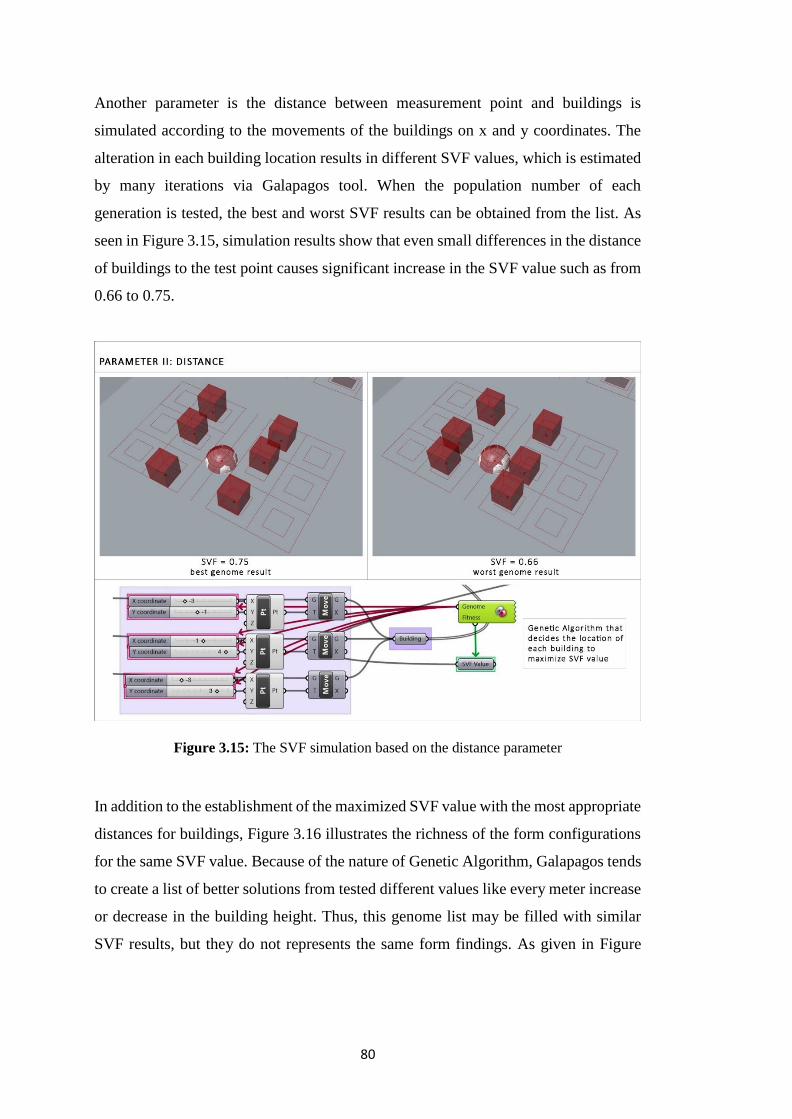
80
Another parameter is the distance between measurement point and buildings is
simulated according to the movements of the buildings on x and y coordinates. The
alteration in each building location results in different SVF values, which is estimated
by many iterations via Galapagos tool. When the population number of each
generation is tested, the best and worst SVF results can be obtained from the list. As
seen in Figure 3.15, simulation results show that even small differences in the distance
of buildings to the test point causes significant increase in the SVF value such as from
0.66 to 0.75.
Figure 3.15: The SVF simulation based on the distance parameter
In addition to the establishment of the maximized SVF value with the most appropriate
distances for buildings, Figure 3.16 illustrates the richness of the form configurations
for the same SVF value. Because of the nature of Genetic Algorithm, Galapagos tends
to create a list of better solutions from tested different values like every meter increase
or decrease in the building height. Thus, this genome list may be filled with similar
SVF results, but they do not represents the same form findings. As given in Figure

81
3.16, as a result of the distance simulation, the building-plot relations according to the
location of buildings is represented with different solutions for the same SVF (0.70)
value.
Figure 3.16: Different form configurations for the same ‘distance simulation’ result
Changes in the building coverage area, which is defined as a size parameter, is also
simulated for getting a wide range of SV results. Due to the height of the buildings is
fixed in a certain value, an increase in the floor area of the buildings directly affects
their volume that results in a decrease of SVF value. The main logic of this simulation
is based on a scale tool that can control the size of the building with a specified scale
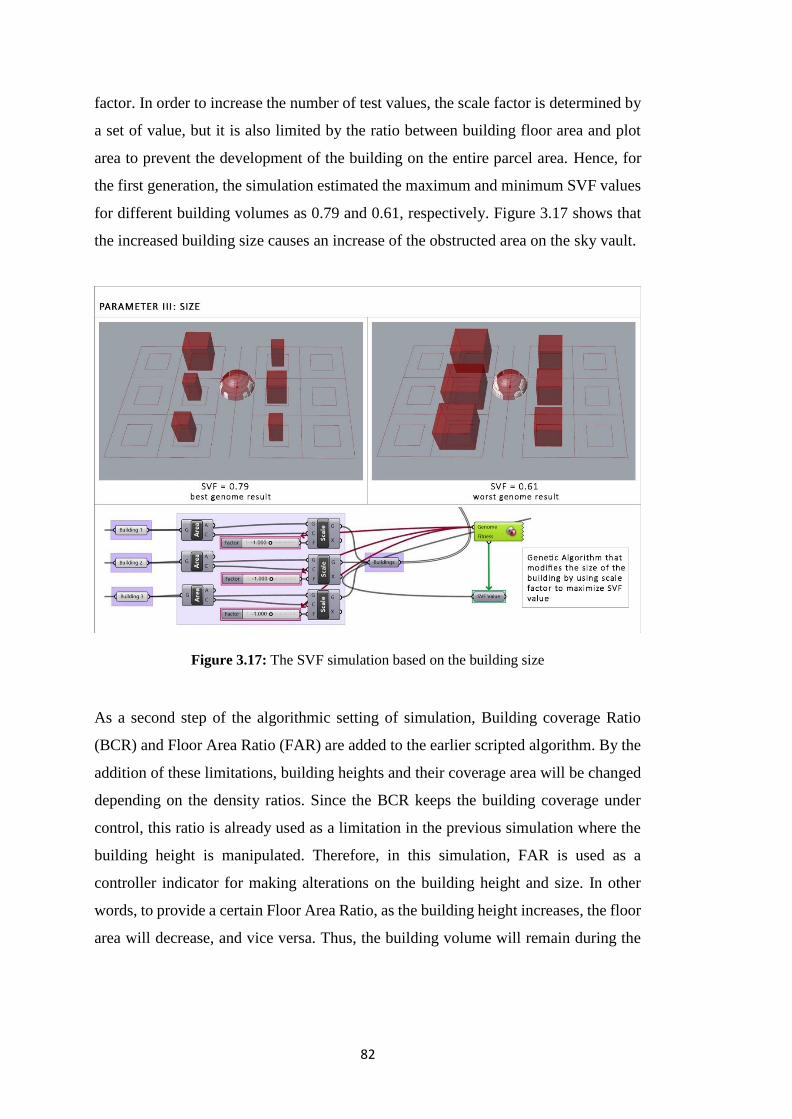
82
factor. In order to increase the number of test values, the scale factor is determined by
a set of value, but it is also limited by the ratio between building floor area and plot
area to prevent the development of the building on the entire parcel area. Hence, for
the first generation, the simulation estimated the maximum and minimum SVF values
for different building volumes as 0.79 and 0.61, respectively. Figure 3.17 shows that
the increased building size causes an increase of the obstructed area on the sky vault.
Figure 3.17: The SVF simulation based on the building size
As a second step of the algorithmic setting of simulation, Building coverage Ratio
(BCR) and Floor Area Ratio (FAR) are added to the earlier scripted algorithm. By the
addition of these limitations, building heights and their coverage area will be changed
depending on the density ratios. Since the BCR keeps the building coverage under
control, this ratio is already used as a limitation in the previous simulation where the
building height is manipulated. Therefore, in this simulation, FAR is used as a
controller indicator for making alterations on the building height and size. In other
words, to provide a certain Floor Area Ratio, as the building height increases, the floor
area will decrease, and vice versa. Thus, the building volume will remain during the

83
simulation process.
As seen in Figure 3.18, the algorithm is defined for building groups, which are located
in the same block. Hence, the height and size of the buildings are modified en masse
for those who want to create a more homogenous form with uniformity. As a result of
the simulation, the best SVF (0.69) value is obtained from the building typology, which
has the lowest height and the widest floor area. Also, simulation results show that the
narrowest and highest buildings cause the worst SVF (0.66) value when the building
volumes are kept constant.
Figure 3.18: The SVF simulation based on the Floor Area Ratio (for all buildings)
When the algorithm of the simulation is manipulated for the implementation of this
script to the each building in the study area, a wider variety of proposals has been
obtained. Because of the calculation of the SVF value is based on the projection of the
buildings on the hemisphere, any changes on the height and size of the buildings result
in different SVF values. Thus, Genetic Algorithm tries to find which arrangement will

84
be better for obtaining the maximum SVF value by investigating the height and size
values given in a certain range. As seen in Figure 3.19, the simulation result represents
preferable form configuration for the best SVF (0.69) value. According to the
simulation, the fittest SVF result can be achieved when the nearest buildings to the
measurement point are higher and narrower than the other buildings. The comparison
of these two from alternatives shows that, even if the building volumes are the same,
the height and width of the buildings cause better SVF values according to buildings
location.
Figure 3.19: The SVF simulation based on the Floor Area Ratio (for each building)

85
Additionally, different form configurations, which are obtained from the same
simulation, are given in Figure 3. During the fitness process, Galapagos calculated
SVF values by testing different height and size values for each building while
maintaining the building volume. As seen in Figure 3.20, the tool of Genetic Algorithm
establishes different design alternatives, which cannot be predicted or achieved by the
calculation of SVF values by designers and planners. Therefore, this tool provides
better solutions for the mitigation of UHI by maximizing the SVF value with many
form alternatives.
Figure 3.20: Different form configurations for the same ‘FAR simulation’ result

86

87
CHAPTER 4
APPLICATION OF THE MODEL IN ACTUAL URBAN CONTEXT:
PERFORMANCE ASSESSMENT OF AN URBAN TRANSFORMATION
As a main aim of this study, a parametric model has been developed to mitigate Urban
Heat Island (UHI) effect that is based on urban geometry components. By using three-
dimensional building data of urban areas, SVF values can be calculated to estimate
heat island intensity. In this context, the proposed model is utilized for analyzing
geometrical features of selected urban areas, calculating SVF values and heat island
intensity of that areas, and generating form compositions to achieve the minimized
effect of UHI development. For the demonstration of the applicability of the proposed
parametric model, and for the integration of parametric modelling with urban design
and urban planning practices, this model should be applied and experienced in an
actual urban context.
Therefore, new housing development areas, which are transformed through urban
regeneration projects, can be considered for the selection of the case study area. By
applying this proposal to the urban regeneration area, a comparison can be made
between demolished informal fabric, renewed (existing) urban fabric and design
alternatives to be generated by the model in regard to their contribution to the UHI
effect.
Another aspect of the case area selection criteria is that while the scope of urban
regeneration projects generally aims to provide livable housing and complementary
infrastructure facilities, and thus transformation practices only give priority to the

88
improvement of the indoor environment quality by neglecting thermal comfort of the
outdoor environment. Despite numerous studies have been conducted to emphasize
emerging problems from increased UHI effect in urban areas, mitigation strategies
couldn’t gain a place in urban design and planning practices in Turkey. In this respect,
the application of the proposed parametric model on the renewed urban area can give
an idea that the site may be designed differently, by generating many design
alternatives that mitigate the heat island intensity.
In addition, the implementation of this proposal over an actual urban area also provides
designers and planners to be able to use the parametric modelling tool at an early stage
of design and planning processes. Aim of this study is to provide an integration
between parametric modelling and the development planning system on the basis of
the climate-responsive urban design approach, and thus the model will promote
parametric thinking, and open up new discussions in this regard.
For the case study area selection from one of the neighborhood areas in the city of
Ankara, remarkable changes in land use of Eskişehir road and its surroundings, which
is defined as a developmental center line by upper scale decisions, have been taken
into consideration. Many investments, such as public institutions, shopping malls,
colleges and business centers, that have been increasingly located in that place cause
to accelerate the transformation of informal housing areas. Therefore, Mustafa Kemal
neighborhood is determined as the study area where the most intensive and rapid
development in the region is experienced.
4.1. Case Study Area: Mustafa Kemal Neighborhood
Mustafa Kemal Neighborhood is a developed part of the city where public institutions,
business centers and residential-office mixed project areas haven been mainly taken
place in recent years, and thus this neighborhood area can be considered as a transit
zone between these new developments due to it maintains its residential building area
characteristics. Because of the southwestern corridor of Ankara has a tendency to

89
develop and transform rapidly, the land use of this neighborhood has been changed by
investments, upper scale plans, and implementation plans decisions.
When the land use maps for the years of 1970, 1997 and 2005, which are prepared by
the Ankara Metropolitan Municipality, are examined, in 1970, it is seen that Mustafa
Kemal neighborhood consisted of a few public institutions and housing areas, which
were mainly dominated by informal dwellings. At the beginning of the 1980s, as a
result of the implemented development plans, there were predominantly 1-2 storey
buildings in the area. In 1988, the building density of this area was increased for the
first time by suggesting 2-3 storey buildings through reclamation development plans.
Following this development, in the 1990s, due to the increase in the development of
the central business area where the public institutions increasingly located on the
Eskişehir road, it was decided to increase each building height by one floor (not
exceeding 4 floor) by changing previous plan decisions with revision plans (Eceral et
al., 2010). Thus, as seen in Figure 4.2, the land use of this area has changed
considerably from 1970 to 1997.
Figure 4.1: Land use situation of Mustafa Kemal Neighborhood in 1970 (Source: Eceral et
al., 2010)

90
Figure 4.2: Land use situation of Mustafa Kemal Neighborhood in 1997 (Source: Eceral et
al., 2010)
Figure 4.3: Land use situation of Mustafa Kemal Neighborhood in 2005 (Source: Eceral et
al., 2010)
Figure 4.4: Satellite image of Mustafa Kemal Neighborhood in 2018 (Source: Google Earth)
By 2000s, it is observed that in Figure 4.3, the land use was varied with an increasing
number of public institutions, residential areas, industrial areas and also urban service
areas. At that period, the Ankara Metropolitan Municipality established a new master
plan, which is named as 2023 Capital Ankara Master Plan. According to the master
plan report, the total population of Mustafa Kemal neighborhood was 5349, and the
size of that area was 369 hectares in 2000. This report indicated that the size of

91
developed areas was 54 hectares while the informal housing areas covered an area of
6 hectares. Additionally, it was reported that there were 168 people living in the
squatter houses, but the population at that settlement was increased to 528 people with
reclamation development plans.
Moreover, this master plan provided an intervention by declaring urban transformation
and regeneration project areas at two sites in this neighborhood. As given in Figure
4.5, the urban regeneration areas contain unplanned housing developments, which are
surrounded by central business areas. In these areas, it was envisaged to make urban
transformation projects that based on renewal strategies by providing transfer of
development rights, and to build a healthy urban environment by improving housing
durability. From 2000s to present, the urban fabric has remarkably changed that is
related to upper scale plan decisions. Accordingly, a sub-part of the transformed
housing area is selected as a case study area.
Figure 4.5: 2023 Master Plan decisions for central-west area of Ankara (Source: Ankara
Metropolitan Municipality, 2006)
Figure 4.6: Case study area selection from Mustafa Kemal neighborhood

92
Figure 4.7 illustrates the transformation of the informal housing area into a regular
planned area in the sub-part of Mustafa Kemal neighborhood between the years of
2005 and 2018. The case study area is a typical exemplification of the intervention on
the shanty settlement (a) by superimposing an ordinary plan layout. Even though this
settlement does not carry all morphological characteristics of a typical informal urban
fabric (a higher density, a more tight tissue, etc.), this area still represents that typology
in general terms. Moreover, because the transformed housing area (b) has a different
morphological characteristics (density, layout, etc.) from mass housing areas, which
are produced through urban regeneration projects, and also has a homogeneous layout,
this area can be considered as a representation of a typical residential area in the
context of urban planning practices in Turkey. Therefore, selection of this area may
provide an appropriate base for the investigation of UHI effect.
Figure 4.7: Satellite images of the case study area for 2005 (a) and 2018 (b) years
Figure 4.8: Comparison of the figure-ground map of the informal housing area (a) and the
transformed housing area (b)

93
Figure 4.9: Comparison of the street network of the informal housing area (a) and the
transformed housing area (b)
4.2. Case Study Analysis: SVF Calculation
As a first stage of the application of the proposed model is that analysis of the case
study area to calculate SVF values. By introducing this area to the customized
algorithmic setting, the model automatically responses to the requirements. After
defining morphological components (block, plot and building) of the area and creating
spines between the blocks, the algorithm can be intervened while running to determine
measuring points according to the morphological characteristics of that field, such as
street width, building size and distances between buildings. For example, the radius of
the hemisphere is set as 6 meters for that area where the actual width of the street is
10-15 meters. In other words, the radius is determined as half of the street width to
ensure that the base of the hemisphere fits on the street.

94
Figure 4.10: Algorithmic setting of the building selection for each measurement point
Also, as seen in Figure 4.10, in order to ensure a homogenous measuring point
distribution, the distance between each measurement point is specified as 30 meters.
Then, for the selection of the buildings to be projected on the hemisphere, the distance
between measurement point and buildings’ centroids is defined as 30 meters to limit
the building selection. The reason behind the determination of the distance between
measurement points and buildings is that the SVF calculation for an urban area should
include all buildings in that area. Therefore, the specified distance for this study
ensures that at least 2 buildings can be projected on the hemisphere. Also, the distance
(30 meters) prevents the selection of more than 6 buildings to avoid the iteration of
building projection.

95
By multiplying this sub-algorithm, selection of all buildings to be used for SVF
calculation is provided. Figure 4.11 illustrates application of the algorithms to all
components, which are represented with different colors, such as selected buildings
are light-red, hemispheres are dark-red and surface area of projected buildings are
white colored.
Figure 4.11: Application of the algorithmic set of analysis on the area
Additionally, Figure 4.12 shows the setting of algorithms that is used for SVF
calculation. The set of algorithm for building data provides an information to the next
step, which is based on the building selection and SVF calculation of each
measurement point by using selection results. As seen at the right-bottom of the same
figure, all SVF values from measurement points are aggregated in one single algorithm
that calculates average SVF value to use as an input data for the UHI intensity
equation. Briefly, by applying this analysis, SVF values for each point, the mean SVF
value of the whole area, and UHI intensity of that area can be calculated.

96
Figure 4.12: Algorithmic setting of the analysis phase of the proposed model
In the case study area, SVF calculation results can be differentiated from one
measurement point to another one due to these points are well-distributed on the area
to ensure the selection of all buildings. Each SVF value represents one of the
morphological characteristics of the study area, and thus the mean SVF value can give
an idea about the whole area. Accordingly, Figure 4.3 shows two different
measurement points with different SVF values because of their surroundings. One of
them is surrounded by 4-5 storey buildings while the other one is not obstructed by
any building, so their sky view factors are calculated as 0.66 and 1.0, respectively.
Figure 4.13: Detail sections from the SVF calculations

97
Figure 4.14: Comparison of measurement results (SVF and UHI intensity) of informal and
actual urban transformation areas
In the context of the SVF calculation, to compare the current state of the case study
area with its informal fabric before the implementation of urban transformation, the
analysis phase of the proposed model is applied on both of them. As stated in the
algorithmic setting of analysis section in the previous chapter, the proposed model
applies both the SVF measurement algorithm and Oke’s (1987) formulation to
calculate UHI intensity, which is based on the SVF result. Therefore, by applying this
algorithm both former and current states of the area can be analyzed. As a result of the

98
application it was found that the informal housing area with 1-2 storey buildings have
a higher mean SVF value (0.91) than the formal one (SVF=0.75). Thus, heat island
intensity was calculated in lower degree (2.48°C) at there. By increasing building
density with plan decisions, the contribution of the newly developed housing area to
the magnitude of UHI effect is also increased. As a result of this analysis, comparison
of the alteration in land-use at the same area shows the importance of morphological
indicators of urban geometry on the UHI development.
4.3. Simulation Application for the Mitigation of UHI Effect
As a second stage of the proposed model, a simulation is applied on the case study area
to search form variations that mitigate heat island intensity compared to the current
state of the area. In this context, a specified Floor Area Ratio (FAR), which is given
by the Implementation Development Plan of this area as 1.3 ratio, is used as a
limitation during the all simulation processes. Implementation of this ratio ensures the
building volume to remain constant in each simulation for different scenarios. Also,
the usage of the same limitation provides adherence of generated form compositions
and design alternatives to plan decisions to be able to compare all simulation results
with informal and formal fabric of this area where the transformation is occurred
according to this plan decisions. To generate various form variations to discuss
changes in the typological formation of the area, a few scenarios are determined in
regard to the UHI effect. By defining different type of scenarios, this research aims to
test well-known urban forms in the urban design practices. In addition, simulation
results provide a discussion of the effect of changes in the height-to-width ratio on the
heat island intensity for each formation. By modifying size and distance parameters
during the simulations to test changes in the building and street setbacks, different
building forms have been obtained that apart from the specified form generations by
scenarios. Thus, the comparison of SVF values and H/W ratios for the changes in the
building forms and open spaces between buildings provide a better understanding of
the effect of urban geometry on the UHI development.

99
4.3.1. Generation of Form Variations
By applying simulation on the case study area, four main types of urban forms have
been obtained in regard to the scenarios. The first scenario is formed on the basis of a
typical formation, which is called as point block formation. Point blocks present a
placement of the block as model for compact urban form by current urban demands.
The point block’s typology consists of low-rise buildings (6 storey or less), mid-rise
buildings (within a range of 7 to 12 storey), and high-rise buildings (13 storey and
above). It can also be described as a block, which is isolated from other buildings, and
is located on its own plot without sharing any walls with the next building. Therefore,
this type of formation contains front and back yards, also has side yard setbacks to
avoid an intersection with other buildings. The second scenarios is determined to
represent row-housing development. Unlike the point block formation, the row-house
model usually tends to have lower building height, which is typically between 2 and 5
storey. In other words, the row-house models are formed by a group of low-rise
residential buildings, and are arranged in a sequence of rows. This type of long and
narrow strip series of houses that shares both sides of their walls to provide a parallel
orientation to the street. Thus, this arrangement allows each building to have a deep
rear yard by omitting front and side yards to create continuous isolated private spaces.
As opposed to the arrangement of row-housing development, the third scenario is
based on the shortening of the long rows by placing buildings perpendicular to the
street line. This type of formation, which can be called as converted row-housing
development, consists of 3 or 4 storey buildings, and presents narrow house typology
because it has usually no more than 10-13 meters depth. The converted row-house
model shares one-side of wall with the next building, and thus only side yards become
private spaces by neglecting front and rear yards. Lastly, the fourth scenario is formed
as a particular type of perimeter blocks. The perimeter block formation demonstrates
a direct relationship between street and buildings, and forms isolated common spaces
between the buildings. The type of perimeter block provides public facing edge where
buildings are arranged parallel to the street line, and locates private spaces within the
block. This formation also presents multiple dwellings with 2 or 3 storey. In brief,

100
during the simulations, four different architectural forms (the point block, the row-
house, the converted row-house and the perimeter block) have the same Floor Area
Ratio (FAR) to provide same density, but they present divergent microclimatic
conditions in terms of heat island intensity.
For the first scenario, the simulation algorithm is specified to test point block typology.
Due to the same Floor Area Ratio (1.3) is determined for all plots in the case study
area, the floor area of the buildings decreases as building height increases. In addition,
the same building height for each plot has been provided intentionally to get
homogeneous urban tissues. Thus, simulation results can be classified as low-rise
buildings and mid-rise buildings. As given in Figure 4.15, for the same building
density, changes in the building heights directly affect the mean SVF values, and thus
contribute to the magnitude of heat island intensity. Also, Table 4.1 illustrates changes
in the building height, the average footprint area and the Building Coverage Ratio
(BCR) in regard to the fixed Floor Area Ratio (FAR).
Table 4.1: Simulation results of the first scenario
For example, the 3-storey point block formation, with the average footprint of
buildings as 379 m², causes 4.78°C heat island intensity. When the building height
increases from 3-storey to 6-storey, the UHI intensity has reached up to 4.89°C. Hence,
simulation results show that increased building sizes on the vertical plane have greater
effect on the rise in the air temperature than the horizontal one. In other words, the
UHI effect increases as the building height increases.
FAR BCRBuilding Height
(m)
Average Footprint
Area (m²)Average SVF Value
1 1.3 0.42 9 379 0.7553
2 1.3 0.30 12 271 0.7506
3 1.3 0.25 15 224 0.7492
4 1.3 0.20 18 181 0.7473
5 1.3 0.16 24 143 0.7511
6 1.3 0.12 30 110 0.7617

101
Figure 4.15: Comparison of simulation results for the first scenario
102
However, even if it seems that low-rise buildings have an advantage in heat loss up to
a certain height (up to 8-storey), increased porosity level, which is caused by increasing
building height (over 8-storey) with decreasing footprint size, conduces to a decrease
in heat island intensity (0.20°C). Increased open spaces between buildings that provide
high level of visibility of sky help to reduce ambient air temperature by increasing the
emittance of long-wave radiation. Therefore, compact urban tissues may become
disadvantaged for the mitigation of UHI effect. As a result of these simulations, the
increase in the building height can be interpreted as an influential factor, but at that
point, open spaces between buildings (setbacks, street with) may gain priority than the
building height in terms of the magnitude of heat island intensity.
In the case of first scenario, the point block formation, further simulations are
generated to test mixed building heights, and to achieve better results for the mitigation
of UHI intensity. Therefore, simulation algorithm is set up to ensure that each building
will provide the specified Floor Area Ratio (1.3) within its own plot, regardless of
other building heights. In other words, for this simulation, Genetic Algorithm tests all
possibilities for each building by changing their heights. To provide the test of many
possibilities, the necessity of establishing buildings at the same height in the same
block has been neglected.

103
Figure 4.16: Design variations for the first scenario (from 1st to 6th generation)

104
Figure 4.17: Design variations for the first scenario (from 7th to 15th generation)

105
As seen in Figure 4.16 and Figure 4.17, the task of the simulation is to generate point
block forms with the optimum values (the maximum SVF value with the minimum
UHI intensity) for the specified building area. The minimum values of UHI intensity,
which are represented as best genome results for each generation, outline the
dimension of form-based heat island mitigation. To ensure the high level of various
possibilities, and to achieve fittest results, this simulation tests 15 generations with 50
genomes (form samples) in each generation that makes totally around 750 (15x50)
form samples. Even though the simulation results have some similar form variations,
the different best and worst results are presented. The comparison of produced a series
of form variation results show that the minimum heat island intensity (4.52°C) with
0.77 mean SVF value has been obtained at the 15th generation. The building typology
of this formation consists of 4 to 8 storey buildings that averagely has 18 meters height
(average 6-storey blocks). The simulation results also show that the imperceptible
changes in the building heights can provide a decrease in the air temperature.
For the second scenario, building size and distance parameters are mainly modified to
generate row-housing development via simulation algorithm. Figure 4.18 illustrates
the comparison of the mean SVF values and UHI intensity results for each generation.
Additionally, Table 4.2 gives an information about the changes in the building heights,
sizes and ratios. As opposed to the first scenario, the effect of increased setbacks on
the UHI development is tested for the same building typology in the second scenario.
Table 4.2: Simulation results of the second scenario
Simulation results show that an increase in the building height causes an increase in
the air temperature. To illustrate, the highest UHI intensity (6.06°C) with the lowest
mean SVF value (0.66) is calculated for the highest building typology. (5-storey
FARAverage
BCR
Building Height
(m)
Average Footprint
Area (m²)Average SVF Value
1 1.3 0.55 6 571 0.7229
2 1.3 0.27 15 276 0.6629
3 1.3 0.40 9-12 417 0.6974
4 1.3 0.40 9-12 417 0.7997

106
buildings). Due to the row-housing development consists of narrow canyons with long
façade facing streets, building height become one of the most important factor for this
formation. However, simulation results also show that the UHI effect can be reduced
by modifying setbacks to increase the open spaces between buildings, and to promote
heat loss within that spaces. For example, when the front yard setbacks are modified
by the simulation, heat island intensity decreases from 5.58°C to 4.16°C for 3 or 4
storey blocks. As a result of that, because the street-lined building rows cause narrow
urban canyons, the UHI effect can be mitigated by providing wider distances between
buildings.
Figure 4.18: Comparison of simulation results for the second scenario

107
The third scenario is also formed on the basis of the row-housing development with a
main difference from the former scenario. To avoid the formation of long narrow urban
canyons, which is one of the greatest contributors to the UHI development, and to
promote permeable street patterns by minimizing street-facing facades, converted row-
housing development is specified as the third scenario. Unlike the parallel orientation
to the street line, in this simulation, building rows are arranged perpendicular to the
street axis. As given in Figure 4.19, converted row housing typology consists of 3-4
storey buildings. Also, Table 4.3 illustrates the changes in the Building Coverage Ratio
and average footprint areas for different building heights.
Table 4.3: Simulation results of the third scenario
FARAverage
BCR
Building Height
(m)
Average Footprint
Area (m²)Average SVF Value
1 1.3 0.50 6-9 507 0.7501
2 1.3 0.38 9-12 391 0.7489
3 1.3 0.38 9-12 391 0.7464
4 1.3 0.38 9-12 391 0.7369

108
Figure 4.19: Comparison of simulation results for the third scenario
Through the comparison of the first (2-3 storey blocks) and second (3-4 storey blocks)
simulation results, the effect of building height on the magnitude of heat island
intensity is determined. When the height of each building is increased by 3 meters (1-
storey), the mean SVF value decreases by 0.1 that leads to an increase of 0.2 degrees
in the air temperature. Additionally, by comparing the results of third and fourth
simulations, the influence of the side yard setbacks of buildings with the same height
on the UHI effect is examined. The changes in the side yard setbacks result in wider
or narrower distances between buildings, which are located in the same block. Since
the SVF measurement was made on the street axis to examine the formation of UHI

109
effect for urban canyons, the correlation between heat island intensity and distances
between buildings within the blocks could not be defined exactly. Nevertheless, as a
result of that simulations, a decrease in the mean SVF value (from 0.74 to 0.73) with
an increase in the UHI intensity (from 4.90 to 5.04) was observed.
The last simulation, which is specified as perimeter block formation, is based on the
increment of the size of courtyards. Since this simulation provides the same Floor Area
Ratio (FAR) for each block, the changes in the open spaces between buildings directly
affect the building height. This typology creates narrow street canyons due to the
configuration of the perimeter block model, and thus flanked streets by buildings
causes the development of UHI effect. As given in Table 4.4, the lowest building
typology (1-2 storey buildings) has the highest SVF value (0.7408), which decreases
as the building height increases.
Table 4.4: Simulation results of the fourth scenario
As a result of that formation, the minimum heat island intensity (4.98°C) was
demonstrated. On the contrary, the highest UHI intensity (5.63°C) with the lowest SVF
value (0.6941) was observed at the third simulation result that generates 3-storey
narrow buildings. Nevertheless, as seen in Figure 4.20, as the building height
decreases, the floor area of buildings expands, so the internal space of the blocks gets
narrower that might cause a rise in the air temperature in that areas.
FARAverage
BCR
Average Building
Height (m)
Average Footprint
Area (m²)Average SVF Value
1 1.3 0.79 3-6 770 0.7408
2 1.3 0.68 6 657 0.7116
3 1.3 0.54 9 524 0.6941

110
Figure 4.20: Comparison of simulation results for the fourth scenario
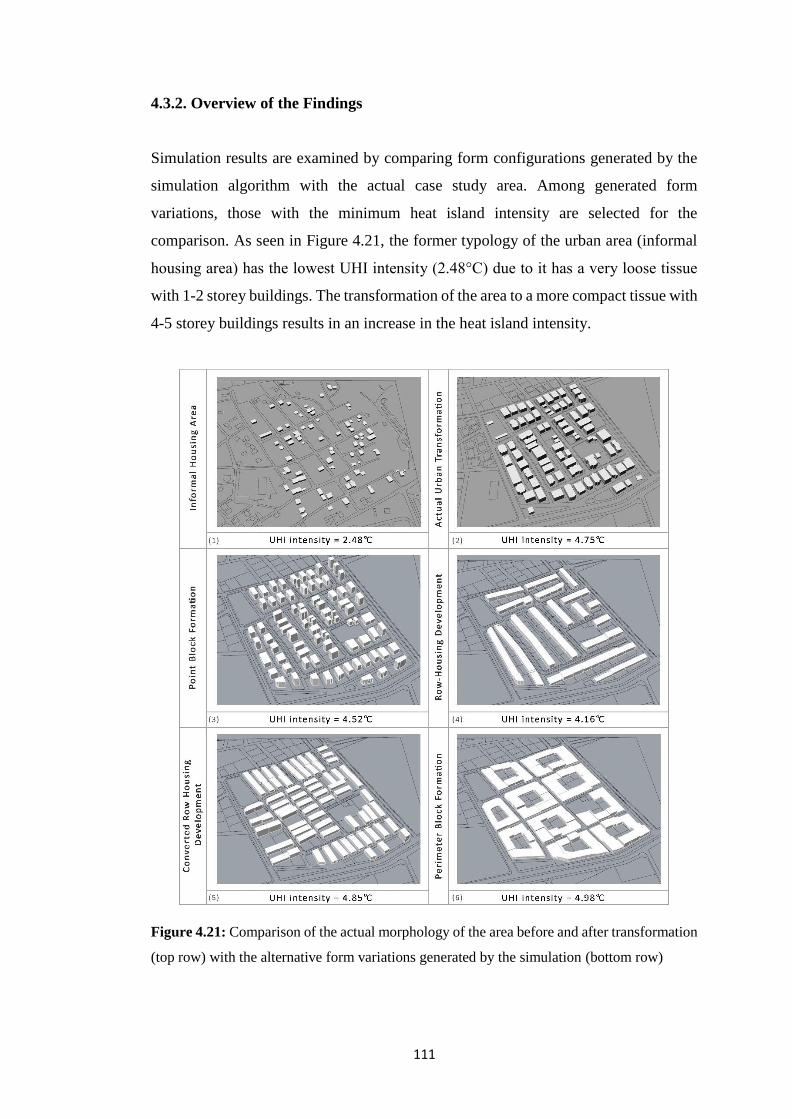
111
4.3.2. Overview of the Findings
Simulation results are examined by comparing form configurations generated by the
simulation algorithm with the actual case study area. Among generated form
variations, those with the minimum heat island intensity are selected for the
comparison. As seen in Figure 4.21, the former typology of the urban area (informal
housing area) has the lowest UHI intensity (2.48°C) due to it has a very loose tissue
with 1-2 storey buildings. The transformation of the area to a more compact tissue with
4-5 storey buildings results in an increase in the heat island intensity.
Figure 4.21: Comparison of the actual morphology of the area before and after transformation
(top row) with the alternative form variations generated by the simulation (bottom row)

112
Comparison of alternative form variations shows that the formation of narrow urban
canyons causes an increase in heat island intensity. For example, the perimeter block
formation has the highest UHI intensity (4.98°C) due to the building arrangement of
this typology that promotes the formation of narrow canyons. Even though the row-
housing development consists of long canyons that are aligned with attached buildings,
increased front yard setbacks provide a wider canyon effect. Therefore, the lowest heat
island intensity (4.16°C) has been obtained.
Based on that findings, the variety of form compositions shows that compact urban
tissues have disadvantages on the thermal balance of urban canyons. The compactness
level affects the rate of heat loss that might be perceived as a rise in the ambient air
temperature. As the permeability of urban tissues increases with changes in the
building size, the visibility of sky increases that promotes the stored heat release.
Therefore, loose urban tissues seem to have a lower heat island intensity. Briefly, based
on that evaluations, it is seen that the building height, the street setbacks, the continuity
of street-facing facades and the porosity level of the urban tissue are the key variables
to mitigate heat island intensity.
Within the context of this study, the proposed model gives ideas about the effect of
variables on the UHI development by comparing generated form variations. The
generative design approach has been carried out to overcome the issue of UHI effect
in urban areas by integrating analysis and simulation processes. Therefore, the
application of the model enriches the possibility of design solutions that might be
guidance to the need for the mitigation of UHI intensity.
113
CHAPTER 5
CONCLUSION
The aim of this research is to investigate the potentials of parametric modelling for
analyzing morphological components of urban areas, and generating form variations
to mitigate the Urban Heat Island (UHI) effect. This chapter presents a comprehensive
summary of the research to identify the relationship between urban geometry and the
development of heat island intensity, and to emphasize the need for an integrative
model of analysis and design processes to mitigate UHI effect in urban areas. Most
importantly, this research proposes a parametric model as a methodology to bring an
analytical and generative perspective to urban design and planning practices with
regard to the problematic issue of UHI development. Therefore, based upon the
extensive discussions on the initial discussions on the objectives, methodology and
outcomes of the application of the model in an actual urban context, the final chapter
seeks to improve a better understanding of the use of parametric modelling tools for
further heat island studies.
5.1. The Main Problematic Issues to Revisit
The phenomenon of Urban Heat Island (UHI) has been one of the major issues
regarding the perceived thermal comfort and spatial quality of the urban environment.
The attention to this issue has been increased in recent years due to changes in the
thermal balance of the environment, as an outcome of the urbanization, brought several
problems that directly affect the urban livability. Emerging problems from increased
heat island effect require new methodological approaches to mitigate that effect by

114
specifying and modifying the influential factors on the development of heat island
intensity. Based on that arguments, this research identified the formation of UHI effect
with basic physical principles of energy balance, and the main contributors, such as
urban population, urban geometry, surface materials, lack of vegetation areas and
anthropogenic heat release, to heat island effect in the literature review chapter.
Detailed definitions and explanations showed that the increase in the ambient air
temperature is mainly caused by changes in the energy fluxes. To make it more clear,
higher air temperature in urban areas can be explained by increased energy storage
capacity through absorption and storage of solar radiation in higher amount. Moreover,
inadequate reflection of incoming radiation and reduced heat loss cause a more
intensive UHI effect. Controlling all these energy fluxes (heat gain, heat loss and heat
storage) to mitigate UHI intensity requires taking into account all influential factors in
the urban environment. However, the aim of this study was formed on the basis of
improvement of the generative urban design practices in regard to the mitigation of
UHI effect, so the effect of thermal properties of surface materials, anthropogenic heat
sources, evaporative surfaces (vegetation areas and water bodies), climatic conditions
and geographic features of urban areas on the UHI development are not within the
scope of this study. Considering the dimension of the relation between heat island
intensity and differentiation in the urban morphology, this research was designed to
demonstrate the effect of geometrical features of urban areas while characterizing the
calculation of UHI in regard to the urban geometry.
In the literature review chapter, it has been emphasized that, urban geometry has a
certain effect on the UHI intensity by generating deep and narrow urban canyons,
which limit the visibility of sky. In other words, the form of the urban fabric can restrict
the emittance of long-wave radiation that results in the reducement of the heat loss.
That is why, the methodological approach of this study was formed on the calculation
of UHI intensity by using Oke’s (1987) formulation, which is based on the
measurement of Sky View Factor (SVF). Determination of the visibility of sky
between buildings by measuring SVF value varies depending on the components of
the urban form. Within the context of this study, these components were specified to

115
the findings of the previous heat island studies.
At the end of the literature review part, the outcomes of the existing methods on the
heat island investigations show that simulation-based studies have the lack of
searching form variations to achieve better design proposals in regard to the mitigation
of UHI intensity. Previous studies in the field of urban morphology and heat island
relation have presented limited number of tested form configurations, and restricted
knowledge on the generative design solutions in the context of urban tissue formation.
Based on that evaluation, it has been seen that the gap in this field necessitates the
development of new tools to promote urban design and planning practices into the
generative perspective. That is why this study put forward a new methodological
framework for the concept of the mitigation of UHI effect. Within the context of this
study, a new model has been proposed by introducing parametric modelling tools.
In the third chapter, methodical approach and algorithmic settings of the proposed
model have been introduced. Based on the proposed parametric model, this research
enriches decision making mechanism in the design process by implementing Genetic
Algorithm into the urban form and pattern generation operations. The application of
the model, which integrates analysis and simulation processes, provides designers to
specify parameters in regard to their design issues, and to produce alternative design
solutions according to analysis results by presenting a flexible and performative design
tool. Even though there is a number of experienced limitations throughout the research
process, the application of this parametric model on an actual urban context provides
many contributions.
In the fourth chapter, specifically to examine the outcomes of the application, the
model proposal was applied on the selected residential area in the Mustafa Kemal
neighborhood. For the application of the model, algorithmic set of analysis was
customized to use of 3D building data, which provides information about the building
height, building size, and distances between buildings, of the area in order to calculate
SVF values and UHI intensities. It should be noted that other parameters, such as
material information of buildings, type of ground coverages, vegetation areas, traffic

116
related heat release and weather conditions, of the case study area were neglected, and
thus only geometrical features of this area have taken into consideration throughout
the research. Therefore, calculated heat island intensities only represents the heat
increase based on the urban form.
Additionally, in the simulation process, form compositions and configurations were
generated to mitigate UHI intensity with regards to the basic building codes within the
development planning system in Turkey. These codes, in turn, have been utilized as
the parametric indicators of the algorithmic model. That is why, the Floor Area Ratio
(FAR) was determined as the independent variable of the model to maintain the same
building density of the case study area while modifying other morphological
parameters such as setback distance, height and floor coverage. Thus, changes in the
input parameters were kept within a certain range by using limitations that provides to
generate comparable form compositions within the same layout. From those
implications it has been seen that form variations generated by the proposed model
presented divergent heat island intensities. Therefore, application of the model and
evaluation of the simulation results provided many contributions to the generative
design approach in regard to the heat island studies.
5.2. Main Findings and Contributions of the Research
Application of the proposed model on the actual urban context provided analysis and
simulation results with generated form compositions for that area. Main findings of
this research are derived from the simulation results that indicate UHI intensity varies
in accordance with the morphological formation. Comparison of the generated four
types of urban forms (point block, row-housing, ‘converted row-housing’ and
perimeter block) do apparently demonstrate divergent results.
Simulation result of the point block formation show that permeability level of the urban
tissue is the key to mitigate UHI intensity. The wider open spaces between buildings,
which are provided by increasing building heights, promote heat loss with a higher
ratio of the visibility of sky. As building height decreases, the compactness level of the

117
urban tissue increases that leads to a rise in the ambient air temperature. Based on that
findings, it has been seen that loose urban tissue with mid-rise buildings has a lowest
UHI intensity among the other point block formations. Nevertheless, it should be noted
that loose urban tissues should not be generalized as a better design solution without
considering the shading effect of the buildings. As Bakarman and Chang (2015) stated,
shallow urban canyons are exposed the more incoming solar radiation due to the
insufficient shading effect that results in higher air temperatures in that areas.
Apart from the comparison of compactness level of urban tissues, another type of
urban form, which is row-housing development, opened a discussion on the effect of
street setbacks on the UHI effect. Simulation results show that increased front yard
setbacks can reduce the heat island intensity, even if the buildings are arranged to form
long urban canyons. Additionally, the perimeter block formation was responsible for
the increase in UHI intensity by creating narrow urban canyons. From those findings
it was obvious that narrow street formations with the continuity of street-facing facades
cause a rise in the ambient air temperature.
To sum up, in this research, the proposed model was applied on the selected case study
area (Mustafa Kemal neighborhood in Ankara) to generate various form variations in
regard to the UHI development. Throughout the study, it has been emphasized that the
aim of the research is to improve a generative design approach while investigating
form compositions to mitigate UHI intensity. Within this context, the neighborhood
area, where the UHI effect was increased due to the transformation process, opened up
opportunities to test the model proposal, and to compare possible from alternatives that
could be implemented instead of the current one. Therefore, application of the model
aimed to evaluate simulation results to achieve some design recommendations that can
be used to mitigate UHI intensity in the urban design and planning practices.
Even though evaluations on the form variations are limited to generalize design
solutions, this research has contributed to the field of urban design by providing a
generative approach that triggers the formation of urban morphology in regard to UHI
effect. This research has also provided a contribution to the improvement of an

118
operational design platform that brings up evidence-based design to the agenda.
Evidence-based design pursued by the use of computational methods in spatial
analysis to reveal the intrinsic design problems emphasizes the importance of
performative design approach. Also, it produces design principles based on the
research findings, to achieve better design solutions (Karimi and Vaughan, 2014).
Similarly, the framework of this research promotes the integration of analysis and
simulation processes to generate possible design solutions rather than searching for an
ideal form in certain optimality on many aspects of spatial planning and design.
Therefore, the model application proposed by the research should be considered a kind
of design support system informing the complex process of urban design from the
specific perspective of UHI effect.
5.3. Main Limitations of the Research
It is important to recognize that there were several limitations related to the proposed
model and the research process. The most significant limitation of the model is, in
fact, about the parametric modelling process itself. Since parametric modelling tools
are specified to the field of architectural design, the use of parametric models in urban
design and planning practices is quite a new methodological approach yet to be
developed within a systemic (morphological) framework. Additionally, in the field of
heat island investigations, parametric modelling has almost never been used except in
a few studies resulted with limited evaluations. Therefore, more design research is
necessitate to improve the use of parametric modelling tools and techniques among
urban designers.
Another practical limitation of the model is that modelling process takes long time,
because it requires to set a lot of simultaneous operations for analysis and simulation
applications. As the algorithmic setting of these operations becomes a complicated
task, it turns to a more time-consuming process. Moreover, the implication of the
Genetic Algorithm for the form generation process, performs a long-running operation
without interaction with the designer. In other words, this tool requires a lot of waiting

119
to test each form samples to achieve better design solutions. (In the case of our
research, each form generation trial according to the specified scenarios took up to 40
hours, in total. As the complexity level increased, the waiting period increased to even
more than two days.)
On the other hand, in the current context of the research, simulation algorithm was set
up for the specified building typology without articulation on the building façade.
Since variation in the building setback has a significant importance on the
measurement of SVF value, it would be preferable to investigate that effect on the heat
island intensity within the scope of another study.
Furthermore, as stated in the summary of the research section, many other influential
factors, such as surface materials, ground covers and weather conditions, on the heat
island intensity were excluded from the methodological framework of the research, the
evaluations of generated form variations were limited to produce design codes, and to
generalize them. It may be misleading to recommend a certain urban form to mitigate
UHI effect where many parameters have not been tested yet. Therefore, simulation
results should be considered as an alternative typologies for the case study area instead
of a specialized set of design recommendations. From those outcomes, it is obvious
that the current research should be expanded to investigate more form variations by
including new variables to the simulation process.
Last but not the least, it should be emphasized that the simulated alternative form-
typologies do not imply a kind of ‘good urban form’ models to be addressed for the
general theory of urban design. In other words, the specific form typologies generated
as the ‘best performed models’ should not be regarded as the optimum urban
typologies to be applied in every context. More concretely, the least compact model of
urban fabrics which have been simulated as the best-performed form-typology, in this
respect, are the best alternatives only with regards to the issue of UHI effect
specifically discussed in the research. That means any parametric research in search
for generating ‘good urban form(s)’ has to take other fundamental aspects of urban
design (i.e. legibility, integration, coherence etc.) in order to come up with an

120
integrated and inclusive morphological approach in urbanism..
5.4. Recommendations for Future Studies
Proposing a parametric model is quite motivation for opening up a methodological
discussion on the basis of generative approach to the problematic issue of UHI effect.
Increase in the utilization of the parametric modelling tools and techniques will
provide designers and planners to have a robust perspective on evidence-based urban
design in regard to the thermal balance of the environment. Based on the findings and
limitations of this research, some preliminary recommendations have emerged to
enhance the utility of the proposed model. By following these recommendations,
researchers will have much better opportunities to improve decision-making
mechanism while searching for better design solutions to mitigate UHI effect.
Considering the extent of the model proposal for the analysis of urban areas to
calculate the SVF value and UHI intensity, it can be suggested that researchers should
consider the reevaluation of this measurement tool to achieve better estimation results.
The SVF calculation on the street axis is an important tool for the estimation of UHI
intensity, but it should not be the only consideration. Generated form compositions to
mitigate UHI intensity within urban canyons may create uncomfortable climatic
conditions in the internal spaces between buildings. Therefore, future studies may
respond to the need for a more comprehensive measurement tool for urban areas by
improving the algorithmic setting of analysis.
Regarding the form generation in this study, morphological components of the urban
form, which are specified as building height, building size and distance between
buildings, are the only variables that are used to mitigate heat island intensity. Hence,
the current research should be enhanced to assess the effect of building orientation on
the UHI development by applying airflow and solar radiation simulations. Generation
of form compositions by manipulating building orientation to enhance the cooling
effect of air flow may become an object of a further investigation. In addition to the
building orientation, the impact of building setbacks on the heat island intensity should
121
be investigated by researchers. Briefly, considering the necessity for further
improvement of the parametric approach in urban heat island studies with different
applications, this research can be taken as the initial step to guide the forthcoming
studies in future.

122
123
REFERENCES
Akay, A. (1996). Kentsel mekanlarda oluşan ısı adası etkisinin azaltılmasında
sürdürülebilir peyzajın öneminin Ankara kenti örneğinde araştırılması. Unpublished
master thesis, Graduate School of Natural and Applied Sciences, Ankara University,
Ankara.
Akbari, H., Berdahl, P., Levinson, R., Wiel, S., Miller, B., & Desjarlais, A. (2006).
Cool color roofing materials. California Energy Commission PIER Program,
Lawrence Berkeley National Laboratory (LBNL), and Oak Ridge National Laboratory
(ORNL).
Akbari, H., Davis, S., Huang, J., Dorsano, S., & Winett, S. (1992). Cooling our
communities: A guidebook on tree planting and light colored surfacing. US
Environmental Protection Agency (EPA). Washington DC.
Alavipanah, S., Wegmann, M., Qureshi, S., Weng, Q., & Koellner, T. (2015). The role
of vegetation in mitigating urban land surface temperatures: a case study of Munich,
Germany during the warm season. Sustainability, 7, 4689-4706.
Arkon C. A. & Özkol, Ü. (2013). Effect of urban geometry on pedestrian-level wind
velocity. Architectural Science Review, 57, 4-19.
Arnab, I. Z., Ali, T., Shidujaman, M., & Hossain M. M. (2013). Consideration of
environmental effect of power generation: Bangladesh perspective. Energy and Power
Engineering, 5, 1521-1525.
Asaeda, T., Ca, V. T., & Wake, A. (1996). Heat storage of pavement and its effect on
the lower atmosphere. Atmospheric Environment, 30, 413-427.
Ashrafizadeh, S. A., & Tan, Z. (2018). Mass and energy balances: Basic principles
for calculation, design, and optimization of macro/nano systems. Springer: Cham.
Bakarman M. & Chang, J. D. (2015). The Influence of height/width ratio on urban heat
island in hot-arid climates. Procedia Engineering, 118, 101-108.

124
Banihashemi, M. (1995). The effect of albedo modification on residential roof and
indoor temperatures. Unpublished master thesis, College of Social Sciences, San Jose
State University, San Jose.
Bejan, A. (2013). Convection heat transfer, 4th edition. John Wiley & Sons: New
Jersey.
Bergman, T. L., Lavine, A. S., Incropera, F. P., & Dewitt, D. P. (2011). Introduction
to heat transfer, 6th edition. John Wiley & Sons: New York.
Bilgili, B. C. (2009). Ankara kenti yeşil alanlarının kent ekosistemine olan etkilerinin
bazı ekolojik göstergeler çerçevesinde değerlendirilmesi üzerine bir araştırma.
Unpublished doctoral dissertation, Graduate School of Natural and Applied Sciences,
Ankara University, Ankara.
Bohnenstengel, S. I., Hamilton, I., Davies, M., & Belcher, S. E. (2014). Impact of
anthropogenic heat emissions on London's temperatures. Quarterly Journal of the
Royal Meteorological Society, 140, 687-698.
Brunt, D. (1952). Physical and dynamical meteorology. Cambridge University Press,
New York.
Canan, F. (2017). Kent geometrisine bağlı olarak kentsel isı adası etkisinin
belirlenmesi: Konya örneği. Çukurova Üniversitesi Mühendislik Mimarlık Fakültesi
Dergisi, 32, 69-80.
Cao, Z., Wu, Z., & Ma, W. (2018). Effect of anthropogenic heat release on temperature
in different types of built-up land in Guangzhou, China. Progress in Geography, 37,
515-524.
Chen, L., Ng, E., An, X., Ren, C., Lee, M., Wang, U., et al. (2012). Sky view factor
analysis of street canyons and its implications for daytime intra-urban air temperature
differentials in high-rise, high-density urban areas of Hong Kong: A GIS-based
simulation approach. International Journal of Climatology, 32, 121-136.
Cheung, H. K. W., Coles, D., & Levermore, G. J. (2016). Urban heat island analysis
of Greater Manchester, UK using sky view factor analysis. Building Services
Engineering Research and Technology, 37, 5-17.
Chokachian, A., Perini, K., Giulini, S., & Auer, T. (2017). Mathematical generative

125
approach on performance based urban form design. International Conference on
Urban Comfort and Environmental Quality, Genova.
Chrysoulakis, N. & Grimmond, C. S. B. (2016). Understanding and reducing the
anthropogenic heat emission. In M. Santamouris & D. Kolokotsa (Eds.), Urban
climate mitigation techniques (pp. 27-40). Routledge: New York.
Clarke, J. F., Ching, J. K. S., & Godowitch, J. M. (1982). An experimental study of
turbulence in an urban environment. US Environmental Protection Agency, United
States.
Cleugh, H. A., & Oke, T. R. (1986). Suburban-rural energy balance comparisons in
summer for Vancouver, B.C. Boundary Layer Meteorology, 36, 351-369.
Damm, A., Köberl, J., Prettenthaler, F., Rogler, N., & Töglhofer, C. (2017). Impacts
of + 2°C global warming on electricity demand in Europe. Climate Services, 7, 12-30.
Dousset, B. M. (1992). Remote sensing of urban microclimates and their relationship
to land use: A case study of the Los Angeles basin. Unpublished doctoral dissertation,
University of California, Los Angeles.
Duckworth, E. & Sandberg, J. (1954). The effect of cities upon horizontal and vertical
temperature gradients. Bulletin of American Meteorological Society, 35, 198-207.
Eceral, T., Varol, Ç., & Alkan, L. (2010). Kentsel Arazi Değer Artış Süreci: Ankara
Mustafa Kemal Mahallesi Örneği, Toprak Mülkiyeti Sempozyum Bildirileri, 307-25.
Erell, E., Pearlmutter, D., & Williamson, T. (2011). Urban microclimate: Designing
the spaces between buildings. Earthscan: London.
Fouillet, A., Rey, G., Laurent, F., Pavillon, G., Bellec, S., Guihenneuc-Jouyaux, C., et
al. (2006). Excess mortality related to the August 2003 heat wave in France.
International Archives of Occupational and Environmental Health, 80, 16-24.
Givoni, B. (1989). Urban design in different climates. WCAP-10, World
Meteorological Organization, Geneva.
Goh, K. C. & Chang, C. H. (1999). The relationship between height to width ratios
and the heat island intensity at 22:00 h for Singapore. International Journal of
Climatology, 19, 1011-1023.
Grimmond, C. S. B., & Oke, T. R. (2002). Turbulent heat fluxes in urban areas:

126
Observations and a local-scale urban meteorological parametrization scheme
(LUMPS). Journal of Applied Meteorology, 41, 792-810.
Gülten, A. (2014). Kentsel yüzeylerde ısı adası etkisinin simülasyon yöntemi ile
araştırılması. Unpublished doctoral dissertation, Graduate School of Natural and
Applied Sciences, Fırat University, Elazığ.
Hamdi, R. & Schayes, G. (2008). Sensitivity study of the urban heat island intensity
to urban characteristics. International Journal of Climatology, 28, 973-982.
Hammerle, M., Gal, T., Unger, J., & Matzarakis, A. (2011a). Introducing a script for
calculating the sky view factor used for urban climate investigations. Acta
Climatologica et Chorologica, 44-45, 83-92.
Hammerle, M., Gal, T., Unger, J., & Matzarakis, A. (2011b). Comparison of models
calculating the sky view factor used for urban climate investigations. Theoretical and
Applied Climatology, 105, 521-527.
Heiple, S. C. (2007). Using building energy simulation and geospatial modeling
techniques to determine high resolution building sector energy consumption profiles.
Unpublished master thesis, College of Engineering and Computer Science, Portland
State University, Oregon.
Honjo, T. & Takakura, T. (1991). Simulation of thermal effects of urban green areas
on their surrounding areas. Energy and Buildings, 15, 443-446.
Hosler, C. L. & Landsberg, H. E. (1977). The effect of localized man-made heat and
moisture sources in mesoscale weather modification. Energy and Climate, National
Academy of Sciences, Washington, DC.
Hu, Y., White, M., & Ding, W. (2016). An urban form experiment on urban heat island
effect in high density area. Procedia Engineering, 169, 166-174.
Huang, Y. J., Akbari, H., & Taha, H. (1990). The wind shielding and shading effects
of trees on residential heating and cooling requirements. American Society of Heating,
Refrigerating and Air-Conditioning Engineers, 96, 1403-1411.
Jauregui, E. (1990). Influence of a large urban park on temperature and convective
precipitation in a tropical city. Energy and Buildings, 15-16, 457-463.
Kakon, A. N. & Nobuo, M. (2009). The sky view factor effect on the microclimate of

127
a city environment: A case study of Dhaka city. 7th International Conference on Urban
Climate, Yokohama.
Kalma, J. D. (1974). An advective boundary-layer model applied to Sydney, Australia.
Boundary Layer Meteorology, 6, 351-361.
Karaosman, S. K. (2006). Yeşil çatılar ve sürdürülebilir bina değerlendirme sistemleri.
3. Çatı ve Cephe Kaplamaları Sempozyumu, İstanbul.
Karimi, K. & Vaughan, L. (2014). An evidence-based approach to designing new
cities: the English New Towns revisited, Chapter 22 in explorations in urban design:
An urban design research primer, 261-276.
Katili, A. R., Boukhanouf, R., & Wilson, R. (2015). Space cooling in buildings in hot
and humid climates: A review of the effect of humidity on the applicability of existing
cooling techniques. Conference: SET, Nottingham.
Landsberg, H. E. (1981). The urban climate. Academic Press: London.
Lau, K. K. L., Thorsson, S., Lindberg, F., & Holmer, B. (2015). Street geometry design
and its effect on mean radiant temperature: A parametric study based on numerical
modelling. 9th International Conference on Urban Climate jointly with 12th
Symposium on the Urban Environment, Toulouse.
Lee, S. H., Song, C. K., Baik, J. J., & Park, S. U. (2008). Estimation of anthropogenic
heat emission in the Gyeong-In region of Korea. Theoretical and Applied Climatology,
96, 291-303.
Liao, J. W. L. & Cavaleri, M. M. (2014). The study of sky view factor in urban
morphologies: Computational tools and methods of analysis. 30th International Plea
Conference, Ahmedabad.
Lopez, C. S. P., Sala, M., Tagliabue, L. C., Frontini, F., & Bouziri, S. (2016). Solar
radiation and daylighting assessment using the Sky-View Factor (SVF) analysis as
method to evaluate urban planning densification policies impacts. Energy Procedia,
91, 989-996.
Marther, P. M., & Koch, P. (2011). Computer processing of remotely-sensed images:
An introduction, 4th edition. Wiley-Blackwell: Chichester.
Matuschek, O. & Matzarakis, A. (2010). Estimation of sky view factor in complex

128
environment as a tool for applied climatological studies. 7th Conference on
Biometeorology, Freiburg.
Millennium Ecosystem Assessment (MEA). (2005). Ecosystems and human well-
being: Synthesis. Island Press, Washington, DC.
Money, D. (2000). Weather and climate. Nelson: Cheltenham.
Montavez, J. P., Gonzalez-Rouco, J. F., & Valero, F. (2008). A simple model for
estimating the maximum intensity of nocturnal urban heat island. International
Journal of Climatology, 28, 235-242.
Nakata, C. M. & Souza L. C. L. (2013). Verification of the influence of urban geometry
on the nocturnal heat island intensity. Journal of Urban and Environmental
Engineering, 7, 286-292.
Nakata-Osaki, C. M., Souza, L. C. L., & Rodrigues, D. S. (2015). A GIS extension
model to calculate urban heat island intensity based on urban geometry. 14th
International Conference on Computers in Urban Planning and Urban Management,
Cambridge.
Naughton, M. P., Henderson, A., Mirabelli, M. C., Kaiser, R., Wilhelm, J. L., Kieszak,
S. M., et al. (2002). Heat-related mortality during a 1999 heat wave in Chicago.
American Journal of Preventive Medicine, 22, 221-227.
Nunez, M. & Oke, T. R. (1977). The energy balance of an urban canyon. Journal of
Applied Meteorology, 16, 11-19.
Oke, T. R. & East, C. (1971). The urban boundary layer in Montreal. Boundary Layer
Meteorology, 1, 411-437.
Oke, T. R. (1973). City size and the urban heat island. Atmospheric Environment, 7,
769-779.
Oke, T. R. (1976). The distinction between canopy and boundary-layer urban heat
islands. Atmosphere, 14, 268-277.
Oke, T. R. (1982). The energetic basis of the urban heat island. Quarterly Journal of
the Royal Meteorological Society, 108, 1-24.
Oke, T. R. (1987). Boundary layer climates, 2nd edition. Routledge: London.

129
Oke, T. R. (1988a). The urban energy balance. Progress in Physical Geography, 12,
471-508.
Oke, T. R. (1988b). Street design and urban canopy layer climate. Energy and
Buildings, 11, 103-113.
Oke, T. R., Johnson, G. T., Steyn, D. G., & Watson, I. D. (1991). Simulation of surface
urban heat islands under ideal conditions at night: Diagnosis and causation. Boundary
Layer Meteorology, 56, 339-358.
Oke, T. R., Spronken-Smith, R. A., Jauregui, E., & Grimmond, C. S. B. (1999). The
energy balance of central Mexico City during the dry season. Atmospheric
Environment, 33, 3919-3930.
Oke, T.R. (1981). Canyon geometry and the nocturnal urban heat island: Comparison
of scale model and field observations. Journal of Climatology, 1, 237-254.
Parker, D. S. & Barkaszi, S. F. (1997). Roof solar reflectance and cooling energy use:
Field research results from Florida. Energy and Buildings, 25, 105-115.
Pearlmutter, D., Krüger, E. L., & Berliner, P. (2009). The role of evaporation in the
energy balance of an open-air scaled urban surface. International Journal of
Climatology, 29, 911-920.
Priyadarsini R. & Wong, N. H. (2006). Parametric studies on urban geometry, air flow
and temperature. International Journal on Architectural Science, 6, 114-132.
Quah, A. K. L. & Roth, M. (2012). Diurnal and weekly variation of anthropogenic heat
emissions in a tropical city, Singapore. Atmospheric Environment, 46, 92-103.
Sailor D. J. & Lu, L. (2004). A top–down methodology for developing diurnal and
seasonal anthropogenic heating profiles for urban areas. Atmospheric Environment,
38, 2737-2748.
Sailor, D. J. (1994). Sensitivity of coastal meteorology and air quality to urban surface
characteristics. American Meteorological Society, 8, 286-293.
Sani, S. (1973). Observations on the effect of a city form and functions on temperature
patterns. Journal of Tropical Geography, 36, 60-65.

130
Santamouris, M., Adnot, J., Alvarez, S., Klitsikas, N., Orphelin, M., Lopes, C., et al.
(2004). Cooling the cities: Rafraichir les villes. Paris: Les Presses.
Santamouris, M., Asimakopoulos, D. N., Assimakopoulos, V. D., Chrisomallidou, N.,
Klitsikas, N., Mangold, D., et al. (2001). Energy and climate in the urban built
environment. James & James: London.
Scherba, A. J. (2011). Modeling the impact of roof reflectivity, integrated photovoltaic
panels and green roof systems on the summertime heat island. Unpublished master
thesis, College of Engineering and Computer Science, Portland State University,
Oregon.
Shahidan M. F. (2011). The potential optimum cooling effect of vegetation with ground
surface physical properties modification in mitigating the urban heat island effect in
Malaysia. Unpublished doctoral dissertation, Cardiff University, Cardiff.
Shahmohamadi, P., Che-Ani, A. I., Ramly, A., Maulud, K. N. A., & Mohd-Nor, M. F.
I. (2010). Reducing urban heat island effects: A systematic review to achieve energy
consumption balance. International Journal of Physical Sciences, 5, 626-636.
Shaker, R. & Drezner, T. D. (2010). A new technique for predicting the sky-view
factor for urban heat island assessment. Geographical Bulletin - Gamma Theta
Upsilon, 51, 85-96.
Shishegar, N. (2013). Street design and urban microclimate: Analyzing the effects of
street geometry and orientation on airflow and solar access in urban canyons. Journal
of Clean Energy Technologies, 1, 52-56.
Şimşek, Ç. K. (2013). İstanbul’da kentsel iklim üzerine antropojenik etkiler: Kent ısı
adalarının incelenmesi. Unpublished doctoral dissertation, Graduate School of Natural
and Applied Sciences, Yıldız Teknik University, İstanbul.
Stafoggia, M., Forastiere, F., Agostini, D., Biggeri, A., Bisanti, L., Cadum, E., et al.
(2006). Vulnerability to heat-related mortality: A multicity, population-based, case-
crossover analysis. Epidemiology, 17, 315-323.
Stewart, I. D. (2011). Redefining the urban heat island. Unpublished doctoral
dissertation, The University of British Columbia, Vancouver.
Suomi, J. (2014). Characteristics of urban heat island (UHI) in a high-latitude coastal
city: A case study of Turku, SW Finland. Unpublished doctoral dissertation, Graduate
131
School of Mathematics and Natural Sciences, University of Turku, Turku.
Svensson, M. (2004). Sky view factor analysis - implications for urban air temperature
differences. Meteorology Applications, 11, 201–211.
Taha, H. (1997). Urban climates and heat islands: Albedo, evapotranspiration, and
anthropogenic heat. Energy and Buildings, 25, 99-103.
Taha, H., Akbari, H., & Rosenfield, A. (1991). Heat island and oasis effects of
vegetative canopies: Micro-meteorological field-measurements. Theoretical and
Applied Climatology, 44, 123-138.
Taha, H., Sailor, D., & Akbari, H. (1992). High-albedo materials for reducing building
cooling energy use. Energy & Environment Division, Lawrence Berkeley Laboratory,
University of California, Berkeley.
Takebayashi, H. (2017). Influence of urban green area on air temperature of
surrounding built-up area. Climate, 5, 60.
Takkanon, P. (2016). A study of height to width ratios and urban heat island intensity
of Bangkok. 4th International Conference on Countermeasures to Urban Heat Island,
Singapore.
Tham, K. W. (1993). Conserving energy without sacrificing thermal comfort. Building
and Environment, 28, 287-299.
Tymkow, P., Tassou, S., Kolokotroni, M., & Jouhara, H. (2013). Building services
design for energy efficient buildings. Routledge: New York.
U.S. Environmental Protection Agency (EPA). (2008). Urban heat island basics. In
Reducing urban heat islands: Compendium of strategies. Draft.
https://www.epa.gov/heat-islands/heat-island-compendium.
U.S. Environmental Protection Agency (EPA). (2012). Cool pavements. In Reducing
urban heat islands: Compendium of strategies. Draft. https://www.epa.gov/heat-
islands/heat-island-compendium.
UNCHS (Habitat). (2001). Implementing the habitat agenda: The 1996-2001
experience, Report on the Istanbul+5 Thematic Committee, 25th Special Session of
the United Nations General Assembly, New York.
Unger, J. (2009). Connection between urban heat island and sky view factor

132
approximated by a software tool on a 3D urban database. International Journal of
Environment and Pollution, 363, 1-3.
United Nations Department of Economic and Social Affairs (UNDESA). (2011).
World economic and social survey 2011: The great green technological
transformation.
United Nations, Department of Economic and Social Affairs, Population Division.
(2017). World population prospects: The 2017 revision, Volume II: Demographic
profiles (ST/ESA/SER.A/400).
United Nations, Department of Economic and Social Affairs, Population Division.
(2016). The world’s cities in 2016: Data booklet (ST/ESA/ SER.A/392).
Voogt, J. A. (2004). Urban heat islands: Hotter cities. American Institute of Biological
Sciences.
Voogt, J. A., & Oke, T. R. (2003). Thermal remote sensing of urban climates. Remote
Sensing of Environment, 86, 370-384.
Wong N. H. & Chen, Y. (2009). Tropical urban heat islands: Climate, buildings and
greenery. Taylor & Francis: New York.
Yılmaz, E. (2013). Ankara şehrinde ısı adası oluşumu. Unpublished doctoral
dissertation, Graduate School of Social Sciences, Ankara University, Ankara.
Yuan, C. & Chen, L. (2011). Mitigating urban heat island effects in high density cities
based on sky view factor and urban morphological understanding: A study of Hong
Kong. Architectural Science Review, 54, 305-315.
Yüksel, Ü. D. (2005). Ankara kentinde kentsel ısı adası etkisinin yaz aylarında uzaktan
algılama ve meteorolojik gözlemlere dayalı olarak saptanması ve değerlendirilmesi
üzerinde bir araştırma. Unpublished doctoral dissertation, Graduate School of Natural
and Applied Sciences, Ankara University, Ankara.
Zareiyan, B. (2011). Performance of roof materials high SRI, low SRI, and green roof
in California climate zone 8 Los Angeles, California. Unpublished master thesis,
School of Architecture, University of Southern California, Los Angeles.