Paradigm change in drinking water management to achieve
85
Paradigm Change in Drinking Water Management to Achieve Vision 2030
-
Upload
homero-silva -
Category
Documents
-
view
63 -
download
1
Transcript of Paradigm change in drinking water management to achieve

Paradigm Change in Drinking Water Management to Achieve Vision 2030

Content
• Title “Is drinking water the correct term”• Do we ensure complete health with that?• Is it to enough to provide water for drinking
purposes to achieve Vision 2030?• Should we change the term “Drinking Water”
for the term “Vitamin G Water”?• Have we achieved the Millennium
Development Goals for Water
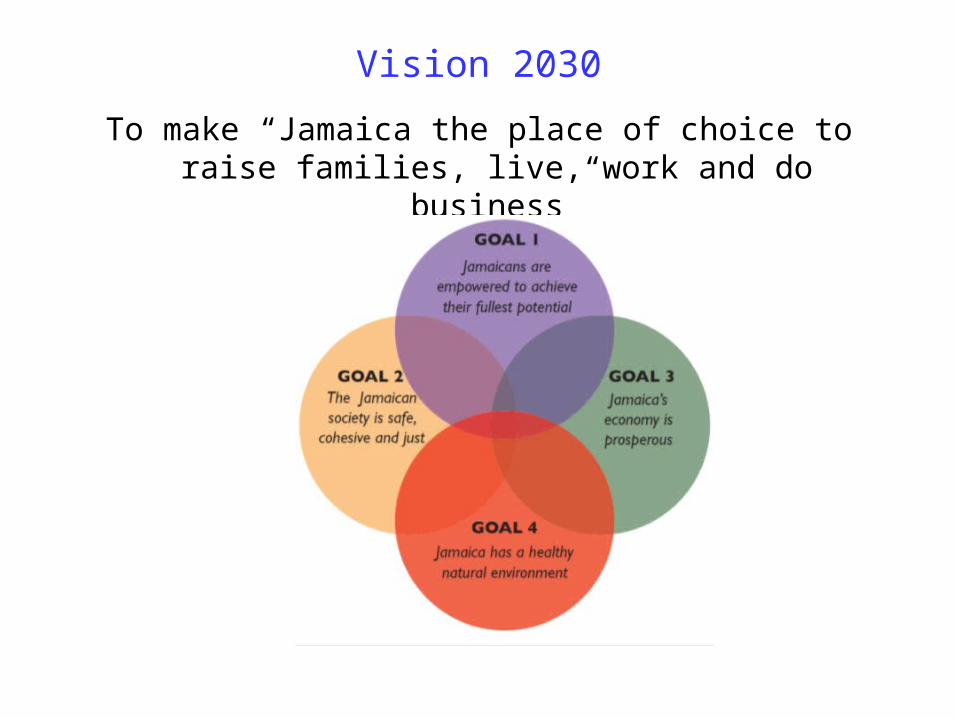
Vision 2030
To make “Jamaica the place of choice to raise families, live, work and do business”


National Outcome Outcome 1 A Healthy and Stable
Population Improve the quality of life Increase average life expectancy Encourage healthy lifestyles Primary Health Care
2 World-Class Education and Training
Creative and productive individuals Holistic development of the child Training of under-trained population
3 Effective Social Protection Identify and create employment and business opportunities 5 Security and Safety Reducing the level of crime and violence in our country
Empowering communities to participate fully in mainstream society 6 Effective Governance Equity, tolerance and respect for human rights and freedoms. 7 A Stable Macroeconomy Financial system stability
Price stability over the long term. 8 An Enabling Business
Environment Improve labour productivity and worker satisfaction; Promote and develop entrepreneurship
9 Strong Economic Infrastructure
W&S that contributes competitiveness producers and ↑ quality of life W&S services for economic and social uses.
10 Energy Security and Efficiency
Reduce dependency on imported petroleum Provide a secure and sustainable energy supply Diversify energy supply, and increase use of renewable energy Take advantage of emerging technologies
11 A Technology-Enabled Society
Deepen application of S&T to benefit all aspects national dev Build our capacity for undertaking research and development, Applying S&T to practical and productive uses.
12 Internationally Competitive Industry Structures
Environmental sustainability and food security Promote use of clean technology Adopt and adapt new construction technologies Compliance relevant environmental standards and reg Reduce sector’s carbon footprint and waste generation Increase growth of sport Increase use of Jamaican inputs in tourism
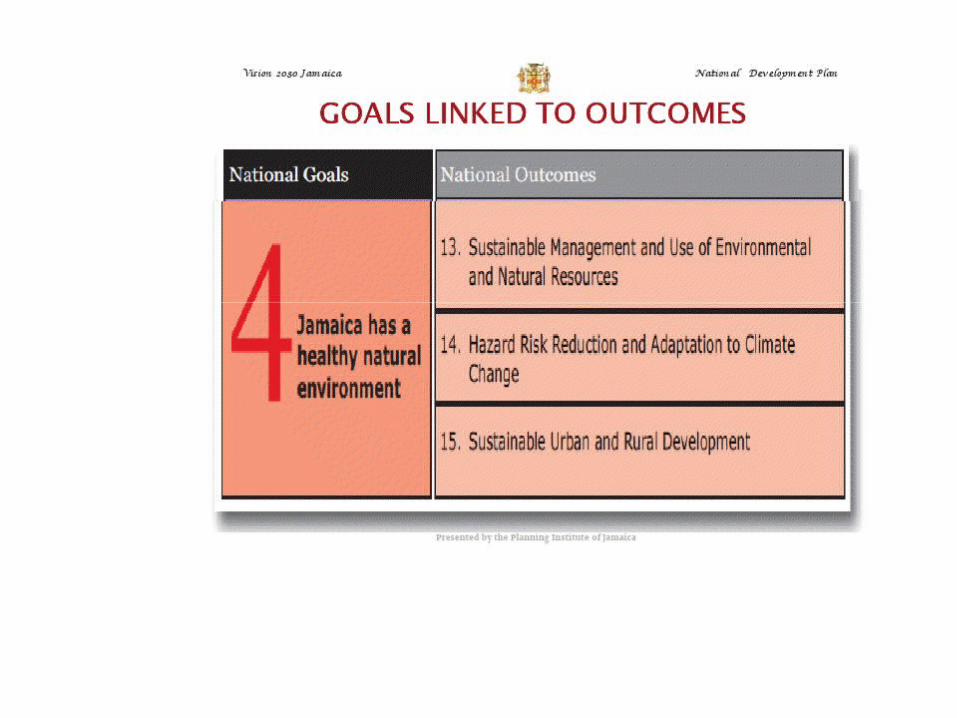
13 Sustainable Management and Use of Environmental and Natural Resources
Env considerations integral factors socio-econ decision making Green economy Conserve NR; incorporating environ consider dec mak processes;
14 Hazard Risk Reduction and Adaptation Climate Change
Haz risk manag activ/progr for reducing vulnerability Incorporate climate change future economic and land use planning
15 Sustainable Urban and Rural Development
Rundown town centres, urban sprawl, environmental degradation, unsafe and dilapidated housing, planned and unplanned development in ecologically-sensitive areas, crime and disorder, rural-urban migration, and poverty
Create framework urb & rur dev that supports econ and soc devpmnt A spatial arrangement of land use that facilitates social and economic development,
respects the environment and satisfies the need for safety, efficiency, aesthetics and social justice
Water Related Expected Results(39) Vision 2030
Expected Result
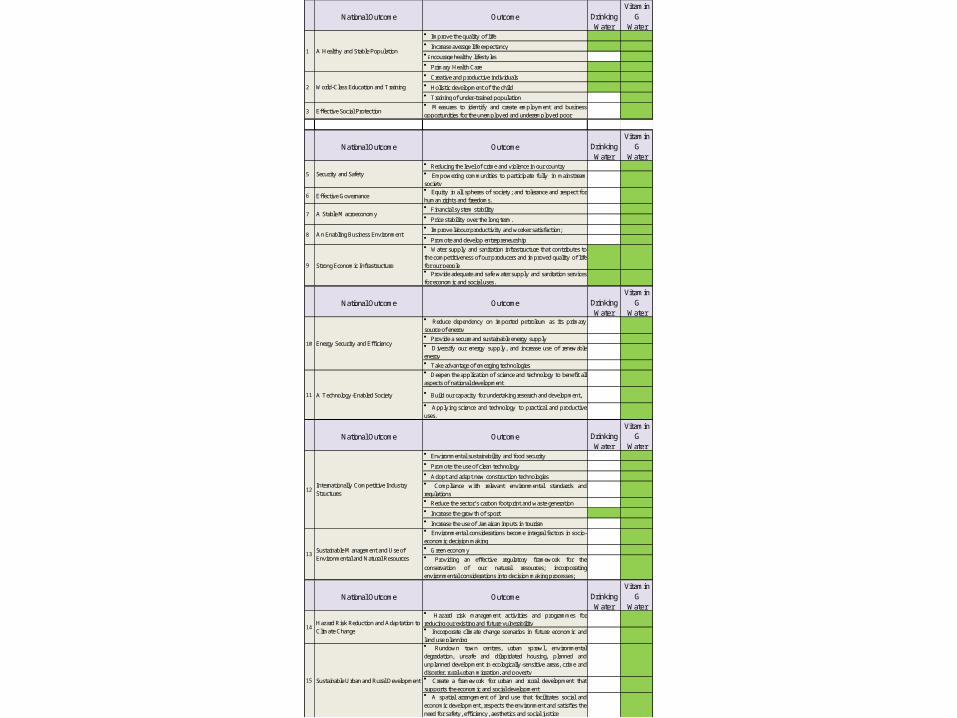
National Outcome Outcome DrinkingWater
Vitamin G
Water Improve the quality of life
Increase average life expectancy
Encourage healthy lifestyles
Primary Health Care
Creative and productive individuals
Holistic development of the child
Training of under-trained population
3 Effective Social Protection Measures to identify and create employment and businessopportunities for the unemployed and underemployed poor
National Outcome Outcome DrinkingWater
Vitamin G
Water Reducing the level of crime and violence in our country Empowering communities to participate fully in mainstreamsociety
6 Effective Governance Equity in all spheres of society; and tolerance and respect forhuman rights and freedoms. Financial system stability
Price stability over the long term.
Improve labour productivity and worker satisfaction;
Promote and develop entrepreneurship Water supply and sanitation infrastructure that contributes tothe competitiveness of our producers and improved quality of lifefor our people Provide adequate and safe water supply and sanitation servicesfor economic and social uses.
National Outcome Outcome DrinkingWater
Vitamin G
Water Reduce dependency on imported petroleum as its primarysource of energy Provide a secure and sustainable energy supply Diversify our energy supply, and increase use of renewableenergy Take advantage of emerging technologies Deepen the application of science and technology to benefit allaspects of national development
Build our capacity for undertaking research and development,
Applying science and technology to practical and productiveuses.
National Outcome Outcome DrinkingWater
Vitamin G
Water Environmental sustainability and food security
Promote the use of clean technology
Adopt and adapt new construction technologies Compliance with relevant environmental standards andregulations Reduce the sector’s carbon footprint and waste generation
Increase the growth of sport
Increase the use of Jamaican inputs in tourism Environmental considerations become integral factors in socio-economic decision making Green economy Providing an effective regulatory framework for theconservation of our natural resources; incorporatingenvironmental considerations into decision making processes;
National Outcome Outcome DrinkingWater
Vitamin G
Water Hazard risk management activities and programmes forreducing our existing and future vulnerability Incorporate climate change scenarios in future economic andland use planning Rundown town centres, urban sprawl, environmentaldegradation, unsafe and dilapidated housing, planned andunplanned development in ecologically-sensitive areas, crime anddisorder, rural-urban migration, and poverty Create a framework for urban and rural development thatsupports the economic and social development A spatial arrangement of land use that facilitates social andeconomic development, respects the environment and satisfies the need for safety, efficiency, aesthetics and social justice
13Sustainable Management and Use of Environmental and Natural Resources
14Hazard Risk Reduction and Adaptation to Climate Change
15 Sustainable Urban and Rural Development
10 Energy Security and Efficiency
11 A Technology-Enabled Society
12Internationally Competitive Industry Structures
7 A Stable Macroeconomy
8 An Enabling Business Environment
9 Strong Economic Infrastructure
1 A Healthy and Stable Population
2 World-Class Education and Training
5 Security and Safety
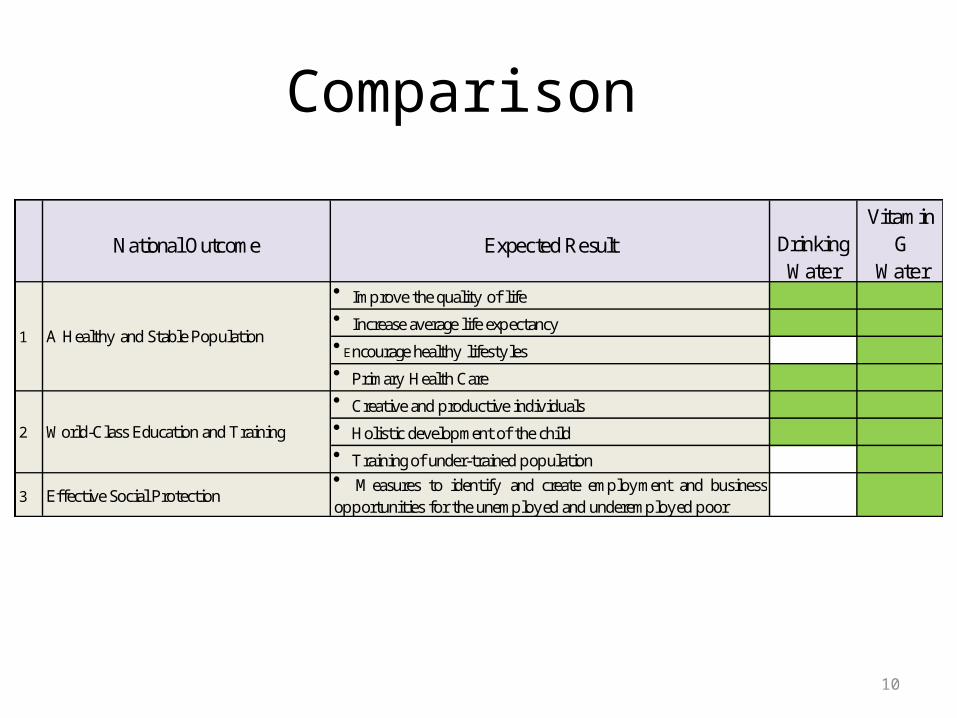
Comparison
10
National Outcome Expected Result DrinkingWater
Vitamin G
Water Improve the quality of life
Increase average life expectancy
Encourage healthy lifestyles
Primary Health Care
Creative and productive individuals
Holistic development of the child
Training of under-trained population
3 Effective Social Protection Measures to identify and create employment and businessopportunities for the unemployed and underemployed poor
1 A Healthy and Stable Population
2 World-Class Education and Training

11
National Outcome Expected Result DrinkingWater
Vitamin G
Water Reducing the level of crime and violence in our country Empowering communities to participate fully in mainstreamsociety
6 Effective Governance Equity in all spheres of society; and tolerance and respect forhuman rights and freedoms. Financial system stability
Price stability over the long term.
Improve labour productivity and worker satisfaction;
Promote and develop entrepreneurship Water supply and sanitation infrastructure that contributes tothe competitiveness of our producers and improved quality of lifefor our people Provide adequate and safe water supply and sanitation servicesfor economic and social uses.
7 A Stable Macroeconomy
8 An Enabling Business Environment
9 Strong Economic Infrastructure
5 Security and Safety

12
National Outcome Expected Result DrinkingWater
Vitamin G
Water Reduce dependency on imported petroleum as its primarysource of energy Provide a secure and sustainable energy supply Diversify our energy supply, and increase use of renewableenergy Take advantage of emerging technologies Deepen the application of science and technology to benefit allaspects of national development
Build our capacity for undertaking research and development,
Applying science and technology to practical and productiveuses.
10 Energy Security and Efficiency
11 A Technology-Enabled Society

13
National Outcome Expected Result DrinkingWater
Vitamin G
Water Environmental sustainability and food security
Promote the use of clean technology
Adopt and adapt new construction technologies Compliance with relevant environmental standards andregulations Reduce the sector’s carbon footprint and waste generation
Increase the growth of sport
Increase the use of Jamaican inputs in tourism Environmental considerations become integral factors in socio-economic decision making Green economy Providing an effective regulatory framework for theconservation of our natural resources; incorporatingenvironmental considerations into decision making processes;
13Sustainable Management and Use of Environmental and Natural Resources
12Internationally Competitive Industry Structures

14
National Outcome Expected Result DrinkingWater
Vitamin G
Water Hazard risk management activities and programmes forreducing our existing and future vulnerability Incorporate climate change scenarios in future economic andland use planning Rundown town centres, urban sprawl, environmentaldegradation, unsafe and dilapidated housing, planned andunplanned development in ecologically-sensitive areas, crime anddisorder, rural-urban migration, and poverty Create a framework for urban and rural development thatsupports the economic and social development A spatial arrangement of land use that facilitates social andeconomic development, respects the environment and satisfies the need for safety, efficiency, aesthetics and social justice
14Hazard Risk Reduction and Adaptation to Climate Change
15 Sustainable Urban and Rural Development

Millennium Development Goals
15
Table Drinking water coverage estimates
Urban (%) Rural (%) Total (%)
1990
2010
1990
2010
1990 2010
Piped onto premises
89 91 34 47 61 70
Other improved source
9 7 54 41 32 23
Other unimproved 2 2 1 8 1 5
Surface water 0 0 11 4 6 2
Target 7.C:Halve, by 2015, the proportion of the population without sustainable access to safe drinking water and basic sanitation.Jamaica Goal was to reach 97.5% (in 1990 95%)
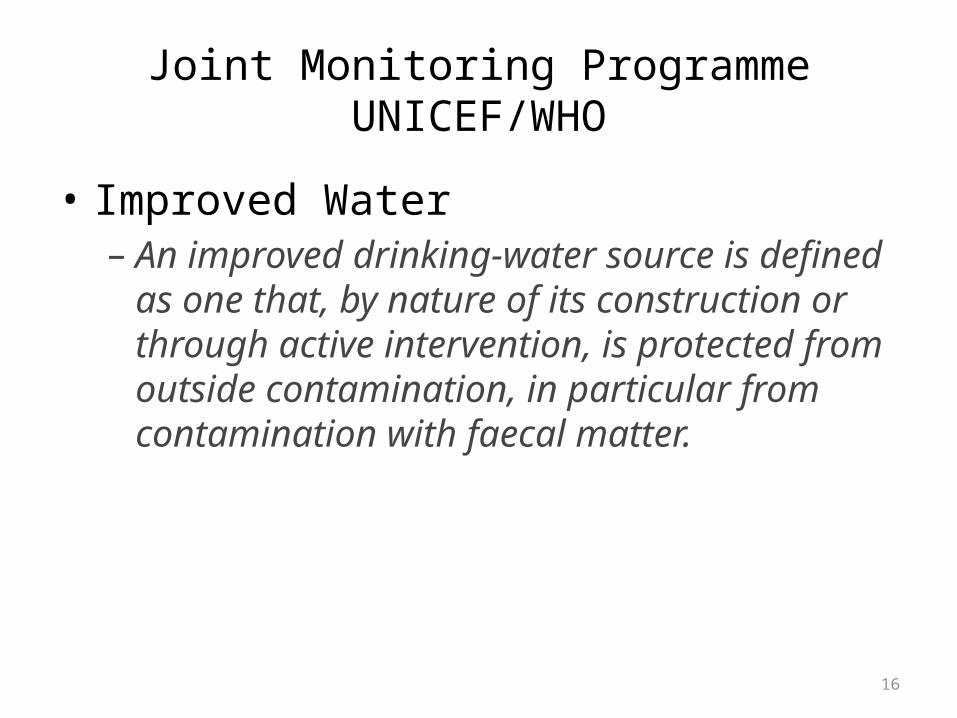
Joint Monitoring Programme UNICEF/WHO
• Improved Water– An improved drinking-water source is
defined as one that, by nature of its construction or through active intervention, is protected from outside contamination, in particular from contamination with faecal matter.
16
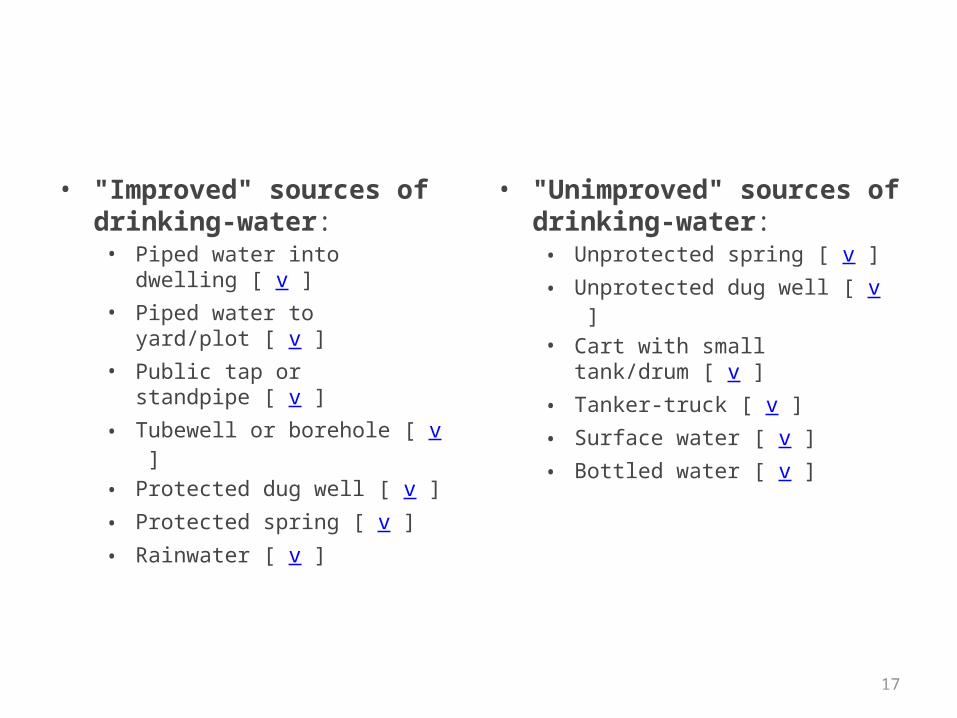
• "Improved" sources of drinking-water:
• Piped water into dwelling [ v ]• Piped water to yard/plot [ v ]• Public tap or standpipe [ v ]• Tubewell or borehole [ v ]• Protected dug well [ v ]• Protected spring [ v ]• Rainwater [ v ]
• "Unimproved" sources of drinking-water:
• Unprotected spring [ v ]• Unprotected dug well [ v ]• Cart with small tank/drum [ v
]• Tanker-truck [ v ]• Surface water [ v ]• Bottled water [ v ]
17

Census 2011
18
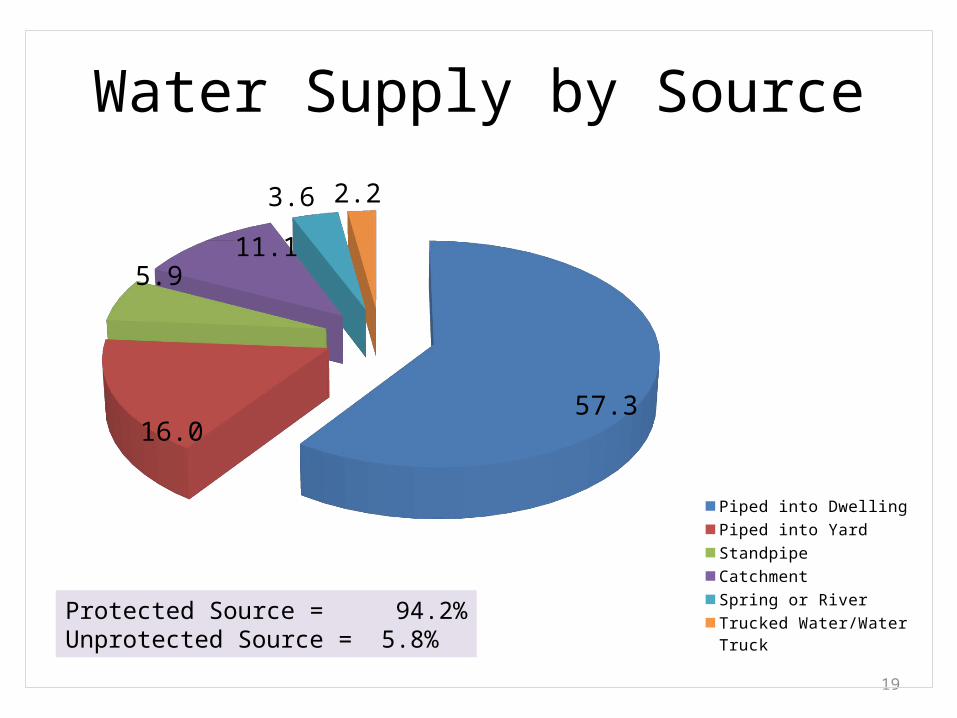
Water Supply by Source
19
57.316.0
5.9
11.1 3.6 2.2
Piped into Dwelling
Piped into Yard
Standpipe
Catchment
Spring or River
Trucked Water/Water Truck
Protected Source = 94.2%Unprotected Source = 5.8%
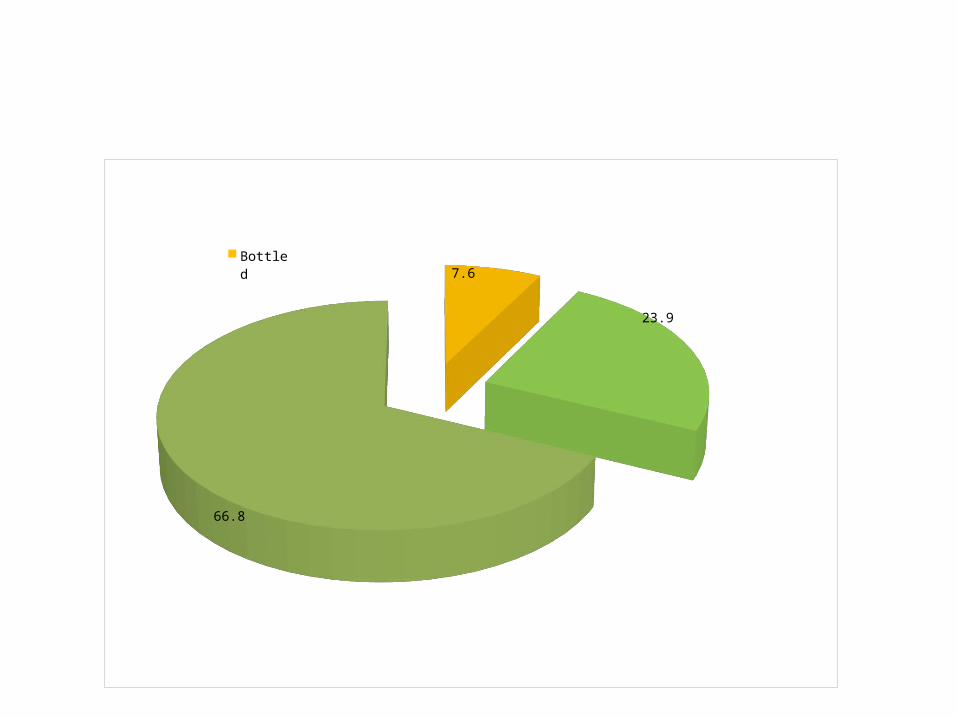
7.6
23.9
66.8
BottledTreatedNo Treated
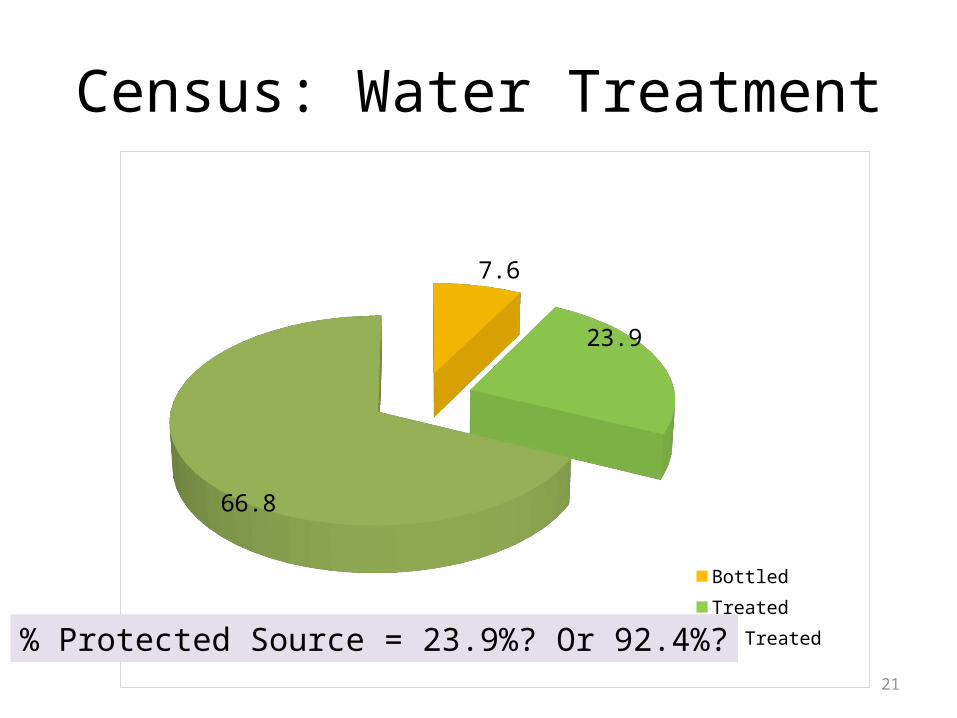
Census: Water Treatment
21
7.6
23.9
66.8
Bottled
Treated
No Treated% Protected Source = 23.9%? Or 92.4%?
22
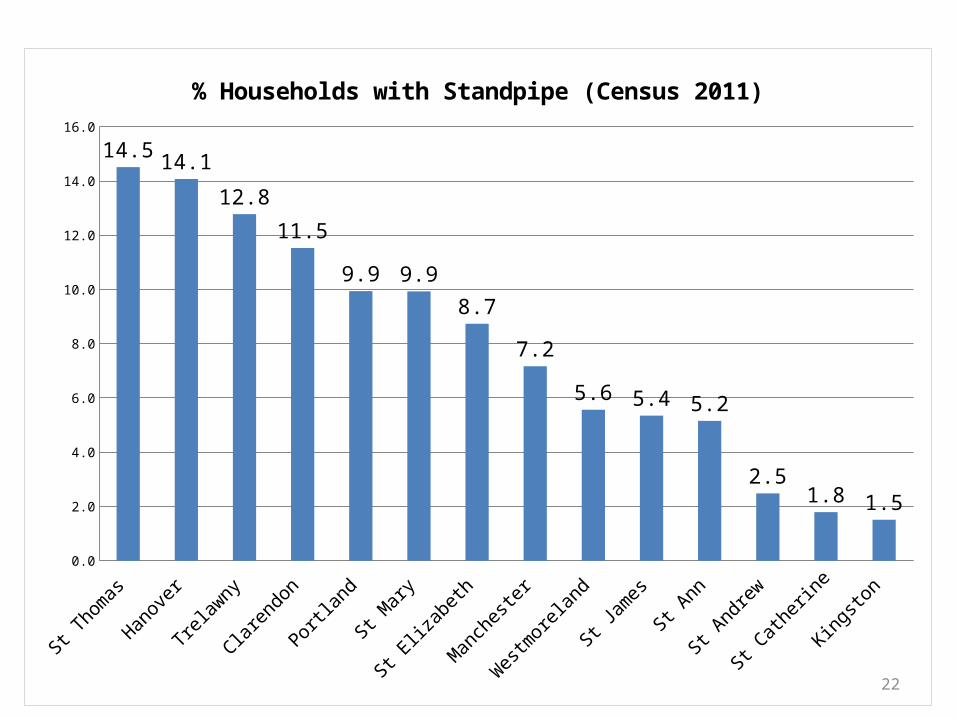
St Thomas
Hanover
Trelawny
Clarendon
Portland
St Mary
St Eliza
beth
Mancheste
r
Westm
oreland
St James
St Ann
St Andrew
St Catherin
e
Kingston
0.0
2.0
4.0
6.0
8.0
10.0
12.0
14.0
16.0
14.5 14.1
12.8
11.5
9.9 9.9
8.7
7.2
5.6 5.4 5.2
2.51.8 1.5
% Households with Standpipe (Census 2011)
23
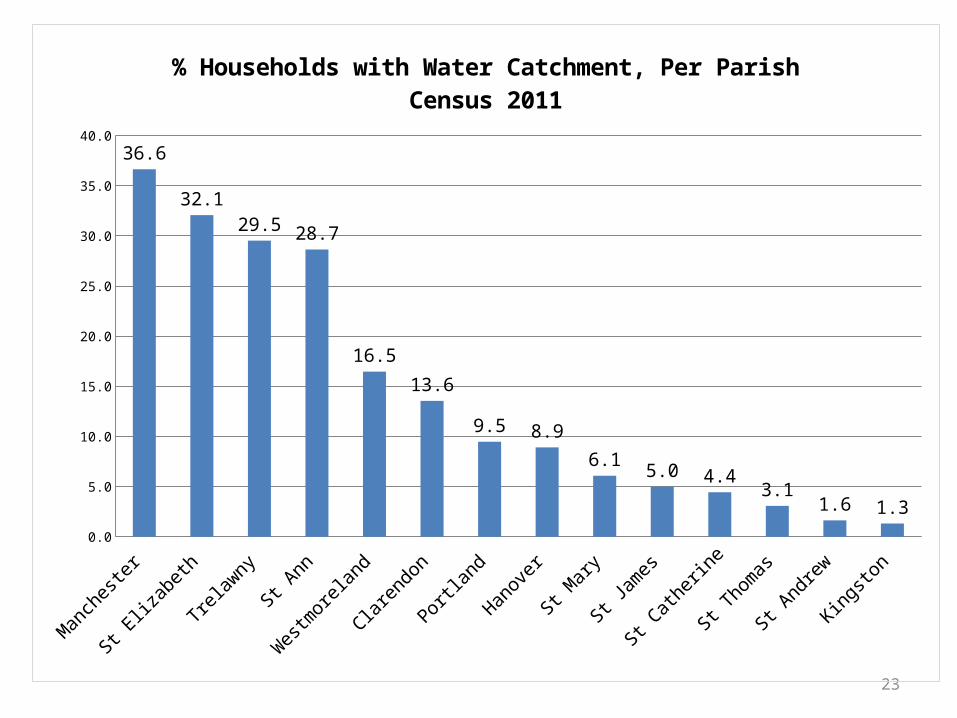
Mancheste
r
St Eliza
beth
Trelawny
St Ann
Westm
oreland
Clarendon
Portland
Hanover
St Mary
St James
St Catherin
e
St Thomas
St Andrew
Kingston
0.0
5.0
10.0
15.0
20.0
25.0
30.0
35.0
40.0
36.6
32.1
29.5 28.7
16.5
13.6
9.5 8.9
6.15.0 4.4
3.11.6 1.3
% Households with Water Catchment, Per ParishCensus 2011
24
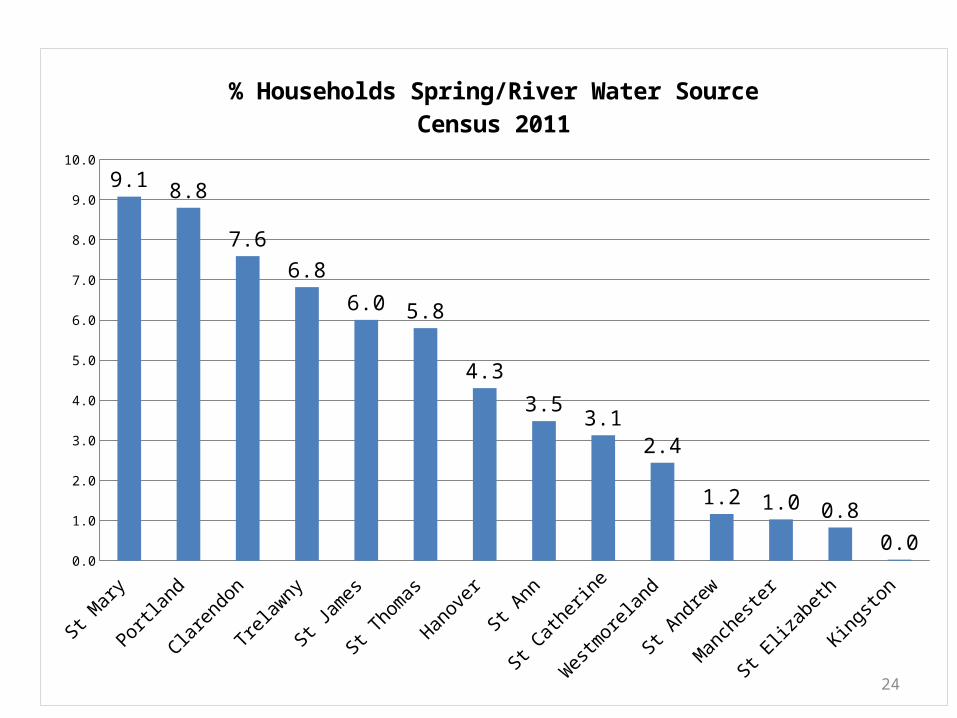
St Mary
Portland
Clarendon
Trelawny
St James
St Thomas
Hanover
St Ann
St Catherin
e
Westm
oreland
St Andrew
Mancheste
r
St Eliza
beth
Kingston
0.0
1.0
2.0
3.0
4.0
5.0
6.0
7.0
8.0
9.0
10.0
9.1 8.8
7.6
6.8
6.0 5.8
4.3
3.53.1
2.4
1.2 1.0 0.8
0.0
% Households Spring/River Water SourceCensus 2011

25
Kingston
St Andrew
St Thomas
Portland
St Mary
St Ann
Trelawny
St James
Hanover
Westm
oreland
St Eliza
beth
Mancheste
r
Clarendon
St Catherin
e0.0
0.5
1.0
1.5
2.0
2.5
3.0
3.5
4.0
4.5
4.1
3.7
3.22.9 2.9 2.8
1.8 1.8 1.8
1.41.1
1.0
0.50.3
% Households Receiving Water by Truck by ParishCensus 2011

Are we meeting the MDGs?
No, We don’t
26


Health Definition
•The World Health Organization (WHO) states health is ‘A state of complete physical, mental, and social wellbeing, and not merely the absence of disease
or infirmity’
28

29


Epidemiological-Demographic and Socio-economic transitions
Top five leading causes of death in Jamaica 1945-2004
1945 1982 1996 2004Tuberculosis Cerebrovascular
DiseaseCerebrovascular
DiseaseCerebrovascular
Disease
Heart Disease Heart Disease Diabetes Mellitus Diabetes Mellitus
Nephritis Malignant Neoplasm
Ischaemic Heart Disease
Ischemic Heart Disease
Syphilis Hypertension Hypertensive Diseases
Hypertensive Diseases
Pneumonia Diabetes Mellitus Homicide/Assault Other Heart Disease
Influenza Gastroenteritis Accidents and Injuries-(Accidents, poisoning
and violence)*
31Source: Chronic Disease in the Caribbean: Jamaica Case Study

Disability Adjusted Lost Years
DALYs
32
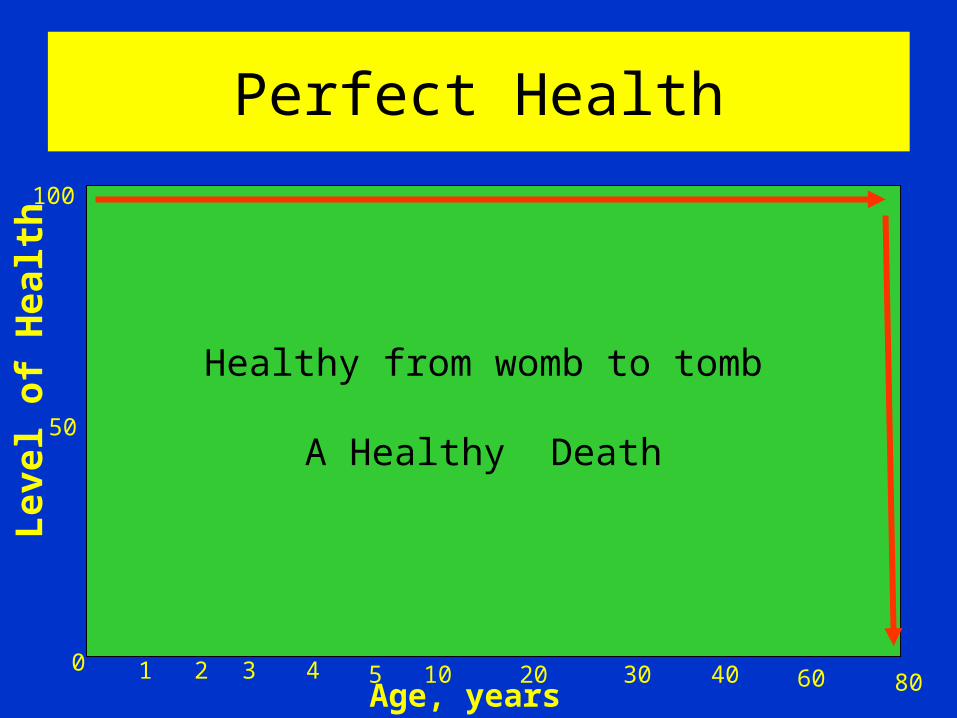
Perfect Health
0
50
100
1 2 3 4 5 10 20 30 40 60 80
Lev
el o
f H
ealt
h
Age, years
Healthy from womb to tomb
A Healthy Death

Healthy Years Lost (DALYS)
0
50
100
1 2 3 4 5 10 20 30 40 60 80
Healthy time
Non – Healthy time
Lev
el o
f H
ealt
h
Age, years
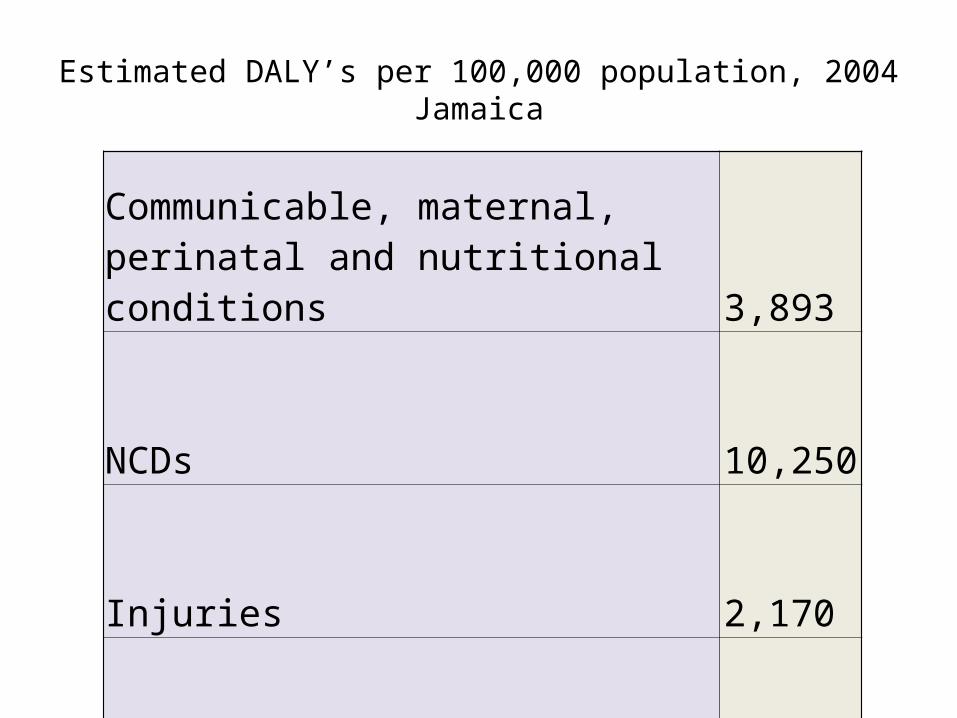
Estimated DALY’s per 100,000 population, 2004Jamaica
Communicable, maternal, perinatal and nutritional conditions
3,893
NCDs
10,250
Injuries 2,170
Total
16,314

Country profile of Environmental Burden of Disease (Jamaica)

DALys Comparison
• NCDs 10,250 • Diarrheas 280
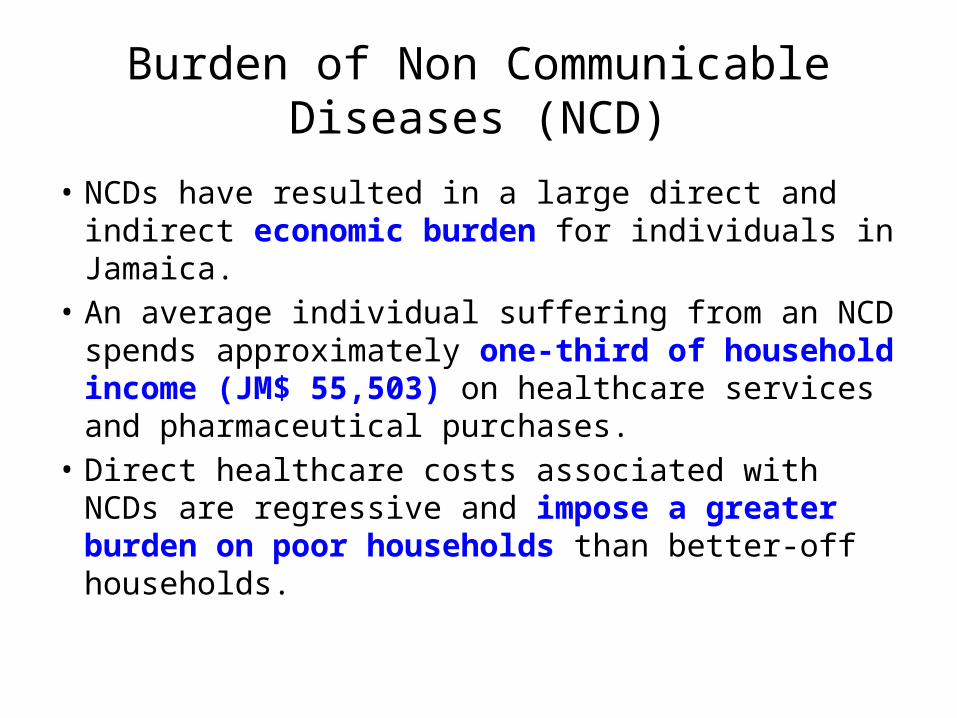
Burden of Non Communicable Diseases (NCD)
• NCDs have resulted in a large direct and indirect economic burden for individuals in Jamaica.
• An average individual suffering from an NCD spends approximately one-third of household income (JM$ 55,503) on healthcare services and pharmaceutical purchases.
• Direct healthcare costs associated with NCDs are regressive and impose a greater burden on poor households than better-off households.
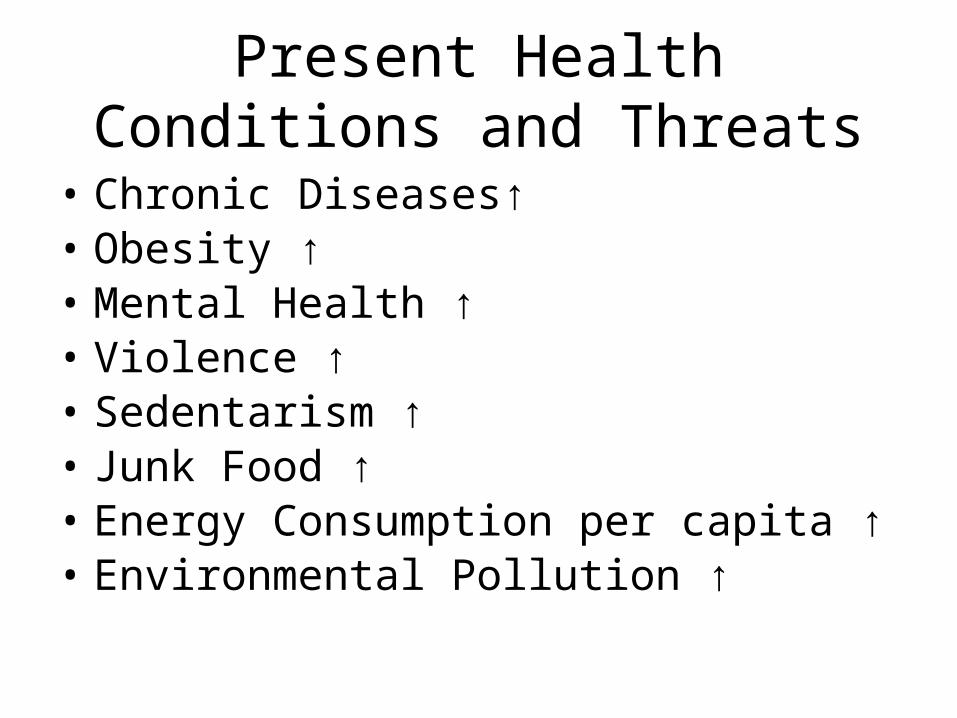
Present Health Conditions and Threats
• Chronic Diseases↑• Obesity ↑• Mental Health ↑• Violence ↑• Sedentarism ↑• Junk Food ↑• Energy Consumption per capita ↑• Environmental Pollution ↑

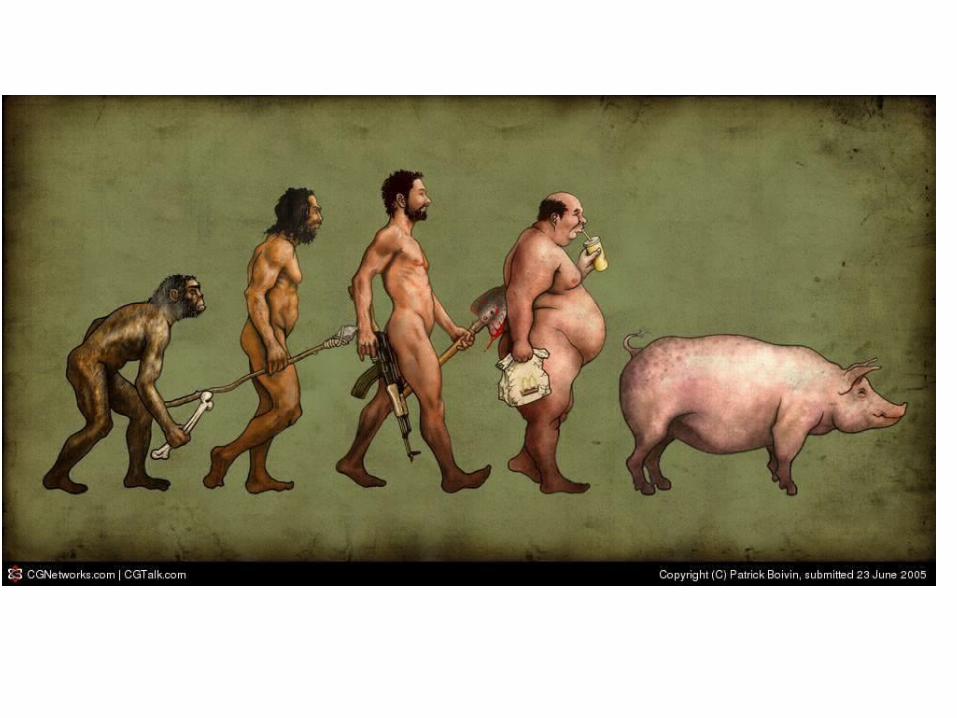
From Homo sapiens to Homo sedens
40

Obesity and overweight major risk factors for NCDs
Source: WHO 2012
41
DIABETES 44% CVD 23% (mainly heart d and stroke) CANCER 41% (Breast, endometrial, Colon) HYPERTENSION
Cholesterol, Dyslipidemia, LDLGall stone diseaseGlucose intolerance
Skin problems Respiratory problemsSleeping problems-ApneaPsychological Problems depression, dementiaMusculoskeletal disorders: Arthritis, Osteoporosis

Obesity Burden and its NCDs cause:
• Premature death• Long term Morbidity• S. Disability• Loss of Productivity• Reduction in quality life• High economic Burden-programs-PHC-• 77% of the cost of illness from obesity C Fray-Aiken-ERU-UWI
• Can occupy an enormous % of MOH budget
42
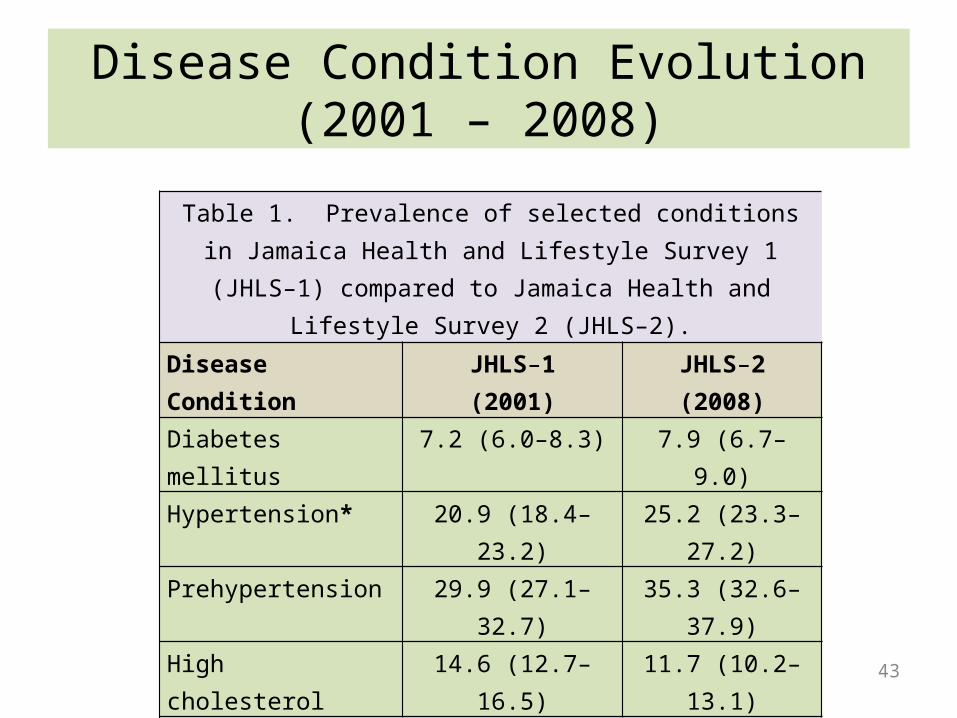
Disease Condition Evolution(2001 – 2008)
43
Table 1. Prevalence of selected conditions in Jamaica Health and Lifestyle Survey 1 (JHLS–1) compared to Jamaica Health and
Lifestyle Survey 2 (JHLS–2).
Disease Condition JHLS–1(2001)
JHLS–2(2008)
Diabetes mellitus 7.2 (6.0–8.3) 7.9 (6.7–9.0)
Hypertension* 20.9 (18.4–23.2) 25.2 (23.3–27.2)
Prehypertension 29.9 (27.1–32.7) 35.3 (32.6–37.9)
High cholesterol 14.6 (12.7–16.5) 11.7 (10.2–13.1)
*p < 0.05; JHLS–1 was conducted from 2000–2001 and JHLS–22007–2008.
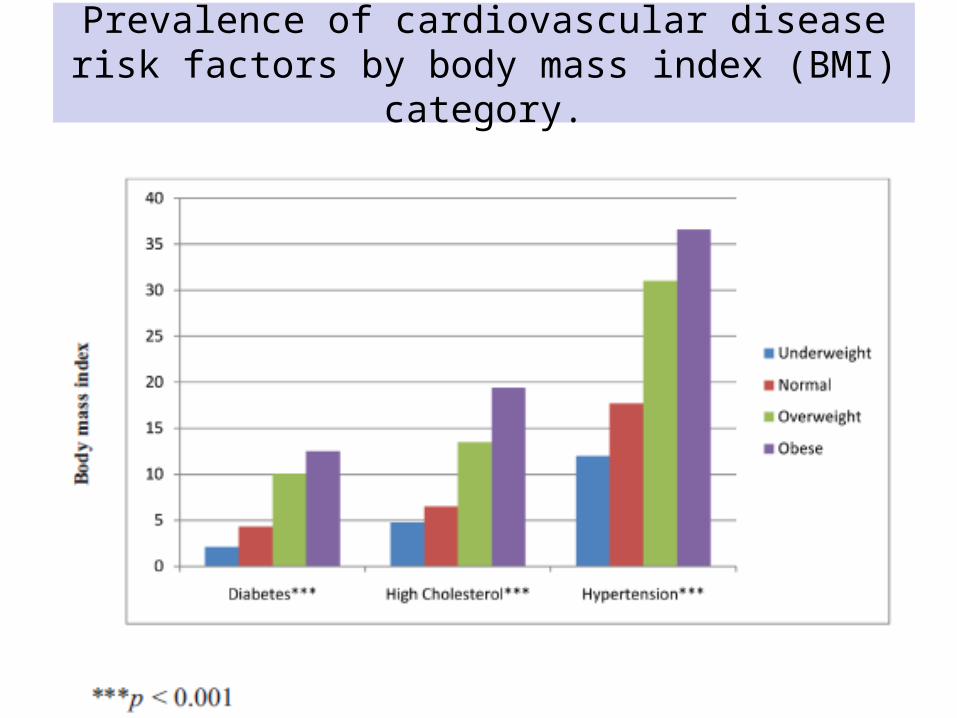
Prevalence of cardiovascular disease risk factors by body mass index (BMI) category.
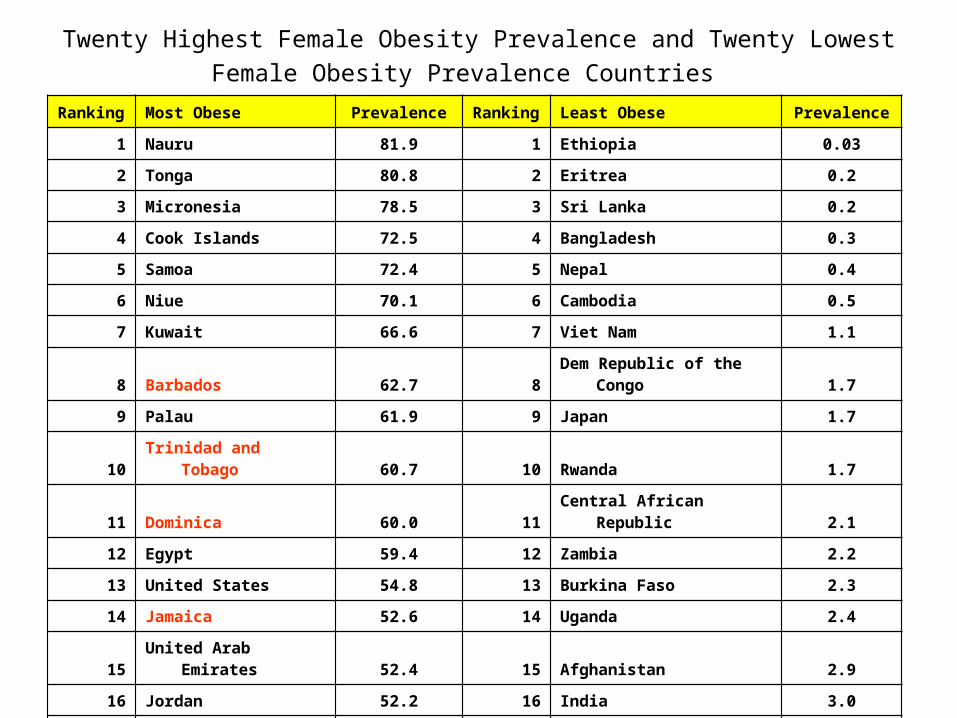
Twenty Highest Female Obesity Prevalence and Twenty Lowest Female Obesity Prevalence Countries
Ranking Most Obese Prevalence Ranking Least Obese Prevalence
1 Nauru 81.9 1 Ethiopia 0.03
2 Tonga 80.8 2 Eritrea 0.2
3 Micronesia 78.5 3 Sri Lanka 0.2
4 Cook Islands 72.5 4 Bangladesh 0.3
5 Samoa 72.4 5 Nepal 0.4
6 Niue 70.1 6 Cambodia 0.5
7 Kuwait 66.6 7 Viet Nam 1.1
8 Barbados 62.7 8 Dem Republic of the Congo 1.7
9 Palau 61.9 9 Japan 1.7
10 Trinidad and Tobago 60.7 10 Rwanda 1.7
11 Dominica 60.0 11 Central African Republic 2.1
12 Egypt 59.4 12 Zambia 2.2
13 United States 54.8 13 Burkina Faso 2.3
14 Jamaica 52.6 14 Uganda 2.4
15 United Arab Emirates 52.4 15 Afghanistan 2.9
16 Jordan 52.2 16 India 3.0
17 Nicaragua 51.2 17 Malawi 3.1
18 Mexico 51.1 18 Kenya 3.1
19 Malta 50.6 19 Burundi 3.2
20 Seychelles 50.4 20 Papua New Guinea 3.2

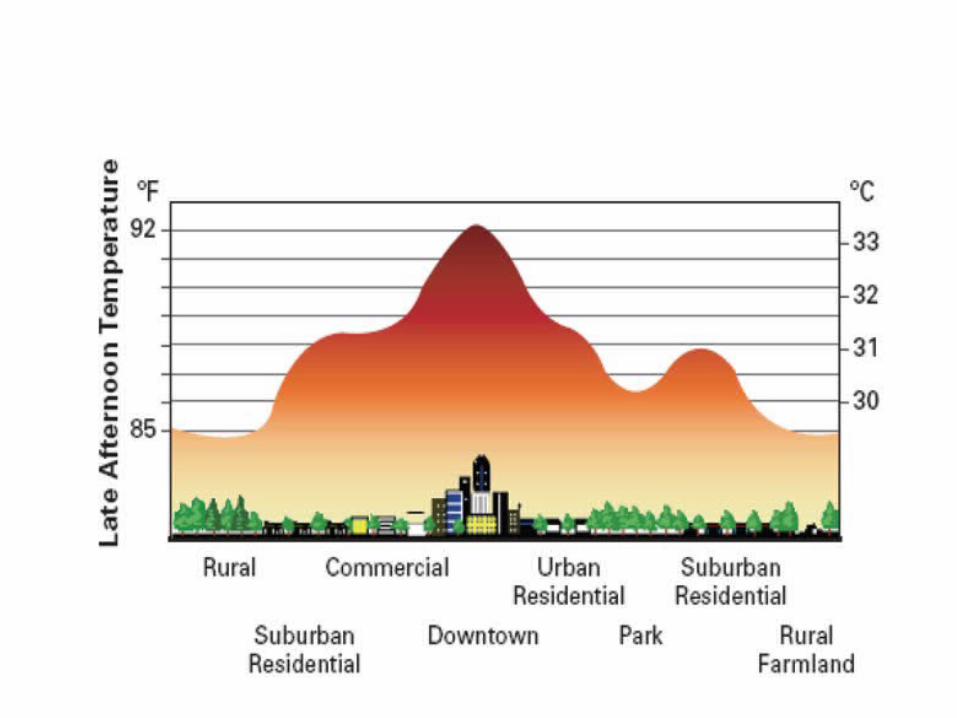
Climate Change Impacts• Higher temperatures
– 2 oC • Higher Relative Humidity
– 2.2% from 1973 to 2003• Rising seas• Increased risk of drought, fire and floods • Stronger storms and increased storm damage • Changing landscapes • More heat-related illness and disease • Economic losses • Wildlife at risk
It is expected an increase of 1.5 to 2.8o Celsius increase in temperature by 2050 and 2080
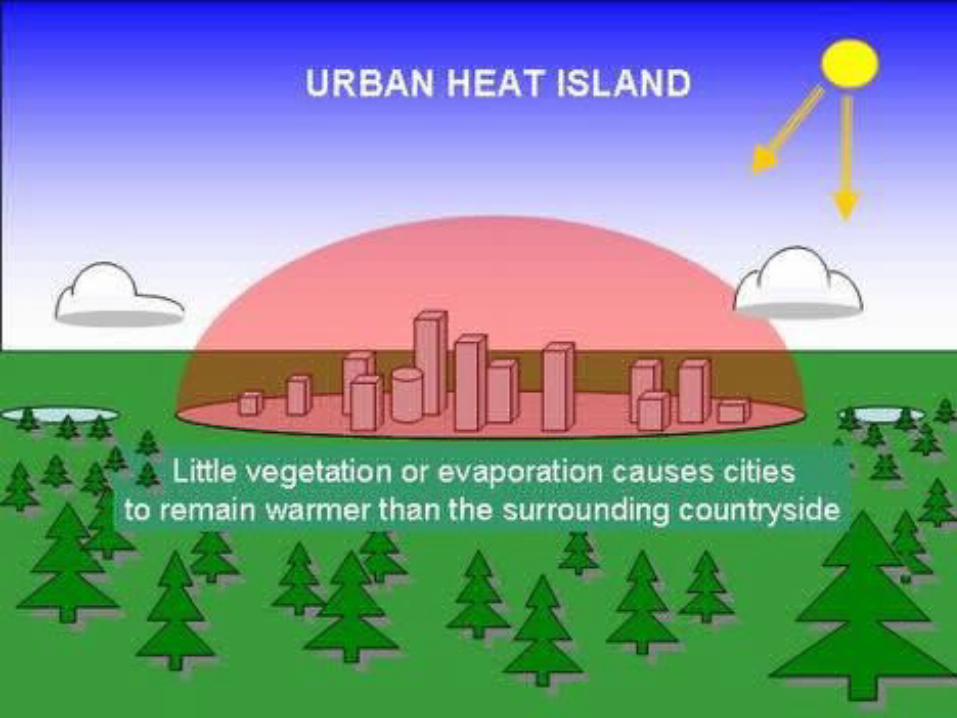
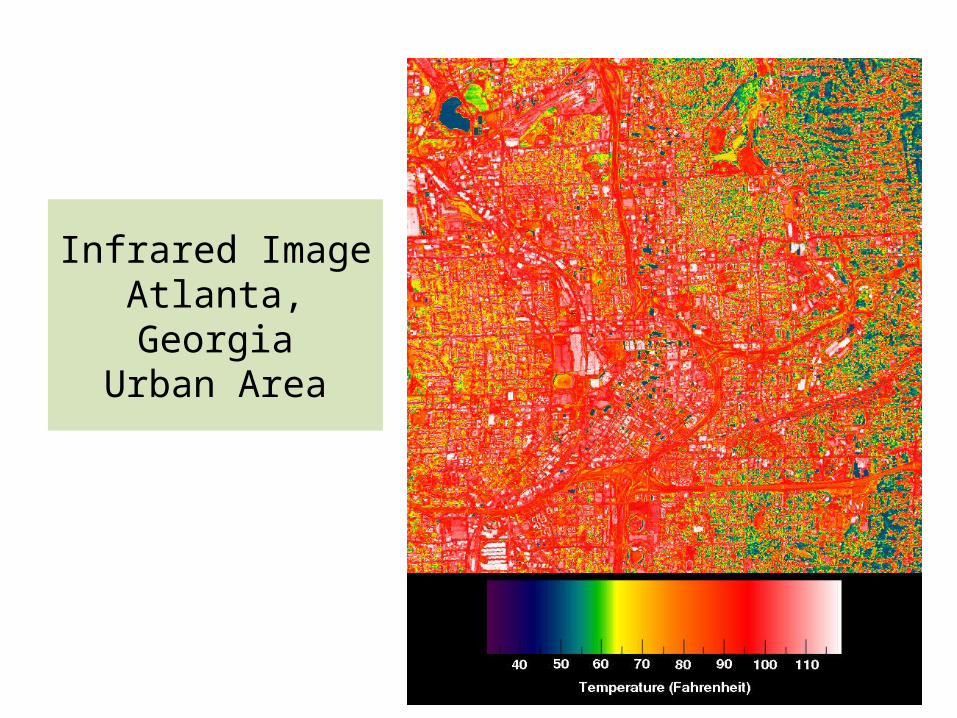
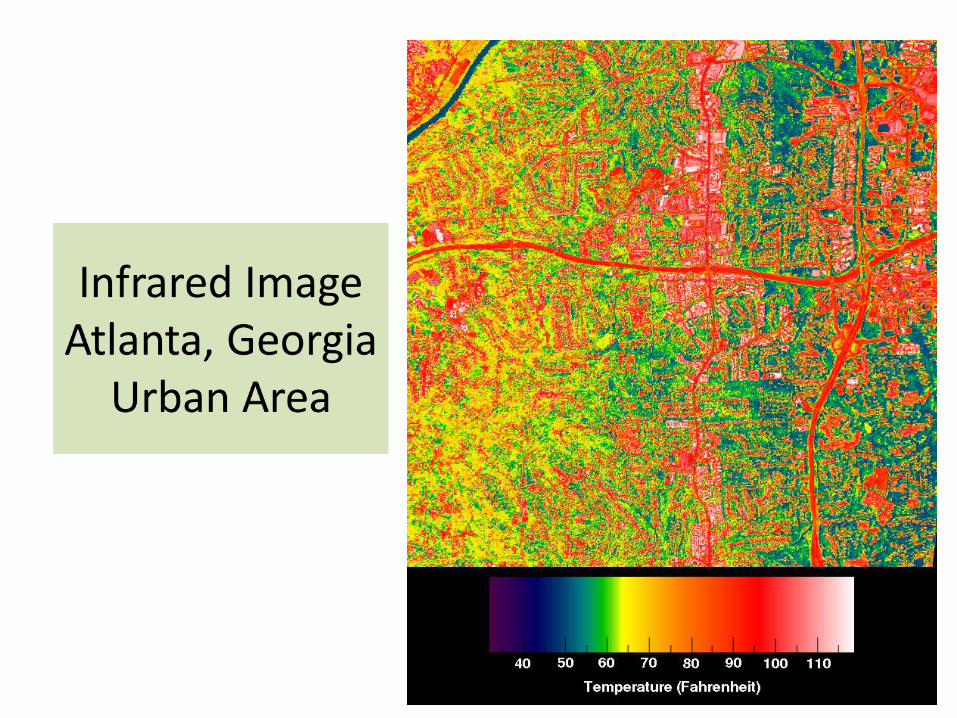
Infrared Image Atlanta, Georgia
Urban Area

Health Impacts
• Increase on water use: bath and laundry• Change on quality• Higher groundwater table • Increase in chronic diseases• Increase in violence• Increase in vector borne diseases• Impacts on physical activity• Impacts on occupational Health• Sick Building Syndrome
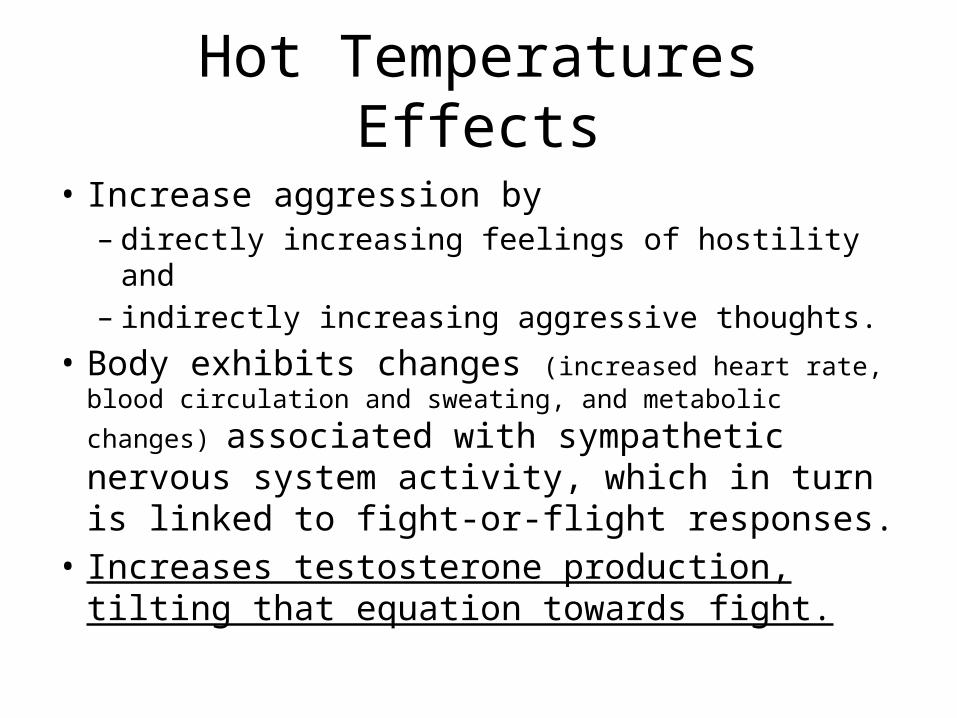
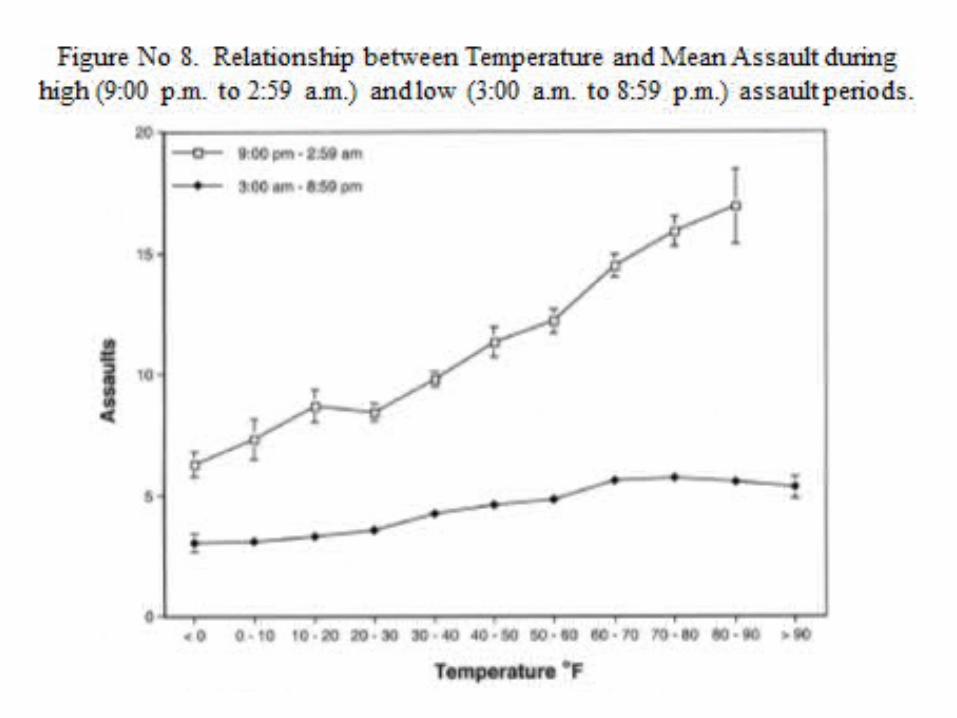
Hot Temperatures Effects
• Increase aggression by– directly increasing feelings of hostility and – indirectly increasing aggressive thoughts.
• Body exhibits changes (increased heart rate, blood
circulation and sweating, and metabolic changes) associated with sympathetic nervous system activity, which in turn is linked to fight-or-flight responses.
• Increases testosterone production, tilting that equation towards fight.

Ranson Study in USA(2012)
• Across a variety of offenses, higher temperatures cause more crime.
• For most categories of violent crimes, this relationship appears approximately linear through the entire range of temperatures experienced in in-sample counties.
• He has estimated that between 2010 and 2099, climate change will cause an additional 30,000 murders, 200,000 cases of rape, 1.4 million aggravated assaults, 2.2 million simple assaults, 400,000 robberies, 3.2 million burglaries, 3.0 million cases of larceny, and 1.3 million cases of vehicle theft in the United States.

Impact on Physical Activity
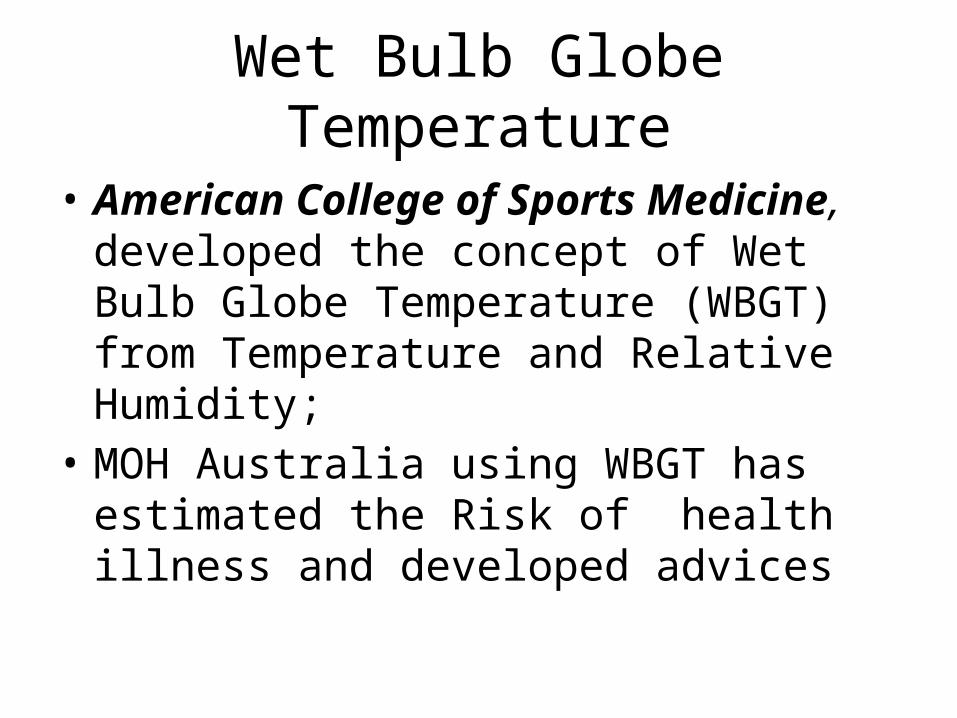
Wet Bulb Globe Temperature
• American College of Sports Medicine, developed the concept of Wet Bulb Globe Temperature (WBGT) from Temperature and Relative Humidity;
• MOH Australia using WBGT has estimated the Risk of health illness and developed advices

Wet Bulb Globe Temperature (WBGT) from Temperature and Relative Humidity and Risk for Heath Illness
Low Moderate-High High – Very High Extreme
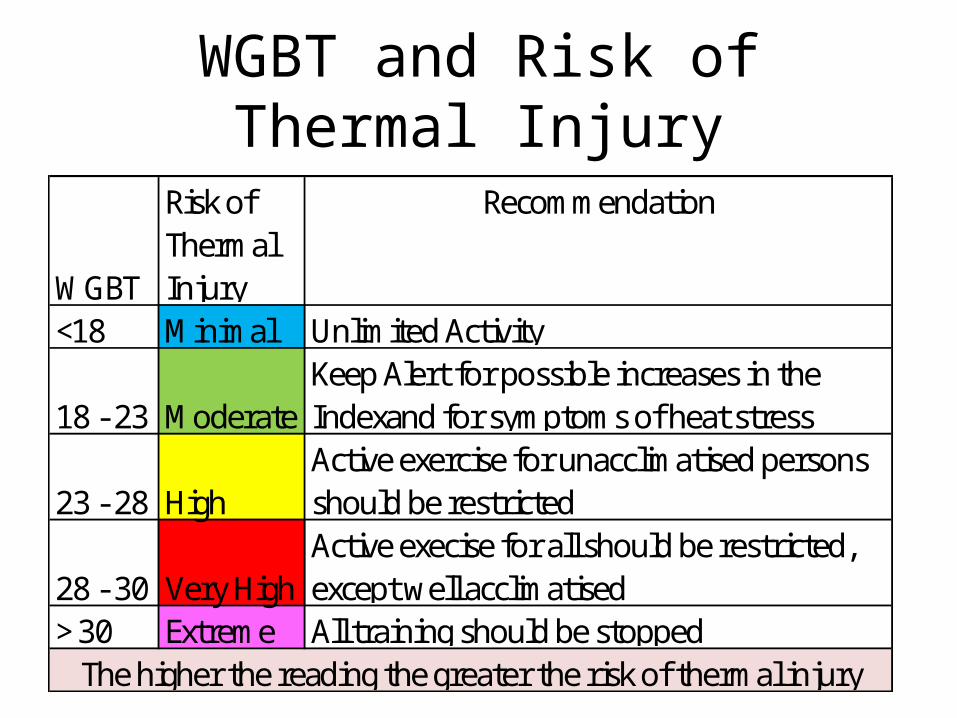
WGBT and Risk of Thermal Injury
WGBT
Risk of Thermal Injury
Recommendation
<18 Minimal Unlimited Activity
18 - 23 ModerateKeep Alert for possible increases in the Indexand for symptoms of heat stress
23 - 28 HighActive exercise for unacclimatised persons should be restricted
28 - 30 Very HighActive execise for all should be restricted, except well acclimatised
> 30 Extreme All training should be stoppedThe higher the reading the greater the risk of thermal injury
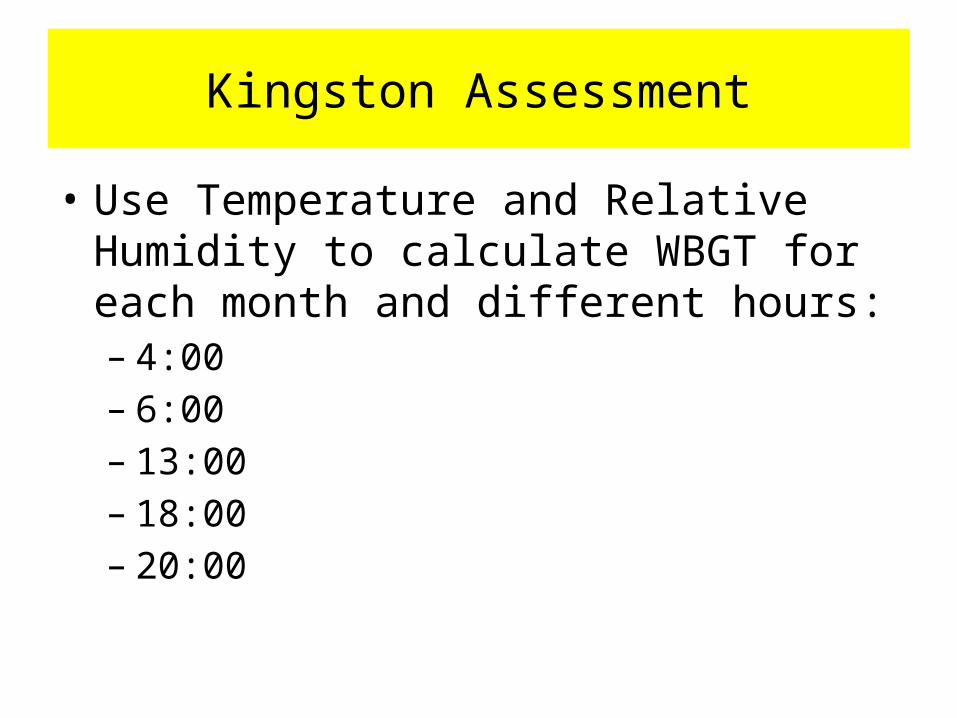
Kingston Assessment
• Use Temperature and Relative Humidity to calculate WBGT for each month and different hours:– 4:00– 6:00– 13:00– 18:00– 20:00

Table . Climate Change Risk of Thermal Injury during different hours of the year
Jan Feb Mar Apr May Jun Jul Aug Sep Oct Nov Dec 4:00 29 29 30 31 31 33 32 33 32 33 31 30 6:00 29 28 29 30 31 32 32 32 32 32 31 30
13:00 32 32 33 34 35 35 36 36 36 35 34 33 18:00 31 31 32 32 33 34 34 34 34 34 33 32 20:00 30 29 30 32 33 33 34 34 34 33 32 31

“Impact of Climate Change on Occupational Health and Safety: Are we prepared?”
Dr. Homero Silva-SerranoProfessor of Public Health Environment and Climate Change
School of Public Health and Health TechnologyUniversity of Technology, Jamaica
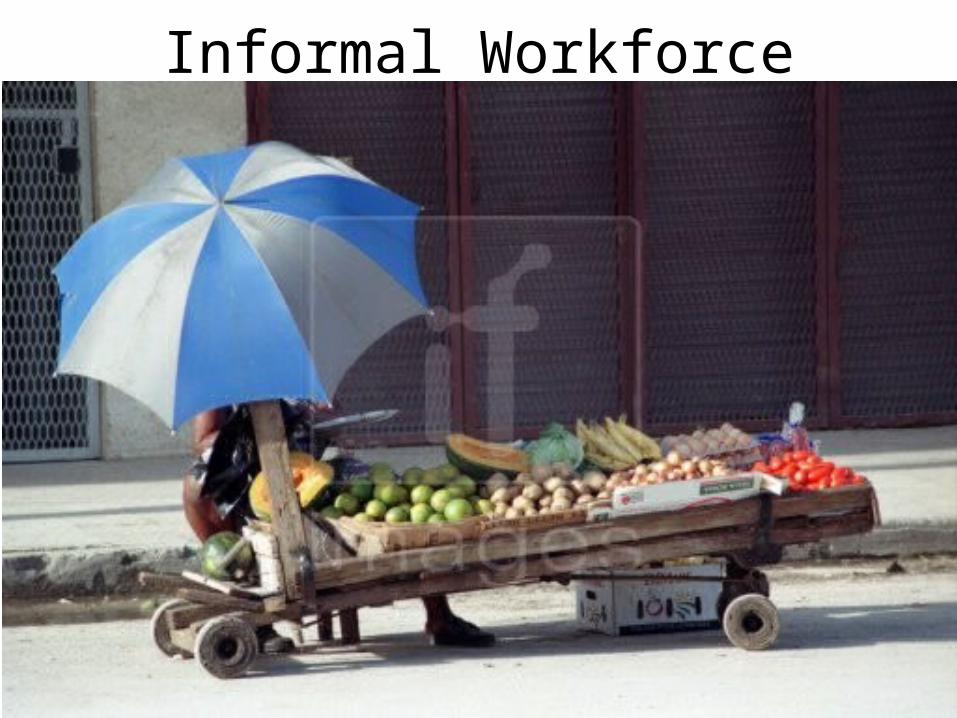
Informal Workforce
63
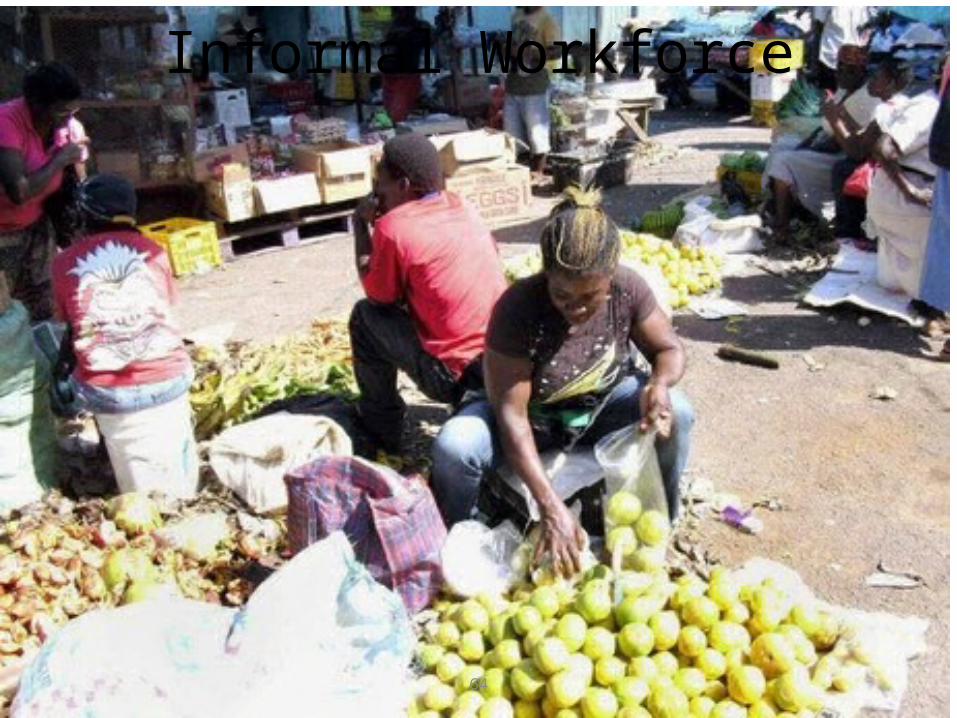
Informal Workforce
64

Informal Workforce
65

Humidex Chart

Preventive MeasuresHumidex Respone
Provide 15 minutes relief per hour
Provide adequate cool (10 - 15 oC) waterAt leas 1 cup (240 ml.) of water every 20 minutesWorkers with symptoms should seek medical attention
40-42Provide 30 minutes relief per hour in addition to the provisions listed aboveif feasible, provide 45 minutes relief per hour in addition to the provisions listed aboveIf a 75% relief period is not feasible then stop working until Humidex is 42 or less
45 or over Stop working until Humidex is 44 or less
38 - 39
43 - 44

Table No Working Risk Conditions with Climate Change
Jan Feb Mar Apr May Jun Jul Aug Sep Oct Nov Dec4:00 35 35 36 38 39 41 40 41 40 40 38 376:00 35 34 35 37 38 40 40 40 40 40 38 36
10:00 40 39 39 42 43 44 44 45 44 45 43 4113:00 40 40 41 42 44 45 45 46 45 44 43 4016:00 40 39 40 42 43 44 43 45 45 45 43 4218:00 39 39 40 41 41 43 43 44 43 42 41 4120:00 37 36 37 40 41 42 43 43 43 42 40 38
Working Risk Conditions With Climate Change
Table . Working Risk Conditions With Climate Change and Urban Heath Island Effect
Jan Feb Mar Apr May Jun Jul Aug Sep Oct Nov Dec 4:00 41 41 42 44 45 47 46 47 46 47 44 43 6:00 41 40 41 43 44 46 46 46 46 46 44 42
10:00 45 43 45 46 50 51 51 52 50 50 50 46 13:00 45 45 46 48 49 51 53 53 51 50 50 47 16:00 45 45 46 47 48 51 53 51 51 50 49 47 18:00 45 44 46 46 47 49 48 50 49 48 47 47 20:00 42 42 43 46 47 48 49 49 49 48 46 44
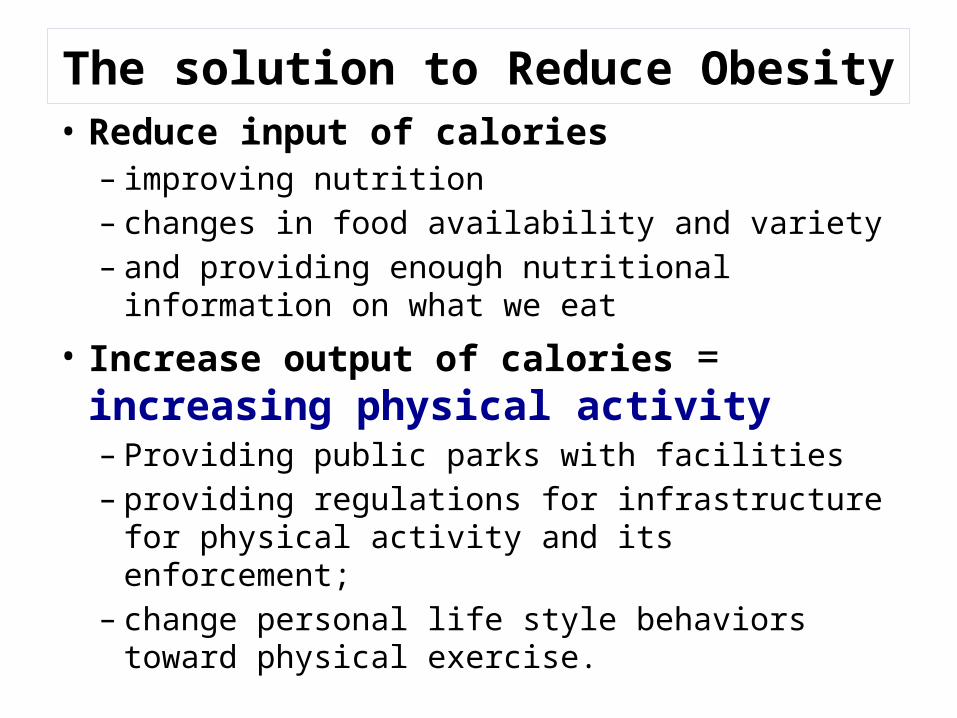
The solution to Reduce Obesity • Reduce input of calories
– improving nutrition– changes in food availability and variety – and providing enough nutritional information on
what we eat
• Increase output of calories = increasing physical activity– Providing public parks with facilities – providing regulations for infrastructure for physical
activity and its enforcement; – change personal life style behaviors toward physical
exercise.

The Complexity Eating Healthy
71
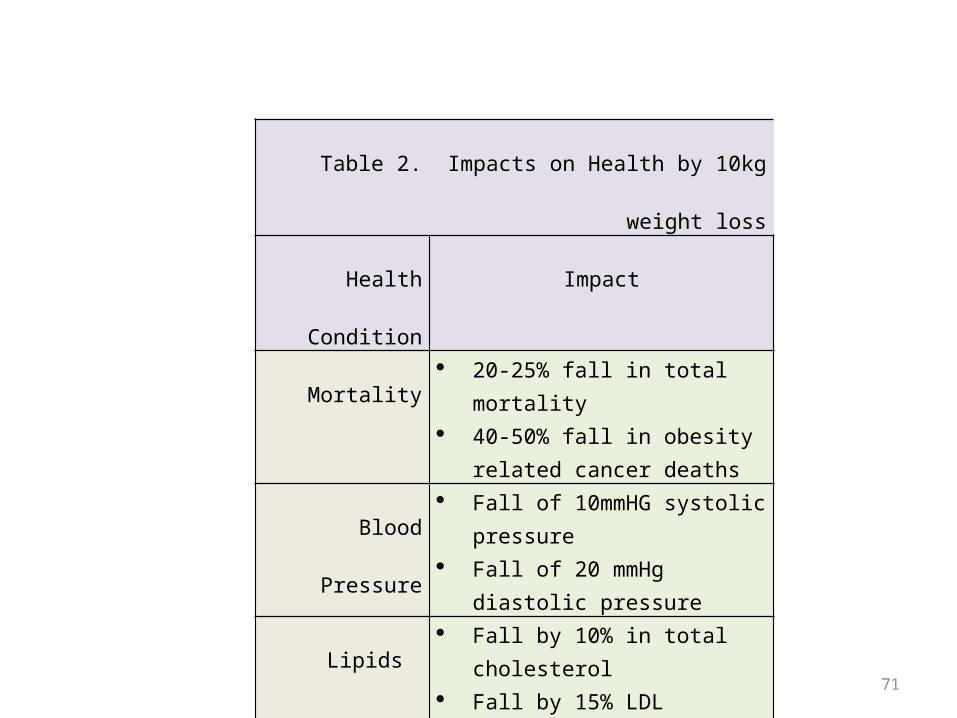
Table 2. Impacts on Health by 10kg weight loss
Health Condition Impact
Mortality 20-25% fall in total mortality 40-50% fall in obesity related
cancer deaths
Blood Pressure Fall of 10mmHG systolic pressure Fall of 20 mmHg diastolic
pressure
Lipids Fall by 10% in total cholesterol Fall by 15% LDL cholesterol Fall by 30% triglycerides Increase by 8% in HDL
cholesterol
Diabetes Fall of 30-50% in fasting blood
glucose Fall of 15% in HbA1c
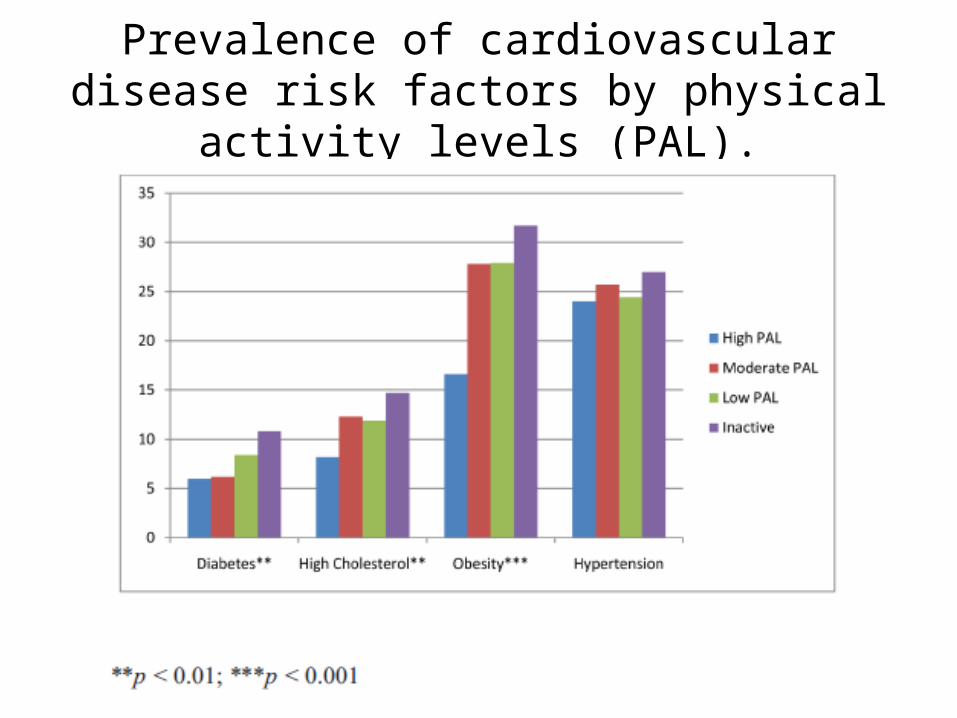
Prevalence of cardiovascular disease risk factors by physical activity levels
(PAL).
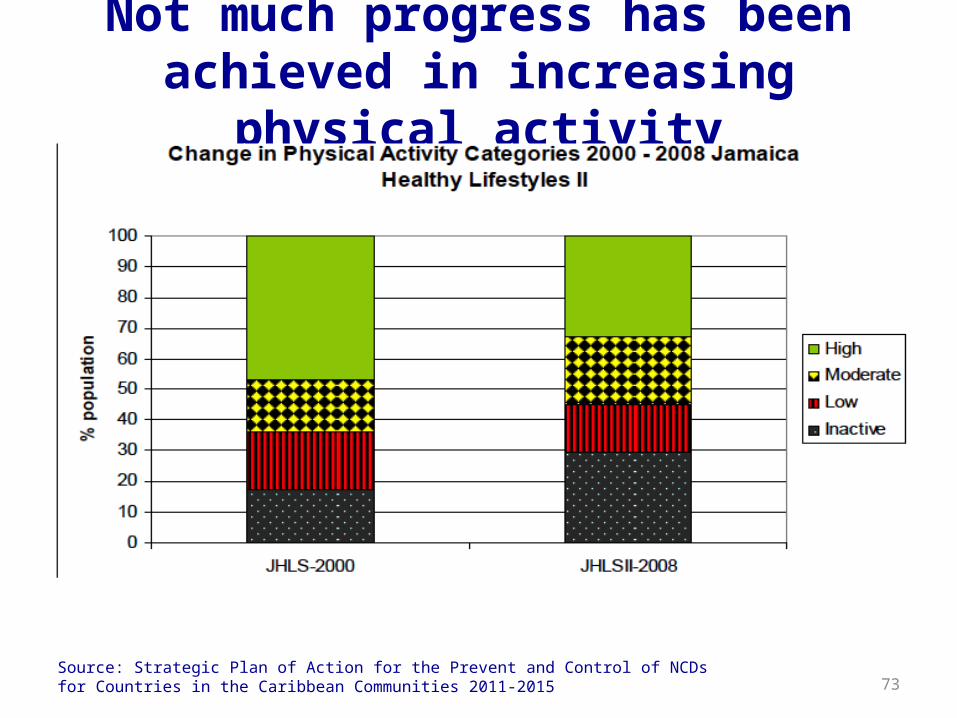
Not much progress has been achieved in increasing physical activity
73Source: Strategic Plan of Action for the Prevent and Control of NCDs for Countries in the Caribbean Communities 2011-2015
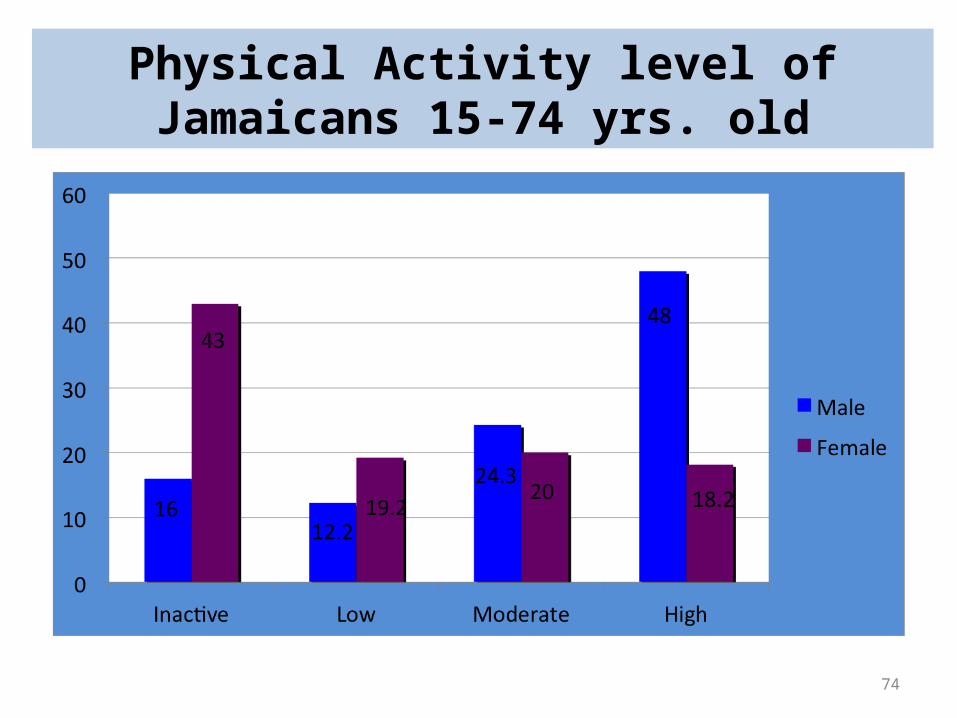
Physical Activity level of Jamaicans 15-74 yrs. old
Men more physically active than women
74
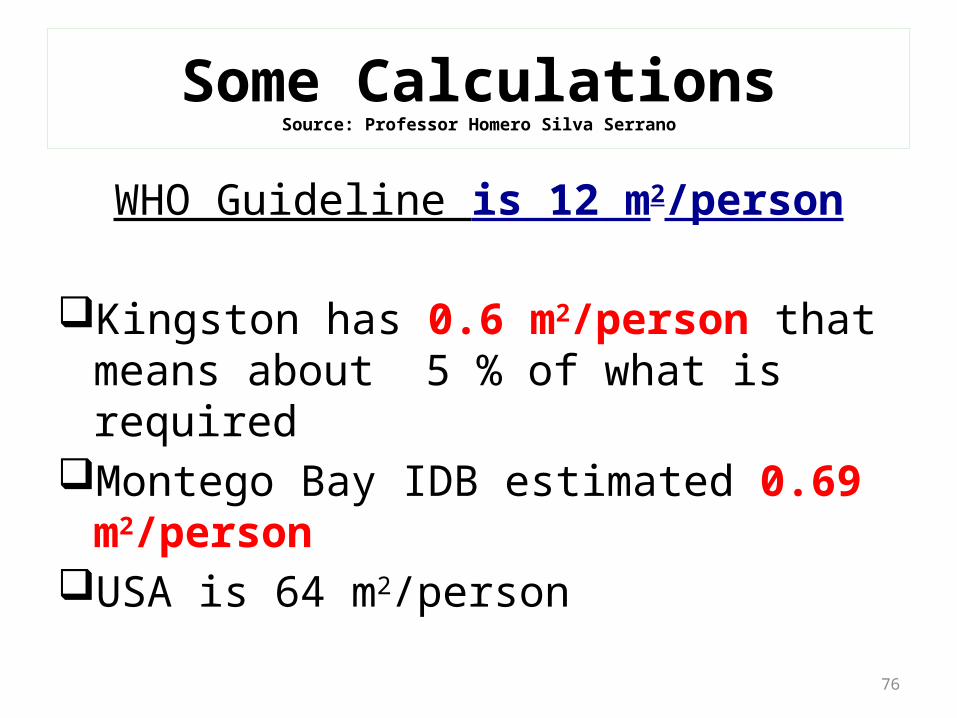
Some CalculationsSource: Professor Homero Silva Serrano
WHO Guideline is 12 m2/person
Kingston has 0.6 m2/person that means about 5 % of what is required
Montego Bay IDB estimated 0.69 m2/personUSA is 64 m2/person
76
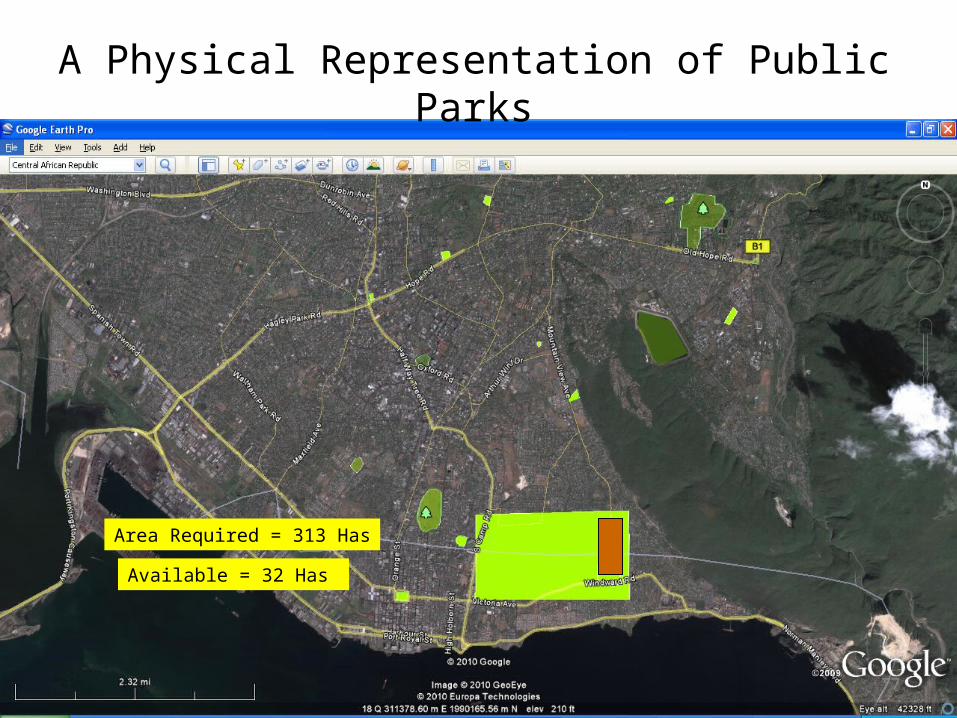
A Physical Representation of Public Parks
Area Required = 313 Has
Available = 32 Has
77
No
With
in p
ark
acce
ss
Park
Siz
e
Layo
ut: A
ctivi
ty a
reas
Park
feat
ures
Land
scap
ing
or A
esth
etic
appe
al
Bala
nce
betw
een
sun
and
shad
e
Play
grou
nd
Ligh
ting
Irrig
ation
sys
tem
Oth
er a
esth
etic
feat
ures
Rest
room
/cha
ngin
g fa
ciliti
es
Picn
ic a
reas
Park
ing
lots
No
Vis
ual c
ues
of
inci
viliti
es
Surr
ound
ing
neig
hbor
hood
Co
nditi
ons
Recr
eatio
n pr
ogra
ms
or th
e or
gani
zed
activ
ities
Safe
ty
Gra
de
Perc
enta
ge
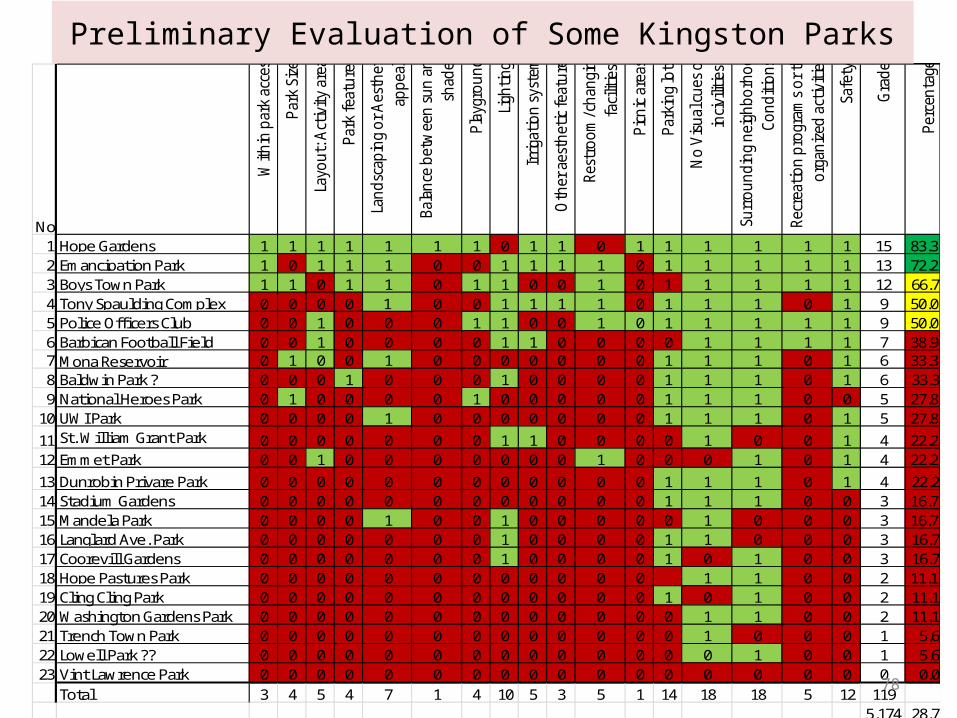
1 Hope Gardens 1 1 1 1 1 1 1 0 1 1 0 1 1 1 1 1 1 15 83.32 Emancipation Park 1 0 1 1 1 0 0 1 1 1 1 0 1 1 1 1 1 13 72.23 Boys Town Park 1 1 0 1 1 0 1 1 0 0 1 0 1 1 1 1 1 12 66.74 Tony Spaulding Complex 0 0 0 0 1 0 0 1 1 1 1 0 1 1 1 0 1 9 50.05 Police Offi cers Club 0 0 1 0 0 0 1 1 0 0 1 0 1 1 1 1 1 9 50.06 Barbican Football Field 0 0 1 0 0 0 0 1 1 0 0 0 0 1 1 1 1 7 38.97 Mona Reservoir 0 1 0 0 1 0 0 0 0 0 0 0 1 1 1 0 1 6 33.38 Baldwin Park ? 0 0 0 1 0 0 0 1 0 0 0 0 1 1 1 0 1 6 33.39 National Heroes Park 0 1 0 0 0 0 1 0 0 0 0 0 1 1 1 0 0 5 27.8
10 UWI Park 0 0 0 0 1 0 0 0 0 0 0 0 1 1 1 0 1 5 27.811 St. William Grant Park 0 0 0 0 0 0 0 1 1 0 0 0 0 1 0 0 1 4 22.212 Emmet Park 0 0 1 0 0 0 0 0 0 0 1 0 0 0 1 0 1 4 22.2
13 Dunrobin Privare Park 0 0 0 0 0 0 0 0 0 0 0 0 1 1 1 0 1 4 22.214 Stadium Gardens 0 0 0 0 0 0 0 0 0 0 0 0 1 1 1 0 0 3 16.715 Mandela Park 0 0 0 0 1 0 0 1 0 0 0 0 0 1 0 0 0 3 16.716 Langlard Ave. Park 0 0 0 0 0 0 0 1 0 0 0 0 1 1 0 0 0 3 16.717 Coorevill Gardens 0 0 0 0 0 0 0 1 0 0 0 0 1 0 1 0 0 3 16.718 Hope Pastures Park 0 0 0 0 0 0 0 0 0 0 0 0 1 1 0 0 2 11.119 Cling Cling Park 0 0 0 0 0 0 0 0 0 0 0 0 1 0 1 0 0 2 11.120 Washington Gardens Park 0 0 0 0 0 0 0 0 0 0 0 0 0 1 1 0 0 2 11.121 Trench Town Park 0 0 0 0 0 0 0 0 0 0 0 0 0 1 0 0 0 1 5.622 Lowell Park ?? 0 0 0 0 0 0 0 0 0 0 0 0 0 0 1 0 0 1 5.623 Vint Lawrence Park 0 0 0 0 0 0 0 0 0 0 0 0 0 0 0 0 0 0 0.0
Total 3 4 5 4 7 1 4 10 5 3 5 1 14 18 18 5 12 1195.174 28.7
Preliminary Evaluation of Some Kingston Parks
78
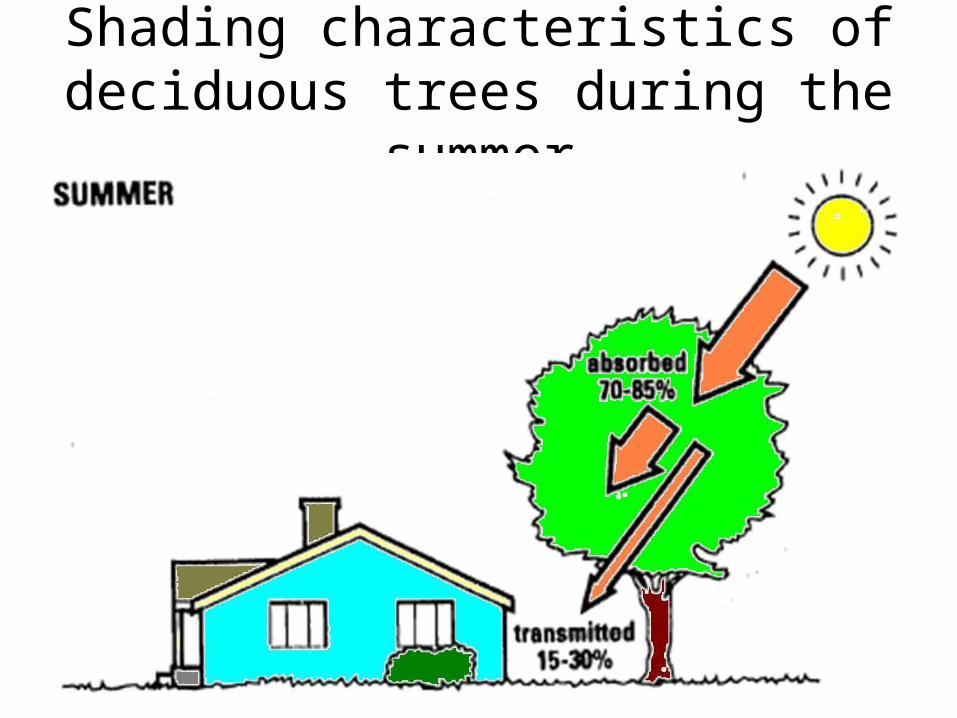
Shading characteristics of deciduous trees during the summer
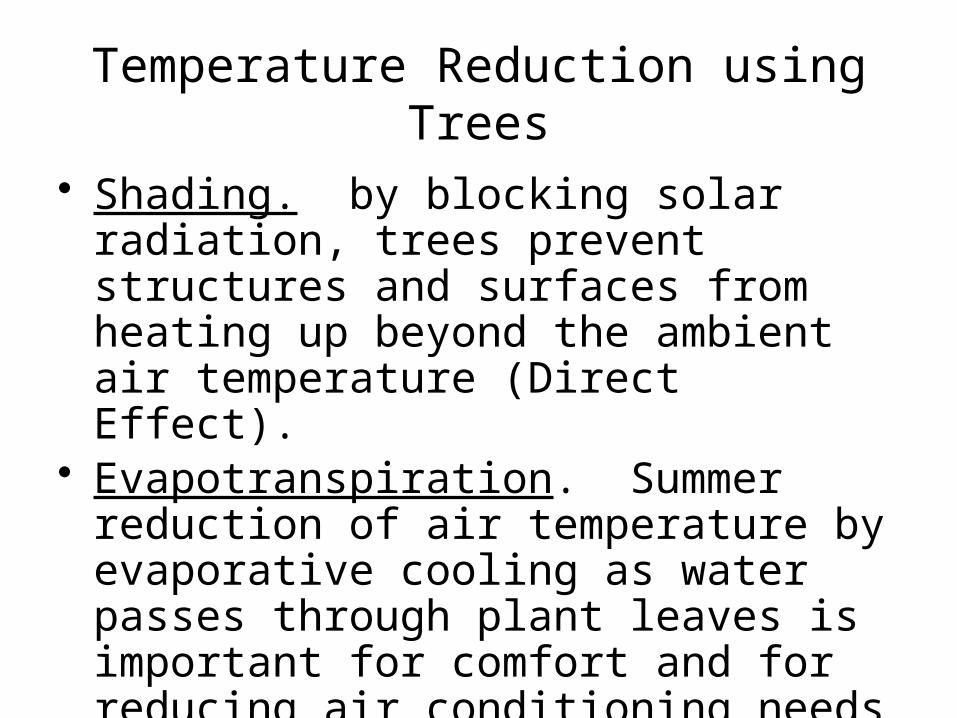
Temperature Reduction using Trees
• Shading. by blocking solar radiation, trees prevent structures and surfaces from heating up beyond the ambient air temperature (Direct Effect).
• Evapotranspiration. Summer reduction of air temperature by evaporative cooling as water passes through plant leaves is important for comfort and for reducing air conditioning needs (Indirect Effect).

Shading(Direct Effect)
• Shading can reduce summer air conditioning costs by 15 to 35 percent,
• As much as 50 percent or more in certain specific situations.
• Simply shading the air conditioner – by using shrubs or vine-covered trellis – can save up to 10 percent in annual cooling energy costs

Evapotranspiration(Indirect Effect)
82
Trees transpire up to 100 gallons of water in a day In a hot dry climate, This
cooling effect equal that of
5 air conditioners running for 20 hours
When the effects of evapotranspiration are combined with the effect of strategically placed shade, temperatures can drop by as much as 9 oF in the immediate vicinity of the trees.
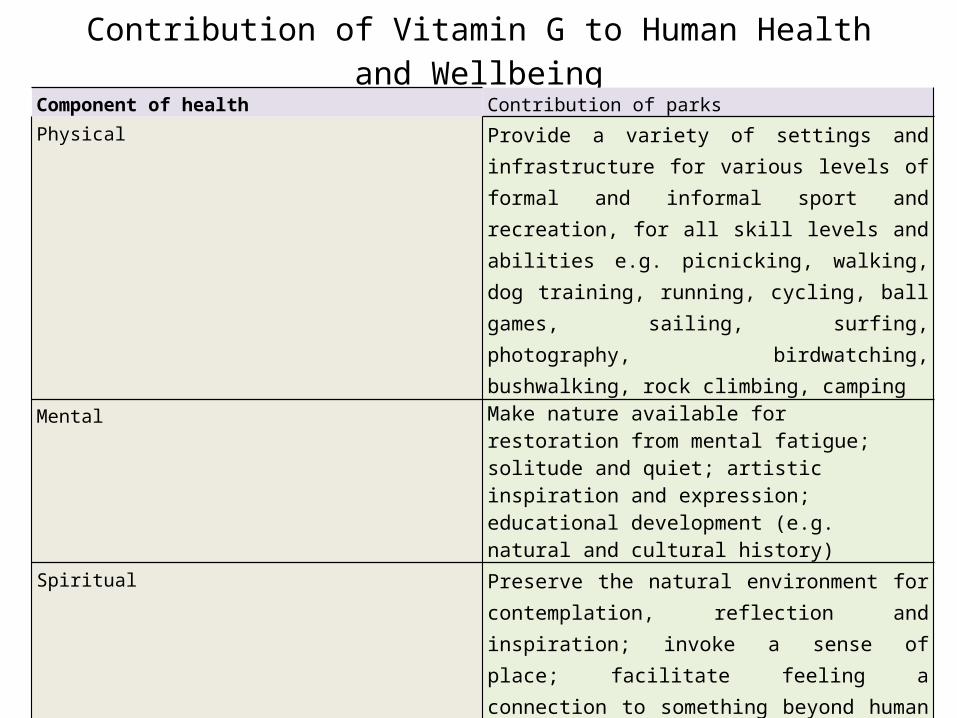
Contribution of Vitamin G to Human Health and Wellbeing
83
Component of health Contribution of parksPhysical Provide a variety of settings and infrastructure for
various levels of formal and informal sport and recreation, for all skill levels and abilities e.g. picnicking, walking, dog training, running, cycling, ball games, sailing, surfing, photography, birdwatching, bushwalking, rock climbing, camping
Mental Make nature available for restoration from mental fatigue; solitude and quiet; artistic inspiration and expression; educational development (e.g. natural and cultural history)
Spiritual Preserve the natural environment for contemplation, reflection and inspiration; invoke a sense of place; facilitate feeling a connection to something beyond human concerns
Social Provide settings for people to enhance their social networks and personal relationships from couples and families, to social clubs and organisations of all sizes, from casual picnicking to events days and festivals
Environmental Preserve ecosystems and biodiversity, provide clean air and water, maintain ecosystem function, and foster human involvement in the natural environment (Friends of Parks groups, etc.)

Is Drinking Water Enough?
84