Laser induced emission spectrometry for rapid elemental ...shura.shu.ac.uk/19273/1/10694153.pdf ·...
251
Laser induced emission spectrometry for rapid elemental analysis. ANDERSON, David Robert. Available from Sheffield Hallam University Research Archive (SHURA) at: http://shura.shu.ac.uk/19273/ This document is the author deposited version. You are advised to consult the publisher's version if you wish to cite from it. Published version ANDERSON, David Robert. (1994). Laser induced emission spectrometry for rapid elemental analysis. Doctoral, Sheffield Hallam University (United Kingdom).. Copyright and re-use policy See http://shura.shu.ac.uk/information.html Sheffield Hallam University Research Archive http://shura.shu.ac.uk
Transcript of Laser induced emission spectrometry for rapid elemental ...shura.shu.ac.uk/19273/1/10694153.pdf ·...

Laser induced emission spectrometry for rapid elemental analysis.
ANDERSON, David Robert.
Available from Sheffield Hallam University Research Archive (SHURA) at:
http://shura.shu.ac.uk/19273/
This document is the author deposited version. You are advised to consult the publisher's version if you wish to cite from it.
Published version
ANDERSON, David Robert. (1994). Laser induced emission spectrometry for rapid elemental analysis. Doctoral, Sheffield Hallam University (United Kingdom)..
Copyright and re-use policy
See http://shura.shu.ac.uk/information.html
Sheffield Hallam University Research Archivehttp://shura.shu.ac.uk

^ acnqsia..
Sheffield Hallam University
REFERENCE ONLY

ProQuest Number: 10694153
All rights reserved
INFORMATION TO ALL USERS The quality of this reproduction is dependent upon the quality of the copy submitted.
In the unlikely event that the author did not send a com p le te manuscript and there are missing pages, these will be noted. Also, if material had to be removed,
a note will indicate the deletion.
uestProQuest 10694153
Published by ProQuest LLC(2017). Copyright of the Dissertation is held by the Author.
All rights reserved.This work is protected against unauthorized copying under Title 17, United States C ode
Microform Edition © ProQuest LLC.
ProQuest LLC.789 East Eisenhower Parkway
P.O. Box 1346 Ann Arbor, Ml 48106- 1346

Laser-Induced Emission Spectrometry
for Rapid Elemental Analysis
David Robert Anderson
A thesis submitted in partial fulfilment of therequirements of
Sheffield Hallam University for the degree of Doctor of Philosophy
October 1994
Collaborating Organisation: Arun Technology Ltd.Southwater Horsham
West Sussex
RH13 7UD

Abstract David Robert Anderson
This thesis reports investigations into laser-induced emission spectrometry for rapid elemental analysis. An integrated laser and spectrometer system is configured, comprising a Q-switched Nd:YAG laser and an optical multichannel analyser, which enables the discreet monitoring of the laser-induced plasma produced by each laser shot. Novel applications are devised including the survey analysis of polymeric materials and the depth profiling of coated steels.
A survey analysis of polymeric materials for twelve elements (Al, Ba, Ca, Cu, Fe, Mg, Pb, P, Sb, Sn, Ti and Zn) is reported. Results showed that element emission responses are dependent upon operating conditions, selective volatilisation of antimony can occur, and ablation characteristics, such as the rate of material removal and plasma lifetime, are very different compared to metals. With optimised operating conditions of low laser energy and sample positioned at the laser focal point, the limit of detection for antimony is 0.09 % mass/mass with precision of 1.8 (% relative standard deviation) using a carbon signal from the polymer as internal standard. Rapid discrimination between samples of poly (vinyl chloride) is demonstrated with a measurement time of 1 s.
Data for the depth profiling of a range of coated steels using laser-induced plasma emission spectrometry are reported in detail for the first time. Coatings of zinc/nickel, tin, titanium nitride and chromium are examined. Depth profile signatures and crater shape are greatly influenced by operating conditions. Improved depth resolution and signatures are obtained using high laser energy and defocused laser radiation. Correlations are established between coating thickness and output parameters of the technique. Linear calibrations against coating thickness are achieved with good precision for replicate measurements (4 % relative standard deviation). Results showed that the technique can differentiate between tin coated samples with a difference in coating thickness of 0.02 pm, and can detect an ultra-thin chromium coating of 0.020 pm thickness. This performance and measurement times of 50 s indicate the rapid depth profile capability of the technique.
The novel application of an artificial intelligence technique (artificial neural networks) to laser-induced plasma emission spectra is reported for the first time. Studies showed that artificial neural networks can rapidly discriminate between the emission spectra of different materials with a success rate of 100 %, to provide a new means of rapid data processing.
© David R. Anderson

We seemed to tread air rather than crusted snow
W e were light of foot, we walked like demigods in joyous serenity
W . H . Murray
Mountaineering In Scotland

To my Mother and the memory of my Father
To Alison and David John

Table of Contents
Chapter 1
Introduction............................................................................................................. 1
1.1 Introduction............................................................................................. 2
1.2 Theory of atomic emission spectroscopy...............................................8
1.3 Theory of laser - material interaction processes.....................................10
1.4 Instrumentation for laser-induced emission spectrometry..................... 14
1.4.1 Laser types............................................................................... 16
1.4.2 Detection systems....................................................................18
1.5 Review of analytical applications............................................................25
1.5.1 Solid phase............................................................................... 25
1.5.2 Liquid phase............................................................................. 33
1.5.3 Gas phase................................................................................ 34
1.5.4 Studies to improve analytical performance...............................35
Buffer gas type and pressure..................................................36
Effect of laser wavelength.......................................................39
Use of internal standard..........................................................40
Effect of magnetic field ...................................................41
Other studies........................................................................... 41
1.6 Conclusions............................................................................................ 42
1.7 Aims and objectives of this work............................................................ 44
1.8 References............................................................................................. 46
i

Chapter 2
Experimental............................................................................................................ 59
2.1 Introduction............................................................................................ 60
2.2 Laser-induced plasma emission spectrometry...................................... 60
Laser...................................................................................................60
Optical multichannel analyser.............................................................67
Spectrometer............................................................................68
Intensified photodiode array detector...................................... 69
Detector interface.....................................................................72
Laser - optical multi-channel analyser system................................... 72
Overview..................................................................................72
Laser table and sample ablation cabinet................................. 75
Synchronisation of the laser and OMA operation.................... 78
Data acquisition..................................................................................81
Procedure........................................................................................... 83
2.3 Inductively coupled plasma emission spectrometry..............................83
Introduction.........................................................................................83
Instrumentation...................................................................................85
Procedure...........................................................................................88
Normal - direct nebulisation.....................................................88
Flow injection............................................................................ 88
Reagents............................................................................................ 88
2.4 Additional instrumentation.....................................................................89
2.5 Laser Safety.......................................................................................... 9°
Warning.............................................................................................. 90
Precautions......................................................................................... 90
2.6 References............................................................................................ 91
ii

Chapter 3
Studies Of Laser-Induced Plasma Emission Spectrometry With An
Optical Multichannel Analyser..................................................................................92
3.1 Introduction..............................................................................................93
3.2 Experimental...........................................................................................94
3.3 ResuJts and Discussion...........................................................................95
3.3.1 Inductively coupled plasma emission spectrometry..................95
3.3.2 Laser-induced plasma emission spectrometry.......................... 103
Studies of the laser-induced plasma........................................103
Analytical performance.,...........................................................115
3.4 Conclusions and Recommendations for Further Work........................... 121
3.5 References..............................................................................................124
Chapter 4
Survey Analysis of Polymeric Materials...................................................................125
4.1 Introduction.............................................................................................. 126
4.2 Experimental...........................................................................................128
4.3 Results and Discussion...........................................................................133
4.3.1 Preliminary studies.....................................................................133
4.3.2 Characterisation of operating conditions....................................138
4.3.3 Analytical performance..............................................................143
4.3.4 Survey analysis.......................................................................... 148
4.4 Conclusions and Recommendations for Further Work............................150
4.5 References.............................................................................................. 151
iii

Chapter 5
Depth Profile Studies............................................................................................... 153
5.1 Introduction.............................................................................................. 154
5.2 Experimental........................................................................................... 156
5.3 Results and Discussion........................................................................... 158
5.3.1 Preliminary studies..................................................................... 158
5.3.2 Basic characterisation studies...................................................165
5.3.3 Depth profile performance and applications...............................178
Zinc/nickel coatings..................................................................178
Tin coatings.............................................................................. 184
Titanium nitride coating............................................................189
Ultra-thin chromium coating.....................................................192
5.4 Conclusions and Recommendations for Further Work........................... 195
5.5 References.............................................................................................. 197
Chapter 6
The Discrimination Of Laser-Induced Plasma Emission Spectra Using
Artificial Neural Networks......................................................................................... 199
6.1 Introduction..............................................................................................200
6.2 Artificial neural networks..........................................................................203
6.2.1 Historical....................................................................................203
6.2.2 Theory........................................................................................ 203
6.3 Feature extraction................................................................................... 207
6.3 Experimental........................................................................................... 209
6.3.1 Data manipulation......................................................................210
6.3.2 Artificial neural networks............................................................212
6.4 Results and Discussion...........................................................................212
6.5 Conclusions and Recommendations for Further Work........................... 220
6.6 References.............................................................................................. 221
i v

Chapter 7
Conclusions and Recommendations for Future Work............................................. 223
Acknowledgement....................................................................................................229
Postgraduate Studies...............................................................................................230
Bibliography.............................................................................................................232
Appendix
v

1.1 Introduction
Atomic emission spectrometry has been used in analytical chemistry for over
one hundred years. The history of the technique spans several centuries from
early observations by Agricola in the 16th century, through to studies by
Bunsen and Kirchoff in the 19th century, to commercial instruments developed
over the last 70years. Modern instrument systems, such as inductively coupled
plasma emission spectrometers, are now used world-wide for the rapid and
quantitative analysis of many elements.1
Atomic emission instruments consist of three main components: an excitation
source, a spectrometer and a detector, (Figure 1). The function of the source is
to vaporise sample material (depending on the phase of the sample), and to
atomise sample components and electronically excite the atoms to produce
atomic emission radiation. Ionisation may also occur resulting in ionic
emissions. These emissions are in the ultra-violet and visible regions of the
electromagnetic spectrum and are characteristic in wavelength for each
element. Many different sources have been developed over the years including
electrical arcs and sparks, glow discharges, laser-induced plasmas, inductively
coupled plasmas, etc.2
emission source
tsample
emittedradiation
detectorspectrometer
dispersion of emitted radiation using either: prism or grating
c1fgint1.cdr
detection with either:- photographic plate- photomultiplier tube- photodiode array
Figure 1 The three main components of an atomic emission spectrometer
2

The spectrometer disperses the emitted radiation into component wavelengths
using either a prism or a diffraction grating to produce a spectrum.
Spectrometers can analyse either several wavelengths simultaneously or a
single wavelength at a time. The detector records the emission signal of an
individual emission wavelength from the spectrum. Detectors are either single
channel and detect a single element response, such as a photomultiplier tube,
or are multichannel and can detect several elements simultaneously, such as
photographic plates, several photomultiplier tubes and photodiode arrays.
Over the last seventy years, each area of instrumentation has received
considerable development. A list of typical instrumentation is given in Table 1.
Emission Source Instrument and Manufacturer
arc
spark
glow discharge
ICP
laser-induced plasma
large quartz spectrograph, Hilger and Watts
Analoy, Arun Technology
Quantovac, Applied Research Laboratories,
Polyvac, Hilger and Watts
Leco Instruments
Applied Research Laboratories
Thermo Jarrell Ash, Spectro Analytical
Varian, Perkin Elmer
Laser Microprobe: Carl Zeis
JEOL
Jarrell Ash
Note: not all instruments are now available commercially
Table 1 List of atomic emission sources and instruments

In the 1930s, commercial arc emission instruments, such as the Hilger and
Watts large quartz spectrograph, became available. The instrument used an arc
discharge between a counter electrode and a solid, conducting sample.
Material was removed from the sample by the arc through melting, boiling and
vaporisation processes. The high temperature of the arc caused atomisation
and ionisation and produced atomic/ionic emissions. Radiation from the arc was
dispersed in the spectrograph by a prism and a photographic plate recorded the
resulting emission spectrum. This sensitive technique allowed the simultaneous
detection and semi-quantitative analysis of many elements. The interpretation
of the photographic plate is very time-consuming and tedious.
Direct reading spectrometers were developed in the 1950s to meet the demand
of the steel industry for a rapid, quantitative analytical technique. A typical
instrument was a 'Quantometer' from the company, Applied Research
Laboratories.3 It used a spark discharge for excitation and a polychromator
fitted with several photomultiplier tube detectors to measure the light intensity at
pre-selected wavelengths. A grating was used in the spectrometer for the
dispersion of light. The advance was possible by improvements in the quality of
gratings and photomultiplier tubes. The instrument enabled quantitative,
multielement analysis to be achieved in approximately 2 to 3 minutes, much
less than by the spectrograph, which took about 1 hour. Such direct reading
spectrometers are still commercially available and are widely used for the
analysis of metals and alloys.
Glow discharge sources such as the Grimm-type lamp have been used for the
bulk chemical analysis of solid, conducting materials2, and more recently, for
the depth profiling of conducting coatings on substrates.4 In the Grimm lamp, a
flat sample forms the cathode close to an annular anode in a low pressure
argon atmosphere. A high voltage (500-1000 V) between the cathode and
4

anode produces a glow discharge of high radiant intensity, and sample material
is removed through a sputtering process by the bombardment of argon ions.
Instruments are available from companies such as Leco Instruments.
Arc, spark and glow discharge sources have been successfully used with solid,
conducting materials but have had limited success with the analysis of liquids or
non-conducting materials. In the 1960s and 1970s, inductively coupled plasma
(ICP) sources were developed to analyse liquid solutions and became widely
used for this application.1 Solutions are generally introduced via a nebuliser
which produces an aerosol that is dried, atomised and excited by the plasma.
The plasma is sustained by radio-frequency energy from an induction coil. The
ICP technique has rapid, simultaneous multielement analysis capabilities. For
example, a Thermo Jarrell Ash ICAP9000 can analyse a sample solution for up
to 64 elements in under 1 minute. Many systems are available from companies
such as Applied Research Laboratories, Spectro Analytical, etc.
The laser was first used as a source for atomic spectrometry in 1962 by Brech
and Cross5 soon after the invention of the laser by Maiman in I960.6 In this
technique (laser-induced plasma emission spectrometry, LIPS), laser light from
a high energy laser is focused onto the sample surface to produce a laser-
induced plasma. Sample material is vaporised into the plasma and
characteristic atomic/ionic emissions result. Spectrochemical measurement of
the laser-induced plasma enables simultaneous, multi-element analysis of the
sample. Rapid, in situ micro- and bulk analysis of samples can be achieved,
and the technique has a remote sensing capability. The technique has been the
subject of development for over thirty years,7 starting with the laser microprobe
with photographic detection used by Brech and Cross5 to current state of the art
optical multi-channel analysers that incorporate computer-controlled photodiode
5

array detection systems. Some authors refer to the technique as laser induced
breakdown spectrometry (LIBS) and refer to the plasma as the 'laser spark1.8
laser light
focus lens
atomicionic
emission laser-inducedplasma
sample
Figure 2 Schematic of laser-induced plasma emission spectrometry
There are, however, some disadvantages associated with the laser-induced
plasma technique. Emission spectra are complex and time-dependent because
of the high temperature and the transient nature of the plasma, and the plasma
is formed with each laser shot and decays away completely between shots. A
sophisticated detector system is required to make rapid, time-resolved
measurement in order to extract useful analytical data from the laser-induced
plasma.7 Time resolution is important because it enables analyte emission
signals to be separated in time from the intense background continuum and
provides considerably improved analytical performance .
Laser ablation has also been used as a source for elemental mass
spectrometry (laser microprobe mass analysis, LAMMA), and has been coupled
6

to other techniques such as inductively coupled plasma emission and mass
spectrometry's.7 Here the laser is used only to remove sample material and
analysis is achieved with a more powerful excitation source and detector
system. Several reviews are published 7-9-10 and laser ablation systems with
inductively coupled plasma mass spectrometers are available, e.g. Fisons VG
Elemental, Perkin Elmer Sciex, etc. The main advantage of such coupled
techniques is improved sensitivity compared to laser-induced plasma emission
spectrometry.
There remains, however, considerable interest in laser-induced plasma
emission spectrometry because there is a growing need by industry for
elemental analysis of materials that is more rapid than currently available.
Applications include the monitoring of element compositions in production and
process situations so that material composition can be more closely controlled,
the rapid sorting of materials, and the rapid, in situ environmental analysis of
hazardous materials. Laser-induced plasma emission spectrometry can be
used to address these requirements because of the remote sensing, rapid and
in situ, simultaneous multielement analysis capabilities. The major
disadvantage of laser-induced plasma emission spectrometry is relatively poor
sensitivity, which may not present a problem because these industrial
applications do not generally require high sensitivity. The work forming the
basis of this thesis investigates laser-induced plasma emission spectrometry in
order to devise novel applications that will further the understanding and
knowledge of the technique.
7

1.2 Theory of atomic emission spectroscopy
Atomic emission spectra originate from electronic transitions of excited atoms
and ions.11-12 An atom consists of a central nucleus of protons and neutrons,
surrounded by electrons arranged in discrete energy levels (orbitals). At low
temperatures, such as room temperature, all the electrons are essentially in
ground state configurations and are un-excited. Outer valence electrons can be
excited to higher orbitals by the high temperature of an atomic emission source
such as a chemical flame, inductively coupled plasma (ICP), or laser-induced
plasma. The excited atom has a very short lifetime (10-8 s) and the excited
electron then decays to the ground state, releasing the extra energy as a
photon of radiation. The energy of this emitted photon (Eem) is governed by the
difference in energy levels between the ground state (Egs) and excited state
(E ex)-
(1)
(2) and
where h = Plank's constant (6.624 x 10⁻³⁴ Js)
v = frequency of radiation
(3)
the frequency can be converted to wavelength (X) from:
(4) c = v X
where c = velocity of light in vacuum (2.9979 x 10⁸ ms4)
from (3)
(5)
v = c / X
h (C / X) — Eex - Egg
X he / (Eex - Egg)
As these energy levels are discrete and unique to each element, the emitted
photon is characteristic in wavelength of that element and the resultant
emission line is narrow and well defined. Depending on the temperature of the

emission source, atoms can be ionised, either singly, doubly, etc., and these
ions may also undergo electronic excitation to produce further emission lines.
The probability of a particular electronic transition is given by the Boltzmann
Distribution Law:
Nj gj ( Ep(6 ) T j- = — expNo go kTy
where Nj = number of atoms in an excited state
N0 = number of atoms in the ground state
gj = statistical weight of the excited state
g0 = statistical weight of the ground state
Ej = energy difference between excited state and ground state
k = Boltzmann constant (1.38 x 10⁻²³ J K_1)
T = temperature (K)
The emission intensity is proportional to the number of excited species.
From (6), the number of excited species and therefore the intensity of emitted
radiation is strongly affected by the temperature of the emission source;
increasing the temperature increases the intensity of emission lines.
The wavelengths of emission lines are not generally calculated as there are
many possible electronic transitions for each element, the number of transitions
increasing with atomic number and valancy. For example, in the wavelength
range 200 - 800 nm there are more than 200,000 emission lines2 of neutral
atoms and single ions. Emission wavelengths are given in published tables,
such as the M. I. T. Wavelength Tables,13 in which emission lines were
obtained from the arc, spark or discharge tube emission spectra of pure
elements, and the spectral atlas for an ICP emission source by Fassel et al.14
9

Other types of emission from the source include molecular (or band), and
continuous spectra. Band spectra are produced by molecular emission from, for
example diatomic molecules, e.g. N2, CN. Band spectra appear as unresolved
broad lines with a low resolution spectrometer, and as a series of fine lines with
a high resolution spectrometer. Continuous spectra are not atom or molecule
specific and are produced by free electrons in the emission source. These emit
continuous, i.e. not wavelength specific, radiation due to Bremsstrahlung and
recombination processes. Black body radiation also contributes to the
continuum and the intensity increases with temperature.
From the discussions above, the intensity and complexity of emission spectra
increase with temperature. Spectra from a laser-induced plasma which has a
relatively high temperature (-15 - 30,000 K) will therefore be much more
complex and intense than spectra from a lower temperature source, such as a
chemical flame (-2000 K) or an inductively coupled plasma source (-6000 K).
Spectra will contain intense emissions from atom, and single and multiply
charged ionic species, together with intense molecular and continuum signals.
The spectra may be additionally complex because the laser-induced plasma is
transient, and plasma characteristics, such as temperature and size, change
rapidly during the plasma lifetime.
1.3 Theory of laser - material interaction processes
The laser-induced plasma results from a complex series of processes, with
many occurring simultaneously. Much has been written about the processes
and the many factors that affect them.7-15-18 A simplified view is presented here
and a schematic shown in Figure 3.
10

When a high power, Q-Switched laser pulse is focused onto the surface of a
solid material, the surface in the vicinity of the laser spot is heated very rapidly
and several processes occur within a very short period of time, on the ns time
scale. The irradiance (power per unit area) is typically 109 to 1012 W cm-2.
Initially, some of the laser light may be reflected depending on the reflectivity
and nature of the surface, but this decreases rapidly as the temperature rises.
The laser energy is thermally absorbed by the material which causes material
to be vaporised. In the case of a conducting material, the conduction band
electrons absorb laser photons and the energy is converted to heat through
collisions. Heat may be lost from the surface by thermal conduction. Part of the
absorbed energy is used to overcome the latent heats of fusion and
evaporation to produce phase changes. Vaporisation and heating continues to
produce a partially ionised gas above the surface of the material. Other
processes also produce electrons and ions. These include multi-photon
absorption, where an atom absorbs several photons to gain sufficient energy to
cause ionisation, and thermionic emission (desorption) of ions and thermal
electrons.
When the electron density of the gas above the sample surface is sufficiently
high, heating by inverse Bremsstrahlung processes takes place. Here,
electrons gain energy by absorbing photons, and transfer energy to the plasma
through collisions with other species in the plasma. The temperature and
electron density continues to rise and the plasma expands. An avalanche effect
takes place causing rapid heating because the heating rate increases with
electron density; as the number of electrons increases, the amount of heating
through inverse Bremsstrahlung increases which causes more ionisation and
further heating. A rapid expansion of the plasma due to energetic particles
occurs with a supersonic velocity (2 x 10 7 cm s_1), typically at the peak of the
laser pulse. The plume develops towards the laser beam. Heating of the
11

sample continues by the laser and plasma, and material leaves the surface as
vapour, droplets, or superheated streams of material. The temperature of the
plasma is of the order 104 to 105 K. As the plasma is very hot and dense, the
plasma contains a very high density of energy. This means that the plasma
continues to be luminous and expand for a long time after the end of the laser
pulse. Depending on many factors, such as the incident laser energy and the
density of the ambient gas, the post-pulse lifetime of the plasma may be from
300 ns to 40 ps,16to 100 ps.19 The plasma cools during this time due to
expansion and material entering the plasma.
Studies have been made photographically, with streak cameras, and
spectroscopically to support this sequence of events.15-16-20-21 Spectroscopic
monitoring16 of the ablation of steel in air at 0.05 Torr shows that emission from
the plasma initially consists of an intense background continuum due to
Bremsstrahlung processes and black body radiation. This continues to increase
until about 150 ns after the start of the laser pulse. After this, the plasma
intensity decreases and emission lines from elements in the sample become
apparent. The emission lines can be measured by a suitable spectrometer to
gain qualitative and quantitative analytical information about the sample. The
emission lines decrease in intensity as the plasma decays to zero over a period
of time (100 ns to 100 ps, depending on operating parameters). Improvement in
analytical performance can be achieved when analyte emission signals are
resolved in time from the intense background continuum.
12

reflection
time
heating and vaporisation
ion and electron production - multiphoton absorption
- thermionic emission
partially ioinised gas plasma formed
heating of plasma- inverse Bremsstrahlung r .. , .further sample heating
by laser and plasmato melting and boiling
pointscauses phase changes
rapid expansion of plasma shock wave
atomic / ionic emission < spectrochemicalmeasurement
plasma lifetime,300 ns to ~100 ps
after end of laser pulse
c1fg1.cdr
Figure 3 Schematic showing the processes involved in laser-induced plasma
spectrometry

1.4 Instrumentation for laser-induced emission spectrometry
The laser was first used as a source for atomic emission spectrometry in 1962
by Brech and Cross5 who used a laser microprobe. A pulsed ruby laser was
focused onto the surface of a sample using a microscope objective lens
through which the operator could view the sample for alignment and
observation. The laser/laser-induced plasma removed material from the
sample, and the laser-induced plasma was supplemented by a conventional
electrical spark from a pair of electrodes positioned directly above the sample.
This extra excitation is termed cross excitation. Light from the discharge was
focused onto the entrance slit of a spectrograph and the dispersed spectrum
recorded photographically.
Laser microprobes with cross excitation were for many years the main
instruments used in laser-induced emission spectrometry, and commercial
instruments were produced in the USA (e.g. Jarrell Ash Mark III), Japan (e.g.
JEOL JLM 200), and in the former-East Germany (e.g. Carl Zeis VEB LMA 10).
The instruments, developments and applications are described by several
authors, notably Moenke-Blankenburg et al7 , Cremers et al8 , and Piepmeier et
al.17 A schematic is shown in Figure 4.
Cross excitation improved certain aspects of analytical performance, such as
sensitivity, and minimised the effect of the strong background continuum from
the laser-induced plasma. The disadvantages of cross-excitation were
recognised by many authors,7-8 and Van Deijck22 concluded that the technique
was not sufficiently reproducible to become fully quantitative. Subsequent
studies have concentrated on using the laser-induced plasma as the sole
energy source in order to simplify the instrumentation and remove the
disadvantages of cross-excitation. Advantages include simpler methodology,
because no auxiliary equipment is needed as the laser vaporises and excites
14

the sample. Also it is possible to make non-invasive measurements as the laser
plasma can be produced remotely. Many studies have investigated and used
procedures such as internal standardisation, spatial and time resolution to
improve analytical performance. Time resolved measurement and modern
optical multichannel analysers (OMAs) have compensated for the lack of cross
excitation and have brought improved performance. The instrumentation used
has generally been modified laser microprobe analysers, or laboratory
assembled equipment.
prism Alaser beam < ---------
c1fglmpr.cdr
microscope
cross excitation electrodes
vapour
sample
Figure 4 Schematic of a commercial laser microprobe showing the electrodes
for cross excitation.23
15

1.4.1 Laser types
The types of laser used in laser-induced plasma emission spectrometry are
listed in Table 2 together with output wavelengths. The main difference is the
type of active medium used to produce the laser light, and the phase of the
medium, either solid or gas.
Laser Phase of
active medium
Wavelength (nm)
Ruby solid 694
Nd:Glass solid 1064
Nd:YAG solid 1064
Nd:YAG
(Frequency Doubled) solid 532
Nd:YAG
(Frequency Quadrupled) solid 266
n2 gas 337.1
C02 gas 10600
Excimer XeCI gas 308
ArF gas 193, 248
Table 2 Types of laser used in laser-induced plasma emission spectrometry
The ruby laser found widespread use in the laser microprobe analysers and in
early laser induced breakdown spectrometry work, but has generally been
superseded by the Nd:YAG laser, (neodymium yttrium aluminium garnet). This
laser has been used in most studies since 1980. The advantages of the
Nd:YAG are that it is robust and fairly compact, can operate at higher repetition
rates than the ruby (15 Hz Vs 4 Hz), and has better repeatability of shot to shot
output. The infrared laser output (1064 nm) of the Nd:YAG is absorbed by most
16

materials making it suitable to ablate a wide range of materials. It is generally
used in the Q-Switched mode, in which all the energy of the laser pulse is
released within a very short time period, typically a peak width of 10 ns. This is
achieved by using either an electro-optically operated Q-Switched laser, or an
acousto-optically Q-switched laser.24 The electro-optically switched is generally
used because of the relatively high energy output, 0.5 J pulse-1 at 10 Hz. The
acousto-optically Q-switched can generate 0.012 J pulse-1 up to a repetition
rate of 5000 Hz.
A disadvantage of the Nd:YAG is that high energies are required to cause
ionisation and plasma formation. Also the smallest spot size that can be
achieved by focusing this wavelength is about 100 pm in diameter (the
calculations are given in Chapter 2, section 2.2). To obtain higher degrees of
ionisation and a smaller spot size, it is necessary to use a shorter laser
wavelength. This can be achieved by using a laser with an ultra violet (UV)
wavelength, such as a a frequency doubled or quadrupled Nd:YAG laser
(Niemax et al25), a N2 laser (Kagawa et al26-27), or an excimer laser (Chau et
al28, Hoffman 29 Lorentzen et al,30 Petit et al,31 Sneddon et al 32,33,34 ancj
Weimer et al35). The UV wavelengths of these lasers are sufficiently short to
cause the photoelectric effect by single or double -photon processes and so the
plasma can be generated easily with relatively low threshold energy,
(Kagawa26). Further advantages of the N2 laser include high repetition rates,
which may improve precision, and short pulse duration (~ 5 ns), which may
minimise selective vaporisation effects.
In the following sections, the laser type and wavelength are not generally
recorded if a Nd:YAG laser with an output wavelength of 1064 nm has been
used. The laser and wavelength are specified if they are different from these.
17

1.4.2 Detection systems
Different detection systems have been used in laser-induced plasma emission
spectrometry and are summarised in Table 3.
Detector Year of introduction to
LIPS
photographic plate 1962
photomultiplier tube 1969
silicon intensified target vidicon 1981
intensified photodiode array 1981
charge coupled device 1990
Table 3 Detectors used in laser-induced plasma emission spectrometry
The photographic plate was generally used in laser-induced emission
spectrometry as a detection device for over 25 years because of its unique
advantages, (Cremers and Radziemski,8 1986). These are, (a) the plate can
store permanently the position and intensity of spectral lines, (b) it has a good
sensitivity for many elements, (c) it is fairly cheap and easy to operate. This
versatility enables not only simultaneous recording of much of the periodic table
but also recording of all available lines for each available element. This
technique, however, has several disadvantages: the chemical process and the
reading of the plate are both time consuming, the latter necessitating the skill of
an experienced chemist; it is only semi-quantitative because of inherent errors
in the technique, variation in the plate emulsion, chemical processing of the
plate and difficulties in reading the plate. The lack of direct access to the
analytical data led to the introduction of photoelectric detection systems in 1969
by Beatrice and Glick.36 Here a polychromator with two photomultiplier tubes
18

was attached to a Czerny-Turner spectrograph to facilitate the simultaneous
measurement of an analytical line and the adjacent background, enabling
simultaneous background correction. A system described by Marich et al37
(1974) contained a six tube vacuum polychromator, in which six elements could
be determined simultaneously. In a study with a three channel spectrograph,
Moenke-Blankenburg38 found that it was possible to reduce the limits of
detection by an order of magnitude, the precision of the determination of
concentration was about 5% (RSD), a factor of two better than the photographic
method, and the speed of analysis was very much faster. However the normal
disadvantage of a direct reading spectrometer remained, namely only pre
selected elements could be determined and so photographic plates continued
in general use for simultaneous analysis. Other elements could only be
measured sequentially by adjustment of the channels to other wavelengths, or
by using a scan facility.
In order to combine the speed of the direct reader with the versatility of the
photographic plate, instrumentation has been developed which use an
optoelectronic image device as a multi-channel detector. Initially a silicon-
intensified target vidicon (SIT) was used,7 but this was superseded by a
photodiode array device when these became available. Talmi et al39 (1981)
compared both systems and found detection limits for both to be in the range
2-500 ppm.
The silicon-intensified target vidicon tube comprises an image intensifier and a
target crystal containing 500 silicon photodiodes, 10 mm high x 25 pm. Each
photodiode is storage device. Incident photons neutralise part of this charge,
the extent being proportional to the number of photons. Each photodiode is
recharged by an electron beam and so the size of the recharging current is
proportional to the light intensity between two scans. This signal is passed to a
19

computer for processing to yield a wavelength spectrum of, for example, 30 nm.
In terms of performance, the silicon-intensified target vidicon has similar
sensitivity to a photomultiplier tube, but suffers from inferior signal/noise ratio.8
A typical photodiode array contains a linear array of 1024 detector elements
(diodes, pixels),. 2.5 mm high x 25 pm, covering a length of 25.4 mm, i.e. 40
diodes per mm. Each diode, or pixel, stores charge which is again partly
neutralised by incident photons. The array is scanned by individual switches
attached to each pixel opening in turn and recharging the pixel. These switches
are field effect transistors and are part of the integrated circuit containing the
array. It is scanned typically every 30 ms, so the integration time is 30 ms, and
the data processed by computer to yield wavelength spectra. Depending on the
grating utilised in the spectrometer, medium and high dispersions can provide
spectral regions of 70 and 17 nm respectively (Talmi39). By choosing a suitable
region, multi-element analysis can be achieved, and by scanning the grating to
other wavelengths, a wide range of elements can be detected. A development
has been the addition of an image intensifier located in front of the photodiode
array (Radziemski,40 Figure 5). A microchannel plate image intensifier amplifies
the incident light with a gain in the order of 25,000 giving improved sensitivity
and allowing shorter integration times to be used.
20

display
<—lenses
intensifiedphotodiode
arraylaser-induced
plasma c1fcr1.cdr
timecontrolpulsed
laser
spectrograph
entrance slit
Figure 5 Typical apparatus for laser-induced plasma analysis of a material.The detector is an intensified photodiode array (time-gated). The image of the laser-plasma is focused onto the entrance slit of the spectrometer with a simple lens, (from reference40)
More recently other measuring devices, such as the charge coupled device
(CCD) and the charge injection device (CID) detectors have been developed 41
and utilised in commercial inductively coupled plasma emission spectrometers.
The charge coupled device detector is available as a linear array or as a two
dimensional array of measuring elements, typically 512 x 512, and benefits
from improved sensitivity and readout noise. The two dimensional array facility
was used in an optical imaging spectrometer by lida42 (1990) to spectrally map
laser-induced plasmas, (discussed in section 1.5.4).
21

A time resolved measurement capability is advantageous when monitoring the
laser-induced plasma in order to separate analyte emission signals from the
intense background continuum and improve analytical performance. Various
methods were used to achieve this with photographic detection, such as streak
photography of the spectrally resolved emission line (Cremers et al8), or a
system of rotating mirrors synchronised with the laser Q-Switch to sweep the
plasma image across a spectrograph entrance slit (Piepmeier et al,43 1 969).
With photomultiplier tube detection, electronic systems were devised to gate
and integrate the signal (Marich et al 44 1971; Allemand 45 1972; Schroeder46
1971). However, this photomultiplier tube technique had the disadvantage of
measuring only one element at a time, with no possibility to make simultaneous
background measurement unless a second photomultiplier tube channel was
fitted. Image-intensified photodiode arrays can be used (Radziemski,40 1981)
by switching the intensifier on and off to control the exact time period that is
observed. This is termed 'gating'. The device has the ability to make
simultaneous, multi-element and background measurements, and is thus a
most powerful and convenient method to capture time resolved spectra. Studies
of laser-induced plasma emission spectrometry since 1981 have either used
intensified photodiode arrays, or, to a lesser extent, time-gated photomultiplier
tubes.
A recent development (1993) in charge coupled detection (CCD) device
technology is a 'masked' CCD, (EG&G OMA 4 )47 which enables time resolved
measurement with a CCD. Here, only a single row of the 512 rows available is
exposed to radiation, the remaining 511 are masked. After exposure, the
charges on the exposed row are shifted down to the next row, which is behind
the mask, and exposure of the first row is repeated. After each exposure, the
charges are shifted down the array and are stored until readout at the end of
the experiment. Time resolution is limited compared to an intensified
22

photodiode array, however, the minimum delay and integration times are 3 ps
for the 'masked' CCD compared to 20- 100 ns for the intensified photodiode
array.
The general method of transferring radiation from the laser-induced plasma to
the spectrometer system has been to use a straight optical path with a simple
lens to focus the image of the plasma onto the entrance slit (Figure 5). Some
studies have used an optical mask to shield part of the plasma in order to make
spatial measurements. More recently, an optical fibre has been used to capture
and transfer the emitted light to the spectrometer (Figure 6), by researchers
such as Campos et al48 (1992), Cremers et al49 (1987), Grant et al50 (1991),
Kuzuya et al51 (1992), and Lorenzen et al52 (1992). This has the advantage that
spectrometer and plasma do not have to be precisely aligned, and remote
sensing is more easily achieved. These studies have generally achieved
analytical performance that is comparable to that obtained with a straight optical
path, despite the losses in light intensity due to fibre optic light transmission.
Some studies48-51-52 have used a lens arrangement to focus emitted radiation
onto the entrance of the fibre optic in order to increase the light intensities.
23

sample rotator
sample
plasma
\ acceptance monochromator
fibre opticlens f = 200 mm
c1fgfibr.cdr
mirror
Figure 6 Schematic showing part of the apparatus used by Grant et al50 to measure laser-induced emission spectra of iron ore. The diagram shows the arrangement used to collect radiation from the plasma with a fibre optic. The end of the fibre optic was positioned 15 mm from the plasma and the acceptance angle was 35°.
24

1.5 Review of analytical applications
The technique of laser-induced plasma emission spectrometry has been used
to determine over 60 elements in a very wide range of samples in the solid,
liquid and gas phases. The following sections discuss applications of the
technique to the three phases.
1.5.1 Solid phase
A comprehensive review of applications with cross excitation is provided by
Moenke-Blankenburg7 (1989), and with direct spectral analysis, i.e. no cross
excitation, by Cremers8 (1986) up to 1986. Solid samples include minerals,
meteorites, metals, alloys, semiconductors, glasses, ceramics, paintings,
medical and biological specimens. Absolute detection limits are at the ng level,
and relative detection limits about 10'3 mass percent, an order of magnitude
worse than direct current arc optical emission spectrometry. This section
reviews applications that use direct analysis of the laser-induced plasma.
Runge et al53-54 (1964) demonstrated the quantitative analysis of Ni and Cr in
solid and molten iron using a Q-Switched ruby laser. Similar results were
obtained for both samples, with linear calibration graphs using chromium/iron
and nickel/iron ratios. Scott and Strasheim20 (1970) compared three modes of
laser output for spectrochemical analysis. The two forms of Q-Switched firing
generated the highest temperatures, and produced line shifts towards the red in
the emission spectrum. They concluded that the analytical capability could be
increased by monitoring a selected region of the plasma, and that time
resolution was only useful with the Q-Switched laser pulse. Felske et al55
(1972) analysed steel samples using a device that moved the sample between
laser shots so that fresh material was ablated each time. Improved precision
25

was obtained (relative standard deviation, RSD, 1%), but the sensitivity was an
order of magnitude poorer than with cross excitation.
Baldwin56 (1970) studied the Q-Switched laser sampling of copper-zinc alloys
and found that material was removed as vapour and liquid metal. Results
suggested there were different volatilisation rates for copper and zinc, which
explained the error that occurred when copper was used as an internal
standard in this matrix. Allemand45 (1972) found that the size of crater
produced by Q-switched laser ablation depended strongly on the type of
material ablated, and better reproducibility was obtained from metals that had
been polished. The usefulness of time and spatial resolution was
demonstrated.
Rare earth elements were detected in a sodium chloride matrix by Ishizuka57
(1973) at concentrations down to approximately 5 ppm with calibrations linear
over an order of magnitude. A Q-switched ruby laser with single pulse was
used. Furuta et al58 (1993) studied the ablation of sodium chloride and
observed that atomic emission lines were broadened in air and some were self
reversed, but self-reversal did not occur if the sample was ablated in a
vacuum. The line broadening was due to resonance and Stark effect.
In a series of papers, Marich, Treytl et al37- 59,60,61,62,63 (1970-1975) described a
range of applications and studies. The effects of matrix (bovine albumin and
human serum) upon silver and magnesium emissions were investigated.59 It
was observed that the presence of increasing concentrations of matrix
decreased the amount of sample vaporised, and that these effects were mainly
physical rather than chemical. Attempts were made to intensify the laser
absorption by adding methyl blue, but no increase in silver emission was found
and at higher concentrations the silver emission decreased. Time resolved
26

measurements were made of magnesium in aluminium foil and calcium in
photographic film.60 Using a gate width of 5 ps, the delay time for maximum
signal to background ratio (S/B) was found to increase with laser energy and
was different for each sample. In a study into the effects of atmosphere,63 it
was observed that S/B ratios did not vary systematically with laser energy and
atmosphere, but larger values were obtained in vacuum with the lower energy
used (1.2 mJ). It was concluded that, in certain samples, the selection of an
appropriate atmosphere may improve S/B, but in general, there was no need to
change the atmosphere from air. Optimal time parameters and detection limits
were determined for a series of elements in an organic matrix (Li, Mg, Ca, Fe,
Cu, Zn, Hg, Pb).50 The time delay varied from 4 to 16 ps, and the integration
time from 2 to 15 ps, and detection limits were obtained of the order 10-13 to
10-15 g. An improved instrumental system was described37 and used to analyse
human tissue. Further work61 investigated the time differentiated analysis of
selected regions of the laser-induced plasma. Twofold increases in response
relative to on-axis viewing were obtained for gelatin and liver samples by using
spatial differentiation. The optimal lateral displacement from the centre of the
plasma varied with element, 0.5-0.75 mm. The optimal vertical distance was
about 1 mm above the focal plane. Marich concluded that to optimise analytical
sensitivity, advantage could be made of the heterogeneous nature of the laser
induced plasma.
Using an intensified photodiode array, Cremers et al64 (1986) evaluated a
range of factors affecting the analysis of steels. These included, the lens to
sample distance, the laser energy, and the imaging lens position. The
maximum S/B ratios for each element were with the sample positioned at, or
close to, the laser focal point. It was observed that as the laser pulse energy
was increased, the intensities of ion emission lines increased relative to atomic
lines, and it was concluded that the choice of iron line for use as internal
27

standard should be made carefully. In a further study65 (1985) laser-induced
plasma emission spectrometry was compared with laser ablation - inductively
coupled plasma - emission spectrometry for the rapid analysis of solid and
molten steels. The ICP method appeared to have superior analytical
performance, and the authors thought that this might be easier to incorporate
into a steel plant environment.
Using a fibre optic for collection and transmission of emitted light, Cremers66
(1987) analysed solder and steel alloys with RSDs in the range 4-28 %. The
fibre optic was positioned between 0.5 m and 2.4 m from the sample and a 500
mm focal length lens was used to focus the laser light. Radziemski et al67-68
(1986) analysed beryllium-copper alloys and considered the technique useful
for the rapid sorting of these alloys.
The spectral emission of atoms and ions from the laser ablation of super
conducting materials for the deposition of thin films was studied by various
authors. Yoo et al69 (1989), Geyer et al70 (1989), Weimer et al35 (1990), and
Hoffman29 (1990) studied species emitted from YBa2Cu30 7_x, while Deshmukh
et al59 (1988) investigated Bi2CaSrCu209 . The emission data was used to
monitor in-situ the deposition of these materials and provide information about
possible chemical reactions taking place in the plasma.
The spectroscopy of the plasma was used by Chita et al72 (1990) to monitor the
performance of the laser welding of aluminium sheet, and showed that
improved performance was obtained with nitrogen as the shield gas compared
to Ar and He. Pramanick et al monitored73 (1991) emission spectra during the
growth of thin films (Ti, TiN and TiSi2) with pulsed laser evaporation. Emission
spectra were dominated by atomic and ionic titanium emissions (Ti I, Ti II), but
signals for atomic and ionic silicon and ionic nitrogen were also observed.
28

Grant et al74 (1991) quantitatively measured various elements (Ca, Si, Mg, Al
and Ti) in iron ore, and obtained precision in the range 2-25 % (RSD) with
detection limits of the order of 0.01 % m/m. A schematic of the instrumental set
up is depicted in Figure 3. Campos et al48 (1992) determined the carbon
content of steel with a precision of 1.6 % and detection limit of
65 pg/g using a. nitrogen buffer gas. Carbon was measured at 193.09 nm with a
1 metre monochromator. In a conference abstract, Petit et al31 (1992) reported
the use of a XeCI excimer laser to measure magnesium in aluminium alloy
samples. Precision was 2 % (RSD) when the aluminium of the matrix was used
as internal standard.
Sneddon et al32-33-34-75,76 (1991-92) have made a series of studies using an ArF
excimer laser (193 nm). Using metallic targets (Zn, Cu, Ni, and Fe metals), they
found that the radiation emission intensity from the plasma increased with laser
energy, and that this relationship could be quantified.75 Spatial measurements
of the plasma produced by an ArF excimer laser were made with copper and
lead targets.76 They found that the plasma differed in size with the target used,
and different observation positions were needed for both. It was attributed to
the differences in thermal conductivity and boiling points of the two materials.
Studies of the effect of atmosphere32 with the ablation of copper showed that
the size of the plasma was affected by the type of gas and pressure used for
ablation. They concluded that maximum S/B ratio for copper was obtained with
argon at reduced pressure and with helium at atmospheric pressure. Space and
time resolved studies34 showed the plasma to have a Gaussian distribution of
atoms and ions. The lifetime of the plasma was estimated to be 100 ps. Using
spatial resolution of the plasma, Sneddon et al33 reported the quantitative
measurement of chromium in steel with an estimated limit of detection of
0.002 % m/m.
29

Niemax et al77 (1992) calculated the spatial electron density in an argon plasma
from time-resolved measurement studies. The density was derived from the
shift of spectral lines and from Stark broadening. They concluded that the argon
plasma had a larger volume than the vapour cloud from the ablated material.
Esmiller et al78 (1992) determined the temperature and electronic density of a
plasma induced on aluminium, graphite and silicon carbide targets. Majidi and
Xu79 (1993) studied the use of the laser-induced plasma as a continuum
source. They concluded that the continuum emissions generated in the first
150 ns of the plasma lifetime should be used for optimum results.
A series of applications have focused on environmental analysis. Cremers and
Radziemski80 (1985) determined beryllium dust collected on an air filter as part
of a health and safety programme. The filter was rotated so that the laser-
induced plasma (dimensions 0.1 mm x 4-8 mm) could sample a large area.
Enhanced beryllium signal was obtained with increased rate of rotation, up to a
maximum of 4.8 rpm, above which the signal levelled off. The limit of detection
varied with the particle size, typically 0.45 ng cnrr'J for 0.5 to 5 pm diameter,
with RSD for replicate analysis of 4%. Hardjoutomo et al81 (1992) reported the
use of a compact TEA C02 laser for field-based analysis of geological samples,
(TEA, transverse excitation atmospheric).82 Using helium gas at atmospheric
pressure, semi-quantitative analysis was undertaken using glass reference
materials as calibration standards. Minimum detectable concentrations were
estimated to be 60 and 500 pg/g for zinc and fluorine respectively. Wisburn et
al83-84 (1992,1993) evaluated the detection of heavy metals in environmental
samples such as soils. They compared the use of two lasers, (Nd:YAG, 1064
nm) and an excimer (XeCI, 308 nm) and found that the use of the UV
wavelength was more efficient resulting in lower detection limits for lead in
sand, 2 pg/g (308 nm) and 15 pg/g (1064 nm), respectively. They concluded
that detection limits were acceptable, and with the minimal sample preparation
30

required, the technique could be used as a fast screening sensor for
environmental analysis. Cremers et al85 (1992) reported the development of a
'Portable Laser Spark Surface Mass Analyser'. The instrument measures light
emitted from the laser-induced plasma to detect elements, and has been
applied to environmental analyses in the field, such as lead in paint, chromium
in soil, lead and arsenic in industrial plant exhaust.
Laser-induced plasma emission spectrometry has been used for on-line
process monitoring applications. Several workers have developed applications
for the analysis of molten steel in order to monitor steel production. These
include, Runge et al54 (1966), Cremers et al65 (1985), Jowitt86 (1985),
Lorentzen et al52 (1992), and Kim87 (1992). The technique appears to be well
suited to this application even in this harsh environment. Jowitt86 obtained
linear calibrations for chromium and manganese in liquid steel. Kim87 discussed
the feasibility of making quantitative measurement with a single laser shot. The
monitoring of elements (S, Si, Zn) in rubber slab production for tyre
manufacture was reported by Lorenzen and Carlhoff52 (1992). A schematic
diagram is shown in Figure 7 of the arrangement used to deliver laser light to
the sample and transmit emitted radiation to the measuring spectrometer.
In the nuclear industry, the technique has been applied to the on-line
monitoring of uranium concentration in liquid88-89 (1987, 1992) (described
below, 1.4.2) Adrain et al90 (1978) studied silicon emission responses from the
ablation of mild steel in order to measure in situ the concentration of silicon in
the steel of nuclear reactor vessels. More recently, fundamental studies have
investigated the remote laser-sampling and analysis of radioactive materials
(Shuttleworth 1994).91 In the energy industry, studies have applied the
technique to the on-line monitoring of elements in coal-gas flows,92-93-94
(1989, 1991, 1993), (described below, 1.4.3).
31

s c a n n in g t a b le o p t ic a l f ib r ebundle
mirror
scannerlaserbeam
plasmalight
rubber slabc1fglmx.cdr
laser-inducedplasma
UV laser
spectrometer
Figure 7 Schematic representation of the system developed by Lorenzen et al95 of Krupp, Germany, to monitor the elemental composition of rubber for tyre manufacture. The authors refer to the technique as 'remote laser microanalysis' (RELMA).
The application of laser-induced plasma emission spectrometry (LIPS) to
the depth profiling of materials and coatings has been limited. Talmi et al39
(1981) used a laser microprobe (ruby laser and vidicon detector) to obtain
a quasi-depth profile of an electrical capacitor by sampling to different depths
of the material. This was achieved by changing the size of the laser spot
through variation of operating parameters. In discussing surface contamination,
Cremers49 (1987) reported the ablation of aluminium metal coated with a paint
film by using the first few laser shots to remove the paint layer. In the same
paper, Cremers reported the removal of surface grease from a metallic
surface prior to analysis, and the analysis of galvanised steel having removed
the zinc coating with the first laser shots. Lorenzen et al52 (1992)
32
showed a variation in the thickness of a titanium nitride coating across the
surface of a metallic sample. Kim87 (1992) reported the variation of calcium
concentration with depth for a sample of steel.
1.5.2 Liquid phase
Only a few applications of laser-induced plasma emission spectrometry have
been made with liquid samples. Cremers et al97 (1984) fired the laser through a
window in the side of a teflon cell to generate a submerged spark in the liquid.
The laser was focused by a pair of 5 cm focal length lenses and the light
produced was transferred through a second window to a monochromator with
photomultiplier tube detection. Limits of detection were of the order 1 mg I"1 in
water with RSD values of 4-8% for various elements (Li, Na, K, Rb, Cs. Be, Mg,
Ca, B and Al). In the case of lithium, calibration was linear over four orders of
magnitude. The effect of sample flow was found to have no effect upon
analytical performance. Species were also detected in organic solvents
(methanol, ethanol, acetone).
Two studies have examined the determination of uranium in nitric acid solution
for use in the nuclear reprocessing industry. Cremers et al88 (1987) compared
the focus of the laser at the surface and into the bulk of the liquid. The surface
measurement was found to be more sensitive because it produced a higher
plasma temperature, necessary for uranium excitation (U II 409.0 nm). The
detection limit was 0.1 g M. Mauchien et al89 (1993) used a nitrogen laser (337
nm) to measure uranium in nitric acid solution in an on-line application of laser-
induced spectrofluorometry. The more sensitive technique used by Mauchien et
al enabled lower detection limits to be achieved, between 5 pg M and 1 mg M.
The analysis of dry aerosols produced by a nebuliser and desolvator was
studied by Radziemski et al98 (1988) for the determination of cadmium, lead
33

and zinc. The aerosol was presented to the focal point of the laser and
detection limits estimated to be of the 0.2 ng g-1. Crouch et a l" (1988) used an
isolated droplet generator as a sample introduction system. The generator
produced droplets at a rate of 1,000 to 50,000 s_1 with volumes in the nl range.
A flow injection manifold (sample volume 70 ml to 1.5 ml) was used to introduce
sample solution and laser light from a Nd:YAG laser (1064 nm) was focused
into the stream of droplets. Calibration curves linear over three orders of
magnitude were obtained with detection limits in the low mg/l (Na, Li, In, Al, Ga,
Mg, K and Sr). Winefordner et al100 (1992) used a concentric glass nebuliser to
produce an aerosol that was ablated by an Ar-F excimer laser (193 nm). They
obtained detection limits similar to those obtained by Crouch and co-workers.
In a geochemical application of laser-induced plasma emission spectrometry ,
Mermet et al101 (1991) investigated the analysis of calcium, magnesium,
sodium and potassium in individual fluid inclusions. The analysis of the fluid
inside an inclusion can provide information about the history of the parent rock,
such as the minerals that the rock was formed from originally. Good analytical
data were obtained for synthetic fluid inclusions suggesting that the method
should be further explored.
1.5.3 Gas phase
Radziemski and Loree102 (1981) studied the real-time analysis of gas samples.
With the addition of time-resolved detection103 (1981), the authors reported
significant improvements in analytical performance. The limit of detection was
improved from 690 to 15 ppm (m/m) and from 120 to 60 ppm (m/m) for
phosphorus and chlorine respectively. Radziemski et al104-105 (1983, 1983)
detected beryllium in air, and chlorine and fluorine in air106 (1983). Detection
limits were 0.5 ng g_1 (m/m), 8 and 38 ppm (m/m), respectively. Eden et al107
34

(1991) measured the trace concentrations of polyatomic species (B2H6, PH3
and AsH3) in helium with detection limits of about 1 ppm.
Radziemski et al92-93 (1989, 1991) monitored in-situ the composition of coal
particles in a flowing gas stream. The semi-quantitative analysis enabled four
coals to be analysed for silicon, aluminium, iron, titanium, calcium and
magnesium. Radziemski et al108 (1985) measured the variation of temperature
and electron density with time for a plasma induced in air with a C02 laser. The
results implied that there was thermodynamic equilibrium between the oxygen
species monitored. Singh et al94 (1993) successfully used a Nd:YAG laser at
532 nm to measure relative concentrations of calcium, aluminium, barium,
manganese, magnesium, iron strontium and titanium in the combustion
environment of a coal-fired power station.
1.5.4 Studies to improve analytical performance
Several researchers have made studies into the parameters affecting
performance, such as laser energy, distance of sample from laser focal point,
presentation of sample (same spot or fresh area for ablation), number of
cumulative laser shots, type of gas atmosphere and pressure at point of
ablation, sample matrix, etc. Additionally, work has been directed into
techniques which might improve aspects of performance, such as precision, a
major limitation in semi- and full quantitative laser ablation. Much of this centres
on using some form of internal standard to reduce errors and increase
repeatability, e.g., ratio the line intensities of analyte and matrix elements,
measure the crater volume produced by each ablation and normalise this with
the emission data to standards, measure and use the primary plasma intensity
as with the crater volume method. Studies have generally used time-resolved
measurement to improve analytical performance. Other investigations include
35

spatial resolution where only a specific part of the plasma is spectrally
analysed, the remainder being masked.
Buffer gas type and pressure
Buffer gas type and pressure have been investigated by several groups:
Niemax et al,109-110 lida et al,111-42 Kuzuya et al,112 Piepmeier et al,113
Marich et al,37 Sneddon et al 32>34 Gases studied include air, argon, neon and
helium at different pressures for a range of sample types. General conclusions
were that reduced pressures of argon gave improved analytical performance,
and helium may be better than air at atmospheric pressure. The studies are
reviewed below.
Niemax109 (1989) measured silicon, chromium and iron emission as a function
of argon gas pressure and time delay (time between start of laser pulse and
start of measurement). A 30-fold increase in line intensity for silicon (288.2 nm)
was obtained when the pressure was reduced from 1000 mbar to 140 mbar.
When the gas pressure was reduced further, the signal intensity decreased.
The main reason for this maximum appeared to be that this pressure is an
optimum in the atomisation process, despite the fact that the size and
temperature of the plasma change with argon pressure. The argon pressure
determined the mean free path of the particles, which penetrate the hot argon
plasma, and thus the atomisation, excitation and ionisation processes. The
background intensity was also measured and was found to have a similar
temporal behaviour but decreased faster, thus the S/B ratio increased with time.
The maximum S/B ratios at pressures of 5, 140 mbar were at time delay 4-6, 8-
12 ps respectively. In another study, Niemax et al110 (1992) found that argon
was the best buffer gas at reduced pressure (300 mbar), and suggested that for
atmospheric pressure, neon should be used.
36

Piepmeier and Olsten113 (1971) observed that the emission spectra, crater size,
and amount of material vaporised were affected by the gas pressure. At
760 Torr, the crater diameter and amount of material vaporised remained fairly
constant when the laser energy was increased, but with reduced pressure,
(1 Torr), both parameters increased with laser energy. The results appeared to
be caused by absorption of a large fraction of the laser energy by the
atmospheric plasma at higher pressure, reducing the amount of laser energy
available at the sample surface to ablate material. In an earlier study,
Piepmeier115 (1969) made time and spatially resolved measurements of
aluminium in air. These suggested the rapid formation of an atmospheric
plasma initially containing little sample material. The resulting intense
background spectra lasted only a few tenths of a ps and could be time-resolved
from the analyte emission lines that last for many ps. It was also noted that a
large fraction of the laser energy was absorbed by the plume, and that the hot
plume continued to cause sample vaporisation after the laser pulse had
finished.
lida111 (1989) studied the emission characteristics of the laser induced plasma
in argon at reduced pressures using time- and spatially- resolved emission
profiles. In comparison to atmospheric pressure ablation, the emission period
was lengthened to over 100 ps and the plasma extended to a few tens of
millimetres above the sample surface at reduced pressure. The emission
intensities of atomic lines were observed to increase several fold in argon
relative to air at the same pressure. It was suggested that the chemical
inertness and thermal characteristics of the argon plasma, and the decrease in
absorption of the laser pulse by the plasma plume, accounted for these results.
In another paper, lida42 (1991), made simultaneous, spatial mapping
measurements of the laser induced plasma with a novel optical imaging
spectrometer. This instrument focused the spectrally-resolved image of the
37

plasma onto a charge coupled device detector to produce an emission intensity
contour map. Measurements were made for the ablation of aluminium metal,
(Al (I) 396 nm, background 400 nm), in different gases (air, Ar and He) at a
range of pressures (10, 100, 760 Torr). Contour maps were prepared of the
aluminium 396 nm signal with the background subtracted, and of the
background. It was observed that the most intense aluminium emission in argon
and air was at the reduced pressure of 100 Torr. At this pressure the
background emission was very small relative to that detected at 760 Torr. The
helium atmosphere produced strong aluminium emission with little background
at 760 Torr, and both signals decreased with a reduction of pressure. The
explanation proposed was that the plasmas developed in argon or air were
more absorptive of the laser light than those in He. This is because argon,
nitrogen and oxygen are more easily ionised than helium and this produces
more electrons at the beginning of plasma formation. This results in more
energy absorption from the laser through electron-dependent processes such
as electron-neutral and electron-ion inverse Bremsstrahlung. In addition the
pressure of the ambient gas relates directly to the plasma density, so that an
increase in pressure results in an increase in absorption coefficient. This
absorption of laser energy by the plasma induces higher plasma temperatures
and greater background continuum emission, and a corresponding decrease in
laser energy reaching the sample and so less material is vaporised, lida
concluded that argon at reduced pressure would be the most suitable for
emission analysis, and for atmospheric measurements, helium gas could be
used, but air at atmospheric pressure was not a good atmosphere.
The effect of argon buffer gas pressure on the copper and aluminium alloys
was studied by Kuzuya and Mikami112 (1992). It was found that self-absorption
was reduced with a reduced-pressure argon atmosphere, but increased
emission intensity was obtained with higher pressures due to the confining
38

effects of the plasma. Overall, it was concluded that a reduced argon pressure
would be most useful.
Kuzuya et al116 (1993) found that the emission characteristics of the laser-
induced plasma were strongly influenced by the ablation atmosphere and laser
energy. Increases in laser energy and gas pressure resulted in high emission
intensities for the ablation of a nickel alloy. At atmospheric pressures, however,
higher laser energy did not produce higher intensities, and the highest
intensities were achieved at reduced pressure of argon with high laser energy.
Sneddon et al32-34 (1992) ablated copper using an ArF laser (193 nm) and
concluded that improved signal/background ratio was obtained at reduced
pressures with argon, and at atmospheric pressure with helium.
Effect of laser wavelength
Niemax et al25 (1992) studied the effects of laser wavelength upon ablation.
Two wavelengths from a Nd:YAG laser, 266 nm (fourth harmonic) and 1064 nm
(fundamental wavelength) were compared, and it was observed that, although
the UV radiation ablated more sample mass with the same pulse power,
element emission intensities were much lower because the plasma was more
constricted. It was concluded that laser ablation with UV laser radiation required
an additional atomisation step such as ICP-AES. Lorenzen et al52 (1992) used
a wavelength of 248 nm (excimer KrF) in preference to 1064 nm (Nd:YAG) for
the analysis of rubber materials because it did not produce thermal side-effects
on the sample surface. Mermet et al117 (1993) obtained results for UV ablation
(nitrogen 337 nm) in air at atmospheric pressure which were only slightly
degraded compared to reduced pressure ablation. They suggested that these
conditions were suitable for analytical applications. Mermet et al118 (1994)
compared infrared (Nd:YAG, 1064 nm) and ultraviolet (excimer XeCI 308 nm,
ArF 193 nm) laser ablation with copper metal, and found that UV ablation
39

removes more material per laser shot and produced a simple, more
reproducible plasma than IR ablation. They concluded that UV ablation was to
be preferred with coupled techniques (LA-ICP-MS) as analytical performance
(reproducibility, matrix effects, sensitivity) was significantly improved over IR
ablation.
Use of internal standard
Niemax109 (1989) obtained precision of typically 6 % RSD when calibration
curves were obtained for silicon and chromium using five or ten measurements
of thirty laser shots each, but was improved to 2.4% when an appropriate iron
line was used as internal standard. Detection limits were 30 pg/g and 200 pg/g
for chromium and silicon respectively. It was noted that there was negligible
loss in precision when 10 laser shots were used instead of 30. The standard
deviation was partly caused by micro-inhomogeneities in the sample. In a
further study of internal standardisation, Niemax et al114 (1989) observed that
the zinc and copper emissions showed different temporal behaviour, the zinc
line reached a maximum intensity at 2 ps, copper at 5 ps. Fractional
evaporation from the ablated droplets occurred because zinc and copper have
very different vapour pressures. Niemax concluded that if the same criteria
were adopted as for iron/chromium above, i.e. similar wavelength and excitation
energy, taking the ratio of zinc to copper would not improve analytical
performance. Niemax et al99 (1989) calculated the temperature of the plasma
as a function of time for a series of binary iron-chromium alloys by measuring
simultaneously the relative line intensities of four iron lines (299.04, 300.96,
301.15, 302.65 nm). It was observed that the temperature decreased very
rapidly initially (3-6 ps), but was much slower at later times (9-12 ps). It was
assumed that at early times, the sample plume was not completely mixed with
the argon plasma and as mixing took place the temperature decreased. At later
times the mixing was almost complete and so the temperature decreased
40

slowly. The temperature obtained for the different samples varied considerably,
the temperature decreased with increasing chromium content. It was shown by
measuring crater volume that, as the chromium content increased more
material was ablated, and a lower plasma temperature was recorded. It was
concluded that this strong matrix dependence implies that calibration should be
made with standards of composition as close as possible to the samples, and,
reference lines for ratioing should have a similar temperature behaviour to the
analytical line, (i.e. comparable excitation energies).
Effect of magnetic field
The effect of a pulsed magnetic field on the laser-induced plasma was studied
by Goldberg and Mason119-120 (1991) with aluminium metal samples. Two to
five-fold enhancements of the emission intensity were obtained with the
magnetically compressed plasma, but it was not considered a significant
analytical advantage with the low magnetic coupling achieved in the studies.
Other studies
Kuzuka121 (1987) developed a calculation procedure to correct for self
absorption of spectral lines. It was found that calibration curves for copper in
aluminium alloy became unity after correction for self-absorption. Yeung et al122
(1988) monitored the acoustic signal associated with plume generation as an
internal standard. It was shown that the acoustic signal could be used to
normalise fluctuations in emission intensity over three orders of magnitude, and
it was thought that the technique could be used where experiment conditions
vary significantly such as depth profiling. Radziemski et al123 (1989) modelled
the emission spectra formed on a carbon surface to obtain the behaviour of the
intensity profiles of the carbon atom (247.8 nm) and carbon ion (251.1 nm) lines
and the carbon atom Stark shifts. Kagawa et al124 (1993) used a tube
(dimensions 7 x 7 x 20 mm) in front of the sample to confine the laser-induced
41

plasma. The C02 laser was fired down the tube at the sample and the
confinement caused element intensities to increase. The authors concluded
that sensitivity may be improved for certain elements and this may be useful for
elements such as the halogens.
1.6 Conclusions
From the discussion of laser-material interactions, it can be seen that several
complex processes are involved in laser-induced plasmas. This complexity is a
major cause of the relatively poor analytical performance (precision and
sensitivity) of the spectrometric technique compared to more conventional
approaches such as inductively coupled plasma spectrometry. Additional
sources of error centre on the relatively small amounts of material sampled by
the laser leading to problems if samples are not sufficiently homogenous. Other
laser ablation techniques, such as laser ablation inductively coupled plasma
emission and mass spectrometry's, also suffer from poor precision for these
reasons. The laser-induced plasma emission technique retains many
advantages, such as rapid, in situ and simultaneous multi-element capabilities,
such that many groups continue to research the method and develop new
applications.
Improved performance, i.e. sensitivity and precision, can be achieved for
different applications by optimising operating parameters, such as laser energy,
sample position relative to the laser focus, and by using methods such as time-
resolved measurement, etc. Some studies have utilised different buffer gases of
various pressures at the ablation site to improve performance. Many studies
have used correction methods, such as internal standardisation, to improve
precision, but these need to be applied with care. For example, different rates
of volatilisation were reported for copper and zinc from a copper/zinc alloy by
Baldwin et al56 and Niemax et al,109 resulting in worse performance if one
42

element was used as internal standard for the other. Although improved
performance can be achieved with the use of buffer gases such as argon at
partial pressures, industrial applications such as process monitoring have
utilised atmospheric pressures because high sensitivity is not necessarily
required and it may not be feasible to achieve partial pressures.
Instrumentation for laser-induced plasma emission spectrometry generally
consists of a Q-switched Nd:YAG laser and an optical multi-channel analyser
fitted with an intensified photodiode array detector. The Q-switched Nd:YAG
laser is rugged, relatively compact and low cost compared to other lasers. The
fundamental wavelength of 1064 nm from the Nd:YAG is normally used
because this wavelength is readily absorbed by almost all materials to produce
laser ablation and a laser-induced plasma for analytical measurement. More
recently, the use of ultraviolet laser wavelengths has been examined. A fibre
optic is generally used to collect and transfer radiation from the laser-induced
plasma to the spectrometer because it facilitates easy alignment and capture of
radiation and allows remote location of the spectrometer if required. For
detection, an optical multi-channel analyser fitted with an intensified photodiode
array detector is generally used because it enables simultaneous, multi-element
analysis with time-resolved measurement.
Industrial applications such as process monitoring have been developed that
have exploited the advantages of laser-induced emission spectrometry. For
example, the rapid, remote sensing capabilities have enabled the in situ
monitoring of steel and rubber production. The speed of analysis has been
utilised in recent environmental analysis applications, such as the detection of
heavy metals in soils, to provide a rapid, survey analysis capability. Laser-
induced plasma emission spectrometry has been widely applied to the analysis
of metals, but few applications to the analysis of polymeric, ceramic, or organic
43

materials, liquids, or coatings on substrates have been reported. There has also
been little development of methods to rapidly process laser-induced emission
data towards real-time data analysis. Artificial intelligence techniques have not
been applied to the pattern recognition of laser-induced emission spectra.
There is considerable potential for research in these areas for the development
of new applications, which will further the understanding of the laser-induced
emission technique.
1.7 Aims and objectives of this work
The aim of this research is to further the understanding of laser-induced plasma
emission spectrometry through the study of new applications. The objectives
are to configure an integrated laser-induced plasma emission spectrometer
system using the most appropriate instrumentation. This includes a Q-switched
Nd.YAG laser with an infrared laser wavelength that is readily absorbed by
most materials, fibre optic for collection and transmission of the emitted
radiation, and an optical multichannel analyser with an intensified photodiode
array detector to provide a time-resolved, simultaneous multi-element analysis
capability. The performance of the optical multichannel analyser will be first
evaluated with a stable emission source (an inductively coupled plasma
emission source), and then with the laser-induced plasma emission source.
Studies will investigate basic aspects of laser-induced plasma emission
spectrometry to provide information about laser-induced plasma characteristics.
Novel applications will be devised to provide insight into the processes of laser-
induced emission spectrometry. The areas to be studied are the rapid survey
analysis of polymeric materials, and the depth profile measurement of coatings
on substrates. The influence of key operating parameters upon emission
characteristics and performance will be examined for both types of materials.
The polymer studies will exploit the capabilities of the technique towards bulk
44

analysis of non-conducting materials, and may enable samples to be rapidly
identified by their elemental composition. The depth profile investigations will
utilise the in situ, micro-analysis capabilities of the technique, and may provide
a new method for the rapid measurement of coating thickness. In addition, a
new, rapid data processing technique will be devised to exploit the real-time
analysis capabilities of laser-induced plasma emission spectrometry. In this
study, the rapid pattern recognition capabilities of artificial neural networks, a
form of artificial intelligence, will be applied to laser-induced emission spectra.
45

1.8 References
1. Montaser A. and Golightly D. W., in Inductively Coupled Plasmas in
Analytical Spectrometry, Montaser A. and Golightly D.W., Editors, VCH
Publishers, New York, 1987, pp 1-15.
2. Slickers K., The Automatic Atomic Emission Spectroscopy, Bruhl
Universitatsdruckerei, Giessen, Germany, Second Edition, 1993.
3. Harrison T. S., Handbook of Analytical Control of Iron and Steel Production,
Ellis Horwood Ltd., Chichester, U.K., 1979.
4. Bengston A. and Danielsson L., Thin Solid Films, 1985, 124, 231-236.
Depth Profiling Of Thin Films Using A Grimm-type Glow Discharge Lamp
5. Brech F. and Cross L., Applied Spectroscopy, 1962, 16, 59. Optical micro
emission stimulated by a ruby laser.
6. Maiman T. H., Physics Review Letters, 1960, 4, 564.
7. Moenke-Blankenburg L., Laser Micro Analysis, Wiley, New York, 1989.
8. Cremers D. A. and Radziemski L. J., "Laser Plasmas for Chemical
Analysis", in Applications of Laser Spectroscopy, Marcel Dekker, New York,
1986, pp 351-415
9. Tyson J. and Darke S. A., Journal of Analytical Atomic Spectrometry, 1993,
8, 145-209. Interaction of laser radiation with solid materials and its
significance to analytical spectrometry.
10.Routh M., and Tikkanen M. W., in Inductively Coupled Plasmas in Analytical
Spectrometry, Montaser A. and Golightly D.W., Editors, VCH Publishers,
New York, 1987, pp 468-475.
H.Schrenk W. G., Analytical Atomic Spectroscopy, Plenum Press, London,
1975.
12.Skoog D. A. and Leary J. L., Principles of Instrumental Analysis, Harcourt
Brace College Publishers, London, Fourth Edition, 1992.
46

13. Harrison G. R., Wavelength Tables with Intensites in Arc, Spark or
Discharge Tube, M.I.T. Press, Cambridge, Mass., USA, 1969
14. Winge R. K., Fassel V. A., Peterson V. J. and Floyd M. A., Inductively
Coupled Plasma-Atomic Emission Spectroscopy, An Atlas Of Spectral
Information, Elsevier, New York, USA, Volume 20.
15. Ready J. F., Effects of High Power Laser Radiation, Academic Press, New
York, 1971.
16. Kim Y. W., "Fundamentals of Analysis of Solids by Laser-Produced
Plasmas", in: Laser-Induced Plasmas and Applications, Cremers D. A.,
Radziemski L. J., Editors, Marcel Dekker, New York, 1989, pp 327-346.
17. Piepmeier E. H., "Laser Ablation for Atomic Spectroscopy", in Analytical
Applications of Lasers, Piepmeir E.H., Editor, Wiley, New York, 1986,
pp 627-669.
18. Hein S., Piepmeier E. H., Trends in Analytical Chemistry, 1988, 7 (4),
137-142. Laser Ablation And The Laser Microprobe.
19. Sneddon J., Hwang Z. W., Teng Y. Y. and Li K. P., Analytical Letters,
1992, 25 (11), 2143-56. Studies of space and time resolved emission
measurements of an ArF excimer laser ablated plasma.
20. Scott R. H. and Strashheim A., Spectrochimica Acta, 1970, 25B, 311-332.
Laser Induced Plasmas For Analytical Spectroscopy.
21. Piepmeier E. H. and Osten D. E, Applied Spectroscopy, 1971, 25, 642-
652. Atmospheric Influences On Q-Switched Laser Sampling And
Resulting Plumes.
22. Van Deijck W., Balke J. and Maessen M. J., Spectrochimica Acta, 1979,
34B, 359-369. An Assessment Of The Laser Microprobe Analyzer As A
Tool For Quantitative Analysis In Atomic Emission Spectrometry.
23. Jarrell Ash Laser Microprobe, Jarrell Ash literature, Thermo Jarrell Ash
Corporation, USA, 1975.
47

24. Cremers D. A. and Archuleta F. L., Proceedings of the 5th Process Tech.
Conf. on Sensors Steel Industry, Detroit, Michigan, April 14-17, 1985,
pp157-162. Rapid Analysis Of Steels Using Laser-Based Techniques.
25. Niemax K., Sdorra W. and Brust J., Mikrochim Acta, 1992, 108, (1-2), 1-10.
Basic Investigation For Laser Micro Analysis IV: The Dependence Of Laser
Wavelength In Laser Ablation.
26. Kagawa K. and Yokoi S., Spectrochimica Acta, 1982, B37, 789-795.
Applcation Of The N2 Laser To Laser Microprobe Spectrochemical
Analysis.
27. Kagawa K., Matsuda Y., Yokoi S. and Nakajima S., Journal of Analytical
Atomic Spectromertry, 1988, 2, 415-419. Nitrogen Laser Ablation Analysis
Using The Primary Plasma As A Standard For The Quantification Of
Vapourised Atoms.
28. Chau F. T., Lau K. S., Wong K. H., Mak C. H. and Wong W. K., Laboratory
Microcomputer, 1990, 9, (3), 88-93. A Software Package For Spectrum
Processing Of A Laser-Induced Spectrometer.
29. Hoffman A., Super Conductor Science & Technology, 1990, 3, (8), 395-
403. A Comparative Study Of The ArF Laser-Ablation-lnduced Plasma
Plume Of Y YO Cu YCuO & YBaCuO By Fluoresence Spectroscopy.
30. Lorenzen C. J., Carlhoff C., Hahn U. and Jogwich M., Journal of Analytical
Atomic Spectrometry, 1992, 7, 1029-1035. Applications Of Laser-Induced
Emission Spectral Analysis For Industrial Process And Quality Control.
31. Petit A., ICP Infromation Newsletter, 17, January 1992, 114. (1992 Winter
Conference on Plasma Spectrochemistry) Optical Emission Spectroscopy
On Laser Produced Plasma For Analytical Determination In Solid Sample.
32. Sneddon J., Lee Y. I., Kim G. H. and Teng Y. Y., Applied Spectroscopy,
1992, 46, 11, 1597-1604. Interation Of An Excimer Laser Beam With
Metals 3: Effect Of A Controlled Atmosphere In Laser-Ablated Plasma
Emission.
48

33. Sneddon J. and Lee Y. L.t Spectroscopy Letters, 1992, 25, (6), 881-891.
Quantitative Elemental Analysis Of Solid Samples By ArF-Excimer Laser -
Ablated Atomic Emission-Specrometry.
34. Sneddon J., Hwang Z. W., Teng Y. Y. and Li K. P., Analytical Letters,
1992, 25 (11), 2143-56. Studies Of Space And Time Resolved Emission
Measurements Of An ArF Excimer Laser Ablated Plasma.
35. Weimer W. A. and Geyer J. J., Applied Spectroscopy, 1990, 44 (10), 1659-
1664. Parametric Effects On Plasma Emission Produced During Excimer
Laser Ablation Of YBa2Cu30 7_x.
36. Beatrice E. S and Glick D., Applied Spectroscopy, 1969, 23, 260-263. A
Direct-Reading Polychromator For Emission Spectroscopy.
37. Marich K. W., Treytl W. J., Hawley W. J., Peppers N. A., Myers R. E. and
Glick D., Journal of Physics, 1974, E7, 830-834. Improved Q-Switched
Ruby Laser Microprobe For Emission Spectroscopic Element Anaysis.
38. Moenke-Blankenburg L., Progress Analytical Spectroscopy, 1986, 9, 335-
427. Laser Micro Analysis.
39. TalmiY. and Sieper H. P., Analytical Chimica Acta, 1981, 127, 71-85.
Laser-Microprobe Elemental Determinations With An Optical Multichannel
Detection System.
40. Radziemski L. J. and Loree T. R., Journal of Plasma Chemistry and
Plasma Processing, 1981, 1, 271-279. Laser Induced Breakdown
Spectroscopy: Time-Integrated Applications.
41. Denton M. B., Sweedler J. V. and Jalkian R. D., Applied Spectroscopy,
1989, 43 (6), 953-962. A Linear Charge-Coupled Device Detector System
For Spectroscopy.
42. lida Y., Analytical Science, 1991, 7 (1), 61-64. Laser Induced Plasmas
With An Optical Imaging Spectrometer.
49

43. Peipmeier E. H. and Malmstadt H. V., Analytical Chemistry, 1969, 41, (6),
700-707. Q-Switch Laser Energy Absorption In The Plume Of An
Aluminium Alloy.
44. Marich K. W., Treytl W. J., Glick D. and Orenberg J. B., Applied
Spectroscopy, 1971, 25, 376-379. Photoelectric Time Differentiation In
Laser Microprobe Optical Emission Spectroscopy.
45. Allemand C. D., Spectrochimica Acta, 1972, B27, 185-204. Spectroscopy
Of Single Spike Laser Generated Plasmas.
46. Schroeder W. W., Spectrochimica Acta, 1971, B26, 33. A New Electronic
Time Resolution System For Direct Reading Spectrometers And Some
Applications In The Diagnosis Of Spark And Laser Radiations.
47. EG&G Literature OMA 4, EG&G Instruments, Sorbus House, Wokingham,
RG11 2GY, UK, 1993.
48. Campos J., Aguilera J. A. and Aragon C., Applied Spectroscopy, 1992, 46
(9), 1382-1387. Determination Of Carbon Content In Steel Using Laser-
Induced Breakdown Spectroscopy.
49. Cremers D. A., Applied Spectroscopy, 1987, 41 (4), 572-579. Analysis Of
Metals At A Distance Using Laser-Induced Breakdown Spectroscopy.
50. Grant K. J., Paul G. L. and O'Neill J. A., Applied Specroscopy, 1991, 45
(4), 701-705. Quantitative Elemental Analysis Of Iron Ore By Laser
Induced Breakdown Spectroscopy.
51. Kuzuya M. and Mikami O., Journal of Analytical Atomic Spectrometry,
1992, 7 (3) 493-497. Effect Of Argon Pressure On Spectral Emission Of A
Plasma Produced By A Laser Microprobe.
52. Lorenzen C. J., Carlhoff C., Hahn U. and Jogwich M., Journal of Analytical
Atomic Spectrometry 1992, 7, 1029-1035. Applications Of Laser-Induced
Emission Spectral Analysis For Industrial Process And Quality Control.
53. Runge E. F., Minck R. W. and Bryan F. R., Spectrochimica Acta, 1964, 20,
733. Spectrochemical Anaylsis Using A Pulsed Laser Source.
50

54. Runge E. F., Bonfiglio S. and Bryan F. R., Spectrochimica Acta, 1966, 22,
1678-1680. Spectrochemical Anaylsis Of Molten Metal Using A Pulsed
Laser Source.
55. ^elske A., Hagenah W. D. and Laqua K., Spectrochimica Acta, 1972,
B27, 1-21.
56. Baldwin J. M., Applied Spectroscopy, 1970, 24, 429-435.
Q-Switched Laser Sampling Of Copper-Zinc Alloys.
57. Ishizuka T., Analytical Chemistry, 1973, 45, 538-541.
Laser Emission Spectrography Of Rare Earth Elements.
58. Furuta K., Yago H., Ishikawa K. and Komura H., Physical Status Solidi B,
1993, 179 (1), 223-32. Time-Resolved Emission Spectra From Laser-
Induced Plasma In Sodium Chloride
59. Marich K. W., Treytl W. J., Carr P. W. and Glick D., Analytical Chemisty,
1970, 42, 1775. Effect Of Matrix Material On Laser-Induced Element
Spectral Emission.
60. Marich K. W., Treytl W. J., Glick D. and Orenberg J. B., Applied
Spectroscopy, 1971, 25, 376-379. Photoelectric Time Differentiation
In Laser Microprobe Optical Emission Spectroscopy.
61. Treytl W. J., Marich K. W, Orenberg J. B., Carr P. W. and Glick D.,
Analytical Chemistry, 1971, 43 (11), 1452-1456. Effect Of Atmosphere On
Spectral Emission From Plasmas Generated By The Laser Microprobe.
62. Treytl W. J., Marich K. W. and Glick D., Analytical Chemistry, 1972, 44
(11), 1903-1904. Detection Limits In Analysis Of Metals In Biological
Materials By Laser Microprobe Optical Emission Spectrometry.
63. Marich K. W., Treytl W. J. and Glick D., Analytical Chemistry, 1975, 47 (8),
1275-1279. Spatial Differentiation Of Optical Emission In Q-Switched
Laser-Induced Plasmas And Effects On Spectral Line Analytical
Sensitivety
51

64. Cremers D. A., SPIE 1986, 644, Remote Sensing 7-12. An Evaluation Of
Factors Affecting The Analysis Of Metals Using Laser-Induced Breakdown
Spectroscopy.
65. Cremers D. A. and Archuleta F. L., Proceedings of the 5th Process
Techniques Conference on Sensors in Steel Industry, Detroit, Michigan,
April 14-17, 1985, p157-162. Rapid Analysis Of Steels Using
Laser-Based Techniques.
66. Cremers D. A., Applied Spectroscopy, 1987, 41 (4), 572-579. Analysis Of
Metals At A Distance Using Laser-Induced Breakdown Spectroscopy.
67. Radziemski L. J., Millard J. A., and Dalling R. H., SPIE 1986, 644, Remote
Sensing, 13-15. Time Resolved Laser-Induced Breakdown Spectrometry
For Rapid Alloy Analysis.
68. Radziemski L. J., Millard J. A. and Dalling R. H., Applied Spectroscopy,
1986, 40 (4), 491-494. Time-Resolved Laser-Induced Breakdown
Spectrometry For The Rapid Determination Of Beryllium In Beryllium -
Copper Alloys.
69. Yoo K. M., Applied Physics Letters, 1989, 54, (3), 1278-1279. Time
Resolved Emission Spectroscopy Of The High TC Superconductor
YBa2Cu30 7_x Under Laser Ablation.
70. Geyer J. W., Applied Physics Letters, 1989, 54 (5), 469-471. Spectral
Characteristics of Plasma Emission During ArF Excimer Laser Ablation of
YBa2Cu30 7.
71. Deshmukh S., Applied Physics Letters, 1988, 53 (26), 2698-2700.
Emission Spectra From ArF Laser Ablation of High Temperature
Superconductor Bi2CaSr2Cu209.
72. Chita G., Conference proceedings, 1991, 29. Quantum Electronics and
Plasma Engineering, 471-475. Spectroscopy Of Laser Produced Plasma
During Aluminium Welding With CO2 Laser.
52

73. Pramanick S. and Narayan J., Materials Research Society Symposium
Proceedings, 1992, 250, 125-9. In-Situ Optical Emission Of Titanium
Nitride (TiN) And Titanium Silicide (TiSi2) Plasma During Thin Film Growth
By Pulsed Laser Evaporation.
74. Grant K. J., Paul G. L. and O'Neill J. A, Applied Specroscopy, 1991, 45 (4),
701-705. Quantitative Elemental Analysis Of Iron Ore By Laser Induced
Breakdown Spectroscopy.
75. Sneddon J. , Hwang Z. W. and Li K. P., Applied Specroscopy, 1991, 45
(3), 435-441. Interation Of A Laser Beam With Metals Part L Quantitative
Studies Of Plasma Emission.
76. Sneddon J., Lee Y. I. and Sawan S. P., Applied Specroscopy, 1992, 46
(3), 436-441. Interation Of A Laser Beam With Metals Part II: Space
Resolved Studies Of A Laser-Ablated Plasma Emission.
77. Niemax K., Zhao XZ., Shen LJ., Applied Physics B-Photophysics And
Laser Chemistry, 1992, 55 (4), 327-330. Spatial Distributions Of Electron
Density In Microplasmas Produced By Laser Ablation Of Solids.
78. Esmiller B., Baudinaud V. and Autric M., SPIE, 1992, Gas Flow and
Chemical Lasers, 692-695. Characterisation By Space-Time Resolved
Emission Spectroscopy Of Laser Produced Plasma On Solid Materials.
79. Majidi V. and Ning X. U., Applied Spectroscopy, 1993, 47 (8), 1134-1139.
Wavelength And Time-Resolved Investigation Of Laser-Induced Plasmas
As A Continuum Source.
80. Cremers D. A. and Radziemski L. J., Applied Spectroscopy, 1985, 39 (1),
57-63. Direct Detection Of Beryllium On Filters Using The Laser Spark
81. Hardjoutomo W., Munechika H., Kurniawan H., Hattori I., Kobayashi T. and
Kagawa K., Optics And Laser Technolology, 1992, 24 (5), 273-277.
A Compact TEA Carbon Dioxide Laser For Field Based Spectrochemical
Analysis Of Geochemical Samples.
53

82. O'Shea D. C., Callen W. R. and Rhodes W. T., Introduction To Lasers And
Their Applications, Addison Publishing Company, London, 1977.
83. Wisbrun R., Schechter I., Niessner R. and Schroder H., Proceedings SPIE
Int. Soc. Opt. Eng., 1992,1716, 2-15. Laser-Induced Breakdown
Spectroscopy For Detection Of Heavy Metals In Environmental Samples
84. Wisbrun R,, Schroder H. and Niessner R., Analytical Methods and
Instrumentation, 1993, 1 (1), 17-22. Laser-Induced Breakdown
Spectrometry For Environmental Analysis Of Trace Amounts Of Heavy
Metals In Soils.
85. Cremers D. A., Ferris M. J. and Kane K. Y., Portable Laser Spark Surface
Mass Analyser, Los Alamos Information Sheet (LALP 92-63), Los Alamos
National Laboratory, Los Alamos, USA, 1992.
86. Jowitt R., British Steel/BISPA Chemist Conference, June 26th, 1985,
19-29. Direct Analysis Of Liquid Steel By Laser.
87. Kim Y. W., Advanced Sensing, Modelling and Control of Material
Processing, 1992, 45-47. Compositional Control Via Laser Sensing Of
Plasma Generated From Steel Melts.
88. Cremers D. A. and Wachter J. R., Applied Spectroscopy, 1987, 41 (6),
1042-1048. Determination Of Uranium In Solution Using Laser-Induced
Breakdown Spectroscopy.
89. Mauchien P., Deniau H. and Moulin C, Radiochimica Acta, 1993, 61, 23-
28. Time-Resolved Laser-Induced Spectroflurometry Of U022+ In Nitric
Acid Solutions. Preliminary Results For On-Line U Monitoring Applications
90. Adrain R. S., Airey D. R. and Ormerod E. J., IEE Conference Publication
(1978 International Conference on Gas Discharges, 5th), 70-73.
Spectro-Chemical Analysis Of Steels With Laser Initiated Plasmas.
91. Personnal Communication, Shuttleworth S., Manchester University,
Manchester, UK.
54
92. Radziemski L. J., Appled Spectroscopy, 1989, 43, (6) 967-976. Real Time
Laser Spark Spectroscopy Of Particulates In Combustion Environments.
93. Radziemski L. J., Energy and Fuels, 1991, 5 (2), 304-312.
Laser Spark Emission Spectroscopy For In-Situ Monitoring Of Coal.
94. Singh J. P., Zhang H., Fang-Yu Y. and Cook R. L., Proceedings of
Intersociety Energy Con version Engineering Conference, 1993, 1, 1995-
1100. Laser-Induced Breakdown Spectra In A Coal-Fired MHD Facility.
95. Krupp Literature, RELMA: On-Line Quality Control In The Rubber Mixing
Room Using Laser Analysis, Technishe Mitteilungen Krupp, 2, 1992.
96. Cremers D. A. and Radziemski L. J., in Laser-Induced Plasmas and
Applications, Editors Cremers D. A. and Radziemski L. J., Marcel Dekker,
New York, USA, 1989, p314.
97. Cremers D. A., Radziemski L. J. and Loree T. R., Applied Spectroscopy,
1984, 38 (5), 721-729. Spectrochemical Analysis Of Liquids Using The
Laser Spark.
98. Radziemski L. J., Essien M. and Sneddon J., Journal of Analytical Atomic
Spectrometry, 1988, 3, (7), 985-988. Detection Of Cadmium, Lead And
Zinc In Aerosols By Laser-Induced Breakdown Spectrometry.
99. Archontaki H. A. and Crouch S. R., Applied Spectroscopy, 1988, 42, (5),
741-746. Evaluation Of An Isolated Droplet Sample Introduction System
For Laser-Induced Breakdown Spectroscopy.
100. Winefordner J. D., Ng K. C., Ayala N. L. and Simeonsson J. B., Analytica
Chimica Acta, 1992, 269, 123-128. Laser-Induced Plasma Atomic
Emission Spectrometry In Liquid Aerosols.
101.Mermet J. M. and Boiron M. C., Geochemica et Cosmochimica Acta, 1991,
55, (3), 917-923. Analysis Of Mono-Atomic Ions In Individual Fluid
Inclusions By Laser-Produced Plasma Emission Spectometry.
55

102. Radziemski L. J. and Loree T. R., Journal of Plasma Chemistry and
Plasma Processing, 1981, 1, 271. Laser Induced Breakdown
Spectroscopy: Time-Integrated Applications.
103. Radziemski L. J. and Loree T. R., Journal of Plasma Chemistry and
Plasma Processing, 1981, 1, 281-293. Laser Induced Breakdown
Spectroscopy: Time Resolved Spectrochemical Applications.
104. Cremers D. A., Radziemski L. J. and Loree T. R., Spectrochimica Acta,
1983, 38B (1-2), 349-355. Detection Of Beryllium By Laser-Induced
Breakdown Spectroscopy.
105. Cremers D. A and Radziemski L. J., Analytical Chemistry, 1983, 55 (8),
1246-1252. Time-Resolved Laser-Induced Breakdown Spectrometry Of
Aerosols.
106. Cremers D. A. and Radziemski L. J., Analytical Chemistry, 1983, 55 (8),
1252-1256. Detection Of Chlorine And Fluorine In Air By Laser-Induced
Breakdown Spectrometry.
107. Cheng E. A., Fraser R. D. and Eden J. G., Applied Spectroscopy, 1991, 45
(6), 949-952. Detection Of Trace Concentrations Of Column III And V
Hydrides By Laser-Induced Breakdown Spectroscopy.
108. Radziemski L. J., Cremers D. A. and Neimczk T. M., Spectrochimica Acta,
1985, 40B, 3, 517-525. Measurement Of The Properties Of A C02 Laser
Induced Air-Plasma By Double Floating Probe And Spectroscopic
Techniques.
109. Niemax K ., Leis F., Sdorra W. and Ko J. B., Mikrochimica Acta, 1989, 2
(4-6), 185-199. Basic Investigation For Laser Micro Analysis: 1. Optical
Emission Spectrometry Of Laser-Produced Sample Plumes.
110. Niemax K., Sdorra W., Quentmeir A., Mikrochimica Acta, 1989, 2, (4-6),
201-218. Basic Investigation For Laser Micro Analysis Part 2: Laser-
Induced Fluorescence In Laser-Produced Sample Plumes.
56

111. lida Y., Applied Spectroscopy, 1989, 43 (2), 229-234. Atomic-Emission
Characteristics Of Laser-Induced Plasmas In An Argon Atmosphere At
Reduced Pressure.
112. Kuzuya M. and Mikami O., Journal of Analytical Atomic Spectrometry,
1992, 7 (3), 493-497. Effect Of Argon Pressure On Spectral Emission Of A
Plasma Produced By A Laser Microprobe.
113. Piepmeier E. H. and Osten D. E., Applied Spectroscopy, 1971, 25, 642.
Atmospheric Influences On Q-Switched Laser Sampling And Resulting
Plumes.
114. Niemax K., Ko J.B. and Sdorra W., Fresnius' Z. Analytical Chemistry,
1989, 335 (7), 648-651. On The Internal Standardisation In Optical
Emission Spectrometry Produced By Laser Ablation Of Solid Samples.
115. Peipmeier E. H. and Malmstadt H. V., Analytical Chemistry, 1969, 41 (6),
700-707. Q-Switch Laser Energy Absorption In The Plume Of An
Aluminium Alloy.
116. Kuzuya M., Matsumoto H., Mikami O. and Takechi H., Applied
Spectrosopy, 1993, 47 (10), 1659-1664. Effect Of Laser Energy And
Atmosphere On The Emission Characteristics Of Laser-Induced Plasmas.
117. Autin M., Briand A., Mauchien P. and Mermet J. M., Spectrochimica Acta,
1993, 48B (6/7), 851-862. Charcaterization Of A Laser-Produced Plasma
From A Copper Target In Air At Atmospheric Pressure.
118.Geersten C., Briand A., Chartier F., Lacour J. L., Mauchien P., Sjostrom S.
and Mermet J. M., Journal Of Analytical Atomic Spectroscopy, 1994, 9,
17-22. Comparison Between Infrared And Ultraviolet Laser Ablation At
Atmoshperic Pressure - Implications For Solid Sampling Inductively
Coupled Plasma Spectrometry.
119. Goldberg J. M. and Mason K. J., Applied Spectroscopy, 1991, 45 (3),
370-379. Charcaterisation Of A Laser Plasma In A Pulsed Magnetic-Field
1. Spatially-Resolved Emission Studies.

120. Goldberg J. M. Mason K. J., Applied Spectroscopy, 1991, 45 (9),
1444-1455. Charcaterisation Of A Laser Plasma In A Pulsed Magnetic-
Field 2. Time Resolved Emission And Absorption Studies.
121. Kuzuya M., Mikami T. and Mikami O., Bunko-Kenkyu, 1987, 36 (5), 333-
340. Studies On The Analysis Precision Of Laser Micro-Probe Analyser:
II. Improvement Of Analysis Precision By Correcting Self-Absorption.
122. Yeung E. and Chen G., Analytical Chemistry, 1988, 60 (20), 2258-2263.
Acoustic Signal As An Internal Standard For Quantitation In Laser
Generated Plumes.
123. Radziemski L. J., Journal of Applied Physics, 1989, 65 (8), 2946-2950.
Modelling Of Time Dependant Laser Induced Plasma On Carbon Surface.
124. Kagawa K., Ueda T. H., Sasaki M. and Mizukami K., Applied
Spectroscopy, 1993, 47 (10), 1562-1566. TEA C02 Laser-Induced
Plasma With A Plane Shock Wave Structure.
58
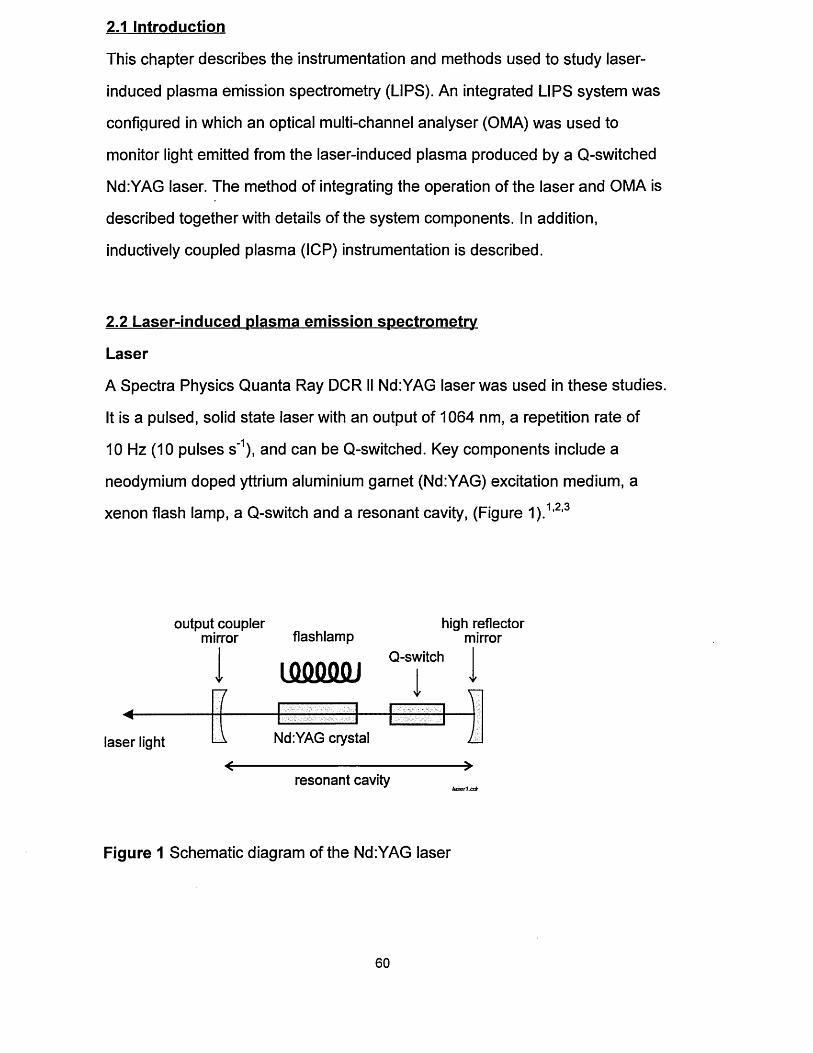
2.1 Introduction
This chapter describes the instrumentation and methods used to study laser-
induced plasma emission spectrometry (LIPS). An integrated LIPS system was
configured in which an optical multi-channel analyser (OMA) was used to
monitor light emitted from the laser-induced plasma produced by a Q-switched
Nd:YAG laser. The method of integrating the operation of the laser and OMA is
described together with details of the system components. In addition,
inductively coupled plasma (ICP) instrumentation is described.
2.2 Laser-induced plasma emission spectrometry
Laser
A Spectra Physics Quanta Ray DCR II Nd:YAG laser was used in these studies.
It is a pulsed, solid state laser with an output of 1064 nm, a repetition rate of
10 Hz (10 pulses s 1), and can be Q-switched. Key components include a
neodymium doped yttrium aluminium garnet (Nd:YAG) excitation medium, a
xenon flash lamp, a Q-switch and a resonant cavity, (Figure 1).1,2,3
output couplermirror flashlamp
high reflector mirror
Q-switch
F7
laser light A Nd:YAG crystal
<------resonant cavity
Figure 1 Schematic diagram of the Nd:YAG laser
60

The principle of laser action (light amplification by stimulated emission of
radiation) is depicted in Figure 2 and is as follows.
V
\\
\
----------- 4F1 3/2
>, Laser TransitionO ) 1064 nmd )c<D
^ 4 ,/ 11/2
//
//
ground * 4 |taseneq jcdr
Figure 2 Diagram of the 4-level energy transition scheme for the Nd:YAG laser
The active medium (Nd 3+ ions in a host aluminium garnet crystal) is optically
pumped by the pulsed flash lamp causing electrons to gain energy and move to
high energy levels. The excited electrons quickly decay to the upper lasing
transition level (F3/2), which is metastable, where they can remain for a
relatively long period of time (~230 ps). The most probable transition is to the
l11/2 state, from where electrons quickly decay to the ground state. Thus, a
population inversion is easily built up at the F3/2 level. This energy is released
through stimulated emission to produce laser light at 1064 nm. In stimulated
emission, a photon of specific wavelength, i.e. 1064 nm, impinges on an
excited electron (at F3/2) resulting in 2 photons of the same energy travelling in
the same direction and in phase. The first photons are produced by random,
spontaneous emission. The mirrors at either end of the optical cavity only
reflect light that is travelling along the axis of the cavity, perpendicular to the
mirrors, and stimulated emission in other directions passes out of the cavity.
Light passes back and forth within this resonant cavity causing further61

stimulated emission. It is released by the output coupler as a pulse of laser light
lasting ~200 ps, the duration of the flash lamp illumination. The output coupler
in this diffraction coupled resonator (DCR) laser is a small, high reflector
mounted on a clear substrate on the optical axis of the resonant cavity. Light
escapes from the resonator by diffraction around this dot.
Laser energy can be released in two modes, long pulse (normal) and Q-
switched. In the long pulse mode, the energy is released as above, to produce
a train of laser pulses lasting about 200 ps. In the Q-switched mode, the Q-
switch acts as a high speed shutter. It is closed initially to prevent lasing action
causing the build up of a large population inversion at the upper lasing
transition level (F3/2). When the maximum population inversion is achieved,
(-220 ps after the start of the flash lamp), the Q-switch is opened and the
energy is released as a single giant pulse. The pulse width is less than 10 ns,
and the peak optical power is of the order of megawatts. This Q-switched mode
is used in LIPS as the high peak power, when focused to a small spot size, will
produce a high power density sufficient to induce a plasma at the surface of a
sample.
Q-switching means changing the Q (quality factor) of the cavity resonator.
When the Q factor is high, the cavity stores the energy well (Q-switch closed,
large population inversion builds up), and when the Q factor is low, the cavity
emits laser light rapidly (Q-switch open). The Q-switch in this laser is an electro
optic device consisting of a Pockels cell, quarter-wave plate and a polariser,
(Figure 3). When a high voltage is applied to the Pockels cell crystal, the
polarisation characteristics of the cell are changed which determines whether
light is returned to the cavity and the cavity can resonate or not. When the Q-
switch is closed, no voltage is applied and so the Pockels cell does not affect
the polarisation of light passing through it. Light entering the Q-switch is
62

vertically polarised by the polariser and then circular polarised by the quarter-
plate polariser. When the light returns from the reflector, it is converted to
horizontal polarised light by the quarter-plate polariser. This light is reflected out
of the cavity by the polariser as it will only transmit vertically polarised light and
so lasing does not occur. When the Q-switch is opened, a fast high-voltage
pulse is applied to the Pockels cell which cancels the polarisation of the
quarter-plate and so the vertically polarised light is transmitted by the polariser
and lasing will occur. In the long pulse mode, the Q-switch is open throughout
the flash lamp illumination and so laser light is released as a train of pulses
lasting the duration of the flash lamp.
highreflector
polariserquater-w ave Pockelsplate cell
Figure 3 Diagram of the laser Q-switch
Laser radiation has several unique properties. It is monochromatic,
unidirectional, intense, and coherent (same phase and polarisation). A laser
beam has low divergence so that the beam diameter, 6.4 mm here, is
maintained over relatively large distances. These properties enable laser light
to be focused to a small spot size with very high irradiance, typically 1011 W cm2
in Q-switched mode, such that a plasma will be induced at the laser focal point.
Emission from the laser-induced plasma is monitored in this study with an
optical multichannel analyser, described in the next section.
63

Irradiance is defined as power per unit area, and is calculated from the laser
energy per pulse and the area of the laser spot.4-5 Below are the calculations to
obtain values for irradiance produced by two laser energies (laser flash lamp
energies 70 and 40 J) with the focus lens that is used in these studies (focal
length 500 mm).
a. calculation of laser power
(1) power = energy / unit time (watt = joule second'1)
Laser power is ideally measured directly from the laser with a power meter, but
it is calculated here from the laser manufacturer's specification because no
power meter was available.
- from laser manufacturer's specification:
70 J laser flash lamp energy = 275 mJ laser energy
laser pulse width = 8-9 ns, assume = 10 ns
therefore, laser power = 275 mJ per 10 ns
as power (watt) = J s_1, laser power per s = 27.5 x 10⁶ W
b. calculation of the area of the laser spot from the focal spot diameter
for a Gaussian beam, the focal spot diameter (d) is given by:
(2) d (nm) = n X B
where: X = wavelength of laser radiation
F = focal length of focus lens
D = diameter of laser beam
for these studies: X = 1.064 pm
F = 500 mm
D = 6.4 mm
64

focal spot diameter (d) = 105.8 pm
= 1.058 x 10'2 cm
(3) area of laser focal spot (cm-2)
.*. area of laser focal spot =
c. Calculation of irradiance
(4) irradiance = power / unit area (watt crrr2)
irradiance for laser flash lamp energy 70 J = power / unit area (watt cnr2)
27.5 x lO 6 0.8791 x l0 “4
irradiance for laser flash lamp energy 70 J = 3.1 x 10¹¹ W cm-2
irradiance for laser flash lamp energy 40 J = 7.8 x 10¹⁰ W cm-2
calculation of irradiance for laser flash lamp energy of 40 J:
the estimated laser energy for this laser flash lamp energy is 70 mJ, from:
- assuming laser flash lamp energy is proportional to laser energy
- lasing threshold is at laser flash lamp energy 30 J = 0 laser energy
and laser flash lamp energy 70 J = 275 mJ laser energy
.-. laser flash lamp energy 40 J = 7.0 mJ laser energy
laser power = 6.87 x 10⁶ watt
7i d24
0.8791 x 10⁻⁴ cm-2
65

From (2), it can be seen that the laser spot size is governed by the focal length
of the focus lens, the diameter of the laser beam, and the wavelength of the
laser. From (4), irradiance is increased by reducing the size of the laser spot.
To decrease the size of the laser spot size and thereby increase the irradiance,
the laser wavelength or the focal length of the focus lens can be decreased.
Calculated values are shown in Table 1 of the laser spot diameter produced by
a shorter laser wavelength (266 nm), and a shorter focal length focus lens
(100 mm), than the laser wavelength and focus lens used in these studies
(1064 nm, 500 mm, respectively).
Laser Wavelength (nm) Focal Length of Focus Calculated Laser Spot
Lens (mm) Diameter (pm)
1064* 500* 105.8
1064 100 21.16
266 100 5.29
* laser wavelength and focus lens used in these studies
Table 1 Calculated laser spot diameters for different laser wavelengths and focus lenses
The depth of focus (DOF) for a Gaussian beam is given by:
(5) DOF =v 7i y
where F = focal length of focus lens (500 mm)
D = diameter of laser beam (6.4 mm)
DOF for 500 mm focal length lens = 16.5 mm
This indicates that when a focus lens of focal length 500 mm is used, the
sample should be placed more than 16.5 mm from the laser focal point for the
sample to be ablated with defocused laser radiation.66

Optical multichannel analyser
An optical multichannel analyser (OMA) is a versatile spectrometer system that
can be configured to measure light for a wide variety of experiments. The OMA
used here (EG&G OMA III) was purpose-configured to measure ultra violet (UV)
to visible radiation on the sub-jis time scale, suitable for use in laser-induced
plasma emission spectrometry (LIPS). It is depicted in Figure 4 and consists of
an intensified photodiode array detector mounted onto the exit port of a
compact spectrometer, and several electronic units to control the operation of
the spectrometer, detector and data acquisition. The components are
summarised in Table 2 and are described below.6
IBM-typePC
printer plotter
14621461
Detector Interface 1303
1304SpectrometerController Gate Unit
Light Source
Fibre Optic
Spectrometer 1235
Intensifier
Detectordomashce.doc
Figure 4 Schematic diagram of the optical multichannel analyser (OMA) system
67

EG&G
Model Number
Description
1455B-700HQ Detector: gateable, intensified, silicon photodiode array,
photosensitive material (multi-alkali on quartz) with blue enhanced
response, 1024 pixels, >700 active pixels,
pixel dimensions 25 pm x 2.5 mm (width x height)
1235 Spectrometer: Czerny-Tuner mount, focal length 0.275 m,
aperture ratio f/3.8, entrance slit 25 pm x 18 mm,
3 grating turret fitted with two gratings
1 2 3 5 /8 6 Grating 1: ruled grating 1200 groove/mm, blaze 250 nm,
spectral window -5 0 nm, dispersion 0.07 nm/pixel
1 2 3 5 /7 2 Grating 2: holographic grating 2400 groove/mm, blaze 250-500 nm,
spectral window -2 5 nm, dispersion 0.03 nm/pixel,
effective resolution 0.20 nm
1461 Detector interface unit: electronics and microprocessor to control
detector; contains electronic cards 1462, 1303
1462 Detector interface card (in 1461)
1303 Gate pulse interface card (in 1461)
1304 Gate pulse amplifier: controls gate width, gate delay
M1235 /52 Fibre optic cable: length 2 m, bundle of 19 x 200 pm UV grade fused
silica, acceptance angle 25°
SMA input (diameter 1.2 mm)
Viglen Vig SX-20 IBM-compatible personal computer running OMA2000 software
OMA2000 Software package to control detector interface (1461)
Table 2 Components of the optical multi-channel analyser, EG&G OMA III
Spectrometer
Radiation is collected and transmitted from the light source by the fibre optic
cable to the spectrometer. The light is dispersed spectrally by the grating and
detected by the intensified photodiode array. The spectrometer has a crossed
path Czerny Turner optical layout, Figure 5. It is equipped with a choice of two
gratings of different dispersions mounted on a turret. The chosen grating is68

positioned by a microprocessor-controlled stepper motor with worm-gear drive.
This rotates the turret until the desired wavelength region covers the detector.
Selection of grating and spectral region are made through the spectrometer
control unit or the OMA2000 software.
light path
focusing mirrorentrance slit
entrance turning mirror
grating
turret
exit turning mirrorspectrom.cdr
exit portcollimating mirror
Figure 5 Diagram of the spectrometer of the optical multichannel analyser
Intensified photodiode array detector
This comprises a microchannel plate (MCP) image intensifier coupled via fibre
optics to a linear, silicon photodiode array, Figure 6. The photodiode array
(EG&G Reticon) consists of 1024 photodiodes mounted on a single integrated
circuit. This also contains electronic circuits to read each photodiode. Each
photodiode, or detector element (pixel) is a photo-sensitive area of dimensions
25 pm length by 2.5 mm width. Thus the array is 25.6 mm long by 2.5 mm wide.
It is mounted on a Peltier-effect cooler to reduce the array temperature to a
fixed level of 5 °C in order to reduce the ‘dark current’, signal resulting from
heat rather than light. The intensified detector is purged with dry nitrogen at 5
cubic feet per hour to prevent condensation and damage.69

microchannel
plate intensiferpeltier-effect
coolerphotocathode on silica w indow
phosphor
light
FRONTA
-1 kV
-200 V +5dintpda.doc
fibre optic coupled
photodiode array
Figure 6 Schematic diagram of the intensified photodiode array detector
At the front of the intensifier is a photocathode (Pk) that emits electrons when
struck by photons. These electrons are accelerated by a Pk to MCP voltage
and most enter the MCP after crossing the small distance between the Pk and
MCP. The MCP consists of a bundle of fine glass tubes which have partially
conducting walls. The electrons are accelerated by the potential difference of
-700 V between the ends of the microchannels which causes them to collide
with the microchannel walls. The microchannels act as electron multipliers and
each collision causes more electrons to be liberated. The electrons leaving the
MCP are accelerated towards a phosphor screen by a 5 kV potential difference
between the MCP and the phosphor. This causes photons to be emitted from
the phosphor which are transferred by fibre optics to the photodiode array for
detection.
70
0999999999999999999999999999^45399999999999999999999999999

The intensifier can be rapidly switched on and off, i.e. gated, because the close
proximity of the photocathode and the entrance of the MCP requires only a
small change in voltage to prevent electrons entering the MCP. It amplifies the
signal reaching the detector with a gain of up to 25000. This enables the
detector to be used with very short integration times, down to 100 ns with this
system. The intensifier is 18 mm in diameter enabling more than 700 pixels to
be active, (-730).
The photodiodes are reverse-biased so that they are, in effect, charged
capacitors. When light strikes a photodiode, electrons are freed that discharge
the capacitance. The charge is dissipated at a rate proportional to the intensity
of the light flux. This process takes place until the pixel is read by the
measuring circuits which connect each photodiode in turn to the detector’s
amplifier. This signal is measured for each pixel and these data comprise a
spectrum. As each pixel is read in turn and the time per pixel is 28 ps, the cycle
time for each scan of the array is 30 ms which includes overhead time for any
processor decisions or triggers to be made. Thus the integration time is 30 ms.
As described above, the intensifier can be rapidly switched on and off to enable
gating of the light signal. This enables the detector to be used in two ways. (1)
In the free running mode, the intensifier is always on and the array is read every
30 ms with a fixed integration time of 30 ms. This is suitable for the OMA to be
used with a light source such as an ICP or a discharge lamp. (2) In the gated
mode the intensifier acts as a high speed shutter, being turned on and off very
rapidly, to enable measurement at a precise time for a variable integration
period. Here the timing sequence is: intensifier off and array is read to clear
each pixel; after required delay, intensifier switched on for pre-set time to
integrate light signal; at the end of the integration time, the intensifier is
switched off; the array is read and the process can then be repeated. The time
delay and the integration time can be varied separately, from a minimum of
71

100 ns to several seconds. This gating and the increase in gain provided by the
intensifier are exploited in LIPS to undertake time-resolved measurements.
A disadvantage of a photodiode array fitted with an image intensifier is that the
spectral resolution of the spectrometer is degraded by the intensifier. This is
because the fibres of the fibre optic, which couple the output of the intensifier to
the photodiode array, are a different size to the individual photodiode pixels.
The widths are 10 and 25 pm, respectively. Each fibre does not exactly
illuminate a single pixel, which means that a dispersed spectral line is spread to
a larger area of the array than if an intensifier was not fitted. The effective
resolutions at full width half maximum (FWHM) are 2 and 3 pixels for non
intensified and intensified detectors, respectively, as quoted by the
manufacturer when a 25 pm wide line is focused onto the detector.6
Detector interface
The detector interface (EG&G 1461) contains electronics, a microprocessor and
electronic cards (EG&G 1462 and 1303) to control detector operation and data
acquisition. The 1462 detector interface card controls the scanning of the array
detector and the acquisition of data. The 1303 with the 1304 gate pulse
amplifier control the operation of the intensifier. Operation of the 1461 unit is
directed by the OMA2000 program running on an IBM-type personal computer
(PC). Data acquisition is described in the next section.
Laser - optical multi-channel analyser system
Overview
A schematic diagram of the integrated laser and OMA system is shown in
Figure 7, and details are given in Table 3. Laser light is delivered to the sample
by a mirror. A lens is used to focus the light from a beam diameter of 6.4 mm
down to about 100 pm on the sample surface positioned at the laser focal point.
72

A laser-induced plasma is formed at the surface of the sample and radiation is
captured and transmitted to the OMA by the fibre optic cable for time resolved
detection. Sample can be manipulated in three dimensions relative to the laser
spot using the XYZ stage. The fibre optic is positioned independently using a
second XYZ stage, 12 mm from the laser point and 1 mm above the sample
surface, as shown in Figure 7. Below are descriptions of the laser table /
sample ablation cabinet and the synchronisation of the operation of the laser
and OMA.
Reflecting mirror 45° high purity silica,
25.4 mm diameter
(Newport 10 QM 20 HM-15)
Focus lens 500 mm focal length
bi-convex, high purity fused silica
25.4 mm diameter
(Newport SBX 040 AR.18)
Ablation gas air at atmospheric pressure
Fibre optic observation position
From laser point 12 mm
Above sample surface 1 mm
Table 3 Details of optics and parameters used for laser- induced plasma emission spectrometry
73

NdrYAG laser laser light mirror
imaster
control unitfocus lens
optical multichannel analyser
XYZlaser-inducedplasma
fibre optic cable XYZ
Figure 7 Schematic of the laser - optical multi-channel analyser system used for laser- induced plasma emission spectrometry
74

Laser table and sample ablation cabinet
A steel table of welded construction was specially modified to house the laser
and sample ablation chamber, (Figure 8). The large sample chamber was 0.54
x 0.82 x 1.0 m (width x depth x height). It was purpose-designed and built to be
light-tight and accommodate a variety of laser optics and sample sizes. A steel
box with an internal baffle was provided on the side of the cabinet to facilitate
easy input of the fibre optic cable, gas pipes and wires for electric illumination.
The inside of the steel cabinet was painted matte black to minimise any
reflections of laser light and was illuminated by an electric lamp. Extraction was
provided so that any fumes produced from sample ablation were removed to
outside of the building. The large, hinged door enabled easy access to the
inside of the cabinet and all four sides of the door wrapped around the cabinet
opening to provide a light-tight seal. The laser table had legs with adjustable
feet so that the table could be levelled. The laser head was bolted onto a high
steel shelf so that laser light entered near the top of the chamber enabling a
long focal length lens to be used. The power supply was located on the floor
underneath the laser table. Laser light entered the chamber through a steel
tunnel. With the chamber door closed, the design and construction of the
chamber prevented the escape of laser radiation permitting Class 1 laser
operation. Laser safety is described in section 2.4.
A versatile mounting system for the optical components was built inside the
sample chamber. This consisted of a vertical, stainless steel mounting bar
(0.96 m high x 38 mm diameter) bolted to the base of the chamber. The laser
optics, mirror and focus lens, and a mounting for the fibre optic cable were
75

to extraction system
SIDE VIEW
sample ablation cabinetlaser light path
electric lightmounting bar mirror
laser
fibre optic mounted on XYZ stage \
lens
laser remote control unit
light trap
— sample
XYZo o o
laserpowersupply
fibre optic cable adjustable feet
cabinet
sample ablation cabinet
END VIEW
door
door handle
overlap of door and sample cabinet
Figure 8 Diagram of the laser table and sample ablation cabinet. The end view shows the overlap of door and cabinet to provide a light seal
76

independently attached to this. Each item could be moved up or down, or
rotated about the bar and clamped in any desired position. The laser mirror and
focus lens were mounted separately on modified steering units (LBS-1, Photon
Control, Cambridge) attached to clamps. The fibre optic mounting consisted of
a holder for the fibre end attached via a bracket to a micro-adjustable XYZ
stage which had 10 mm travel in each direction. This was attached to the
mounting bar via a plate and clamp. The threaded end cap (SMA fitting) of the
fibre screwed onto the hollow holder which was clamped against the XYZ
bracket by the nut to provide a secure mounting for the fibre optic, (Figure 9). A
quartz window, attached with blutak onto a plastic sleeve, protected the end of
the fibre from any ablation product. All engineering work was undertaken by
the Engineering Workshops, School of Engineering, Sheffield Hallam
University.
bracket mounted on X Y Z
plastic sleeve
fibre optic cable
threaded hollow holderblutak
fibre optic end cap
quartz w indow
nut
Figure 9 Schematic diagram of the fibre optic holder arrangement
77

Synchronisation of the laser and OMA operation
The operation of both laser and OMA systems was studied so that the firing of
the laser would be synchronised with the scanning of the photodiode array. It is
necessary to co-ordinate several events in order to have a working system. The
photodiode array needs to be scanned at the same frequency as, and in phase
with, the flashing of the laser flash lamp. The two frequencies are normally 33
and 10 Hz, respectively. In addition, the laser Q-switch needs to be opened a
set time after the start of the laser flash lamp illumination in order to fire the
laser, and has to be synchronised with the gating of the detector.
Following experiments and discussions with the respective manufacturers of
the laser and OMA, a master control unit was designed and was specially built
by EG&G, (EG&G 1310). This consists of a master pulse generator with
electronic trigger outputs to the photodiode array and laser flash lamp, and a
variable control for operation of the laser Q-switch. The master pulse generator
replaced the timing units of the laser and OMA, and the OMA detector interface
(1461) was modified to enable timing to be controlled by this external source.
The OMA and Nd:YAG laser were configured with the master control unit to
produce an integrated laser-induced plasma emission spectrometry system.
Operation of the laser and the OMA is synchronised electronically at 10 Hz
using the master control unit. This frequency of operation was selected
because it is an optimum repetition rate for operation of the Spectra Physics
laser. The unit controls the timings of the laser flash lamp and Q-switched laser
firing, and the detector gating and scanning of the detector array. The number
of detector scans / laser shots is controlled by the OMA-2000 program.
78

The timing sequence for a typical experiment is depicted in Figure 10 and is as
follows. At the start of the experiment, a trigger pulse from the master control
unit causes the photodiode array to be scanned in order to clear each pixel. A
trigger from the OMA to the master control unit tells it to fire the laser, i.e. open
the Q-switch, during the next flash of the flash lamp. A trigger pulse to the laser,
50 ms later, starts the flash lamp illumination. After the Q-switch delay, a trigger
pulse to the laser opens the Q-switch to cause the laser to fire. At the same
time, a trigger pulse to the OMA starts the delay / integration sequence. The
delay and integration times are pre-set in the OMA-2000 program. The next
pulse, 50 ms later, causes the photodiode array to be scanned, i.e. read. This
50 ms cycle time enabled the photodiode array to be read between separate
firings of the laser and allowed each individual laser-induced plasma to be
monitored. The sequence of laser firing / detector integration / detector read is
100 ms and is repeated at 10 Hz. The number of repeats is set within the OMA-
2000 program.
79

flash lam p
laser Q-switch
laser pulse
laser-inducedplasm a
O M Adetector
delay / integration
array read
tim e
1 cycle 100ms (10Hz)
50ms50ms 50ms
~200|is
QS delay
10ns
~3 j_is
30ms30ms
laomsyn1.cdr
onoff
openclose
onoff
d = delay e.g . 5 0 0 ns
i = integration e .g . 2 \is
Figure 10 Schematic of the laser - optical multichannel analyser timing sequence
80

Data acquisition
Data acquisition was controlled by proprietary software (EG&G OMA2000)
running on an IBM-compatible personal computer. The detector interface
(EG&G 1461) allows versatile data acquisition and storage through the use of
memories. An individual scan of the array, i.e. a spectrum, can be stored
separately in a memory, or multiple spectra can be accumulated into several
memories. For example, 1 spectrum in 20 memories gives a total of 20 spectra;
5 spectra in each of 40 memories provides 200 spectra in total. These values
can be tailored to a specific experiment. A maximum of 250 memories can be
used. Other parameters such as sending and receiving trigger pulses,
subtraction of blank spectra, are set by writing a simple OMA Data Acquisition
Design (DAD) routine.
In addition, there are different modes of data acquisition. In the Live mode,
spectra are displayed after every scan of the array with no automatic saving of
data. In the Accumulation mode, a pre-set number of scans are made which are
stored in the 1461 unit until the end of the experiment when data are
transmitted to the PC.
The OMA was used with the time-gating capability in two ways to address the
problem of complex, time-dependent emission from the laser-induced plasma.
(1) The OMA was used in an incremental program mode which allowed the
spectra to be time-resolved to produce an emission-wavelength-time profile of
emission from the plasma. Study of the transient signal responses within these
profiles enabled suitable values for delay and integration times to be chosen.
(2) A fixed time mode (FT) was used with these timing values such that the start
of the integration time was delayed by a set time, the delay time, to enable
rejection of the initial intense background signal, and the integration period
captured the analyte emission signal response.
81

In the OMA incremental mode, each scan of the array was stored in a separate
memory, and the integration window (100 ns) was stepped sequentially through
the lifetime of the plasma by the increment time (100 ns). Each scan was taken
from a separate laser-induced plasma. This yielded an emission-wavelength
time profile for ablation of a sample.
For the OMA fixed time programs (FT), fixed delay and integration times were
set, e.g. delay time 500 ns, integration time 1 ps. Scans were either stored in
individual memories or accumulated into a single memory. Both of the OMA
programs were used with a blank spectrum subtraction method. The laser flash
lamp and the OMA detector were both operated at 10 Hz. The laser was fired
during alternate flashes of the flash lamp only, i.e. 5 Hz, and the OMA recorded
a blank spectrum during the flash lamp cycles when the laser did not fire. Each
blank spectrum was automatically subtracted from the previous emission
spectrum to yield a net signal from the plasma. In this way, the run time for 5
laser shots was 1 s.
After a LIPS experiment, spectra could be viewed on screen using the
OMA2000 software, printed either as overlays or in a variable 3D view, and
stored on disk for later use. The data produced by both OMA programs was
manipulated as needed using separate computer routines. Individual pixels
from the 3D plots were selected and plotted against memory number (time), to
give an emission - memory number (time) response. These were then extracted
into a spreadsheet program (Microsoft Excel) to facilitate graph plotting and
statistical calculations to be made, such as signal/noise signal/background
ratios, precision, etc.
82
Procedure
Samples were generally analysed as received with no sample preparation. The
sample was mounted on the XYZ manipulator and a fresh area of material
positioned at the laser spot. The manipulator was moved in height (Z) until the
sample was at the laser focal point, 500 mm from the focusing lens. The
sample chamber door was closed. The spectrometer was set-up with the
chosen grating, i.e. grating 2, to monitor the required spectral region, e.g. 307-
332 nm. The number of detector scans / laser shots and OMA memories was
selected, e.g. 2 scans / laser shots in each of 10 OMA memories resulting in 20
scans / laser shots in total. A blank subtraction program was used so that the
experiment run time for 20 laser shots was 4 s with the laser firing at 5 Hz. The
laser flash lamp energy was set on the laser remote control unit to a suitable
value, e.g. 40 J, and the acquisition was started. The laser fired under control of
the OMA software and the master control unit, and the resulting spectra were
stored on the computer for later manipulation and printing as required.
2.3 Inductively coupled plasma emission spectrometry
Introduction
Inductively coupled plasma - atomic emission spectrometry (ICP-AES) is a
versatile chemical analysis technique, able to determine elements over a wide
range of concentrations, from trace through minor to major levels, and is well
established in laboratories world-wide.7 An ICP instrument consists of a sample
introduction system, an inductively coupled plasma emission source and a
spectrometer to analyse the light emitted by the plasma. Sample is introduced
as a liquid and a nebulizer is used to produce an aerosol that is swept into the
plasma by a flow of argon carrier gas. The ICP source (Figure 11) comprises a
torch of concentric quartz tubes and a water-cooled copper induction coil which
surrounds the top of the torch.
83

observation zone ~15 mm above top of induction coilAr plasma
copperinductioncoil
sample injector tube
coolant Ar
quartz torchplasma Ar
tepsorcr.cdr
sample aerosol
Figure 11 Diagram of the ICP source
The high temperature argon plasma (6 -10,000 K) is sustained by inductively-
coupled radio-frequency energy from the induction coil. The coolant and plasma
argon gas flows are introduced tangentially and the plasma is initiated by a
tesla coil which provides a seed of electrons. Sample aerosol is introduced
through the sample injection tube and the analyte is confined to a central axial
channel within the ICP discharge. Drying, atomisation and/or ionisation, and
excitation of the analyte takes place. Light is emitted that is characteristic in
wavelength of the analyte elements. In a conventional ICP spectrometer, the
84

emitted light is dispersed by a diffraction grating and wavelengths of interest are
detected by photo multiplier tubes (PMT). The technique benefits from several
advantages, such as, simultaneous multi-element analysis capability, wide
dynamic range, and relative freedom from inter-element interference effects.
In this study, light from the ICP is collected and transmitted by fibre optic to an
optical multichannel analyser (OMA) that utilises an intensified photodiode array
for detection. This enables simultaneous spectral monitoring over a window
approximately 25 nm wide, and offers the possibility of simultaneous multi
element analysis. Different wavelength regions can be selected by scanning the
grating of the spectrograph to the region of interest. A feature of the OMA is the
ability to store a spectrum electronically in memory. This can be used to
simultaneously remove the background signal of a previously recorded blank,
from the spectrum of a sample as it is measured.
Instrumentation
Details of the instruments and operating parameters used are given in Table 4.
The sample introduction system for normal ICP - AES is depicted Figure 12a in
which sample is continuously pumped to the nebulizer to achieve a steady state
emission signal. The sample introduction manifold for flow injection (Figure 12b)
incorporates an injection valve to inject sample into the carrier stream, distilled
water. This transports the sample to the ICP where transient signal responses
are obtained.
85

ICP Instrument Thermo Jarrell Ash ICAP 9000
Forward Power 1.1 kW
Gas Flows Plasma 0 litre minute
Coolant 15 litre minute
Nebulizer 0.4 litre minute
Carrier / Sample Flow Rate 2 ml minute-1
Observation Position 15 mm above load coil
15 mm from load coil
Detection System EG&G OMA III
Spectrometer
grating (holographic) 2400 g/mm, blaze 250-550 nm
dispersion 0.027 nm/pixel
view band 25 nm
Detector
Intensifier (0-1000 units) 500
Mode Free-running
Exposure Time 30 ms
Table 4 Details of instrumentation for ICP-AES studies
86

A r
Sample
Peristaltic
Pump
Nebuliser
(b)
Carrier
Sample
Peristaltic Injection
Pump Valve
Nebuliser
Figure 12 Schematic diagram of sample introduction system into ICP-AES with,(a) conventional, direct nebulization, (b) flow injection
87

ProcedureNormal - direct nebulisation
The fibre optic was positioned as described in Table 4 and the plasma lit and
allowed to stabilise for 30 minutes. The centre wavelength of the OMA was set.
Sample solution was introduced into the ICP and measurements made after the
solution had been in the plasma for 30 seconds. The recorded spectra were
stored on the computer and printed. Emission-time plots were obtained for
chosen pixels (wavelengths), and these data points were transferred to another
program for numerical calculations such as signal/background and precision.
Flow injection
The instrumentation and procedure is the same as above but a flow injection
valve was used to introduce sample into the ICP (Figure 12). Sample was
loaded into the loop (250 pi) of the valve, and injected into the ICP by bringing
the loop on-line. OMA measurement was started when the sample reached the
nebuliser.
Reagents
Solutions were prepared fresh from commercial stock solutions (BDH
Spectrosol Solutions, Merck Ltd., Lutterworth, Leicestershire, UK).
88

2.4 Additional instrumentation
To examine the craters produced in samples by laser ablation, two techniques
were used, scanning electron microscopy (SEM) and Talysurf surface analysis.
The SEM used was a Phillips XL40. The sample was irradiated by a beam of
electrons in a vacuum, and the collected backscattered electrons, or secondary
electrons, were used to produce a magnified image of the sample surface.
Photographs were recorded of the sample surface at different magnifications.
The Talysurf instrument was a Rank Taylor Hobson Form Talysurf 120L. A
diamond-tipped stylus traversed the sample surface and the vertical
movements of the stylus were magnified by a laser interferometric transducer
mechanism to reveal surface texture information. The radius of the stylus tip
was 2 pm and the vertical resolution was 0.020 pm. A typical profile was
recorded using 164 scans in a 1.63 mm square to produce a magnified, three
dimensional view of surface features. The data were stored and manipulated on
an IBM-compatible personal computer using proprietary software. The software
enabled the three dimensional profile to be viewed from different angles and
individual scans, such as the profile through the centre of a laser crater, to be
viewed separately. The profiles were recorded photographically direct from the
computer screen.
89

2.5 Laser Safety Warning
A Class IV high power laser has been used in this work. This classification
means that the output power is above 500 mW and it is a safety and fire
hazard. It is a pulsed Nd:YAG laser with an output wavelength of 1064 nm and
this infrared wavelength is invisible to the human eye and is therefore
extremely hazardous. Infrared radiation passes easily through the cornea of
the eye which focuses the laser light on the retina, where it can cause
instantaneous permanent damage. Diffuse and specular reflections can cause
severe eye and skin damage. The laser light must not be viewed directly and
precautions should be taken to prevent accidental exposure to both direct and
reflected beams. In addition, the laser head and power supply both contain
lethal high voltage components which are accessed if the respective covers are
removed.
Precautions
The laser is used in a laser-designated area where only authorised personnel
are allowed and a strict code of practice is followed. Access to the laser room
and laser is by key which are only issued to authorised laser users. A warning
sign is illuminated outside the room during laser operation. The room is blacked
out to prevent the escape of laser light, and bright illumination is provided to
reduce the pupil size of the eye. For all experimental work, the laser is used
with the sample chamber door closed and laser light is confined to the steel
sample cabinet. For alignment work, the laser is used in the long pulse mode
only, with the laser energy as low as possible, i.e. at the laser threshold. Eye
protection must be worn (laser goggles for 1064 nm radiation) and watches,
jewellery, etc. that may reflect the laser light must be removed. Laser light is
located with an infrared laser card. For further information about laser safety
precautions and the hazards of laser radiation, a manual such as that of Sliney
and Wolbarsht8 should be consulted.
90

2.6 References
1. Quanta-Ray DCR-II Instruction Manual, Spectra Physics, Hemel Hempstead,
Hertfordshire, UK, 1987.
2. Andrews D. L., Lasers in Chemistry, Second Edition, Springer-Verlag,
London, 1990.
3. O’Shea D. C., Callen W. R. and Rhodes W. T., Introduction to Lasers and
Their Applications, Addison-Wesley Publishing Company, London, 1977.
4. Hecht E., Optics, Addison-Wesley Publishing Company/Wokingham,
Berkshire, UK, Second Edition, 1987.
5. Optics Tutorial, Newport Catalogue, Newport Ltd., Harpenden, Hertfordshire,
UK., 1990.
6. EG&G OMA III Instruction Manuals, EG&G Instruments, Wokingham,
Berkshire, UK, 1990.
7. Montaser A., Golightly D. W., Inductively Coupled Plasmas in Analytical
Atomic Spectrometry, VCH Publishers, New York, USA, 1987.
8. Sliney D. and Wolbarsht M., Safety with Lasers and Other Optical Sources, A
Comprehensive Handbook, Plenum Press, London, 1985.
91

Chapter 3
Studies Of Laser-Induced Plasma Emission SpectrometryWith An
Optical Multichannel Analyser
92

3.1 Introduction
The aim of this work was to evaluate the performance of the optical
multichannel analyser and to investigate laser-induced plasma emission
spectrometry. The operation of the optical multichannel analyser (OMA) was
first tested and evaluated with an inductively coupled plasma (ICP) emission
source because the laser-induced plasma is transient and emission spectra are
complex. An ICP emission source was chosen because it is a well
characterised, stable emission source and is relatively easy to monitor. In
addition, emission spectra for different elements can be easily obtained over a
range of element concentrations. The basic analytical performance of the
optical multichannel analyser (OMA) was examined, and parameters studied
include spectral resolution, wavelength accuracy (ability to position the grating
to a set wavelength), and analytical performance (effect of integration time,
precision, sensitivity, limit of detection and dynamic range). In addition, special
advantages of the OMA spectrometer were demonstrated compared to a
conventional atomic emission spectrometer as used in ICP instrumentation,
such as concurrent background subtraction, and simultaneous spectrum
measurement during a transient event.
Following the ICP work, the optical multichannel analyser (OMA) was used with
a Q-switched Nd:YAG laser in laser-induced plasma emission spectrometry.
Here, the optical multichannel analyser was used to monitor the laser-induced
plasma produced by focused radiation from a Nd:YAG laser. The purpose was
to evaluate the performance of the integrated laser and OMA instrument system
and to study laser-induced plasma emission spectrometry in order to obtain
basic analytical performance data. The influence of operating parameters such
as laser energy upon laser-induced plasma emission characteristics was
examined for the ablation of copper metal. The lifetime of the plasma was
93

established for different laser energies. Performance data were obtained for the
determination of copper in aluminium alloys.
3.2 Experimental
For the inductively coupled plasma (ICP) emission studies, the optical
multichannel analyser (OMA) was used with the ICP emission source of a
Thermo Jarrell Ash instrument, as described in Chapter 2 (section 2.3). The
photodiode detector of the OMA was operated in the free-running mode with an
integration time of 30 ms. A variable number of photodiode array scans were
accumulated into an OMA memory, the number depending on the experiment.
Solutions were prepared fresh from commercial stock solutions (BDH
Spectrosol Solutions, Merck Ltd., Lutterworth, UK).
For laser-induced plasma emission spectrometry studies, the OMA was used in
an integrated laser-induced plasma emission spectrometer system. The system
consisted of a Q-switched Nd:YAG laser, an OMA and a master control unit,
and is described with details of operation in Chapter 2 (section 2.2). The blank-
spectrum subtraction method was utilised with the laser fired at 5 Hz. Different
modes of OMA operation were used. The incremental mode was used with
various time settings to study the transient signal responses from the laser-
induced plasma. Time settings were: delay time of 0 ns, integration time of
100 ns (or 1 ps), and increment time of 100 ns (or 1 ps). Fixed time (FT)
programs were also used, FTa, FTb, and FTc, with delay times of 700 ns and
integration times of 1 ps. Method FTa consisted of firing 30 laser shots at the
same spot, each shot being stored individually, i.e. 1 laser shot in each of 30
OMA memories (30 laser shots total). Method FTb accumulated 10 laser shots
into each of 30 memories, all at the same sample site (300 shots total), and
method FTc repeated FTb seven times at fresh site each time (2100 shots
total). The run times for FTa, FTb and FTc were 6, 60 and 420 s, respectively,
94

with a further 25 s required for sample manipulation for method FTc. Laser
energy (laser flash lamp energy, LFLE) was varied for some experiments.
The materials examined were copper metal (BDH Analar, Merck Ltd.,
Lutterworth, UK), pure aluminium metal (BAS BCS198e, Bureau of Analysed
Standards, Newham Hall, Newby, Cleveland, UK), and a range of aluminium
alloy standards (BAS SS502, SS503, SS506, Bureau of Analysed Standards)
containing various amounts of copper (0.001 to 0.40 % m/m Cu).
3.3 Results and Discussion
3.3.1 Inductively coupled plasma emission spectrometry
Emission spectra for the 307 - 332 nm spectral region recorded with the OMA
are shown in Figure 1 for distilled water and a copper solution (10 mg M). This
region was monitored because it encompasses two strong emission lines for
copper (324.754 and 327.396 nm). An increase in intensity can be seen for the
background spectrum due to the continuum emission from the ICP source. The
two regions of low intensity at either side of the spectra correspond to the pixel
regions which are not intensified. Of the 1024 pixels of the photodiode array,
the central 720 pixels are intensified. The effective resolution of the OMA
spectrometer was calculated to be 0.20 nm at full width half height from the
spectrum for copper solution depicted in Figure 1.
95

60000Cu 324.7 nm
Cu 327.4 nm
<5 30000
background 325.8 nm
10 mg/l Cu solution
j unintensified | pixel region
unintensified pixel region
distilled water0
icp031tb.xls.c1
Wavelength 307 - 332 nm
Figure 1 Overlay of spectra for copper solution (10 mg M) and distilled water from ICP emission spectrometry recorded with the OMA. The integration time for each spectrum was 6 s (20 scans of the photodiode array into each OMA memory).
The effect of integration time upon performance was examined. Spectra were
recorded for distilled water and a solution of copper (10 mg M) using a range of
integration times from 0.3 to 30 s. To change the integration time, the number
of scans of the photodiode array accumulated into an OMA memory was varied.
Ten OMA memories were used for each experiment. The emission intensity for
copper 324.7 nm was measured for each memory and the data are shown,
together with the integration times, in Table 1. Precision (% relative standard
deviation, % RSD) did not vary significantly with integration time for either the
distilled water or the copper solution. The signal/noise ratio increased with
integration time as would be expected. The signal/background ratio,
approximately 6.3, was very similar for each integration time. The values for
precision are similar to those of the Jarrell Ash ICP spectrometer and those
96

reported in the literature for the ICP technique.1 Data indicate, therefore, that
the OMA spectrometer is capable of achieving good levels of precision.
Total integration time (s) 0.3 3 6 15 30
No. of photodiode array
scans per OMA memory1 10 20 50 100
Integration time of each
OMA memory (s)0.03 0.3 0.6 1.5 3.0
Mean signal distilled water 459.6 4601 9200 23010 45701
(counts) 1 0 m g l'1 Cu 2895 29064 57724 143500 288100
% RSD distilled water 0.68 0.37 0.18 0.17 0.28
10 mg I'1 Cu 0.40 0.54 0.54 0.37 0.50
S/N ratio 1 0 m g l - 1 Cu 4244 78551 318919 829480 1018021
S = Cu 324.7 nm N = % RSD of Cu 324.7 nm measured with distilled water
Table 1 Effect of integration time upon analytical performance for the OMA monitoring an ICP emission source
The wavelength accuracy was tested by measuring the emission intensity of
copper 324.7 nm after the grating had been driven from centre wavelength
700 nm to 320 nm. This was repeated ten times. Each measurement had an
integration time of 6 s (20 photodiode array scans into 1 OMA memory). The
spectra were examined and the copper 324.7 nm emission line was found to be
at the same pixel number on the photodiode array each time (pixel 684). The
precision was slightly worse, 0.9 % RSD, compared to the same measurements
when the grating was fixed at centre wavelength 320 nm, 0.5 % RSD. The data
indicate that the grating drive mechanism is reproducible in operation to within
97

1 pixel (± 0.024 nm), which is the manufacturer's spectrometer specification. It
is recommended, however, that the pixel positions of analyte emission lines
should be confirmed for each spectrum following movement of the grating.
Analytical performance data are shown in Table 2 for copper, cadmium and
lead. Copper signals were recorded with the 307 - 332 nm spectral region as
above, and the spectral region 216 - 242 was used to monitor cadmium and
lead signal responses.
element Cu I Cd I Pb II
emission wavelength (nm) 324.754 228.802 220.353
limit of detection (mg I-1)
(3ct, distilled water)0.017 0.011 0.135
signal / background
(10 mg l“1)6.45 2.67 1.06
% RSD 0.57 0.43 0.51
I neutral atom emission line II singly ionised atom emission line
n = 10 for statistical calculations
Table 2 Analytical data for the OMA monitoring the ICP emission source. The integration time was 6 s (20 scans of the photodiode array into each OMA memory).
The emission lines for copper and cadmium are relatively sensitive compared to
lead, and therefore have lower limits of detection than lead. The % RSDs are
similar to those obtained by the spectrometer of the Jarrell Ash ICP instrument
(0.6 % RSD for similar integration times), but limits of detection and signal
/background ratios are poorer; the limit of detection for copper was 0.005 mg M
and the signal/background ratio was 51 (10 mg M). The performance of the
OMA might be improved by varying the fibre optic observation position.
98

Results obtained here are similar to those reported by Furuta at al 2 (1980) who
utilised a silicon intensified target image detector.
The dynamic range of the OMA photodiode array detector was studied by
aspirating solutions that had a wide range of concentrations (Cu, Cd and Pb,
0.1 to 100 mg h1). A typical calibration graph of emission intensity versus
concentration of cadmium is shown in Figure 2. Linear plots were obtained over
3 to 4 orders of magnitude, indicating that the photodiode array detector has
the potential to exploit the wide dynamic range of the ICP source. Dynamic
range is limited compared to that of a photomultiplier tube because of the image
intensifier fitted to this photodiode array. This could be shown with further study
using solutions that cover a wider range of concentration than used here.
- OcDgO)0(O001CMOCOCOCMCMTJO&tf>ca>cD)O
icpcu01.xls
100100.1 1log Concentration (Cd mg/l)
Figure 2 Plot of log emission intensity versus log concentration of cadmium for the OMA monitoring the ICP emission source. The integration time was 6 s (20 scans of the photodiode array into each OMA memory).
99

The background subtraction capability of the OMA photodiode array detector is
depicted in Figure 3 with spectra for copper solution (10 mg M) with, and
without, the background signal. For the subtracted spectrum, a spectrum of
distilled water was recorded first and this was simultaneously subtracted from
the copper solution spectrum when it was recorded. The spectrum resulting
from the background subtraction technique is clearly much simpler. With further
work, this subtraction technique could be used to simplify complex spectra from
sample solutions containing a strong matrix, such as digested steels, serum
samples, etc. A spectrum for a matrix blank solution would be recorded first,
and this used to correct the spectrum for the sample solution.
60000 Cu 324.7 nm
Cu 327.4 nm
30000 Cu solution (10 mg/l) with background spectrum
background 325.8 nm
Cu solution (10 mg/l) with background spectrum subtracted
0
Wavelength 307 - 332 nm
Figure 3 Overlay of spectra for copper solution (10 mg M) with background spectrum (upper spectrum) and with the background spectrum subtracted (lower spectrum). The spectra were recorded with the OMA monitoring the ICP emission source, and the integration time for each spectrum was 6 s (20 scans of the photodiode array into each OMA memory).
100

The OMA was used to monitor transient signals of the ICP source resulting
from the introduction of sample solutions by a flow injection technique. Instead
of continuous nebulization of sample solution to achieve a steady state, as
used above, small, discrete sample volumes are introduced into the ICP source
using an injection valve. An emission-wavelength-time response for the
introduction of a copper solution (10 mg I-1) is depicted in Figure 4a. The
sample volume was 250 pi and the flow rate was 1 ml minute-1. Transient
emission responses for copper are observed. The spectral background is
monitored simultaneously, together with other emission lines within this spectral
region 307 - 332 nm. Spectra for a repeat injection with background subtraction
are shown in Figure 4b. Here, spectra were first recorded for a blank injection of
distilled water, and these were subtracted from the spectra for the subsequent
injection of copper solution. The responses in Figure 4b are clearer and simpler
than those of Figure 4a without background subtraction. The technique could
be advantageous in more complex flow injection applications, such as samples
with organic matrices, e.g. oils, blood serums and organic solvents that cause
signal depression in the ICP source, because any background shifts can be
simultaneously monitored with the analyte signals and such shifts can be easily
corrected.
The technique of using an OMA spectrometer with photodiode array detection
to monitor transient signals from an ICP source is advantageous over a
conventional ICP spectrometer because the conventional spectrometer uses
photomultiplier tube detectors for single element wavelength detection.
Simultaneous background measurement is not normally possible. This
photodiode array detection technique could also be very useful to record
signals when other sample introduction devices are used, such as laser
ablation, electro-thermal atomisation, hydride generation.
101

wc3oooooo"M-io&Uic(Dcco
'</)(OELU
Cu 324.7 nm
Cu 327.4 nm
Wavelength 307 - 332 nm c1fg4c&
Figure 4 Emission-wavelength-time responses for the introduction of copper
solution (10 mg M) into the ICP source with flow injection: (a) with the
background signal present, (b) with the background signal subtracted.
102

3.3.2 Laser-induced plasma emission spectrometry
Studies of the laser-induced plasma
Previous work established the performance of the optical multichannel analyser
with a well characterised and stable emission source, an inductively coupled
plasma emission source (section 3.3.1). Here, the optical multichannel analyser
is used to monitor a transient laser-induced plasma produced by the focused
radiation from a Q-switched Nd:YAG laser. A sample of copper metal was
ablated at the laser focal point with laser flash lamp energy (LFLE) 40 J,
(irradiance ~8 x 10¹⁰ W cnrr2). The OMA incremental mode was used to enable
spectra to be time-resolved so that the transient signals from the plasma could
be studied. There were 30 OMA memories with 1 laser shot in each memory.
The increment time after each memory was 100 ns and so the total time was
2.9 ps. Copper metal was examined because copper has a relatively simple
emission spectrum and is available in relatively high purity at low cost.
An emission-wavelength-time response for the ablation of copper metal is
depicted in Figure 5, spectral overlays are shown in Figure 6, and an emission
time response for selected wavelengths is depicted in Figure 7. The figures
show that initially the emission spectrum is dominated by a very intense
background continuum from the plasma, and only a broad continuum is visible
near the two copper emission lines (Cu 324.754 and 327.396 nm). This
indicates that the plasma temperature is very high, of the order 1.5 to 3.0 x
104 K.3'4 At time 300 ns, broad copper emission lines are evident
superimposed on the intense background continuum. These lines are shifted to
the red by about 0.07 nm (Figure 6b). The background has reduced
considerably by time 400 ns because plasma temperature has decreased,
caused by sample material entering the plasma.
103

g Emission Intensity 0 - 800 (counts)Q)<CD
Figure 5 Emission-wavelength-time response for the ablation of f
copper metal with laser flash lamp energy 40 J using the OMA incrementalprogram (increment time 100 ns, integration time 100 ns).
104

(a)
Cu 324.754 nm800Cu 327.396 nm
£ 400
UJ
(b)
&w
coww£
UJ
Time (ns)
---------- - 200
---------- - 300
- 400
500
- 600
900
Wavelength 307 - 332 nm
Cu 324.754 nm Cu 327.396 nm800Time (ns)
200
300
400
400
9000
Wavelength 312.6 - 326.5 nm
Figure 6 Emission spectra for the ablation of copper metal with laser flash lamp energy 40 J using the OMA incremental method (integration time 100 ns, increment time 100 ns). The spectra are for the times shown and the wavelength regions are: (a) 307 - 332 nm, (b) 312.6 - 326.5 nm, a magnified portion of (a).
105

After time 400 ns, the background intensity continues to decrease and line
widths become narrower as the plasma temperature decreases. The amount of
emission line shift to the red also reduces with time as the plasma temperature
decreases. By time 900 ns, the lines have ceased to be red shifted, the
background response is minimal and element emission responses are
dominant.
The emission-time response (Figure 7) shows the rapid decrease in
background intensity after time 300 ns. Element emission signals are clearly
seen after time 400 ns. They continue to be observed as they decrease slowly
until the plasma has extinguished at about 35 ps. The plasma lifetime
(examined below) is relatively long-lived compared to the laser pulse width
(10 ns).
800 y
Cu 327.4
Background 325.8
Cu 324.7
<i5 400
02.521.510 0.5
Time (us)
Figure 7 Emission-time response for the ablation of copper metal with laserflash lamp energy 40 J using the OMA incremental method (integration time100 ns, increment time 100 ns, total 2.9 ps).
106

Useful analytical data can be obtained by resolving the analyte emission signals
in time from the initial, intense background continuum. This can be achieved
using an OMA fixed time program with suitable time settings. A delay time of
700 ns would minimise background contributions as the background has
reduced considerably by then, and an integration time of about 1 ps is
appropriate to measure analyte emission responses.
The peak broadening and line shifts at early times are due to pressure
broadening effects, and suggest very high plasma temperatures, pressures and
electron densities. Scott and Strasheim5 have previously reported red line shifts
(-0.16 nm) and line broadening for the ablation of aluminium which they
attributed to pressure effects. Niemax and Sdorra,3 and Kim6 have also
reported line broadening due to pressure broadening effects (Stark
broadening). Pressure broadening (Stark broadening) is due to perturbation of
the emitting species by charged particles in the laser-induced plasma.7
The experiment was repeated with the maximum laser energy available (LFLE
70 J, irradiance -3.1 x 10¹¹ W cnr2). An emission-wavelength-time response is
shown in Figure 8, spectra overlays in Figure 9, and an emission-time response
in Figure 10. Compared to ablation with LFLE 40 J (Figures 5 and 6), emission
signals are greater (-7000 vs. -800) and line shifts are larger (-0.12 vs.
0.07 nm) suggesting that the laser-induced plasma is more intense and has a
higher initial temperature, (1.5 to 3.0 x 10⁴ K). The plasma also has a longer
lifetime compared to LFLE 40 J ablation, (-80 ps vs. -35 ps). The temperature
of the plasma for the ablation of different materials with different laser energies
could be estimated from spectrometric measurement at selected times of the
plasma lifetime. Niemax3 measured the relative intensities of four copper lines
to obtain temperature measurements for the ablation of copper, but this would
require a more detailed study of other spectral regions than is reported here.
107

It can be seen from the comparison of ablation with LFLE 40 and 70 J that the
copper signals are more intense for the higher laser energy. However, signal
/background ratios (Cu 324.7/background 325.8 nm) were higher for LFLE 40 J
than for 70 J as the background intensities were greater for the higher laser
energy. For example, signal/background ratios for LFLE 40 and 70 J were 19.1
and 8.3 at time 1 ps, and 31.3 and 18.8 at time 2 ps, respectively,
suggesting that high laser energy may not be required to obtain the most
sensitive analyte emission responses.
The different time behaviours of the copper and background signals for ablation
with LFLE 40 and 70 J suggest that a longer detector delay time may be
required for LFLE 70 J in order to minimise the effect of the background signal
and optimise analytical performance, e.g. 1.5 ps instead of 700 ns.
108

Wavelength
307 - 332
nm
Emission Intensity 0 - 7000 (counts)
Figure 8 Emission-wavelength-time response for the ablation of coppermetal with laser flash lamp energy 70 J using the OMA incremental program(increment time 100 ns, integration time 100 ns).
a Cu
324.754 nm

(a)
7000
Z5O5
3500
inc38t6.xls.c4
Wavelength 307 - 332 nm
Time (ns)
(b)
7000 tTime (ns)
200
3500 -L
co'(/)i f )
ELLl
mc38t6.xls.c5
Wavelength 312.6 - 326.5 nm
Figure 9 Emission spectra for the ablation of copper metal with laser flash lamp energy 70 J using the OMA incremental method (integration time 100 ns, increment time 100 ns). The spectra are for the times shown and the wavelength regions are: (a) 307 - 332 nm, (b) 312.6 - 326.5 nm, a magnified portion of (a).
Cu 324.754 nmCu 327.396 nm
110

6400
Cu 327.4
Background 325.8 j
Cu 324.7
&S 3200ccowC/D
ELU
2.51.5 210 0.5Time (us)
Figure 10 Emission-time response for the ablation of copper metal with laser flash lamp energy 70 J using the OMA incremental method (integration time 100 ns, increment time 100 ns, total 2.9 ps).
The plasma lifetime for ablation with different laser energies (LFLE 40 and 70 J)
was estimated using an OMA incremental program. The time settings used
were increment time of 1 ps and integration time of 1 ps with 100 memories to
enable a total measurement time of 99 ps. Emission-wavelength-time
responses are depicted in Figures 11 and 12 for ablation with LFLE 40 and
70 J, respectively.
111

Emission Intensity 0 - 700 (counts)
I<CDCD13<Q
0303ro
CTcr
COrocoCDo>
O
CO
Figure 11 Emission-wavelength-time response for the ablation of copper metalwith laser flash lamp energy 40J using the incremental program (increment time1 ps, integration time 1 ps) to estimate the lifetime of the plasma.
1 1 2

Emission Intensity 0 - 7000 (counts)
0)<CDCDZJCQzrCOo
COCOro
toroCOCD
O
CO
Figure 12 Emission-wavelength-time response for the ablation of copper metal with LFLE 70J using the incremental program (increment time 1 ps, integration time 1 ps) to estimate the lifetime of the plasma.
113

These show that element emission responses for both copper lines became
indistinguishable from the background at about 37 and 80 ps for LFLE 40 and
70 J, respectively, indicating that the plasma had extinguished by these times.
Emission intensities for both copper lines were less than 5 counts. Examination
of the spectra for both ablations at time 99 ps confirms that there are no
element emission responses (Figure 13).
(a) 30
20
10
0
-10
Wavelength 307 - 330 nm
(b)
10
0
-10
Wavelength 307 - 330 nm
Figure 13 Spectra at time 99 ps for the ablation of copper metal recorded with the OMA incremental program (increment time 1 ps, integration time 1 ps) using laser flash lamp energy: (a) 40 J, (b) 70 J.
114

The lifetime of the plasma produced by ablation with LFLE 55 J was -44 ps, a
value between those for LFLE 40 and 70 J, i.e. increased laser energy
lengthens the plasma lifetime. Kim5 reported plasma lifetimes ranging from
300 ns to 40 ps depending on operating parameters such as laser energy and
ablation gas and pressure. Sneddon et al8 reported plasma lifetimes of
100 ps for the ablation of copper, zinc, iron and nickel targets with an excimer
laser (ArF 193 nm). The published values are comparable to those obtained
here. It is noted that with the laser firing at 5 Hz, as in these experiments, the
time interval between laser shots is 200 ms. The plasma is therefore
extinguished for approximately 199.9 ms prior to the next laser shot, (plasma
lifetime -0.1 ms).
Analytical performance
The effect of operating parameters upon analytical performance was examined
for the ablation of copper metal. An OMA fixed time program (FTa), consisting
of 30 memories with 1 laser shot in each memory, was used (delay time 700 ns,
integration time 1 ps) with LFLE 40 J. The observation position for the end of
the fibre optic was varied and it was found that increased signal/background
(S/B) and signal/noise (S/N) ratios were obtained with the fibre positioned 1-2
mm above the sample surface and in direct line with the laser spot. The sample
was placed at different positions relative to the laser focal point and increased
S/B and S/N were obtained with the sample positioned at the laser focal point.
The effect of repetitive laser firing at a sample site upon performance was
considered using three fixed time programs, FTa (1 laser shot in each of 30
memories, 30 shots total), FTb (10 laser shots in each of 30 memories, 300
total), and FTc (method FTb was repeated 7 times at a fresh site each time to
give 2100 shots in total). Data for each method are given in Table 3.
115

These data indicate that precision (relative standard deviation, RSD) and S/N
ratio improve with the number of laser shots used for measurement. The S/B
ratio was reduced, however, with a larger number of laser shots. Emission-time
profiles showed that this was because the background signal increased with
time, i.e. with the number of laser shots. This effect might be minimised by
increasing the delay time. The results suggest that precision is improved by
accumulating a large number of laser shots, e.g. from 17.1 (30 shots) to 3.8
(2100 shots), (% RSD, Cu 324.7 nm). Precision was further improved to 0.6
(% RSD) when a ratio of the two copper lines was taken, suggesting that the
use of an appropriate internal standard is beneficial. The precision data are
comparable to those reported by other workers, for example, Cremers and
Romero9 obtained % RSD values between 0.4 and 14 for various elements in
steel using iron signals from the steel matrix as internal standard. Niemax et
al10 achieved precision of 6 % RSD for silicon and chromium in steel, which
was improved to 2.4 when an iron signal was used as internal standard.
116

Method n mem
shots
/mem
total
shots Cu 324.7
% RSD
Cu 327.4 Cu 324.7
/Cu 327.4
S/B S/N
FTa 30 30 1 30 17.1 18.6 1.7 17.7 183
FTb 30 30 10 300 10.2 12.2 2.7 11.7 2424
FTc 7 210 10 2100 3.8 3.5 0.6 11.9 18613
shots = number of laser shots n = number for statistical calculation
mem = number of OMA memories used S = Signal (Cu 324.7 nm)
B = Background (325.8 nm) N = RSD of Background response
Table 3 Data for copper metal from laser-induced plasma emission spectrometry. Different OMA fixed time programs were used.
In order to quantify the effect that time resolved measurement has upon
performance, copper metal was ablated with an OMA fixed time program using
different delay times. With time resolution, the delay time was 700 ns, and with
no time resolution, the time delay was 0 ns. An OMA program (FTa) was used
to record 30 laser shots, each into a separate memory. The integration time
was 1 ps for both, and the laser flash lamp energy was 40 J. A typical spectrum
from each experiment is shown in Figure 14. The spectrum recorded with time
resolution (delay time of 700 ns) has minimal spectral background and sharp,
intense emission peaks for the two copper lines. Conversely, the spectrum
recorded with no time resolution (delay time 0 ns) has an intense spectral
background and broader copper emission lines. Although the copper lines are
as intense as those recorded with time resolution, the signal/background ratio
was considerably worse because of the intense background signal. The
117

signal/background ratios (Cu 324.7 / background 325.8) were 15.4 and 2.5 for
time resolved measurement and no time resolution, respectively. This clearly
shows the increase in sensitivity that is achieved by the use of time resolved
detection in laser-induced plasma emission spectrometry.
1000 - Cu 324.7 nm
Cu 327.4 nm
500
delay time 0 ns
delay time 700 ns
0
Wavelength 307 - 332 nm
Figure 14 Spectra for the ablation of copper metal with laser flash lamp energy 40 J and an OMA fixed time program (FTa), 1 laser shot into each memory. The upper spectrum was recorded with no time resolution (delay time 0 ns), and the lower spectrum recorded with time resolution (time delay 700 ns). The integration time for both spectra was 1 ps.
These copper spectra can be compared to that obtained for copper solution
from the inductively coupled plasma (ICP) emission source (Figure 1). The
emission lines of the ICP source spectrum are considerably narrower and the
baseline is simpler compared to the laser-induced plasma spectra. The
differences are due to the higher temperatures and more complex interaction
processes of the laser-induced plasma. In addition, the laser-induced plasma is
in air and these gases may contribute to the spectra, whereas the ICP emission
118

source is an argon plasma, which has a relatively simple emission spectrum,
and the emitting species are effectively shielded from air.
To study the quantitative analysis capability of the technique, a range of
aluminium alloy standards was examined for copper content, (Table 4). The
samples were ablated with LFLE 70 J and data acquired with a fixed time OMA
program, FTb (10 laser shots in each of 30 memories at same site, 300 shots
total). The spectral region 307 - 332 nm was monitored. A spectrum for the
ablation of BAS SS 502 is shown in Figure 15 in which emission lines for
aluminium and copper are clearly seen.
Standard Cu Concentration (% m/m)
pure Al BCS198e 0.00
BAS SS 506 0.03
BAS SS 503 0.11
BAS SS 502 0.40
Table 4 Copper content of aluminium metal and a range of aluminium alloys
The two aluminium emission lines are not fully resolved and there is a small
background shift seen across the spectrum, (Figure 15). The use of a longer
time delay might reduce the background intensity and enable the aluminium
lines to be resolved.
Calibrations for copper 324.7 nm and copper 324.7 ratioed to aluminium
309.2 nm were both linear, although the ratioed values provided a better fit
when the value for the blank was omitted, (Figure 16). The line equations and
correlation coefficients were: y = 12049x + 5353, 0.9632 (Cu 324.7), and
y = 122x + 53.3, 0.9989 (Cu 324.7 / Al 309.2), respectively.
119

100000
Al 309.271 nm
308.215 nm
50000
background 325.8 nm
Cu 327.4 nm
Cu 324.7 nm
0
Wavelength 307 - 332 nm
Figure 15 Emission spectrum for aluminium alloy containing copper 0.40 % m/m (BAS SS 502). Sample was ablated with laser flash lamp energy 70 J and data were acquired with fixed time OMA program FTb, (delay time 700 ns, integration time 1 ps).
25000 -1
§ 20000 -
<L> Cu324.7 / Al 309.2 *200
>. 15000 - 'Iod<L>c 10000 - Cu324.7
ao‘ g oq"ELU
5000 -<r
0.400.16 0.320.00 0.240.08
Cu Concentration (% m/m)
Figure 16 Calibration plot for copper in aluminium alloy. Samples were ablated with LFLE 70 J and data were acquired with OMA fixed time program FTb. The samples are listed in Table 4. The values for the copper/aluminium plot were multiplied by 200 in order to obtain both graphs on the same scale.
120

The limit of detection for copper was estimated to be 0.010 % m/m based on 3a
(measurement of pure aluminium standard). The calibration shows that
emission signals are representative of the samples ablated and that
quantification is possible when suitable standard reference materials are
available. Precision of 5.3 % RSD was obtained for copper 324.7 nm (n=30),
and this was improved to 3.0 % when the copper was ratioed to the aluminium
309.2 nm emission signal. The values are better than those obtained by Scott
and Strasheim (1970),5 who obtained values of between 5-8 % RSD for copper
in aluminium alloy, and comparable to those reported by Niemax et al (1989)10
for the determination of chromium and silicon in steel. Niemax10 achieved
better limits of detection than here, 0.003 % m/m (3a), by using an argon buffer
gas at reduced pressure. The performance achieved here, however, is
appropriate for process monitoring and industrial applications such as the rapid
sorting of alloy types.
3.4 Conclusions and Recommendations for Further Work
An optical multichannel analyser with a photodiode array detector has been
successfully used to monitor an ICP emission source. Analytical performance
was comparable to a conventional ICP spectrometer although sensitivity was
lower. Sensitivity could probably be improved by optimising the fibre optic
observation position relative to the ICP discharge. Spectral resolution was
about an order of magnitude lower than that of a conventional ICP
spectrometer because of the compact size of the OMA spectrometer and the
intensifier. The wavelength accuracy of the optical multichannel analyser
spectrometer was found to be reproducible in positioning the grating to a
selected wavelength region.
121

The integrated laser and OMA system was found to operate satisfactorily, and it
was possible for the spectrometer to discreetly monitor the laser-induced
plasma from each laser shot. The versatility of the OMA data acquisition modes
indicates that the system is appropriate to investigate new applications. Study
of the laser ablation of copper metal showed that sensitivity was considerably
improved when time resolved measurement of the laser-induced plasma was
used. For the ablation of copper metal, the signal/background ratio (Cu 324.7
/background 325.8) was 6.2 times larger for measurement with time resolution
than measurement without. Increasing the laser energy was found to increase
the intensity of the initial background continuum and increase the lifetime of the
laser-induced plasma. Analytical performance was established for the ablation
of copper metal and copper in aluminium alloy. It was found that a larger
number of laser shots (2100 vs. 30) improved precision (17.1 vs. 3.8 % relative
standard deviation, RSD). Performance was comparable to other published
studies.5-9-10 The limit of detection for copper in aluminium alloy was 0.010 %
m/m. The use of an internal standard for the determination of copper in
aluminium alloy also improved the performance (5.3 vs. 3.0 % RSD), and
provided a calibration graph of improved linearity.
Comparing the performance of the OMA with the ICP emission source and the
laser-induced plasma source, precision and sensitivity (signal/background ratio)
were better with the ICP source, as expected. Values for precision were 0.5 %
RSD for the ICP source (10 mg M Cu solution, Cu 324.7 nm) and 3.5 % RSD
for the laser-induced plasma (pure copper metal, Cu 324.7 nm). The
signal/background ratio was 6.3 for the OMA monitoring the ICP source (10
mg I-1 Cu 324.7 nm / distilled water 324.7 nm), compared to 11.9 for the OMA
with the laser-induced plasma source (pure copper metal, Cu 324.7 nm /
background 325.8 nm). The signal for the ICP was only for a dilute solution
whereas the signal for the laser-induced plasma source was for pure metal.
122

These results show that the OMA can achieve good levels of precision with a
relatively precise emission source, and that the relatively poor precision
obtained with the laser-induced plasma emission source can probably be
attributed to complex laser ablation processes.
123

3.5 References
1. Thompson M., in Inductively Coupled Plasmas in Analytical Spectrometry,
Montasser A. and Golightly D. W., Editors, VCH Publishers, New York,
1987, pp 163-199.
2. Furuta N., McLeod C. W., Haraguchi H. and Fuwa K., Applied
Spectroscopy, 1980, 34 (2), 211-216. Evaluation Of A Silicon-Intensified
Target Image Detector For Inductively Coupled Plasma Emission
Spectrometer.
3. Niemax K. and Sdorra W., Mikrochimica Acta, 1992, 107, 319-327. Basic
Investigations for Laser Microanalysis III: Application Of Different Buffer
Gases For Laser-Produced Plumes.
4. Moenke-Blankenburg L., Laser Micro Analysis, Wiley, New York, 1989.
5. Scott R. H. and Strasheim A., Spectrochimica Acta, 1970, 25B, 311-332.
Laser Induced Plasmas For Analytical Spectroscopy.
6. Kim Y. W., in Laser-Induced Plasmas and Applications, Cremers D. A. and
Radziemski L. J., Editors, Marcel Dekker, New York, 1989, p327-346.
7. Miller M., in Inductively Coupled Plasmas in Analytical Spectrometry,
Montasser A. and Golightly D. W., Editors, VCH Publishers, New York,
1987, pp 17-65.
8. Sneddon J., Hwang Z. W., Teng Y. Y. and Li K. P., Analytical Letters, 1992,
25 (11), 2143-56. Studies Of Space And Time Resolved Emission
Measurements Of An ArF Excimer Laser Ablated Plasma.
9. Cremers D. A., SPIE 1986, 644, Remote Sensing, 7-12. An Evaluation Of
Factors Affecting The Analysis Of Metals Using Laser-Induced Breakdown
Spectroscopy.
10. Niemax K., Leis F., Sdorra W. and Ko J. B., Mikrochimica Acta, 1989, 2,
185-199. Basic Investigation For Laser Micro Analysis: 1. Optical Emission
Spectrometry of Laser-Produced Sample Plumes
124

Chapter 4
Survey Analysis of Polymeric Materials
125

4.1 Introduction
Polymeric materials generally contain a wide variety of additives which are used
to give specific properties to the material.1 These include, pigments for colour
(e.g. white Ti02), fillers (e.g. CaC03), stabilisers (e.g. Zn, Pb, Ba), flame-
retarding agents (e.g. Sb, P), smoke suppressants (e.g. Zn), etc. These
inorganic components vary in concentration from trace (jig/g) to minor (%)
levels. Samples can be in different forms such as granular, extruded shape, or
sheet of different thicknesses (mm to several cm).
Analytical techniques currently in use for such analyses include solution-based
atomic spectrometric methods2-3 which require time-consuming dissolution of
sample and X-ray fluorescence spectrometry. For example, Belarra et al2
digested samples of poly (vinyl chloride) (PVC) by heating sample material
(0.1 g) first in concentrated sulphuric acid, and then in hydrogen peroxide
solution. Concentrated ammonia solution and EDTA solution were added to
the cooled solution to dissolve the precipitate. Calcium, aluminium and
antimony were determined by atomic absorption spectrometry. Precision varied
from to 6.9 to 1.1 % RSD and recoveries were within the range 93 to 103 %
m/m. Sample preparation took about 1 hour. DiPasquale et al3 determined
sulphur in polymeric materials by inductively coupled plasma emission
spectrometry following sample dissolution, and obtained RSD values of less
than 2 %.
Energy dispersive X-ray fluorescence spectrometry was used by Warren et al4
to measure calcium, silicon and strontium in nylon samples, and calcium,
titanium lead, barium and cadmium in PVC materials. Analysis time was much
faster than the techniques above that required sample dissolution, 100 s vs.
about 1 hour. Limits of detection were of the order 1 % m/m, and precision
126

varied from 0.5 to 10 % RSD depending on element and sample type. Samples
were placed in a 30 mm diameter cup for analysis, either as nylon granules,
or by cutting PVC sheet to size. Sample homogeneity was found to influence
analytical performance because X-ray fluorescence signals originated from
different depths of the sample depending on the element measured. For
example, the critical depth (depth beyond which no significant radiation
emerges) for silicon was 0.05 mm compared to 17.1 mm for strontium. The
authors concluded that performance was suitable for off-line monitoring of the
composition of polymeric materials in the plastics industry.
An alternative technique is direct spectrochemical analysis by laser ablation,
either by direct spectral measurement of the laser-induced plasma (laser-
induced plasma emission spectrometry), or by coupling to an another analytical
technique. For example, laser ablation with inductively coupled plasma (ICP) -
atomic emission spectrometry has been used for the survey analysis of liquid
paints and polymeric materials in sheet form.5 In situ micro-sampling and rapid
elemental monitoring capabilities were demonstrated for a range of elements
including aluminium, chromium, lead and titanium. Measurement times were
typically 30 s. Laser ablation with ICP - mass spectrometry was applied to the
determination of trace elements (Al, Si, P, Co, Zn, Sb) in plastic materials by
Marshall et al.6 Higher sensitivity than X-ray fluorescence spectrometry was
demonstrated with limits of detection at the pg g_1 level, but precision was
significantly worse, ~10 % RSD. Quantitative analysis was limited in most of the
above studies because of the absence of suitable standards and certified
reference materials.
This study has examined the application of laser-induced plasma emission
spectrometry to the rapid survey analysis of poly (vinyl chloride) (PVC)
samples. Potential advantages of the technique include in situ measurement of
127

analyte and rapid measurement times. The small area sampled by the laser
may enable samples to be tested for homogeneity of inorganic additives, and
bulk analysis may be possible by ablating several sites of the sample material.
The twelve elements selected to be monitored, (Al, Ba, Ca, Cu, Fe, Mg, Pb, P,
Sb, Sn, Ti, Zn) are used in various chemical forms in polymeric materials. The
effects of key operating parameters, (laser energy and sample position relative
to the laser focal point) upon analytical performance (signal/background ratio)
are characterised for antimony and calcium, and performance data for the
determination of antimony, zinc and calcium in PVC samples are obtained. Part
of this study has been published.7
4.2 Experimental
The laser-induced plasma emission spectrometry system was used as
described in Chapter 2, with the blank-spectrum subtraction method and the
laser fired at 5 Hz. The incremental mode of optical multichannel analyser
(OMA) operation was used with time settings of zero delay time, increment time
of 100 ns and an integration time of 100 ns. Two fixed time (FT) programs were
also used, FT1 and FT2, with a 500 ns delay time, and a 1 ps integration time.
Method FT1 consisted of firing 30 laser shots at the same spot, the emission
spectrum from each shot being stored individually, i.e. 1 laser shot in each of 30
OMA memories (30 shots total). Method FT2 accumulated 5 laser shots into
one memory at one sample site, and repeated this 7 times in total, with a fresh
site each time, i.e. 5 laser shots in each of 7 memories (35 laser shots total).
The run times for FT1 and FT2 were 6 s and 7 s respectively, with a further 25 s
required for sample manipulation for FT2. Laser energy (laser flash lamp
energy, LFLE) and sample position relative to the laser focal point (F-) were
varied for some experiments
128

Three spectral windows, 237 - 262, 267 - 292 and 307 - 332 nm of centre
wavelengths 250, 280 and 320 nm, respectively, were used to detect the
elements selected (Al, Ba, Ca, Cu, Fe, Mg, Pb, P, Sb, Sn, Ti, Zn). The
emission lines monitored are given in Table 1. In addition, two barium lines
were utilised (230.423 nm and 233.527 nm) at centre wavelength 230 nm.
Emission lines were identified for each spectral region from the ablation of pure
materials (Table 2). Wavelength values for element emission lines were taken
from standard tables.8
Materials
Samples of PVC were prepared by FMC Process Additives (UK) Ltd. The
samples were supplied in sheet form and were identified as A to K. The
elemental compositions as supplied by the manufacturer are listed in Table 3.
Sample X was industrial grade PVC (Darvic), obtained locally. All samples were
analysed as received with no sample preparation.
129

237 - 262 nm
Wavelength Range
267 - 292 nm
(nm)
307 - 332 nm
240.549 Cu 279.553 Mg II 308.215 Al I
241.949 Sn 280.199 Pb I 308.802 Ti II
247.857 C.l 280.270 Mg II 309.271 A ll
250.200 Zn II 283.306 Pb I 315.887 Ca II
250.911 Cll 283.999 Snl 317.502 Sn I
251.203 Cll 285.213 Mg I 317.933 Ca II
251.743 Ti II 286.333 Snl 322.579 Fe II
252.560 Ti II 286.426 Pb 322.775 Fe II
252.852 Sb I 287.792 Sb I 323.252 Sb I
253.401 PI 323.452 Ti II
253.565 PI 323.612 Ti II
254.480 Cu II 323.904 Till
255.328 PI 324.199 Ti II
255.493 PI 324.754 Cu I
255.796 Zn II 326.233 Sn I
256.253 Fe II 326.751 Sb I
259.806 Sb I 327.396 Cu I
259.881 Cu II 328.233 Zn I
261.418 Pb 328.321 Sn II
330.259 Zn I
Table 1 List of element emission lines for each spectral region monitored
in this study
130

Material Details
Al aluminium metal, BCS198e, Bureau of Analysed
Standards, Newham Hall, Newby, Cleveland, UK
Ba barium chloride powder, pressed in die into pellet,
Proanalysis, May and Baker, Rhone-Poulenc,
Manchester, UK
C Spectroscopic grade solid carbon, Spectrochem,
Spectro Supplies Ltd, Hornsea, UK
Ca calcium carbonate powder, pressed in die into pellet,
BDH Analar, Merck Ltd, Lutterworth, Leicestershire,
UK
Cu copper metal foil, BDH Analar
Fe iron metal rod, Specpure, Johnson Matthey, Royston,
Hertfordshire, UK
Mg magnesium metal turnings, pressed in die into pellet,
BDH Analar
Pb lead metal sheet, BDH Analar
P sodium phosphate powder, pressed in die into pellet,
Proanalysis, May and Baker, Rhone-Poulenc
Sb antimony metal rod, Specpure, Johnson Matthey
Sn tin metal rod, Specpure, Johnson Matthey
Ti titanium metal, IMI Titanium Ltd, Witton, Birmingham,
UK
Zn zinc metal, BCS194d, Bureau of Analysed Standards
Table 2 List of materials used to identify element emission wavelengths
131

Table 3
Elemental com
position of PVC
samples
A to
K. The com
position values
were supplied
by the
manufacturer.
3©
crCD
o o b b
ob
o o
. o b
ob
- I Q
o b
i i i
i i i
o o o
O o
-n m O
o co ^ o
■ i i
i i i
ro to bo b
i co
o ->■ ^ b
to
O CD >
N ' '
0300
i i i
i i i
N i i
CO i ■
ro -&■oo b
■ i i
i i
© c?? 3© "Oo ® ©
CD©
O©
oc
n© _rn
©3©13
s o(Q O
3■oo0)
TIcr
CDcr
CD3
N13
132

4.3 Results and Discussion
4.3.1 Preliminary studies
An emission-wavelength-time response, recorded with the optical multichannel
analyser incremental program, is depicted in Figure 1 for the ablation of sample
A (4.9 % m/m Sb, 2.6 % m/m P). The sample was ablated with laser flash lamp
energy (LFLE) 40 J with the sample positioned at the laser focal point (F0),
(irradiance ~ 8 x 10¹⁰ W cnr2). The wavelength region monitored was 237 - 262
nm. The response shows the intense background continuum at early times, and
the emergence of atom/ion emission at later times. Carbon ion emissions
(C ion 250.9, 251.2 nm) were evident initially, and carbon atom (C atom
247.9 nm) later. The intense background signal and carbon ion emissions
reflect the high temperatures of the plasma at early times, but as the plasma
expanded and cooled, the background signal decayed rapidly and atomic
emission lines for antimony and phosphorus became prominent. An emission
time response for selected wavelengths (Figure 2a) shows that carbon,
antimony and phosphorus responses were indistinguishable from the
background until 400 ns. After this, emission signals for carbon, antimony and
phosphorus remained above background until about 1.5 ps. These
observations enabled suitable detector settings to be obtained for time-resolved
measurement of analyte signal with the OMA fixed time mode. As the
background signal had reduced significantly by 500 ns, selection of a time delay
of 500 ns minimised background contributions. An integration time of 1 ps was
appropriate for monitoring analyte emission.
An emission-time response for this experiment repeated with maximum laser
energy (LFLE 70 J, irradiance ~ 3 x 10¹¹ W cm-2) is depicted in Figure 2b.
Element emission responses for carbon, antimony and phosphorus remained
above the baseline until about 3 ps, indicating that the micro-plasma was longer
lived than that produced by ablation with LFLE 40 J.
133

Wavelength
237 - 262
nm
Emission Intensity (counts)
Figure 1 Emission-wavelength-time response for ablation of sample A usingthe incremental program, (increment time 100 ns, integration time 100 ns), withLFLE 40 J at sample position F0.
carbon atom
247.9 nm

(a)
700
P 253.4 j
Sb 252.9 |I
C 247.9 |
- — background 245.9 j£ 350 -i-
C 247.9 nm
0 0.5 1 1.5 2 2.5Time (us)
(b)
2000 T
P 253.4
Sb 252.9
C 247.9
background 245.9
£ 1000 T
C 247.9 nm
0 0.5 1 1.5 2 2.5Time (us)
Figure 2 Emission-time profile for ablation of sample A using the incremental
program, (increment time 100 ns, integration time 100 ns) at sample position F0
with laser flash lamp energy: (a) 40 J, and (b) 70 J.
135

Results obtained with the 307 - 332 nm spectral region for the ablation of
sample B with LFLE 40 and 70 J suggested that the timing values selected
above were appropriate.
There are differences between the laser ablation of polymer and metal, in
particular, in the rate of material removal and the emission characteristics of the
laser-induced plasma. Laser ablation of PVC samples results in a crater
approximately 1 mm in diameter and 50 pm deep (10 laser shots at the same
site with LFLE 40 J). A Talysurf surface analysis of a crater is shown in
Figure 3. The base of the crater is relatively flat and the crater walls steep. A
darkened region, about 2 mm in width, is observed around each crater. The
rate of material removal is estimated to be 5 pg/laser shot, which is significantly
higher than that obtained for the ablation of metal under very similar conditions,
(0.45 pg/laser shot, Zn/Ni coating on steel, Chapter 5).
(The calculation for the rate of material removal is given in Appendix 1.)
Figure 3 Three dimensional Talysurf surface analysis of crater in PVC (sample X). The x and y-axis correspond to distance across the sample surface, both 1.63 mm total. The z-axis is the vertical height, with total height 92.8 pm. The crater was produced by 10 laser shots with LFLE 40 J.
136

Comparing the emission-time responses for the ablation of PVC (Figure 2a)
and pure copper metal (Chapter 3, Figures 7 and 11) shows that the plasma
lifetime for ablation of copper metal (~35 ps) is much longer than for the
polymer (~2.5 ps). Ablation conditions and measurement times were similar for
both experiments. Initial intensities for the matrix elements, carbon from the
polymer and copper from the metal, are similar (~ 800 counts).
The differences between ablation of polymer and metal are probably because
of the difference in material properties. For ablation of metal, the free electrons
of the conducting material are able to couple with the energy of the laser pulse
through inverse-Bremsstrahlung processes, to produce a plasma of higher
energy, electron density and temperature. This relatively energetic plasma will
therefore have a longer lifetime. The plasma may shield the metal from part of
the laser pulse, thereby reducing direct laser-material interaction, and reducing
the amount of material removed per laser shot.
For ablation of polymer, the insulating nature of the material means that there is
less coupling with the laser pulse, and therefore a less energetic plasma is
induced which has a shorter lifetime. The rate of material removal is higher for
the polymer because of the lower temperature needed to volatilise and
decompose polymeric material compared to metal. The plasma is cooled
as the relatively large amount of ablated polymer material enters the plasma,
further reducing the plasma lifetime. The result is that the rate of material
removal is higher and the plasma lifetime is shorter for the ablation of polymeric
material compared to the ablation of metal.
137

4.3.2 Characterisation of operating conditions
The objective was to study the effects of operating conditions (laser energy and
sample position relative to the laser focal point) upon analytical performance,
and thereby obtain the conditions required for maximum sensitivity of key
elements (Sb and Ca). Sample B (6.8 % m/m Ca, 2.8% m/m Sb) was ablated
using fixed time method FT1 (30 laser shots at same site, delay time 500 ns,
integration time 1 ps) with different laser energies (LFLE 40, 55 and 70 J) and
at different sample positions (F-20, F-5, F0, F+5 and F-20). A fresh sample site
was used for each experiment. The signal/background ratio was calculated for
antimony 323.3 and calcium 317.9 nm for each experiment, where the
background wavelength was 312.9 nm. The signal/background values are
plotted in Figure 4. Maximum values of the ratio for calcium and antimony were
obtained at F0 with LFLE 40 J. Although the analyte emission intensities were
more intense with the higher laser energies, the background intensites were
also more intense, resulting in maximum signal/background values at low laser
energy, LFLE 40J. These conditions were adopted for subsequent studies.
Sample positions of F-5 and F-20 also produced similar results for antimony
with this laser energy. Initial studies, as reported,7 suggested that sample
position F-0.5 gave improved performance, but the more detailed study here
found no significant differences between F-0.5 and F0. The timing values (delay
and integration) used for this experiment were selected for LFLE 40 J ablation.
Sensitivity increased a little when the integration time for LFLE 70 J was
increased from 1 to 2 ps to take advantage of the longer plasma lifetime (Figure
2b). However, the increase was small and LFLE 40 J at sample position F0 still
produced maximum sensitivity.
138

(a)
signal / background ratio for Sb 323.3 nm
2.5 j
oromw
FOF-5 F+5F-20 F+20
40 J
55 J
70 J
jl4sum1.c1.xls
Sample position relative to laser focal point (mm)
(b)
signal / background ratio for Ca 317.9 nm
45 -
O vll “ 03m 25 f coCO 2 0 -
10 -
F0 F+5 F+20F-5F-20
■ 40 J
55 J
70 J
jl4sum1.c2.xls
Sample position relative to laser focal point (mm)
Figure 4 Plot of signal/background ratios obtained for ablation of sample B with
different laser energies and sample positions relative to laser focal point;
(a) Sb 323.3, and (b) Ca 317.9 nm. The background wavelength was 312.9 nm.
139

In the case of transparent polymeric samples, no emission signals were
obtained when material was ablated at FO with LFLE 40 J. Faint tunnelling
through the material and ablation of the metal support underneath the sample
were observed, suggesting that a plasma was not induced on the surface of the
polymer, and the laser light was transmitted through the plastic to the metal.
The tunnelling was due to the self-focusing of the laser beam within the
material, which trapped the light and prevented it from spreading, to produce a
waveguide.9 This was not evident in the opaque samples because the laser
light was absorbed leading to ablation and production of the laser-induced
plasma. When the transparent sample was moved away from the laser focus
position, e.g. F+5, emission signals and laser damage on the sample surface
were obtained. The plasma was induced in the air above the sample surface,
and the plasma was responsible for volatilising sample material and creating
the crater. As the PVC samples in this study were opaque, the conditions
identified above (LFLE 40 J and FO) were adopted.
A further consideration was the effect of repetitive laser firing upon
performance, i.e. the number of laser shots at a given site. Emission-time
responses for the ablation of sample A with fixed time methods FT 1 (30 shots
at same site) and FT2 (5 shots at each of 7 sites) are depicted in Figure 5. With
method FT1, the antimony responses were not similar throughout the
experiment, although the carbon, phosphorus and background responses were
reasonably constant. The intensity of both antimony signals increased initially,
then decreased until about memory number 8, after which a relatively constant
signal was observed. In contrast, all emission responses were fairly constant
with method FT2. Preliminary calibrations indicated that the emission response
for antimony was not linear with concentration with method FT1 although the
response for calcium was linear. Method FT2, however, produced linear
responses for calcium and antimony. A probable explanation is that the
140

antimony in the vicinity of the laser spot was selectively volatilised during the
first few laser shots, possibly through formation of volatile antimony chloride,
leading to a depletion of antimony for the remaining shots. The effect was not
due to higher concentration levels of antimony at the surface as similar
emission responses were obtained from the ablation of material beneath the
sample surface. The effect was also observed for the antimony emission lines
in the 307 - 332 nm wavelength region. Reasonably constant signals for
carbon, phosphorus and calcium were obtained by FT1, suggesting that these
elements were not selectively volatilised and it was still possible to make
representative measurements after firing 30 laser shots at the same site.
Method FT2 was selected for subsequent use because the effects of antimony
volatilisation were minimised, and FT2 provided improved analytical
performance compared to method FT1. Data are shown in Table 4. Precision
(% relative standard deviation, % RSD) improved from 13.6, 16.0 and 11.0
(FT1) to 6.9, 7.1 and 7.3 (FT2) for carbon, antimony and phosphorus,
respectively, and the signal/noise ratios for antimony and phosphorus increased
from 20.6 and 16.2 to 746 and 250, respectively.
Method FT1 Method FT2
Number of shots per site 30 5
% RSD C 247.8 nm 13.6 6.9
% RSD Sb 252.9 nm 16.0 7.1
% RSD P 253.4 nm 11.0 7.3
S/N (Sb 4.9% m/m) 20.6 746
S/N (P 2.6% m/m) 16.2 250
n for statistical calculation 30 7
Table 4 Comparison of data from fixed time methods FT 1 and FT2 for the ablation of sample A
141

(a)
1400
C 247.9 nmOTC13OOtoca> 700 -hcco'(/)tOEm
Sb 252.9 nm
0 2 4 6 8 10 12 14 16 18 20 22 24 26 28
Sb 259.8
P 253.4
Sb 252.9
C 247.9
background 245.9
jl402.c4.xls
Memory Number
(b)
12000 T C 247.9 nm
c13Oo
Sb 252.9 nmtoco 6000ccototo'EID
2 60 1 3 4 5
-■ Sb 259.8
-a P 253.4
-♦ Sb 252.9
-o C 247.9
-*■ background 245.9
jl455a.c3.xls
Memory Number
Figure 5 Emission-time profile for ablation of sample A with fixed time programs: (a) FT1, 30 shots at same sample site; (b) FT2, 5 shots in each memory, 7 memories, fresh site each memory.
142

4.3.3 Analytical performance
Full quantitative measurement of inorganic additives in polymeric materials is
considered to be difficult because of the absence of suitable certified reference
materials necessary to prepare calibration graphs. Quantitative measurements
in this work were based on using characterised samples as calibration
standards. The operating conditions used were as identified above, LFLE 40 J,
sample position F0 and method FT2 (5 laser shots at each of 7 fresh sample
sites). An emission-wavelength-memory number response (Figure 6) for
ablation of sample A clearly indicates good repeatability for successive laser
firings. The emission-time response for this experiment is shown in Figure 5b.
Results suggest that the sample is relatively homogenous, and indicate that the
technique can be used for bulk analysis to check for sample heterogeneity.
Performance data are given in Table 5. Typical values for precision (% relative
standard deviation, % RSD) were 7.3, 5.6 and 3.2 for antimony 252.9, calcium
317.9 and zinc 330.3 nm, respectively. Precision improved from 7.3 to 1.8 for
antimony 252.9 when the carbon signal (C atom 247.86 nm) from the polymer
matrix was used as an internal standard. This internal standard can only be
used for element emission signals that are within a spectral region that contains
a carbon emission signal, e.g. 237 - 262 nm.
143

Element Wavelength
(nm)
Limit of Detection
(% m/m)
% RSD
Ca 317.9 0.04 5.6
Zn 330.3 0.07 3.2
Sb 252.9 0.09 7.3
Sb / C * Sb 252.9 — 1.8
C 247.9
Table 5 Analytical performance data for Sb, Ca and Zn in PVC samples. Operating conditions were LFLE 40 J, sample position F0 with 5 laser shots in each of 7 memories, fresh sample site each memory (method FT2).
C I 247.9
Sb 252.9 Sb 259.8
Wavelength 237 - 262 nmMemory Number (0 to 6)
Cf/y6.cdr-f4S5a
Figure 6 Emission-wavelength-memory number response for the ablation of sample A at sample position F0 with LFLE 40 J and 5 laser shots in each of 7 memories, fresh sample site each memory (method FT2).
144

Linear calibration graphs, shown in Figures 7 and 8, were generated for calcium
317.9, zinc 330.3 and antimony 252.9 nm for up to 10 % m/m of each element.
The line for calcium was a straight line, (y = 320.2x + 29.7, correlation
coefficient 0.9985) and the lines for antimony and zinc were curves. The line for
antimony was improved (Figure 8b), i.e. was less curved, when the ratio of
antimony to carbon 247.9 nm was plotted, indicating that the use of an internal
standard can provide better performance. The curvature of the antimony and
zinc lines suggests that there was some enhancing effect for the responses of
zinc and antimony at higher concentrations. The ablation efficiency was
possibly higher when these elements were present in the polymer at greater
concentrations, leading to increased mass removal per laser shot and
enhanced analyte emission responses. This effect was partly corrected for for
antimony by using the carbon signal from the polymer matrix as internal
standard.
Limits of detection based on 3cr (measurement of blank PVC sample) were
estimated at 0.09, 0.04 and 0.07 % m/m for antimony 252.9, calcium 317.9 and
zinc 330.3 nm, respectively. The limits of detection are similar to values
obtained for elements in steel (Ni, Cr, Si and Mn) by Cremers et al 9 using LIPS.
145

3500-1
O icsj 2800 -coD)
^ 2 1 0 0 -
1400-r-CO
™ 700 -
0 2 4 6 8 10
Concentration Ca (% m/m)
zinc
co'wwE
HI
2000-1
S 1600 -CO
^ 1200 - CO
CO 800 -OcoCO
IS 400 -
0 2 6 8 104
Concentration Zn (% m/m)
Figure 7 Calibration graphs for Ca and Zn in PVC samples using laser-induced
plasma emission spectrometry.
146

(a)
Co’c/)gELU
20000
o>Lo 16000*3"C\J
^ 12000 00
COcviIDc\J.Q
8000
4000
0 2 4 6 108
Concentration Sb (% m/m>
(b)J2'E13(D>To<D
co'</)gE
LU
o> 1.200
Q>00 0.6
GO 0.3
0.020 4 6 8 10
Concentration Sb (% m/m)
Figure 8 Calibration graphs for Sb in PVC samples using laser-induced plasma
emission spectrometry; (a) Sb 252.9 - background 245.9 nm, (b) using a carbon
signal from the polymer matrix as internal standard,
(Sb 252.9 - background 245.9) / (C 247.9 - background 245.9)
147

4.3.4 Survey analysis
To demonstrate the rapid analysis capability of laser-induced plasma emission
spectrometry, the range of PVC samples listed in Table 3 was examined. The
composition values quoted were supplied by the manufacturer. Spectra from
four samples (A, B, D and E) are shown in Figure 9 for three spectral regions.
Samples A and B are clearly seen to contain antimony, as the emission lines for
antimony are identified within all three spectral windows for both samples. The
greater emission intensity for A compared to B indicates the higher
concentration present in A (Sb: A, 4.9 % m/m; B, 2.8 % m/m). Tin and
phosphorus are present in sample A (P 2.6 % m/m, Sn 0.05 % m/m). Calcium
emission lines are evident in samples B and D, the greater emission intensity of
B indicating the higher concentration present (Ca: B, 6.8 % m/m; D,
0.4 % m/m). Emission lines of magnesium lines were observed for all four
samples. Barium was detected in sample B (Ba: 0.1 % m/m), the barium
emission lines (230.423 nm and 233.527 nm) are not shown in Figure 8. Lead
(3.0 % m/m) is present in sample D, and aluminium, phosphorus, tin and zinc
are evident in E. Iron and copper were not detected in the samples tested here.
The technique can rapidly differentiate between samples by the inorganic
content without the need for time-consuming sample dissolution with associated
possible loss of volatile elements. Each spectrum was acquired in 1 s and so it
took about 3 s to examine each sample (excluding sample manipulation time).
In comparison, similar testing by energy dispersive X-ray fluorescence took
100 s, and required a minimum sample size of 30 mm diameter and ~17 mm
thickness. Testing by laser-induced plasma emission spectrometry was
possible on small samples only ~5 mm in diameter and 2 mm thick. The small
sample site enables sample material to examined for localised homogeneity.
The results indicate that laser-induced plasma emission spectrometry can be
used for rapid survey analysis of polymeric materials.
148

B
D
3000 2000 80 0
SbSb
Sb SbSb
12000 Ca3000 2500
Ca
c3OU
SbSbSb Sb Sb
3000 2000
Ca
C/3 Pb
Pb Ca
PbPb
G 3000
E ©
B
200Q
P P
Mg Sn
800
Zn
ZnSnSn
0
237.0 - 262.0 267.0 - 292.0
Wavelength (nm)
307.0 - 332.0
Figure 9 Laser-induced plasma emission spectra from samples A, B, D and E. Spectra were recorded with fixed time method FT2 and emission wavelengths are given in Table 1.
149

4.4 Conclusions and Recommendations for Further Work
The laser ablation of polymeric materials was found to be different from that of
metals. The lifetime of the plasma was shorter and rate of material removal was
higher for the ablation of polymer, and were attributed to differences in the
properties in the two types of material. Samples of poly (vinyl chloride) were
successfully monitored for a range of twelve elements (Al, Ba, Ca, Cu, Fe, Mg,
Pb, P, Sb, Sn, Ti and Zn). The study examined the effects of operating
conditions (laser energy and sample position relative to the focal point) upon
analytical performance (signal/background ratio), and obtained improved
performance at relatively low laser energy (laser flash lamp energy 40 J) with
the sample positioned at the laser focal point. Selective volatilisation of
antimony was found to interfere with the determination of this element when a
relatively large number of laser shots (30) was directed at the same sample
site. The effect was minimised by using a smaller number of laser shots (5) at 7
fresh sample sites. This method also provided improved analytical performance
in terms of precision and sensitivity.
Full quantitative measurement was limited by the availability of characterised
samples. Limits of detection and precision were obtained for key elements
(Ca 0.04, Zn 0.07, Sb 0.09 % m/m) and linear calibration graphs were achieved
for these elements to 10 % m/m. Precision (% relative standard deviation)
improved from 7.3 to 1.8 for antimony when the carbon signal from the polymer
matrix was used as an internal standard. The speed of analysis, compactness
of instrumentation and simplicity of operation suggest that the technique has
the potential for compositional monitoring of polymeric materials in industrial
processes, such as manufacture and recycling. Compared to energy dispersive
X-ray fluorescence, the technique is considerably faster (1 vs. 100 s), requires
a smaller sample size, and is more sensitive (limit of detection 0.09 vs.
estimated 1 % m/m).
150

Calibration and performance data for all twelve elements could be obtained with
further work if suitable characterised standards could be obtained. The range of
elements could be extended to include other elements of interest to the polymer
industry, bromine, chlorine, silicon, cadmium, sulphur and bismuth. The use of
carbon as an internal standard could be applied to other elements if other
carbon lines could be used, or if a larger wavelength region could be monitored
around a suitable carbon emission line. Further work could utilise a lower
resolution spectrometer grating to achieve this, and examine, for each element,
the effects of using an internal standard upon performance. Possible spectral
interferences would need to be considered if a lower resolution spectrometer
was to be used. Further studies could investigate the effects of other operating
parameters, such as type and pressure of buffer gas. Improved performance
might be realised with a reduced pressure of argon buffer gas, as reported by
Niemax et al10 for the determination of silicon and chromium in steel.
4.5 References
1. Gachter R. and Muller H., Plastic Additives Handbook, Hanser, New York,
USA., 1983.
2. Belarra M. A., Gallarta F., Anzano J. M. and Castillo J. R., Journal of
Analytical Atomic Spectrometry, 1986, 1, 141-144. Determination Of Metals
In Poly (vinyl chloride) By Atomic Absorption Spectrometry
Part 1. Determination Of Calcium, Aluminium and Antimony In Samples Of
Poly (vinyl chloride) With A High Content Of Alkaline Earths.
3. DiPasquale G. and Casetta B., Atomic Spectroscopy, 1984, 5, 209.
ICP Determination Of Sulphur In Polymeric Materials.
4. Warren P. L., Farges O., Horton M. and Humber J., Journal of Analytical
Atomic Spectrometry, 1987, 2, 245-248. Role Of Energy Dispersive X-ray
Fluorescence Spectrometry In Process Analysis Of Plastic Materials.
151

5. Booth P. K. and McLeod C. W., Mikrochimica Acta, 1989, 3, 283-289.
Rapid Survey Analysis of Polymeric Materials by Laser Ablation-lnductively
Coupled Plasma Spectrometry. An Analytical Note.
6. Marshall J., Franks J., Abell I. and Tye C. J., Journal of Analytical Atomic
Spectrometry, 1991, 6 (2), 145-150. Determination of Trace Elements in
Solid Plastic Materials by Laser Ablation-lnductively Coupled Plasma Mass
Spectrometry.
7. Anderson D. R., McLeod C. W. and Smith A. T., Journal of Analytical
Atomic Spectrometry, 1994, 9 (2), 67-72. Rapid Survey Analysis of
Polymeric Materials Using Laser Induced Plasma Emission Spectrometry.
8. Harrison G. R., Wavelength Tables with Intensities in Arc, Spark or
Discharge Tube, M.I.T. Press, Cambridge, Mass., USA, 1969.
9. Ready J. F., Effects of High Power Laser Radiation, Academic Press, New
York, 1971.
10. Niemax K., Leis F., Sdorra W. and Ko J. B., Mikrochimica Acta, 1989, 2,
4-6, 185-199. Basic Investigation for Laser Micro Analysis: 1. Optical
Emission Spectrometry of Laser-Produced Sample Plumes.
152

5.1 Introduction
In the previous chapters, studies have investigated laser-induced plasma
emission spectrometry for the bulk chemical analysis of metal alloys and
polymeric materials. The technique also has a micro-analysis capability which
was used to test the homogeneity of inorganic additives in samples of polymeric
materials. This chapter applies the micro-analysis capabilty to the depth profile
measurement of coatings deposited on steel substrates. Coatings are widely
used in industry to give enhanced properties to materials. For example, metallic
coatings such as zinc, nickel and chromium are applied to steel to provide
resistance to corrosion for products ranging from car bodies to oil rig
structures.1 Improved resistance to wear in abrasive environments, such as drill
bits and scissors, can be achieved with the use of hard coatings such as
titanium nitride, and zirconium nitride.2 In the jewellery and electronics
industries, gold coatings are used for cosmetic or electrical purposes.
The quality of these coatings can be investigated by a number of techniques
depending on the information required. Techniques such as Auger and X-ray
photoelectron spectroscopy have been utilised to study surface chemistry on
the atomic scale, and can be used to probe into the coating by removing
material through ion bombardment to yield depth profile data.3 Thicker coatings
can be measured mechanically with ball cratering methods, and analytically
using X-ray spectrometry and Rutherford backscattering techniques. Glow
discharge optical emission spectrometry (GD-OES)4 and glow discharge mass
spectrometry (GD-MS)5,6 have been used to measure coatings over the
thickness range 0.01 pm to over 50 pm. The quantitative aspects of GD-OES
have been reported by Bengtson7 and both techniques are now widely
accepted. Measurement times are about 15 minutes with depth resolution
typically around 100 nm and crater diameter o f-10 mm. An improved
measurement technique would be more rapid (seconds vs. minutes) and
154

examine smaller areas to provide higher spatial resolution. The base of the
crater produced by the depth profile should be as flat as possible so that good
depth resolution is achieved.
This study considers the feasibility of utilising laser-induced plasma emission
spectrometry (LIPS) for the depth profiling of coatings. Possible advantages
when compared to glow discharge techniques include small crater size, ~1 mm
diameter, and rapid analysis time, ~40 s. The application of LIPS to depth
profiling has been limited and is discussed in Chapter 1. In this study, a pulsed
Nd:YAG laser is fired repetitively at the same site to erode the coating and then
ablate the substrate. The laser-induced plasma from each laser shot is
discreetly monitored by a gated photodiode array spectrometer system to yield
an emission-wavelength-time signature, i.e. depth profile.
The aim of the investigation is to evaluate the capability of laser-induced
plasma emission spectrometry to depth profile metallic coatings over a range of
coating thickness, i.e. to measure the coating thickness, and to provide
information about the distribution with depth of the components of the coating.
The influence of key operating conditions on signatures is characterised for
zinc/nickel coatings in order to obtain suitable operating conditions. Depth
profile performance is established for zinc/nickel and tin coatings over a coating
thickness range of 0.38 to 7.2 pm. The technique is also applied to a titanium
nitride coating and the detection of an ultra-thin chromium coating (20 nm).
Detailed depth profile studies with laser-induced plasma emission spectrometry
are reported here for the first time and part of this work has been submitted for
publication.8
155

5.2 Experimental
The laser-induced plasma emission spectrometry system was used as
described in Chapter 2 with the blank-spectrum subtraction method and the
laser fired at 5 Hz. A fixed time OMA program was utilised with time settings of
time delay 1.5 ps and integration time 1 ps. Two main operating parameters
were varied to obtain optimum conditions for depth profile measurement: the
laser energy, by changing the laser flash lamp energy (LFLE); and the sample
position relative to the laser focal point, which affected the amount of laser
defocusing and consequently the laser irradiance. This was achieved by
positioning the sample at different distances from the laser focal point,
expressed as F±x, where x was the distance in mm from the laser focal point,
and the - or + sign indicated either towards, or away from, the laser source.
Materials
A series of samples with different coatings over a range of coating thickness
was examined in the study, (Table 1). Samples of low alloy steel with different
coatings were prepared at British Steel Technical, Swinden Laboratories,
Rotherham, UK. The zinc/nickel coating contained 13% m/m nickel and was
deposited by a hot-dip process. The thickness of each tin coating,
electrolytically deposited, was calculated from the coating weight (Appendix 1).
A low alloy steel reference standard was used as an uncoated blank (BAS
SS401, Bureau of Analysed Standards, Newby Hall, UK). A sample of stainless
steel (AISI-340) with a coating of titanium nitride deposited by physical vapour
deposition (PVD) was prepared by G. Williams (Materials Research Institute,
Sheffield Hallam University). Sample Zn-A was hot-dipped galvanised steel
(coating: Zn metal with minor levels of Al and Pb), supplied by A. Bengtson
(Swedish Institute for Metals Research, Stockholm, Sweden). Samples were
rinsed in acetone and air dried prior to use.
156

Sample
Reference
Coating Coating Thickness
(pm)
Coating Weight
(gm‘2)
P1 Zn/Ni 2.7 -
P2 Zn/Ni 2.7 -
P4 Zn/Ni 2.7 -
P5 Zn/Ni 5.0 -
P6 Zn/Ni 7.2 -
Sn1/1 Sn 1.48 10.8
Sn3/1 Sn 0.82 6.0
Sn1/2 Sn 0.58 4.2
Sn4/1 Sn 0.49 3.6
Sn4/2 Sn 0.47 3.4
Sn3/2 Sn 0.44 3.2
Sn5/1 Sn 0.38 2.8
Cr-1 Cr 0.020 -
TiN-1 TiN 2.0 -
Zn-A Zn 8.0 -
Note: the coating thickness of the tin samples was calculated from the coating weight
(the calculation is given in Appendix 1)
Table 1 Details of the coated samples used in the depth profile studies.
157

5.3 Results and Discussion
5.3.1 Preliminary studies
The feasibility of depth profile measurement using laser-induced plasma
emission spectrometry was examined in preliminary studies with zinc/nickel
coatings. Three spectral regions were identified that encompassed strong
emission lines for zinc and nickel and iron: 237 - 262, 287 - 312, and 307 - 332
nm. Initial studies with sample P2 (zinc/nickel coating thickness 2.7 pm)
showed that an experiment consisting of 200 laser shots with maximum laser
energy (laser flash lamp energy, LFLE 70 J) was sufficient to ablate through the
coating and obtain strong element emission responses from the iron of the steel
base. This was achieved by accumulating 5 laser shots/scans of the detector
array into 1 memory of the optical multichannel analyser (OMA); 40 memories
were used to record 200 laser shots. With the laser firing at 5 Hz, the
experiment run time was 40 s. The sample was ablated at the laser focal point
(sample position F0) with laser flash lamp energy (LFLE) 70 J.
Spectra for the ablation of sample P2 at the three spectral regions are depicted
in Figures 1a, 1b, and 1c. Each figure depicts a spectrum from memory 0 (laser
shots 1-5) and from memory 39 (laser shots 196-200). Useful information about
the coating and ablation process can be gained from examination of these
spectra. For each spectral region, zinc and nickel lines were evident for the first
spectrum (laser shots 1 - 5) and there were no responses for iron. The absence
of iron indicated that the surface of the coating did not contain iron, either as a
contaminant of the zinc/nickel alloy, or from diffusion of iron from the substrate,
and that the laser had not penetrated through the coating into the steel
substrate in the first 5 laser shots.
158

(a) 45000 Fe 253.9 Memory 0 I
— — Memory 39 |
B: Ni 243.8
C: Ni 245.5 ‘nD:Zn 251.6
22500
E: Zn 258.2 i 'n i
0
Fe 298.420000Memory 0
Memory 39
Ni 305.7Ni 300.2
Zn 303.6Zn 307.2
10000
45000
Memory 0
Memory 39
Zn 328.2Fe Bkg 320.3
| 22500
Fe 321.4
Fe 322.6Ni Bkg 312.3
Ni 313.4Ni 310.2
Wavelength (nm)
Figure 1 Overlay of spectra for the ablation of Zn/Ni coating on steel (sample P2, coating thickness 2.7 pm) with LFLE 70 J at sample position F0. Emission wavelengths (nm). Memory 0: laser shots 1-5. Memory 39: laser shots 196-200. Spectral regions are: (a) 237-262, (b) 287-312, (c) 307-332 nm.
159

The last spectrum (laser shots 196-200) for each spectral region contained
strong emission lines for iron, which showed that ablation of the substrate had
been achieved. This spectrum for the spectral region 307 - 332 nm contained
minimal responses for zinc and nickel, which indicated that the coating had
been removed. This was not particularly clear for the last spectrum within
spectral regions 237 - 262 and 287 - 312 nm (Figures 1, 2) because of spectral
interference problems discussed below.
The spectral region 237 - 262 nm (Figure 1a) showed an intense increase in
background signal between ablation of the zinc/nickel coating (memory 0) and
the steel substrate (memory 39). This was because of the large number of iron
emission lines present in this region, which caused an increase in the spectral
baseline. This region was not selected as the zinc and nickel emission lines
were effectively swamped by the iron signals when ablation of the substrate
commenced. The spectral region 287 - 312 nm (Figure 1b) was not selected
because the zinc emission lines suffered from spectral interference from iron
emission lines.
The spectral region 307- 332 nm (Figure 1c) was therefore selected for use in
the study of all the zinc/nickel and zinc coated samples because emission lines
for nickel, zinc and iron were relatively free from interference either from the
background or from other emission lines. Aluminium was also monitored in this
wavelength region for sample Zn-A. Emission wavelengths with the
corresponding detector pixel position are listed in Table 2. The last spectrum
within this region had a higher background level because the spectrum was
predominantly iron from the ablation of the steel compared to memory 0 which
was mainly zinc that has a lower background spectrum. To observe the
behaviour of the background during the profile measurement, two wavelengths
160

(312.3 and 320.3 nm) close to nickel and iron lines were selected and
monitored, (Table 2, Figure 3).
An emission-wavelength-time response for the ablation of sample P2 is
depicted in Figure 2. Nickel and zinc emissions were observed during the
removal of the coating until memory 9, after which these emission intensities
decreased and signal responses for iron commenced. An emission-time
response (depth profile) was constructed by plotting specific emission and
background wavelengths against memory number (time), (Figure 3a). The zinc
emission signals were very intense and the zinc values were therefore divided
by 10 in order to obtain a response with all the signal responses on the same
scale. The responses depicted in Figures 2 and 3a show that the zinc emission
signal was reasonably constant until memory 9, (50 laser shots), after which it
decreased sharply. The emission intensity for nickel increased during the
removal of the coating which suggested that the nickel content of the coating
was not uniform with depth. The iron signal increased after about memory 6
and became reasonably constant after about memory 15. This suggested that
about 30 laser shots were required to ablate through the coating. The region in
which the iron increased and the zinc and nickel decreased (memory 9 to 18)
corresponds to an interface region between the coating and the substrate. The
background intensity also increased within the interface region and is discussed
in the next section.
161

Wavelength (nm) Element Pixel Number
309.271 Al I 185 m
310.155, 310.188 Ni I, I 212
312.3 Ni Background 280 m
313.411 Ni I 315 m
320.342 Fe Background 539 m
321.321* 321.404* Fe II, I 572
322.638* 322.672* Fe II, I 619 m
328.233 Zn I 794
330.259 Zn I 856 m
* unresolved emission lines m = monitored for emission-time response
Table 2 List of main element emission lines used in the study of Zn/Ni and Zn
coatings. The spectral region was 307-332 nm, (centre wavelength 320 nm).
162

Emission Intensity (counts)Figure 2 Emission-wavelength-time response for the ablation of Zn/Ni coating on steel (sample P2, coating thickness 2.7pm) with LFLE 70J at sample position FO. Experiment run time 40 s.
163

(a) 14000 T Fe 322.6
cDooZn 330.3 /10
Ni 313.47000 -cco
'toCO
' £LU
background 320.3
background 312.3
402010 15 25 30 3550Memory Number (5 laser shots / memory) ja303c.xts.c24
(b) 3000 t Fe 322.6
Zn 330.3 /10c3oococ0) 1500 -c Ni 313.4co'wco
ELU
background 320.3
background 312.3
403520 25 3010 1550Memory Number (5 laser shots / memory)
ja301c.xis.c15
Zn 330.3 /10 o----- Ni 313.4
— * background 312.3 ----- ♦
□ Fe 322.6
background 320.3
Figure 3 Emission-time response for the ablation of Zn/Ni coating on steel (sample P2, coating thickness 2.7 pm) at sample position F0 with LFLE:(a) 70 J; (b) 40 J.
164

5.3.2 Basic characterisation studies
In order to provide insight into ablation processes and to obtain optimum
operating conditions for depth profile measurement, key operating parameters
(laser energy and sample position relative to laser focal point) were varied
systematically. The effect of laser energy upon depth profile characteristics is
seen for zinc/nickel coatings in the comparison of Figures 3a and 3b. These
depict emission-time responses for the ablation of sample P2 with LFLE 70 and
40 J, respectively, at the laser focal point (F0). Signal characteristics varied with
laser energy: the emission intensities of the iron, nickel and zinc increased with
laser energy, from -2500 to -6000 counts for zinc and nickel (40 to 70 J), and
~2000 to ~9000 counts for iron; the gradient of the profile lines during the
transition period also increased with energy. These features may be explained
by examination of the craters which resulted from these ablations, and by
consideration of the effect of laser energy upon laser - material interaction
processes.
Talysurf surface analyses of these craters, each produced by 200 laser shots,
are depicted in Figures 4 and 5. Figure 4 shows a three dimensional view and
Figure 5 shows a profile through the centre of each crater. Electron micro
graphs from examination of each crater with scanning electron microscopy
(SEM) are shown in Figures 6. The crater produced by ablation with LFLE 40 J
contained a central 'volcano' feature which consisted of walls ~10 pm higher
than the unablated surface with a hole inside that was deeper than the base of
the crater. The hole and crater were ~100 pm and -1.3 mm in diameter,
respectively, and the crater was -4.0 pm deep. By contrast, the crater produced
by ablation with LFLE 70 J appeared to be larger in diameter (-1.4 mm) and
deeper (-7.4 pm ). The crater bottom was considerably flatter with no central
volcano 'feature'. Both craters were surrounded by walls higher than the surface
of the sample.
165

It is proposed that the differences between the craters, and therefore the
emission-time signatures, were caused by different sampling processes. For
ablation with LFLE of 40 J (irradiance ~ 8 x 10¹⁰ W cm'2, Appendix 1), two
processes occurred: plasma-sampling, where the plasma induced by each laser
pulse vaporised solid material from the surface leading to the production of the
crater; and laser-sampling, where direct laser-material interaction produced the
hole feature within the crater. The hole diameter was approximately the same
as the calculated laser spot diameter, ~100 pm, which suggested that the hole
was formed by laser-material interaction. The crater, -1.3 mm in diameter,
probably approximated to the size sampled by the laser-induced plasma. The
laser-induced plasma was optically thin and allowed significant laser radiation
to reach the sample surface. Direct heating by the laser took place at the
sample surface9 which caused rapid heating and phase changes that produced
ejection of material leading to the formation of the deep hole. Electron micro
graphs of this crater (Figure 6a, b) appear to show the presence of a large
number of bubbles at the surface in the vicinity of this hole, suggesting that gas
was evolved from a molten state and that sub-surface heating had taken place.
Some of the ablated material was removed into the plasma where excitation
and atomic / ionic emission took place, the remainder was deposited at the top
of the hole to produce the 'volcano' walls. As the hole was deeper than the
crater, sampling in effect took place at 2 different depths at the same time. The
hole penetrated the substrate before complete removal of the coating was
achieved within the crater, which caused iron signals to be observed from the
steel during the removal of the coating and a very indistinct interface region to
be obtained, (Figure 3b).
166

( a )
(b)
Figure 4 Three dimensional Talysurf analysis of craters in Zn/Ni coating on steel. The x and y-axes correspond to distance across the sample surface, both 1.63 mm total. The z-axis is the vertical height, with total heights: (a) 38.4 pm (b) 80.2 pm. The craters were produced by 200 laser shots with LFLE: (a) 40 J, (b) 70 J.
167

(a) Height
(nm)
2.5 to 25.0
(b) Height
(nm)
5.0 to 45.0
Figure 5 Single Talysurf profiles through centre of craters in Zn/Ni coating on steel. The y-axis corresponds to vertical height and the x-axis is the horizontal distance across the sample surface. The craters were produced by 200 laser shots with LFLE: (a) 40 J, (b) 70 J.
In the case of ablation with LFLE of 70 J (irradiance ~ 3 x 10¹¹ W cm-2), it is
proposed that there was little or no direct laser interaction, and that the main
process of material removal was by volatilisation by the laser-induced plasma.
An electron micro-graph (Figure 6c) shows a generally flat, featureless crater.
Here, a plasma of greater density, intensity and temperature was induced by
each laser pulse which absorbed the incoming laser pulse preventing significant
laser light from reaching the sample surface. The plasma shielded the sample
from the laser pulse. The high temperature plasma vaporised material from the
sample surface to produce a relatively flat-based crater.
Distance (mm) 0.00 to 1.75
Distance (mm) 0.00 to 1.75
168

Figure 6 Scanning electron micro-graphs of craters in Zn/Ni coating on steel produced by 200 laser shots: (a) & (b) LFLE 40 J, (a) central volcano feature within crater, x128 magnification; (b) hole within volcano, x514; (c) crater produced by LFLE 70 J, x128.
169

As material removal took place at only one level for each laser shot compared
to two levels for the 40 J ablation above, removal of the coating was completed
before ablation of the interface and substrate started. Thus a depth profile was
obtained (Figure 3a) that showed a sharp interface region and relatively level
plots corresponding to coating and substrate removal.
The diameter of the crater was probably governed by the size of the laser-
induced plasma. A larger plasma was produced by the higher energy ablation
(LFLE 70J) compared to that of LFLE 40 J ablation, which sampled a larger
area of material and resulted in a crater of larger diameter. The emission
intensities for LFLE 70 J ablation were more intense than for the LFLE 40 J
ablation through a combination of reasons (Figure 3). The higher energy of the
laser pulse (LFLE 70J) induced a hotter, larger, more intense plasma that
produced more intense atomic and ionic emissions; the plasma sampled a
larger area of material resulting in more material bieing removed per shot
(larger crater); and the higher temperature enabled more material to be
removed per laser shot (deeper crater). The rate of material removal was
0.18 and 0.45 jig/laser shot for ablation with LFLE 40 and 70 J, respectively,
estimated from the size of the craters measured by the Talysurf analysis,
(calculation given in Appendix 1).
The background intensity varied during the depth profile, particularly in the
vicinity of the iron emissions, (321.4 and 322.6 nm), depicted in Figure 3. The
background response 320.3 nm was relatively constant during the ablation of
the coating, increased in the interface region, and then remained reasonably
constant for the ablation of the steel substrate. The other background response,
312.3 nm also varied in this manner but to a lesser extent. To correct the nickel
and iron emissions for these changes, the respective background value was
subtracted from the nickel and iron values for each memory number,
170

i.e. iron 322.6 - background 320.3 nm (Fe-Bkg); nickel 310.2 - background
312.3 nm (Ni-Bkg). These background-corrected responses were used in
subsequent studies.
The effects of sample position and laser energy were next examined. Several
complex interdependent processes were affected by changing these operating
conditions. The characteristics of the laser-induced plasma changed with laser
energy, i.e. increased LFLE increased the energy density, size, temperature,
and intensity of the plasma, and by positioning the sample away from the laser
focal point, the laser spot was defocused which increased the laser spot size
and decreased the energy density. Emission-time responses for the ablation of
sample P2 with LFLE 40, 55, 70 J at different sample positions are shown in
Figure 7 (F-20, F0, F+20), Figure 8 (F+10, F+20, F+30) and Figure 9 (F-50,
F+50). From Figure 7, two general observations can be made for sample
positions F-20, F0 and F+20: (1) the gradient of the profile lines in the interface
region generally increased with laser energy, indicating that laser energy had a
greater effect than sample position upon material removal and the
corresponding emission-time signature, and (2) emission intensities for each
sample position increased with laser energy. The energy of the plasma
increased with laser energy which increased the rate of material removal and
the element emission intensities. In the case of ablation with LFLE 55 and 70 J,
line gradients also increased as the sample was positioned further from the
laser, i.e. F-20 through F0 to F+20. The signatures for LFLE 40 J were less
affected by the change in sample position. This suggested that sample position
had more influence on the main material removal process for ablation with
LFLE 55 and 70 J (plasma-material interaction) than for ablation with LFLE 40 J
(laser-material interaction).
171

Depth resolution (Ad)6,10 was calculated as the difference in depths at 84%
and 16% of the maximum zinc signal (Figure 10a). The time-axis was converted
to depth by equating the known coating thickness to D1/4, where D1A was the
distance along the x-axis from the origin to half of the maximum zinc signal
(Figure 10b). For ablation with LFLE 70 J at different sample positions, Ad was
1.5 pm (F-20), 1.8 pm (F0), 1.6 pm (F+10), 1.1 pm (F+20) 1.9 pm (F+30), and
1.5 pm (F+20) for LFLE 55 J. These data and comparison of the emission-time
signatures for these sample positions (Figures 7 and 8) suggested that the
plasma sampling process was modified such that sharper gradients and
improved Ad were achieved at sample position F0 with LFLE 70 J. This
consisted of the longest 'level' signals for zinc and iron as the coating was being
removed, and the steepest gradients in the interface region. This sample
position with LFLE 70 J was probably an 'optimum' distance from the laser focal
point such that plasma characteristics were 'optimised' for controlled
vaporisation across the sampling site. At F+10 with LFLE 70 J, the energy
density was higher and the plasma positioned closer to the surface such that
sampling was more aggressive and less even, indicated by faster penetration
into the coating (Fe increase after 25 laser shots) and shallower gradients. At
F+30 with LFLE 70 J, the plasma was probably induced further from the surface
with a lower energy density leading to less even-sampling. Talysurf analysis of
the crater produced by 200 laser shots at F+20 showed that the crater base
was flatter than that produced by ablation at F0 with LFLE 70 J. The rate of
material removal was estimated at 0.38 pg/laser shot compared to 0.45
pg/laser shot for LFLE 70 J at F0. (The calculation used to obtain the rate of
material removal is given in Appendix 1).
Ablation at sample positions of F-50 and F+50 showed that large defocusing
either towards or away from the laser degraded depth profile performance
significantly, (Figure 9). In the case of ablation with LFLE 40 J, line gradients
172

increased with distance from the laser focal point, i.e. F+10 to F+30, (Figure 8).
As the sample was positioned further from the focal point, a more intense
plasma was induced near the focal point which absorbed more of the laser
radiation and decreased the amount of laser sampling.
For all the emission-time responses (Figures 7-9), the zinc and nickel lines
decreased at the same rate, indicating that zinc and nickel were removed at a
similar rate and selective volatilisation of zinc had not occurred. If boiling of the
sample at the laser spot had been a major process of material removal, it might
have been expected that zinc would be removed preferentially as it has a much
lower boiling point compared to nickel, (Zn 907 vs. Ni 2732 °C).
In summary, experiments have demonstrated that profile performance and
depth resolution were influenced by key operating parameters. Optimal depth
profile data were obtained using the operating parameters of sample positioned
20 mm from the laser focal point (away from the laser source, F+20), with
maximum available laser energy (laser flash lamp energy 70 J).
173

Figure 7
Emission-tim
e responses
for the ablation
of Zn/Ni coating on
steel (sample
P2, 2.7 pm
) at sample
positions F-20, FO
and F+20
with LFLE
40, 55 and
70J.
cnOl o m £7= 3CD 3CQ ~0
Emission Intensity (counts)
CD3o•5zc3crCD
oowCO
'oi5TcnCD-1v>ITo
3CD3o
roooc/>I TO
cn
1 7 4
Laser Sam
ple Position
Flash F-20
F 0
F+20

+CD
T |+N>O03CLT |+COo
T 1r~mo
n<5'c000m3(/>cno'3ir+*
30"i00"Oo30
CD3o*2zc.3cr
0 CD
<? s—< r-t-o
CO CO
=r00cx0r fo’3
cnoTCOCD
Ocncn o
m30(Q<
03T3
T]00
Emission Intensity (counts)
o o
+O
toOoCQ
T3II
N>ro
i
~o
n+N>O
T 1
+COo
000
(/)03T3_0"0O0
o'3
1 7 5
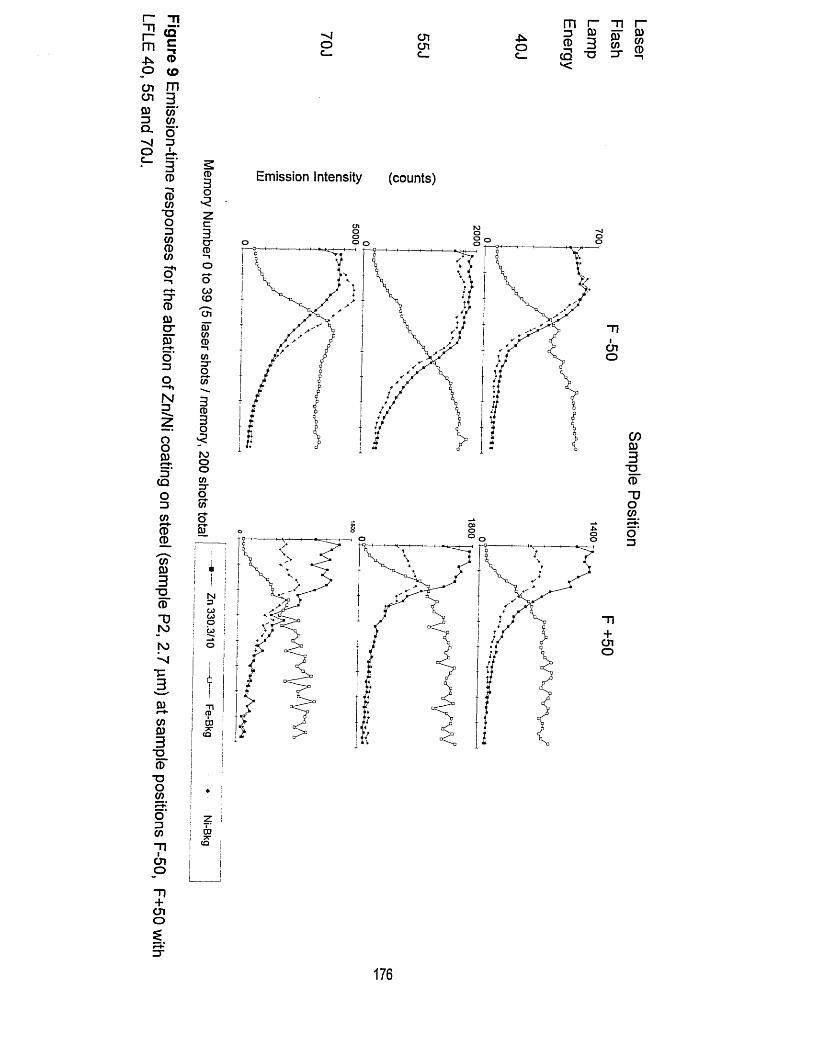
Figure 9
Emission-tim
e responses
for the ablation
of Zn/Ni coating
on steel (sam
ple P2, 2.7
pm) at sam
ple positions
F-50 F+50
with
LFLE 40, 55
and 70J.
*vjO cncn om £73 Q)a> g(Q TD
JJ03toZT
03 to 0
^ Emission Intensity (counts) o *2 •
cr O o
OCOtocn
~ncno
rooocno5T
i■I
N3 i CO 18 ! CO i
° !
A !I!n(Voo77 i ta I
176
Sample
Position

(a) Depth Resolution (Ad)
84% Zn maximumCOc<1)c
Zn maximumco'cocoE
LU 16% Zn maximum
OMA Memory NumberAd/ number of laser shots (time)
(b) DV2
cococ Zn maximum
depth1.cdr
OMA Memory Number / number of laser shots (time)
(C) Dx
Fe 322.6COc<D4-*cco
'coCO
ELU
Zn 330.3
depth3.cdr
OMA Memory Number / number of laser shots (time)D x
Figure 10 Emission-time responses of Zn 330.3 nm for the depth profile measurement of zinc/nickel coating on steel showing the calculation of: (a) depth resolution (Ad), (b) D1/4, and (c) Dx.
177

5.3.3 Depth profile performance and applications
This section examines depth profile performance and the application to a range
of different coatings on steel, zinc/nickel, zinc, tin, titanium nitride and an ultra-
thin chromium coating.
Zinc/nickel coatings
To demonstrate depth profile performance, laser-induced plasma emission
spectrometry measurements were performed on zinc/nickel-coated steels with
a range of coating thickness. Samples P4, P5 and P6 with coating thickness
2.7, 5.0, and 7.2 pm, respectively, were each ablated in triplicate. Operating
parameters were as above except the total number of laser shots utilised was
250 instead of 200 (5 laser shots in each of 50 OMA memories) in order to
remove the thicker coatings. Typical emission-time responses are depicted in
Figure 11 for each sample. These showed that the number of laser shots
needed to remove the coating increased with coating thickness; the number of
laser shots needed before the zinc signal decreased were 35, 60, and 90 for
2.7, 5.0, and 7.2 pm, respectively. The zinc and iron signals remained relatively
constant during the removal of the coating for each sample, and the nickel
response appeared to increase a little.
A correlation between output parameters for laser-induced plasma emission
spectrometry and coating thickness has not been previously reported. Possible
output parameters include D1A (distance along the x-axis from the origin to half
of the maximum zinc signal), Dx (the distance along the x-axis from the origin to
where the Zn and Fe lines cross), and zinc-area or nickel-area (the area under
a coating element profile line, Zn or Ni). The calculation of D1A and Dx is
depicted in Figure 10 b and 10c, respectively.
178

6000J
0
(b)6000
>.
(c)
Co'tn(0'ELU
0 10 20 40
Memory Number 0 to 49 (5 laser shots / memory, 250 shots total)
Zn330.3/10 — □— Fe-Bkg - - ♦ - - Ni-Bkg
Figure 11 Emission-time responses for the ablation of samples P4, P5 and P6 at sample position F+20 with laser flash lamp energy 70 J. Experiment run time 50 s. Coating thicknesses were: (a) P4 2.7 pm; (b) P5 5.0 pm; (c) P6 7.2 pm.
179

Linear plots of DYz, Dx and zinc-area against coating thickness were obtained,
but the nickel-area plot was curved. The curvature was probably caused by
spectral interference from iron on the nickel emission line, which had less effect
as the coating thickness increased. The line equations and correlation
coefficients were, respectively: (DV2) y = 8.66x + 13.28, 0.99986;
(Dx) y = 8.22x + 9.64c, 0.99942; (zinc-area) y = 128854x + 203881, 0.99999.
These results suggest that the LIPS output parameters D1/4, Dx and Zn-area are
proportional to coating thickness. This indicates that the rate of penetration into
the coating is constant with depth, i.e. the rate of material removal is constant
with depth, suggesting that each laser shot removes the same amount of
material. The linear relationship between these output parameters to coating
thickness indicates that laser-induced plasma emission spectrometry can
provide a measurement of coating thickness.
The repeatability of the coating measurement was calculated by ablating
sample P6 (7.2 pm) at eight different locations. Good precision (RSD) for the
zinc-area and nickel-area measurements were obtained, 4.0 and 3.7 %
respectively, suggesting that there was uniform coating thickness across the
area of material tested. This indicates that the technique can rapidly undertake
a coating thickness survey of coated samples.
To investigate the capability of the laser-induced plasma emission spectrometry
technique to provide spatial-depth information, two samples of zinc/nickel
coated steels (samples P1 and P2, both 2.7 pm thick) and a sample with a zinc
coating (Zn-A) were examined. Both zinc/nickel-coated samples were ablated
eight times and typical emission-time responses are depicted in Figure 12.
180

8000
Fe-bkg
g 4000
Ni-Bkg
Zn330.3/10
10 15 250 5 20 30 35 40Memory Number (5 laser shots / memory) ja328c.c2i
8000
Fe-Bkg
£ 4000
Ni-Bkg
Zn330.3/10
15 250 5 10 20 30 35 40
Memory Number (5 laser shots / memory) *>327c.c2i
Figure 12 Emission-time responses for the ablation at sample position F+20
with LFLE 70 J of two samples of Zn/Ni coating on steel (2.7 pm):
(a) P1, (b)P2.
The technique revealed differences within these coatings, although the samples
were suposedly very similar.11 In the case of P1, a larger number of laser shots
were required for the zinc and iron signals to reach minimum and maximum
levels, respectively, from the interface region to removal of the substrate. This
may indicate that the interface region for sample P1 was larger, suggesting that
the surface finish of the steel substrate was rougher which allowed the coating
deeper into the surface of the steel. There was a significant difference in the
181

profiles for nickel during the removal of the coating. For sample P1, the nickel
signal initially increased to -7500 counts, then decreased to ~5500 and
became level until memory number 8 before decreasing in the interface region.
For sample P2, the nickel signal increased steadily through the coating from
-3000 to -5000 counts. These observations suggest that for sample P1, the
concentration of nickel was decreasing through the coating, i.e. nickel was
richer near the surface, and for sample P2 the nickel concentration increased
slightly through the coating. These results suggest that depth profile
measurement using LIPS may be appropriate in the quality control of zinc/nickel
coatings on steel.
An emission-time response for the ablation of zinc on steel (sample Zn-A, 8 pm)
at sample position F+20 with 400 laser shots of LFLE 70 J is shown in Figure
16a. This depicts emission responses for zinc, aluminium and iron; the
emission wavelengths are listed in Table 2. The coating did not contain nickel
so the response for nickel is not shown. The emission-time response showed
an increase in the response for aluminium within the coating, with a maximum
at memory number 5 corresponding to 60 laser shots. This indicated that a
region of the coating, not at the surface, contained a significant amount of
aluminium. This was confirmed by analysis of the sample using glow discharge
optical emission spectrometry (GD-OES), undertaken by the sample supplier.
Figure 16b depicts the GD-OES emission-time profile with total time 800 s. The
aluminium layer appeared to be present at the interface region between the
zinc coating and steel substrate. Although the LIPS profile was not optimal, the
aluminium layer was clearly shown and the profile was much quicker to
measure by LIPS than by GD-OES, 80 vs. 800 s.
182

12000 -
Fe-bkg
i 438>.
| 6000 - c Zn330.3/10co'<nOTELU
Al-bkg
00 5 10 15 20 25 30 35 40
Memory Number (10 laser shots / memory) *eo=ew
(b)
0.00
Figure 13 Emission-time response fo the depth profile of sample Zn-A (8 pm Zn on steel): (a) using LIPS at sample position F+20 with laser flash lamp energy 70 J, 400 laser shots total, experiment run time 80 s; (b) using glow discharge - optical emission spectrometry, experiment run time 800 s
The emission-time characteristics from the ablation of this coating were
different from the zinc/nickel coatings discussed above. The zinc and iron
signatures did not exhibit a relatively constant signal response or sharp line
gradients corresponding to coating removal and interface region, respectively.
Also, considerably more laser shots were required to remove the zinc coating
183

compared to a sample of zinc/nickel coating, ~150 vs. ~400, respectively,
although the zinc coating was only -10% thicker than sample P6 above (7.2 vs.
8.0 pm). These results suggested that the process of ablation for a zinc coating
was different from a zinc/nickel coating. The rate of material removal for the
zinc coating was estimated to be 0.19 pg/laser shot, lower than for zinc/nickel
(0.45 jug/laser shot), both ablated under similar operating conditions. It is
proposed that this was caused by a matrix effect. During the laser pulse and at
the start of the plasma lifetime, a larger amount of zinc was vaporised than for
the zinc/nickel coating, because of the lower vaporisation temperature of zinc
compared to the zinc/nickel alloy. This extra material quickly cooled the plasma
as it entered, resulting in less material being removed during the remainder of
the plasma lifetime. Further studies including measurement of plasma
temperatures are required to investigate this effect and obtain operating
parameters suitable for optimised profile measurement of zinc coatings.
Tin coatings
Two spectra for the ablation of sample Sn1/1 are depicted in Figure 14. The
coating thickness of the sample was 1.48 pm, calculated from the tin coating
weight 10.8 gm'2, (the calculation is given in Appendix 1). The sample was
ablated using 1 laser shot / OMA memory and 60 shots total with the preferred
operating conditions described above. The spectral region utilised was 287-
SI 2 nm and the main emission wavelengths are listed in Table 3.
184

Sn 303.44000
Fe 298.4
Sn 300.9U)cDoo
Fe Bkg 299.6
§ 2000 c
Sn Bkg 304.4
c.2'inco
ELU
laser shot 60
laser shot 1
Ja421tx.c4
Wavelength 287-312 nm
Figure 14 Spectra for the ablation of Sn coating on steel (sample Sn1/1, coating weight 10.8 gnrf2) with LFLE 70 J at sample position F+20. Emission wavelengths (nm).
Wavelength (nm) Element Pixel Number
298.357 Fe I 480 m
299.621 Fe Background 520 m
300.914 Sn I 560
303.412 Sn I 640 m
304.391 Sn Background 671 m
m = monitored for emission-time response
Table 3 List of main element emission lines used in the study of tin coatings, (spectral region 287 - 312 nm, centre wavelength 300 nm)
The spectrum for laser shot 1 showed intense tin emissions from the coating
and small responses for iron, suggesting that the coating may contain iron or
that the steel substrate was penetrated with the first laser shot. Intense iron
signals from the ablation of the steel were observed for laser shot 60 together
185

with a small response for tin suggesting that removal of the tin was not
complete with 60 laser shots. It was found that 100 laser shots were sufficient
to remove the tin (50 OMA memories, 2 laser shots/OMA memory). A shift in
the spectral background, between the first and last shot, was caused by the
change in matrix from tin to iron as ablation of the steel substrate took place.
The background spectrum from iron was more intense than from tin, and so the
intensity of the background increased. Values for the intensity of the
background at 299.6 and 304.4 nm close to iron 298.4 and tin 303.4 nm lines,
respectively, were subtracted from the element emissions to correct for this
shift.
The samples with a tin coating (Table 1) and an uncoated steel blank (BAS
SS401) were analysed in duplicate to study the relationship of coating weight
with signal output. The repeatability of the technique was studied by ablating
samples Sn1/1 and Sn3/2 (10.8 and 1.44 gnr2) eight times. Emission-time
responses (tin, Fe and tin/Fe ratio) for the ablation of samples Sn1/1, 3/1 and
5/1 are shown in Figure 15. Both the number of laser shots needed to remove
the tin coating and the initial tin emission intensity increased with coating
weight. The number of laser shots required to reach a relatively constant iron
signal also increased, and the iron intensity corresponding to ablation of the
substrate was ~5000 counts in each case. A sharp transition in the tin and iron
signals was not observed, unlike the zinc and iron signals of the zinc on steel,
because there is no sharp interface between the tin and steel substrate. In the
manufacturing process,11 a tin-iron alloy approximately 0.1 pm deep was
produced at the tin-steel interface by heating of the material above the melting
point of tin (230°C). During the ablation process, signal responses from the tin
coating were observed followed by tin and iron from the interfacial tin-iron, and
finally iron from the steel substrate. Coating weights have been quoted for tin
coatings in the study as this better describes the total quantity of tin in the tin

and tin/iron layers. The rate of material removal was estimated from Talysurf
analysis to be 0.32 pg/laser shot.
(a)6000
0
(b)6000 T
(c)
Co'coCOE
LU
12000
0 =*H500 20 3010 40
Memory Number 0 to 49 (2 laser shots / memory, 100 shots total)
Sn303.4 Fe398.4 Sn/Fe*1000
Figure 15 Emission-time response for the ablation of Sn on steel. The experiment run time was 20 s using 100 laser shots. The Sn/Fe was x1000 to obtain the responses on the same scale. Samples were of different coating weight (a) Sn5/1, 2.8 gm'2, (b) Sn3/1, 6.0 gm'2, (c) Sn1/1, 10.8 gm'2.
187

The area under the tin profile line (tin-area), which combined the tin intensity
measurement with the number of shots needed to remove the coating, was
calculated as a measure of the tin coating weight. A linear calibration graph was
obtained for the plot of tin-area against coating weight (Figure 16). This
indicated that the output parameter, tin-area, was proportional to the amount of
tin deposited onto steel, and that LIPS could be used to measure coating
weights of tin on steel. Precision (% RSD) for the repeat measurements of
samples Sn1/1 and Sn3/2 was calculated for tin-area to be 3.5 and 6.6 %,
respectively. The result for sample Sn1/1 indicated that coating depth
measurements using LIPS can be achieved with good precision, and that the
tin coating was uniformly distributed across the steel. The poorer precision
obtained for Sn3/2 may be caused by the lower coating thickness, or it may
indicate that the tin was less-evenly distributed across the sample surface. By
comparison, Ka'ntor et al12 obtained an RSD value of 9.4 % for the replicate
measurements of gold coatings using a single shot laser ablation - flame atomic
absorption spectrometry technique.
In summary, the linearity of the calibrations and precision achieved with the tin-
area and zinc-area values suggest that these are suitable methods to measure
tin coating weight/zinc/nickel coating thickness in depth profile measurements
by LIPS. This performance coupled with the respective analysis times of 20 and
50 s indicates that laser-induced plasma emission spectrometry can provide
rapid depth profile data for tin and zinc/nickel coatings over the thickness range
0.3 to 7.2 pm.
188

co150000£Z
Z5
CD5^ 120000
CDCOI£Z
CO
90000
4 —' 6000000£ZCD
4 — ’c= 30000co'cocoE
LU 0 63 9 1512
Coating Weight of Sn (g/m2)
Figure 16 Plot of area under Sn profile line (Sn-area) against Sn coating weight
for the ablation of different samples of Sn coating on steel.
Titanium nitride coating
The ablation of a titanium nitride coating (coating thickness 2 pm) is shown in
Figure 17, which depicts spectra for laser shot number 1 and 100. The spectral
region 287-312 nm was selected because it contained titanium and iron
emission lines that were relatively free from spectral interference. The first laser
shot (1) showed intense emission responses for titanium from the coating and
no responses for iron and chromium from the stainless steel substrate. This
suggested that the coating did not contain iron or chromium and the first laser
shot did not penetrate the coating. The last laser shot (100) showed strong
emission responses for iron and chromium form the substrate and minimal
responses for titanium, indicating that ablation of the substrate had taken place
and removal of the coating was virtually complete. An emission-time response
189

is shown in Figure 18 using the emission wavelengths listed in Table 4. To
correct for the observed shifts in background, the emission intensity values for
chromium, iron and titanium were corrected by subtraction of the intensity value
from the corresponding background wavelength, e.g. chromium 288.9 -
Background 289.3 nm (Cr-Bkg).
3000
Ti 308.7
Ti 307.2
toc3O
J5 1500 c
Ti 310.4
Fe 298.4laser shot 1co
‘coCO
EI II
Cr 288.9Ti Bkg 308.4
Cr Bkg 289.3 laser shot 100Fe Bkg 299.7
Wavelength 287 - 312 nm
Figure 17 Overlay of spectra for the ablation of titanium nitride coating on steel
(sample TiN-1, coating thickness 2jim) at sample position F0 with LFLE 40 J.
Spectral region 267-312 nm, emission wavelengths (nm).
190

9000Fe-Bkg
5 4500 - Cr-Bkg
Ti-Bkg
15 20 25 400 5 10 30 35Memory Number (5 laser shots/memory) mr406.c20
Figure 18 Emission-time response for the ablation of titanium nitride on steel
(sample TiN-1, coating thickness 2 pm) at sample position F+20 and
LFLE 70 J.
Wavelength (nm) Element Pixel Number
288.929 Cr II 202 m
289.302 Cr Background 212 m
298.357 Fe I 479 m
299.747 Fe Background 520 m
307.211* 307.297* Ti II, II 762 m
308.373 Ti Background 795 m
308.718 Ti II 809
* unresolved emission lines m = monitored for emission-time response
Table 4 List of main element emission lines used in the study of titanium nitride
coatings. Spectral region 287-312 nm, centre wavelength 300 nm.
191

The emission-time signatures were different from those of the zinc/nickel
coating discussed above. There were no sharp line gradients for titanium,
chromium or iron corresponding to an interface region. The titanium signal
showed a gradual decrease through the profile while the chromium and iron
signals increased quite steeply until about memory number 5, then increased
gradually for the remainder of the profile. The rate of material removal was
estimated to be 0.17 pg/laser shot from Talysurf analysis of the resultant crater.
The differences in the emission-time signatures were probably caused by
matrix effects, as with the zinc coating above, which may influence the ablation
process in a number of ways and require further study. Different physical
properties of the coating elements may have affected plasma characteristics
which in turn influenced the relative rate of material removal and depth profile
performance. The high affinity of titanium for oxygen may have caused the
formation of titanium dioxide during the ablation process which interfered with
the material removal process. Ablation in an oxygen-free buffer gas is likely to
reduce this possible interference. Further investigation of the effects of
operating conditions with this coating may enable improved emission-time
signatures and depth profile calibrations to be achieved.
Ultra-thin chromium coating
The above studies have shown that useful depth profile data can be obtained
for coatings with thickness ranging from 0.4 to 8 pm. This section examines the
feasibility of utilising LIPS to obtain information about an ultra-thin coating of
chromium on steel. Spectra for the ablation of chromium on steel (coating
thickness 20 nm) using operating conditions of LFLE 40 J and sample position
F0 are depicted in Figure 19. The spectral region utilised was 267-292 nm
because iron and chromium emission signals could be monitored with minimal
spectral interference. The experiment run time was 2 s with 10 laser shots.
192

Cr 283.6Fe 276.6
Background
278.6
laser shot 1
5 1500
laser shot 2
0nv3012tb.xls
Wavelength 267 - 292 nm
Figure 19 Spectra for the ablation of Cr on steel (coating thickness 20 nm) with
LFLE 70 J at sample position F+20.
The spectrum for laser shot 1 showed intense emissions for chromium and
strong responses for iron, while the spectrum for laser shot 2 showed similar
responses for iron but only small signals for chromium. This indicated that the
chromium coating was detected with the first laser shot. In Figure 20, an
emission-time response of iron 276.6, chromium 283.6, Background 278.6 nm
and the chromium/iron ratio shows the chromium signal to decrease sharply
from laser shot 1 to 2 and then increase a little. The chromium/iron ratio was
initially very large when the chromium was removed, but was constant after
memory number 1 as the substrate was ablated. The iron response increased
after memory number 1 for the remainder of the profile; also there was a small
increase in the background intensity during the profile. These observations
suggested that the first laser shot removed the chromium coating and a
substantial amount of steel substrate. Laser shot 2 and the following laser shots
ablated substrate only. The amount of chromium detected with the first laser
shot was estimated to be 0.22 pg, (calculation in Appendix 1).
193

These results indicate that LIPS can be applied to the rapid detection of ultra-
thin coatings, but more work is required to develop a measurement capability.
Further study may enable the amount of substrate removed by the first laser
shots to be significantly reduced in order that coating only is ablated with the
first laser shot. Towards this aim, it may be advantageous to use the laser
solely as a sampling tool so that laser operating parameters are optimised for
minimal mass removal and are not compromised by the requirements of in situ
emission spectrometry. This could be achieved by removing ablated material to
a separate analytical measurement system such as an inductively coupled
plasma mass spectrometer. However, measurement times would be greatly
increased to allow for discreet transport and detection of material ablated by
each laser shot.
900
Fe 276.6___
450
Cr 283.6
Cr/Fe
Bkg 278.60
94 80 1 2 3 5 6 7Memory Number (1 laser shot / memory)
Figure 20 Emission-time response for the ablation of Cr on steel (coating
thickness 20 nm) with LFLE 40 J at sample position F0.
194

5.4 Conclusions and Recommendations for Further Work
This study has shown that rapid depth profiling of coatings can be achieved
with laser-induced plasma emission spectrometry. Emission-time signatures for
the ablation of zinc/nickel coatings on steel were greatly influenced by
operating parameters such as laser energy and sample position relative to the
laser focal point. Improved performance was realised with high laser energy
(laser flash lamp energy 70J) and the sample positioned 20 mm from the focus
position, away from the laser source. The use of these operating conditions
enabled linear calibration against coating thickness for zinc/nickel and tin
coatings to be achieved with good precision (3.5 % RSD). Advantages include
rapid measurement time (50 s for zinc/nickel, 7.2 pm) and small area of
damage (~1 mm diameter) compared to glow discharge techniques (15
minutes, 10 mm diamter crater). A simple measurement strategy was utilised
which involved ablation in air at atmospheric pressure. A limitation of the
technique is absolute depth resolution (Ad) compared to glow discharge
methods, 1.1 vs. 0.1 pm, although differences in depth of 0.02 pm for tin
coatings were distinguished by the technique. This performance combined with
an in situ measurement capability indicates that the technique may be valuable
in industrial situations where rapid coating measurements are required.
Different emission-time signatures and rates of material removal were obtained
for the ablation of different coatings, which indicated that the composition of the
coating influenced plasma characteristics through complex matrix effects. This
suggested that the processes involved in depth profiling with LIPS were
complex and that different operating conditions may be required for each
coating type. Studies with additional techniques e.g. high speed photography,
imaging spectroscopy 13,14 would provide more information regarding plasma
characteristics which may further understanding of the material removal
processes and matrix effects.
195

Further work could apply the technique to the study of coatings of greater
thickness such as 50 or 100 pm. Measurement times could be reduced by
removing the coating at a higher rate, either by ablation at a higher repetition
rate, or by using a shorter focal length focus lens that would produce a smaller
laser spot with associated higher irradiance. In both cases, more energy per
unit area and time would be delivered to the sample surface causing additional
heating in the vicinity of the laser spot. Further work would address the effects
of these changes and study other parameters which may influence profile
performance. For example, sample cooling, e.g. cryogenic, could be required to
dissipate the additional heat input, and the use of a buffer gas such as argon,
helium, might improve analytical performance. For example, in an argon
atmosphere, a denser plasma would be induced that may reduce laser-material
interaction and promote more even sampling.
196

5.5 References
1. Silman H. and Isserlis G., Protective and Decorative Coatings for Metals,
Averill AF, Finishing Publications Ltd., Teddington, UK, 1978.
2. Grissler W. and Jehn H. A., Editors, Advanced Techniques for Surface
Engineering, Kluwer Academic Publishers, London, UK, 1992.
3. Briggs D. and Seah M. P., Editors, Practical Surface Analysis by Auger and
X-ray Photoelectron Spectroscopy, Wiley, New York, 1985.
4. Bengtson A. and Danielson L., Thin Solid Films, 1985, 124, 231-236.
Depth Profiling of Thin Films Using A Grimm-type Glow Discharge Lamp.
5. Hall D. J. and Sanderson N. E., Surface and Interface Analysis, 1988,
11, 40-44. Quantitative Depth Profiling By Glow Discharge Mass
Spectrometry.
6. Raith A., Hutton R. C. and Huneke J. C., Journal of Analytical Atomic
Spectrometry, 1993, 8 (6), 867. Optimisation Of Quantitative Depth Profiling
With Glow Discharge Mass Spectrometry. Part 1: Optimisation Studies On
Crater Shapes And Time - Depth Conversion.
7. Bengtson A., Spectrochimica Acta, 1985, 40B (4), 631-639. A Contribution
To The Solution Of The Problem Of Quantification In Surface Analysis Work
Using Glow Discharge Atomic Emission Spectrometry.
8. Anderson D. R., McLeod C. W., English T., and Smith A. T., submitted to
Applied Spectroscopy, 7, 1994. Depth Profile Studies Using
Laser-Induced Plasma Emission Spectrometry.
9. Piepmeier E. H., in Analytical Applications of Lasers, editor Piepmeier E. H.,
Wiley New York, 1986, pp 635-639.
10. Oechsner H., Editor, Thin Film and Depth Profile Analysis, Springer-Verlag,
Berlin, 1984.
197

11. Personal Communication, English T., British Steel Technical, Swinden
Laboratories, Rotherham, UK.
12. Ka'ntor T., Bezur L., Pungor E., Fodor P., Nagy-Balogh J. and Heincz G.,
Spectrochimica Acta, 1979, 34B, 341-357. Determination Of The Thickness
Of Silver, Gold, And Nickel Layers By A Laser Microprobe And Flame
Atomic Absorption Techniques.
13. lida Y., Morikawa H., Tsuge A,. Uwamino Y. and Ishizuka T., Analytical
Science, 1991, 7 (1), 61-64. Laser Induced Plasmas With An Optical
Imaging Spectrometer.
14. Geersten C., Briand A., Chartier F., Lacour J. L., Mauchien P., Sjostrom S.
and Mermet J. M., Journal of Analytical Atomic Spectroscopy, 1994, 9,
17-22. Comparison Between Infrared And Ultraviolet Laser Ablation At
Atmospheric Pressure - Implications for Solid Sampling ICP Spectrometry.
198

Chapter 6
The Discrimination Of Laser-Induced Plasma Emission Spectra
Using Artificial Neural Networks
199

6.1 Introduction
Laser-induced plasma emission spectrometry has been used in several
demanding applications such as the monitoring of steel and rubber productions,
etc. because of its unique advantages, non-invasive, in situ, rapid elemental
analysis. One disadvantage of the technique, however, is complex emission
spectra. Emission spectra are complex because of the high temperatures of the
laser-induced plasma. Intensified photodiode arrays allow time-resolved
measurement, which enables analyte emission signals to be separated in time
from the initial, intense background continuum. This reduces the problem
somewhat, but plasma temperatures are still relatively high, resulting in
complex emission spectra for many elements. In addition, many elements
produce spectra with complicated baselines that contain background shifts.
These spectral problems cause spectral interferences in the identification and
measurement of emission lines.
The photodiode array generally requires wavelength calibration for each
spectral region monitored. This can be achieved by locating known emission
lines on the array from a discharge lamp or from the ablation of pure metals.
The identification of unknown spectra requires each emission line to identified
as a wavelength value (nm) and this value compared to wavelength tables.1
This is achieved manually, which is usually very time consuming, or
alternatively, a specially-written computer software routine is employed. For
example, Chau et a l2 recently reported such a package that combined
wavelength calibration with a database for identification of elements for
unknown spectra. Langsam et a l3 developed a computer program which
matches spectra against standard wavelengths from tables.
200

In this study, a novel alternative approach is devised which is based on the
application of artificial neural networks (ANNs) to laser-induced plasma
emission spectra. Artificial neural networks are a form of artificial intelligence
(Al). An important feature of ANNs is the ability to learn by example.
Conventional computer programs use techniques such as logic-tree routines to
process data. In the case of identifying an element from emission lines within a
spectrum, this requires the prior knowledge of the position and identification of
emission wavelengths for the elements of interest. In this study, each spectrum
is presented to the ANN and the network selects appropriate features and
learns to recognise these patterns. The network can then identify one of these
spectra when a spectrum is presented again.
An ANN is a greatly simplified computer model of the human brain and can be
trained to recognise different signals or patterns.4 When the ANN has been
successfully trained, it can very rapidly identify unknown signals corresponding
to the trained patterns. Artificial neural networks are particularly effective when
signals are noisy and conventional statistical methods such as discriminant
analysis are not suitable. They have been used in several pattern recognition
applications which produce complex signals, such as spectrum analysis of
electro-encapholograph data (EEG)5 in order to identify patients with brain
disorders. Other applications include radar signal processing,6 optical character
recognition,7 and speech recognition and synthesis.7 In the field of chemical
engineering, ANNs have been applied to problems such as predicting flow rates
in stirred tank reactors.8 In analytical chemistry, ANNs have been used to
successfully differentiate spectra for different polymeric materials produced by
laser ablation ion mobility spectrometry (LA-IMS).9 Artificial neural networks
were applied to the calibration of iron/nickel/chromium samples in X-ray
fluorescence spectrometry10 and to the processing of signals from ion-selective
electrodes.11 Meyer et al12 applied ANNs to the interpretation of infrared
201

spectra from a low resolution spectrometer. The trained ANNs were able to
recognise the functional groups of 50 compounds with a success rate of 76.2
%. A tutorial review has been presented by Bos et al.13 Hieftje and Glick14
applied ANNs to glow discharge optical emission spectrometry in order to
classify a range of metal alloys. Emission wavelengths were selected manually
for 7 elements representative of the different alloy types, and the intensity
values of these wavelengths were presented to the ANN.
The aim of this study is to assess the application of ANNs to the identification of
emission spectra (patterns) from LIPS in order to differentiate materials.
Emission spectra for 7 elements (Cu, Sn, Ti, Zn, Sb, Al and Ca) covering a
25 nm wavelength region have been directly applied to ANNs following a
computerised feature extraction procedure. These elements were selected so
that the ANNs would examine a range of spectral characteristics. For example,
within the spectral region 307 - 332 nm, the spectrum for copper is relatively
simple with just 2 emission lines, the spectrum for antimony contains 9
emission lines, and the spectrum for titanium is very complex with more than 20
lines and several background shifts. This ANN approach has several potential
advantages: element emission wavelengths are not identified or assigned,
wavelength calibration of the array is not required, and spectral interferences
may not be problem. Although only 7 elements were included in the study, the
technique may be applicable to any number of elements. The feature extraction
procedure and ANNs are described, and results for the training and test modes
of operation are presented. Aspects of this work are being prepared for
publication.
202

6.2 Artificial neural networks
6.2.1 Historical
The biological origins of neural networks stem from research and theories of
processes of the brain in the 1890s by James, and in the 1940s by McCulloch
and Pitts.4 Rosenblatt in 1958 modelled a neural network structure, called a
perceptron, on a computer using these biological ideas, and hence the term,
artificial neural network. In 1960, Widrow and Hoff simulated ANNs on a
computer and developed a hardware device, an adaline (adaptive linear), that
consisted of a single neuron with several inputs. However, in 1969, research in
this field effectively stopped with the publication of a book by Minsky and
Papert entitled Perceptrons.15 They showed that ANNs available then had very
limited capabilities. The ANNs were simple structures of only two layers, input
and output, and the neurons had only on or off values. It was not until 1986 that
major interest was revived with the publication of Parallel Distributed
Processing, edited by McClelland and Rumelhart.16 They presented multi-level
perceptrons (input, hidden, output layers) and the derivation of the error back-
propagation learning rule for this structure. These were combined with other
works, the sigmoid transfer function (Grossberg, 1973), and continuously-
valued neurons (Hopfield, 1984), to provide powerful ANNs that have the
capability to solve complex problems. Since then, these ANNs have been used
in many diverse applications.
6.2.2 Theory
The type of ANN used in this work is a multi-layer perceptron and consists of
three layers of neurons: input, one or more hidden layers and an output layer. A
simple network is shown in Figure 1. A neuron (neurode, node or unit) is a
simulated device that receives and sends signals. Each neuron is connected to
every neuron of the adjacent layer(s). Each connection has an associated
connecting weight that controls the amount of influence that the input has upon
203

a neuron. Data flows from the input through the hidden layer to the output, i.e. a
feedforward network.
OUTPUT
connecting weights w(
connecting weights Wjj
node
INPUT
Ouput layer k
Hidden layer j
Input layer i
Figure 1 Structure of a back-propagation ANN
When a hidden layer neuron receives signals from the input neurons, it sums
the signals, transforms the sum, and sends the result to the neurons in the next
layer. The output layer repeats this process and displays the result of the test,
i.e. output values that correspond to the input pattern.
The ANNs are used in two modes, training and test (use). Supervised, back-
propagation networks are used here, which means that the training phase is
supervised, i.e. the network is presented with the patterns and the desired
output values. The input patterns and the resulting output values are compared
with the desired output values. The connecting weights are adapted via an error
back-propagation method to cause the output values to be changed so that
204

they become closer in value to the desired outputs. This learning process is
repeated until the ANN can correctly discriminate between the categories. In
the test mode, unknown patterns are presented for the ANN to recognise.
This process is very rapid due to the parallel structure of the network. The
unknown patterns must be of the same types as the training classes.
In the training and test modes, feedforward calculations are used by the hidden
and output neurons to process the input data and produce the output response
of the network, (Figure 2). The first calculation (combining function) combines
the inputs by multiplying each input by its associated weight. The net input is
the sum of these results.
x n
v / n
combiningfunction
transferfunction >• Output f (i)
w 2x2
w 1
x 1
Figure 2 Diagram of a neuron in a neural network
The second calculation (transfer function) transforms this net input (i) with a
non-linear sigmoid function, shown in Figure 3.
output = / (i) =1
1 + exp [-( i + 0 j ) / 0 o ]
where 0j is the threshold value (or bias) which shifts the transfer function along
the horizontal axis, and 0O is a constant which determines the slope of the
sigmoid.
205

1.0
f (*) Output
high value of 0,
0.5
low value of 0,
Input i
Figure 3 Sigmoid transfer function
During the training mode, these calculations are combined with additional
calculations that represent the learning of the network. The output values
obtained are compared to the desired values and the difference is defined by
an error function, E. The aim of the learning process is to reduce the error E as
quickly as possible. This is achieved using the error back-propagation rule
(generalised delta rule) that propagates the error back through the network in
order to adjust the connecting weights. This is described in detail
elsewhere.7,16,17 The change in weight value (AWjj) is calculated as:
AWjj = p E / (i) + a AWjj (previous)
where a is the momentum factor and is used to overcome a problem called
‘local energy minima’ and p is the learning rate which affects the speed of
learning. Both have values of between 0 and 1. This learning process is
repeated many times until training is complete, i.e. the network can successfully
identify the input patterns.
206

6.3 Feature extraction
Feature extraction is a procedure used to identify the most discriminating
variables of a pattern and thereby reduce the number of input data points.
Ideally, all of the data from a spectrum would be presented to the ANN, i.e. the
values from all 1024 pixels of the photodiode array. However, this would require
an unacceptably large computer memory and a very long processing time. A
more appropriate method is to extract features from the spectrum that will
adequately describe the spectrum.
There are several possible methods to achieve the feature extraction. In the
study of the discrimination of polymeric materials by laser ablation-ion mobility
spectrometry,7 a moving average window was used that averaged the values of
each group of three pixels. This procedure performed well because the ion
mobility spectrometry signatures were relatively simple broad peaks. In this
study, a new feature extraction procedure, peak intensity-wavelength
identification (PIWI), was devised because the spectra are more complex and
contain more information than the ion mobility spectrometry signatures. The
peak intensity-wavelength identification procedure is depicted in Figure 4.
207

100 ignored pixels
124 ignored pixels
800 pixels (data points)20 regions,
each of 40 pixelspeak intensity and wavelength position
(2 features)
Figure 4 Schematic of the feature extraction procedure, peak intensity -
wavelength identification (PIWI)
Each spectrum consisted of 1024 pixels (data points), of which the central -730
were intensified. The procedure ignores the first 100 and last 124 because
these pixels are not intensified and their values are always 0. A region of 800
pixels remained which approximated to the intensified pixels. This even number
of pixels was divided into smaller regions, i.e. 20 regions each of 40 pixels. For
each region the intensity value of the highest point and the corresponding pixel
position (wavelength) were identified, i.e. 2 features per region. The procedure
resulted in 40 features and these were presented to the ANN.
Two advantages of the PIWI procedure are that main features of each
spectrum are extracted, i.e. the pixel position (wavelength) and intensity of
major peaks, and it is relatively easy to change the size of the regions so that
208

feature resolution could be increased for later studies, if necessary, e.g. 40 to
20 pixels.
6.3 Experimental
The laser and spectrometer system used are described in Chapter 2. The
background subtraction routine was utilised with the laser firing at 5 Hz and with
laser flash lamp energy 40 J. A fixed time OMA program was used with time
settings of time delay of 700 ns and integration time of 1 ps. The spectral region
307-332 nm was monitored by the photodiode array using grating 2 (2400
grooves/mm). The seven materials listed in Table 1 were each ablated with 20
laser shots at the same site, (experiment run time 4 s). A pellet was made of
the calcium carbonate powder by pressing in a die to a pressure of 10 tons per
square inch.
Material Details
Cu copper metal foil, BDH Analar, Merck Ltd., Lutterworth,
Leicestershire, UK
Sn tin metal rod, Specpure, Johnson Matthey, Royston,
Hertfordshire, UK
Ti titanium metal, IMI Titanium Ltd, Witton, Birmingham
UK
Zn zinc metal, BCS194d, Bureau of Analysed Standards,
Newham Hall, Newby, Cleveland, UK
Sb antimony metal rod, Specpure, Johnson Matthey
Al aluminium metal, BCS198e, Bureau of Analysed
Standards
Ca calcium carbonate powder, BDH Analar
Table 1 Details of the materials used in the study
209

6.3.1 Data manipulation
The ablation of the samples resulted in a data file for each sample which
contained 20 spectra. Each data file was divided in 2 files to provide training
and test data, i.e. a training file and a test file, each containing 10 spectra.
These files were converted into ASCII format and were subjected to the feature
extraction routine (PIWI) using a purpose-written program.18 The maximum
intensity of each spectrum was normalised to 1.0 relative to the most intense
spectrum of the entire group.
The data files from this step were taken into a spreadsheet program (Microsoft
Excel) and each material was assigned a binary code that could be used by the
ANN (Table 2). All the training files were merged in a spreadsheet to produce a
single training file, and all the test files were merged to give a single test file.
The layout of each file is shown in Table 3. The order of the training file was
more mixed so that possible bias in the training of the network was minimised.
Material Code
1 Cu 0 0 0 0
2 Sn 0 0 0 1
3 Ti 00 10
4 Zn 00 11
5 Sb 0 10 0
6 Al 0 10 1
7 Ca 0 1 1 0
Table 2 Output codes for each material
210

TRAINING TEST
material 1 spectrum 1 material 1 spectrum 1
2 1 1 2
3 1 1 3
4 1 1 4
5 1 1 5
6 1 1 6
7 1 1 7
material 1 spectrum 2 1 8
2 2 1 9
3 2 1 10
4 2 material 2 spectrum 1
5 2 2 2
6 2 2 3
7 2 2 4
material 1 spectrum 3 2 5
2 3 2 6
3 3 2 7
4 3 2 8
5 3 2 9
6 3 2 10
7 3 material 3 spectrum 1
etc. etc. etc. etc.
Table 3 Layout of training and test data files
211

6.3.2 Artificial neural networks
The program used was a commercially available package (NeuralWare
Pittsburg, USA) and was run on an IBM-compatible personal computer (Viglen
486 DX2 66 MHz, Alperton, Middlesex). The program allowed different network
structures to be constructed, containing up to a maximum of 100 neurons. The
ANNs used always had 40 input and 4 output neurons. This enabled
differentiation of up to 16 materials (classes). The values of the output neurons
were always between 0 and 1.
The error back-propagation method of learning was used and values of a,p,0o
were 0.6, 0.9 and 1, respectively. The patterns in the training file were used to
train the ANN. The training was stopped after 100,000 iterations, and the ANN
was then used in the test mode and tested with the training and test files.
6.4 Results and Discussion
A typical spectrum for the ablation of each material is depicted in Figure 4 and
principal emission lines are listed in Table 4. The spectrum for titanium is very
complex with many emission lines and several shifts in background. The other
spectra are less complex but antimony and tin also contain several emission
lines. Emission lines for titanium, copper, antimony, tin and zinc are similar in
wavelength and there are several spectral overlaps. The 7 spectra are overlaid
in Figure 5 which illustrates the potential complexity of the problem and
closeness of many emission lines. The large variation in emission intensities
between laser shots, shown for calcium in Figures 7 and 8, might also present
problems in the discrimination process. The precision was estimated to be -18
% relative standard deviation (% RSD) for both Ca emission lines. The ablation
of other materials resulted in precision of typically -9 % RSD (copper). The
pixel positions for the emission lines did not vary and were the same for each
laser shot.
212

Element Wavelength (nm)
Al I 308.2 i 5
Al I 309.271
Ca II 315.887
Ca II 317.933
Cu I 324.754
Cu I 327.396
Sb I 323.252
Sb I 326.751
Sn I 317.502
Sn I 326.233
Sn II 328.321
Ti II II * 323.612, 323.904 *
Zn I 328.233
Zn I 330.259
* unresolved emission lines
Table 4 Principal emission wavelengths of the elements studied
213

Emiss
ionl
nten
sity
/ cou
nts
1000 3000 Ca
1500 Cu 2000 Sb
3000 Ti2500 Sn
5000 Zn
Wavelength 307 - 332 nm
Figure 5 Emission spectra for the ablation of the seven materials.
(Principal emission lines are listed in Table 4)
214

Figure 6
Overlay
of the em
ission spectra
for the ablation
of the seven
materials
Emission Intensity (counts)
O
cf
O CD H N Cfl > O
215
4500

Emission Intensity (counts)
Figure 7 Emission intensity-wavelength-time response for the ablation ofcalcium carbonate. Each spectrum was produced by a single laser shot at thesame sample site.
216

4000 -
'ww
Ca 315.9
Ca317.9
Bkg312.9 j
ELU
aju ll Ib.cls
0 £ 0
r ;~t t------2 3 4 5
Laser Shot Number8 9
Figure 8 Emission-time response for the ablation of calcium carbonate
The performance of ANNs with either one or two hidden layers and with
different number of nodes in the hidden layer(s) was investigated. Artificial
neural networks with these different structures were trained with the training file
and then tested. Results indicated that for best performance, i.e. least error, the
network should have one hidden layer containing 10 neurons. With this
structure and after 100,000 iterations, it was possible to discriminate all
materials with an accuracy of 100% both in the training and test phases.
Typical results for the test mode are shown in Table 5. Performance can be
assessed by comparing the output values with the desired values for each
material, and by considering the variation of the output code for each material
(standard deviation). In each case, the output 0.0 values approximate to 0.0
and the output 1.0 values are very close to 1.0. The highest 0.0 value was
0.0207 and the lowest 1.0 value was 0.9924. This shows that the ANN was
100% successful in discriminating between the materials. The low standard
217

deviation values that were obtained indicate that the ANN could achieve these
results with good precision.
Material Output Values
Cu desiredmeanSD
0.00000000.00019040.0000106
0.00000000.00079010.0002525
0.00000000.00028280.0000471
0.00000000.00965720.0039918
Sn desiredmeanSD
0.00000000.00046660.0000048
0.00000000.00000000.0000000
0.00000000.00106270.0001611
1.00000000.99571020.0001133
Ti desiredmeanSD
0.00000000.00038180.0000053
0.00000000.02066840.0101062
1.00000000.99558310.0016062
0.00000000.00720320.0014532
Zn desiredmeanSD
0.00000000.00230460.0000343
0.00000000.00000000.0000000
1.00000000.99704760.0001284
1.00000000.99856140.0000148
Sb desiredmeanSD
0.00000000.00026710.0000023
1.00000000.99238600.0009371
0.00000000.00103460.0001042
0.00000000.00000000.0000000
Al desiredmeanSD
0.00000000.00044470.0000095
1.00000000.99406600.0014241
0.00000000.00320400.0009869
1.00000000.99812070.0010057
Ca desiredmeanSD
0.00000000.00078540.0000108
1.00000000.97583060.0184683
1.00000000.99997500.0000117
0.00000000.00119660.0001456
SD = standard deviation, n = 10
Table 5 Typical output response from the artificial neural network for the test
data
218

ANNs with more neurons in the hidden layer or with two hidden layers were
also found to be successful. It is beneficial, however, to use the successful
structure with the smaller number of neurons in the hidden layer. If the structure
is over-complex training might not be successful. Using a smaller number of
neurons in the hidden layer allows more neurons to be used in the other layers,
if required. When fewer than 10 neurons were used in the hidden layer, either
successful training was not achieved or performance was not satisfactory (0.0
values not approximating to 0.0, 1.0 values not close to 1.0).
These results indicate that ANNs can be successfully used to discriminate the
complex spectra from laser-induced plasma emission spectrometry. This was
achieved without the wavelength-calibration of the photodiode array detector, or
the identification and assignment of element emission wavelengths. The
emission spectra from 7 materials have been discriminated here, and the
network can be further trained in the present form to identify a larger number of
materials. By increasing the number of output neurones to 5 or 6 then the
number of materials in the database could be increased up to 32 or 64,
respectively. This qualitative measurement may be useful in the sorting of
metals, alloys or plastics containing inorganic additives, provided the ANNs are
trained on the spectrum for each material. As the discrimination process is very
fast, it should be possible to achieve on-line measurements with identification of
the spectrum from each laser shot.
A limitation to the technique is that the ANNs used in this study can only
recognise the types of signals that they have been trained with. So, for
example, if a sample contained a mixture of titanium and Al, then the ANNs
would need to be trained to recognise this mixture. Also there is limited
capability towards quantitative measurements. The use of other types of ANN,
such as Kohonen networks, could resolve these problems. Kohonen networks
219

are self-organised and enable training without supervision, i.e. unsupervised
networks; the input patterns are presented only, and the network organises, or
trains, itself. An advantage of this type of ANN is that there are many more
output neurons, e.g. 100, which enable a greater level of description of the
input patterns to be achieved, and this may be more suitable to quantitative
applications.
6.5 Conclusions and Recommendations For Further Work
Artificial neural networks (ANNs) have been successfully used for pattern
recognition of spectra generated by laser-induced plasma emission
spectrometry. The technique was applied to 7 materials and it was possible to
identify all training and test spectra with an accuracy of 100%. This success
rate and the rapid discrimination time indicates that the technique combined
with laser-induced plasma emission spectrometry may be useful in on-line
industrial situations where, for example, rapid sorting of materials is required.
With further work, the technique could be applied to a wider spectral region,
e.g. 100 or 200 nm, that encompasses emission lines for more elements. The
wider spectral region could be achieved here by using a lower resolution grating
in the spectrometer. The lower resolution would probably lead to many spectral
interferences that would interfere with element identification by conventional
techniques of wavelength identification. With the ANN technique, spectral
interferences would probably not present a problem because the feature
extraction program and the ANNs examine the whole wavelength region and
not just pre-determined emission lines. The data base could be expanded with
further work to include other metals, alloys or plastics containing inorganic
additives, and investigate the use of other types of artificial neural networks in
quantitative analysis.
220

6.6 References
1. Harrison G. R., Wavelength Tables with Intensities in Arc, Spark or
Discharge Tube, M.I.T. Press, Cambridge, Mass., USA, 1969.
2. Chau F. T, Lau K. S., Wong K. H., Mak C. H. and Wong W. K., Laboratory
Microcomputer, 1990, 9, (3), 88-93. A Software Package For Spectrum
Processing Of A Laser Induced Plasma Spectrometer.
3. Langsam Y., Tenenbaum A. and Thurm J., Journal of Chemical Information
Computer Science, 1980, 20 (4), 230-234. Computer-Aided Spectral
Identification Of Laser-Induced Plasma Emission.
4. Eberhart R. C. and Dobbins R. W., in Neural Network PC Tools, Eberhart
R. C. and Dobbins R. W., Editors, Academic Press, San Diego, USA, 1990,
pp 9-34.
5. Saatchi R. and Jervis B. W., Computing Control Engineering Journal, 1991,
2, 61-68. PC-Based Integrated System Developed To Diagnose Specific
Brain Disorders.
6. Sigiliito V. G. and Hutton L. V., in Neural Network PC Tools, Eberhart
R. C. and Dobbins R. W., Editors, Academic Press, San Diego, USA, 1990,
pp 235-250.
7. Beale R. and Jackson T., Neural Computing: An Introduction, Adam Hilger,
Bristol, UK, 1990.
8. Bhagat P., Chemical Engineering Progress, 1990, August, 55-60.
An Introduction To Neural Nets.
9. Simpson M., Anderson D. R., McLeod C. W., Cooke M. and Saatchi R,,
Analyst, 1993, 118, 1293-1298. Use Of Pattern Recognition For Signatures
Generated By Laser Desorption-lon Mobility Spectrometry Of Polymeric
Materials.
221

10. Bos M. and Weber H. T., Analytica Chimica Acta, 1991, 247, 97-105.
Comparison Of The Training Of Neural Networks For Quantitative X-ray
Fluorescence Spectrometry By A Genetic Algorithm And Backward Error
Propagation.
11. Bos A., Bos M. and van der Linden W. E., Analytica Chimica Acta, 1990,
233, 31-39. Processing Of Signals From An Ion-selective Electrode Array
By A Neural Network.
12. Meyer M. and Weigelt T., Analytica Chimica Acta, 1992, 265, 183-190.
Interpretation Of Infrared Spectra By Artificial Neural Networks.
13. Bos M., Bos A. and van der Linden W. E., Analyst, 1993, 118, 323-328.
Data Processing By Neural Networks In Quantitative Chemical Analysis.
14. Hieftje G. M. and Glick M., Applied Spectroscopy, 1991, 45 (10), 1706-
1716. Classification Of Alloys With An Artificial Neural Network And
Multivariate Calibration Of Glow Discharge Emission Spectra.
15. Minsky M. and Papert S., Perceptions, M.I.T. Press, Cambridge, MA, USA,
1969.
16. Rumelhart D. E. and McClelland J. L., Parallel Distributed Processing,
Explorations in the Microstructure of Cognition, Vol 1: Foundations, MIT
Press, Cambridge, USA, 1986.
17. Eberhart R. C. and Dobbins R. W., in Neural Network PC Tools, Eberhart
R. C. and Dobbins R. W., Editors, Academic Press, San Diego, USA, 1990,
pp 35-58.
18. Personal Communication, Saatchi R., School of Engineering Information
Technology, Sheffield Hallam University, Sheffield, UK.
222

Chapter 7
Conclusions And Recommendations For Future Work
223
7.0 Conclusions and Future Work
An optical multichannel analyser and a Q-switched Nd:YAG have been
successfully configured in an integrated laser-induced plasma emission
spectrometry system. The operations of the laser and optical multichannel
analyser were synchronised so that the optical multichannel analyser was able
to monitor discreetly the laser-induced plasma from each laser shot. Studies of
the ablation of copper metal showed that characteristics of the laser-induced
plasma were influenced by the operating conditions. Relatively high laser
energy produced a plasma that was more intense and longer-lived than that
produced by lower energy. Time resolved measurement enabled large
improvements in sensitivity to be realised, and precision was improved from
17.1 to 3.8 % relative standard deviation (RSD) by accumulating a relatively
large number of laser shots (2100 vs. 30). For the determination of copper in
aluminium alloy, the limit of detection was 0.010 % m/m and precision was 3.0
% RSD using an aluminium signal from the alloy matrix was used as internal
standard, both comparable to other published data.
The optical multichannel analyser was used separately to monitor an inductively
coupled plasma (ICP) emission source. Precision with this more stable source
was 0.5 % RSD, indicating that the optical multichannel analyser is capable of
achieving good precision. The optical multichannel analyser enabled several
emission lines and the spectral background to be monitored simultaneously
during a transient signal event produced by sample introduction with flow
injection.
Studies showed that the ablation of polymeric materials is different from metals.
The rate of material removal was higher for the polymer but the plasma had a
shorter lifetime. Operating conditions of relatively low laser energy and focused
laser radiation were found to provide improved analytical performance for
224

antimony, calcium and zinc in poly (vinyl chloride) samples. Selective
volatilisation of antimony occurred and the effect was minimised by firing only a
small number of laser shots at a sample site. Linear calibration graphs were
obtained with limits of detection of 0.09, 0.04 and 0.07 % m/m for antimony,
calcium and zinc, respectively, indicating bulk analysis capabilities. Precision
was improved from 7.3 to 1.8 for antimony when a carbon signal from the
polymer matrix was used as an internal standard. A range of poly (vinyl
chloride) samples was successfully monitored for twelve elements (Al, Ba, Ca,
Cu, Fe, Mg, Pb, P, Sb, Sn, Ti, Zn), without the need for time-consuming sample
digestion, demonstrating a rapid survey analysis capability. Sensitivity and
speed of measurement were higher than another direct technique, energy
dispersive X-ray fluorescence.
The micro-analysis capability of laser-induced plasma emission spectrometry
was successfully applied to the depth profile measurement of coatings on steel
substrates. A series of coatings was studied, zinc/nickel alloy, tin and titanium
nitride, on steel substrates over a range of coating thickness up to 8.0 pm.
Depth profile performance and the shape of the resultant crater were greatly
influenced by operating conditions, and it was found that defocused laser light
and maximum laser energy provided improved performance and depth
resolution. New output parameters were devised, and studies showed a linear
relationship between the area under the zinc profile line and coating thickness.
Good precision for replicate measurements was obtained with rapid
measurement times of 50 s. The performance indicates that laser-induced
plasma emission spectrometry can be used for the rapid depth profile
measurement of coatings. In addition, the technique was also able to detect a
layer of aluminium within a zinc coating, and the technique detected an ultra-
thin chromium coating (20 nm). The technique has significant advantages
compared to conventional glow discharge-optical emission spectrometry, such
225

as speed (50 vs. 700 s), smaller size of crater (~1 mm vs. ~10 mm) and non-
invasive measurement capabilities, suggesting the technique may be
appropriate for industrial application.
A novel technique for the processing of laser-induced plasma emission spectra
was developed. Artificial neural networks, a form of artificial intelligence, were
applied to the emission spectra of 7 materials. The artificial neural networks
were successfully trained and could rapidly differentiate between the spectra
with a 100 % success rate. There was, however, limited capability towards
quantitative measurements, which might be resolved by the use of other types
of artificial neural networks, such as Kohonen networks.
Future work could address a number of issues. A more integrated and versatile
laser-induced emission spectrometry system would provide computer control of
the laser energy, sample manipulation and fibre optic observation position.
These are set manually in this work, which is time-consuming and may lead to
loss of precision in the case of laser energy. The positioning of the sample and
fibre optic could be achieved by mounting each separately on computer-
controlled motorised XYZ stages. Automated sample manipulation would
enable the sample to be quickly positioned at different distances from the laser
focal point and the fibre to be rapidly aligned to the laser spot. It would enable
versatile laser sampling of material, such as allowing a fresh area of sample to
be ablated by each laser shot, or a large area of sample to be examined by
ablating in a grid pattern. The computer program of the optical multichannel
analyser could be modified to provide integrated control of these parameters.
The provision of a miniature video camera to monitor the sample position would
provide precise ablation of different regions of the sample.
226

With further work, the effect of operating parameters, such as a buffer gas or
the focal length of the focus lens, upon the ablation of polymeric materials and
coated substrates could be investigated. Buffer gases that could be studied are
argon, helium, neon and nitrogen, and may lead to improvements in analytical
performance for the analysis of polymeric materials, and to improvements in
depth profile performance for coated samples. Investigation of the use of partial
gas pressures could provide further improvements. The depth profile studies
could be extended to the measurement of thicker coatings such as 100 pm, the
quantification of coating elements, and to the measurement of other coatings
such as metallic multi-layers and coating systems with an insulating
component, e.g. paints containing metals, titanium nitride on glass or plastic
substrates.
Artificial neural networks could be applied to the studies described in this thesis,
such as to emission spectra recorded with the optical multichannel analyser
from an ICP emission source, to provide enhanced performance in terms of
speed of data processing. This might be useful in laboratory-based applications
of material quality control, or in on-line applications of ICP emission
spectrometry. In metallurgical applications of laser-induced plasma emission
spectrometry, artificial neural networks could be applied to the spectra of
different alloys in order that alloys could be rapidly sorted by type. For example,
aluminium alloys could be sorted by copper content. This could be extended to
other alloying elements. In the polymeric materials study, artificial neural
networks could be trained to recognise the spectra from polymeric materials
containing additives at different concentrations. When trained, the technique
could then rapidly differentiate between polymer samples by the additive
content of each sample. The rapid data processing capability of artificial neural
networks could then exploit the full potential speed of laser-induced plasma
emission spectrometry in an on-line implementation of survey analysis. The
227

laser-induced plasma emission spectrometry system used in these studies has
a capability of up to ten laser shots (and associated emission spectra) per
second. With appropriate sample manipulation, this could provide a powerful
sorting tool for inorganic additives in polymeric materials.
Recent studies1, have used laser ablation-ion mobility spectrometry (LA-IMS)
and artificial neural networks to rapidly differentiate between different types of
polymeric materials, for example, between poly (vinyl chloride) and
polyethylene. The combination of LA-IMS with simultaneous laser-induced
emission spectrochemical measurement would provide a powerful technique to
identify polymer type and the inorganic additives present. Artificial neural
networks could be used to rapidly process the data from this combined
technique.
Reference
1. Simpson M., Anderson D. R., Saatchi R., McLeod C. W. and Cooke M.,
Analyst, 1993, 118, 1293-1298. The Use Of Pattern Recognition For
Signatures Generated By Laser Desorption - Ion Mobility Spectrometry Of
Polymeric Materials.
228

Acknowledgement
I would like to acknowledge and thank several people:
My Supervisors, Cameron McLeod, Reza Saatchi and Trevor Smith for their
advice and encouragement. I thank Reza Saatchi also for writing the feature
extraction computer program used in the artificial neural network studies.
Staff of Sheffield Hallam University: Brian Didsbury for his help with the design
and construction of equipment; Kevin Blake for the scanning electron
microscopy examinations; and Mac Jackson for the Talysurf surface analyses.
For supplying samples: Richard Dellar (FMC Corporation (UK) Ltd, Process
Additives Division, Manchester) for the polymer samples; Tim English (British
Steel Technical, Swinden Laboratories, Rotherham) for the coated zinc/nickel,
tin and chromium coated samples; Gavin Williams (Materials Research
Institute, Sheffield Hallam University) for the titanium nitride coated sample; and
Arne Bengston (Swedish Institute for Metals Research, Stockholm, Sweden) for
the zinc coated sample.
Richard Burdett (EG&G, Sorbus House, Wokingham) for helpful discussions
about the optical multichannel analyser.
My Friends and Colleagues, in particular Alan Cox and David Mowthorpe, for
their support and encouragement.
I am very grateful to the DTI and SERC for funding this research project under
the LINK TAPM program, and also to the School of Science, Sheffield Hallam
University.
Finally, I must give special thanks to my Family, my wife Alison and son David
John, for their patience, help and support while 'Daddy finishes his book'.
229

Postgraduate Studies
1. Courses, Conferences and Seminars
Courses and conferences
Those attended and participated in during the period of this research are listed
below:
Date Course / Conference
5/91 Laser Safety Training Course
9/91 European Materials Research Society,
Laser Ablation Summer School
10/91 BCR, Community Bureau of Reference
Arsenic Speciation Meeting
3/92 Royal Society of Chemistry Conference
1/93 European Plasma Winter Conference,
paper presented: Survey Analysis of Polymeric
Materials Using Laser-Induced Plasma
Emission Spectrometry
2/93 Fisons VG Elemental, Training Course
Laser Ablation - ICP - MS
7/93 Post-CSI Symposium on Analytical
Applications of Glow Discharge Sources
9/93 Spectro Analytical ICP Application Seminar
5/94 Laser Ablation Workshop, British Geological
Survey
Location
Loughborough
University
Carcans-Maubuisson,
France
Brussels, Belgium
Newcastle University
Granada, Spain
Winsforth, Cheshire
York University
Sheffield Hallam
University
Kegworth,
Nottinghamshire
230

Seminars at Sheffield Hallam University:
participation in weekly research group seminars
attendance at School of Science seminars
presentation of papers at seminars of the School of Science, and the School of
Engineering Information Technology
Seminars with collaborating establishment:
participation and presentation of papers at 3 monthly progress meetings of
Sheffield Hallam University, UMIST, Arun Technology, DTI and SERC, as part
of the DTI and SERC LINK TAPM funded project
2. Publications
Anderson D. R., McLeod C. W. and Smith A. T., Journal of Analytical Atomic
Spectrometry, 1994, 9, 67-72. Rapid Survey Analysis of Polymeric Materials
Using Laser Induced Plasma Emission Spectrometry.
Anderson D. R., McLeod C. W., Smith A. T., and English T., submitted to
Applied Spectroscopy, 7/94. Depth Profile Studies Using Laser-Induced
Plasma Emission Spectrometry.
Simpson M., Anderson D. R., Saatchi R., McLeod C. W. and Cooke M.,
Analyst, 1993,118, 1293-1298. The Use Of Pattern Recognition For
Signatures Generated By Laser Desorption - Ion Mobility Spectrometry Of
Polymeric Materials.
Simpson M., Anderson D. R., McLeod C. W. and Cooke M., Analyst, 1993, 118,
449-451. Polymer Characterisation Using Laser Desorption - Ion Mobility
Spectrometry.
231

Bibliography
Andrews D. L., Lasers in Chemistry, Springer Verlag, London, Second Edition,
1990.
Cremers D. A, and Radziemski L. J., Editors, Laser-Induced Plasmas and
Applications, Marcel Dekker, New York, 1989.
Eberhart R. C. and Dobbins R. W., Neural Network PC Tools: A Practical
Guide, Academic Press, San Diego, USA, 1990.
Moenke-Blankenburg L., Laser Micro Analysis, Wiley, New York, 1989.
Montaser A. and Golightly D. W., Editors, Inductively Coupled Plasmas in
Analytical Spectrometry, VCH Publishers, New York, 1987.
Ready J. F., Effects of High Power Laser Radiation, Academic Press,
New York, 1971.
Slickers K., The Automatic Atomic Emission Spectroscopy, Briihl
Universitatsdruckerei, Giessen, Germany, Second Edition, 1993.
232

Appendix 1
Calculations used in the thesis.
1. Calculation of the rate of material removal from the size of the laser crater
- crater dimensions were taken from Talysurf surface measurements of laser-
produced craters
calculation of crater volume
assume crater is cylindrical in shape
volume of cylinder = n r2 h
where r = radius of crater
h = depth of crater
mass removed per crater
density of material (p) = mass / volume
mass = p volume
volume of material removed = n r2 h
mass removed = p n r2 h (mg mm-2 mm2 mm)
mass removed = p n r2 h (mg)
For poly (vinyl chloride):
crater produced by 10 laser shots
radius of crater = 0.5 mm
depth of crater = 50 pm = 0.05 mm
p poly (vinyl chloride) = 1.4 mg mrrr3
mass removed (10 laser shots) = 1.4 n 0.52 0.05 mg
rate of mass removal = 5.5 pg per laser shot
For zinc/nickel coating on steel:
crater produced by 200 laser shots
radius of crater = 0.7 mm
depth of crater = 7.4 pm = 0.0074 mm

p zinc 7.14 mg mm-3
p nickel 8.90 mg mm-3
p iron 7.86 mg mnr3
p average = 7.97 mg mnr3
mass removed (200 laser shots) = 7.97 n 0.72 0.0074
rate of mass removal = 0.45 pg per laser shot
The mass removed per laser shot was calculated for other materials using the
densities below. Density values were taken from CRC Handbook of Chemistry
and Physics, 60th Edition, except that for poly (vinyl chloride), which was from
the Goodfellows Catalogue (1992).
2. Calculation of tin coating thickness from the tin coating weight
- values of coating weight for each sample were provided by the supplier of the
samples (British Steel Technical, Swinden Laboratories, Rotherham, UK)
density of material (p) = mass / volume
.-. volume = mass / p
volume = length x width x height
where height = coating thickness (T)
.*. length x width x T = mass / p
.-. T = (mass / p) / (length x width)
mass = 10.8 g rrr2 = 10.8 x 10*4 g crrr2
p = 7.28 g cm-3
let length and width = 1 cm
/. T= (10.8/7.28)7(1 x 1)
p tin
p chromium
p titanium
7.28 mg mm-3
7.20 mg mm-3
4.50 mg mm-3
in

= 1.479 x 10⁻⁴ cm
coating thickness = 1.479 pm
3. Calculation of the mass of chromium coating removed with the first laser shot
coating thickness of chromium = 0.020 pm (= 20 x 10-6 mm)
assume crater is cylindrical in shape
volume of cylinder = n r2 h
where radius of crater (r) = 0.7 mm
h = height = coating thickness = 20 x 10-6 mm
density of material (p) = mass / volume
where p chromium = 7.20 mg mm*3
.-. p = mass / (7i r2 h)
.-. mass = p 7i r2 h
= 7.2x10⁻⁶ 7i 0.72 20x 10-6
= 221.67 x 10⁻⁶ mg
= 0.22 pg
.*. mass detected with first laser shot = 0.22 pg
iv

Appendix 2
A copy of the published paper associated with the work of this thesis is below:

JOURNAL OF ANALYTICAL ATOM IC SPECTROMETRY, FEBRUARY 1994, VOL. 9 67
Rapid Survey Analysis of Polymeric Materials by Laser-induced Plasma Emission Spectrometry*David R. Anderson and Cameron W. McLeodDivision o f Chemistry, School o f Science, Sheffield Hallam University, Sheffield, UKS11WB
Trevor A. SmithArun Technology Limited, Unit 16, Southwater Industrial Estate, Station Road, Southwater, Horsham, Sussex, UKRH13 7UD
Laser-induced plasma emission spectrometry has been applied to the analysis of poly(vinyl chloride) materials. Methodologies used to optimize the monitoring of the time-dependent emission from the laser-induced plasma are discussed, and the effects of key parameters, such as laser energy, sample position and repetitive firing at given sites, were examined. Basic performance data are reported for Ca [limit of detection 0.016% m/m and 4.8% relative standard deviation (RSD)] and Sb (limit of detection 0.04% m/m and 4.8% RSD) and the potential use for rapid survey analysis is demonstrated.Keywords: Laser-induced plasma emission spectrometry; gated diode array detection; laser ablation; polymer analysis
Polymeric materials generally contain a wide variety of additives which are used to give specific properties to the material.1 These include, pigments for colour (e.g., white T i0 2), fillers (e.g., CaC03), stabilizers (e.g., Zn, Pb and Ba), flame-retarding agents (e.g., Sb, P) and smoke suppressants (e.g., Zn), among others. These inorganic components vary in concentration from trace (pg g-1 ) to minor (%) levels. Analytical techniques currently in use for such analyses include solution-based atomic spectrometric methods2,3 and X-ray fluorescence spectrometry.4 An alternative approach is direct spectrochemical analysis by laser ablation (LA), either by direct spectral measurement of the laser-induced plasma, or by coupling to another analytical technique. For example, LA with inductively coupled plasma (ICP) atomic emission spectrometry has been used for survey analysis of paints and polymers,5 while ICP mass spectrometry has been applied to polymeric and refractory materials.6
Direct spectrochemical measurement of the plasma, laser- induced plasma emission spectrometry (LIPS), enables rapid, in situ analysis,7,8 and is particularly suited to process measurement.9 The emission signals from the laser-induced plasma are complex and vary greatly with time. Time-resolved measurement is usually essential for the separation of the analyte emission response from the intense plasma background.10 Basic characterization of the laser-induced plasma and systematic studies concerning the effect of key parameters, such as the wavelength of the laser light and the type and pressure of the buffer gas, have been reported.11-16 Niemax et al.,16 concluded that a wavelength of 1064 nm was more suitable than 266 nm for analysis of glass and steel matrices. Other workers1*-15 found that a reduced pressure of Ar gas, typically 133.32 x 10³ Pa, offered improved analytical performance. For process monitoring situations, where it may not be feasible to achieve partial pressures, atmospheric pressure has been used. Cremers and Archuleta9 reported the in situ measurement of molten steel for five elements (Ni, Cr, Si, Mn and Cu) using a laser wavelength of 1064 nm by LIPS and LA-ICP and concluded that at least semiquantitative analysis was feasible. Lorenzen et al.17 described the in situ monitoring of S, Si and Zn in rubber production using an excimer laser operating at 248 nm, and discussed the choice of laser wavelength for this application.
The present study examines the application of LIPS to the
* Presented in part at the 1993 European Winter Conference on Plasma Spectrochemistry, Granada, Spain. January 10-15, 1993.
rapid survey analysis of poly(vinyl chloride) (PVC) samples, and provides information about the emission characteristics of the laser-induced plasma, in particular the emission-time profiles of analyte and background emission. Basic performance data for the determination of Sb, Ca and P in PVC samples are presented.
ExperimentalInstrumentationA schematic diagram of the LIPS system is shown in Fig. 1, and details of the instrumentation and operating parameters are given in Table 1. The system consisted of a Q-switched Nd:YAG laser with output wavelength of 1064 nm, an optical multi-channel analyser (OMA) that comprised a spectrometer, an intensified photodiode array (PDA) detector, a computerized control system and a master pulse generator. Operation of the laser and the O M A was synchronized electronically using the master pulse generator. This controlled the timings of the laser flash lamp and Q-switched laser firing, and the detector gating and scanning of the detector array. Both the laser flash lamp and the O M A detector were operated at 10 Hz. The laser was fired during alternate flashes of the flash lamp, i.e., at 5 Hz, and the O M A recorded a blank spectrum during the flash lamp cycles when the laser did not fire. Each blank spectrum was automatically subtracted from
MirrorLaser1064 nm
Focus lensPulse
generator
XYZMic oplasma
SampleOMA
Fibre optic
Fig. 1 Schematic diagram of laser and spectrometer system

68 JOURNAL OF ANALYTICAL ATOMIC SPECTROMETRY, FEBRUARY 1994, VOL. 9
Table 1 Instrumentation and parameters used in this study
Laser Wavelength Repetition rate Laser flash lamp energy Pulse-width Reflecting mirror Focus lens
Ablation gas
Sample position (relative to laser focal point)
OMA Spectrometer GratingSpectral window Effective resolution DetectorLight collection and transfer
Fibre optic observation position From laser focal point 12 mmAbove sample surface 1 mm
Pulse generator EG&G 1310
Spectra Physics DCR II 1064 nm 10 Hz 40 J 10 ns45° (Newport 10 QM 20 HM-15) 500 mm focal length (Newport SBX 040 AR.18)Air at room temperature and pressure—0.5 mm (0.5 mm towards lens)
EG&G OMA III 0.28 m Czerny-Tumer 2400 g mm-1 25 nm 0.20 nmIntensified photodiode array Fibre optic, bundle of
19 x 200 [im UV-grade fused silica
Table 2 List of element emission lines for each spectral window monitored in this study
Wavelength range/nm
237--262 267--292 307--332
240.549 Cu 279.553 Mg II 308.215 A ll241.949 Sn 280.199 Pb I 308.802 T ill247.857 C l 280.270 Mg II 309.271 A ll250.200 Zn II 283.306 Pb I 315.887 C a ll250.911 CII 283.999 SnI 317.502 SnI251.203 CII 285.213 Mg I 317.933 Ca II251.743 T ill 286.333 Sn I 322.579 F e ll252.560 T ill 286.426 Pb 322.775 F e ll252.852 Sb I 287.792 Sb I 323.252 Sb I253.401 P I — — 323.452 Ti II253.565 P I — — 323.612 T ill254.480 Cu II — — 323.904 Ti II255.328 P I — — 324.199 Ti II255.493 P I — — 324.754 Cu I255.796 Zn II — — 326.233 SnI256.253 F e ll — — 326.751 Sb I259.806 Sb I — — 327.396 Cu I259.881 Cu II — — 328.233 Zn I261.418 Pb — — 328.321 Sn II
330.259 Zn I
the previous emission spectrum to yield a net signal from the plasma. The run time for 5 laser shots was 1 s.
Laser light was delivered to the sample by a mirror, and a lens was used to focus the light onto the sample surface. The laser-induced plasma was formed at the surface of the sample, and radiation was transmitted to the O M A by a fibre optic cable. The light was dispersed by the grating of the spectrometer and detected by an intensified photodiode array. The detector was time-gated to allow precise control of the integration time.
Various spectral regions could be monitored by setting the grating to the required centre wavelength. This was controlled by the grating-drive mechanism which rotated the grating until the required wavelength window covered the detector elements. Three spectral windows 237-262, 267-292 and 307-332 nm of centre wavelengths 250, 280 and 320 nm, respectively, were used to detect the elements selected (Al, Ba, Ca, Cu, Fe, Mg, Pb, P, Sb, Sn, Ti and Zn). The emission lines monitored are given in Table 2. In addition, two barium lines were utilized (230.423 and 233.527 nm) at centre wavelength 230 nm.
Data Acquisition
The OMA hardware and software allowed versatile collection, storage and manipulation of data. For example, individual scans of the photodiode array, representing separate laser shots, could either be stored in separate memories or accumulated into a single memory. The time-gating capability of the OM A was used in two ways to address the problem of complex, time-dependent emission from the laser-induced plasma. Two data acquisition modes of OM A operation are described below, incremental mode and fixed time mode (FT). An incremental program was used for preliminary studies in which each scan of the array was stored in a separate memory, and the integration window (100 ns) was stepped sequentially through the lifetime of the plasma by the increment time (100 ns). This enabled the spectra to be time-resolved to produce an emission- wavelength-time (E -W -T) profile of emission from the plasma. Examination of the transient signal responses within these profiles enabled suitable values for delay and integration times to be selected for use in an FT program.
The FT data acquisition mode exploited the separation, in time, of the analyte response from the background signal and allowed greater measurement sensitivity to be realized. Here,
the start of integration was delayed by a set time, the delay time, to enable rejection of the initial intense background signal, and the integration period captured the analyte emission signal response; typical parameters were delay time 500 ns, and integration time 1 ps.
Two FT programs, FT1 and FT2, were used to acquire the laser generated spectra. Method FT1 consisted of firing 30 laser shots at the same spot, each shot being stored individually, i.e., 1 scan in 30 memories (30 scans total). Method FT2 accumulated five laser shots into one memory at one sample site, and this was repeated seven times in total with a fresh site each time, i.e., 5 scans in 7 memories (35 scans total). The run times for FT1 and FT2 were 6 and 7 s, respectively, with a further 25 s required for sample translation for FT2.
Materials
Poly(vinyl chloride) samples (A -F) were supplied in sheet form by FM C Process Additives (UK). Sample X was industrial grade PVC (Darvic), obtained locally.
Procedure
Samples were analysed as received with no sample preparation. The sample was mounted on an X Y Z manipulator and a fresh area of material postioned at the laser spot. The manipulator was moved in height (Z) until the sample was at the laser focal point, 500 mm from the focusing lens, and then moved 0.5 mm towards the lens. With the laser operating at a suitable flash lamp energy, e.g., 40 J, the acquisition was started. The laser fired under control of the O M A software and the master pulse generator, and the resulting scans were stored on the computer and printed. Separate routines were used off-line to perform individual pixel analyses to give emission-time profiles and statistical information.
Results and Discussion
Preliminary Studies
Previous studies18 of LIPS with metallurgical samples found that emission signal responses and analytical performance were greatly influenced by the complex, interdependent relationship of several parameters, e.g., laser energy, sample position relative to laser focal point, position of the fibre optic and O M A

JOURNAL OF ANALYTICAL ATOMIC SPECTROMETRY, FEBRUARY 1994, VOL. 9 69
Fig. 2 Talysurf stylus-profile of a crater in PVC (sample X) produced by ten laser shots, laser flash lamp energy 40 J. The profile was recorded by 164 scans in a 1.63 mm square grid
>
CQ)C
Co'w(AEw
307 319 332Wavelength/nm
Fig. 3 LIPS spectra for ablation of: A, Ti metal; and B, PVC sample X (laser flash lamp energy 40 J). OMA parameters: delay time, 900 ns; integration time, 100 ns
detector settings. For example, ablation with a relatively high laser energy (flash lamp energy 70 J, irradiance « 3 .1 x l0 u W cm-2) produced a more intense, longer-lived plasma that required a different fibre optic viewing position and OM A settings for optimal performance compared with ablation with a lower energy (flash lamp energy 40 J, « 8 .0 x l0 loW cm-2). For this preliminary study with polymeric materials, initial selection of laser lamp energy was made by examining the amount of laser-damage .to the sample and the variation in emission intensity produced by different values of laser energy. For optimum LIPS performance, it may be necessary to characterize the experimental parameters listed above for the ablation of polymeric materials and also consider the effects of polymer properties such as transparency and colour upon ablation.
A relatively low laser energy (flash lamp energy 40 J) was chosen, which inflicted minimal laser damage to the sample but produced suitable emission responses. The laser appeared to couple well with coloured, opaque samples. A Talysurf stylus-profile of the crater produced in PVC (sample X) by ten laser shots is depicted in Fig. 2. It shows the round crater to be approximately 1 mm in diameter and 50 pm deep. A dark
ened region, about 2 mm in diameter, was observed around each crater.
The LA of an opaque polymer was compared with the ablation of metal using conditions previously established for metal samples. Fig. 3 depicts spectra from the ablations of sample X and Ti metal, taken from the respective E -W -T profiles. The spectra are very similar and most emission lines can be identified as Ti, indicating the presence of Ti in the polymer, probably as the pigment titanium dioxide. The spectrum for the polymer is more intense than that for the metal, probably due to a combination of factors such as, greater coupling of the laser and plasma with the polymer, and the lower temperatures needed for volatilization and decomposition of the polymer compared with the metal.
In the case of transparent polymeric samples, no emission signals were obtained when material was ablated with the operating parameters specified under Experimental. Faint tunnelling through the material and ablation of the metal support underneath the sample were observed. This would suggest that a plasma was not induced on the surface of the polymer, and that the laser light was transmitted through the plastic to the metal. The tunnelling was due to the self-focusing of the laser
incScco
'55wEU1
Wavelength
Fig. 4 Emission-wavelength (237-262 nm)-time (0-900 ns) profile for ablation of sample A using the Incremental program, (increment time, 100 ns; integration time, 100 ns): A, carbon I 247.9 nm; and B, carbon II 250.9 and 251.2 nm; C, antimony 252.9; and D, phosphorus 253.4 and 253.5 nm

70 JOURNAL OF ANALYTICAL ATOMIC SPECTROMETRY, FEBRUARY 1994, VOL. 9
140
<2 120
R 100
60
20
X LrC U .JTV rP -.C Irqj. 1200 1600 20008004000
Delay time/ns
Fig. 5 Emission-time profile for ablation of sample A with the Incremental program, (increment time, 100 ns; integration time, 100 ns): A, carbon I 247.9; B, antimony 252.9; C, phosphorus 253.4; and D, background 245.0 nm
beam within the material, which trapped the light and prevented it from spreading, to produce a waveguide.19 This was not evident in the opaque samples because the laser light was absorbed, leading to ablation and production of the laser- induced plasma. When the transparent sample was moved away from the laser focus position, i.e., 3 mm away from the lens (+ 3 mm), emission signals and laser damage on the sample surface were observed. The plasma was induced in the air above the sample surface, and the plasma was responsible for volatilizing sample material and creating the crater. Results indicated that it was feasible to gain elemental composition data from transparent polymer material. These conditions were not adopted for opaque samples because greater damage was inflicted upon these materials without any significant improvement in performance.
An E -W -T profile recorded with the OM A incremental program from the ablation of sample A (Fig. 4) shows the intense background continuum at early times, and the emerg
600 - (a )
500
400
300
2 200 C
8 100 >-o-i> j ~~1C___~ I i ~ i r i ~ — — r r
2 4 6 8 10 12 14 16 18 20 22 24 26 28U!C 0
2500(fa)
E 2000
1500
-o--o- - o --o -1000
500
643 5210Memory No.
Fig. 6 Emission-time profile for ablation of sample A with FT program (delay time, 500 ns; integration time, 1 ps): (a) FT1, 30 shots at same spot; and (b) FT2, 5 shots in each memory, 7 memories, fresh site each memory: A, carbon I 247.9; B, antimony 252.9; C, antimony 259.8; D, phosphorus 253.4; and E, background 245.0 nm
ence of atom/ion emission at later times. Carbon ion emissions (250.9, 251.2 nm) were evident initially, and carbon atom emissions (247.9 nm) later. The intense background signal and carbon ion emissions reflect the high temperatures of the plasma at early times, but as the plasma expanded and cooled, the background signal decayed rapidly and atomic emission lines for Sb and P became prominent. An E -T profile for selected wavelengths (Fig. 5) shows the responses of C, Sb anu P to be indistinguishable from the background up to 400 ns. After this, emission signals for these three elements remain above background up to about 1.5 ps. These observations enable suitable detector settings to be obtained for the FT data acquisition mode; the background signal is reduced significantly, by 500 ns, so selection of a time delay of 500 ns would minimize background contributions and a signal integration of 1 ps would be appropriate for monitoring analyte emission.
Analytical PerformanceFull quantitative measurement of inorganic additives in polymeric materials is considered to be difficult because of the absence of suitable certified reference materials (CRMs) necessary to prepare calibration graphs. Quantitative measurements in this work are based on using characterized samples as calibration standards. To obtain analytical performance data, OM A FT programs were devised using the system operating parameters established above. Initial studies used two FT programs, FT1 and FT2, to examine the effect of repetitive firing of the laser on signal response and to test for sample homogeneity, prior to making performance measurements. Results from the ablation of sample A by both methods are shown in Fig. 6 (laser flash lamp energy 40 J, delay time 500 ns, integration time 1 ps). With FT1, the Sb emission responses were not similar throughout the experiment, although the C and P emission signals were reasonably constant. Both Sb lines increased in intensity at first, and then decreased until
C0)cco’ (fl(0E
LU iO-
Wavelength
Fig. 7 Emission-wavelength (237-262 nm)-memory number profile for ablation of sample A with FT2, with delay time, 500 ns; integration time, 1 (is, 5 shots in each memory, 7 memories, fresh site each memory: A, carbon I 247.9; B, antimony 252.9; and C, antimony 259.8 nm
Table 3 Comparison of data from fixed time methods FT1 and FT2 for the ablation of sample A
Parameter Method FT1 Method FT2
No. of shots per site 30 5RSD C 247.8 nm 10.6 4.8RSD Sb 252.8 nm 29.7 4.8RSD P 253.4 nm 6.9 7.0S/N (Sb 4.9%) 13.4 97S/N (P 2.6%) 4.5 33Value of n for statistical calculation 30 7

JOURNAL OF ANALYTICAL ATOMIC SPECTROMETRY, FEBRUARY 1994, VOL. 9 / I
about memory number 9, after which a relatively constant signal response was observed. Emission responses for all elements were fairly constant with FT2 [Fig. 6(h)].
The emission response for Sb was not linear with concentration for method FT1, but FT2 did produce a linear response. It would appear that the Sb in the vicinity of the laser spot was selectively volatilized during the first few laser shots, possibly through formation of volatile antimony chloride, leading to a depletion of Sb for the remaining shots. The effect was not due to higher concentration levels of Sb at the surface as similar E -T profiles were obtained from the ablation of material beneath the sample surface. Use of a small number of laser shots, i.e., five on several sites with method FT2, enabled a linear calibration to be produced. Reasonably constant signals for C, Ca and P were obtained by FT1, suggesting that these elements were not selectively volatilized and it was still possible to make representative measurements after firing 30 laser shots at the same site.
The emission responses for C and Sb were more reproducible
with method FT2 compared with FT1. An emission-wave- length-memory number profile (Fig. 7) for ablation with FT2 clearly indicates good repeatability for successive laser firings, and results suggest that the sample is relatively homogeneous. Precision [relative standard deviation (RSD)] improved from 10.6 and 29.7 (FT1) to 4.8 and 4.8 (FT2) for C and Sb, respectively, but there was no significant change for phosphorus, RSD 6.9 (Table 3). Using the C signal (247.86 nm) as an internal standard, RSD was further improved to 2.3 and 3.4 for Sb and P, respectively. This approach is only applicable for element emission signals that are within the spectral region 237-262 nm that contains a C emission signal. The signaknoise ratio for C, Sb and P was considerably improved using FT2, due to the accumulation of five laser shots into each O M A memory compared with one shot with FT1.
Using method FT2, linear calibration graphs were generated for Sb (to 4.9% m/m) and Ca (to 6.8% m/m) emissions (Sb252.8 and 258.8 nm; Ca 315.9 and 317.9 nm) with three data points for each element. The correlation coefficients were
3000 2000 800
Mg1500 Sb Mg 4001000Sb
SbMgSn
3000 2500 12000Mg Ca
Mg
Mg
la,
1500 1250 6000
tn Sbc3oO
SbSb Sb
>■
w 0 vc 3000 2000 800
CaPb1500 1000 Pb 400
PbPb
3000 2000 800
Zn1500 - 1000 400
SnMgZnSn
PP
332.0237.0 262.0 267.0 292.0 307.0Wavelength/nm
Fig. 8 Laser-induced plasma emission spectra from samples A, B, D and E (from top to bottom). Spectra were recorded with fixed time method FT2, delay time 500 ns, integration time 1 ps, 5 shots in each memory, 7 memories, fresh site each memory. Emission wavelengths are given in Table 2

72 JOURNAL OF ANALYTICAL ATOMIC SPECTROMETRY, FEBRUARY 1994, VOL. 9
0.9936 and 0.9999 for Sb 259.8 nm and Ca 317.9 nm, respectively. Limits of detection based on 3a (measurement of blank PVC sample) were estimated at 0.04 and 0.016% m/m for Sb252.8 nm and Ca 317.9 nm, respectively. The data are similar to values obtained for elements in steel (Ni, Cr, Si and Mn) by Cremers and Archuleta9 using LIPS.
Survey AnalysisTo demonstrate the rapid analysis capability, a range of PVC samples was examined. (The composition values quoted were supplied by the manufacturer.) Spectra from four samples are shown in Fig. 8 for three spectral regions. Samples A and B are clearly seen to contain Sb a« the emission lines for Sb are identified within all three spectral windows for both samples. The greater emission intensity for A compared with B indicates the higher concentration present in A (Sb: A, 4.9% m/m; B, 2.8% m/m). Tin and P are present in sample A (P 2.6% m/m, Sn 0.05% m/m). Calcium emission lines are evident in samples B and D, the greater emission intensity of B indicating the higher concentration present (Ca: B, 6.8% m/m; D, 0.4% m/m). Emission lines of magnesium were observed for all four samples. Barium was detected in samples B (Ba: 0.1% m/m), the Ba emission lines (230.423 and 233.527 nm) are not shown in Fig. 8. Lead (3.0% m/m) is present in sample D, and Al, P, Sn and Zn are evident in E. Samples C and X (not shown) contain Sn and Zn, and Ti and Mg, respectively. These results show that the technique can be used for the rapid analysis of samples of PVC for a range of elements, without the need for time-consuming sample dissolution and possible loss of volatile elements.
ConclusionsLaser-induced plasma emission spectrometry has been applied to the rapid survey analysis of polymeric materials. This study monitored a range of twelve elements (Al, Ba, Ca, Cu, Fe, Mg, Pb, P, Sb, Sn, Ti and Zn), and provided analytical data for key elements (Sb and Ca). Quantitative measurement was limited by the availability of characterized samples. To address this problem, it is proposed to prepare a series of samples, covering a wide range of concentration levels for selected elements, which will enable additional calibrations and further quantitative measurements to be made.
The speed of analysis, compactness of instrumentation and simplicity of operation suggest that the technique has the
potential for compositional monitoring of polymeric materials in industrial processes, such as manufacture and recycling.
We would like to thank Richard Dellar (FMC Corporation, Manchester, UK M17 1WT) for providing samples. We are grateful to Richard Burdett (EG&G, Sorbus House, Wokingham, UK) for valuable assistance in configuring the OMA system. We thank Mike Simpson for helpful discussions and Mac Jackson (School of Engineering) for the talysurf analysis. The authors thank the DTI and SERC for funding this project under the LINK TAPM scheme.
References1 Plastic Additives Handbook, eds. Gachter and Muller, Hanser,
1983.2 Wong, K. L., Anal. Chem., 1981, 53, 2148.3 DiPasquale, G., and Casetta, B., At. Spectrosc., 1984, 5, 209.4 Warren, P. L., Anal. Proc., 1990, 27, 186.5 Booth, P. K., and McLeod, C. W., Mikrochim. Acta, 1989, 3, 283.6 Marshall, J., Franks, J., Abell, I., and Tye, C. J. Anal. At.
Spectrom., 1991, 6, 145.7 Moenke-Blankenburg, L., Laser Micro Analysis, Wiley, 1989.8 Laser-induced Plasmas and Applications eds. Cremers, D. A., and
Radziemski, L. J., Marcel Dekker, New York, 1989.9 Cremers, D. A., Archuleta, F. L., and Dilworth, H.C., Proceedings
of the 5 th Process Tech. Conf. on Meas. and Control Instrum, inthe Iron and Steel Industry, April 14-17, 1985, pp. 157-162. Ironand Steel Society, Warrendale, PA, USA.
10 Cremers, D. A., and Radziemski, L. J., in Applications of Laser Spectroscopy, eds. Cremers, D. A., and Radziemski, L. J., Marcel Dekker, New York, 1986, ch. 5, pp. 380-395.
11 Niemax, K., Leis, F., Sdorra, W., and Ko, J. B., Mikrochim. Acta, 1989, 2, 185.
12 Niemax, K., Ko, J. B., and Sdorra, W., Fresnius' Z. Anal. Chem., 1989, 335, 648.
13 Niemax, K., and Sdorra, W., Mikrochim. Acta, 1992,107, 319.14 Iida, Y., Anal. Sci, 1991, 7, 61.15 Kuzuya, M., and Mikami, O., J. Anal. At. Spectrom., 1992, 7, 493.16 Niemax, K., Sdorra, W., and Brust, J., Mikrochim. Acta, 1992,
108, 1.17 Lorenzen, C. J., Carlhoff, C., Hahn, U., and Jogwich, M., J. Anal.
At. Spectrom., 1992, 7, 1029.18 Anderson, D. R., and McLeod, C. W., unpublished work.19 Ready, J. F., Effects of High Power Laser Radiation, Academic
Press, New York, 1971.
Paper 3/02845C Received M ay 19,1993
Accepted November 8 ,1993