Pandemic Protein Performance - IRI
12
1 The arrival of coronavirus in the U.S. prompted two weeks of unprecedented sales in grocery retailing in mid-March, with the meat department experiencing dramatic increases. Throughout the pandemic, retail sales of meat and meat substitutes have experienced dramatic swings, but have always remained well above the 2019 baseline as many meal occasions moved to at-home. In addition to the strong everyday demand, spring and summer holidays brought record sales as consumers celebrated, but in smaller gatherings and often at home. Given the new economic reality and the lingering virus, it is likely that grocery sales, including sales of meat, will remain ahead of 2019 levels for months to come. This meat department performance report is a collaboration between IRI and 210 Analytics. Here, meat sales are compared to total store, across channel, by subcategory, sales of plant-based meat alternatives and much more. SALES EVOLUTION At the onset of coronavirus in the U.S., non-food sales accelerated as early as the first full week of March. After quarantines went into effect and restaurants closed dine-in facilities mid-March, food retail experienced two of the biggest weeks in the history of food retailing in terms of trips, sales and basket size. Many shoppers aimed to have two to three weeks of food in their freezers, fridges and pantries, and sales across departments surged. From mid-March onward, e-commerce took off to the point of running out of delivery slots while dealing with high levels of out-of-stocks. While sales have slowed down somewhat, gains remain well above last year’s levels in center store and the fresh perimeter. As COVID-19 cases started respiking in July, food dollars started to flow back to retail, causing sales trends versus year ago to rise once more. In August, meat sales appeared to be settling into a new baseline that sits about 15%-16% above last year’s levels. IMPLICATION: People returned to the familiar amid COVID-19 and meat returned to the center of plate. Reinforce new behaviors with recipes around new cuts of meat and list-building support. MEAT DEPARTMENT REPORT September 2020 Pandemic Protein Performance In August, meat sales appeared to be settling into a new baseline that sits about 15%-16% above last year’s levels. 7% 77% 91% 37% 41% 43% 18% 50% 51% 41% 26% 21% 19% 19% 16% 32% 16% 18% 21% 23% 22% 15% 15% 16% 16% 3/1 3/8 3/15 3/22 3/29 4/5 4/12 4/19 4/26 5/3 5/10 5/17 5/24 5/31 6/7 6/14 6/21 6/28 7/5 7/12 7/19 7/26 8/2 8/9 8/16 8/23 Dollar growth vs. the comparable week in 2019 Total store Center store Fresh perimeter Meat department ! Source: IRI, MULO, % $ growth vs. YA
Transcript of Pandemic Protein Performance - IRI

1
The arrival of coronavirus in the U.S. prompted two weeks of unprecedented sales in grocery retailing in mid-March, with the meat department experiencing dramatic increases. Throughout the pandemic, retail sales of meat and meat substitutes have experienced dramatic swings, but have always remained well above the 2019 baseline as many meal occasions moved to at-home. In addition to the strong everyday demand, spring and summer holidays brought record sales as consumers celebrated, but in smaller gatherings and often at home. Given the new economic reality and the lingering virus, it is likely that grocery sales, including sales of meat, will remain ahead of 2019 levels for months to come. This meat department performance report is a collaboration between IRI and 210 Analytics. Here, meat sales are compared to total store, across channel, by subcategory, sales of plant-based meat alternatives and much more.
SALES EVOLUTIONAt the onset of coronavirus in the U.S., non-food sales accelerated as early as the first full week of March. After quarantines went into effect and restaurants closed dine-in facilities mid-March, food retail experienced two of the biggest weeks in the history of food retailing in terms of trips, sales and basket size. Many shoppers aimed to have two to three weeks of food in their freezers, fridges and pantries, and sales across departments surged. From mid-March onward, e-commerce took off to the point of running out of delivery slots while dealing with high levels of out-of-stocks. While sales have slowed down somewhat, gains remain well above last year’s levels in center store and the fresh perimeter. As COVID-19 cases started respiking in July, food dollars started to flow back to retail, causing sales trends versus year ago to rise once more. In August, meat sales appeared to be settling into a new baseline that sits about 15%-16% above last year’s levels.
IMPLICATION: People returned to the familiar amid COVID-19 and meat returned to the center of plate. Reinforce new behaviors with recipes around new cuts of meat and list-building support.
MEAT DEPARTMENT REPORTSeptember 2020
Pandemic Protein Performance
In August, meat sales
appeared to be settling
into a new baseline that
sits about 15%-16%
above last year’s levels.
7%
77%
91%
37%41% 43%
18%
50% 51%
41%
26%21% 19% 19%
16%
32%
16% 18%21% 23% 22%
15% 15% 16% 16%
3/1 3/8 3/15 3/22 3/29 4/5 4/12 4/19 4/26 5/3 5/10 5/17 5/24 5/31 6/7 6/14 6/21 6/28 7/5 7/12 7/19 7/26 8/2 8/9 8/16 8/23
Dollar growth vs. the comparable week in 2019 Total storeCenter storeFresh perimeterMeat department
!
Source: IRI, MULO, % $ growth vs. YA

MEAT DEPARTMENT REPORT | September 2020
Pandemic Protein Performance
2
SHOPPING BEHAVIORSAfter the initial two weeks of panic purchasing, the number of trips to the grocery store fell well below last year’s levels. Trips bottomed out the week of April 19, which was Easter week in 2019. As trips fell, the average basket size jumped to new heights, particularly during April when virtually all states were under shelter-in-place mandates. Trip frequency normalized as the well-publicized meat shortages drove shoppers back to the store to stock up more on meat and poultry. Once the meat supply started to normalize in early June, trips once more fell below last year’s levels, with the Father’s Day holiday weekend, June 21, being the one exception.
A third change in shopping patterns related to the day of the week that quickly moved from the typical Saturday and Sunday surge to highly elevated sales levels for every day of the week. Day patterns somewhat normalized going into June as people went back to work, but Fridays continue to see an above-average share versus pre-pandemic. The rise in COVID-19 cases in July prompted basket sizes to increase again, as people went back to stocking up a bit more to fill pantries, fridges and freezers. In August, trips were slightly above year-ago levels whereas the basket size remained around 11%-12% above 2019 levels.
IMPLICATION: More at-home cooking drove trial and a greater variety of cuts/kinds purchased. Leverage enthusiasm for experimentation with recipes and promotions. IMPLICATION: Six months into the pandemic, coming up with new meal ideas is becoming harder. In addition to recipes, ready-to-eat, ready-to-heat and ready-to-cook solutions can be a way to keep the food dollar in the retail channel.
2
100
110
142 140
10398 97
84
99 100 102 10198
10197 98
105100 100 99 100 101 99 100 101 101100
104
117 115 114
121 123129
126121 119 118 118
114 115 115 113 112 112 113 115 114 112 111 111 112
70
80
90
100
110
120
130
140
150
3/1 3/8 3/15 3/22 3/29 4/5 4/12 4/19 4/26 5/3 5/10 5/17 5/24 5/31 6/7 6/14 6/21 6/28 7/5 7/12 7/19 7/26 8/2 8/9 8/16 8/23
Total CPG trip and basket size index across all outlets Trip index
Basket size index
Source: IRI, MULO, % $ growth vs. YA
MEAT DEPARTMENT REPORT | September 2020
Pandemic Protein Performance
3
DOLLAR SHARES BY CHANNELChannels that benefited most from the surge in grocery spending are conventional supermarkets, club stores and e-commerce. Specialty stores were the ones to lose trips and spending as shoppers aimed to consolidate all grocery needs within one store visit. Traditional grocery and club channels picked up substantial additional dollars early on in the pandemic. Dollar shares for mass/supercenters and grocery stores have already started to normalize.
IMPLICATION: It is not all about dinner. Between working from home and a very different back-to-school landscape, strategize by channel to capture and keep the many new meal occasions, particularly breakfast and lunch.
FRESH FOODS E-COMMERCEE-commerce sales very quickly exploded along with in-store sales, and demand far exceeded slot availability in many cases. E-commerce sales gains versus 2019 averaged between 80% and 100% between mid-March and mid-May, but did slow down somewhat in late May and early June as social distancing measures were relaxed in most states. Fresh food e-commerce also increased significantly, though not as much in the early weeks as overall e-commerce. As shoppers gained confidence in ordering groceries online based on positive experiences, fresh e-commerce spiked 150.5% during mid-April to mid-May.
IMPLICATION: E-commerce, including a dramatic increase in purchasing meat online. Win from the first click and transfer in-store loyalty and differentiation to online buyers.
12.1% 12.6% 12.8% 12.3% 12.9% 13.5%2.2% 1.9% 2.1% 2.0% 1.9% 2.0%7.7% 7.5% 7.2% 7.4% 7.2% 7.1%
41.8% 43.1% 42.7% 42.8% 42.3% 42.1%
19.8% 18.6% 18.3% 18.9% 19.5% 19.5%
4 weeks ending 03-22 4 weeks ending 04-19 4 weeks ending 05-17 4 weeks ending 06-14 4 weeks ending 07-12 4 weeks ending 08-09
Share of total fresh meat dollars during the pandemic
Club Health/specialty grocery Discount grocery Traditional grocery Mass/supercenter
44.1%67.1%
98.5%
150.5%120.7% 110.4%
4 weeks ending 02-23-20
4 weeks ending 03-22-20
4 weeks ending 04-19-20
4 weeks ending 05-17-20
4 weeks ending 06-14-20
4 weeks ending 07-12-20
Fresh foods e-commerce sales growth vs. YA
Source: IRI, all outlets, share of fresh meat dollars, % of total dollar sales
Source: IRI eMarket Insights for perishable categories (meat, produce, seafood, deli and bakery), dollar sales 4-week growth vs. YA
As shoppers gained
confidence in ordering
groceries online based
on positive experiences,
fresh e-commerce spiked
150.5% during mid-April
to mid-May.
!
MEAT DEPARTMENT REPORT | September 2020
Pandemic Protein Performance
4
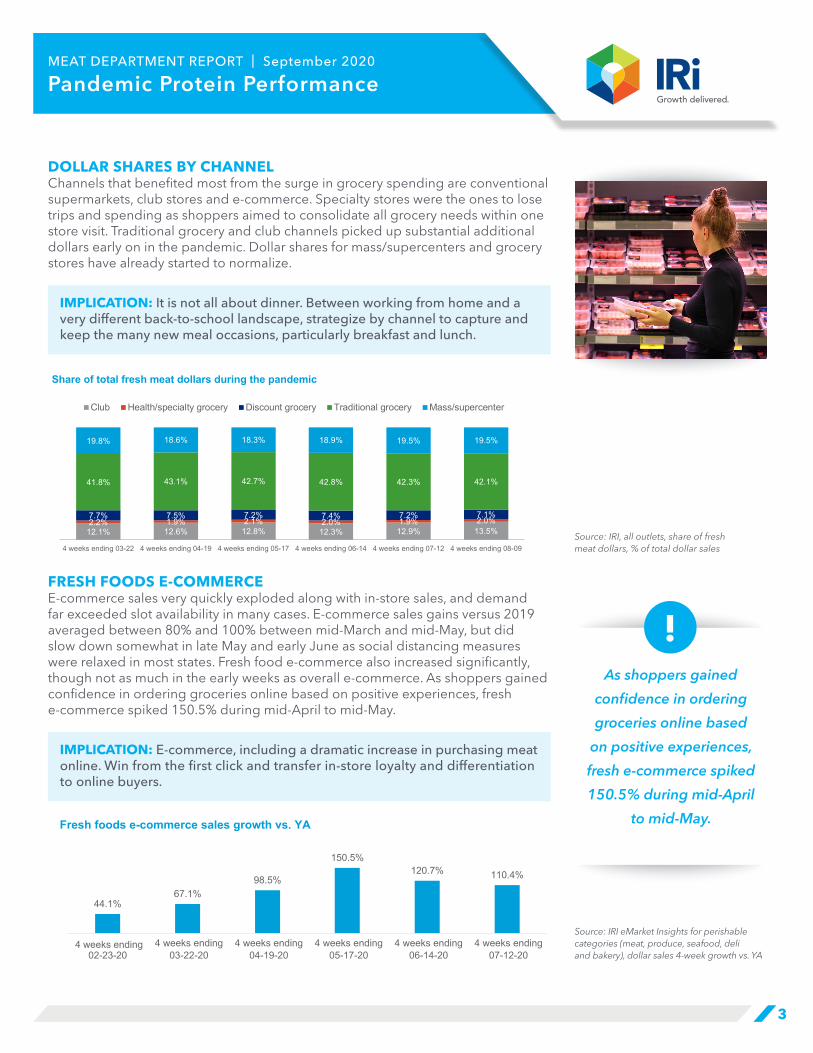
MEAT DEPARTMENT SALESWithin the fresh perimeter, meat is king, nearly doubling sales in mid-March. Meat dollar sales have been outperforming volume sales throughout the pandemic, due to high levels of inflation, especially in beef and pork. Come August, inflation moderated significantly in favor of the consumer, and the gap between volume gains and dollar growth is far below year-ago levels, down to just 8 points.
IMPLICATION: Across departments, shopper behavior shows that shelf life matters. Consider packaging that supports longer shelf life and stock-the-freezer events.
MEAT DEPARTMENT ASSORTMENTSupply chain tightness caused the average number of items per store to drop come the end of March. At its lowest point, during the week of May 18, meat department assortment was down an average of 48 items. Many stores implemented purchase limits, including a maximum number of packages per transaction. Assortment made a big comeback at the end of August but remains down about 14 items versus pre-pandemic levels.
IMPLICATION: Frozen meat and poultry sales have been on fire and emerged as a true extension of the meat department.
-1%8%
80%92%
38%43%46%
18%
51% 54%
43%
28%23%20% 21%17%
33%
16%18%21% 23% 22%15% 15% 16%
16%
-4%
5%
72%78%
30%37%39%
3%
36%39%29%
13%5% 3% 2% 1%14%
-1%4% 8% 10%11% 6% 6% 7%
8%
3/1 3/8 3/15 3/22 3/29 4/5 4/12 4/19 4/26 5/3 5/10 5/17 5/24 5/31 6/7 6/14 6/21 6/28 7/5 7/12 7/19 7/26 8/2 8/9 8/16 8/23
$ and lbs growth meat department vs. comparable week in 2019 Dollar growthVolume growth
3/1 3/8 3/15 3/22 3/29 4/5 4/12 4/19 4/26 5/3 5/10 5/17 5/24 5/31 6/7 6/14 6/21 6/28 7/5 7/12 7/19 7/26 8/3 8/9 8/16 8/23
335 334353
330308 318 318 314 310 311 304 297 299
270300 305 312 312 320 315 317 319 321 323 324 324
0
50
100
150
200
250
300
350
400
-60.0
-50.0
-40.0
-30.0
-20.0
-10.0
0.0
Average items per store selling Average items/storeChange vs. year ago
Source: IRI, MULO, 1-week % growth vs. YA
Source: IRI, MULO, average items per store selling
At its lowest point,
during the week of May
18, meat department
assortment was down an
average of 48 items.
!
MEAT DEPARTMENT REPORT | September 2020
Pandemic Protein Performance
5
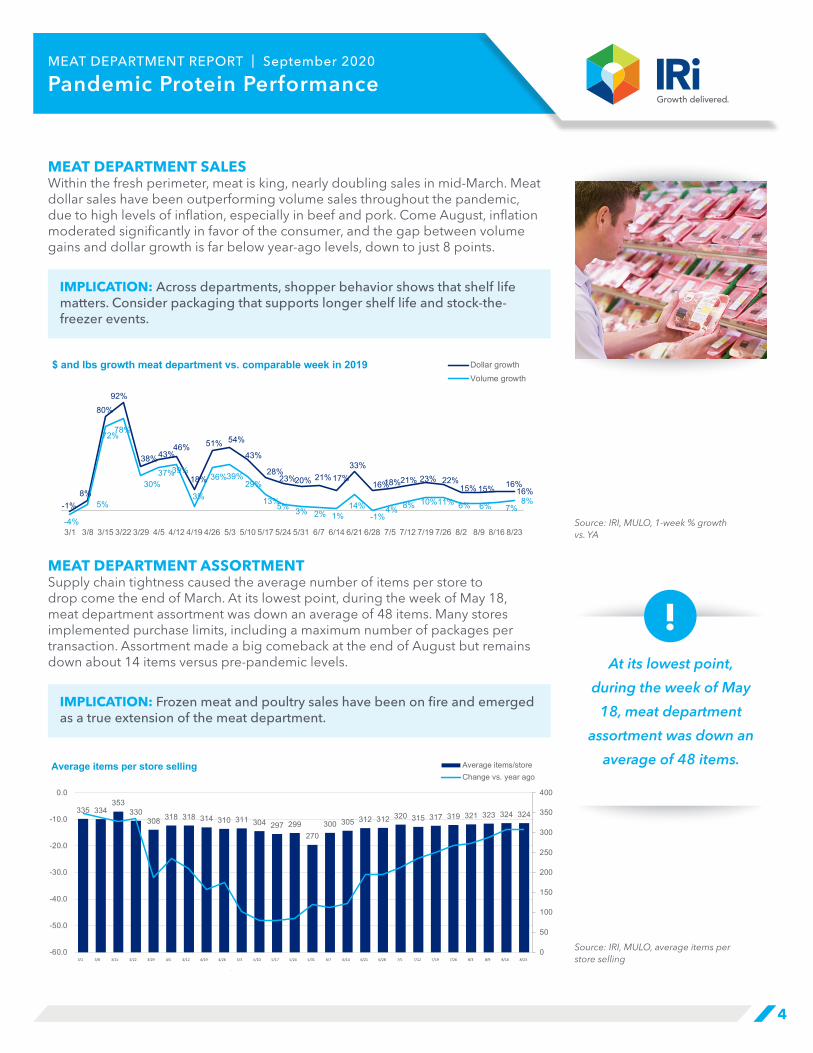
PRICE PER VOLUMESupply shortages led to an increase in the price per volume from $3.56 during the first week of March to as high as $4.16 during the week of June 21, 2020. This was $0.60 higher than the same week year ago and primarily driven by beef and pork. Prices started to moderate in August, but they remain 8% above 2019 levels.
IMPLICATION: Proactively plan for economic pressure with strategic pricing/promotional engagement. Financial pressure often results in buying value packs, private brands, as well as cheaper cuts of meat, frozen products, meat sold on promotion, or simply less of it.
CATEGORY PERFORMANCEBeef, chicken and pork saw tremendous sales increases early on in the pandemic. Tightness in supply for the big three caused smaller proteins to step in, which led to big sales surges for turkey, lamb and exotic proteins, such as bison. Meat sales were boosted by strong inflation, particularly in June. During the first half of 2020 through August 23, meat department dollar sales were up 31.7% over year ago, or an additional $8.6 billion sold versus the same time period in 2019. Year-to-date volume sales through August 23 were up 19.1% over the same period in 2019, reflecting an additional 1.5 billion pounds of meat and poultry sold.
2020 Weekly $ sales gains vs. comparable 2019 week ending…$
3/1 3/8-3/29 4/5-4/26 5/3-5/31 6/7-6/28 7/5-7/26 8/16 8/23 8/23
TOTAL MEAT -1% +54% +38% +32% +22% +21% +16.1% +16.2% $1.26B
Fresh
Beef 0% +53% +42% +36% +27% +28% +19.5% +20.5% $531M
Chicken +1% +41% +32% +21% +13% +12% +9.6% +7.2% $242M
Pork -5% +56% +44% +32% +24% +21% +8.9% +10.6% $123M
Turkey 0% +72% +36% +43% +23% +17% +11.2% +10.0% $37M
Lamb +1% +34% +8% +36% +39% +39% +19.8% +34.6% $9M
Exotic +5% +92% +54% +61% +48% +36% +32.7% +28.4% $3M
Processed
Smoked ham/pork -6% +118% +20% +63% +35% +26% +15.8% +15.7% $15M
Sausage 0% +63% +42% +35% +24% +17% +18.5% +18.9% $120M
Frankfurters -1% +76% +39% +20% +17% +14% +19.1% +18.6% $56M
Bacon -6% +54% +48% +34% +18% +19% +19.6% +20.7% $112M
$3.56$3.57
$3.70$3.73$3.69$3.63
$3.51
$3.69$3.79$3.80
$3.92$3.92$3.94$4.04$4.08
$4.13$4.16$4.08
$3.92$3.99$3.95
$3.89$3.88$3.84$3.85$3.80
$3.00
$3.20
$3.40
$3.60
$3.80
$4.00
$4.20
$4.40
$0.00
$0.10
$0.20
$0.30
$0.40
$0.50
$0.60
$0.70
3/1 3/8 3/15 3/22 3/29 4/5 4/12 4/19 4/26 5/3 5/10 5/17 5/24 5/31 6/7 6/14 6/21 6/28 7/5 7/12 7/19 7/26 8/3 8/9 8/16 8/23
Total meat price per volume Price per poundChange vs. year ago
Source: IRI, MULO, total meat price per volume
Source: IRI, Total US, MULO, 1-week % change vs. YA
During the first half of
2020 through August
23, meat department
dollar sales were up
31.7% over year ago, or
an additional $8.6 billion
sold versus the same
time period in 2019.
!

MEAT DEPARTMENT REPORT | September 2020
Pandemic Protein Performance
6
GRINDSGrinds, in particular ground beef, have been a pandemic powerhouse. Combined, grinds generated an additional $1.8 billion in sales between March 15 and August 23. During the pandemic period, ground beef sales represented 87% of dollars and 88.1% of category growth.
Pandemic (3/15-8/23) grinds performance vs. year ago
$ sales % of fresh meat
% of protein $ gains %
$ gains lbs
sales
% of fresh lbs
meat
Lbs gains
% lbs gains
Ground beef $5.9B 21.8% 39.2% +$1.5B +35.3% 1.4B 19.1% +194M +16.7%
Ground turkey $699M 2.6% 62.6% +$161M +30.0% 193M 2.7% +38M +24.2%
Ground chicken $100M 0.4% 1.5% +$25M +33.2% 24M 0.3% +5M +28.6%
Ground pork $82M 0.3% 2.2% +$22M +35.6% 22M 0.3% +5M +26.1%
CATEGORY ENGAGEMENTOn a full year, meat department household penetration has been around 98.2% of the total population. That meant that growing the category in regular times was not as much about finding more buyers, but about finding ways to expand consumers’ consumption frequency through a greater buying frequency and/or basket size — each boosting meat sales at retail. During the pandemic, the surges in meat sales were fueled by increases in all three levers of growth: buyers, trips and spending. For the midyear view, between January and July 12, household penetration grew by 0.5%. This increase was slightly higher when looking at the pandemic period (March 15 to July 12), at +0.8%.
Much greater gains are seen for spend per household and purchase frequency. During the pandemic, buyers spent 37.3% more on meat and poultry than they did during the same period in 2019. Meat also landed in the basket much more frequently, with a 16.9% increase in meat trips during the pandemic.
IMPLICATION: Shoppers engaged with new stores and new brands. Pursuing new buyers and converting even a fraction into long-term loyalty can have big revenue upside.
Meat department Fixed and random weight
Household penetration
Period spend per household
Purchase frequency per household
Share Change Spend Change Trips Change
Year-to-date 2020 vs. YA 96.9% +0.5% $318.62 +26.6% 20.4x +13.1%
Pandemic period vs. YA 94.6% +0.8% $244.79 +37.3% 14.9x +16.9%
Source: IRI, Total US, MULO, 1-week % change vs. YA
Source: IRI, Household panel data, all outlets, fixed and random weight meat; pandemic: March 15-July 12, 2020, vs. YA
Growing the category
in regular times was not
as much about finding
more buyers, but about
finding ways to expand
consumers’ consumption
frequency through a
greater buying frequency
and/or basket size.
!

MEAT DEPARTMENT REPORT | September 2020
Pandemic Protein Performance
7
While household engagement is high across the board, spending levels differed vastly by generation. Millennials became the biggest generation in 2016 but are not the largest spending generation in either total food or meat. Boomers and Gen X far outspent Millennials in today’s market, both pre-pandemic and during the pandemic. Gen X, the most likely to have children living at home, lead spending growth in absolute dollars, but all generations spent significantly more during the pandemic. This signals that future success requires a careful balancing of current spending patterns versus the very different wants and needs of the Millennial and Gen Z generations.
Generational shares Gen Z* Millennials Gen X Boomers Seniors
% of total food (center store and fresh) 0.3% 24.1% 31.1% 34.5% 10%
% of meat sales (fixed + random weight) 0.3% 24.1% 32.3% 34.3% 9.0%
% of change in meat dollar sales +50.1% +26.0% +32.0% +28.2% +20.0%
% of meat buyers 0.3% 25.6% 29.1% 33.4% 11.6%
% change in meat buyers +55.7% +1.0% +2.1% +0.9% -0.5%
VALUE-ADDED MEAT SALESAs pandemic shopping patterns started to unfold, many retailers had limited ability to create value-added items in-house, due to a lack of available labor hours. But case-ready value-added items did very well. While value-added items had lesser availability, sales increased 29.2% between March 15 and July 12 versus the same period year ago. Given enormous conventional sales, value-added shares dropped slightly, with the exception of turkey.
Value-added meat and poultry
52-week share of total meat/protein
52-week $ growth
Pandemic share of total meat/protein
Pandemic $ growth vs. YA
Total 9.5% +2.4% 9.0% +29.2%
Beef 8.9% +2.9% 8.6% +33.5%
Chicken 8.0% -0.5% 7.5% +12.6%
Pork 16.1% +6.3% 14.4% +34.4%
Turkey 10.4% -4.8% 12.5% +38.6%
Boomers and Gen X far
outspent Millennials in
today’s market, both
pre-pandemic and
during the pandemic.
While value-added items
had lesser availability, sales
increased 29.2% between
March 15 and July 12 versus
the same period year ago.
!
!
Source: IRI, Household panel data, all outlets, fixed and random weight meat; latest 26 weeks ending July 12, 2020, vs. YA
* Very small sample
Source: IRI, U.S. MULO, fixed and random weight, 52-week period pre-pandemic vs. pandemic March 15-July 12, 2020, vs. YA

MEAT DEPARTMENT REPORT | September 2020
Pandemic Protein Performance
8
CLAIMS-BASED MEAT SALESMuch like value-added, claims-based meat availability was spotty at times, which would have affected purchase ability. However, antibiotic-related claims, as well as organic and grass-fed claims, saw unprecedented growth rates, led by beef in both the organic and antibiotic-related claim areas. Chicken, which lost some market share amid the pandemic, also saw some softness in antibiotic-free claim sales, which led to a drop in share.
Claims-based meat and poultry
52-week share of total meat/protein
52-week $ growth
Pandemic share of total meat/protein
Pandemic $ growth vs. YA
Total 15.3% +3.6% 17.6% +31.9%
Organic
Total 2.1% +5.7% 2.1% +35.8%
Beef 1.3% +9.8% 1.4% +57.9%
Chicken 5.3% +4.6% 5.2% +26.0%
Pork 0.1% -24.8% 0.1% +4.0%
Turkey 2.1% +8.9% 2.1% +29.6%
Antibiotic claims
Total 13.2% +3.2% 12.5% +30.9%
Beef 4.1% +0.6% 4.5% +60.6%
Chicken 37.2% +3.7% 35.2% +22.4%
Pork 4.1% +0.2% 3.9% +28.5%
Turkey 11.7% +7.8% 14.7% +52.9%
Grass-fed
Grass-fed total 2.6% +1.2% 1.4% +64.3%
Grass-fed NAE -- -3.7% -- +74.4%
Grass-fed organic -- +7.5% -- +52.1%
MARKET SHIFTS Market shares during the pandemic shifted considerably, in favor of beef. Chicken has been down in both dollar and volume share.
Share of dollar sales
52-weeks ending February 23, 2020 Building calendar
Beef 54.2% 55.5%
Chicken 26.7% 25.3%
Pork 13.6% 13.6%
Turkey 4.2% 4.3%
Lamb 0.9% 0.9%
Veal 0.1% 0.1%
Exotic 0.3% 0.3%
IMPLICATION: Holiday demand has been strong as people celebrate, but in smaller gatherings at home. Accommodate for these new ways of celebrating for fall and winter holiday celebrations.
Source: IRI, U.S. MULO, fixed and random weight, March 15-July 12, 2020, vs. YA
Source: IRI, U.S. MULO, fixed and random weight, share of dollars vs. YA

MEAT DEPARTMENT REPORT | September 2020
Pandemic Protein Performance
9
FROZEN PROTEIN SALESFrozen foods sales have been extremely strong throughout the pandemic, in dollars, units and volume — with meat and seafood among the strongest performers. Frozen meat sales were fueled by an increase in both trip frequency and basket size. Animal protein is the second-largest area within frozen food, closely behind frozen entrées. Meat is the only area within frozen food that saw an increase in assortment.
% sales change 1 week ending 8/23 vs. YA
Category Dollar Gains
Unit gains
Volume gains
Volume/dollar gap (percentage points)
Frozen meat/poultry/seafood +28.8% +18.5% +18.1% -10.7
Processed poultry +30.0% +21.4% +25.8% -4.2
Meat +26.6% +16.3% +10.5% -16.1
Seafood +42.1% +30.5% +34.0% -8.1
SEAFOOD SALESShoppers also diverted protein dollars to seafood throughout the pandemic. Sales gains for both frozen and fresh remain 30% to 50% above year-ago levels five months into the pandemic. Levels dropped somewhat by August, to between 20% and 30% above last year’s levels for fresh and 35% to 45% for frozen seafood.
Source: IRI, Total US, MULO, March 15-August 23, 2020, vs. YA
Sales gains for both
frozen and fresh remain
30% to 50% above year
ago levels five months
into the pandemic.
!
17%
-3%
27%22%
0%4%
19%
-4%
40% 40%51%48% 52% 48% 45%
26.0%
66%
45%33%
42%36%34%
28% 25%29% 30%18%
-4%
70%
100%
36% 38%44%
34%
79%70% 70%
64% 66%59%
50%46%59% 51% 45% 42%
50% 53%
39% 37% 35% 42%
3/1 3/8 3/15 3/22 3/29 4/5 4/12 4/19 4/26 5/3 5/10 5/17 5/24 5/31 6/11 6/14 6/21 6/28 7/5 7/12 7/19 7/26 8/2 8/9 8/16 8/23
$ growth fresh and frozen seafood vs. comparable week in 2019 Fresh seafoodFrozen seafood
Source: IRI, Total US, MULO, 1-week % change vs. YA
MEAT DEPARTMENT REPORT | September 2020
Pandemic Protein Performance
10
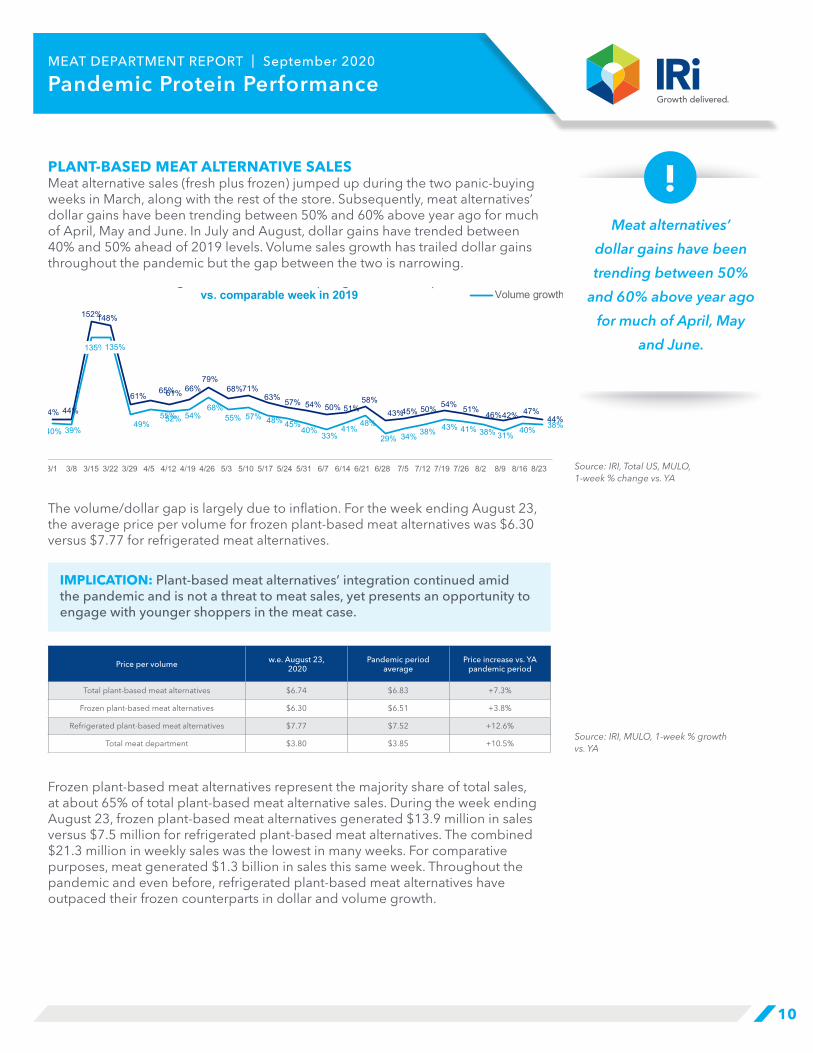
PLANT-BASED MEAT ALTERNATIVE SALESMeat alternative sales (fresh plus frozen) jumped up during the two panic-buying weeks in March, along with the rest of the store. Subsequently, meat alternatives’ dollar gains have been trending between 50% and 60% above year ago for much of April, May and June. In July and August, dollar gains have trended between 40% and 50% ahead of 2019 levels. Volume sales growth has trailed dollar gains throughout the pandemic but the gap between the two is narrowing.
The volume/dollar gap is largely due to inflation. For the week ending August 23, the average price per volume for frozen plant-based meat alternatives was $6.30 versus $7.77 for refrigerated meat alternatives.
IMPLICATION: Plant-based meat alternatives’ integration continued amid the pandemic and is not a threat to meat sales, yet presents an opportunity to engage with younger shoppers in the meat case.
Price per volume w.e. August 23, 2020
Pandemic period average
Price increase vs. YA pandemic period
Total plant-based meat alternatives $6.74 $6.83 +7.3%
Frozen plant-based meat alternatives $6.30 $6.51 +3.8%
Refrigerated plant-based meat alternatives $7.77 $7.52 +12.6%
Total meat department $3.80 $3.85 +10.5%
Frozen plant-based meat alternatives represent the majority share of total sales, at about 65% of total plant-based meat alternative sales. During the week ending August 23, frozen plant-based meat alternatives generated $13.9 million in sales versus $7.5 million for refrigerated plant-based meat alternatives. The combined $21.3 million in weekly sales was the lowest in many weeks. For comparative purposes, meat generated $1.3 billion in sales this same week. Throughout the pandemic and even before, refrigerated plant-based meat alternatives have outpaced their frozen counterparts in dollar and volume growth.
44% 44%
152%148%
61%65%61% 66%
79%68%71%
63% 57% 54% 50% 51%58%
43%45% 50% 54% 51%46%42% 47%
44%40% 39%
135%135%
49%55%52% 54%
68%55% 57% 48% 45%
40%33%
41%48%
29% 34% 38% 43% 41% 38% 31%40% 38%
3/1 3/8 3/15 3/22 3/29 4/5 4/12 4/19 4/26 5/3 5/10 5/17 5/24 5/31 6/7 6/14 6/21 6/28 7/5 7/12 7/19 7/26 8/2 8/9 8/16 8/23
$ and lbs growth meat alternatives (refrigerated + frozen) vs. comparable week in 2019
Dollar growthVolume growth
Source: IRI, Total US, MULO, 1-week % change vs. YA
Source: IRI, MULO, 1-week % growth vs. YA
Meat alternatives’
dollar gains have been
trending between 50%
and 60% above year ago
for much of April, May
and June.
!

MEAT DEPARTMENT REPORT | September 2020
Pandemic Protein Performance
11
Converting dollars to shares, 67.9% of plant-based meat alternative sales were generated by frozen items the month of March. The remaining 32.1% were generated by refrigerated items, typically merchandised in or around the fresh meat case. Given their higher growth rate, refrigerated meat alternatives gained several percentage points in share.
$ share meat alternatives
Mar(3/8-3/29)
Apr(4/5-4/26)
May(5/3-5/31)
June(6/7-6/28)
July(7/5-7/28)
w.e.8/23
Frozen 67.9% 67.8% 65.9% 64.7% 63.8% 65.1%
Refrigerated 32.1% 32.2% 34.1% 35.3% 36.2% 34.9%
The volume share of refrigerated plant-based meat alternatives is slightly lower than their dollar share, given that refrigerated alternatives average a higher price per volume, as seen earlier.
Lbs share meat alternatives
Mar(3/8-3/29)
Apr(4/5-4/26)
May(5/3-5/31)
June(6/7-6/28)
July(7/5-7/28)
w.e.8/23
Frozen 70.7% 70.6% 69.0% 67.7% 67.1% 69.7%
Refrigerated 29.3% 29.4% 31.0% 32.3% 32.9% 30.3%
Despite robust sales gains, refrigerated meat alternative dollar sales remained a fraction of meat department sales.
$ Sales Mar(3/8-3/29)
Apr(4/5-4/26)
May(5/3-5/31)
June(6/7-6/28)
July(7/5-7/28)
w.e.8/23
Meat department $6.655 billion $6.261 billion $7.588 billion $5.655 billion $5.733 billion $1.3 billion
Refrigerated plant-based
meat alternatives$34.0 million $28.1 million $31.0 million $31.0 million $32.3 million $21.3 million
44% 44%
152%148%
61% 65%61% 66%79%
68%71%63% 57% 54% 50% 51%
58%43%45% 50% 54%
51%
40% 39%
135%135%
49%55%52% 54% 68%
55% 57% 48% 45%40% 33% 41% 48%29% 34% 38% 43% 41%
3/1 3/8 3/15 3/22 3/29 4/5 4/12 4/19 4/26 5/3 5/10 5/17 5/24 5/31 6/7 6/14 6/21 6/28 7/5 7/12 7/19 7/26
$ and lbs growth meat alternatives (refrigerated + frozen) vs. comparable week in 2019
Dollar growthVolume growth
Source: IRI, MULO, 1-week % growth vs. YA
Source: IRI, MULO, share of frozen vs. refrigerated plant-based meat alternatives as a percentage of the total
Source: IRI, MULO, share of frozen vs. refrigerated plant-based meat alternatives as a percentage of the total
Source: IRI, MULO, $ sales by period

Copyright © 2020 Information Resources, Inc. (IRI). All rights reserved. IRI, the IRI logo and the names of IRI products and services referenced herein are either trademarks or registered trademarks of IRI. All other trademarks are the property of their respective owners.
12
MEAT DEPARTMENT REPORT | September 2020
Pandemic Protein Performance
Since the onset of the pandemic-related changes in grocery patterns, the meat department has generated an additional $8.6 billion in sales, versus an additional $106 million for refrigerated plant-based meat alternatives. In volume, an additional 1.5 billion pounds of meat and poultry were sold between March 15 and August 23 compared with 2019 versus an additional 12.8 million pounds of refrigerated plant-based meat alternatives.
Pandemic period (March 15-August 23) Dollar growth % Absolute dollar gains Volume growth % Absolute lbs gains
Meat department +31.7% $8.6 billion +19.1% 1.5 billion
Refrigerated plant-based meat alternatives +130.3% $106 million +104.4% 12.8 million
Because of these absolute dollar gain differences, the share of refrigerated plant-based meat alternatives as a percentage of the total (meat department sales plus refrigerated plant-based meat alternative sales) actually dipped in March and April. The share for plant-based alternatives stood at 0.7% during the week ending March 1 and dropped to a low of 0.5% during the week of April 12 (Easter week). The share for refrigerated plant-based meat alternatives averaged 0.6% during the months of July and August.
The volume share for meat alternatives has held relatively steady, at 0.3%.
Share of volume Mar(3/8-3/29)
Apr(4/5-4/26)
May(5/3-5/31)
June(6/7-6/28)
July(7/5-7/28)
w.e. 8/23
Refrigerated plant-based meat alternatives share of total meat + refrigerated alternative sales 0.3% 0.2% 0.3% 0.3% 0.3% 0.3%
While limited supply rocked the fresh meat department throughout May and June, refrigerated meat alternatives have remained consistent in distribution. During the week of August 23, refrigerated meat alternatives averaged 14.2 items or 4.2% of total packages in the case.
Average items per store selling Mar(3/8-3/29)
Apr(4/5-4/26)
May(5/3-5/31)
June(6/7-6/28)
July(7/5-7/28)
w.e. 8/23
Meat department 332.4 318.3 305.5 306.1 317.9 323.8
Refrigerated plant-based meat alternatives 15.3 14.0 14.0 14.4 14.6 14.2
SKU share alternatives 4.4% 4.2% 4.4% 4.5% 4.4% 4.2%
Source: IRI, MULO, dollar and pound growth March 15 through August 23, 2020, vs. the comparable period in 2019
Source: IRI, MULO, 1-week $ sales and market share
Source: IRI, MULO, 1-week lbs sales and lbs share
Source: IRI, Total US, MULO, average weekly items per store selling
0.7%0.6%
0.6%0.6%0.6%
0.5%0.5%
0.6%0.6%
0.6%0.6%
0.7%0.7%
0.6%0.5%0.5%0.5%0.6%0.5%0.6%0.6%0.6%0.6%0.6%0.6%0.6%
0.0%
0.1%
0.2%
0.3%
0.4%
0.5%
0.6%
0.7%
$0
$500,000,000
$1,000,000,000
$1,500,000,000
$2,000,000,000
$2,500,000,000
3/1 3/8 3/15 3/22 3/29 4/5 4/12 4/19 4/26 5/3 5/10 5/17 5/24 5/31 6/7 6/14 6/21 6/28 7/5 7/12 7/19 7/26 8/2 8/9 8/16 8/23
$ sales meat department vs. refrigerated meat alternatives Meat department dollars Meat alternatives (refrigerated) dollars Share meat alternatives