Panama City Beach 2017 In Review - Cloudinary · PDF filePanama City Beach 2017 In Review May...
63
Panama City Beach 2017 In Review May 2017
-
Upload
nguyenhanh -
Category
Documents
-
view
215 -
download
0
Transcript of Panama City Beach 2017 In Review - Cloudinary · PDF filePanama City Beach 2017 In Review May...

Panama City Beach2017 In Review
May 2017

• Brand Networks Overview
• 2017 Round-up• 2017 Performance & Analysis• PCB & Industry Benchmarks• Ideas for Fall & Winter
• Industry Updates & Social Trends• Brand Networks Platform Updates & New Features• Appendix
Today’s Agenda
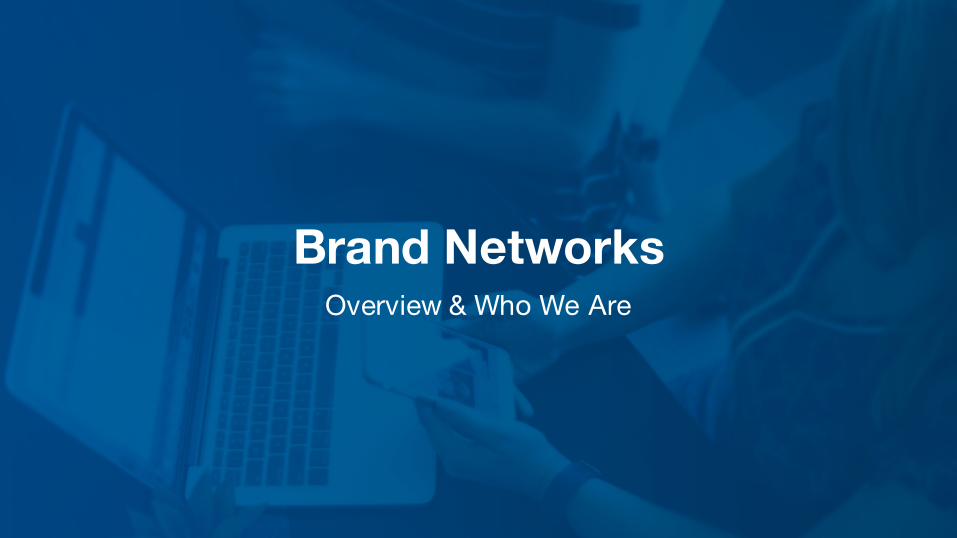
Brand NetworksOverview & Who We Are

• Delivering $500MM+ in paid social advertising annually
• More than 225 employees globally
• Award-winning product innovation: winner of two Facebook Innovation contests
• Specializing in brand awareness and direct response
• Managed, licensed, and professional services offerings
• Strong partnership with key social platforms
• Frequent participation in alpha/beta opportunities with social partners
World Class Customers
Exclusive Access to All Platforms
Simplifying Social Since 2006
About Brand Networks

What We Offer Visit Panama City Beach
History Long-standing relationship, serving as a resource of archival information and data
Expertise Highly experienced service team who is dedicated to mastering the ever-changing social space
Technology Award-winning, innovative technology via a single point of access that makes social buying
and reporting more sophisticated & automated
Cross Channel View Ability to draw insights and implement learnings cross-platform
First API Access One of the first to gain access to Facebook, Twitter, LinkedIn, Instagram, Pinterest and
Snapchat, will continue to be the first
Unbiased Party Advocates for social that makes sense for you; we don’t have a stake in platform sells

Visit Panama City Beach Dedicated Team
Oversees the executional aspects of campaigns,
working across all stakeholders to ensure
long-term vision is translated into tactical strategy in all media
executions.
Responsible for day-to-day execution and campaign
management, working closely alongside other team members to build,
analyze, report and support client campaigns.
Anna Didio
SENIOR MEDIA ANALYST
Kara Doran
MEDIA DEVELOPMENT
MANAGER
Alida Lambert
MEDIA EXECUTION MANAGER
Amy Slife
MEDIA SERVICES DIRECTOR
Oversees the client and business development aspects
of all campaigns, consulting and driving strategy and paid
media opportunities for clients.
Responsible for overall team management and
success.
Lisa Fruggiero
SALES DIRECTOR
Responsible for driving new business opportunities across new channels, data and measurement partners and new
platform features that align with client's business goals.

How We Work Together
Develops creative & sets overarching
campaign initiatives, strategy, and communicates
client goals and objectives.
Develops media plans & targeting
to meet campaign goals. Executes, optimizes and reports on paid
media.
Directs team on creative and
campaign strategy through business goals,
upcoming events and objectives.

Visit Panama City Beach 2017 Round-up

595K51 M 1.5 MImpressions
Average CPM
Video Views
Facebook and InstagramDriving Business Results
$7.57
Website Traffic
.

2017 Primary Objectives
Website Traffic Events
Video Consumption

Platform & Ad Mix
Placement Optimization introduced: 1/30/17*
Placement Optimization: A feature within the FB/IG platform that automatically optimizes delivery of the ads across platforms (FB and IG) to get the lowest overall cost per result.
Benefits of Placement Optimization: Utilizing placement optimization expands available reach by leveraging multiple platforms, and allows us to spend budget more efficiently.
Results: To-date Facebook has proved to drive the most efficient results to date, with platform optimization allocating 99% of the total budget towards Facebook over Instagram
*With the exception of Event Ads, available on FB-only
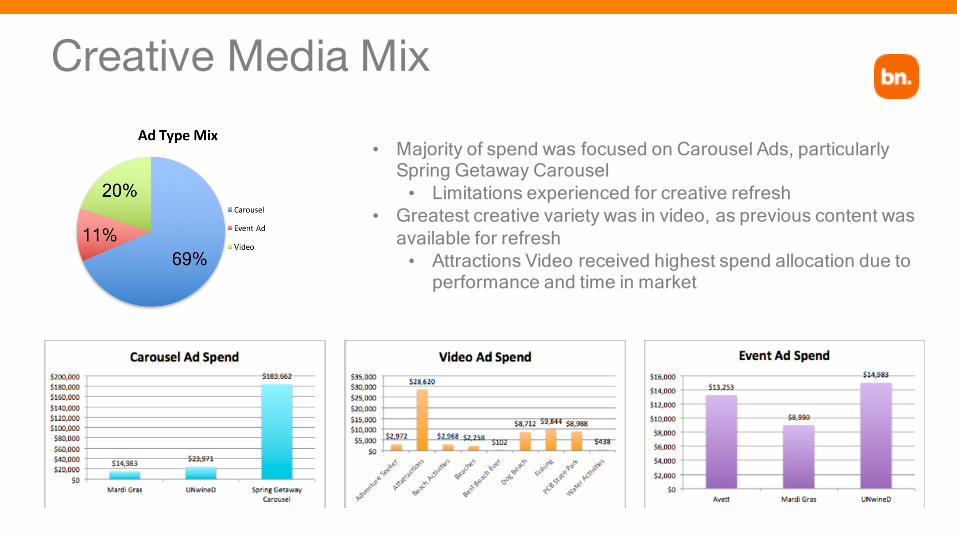
Creative Media Mix
• Majority of spend was focused on Carousel Ads, particularly Spring Getaway Carousel
• Limitations experienced for creative refresh• Greatest creative variety was in video, as previous content was
available for refresh• Attractions Video received highest spend allocation due to
performance and time in market

Key TakeawaysTakeaways
● Frequent creative refreshes drive increased efficiencies and performance
● The Empty Nester, Long Weekend, and Young Families audiences see better CTR% performance among the Southeast markets, while the Couples and CVO target segments see better CTR% performance among the Northern markets
● Overall, the audience segments with the Southeast geo layer outperformed the Northern audience segments, from both a performance and efficiency standpoint
Recommendations
● Refresh creative every two to three weeks for optimal performance
● Continue to test broad vs. more highly targeted audience segments to compare effectiveness, improve performance and identify key audience targets for future campaigns
● Consider implementing more lower-funnel targeting/optimization tactics (Video sequencing, Website Custom Audience Targeting) to re-target and build lookalikes off users who have already been exposed to the PCB messaging/brand

Visit Panama City Beach Detailed Analysis

Timeline
Spring Getaways Campaign• Video Ads: Optimizing for Link Clicks• Carousel Ads: Optimizing for Link Clicks• Event Ads: Optimizing for Event Responses• CVO layer overarching all non-event targets
Summer Campaign• Video Ads: Optimizing for Video Viewing
and Completion• Carousel Ads: Optimizing for Link Clicks• CVO layer removed, custom targeting
implemented
JANUARY2017
FEBRUARY2017
MARCH2017
APRIL2017
Agency Team ChangeLuckie/Watauga Split
BN Team ChangeChicago to Boston
Ongoing Optimizations: • Brand Networks proprietary tool, OPTIMIZE NOW.• Budget shifts toward most efficient targets.• Daily bid and budget adjustments for pacing purposes.• Addition of new target segments to increase performance/efficiencies.
1/30/17Placement Optimization
Introduced
2/3/17Optimize Now
Introduced
3/31/17Spring Getaways Campaign Ends
1/27/17Spring Getaways Campaign Begins
4/21/17Summer Campaign
Begins

MAY2017
JUNE2017
JULY2017
AUGUST2017
SEPTEMBER2017
OCTOBER2017
NOVEMBER2017
DECEMBER2017
New Creative by Luckie / Watauga
Launch Snapchat Test
Launch New Ad Campaigns
Extended Stay, Weekend Families,
Sports Families, Empty Nester Couples
Creative Go Live
Update Copy and Creative to focus on Winter Holidays + Long Weekends
2018 Planning + Summer QBR
Launch Pinterest Ads
Promote NYE + Long Weekend Events
TDC Meeting
Extended Stay, Weekend Families,
Sports Families, K.I.S. Families, Empty Nester Couples, Couples Go
Live
Launch Canvas Ad
QBR for Summer Campaigns
Looking Forward
EOY Wrap-Up
Spring Break Push
Time for a Creative Refresh on any Facebook Always On Campaigns

CVO
Summer Stay
Long Weekend
Empty Nesters
Couples
Event Targeting
Young Families
Sports Families
Audience Focus & Audience EvolutionOur Audience Approach
• Q1 Spring Approach: Primary targeting focus was Chief Vacation Officer (CVO)
• Audience targets included CVO base layer + additional interests/behaviors
• Audiences were geo segmented (Northern vs. Southeast)
• Q2 Summer Approach: Expand audience focus beyond the Chief Vacation Officer
• Removed CVO layer to broaden potential reach • Northern vs. Southeast segmentation removed in favor of
identified key geographic markets• Age range expanded due to strong performance against the
older demographic (Empty Nesters) in Q1
Video/Carousel
• Q1 Spring Approach: Target users with interests and locations aligned with key events themes
• Test broad vs. highly targeted audience approaches• Target users in close proximity of event to reduce waste and
to increase likelihood of attendance
Event Response
Summer Stay
Long Weekend
Empty Nesters
Couples
Young Families
Sports Families
CVO
Spring
Summer

Audience Performance
Takeaways
• The Southeast audience segments showed more optimal performance over the Northern markets in Q1*
• The Empty Nester audience segment that skewed towards the older demographic saw the best performance overall*
• The Couples, and CVO target segments saw better CTR% performance among the Northern markets, while the Empty Nester, Long Weekend, and Young Families audiences performed better against Southeast*
Targeting Results
* Performance evaluated in terms of VCR% (Video) and CTR% (Carousel), respectively
• Focus on Geos that have historically performed well against each audience for future efforts
• Continue to test Broad vs. more highly targeted audience segments to compare effectiveness
• Target users who have visited the website in the past 180 days (Website Custom Audience) to target users most likely to click off-site
• Build lookalike audiences based off these audience segments to expand reach
Key Recommendations

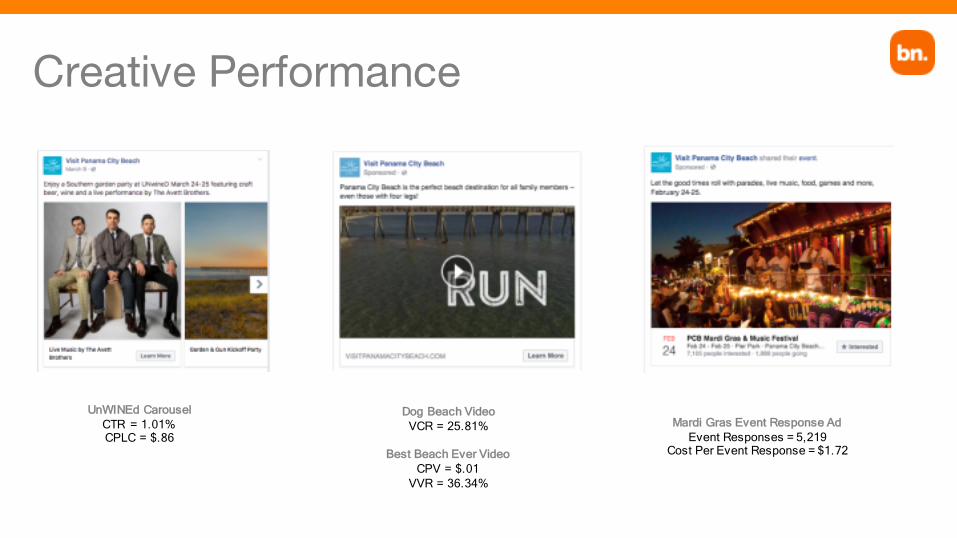
Creative Performance
• Video Completion Rate is correlated with video length
• Video View Rate can be more easily compared across videos with varied lengths
*Please note, the Adventure Seekers Video was the only :20s video. All other videos were :15s. As VCR is dependent on video length, longer videos typically see lower VCRs
• The Mardi Gras Event Response Ad delivered the highest amount of Event Responses, at the most efficient Cost Per Event Response
Creative Performance
Dog Beach Video VCR = 25.81%
Best Beach Ever VideoCPV = $.01
VVR = 36.34%
UnWINEd CarouselCTR = 1.01%CPLC = $.86
Mardi Gras Event Response AdEvent Responses = 5,219
Cost Per Event Response = $1.72

Creative Refreshes: Performance Patterns
• Creative performance tends to drop and cost per result increases after the ad has been in market for longer than two weeks
• Performance ramps up each time there is a creative refresh, with lower cost per result
Recommendations
• Implement a flighted creative approach, refreshing creative every two weeks to prevent creative wear-out against the audience
Takeaways
Indicates Creative Refresh
Visit PCB Benchmarks

Current Performance BenchmarksWebsite Clicks Benchmarks
Benchmark 1.1.17 - 4.22.17 Actual
Overall Website CTR for US Tourism 0.87% CTR 0.73% CTR
Historical Website CTR for Carousel Ads 0.90% CTR 0.64% CTR
Historical Website CTR for Video Ads 0.48% CTR 0.93% CTR
Video Completion Rate (views to 100%) Benchmarks
Benchmark 1.1.17 - 4.22.17 Actual
:15 Video Ads 15% VCR 22.6% VCR
:30 Video Ads 9% VCR n/a
:60 Video Ads 3% VCR n/a

The Funnel + Objectives + BenchmarksAlign benchmarks with objectives & ad types. Different objectives & ad types function to drive different
goals and should be held to different benchmarks
Awareness Consideration Purchase
LeadsConversions
ROAS
CTRCPLCActions
CPECPVVVRVCR
AdRecall

Evolving Performance BenchmarksAwareness
• Page posts
• Video posts
• Carousel Video posts
• Canvas
Acquisition
• Link posts
• Carousel Link posts
• Collection
• Dynamic Product Ads
Benchmarks from PCB 2017 campaign data (Q1 - 4.22)
Consideration
• Event Ads
• Link posts
• Link posts with video
• Carousel Link posts
• Canvas
• Collection
• Engagement Rate: 4.51%
• Cost Per Engagement: $0.17
• Video View Rate: 12.82%
• View Complete Rate: 20.25%
• Cost Per Video View: $0.04
• Click Thru Rate: 0.73%
• Cost Per Website Click: $0.98
• Cost per action: N/A
• ROAS: N/A

Investment by Objective
2016 competitor comparison from Facebook
Not Applicable
• Product Catalog Sales
• Local Awareness
• Offer Claims
Ahead of the Curve
• Clicks to Website
• Video Views
Room for Improvement
• Brand Awareness
• Page Likes
• Reach
• Event Responses (seen improvement in 2017)
• Website Conversions

Comparing Link Click CTR
Advertiser 0.84%
Vertical 1.05%
Competitor 1.01%
Q4 2016 Targets
● Winter residents● PCB website custom audience LAL● Family vacation tendencies
2016 competitor comparison from Facebook

New Ideas for Fall & Winter
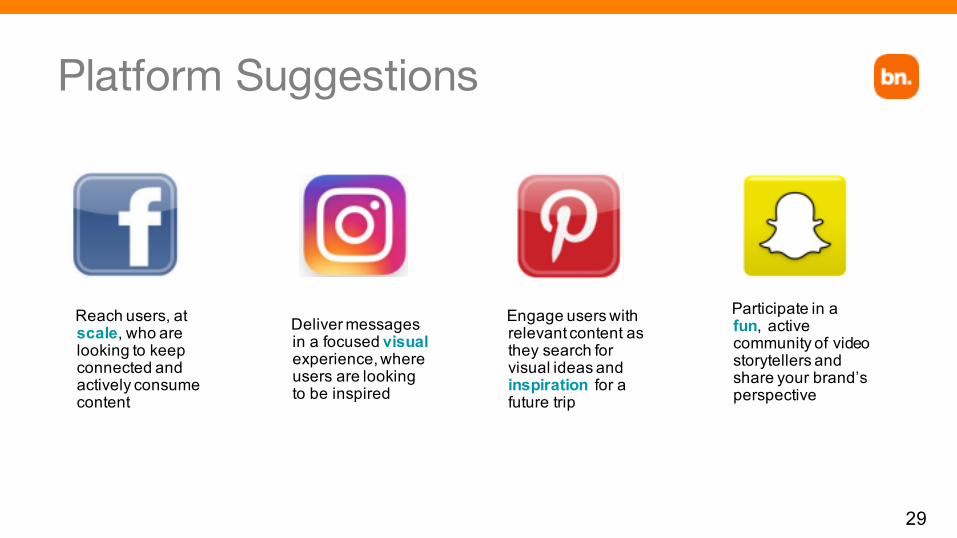
Platform Suggestions
29
Deliver messages in a focused visualexperience, where users are looking to be inspired
Engage users with relevant content as they search for visual ideas and inspiration for a future trip
Participate in a fun, active community of video storytellers and share your brand’s perspective
Reach users, at scale, who are looking to keep connected and actively consume content

Full Funnel + Multi-ChannelBrand Networks to implement a full funnel strategy to drive customers and prospects further down the sales funnel.
Utilize more advanced Facebook and Instagram features to maximize channel value.
- 99% of all Panama City Beach’s paid social advertising has been on Facebook (1% on Instagram)
Expand social channels to Pinterest and Snapchat to reach untapped audiences.
- 35% of Snapchat's daily users cannot be reached by Facebook on any given day
- 46% of Snapchat's daily users cannot be reached by Instagram on any given day
BRAND AWARENESS
CONSIDERATION
DIRECT RESPONSE
LOYALTY

Expanding Social Platform Footprint
● Engagement
● Time Spent on Site
● Link Clicks
Awareness & First to Market
Platforms Main KPIs● Reach
● Frequency
● New Leads● Surveys● Offers
Consideration & Drive to Website
Lead Generation
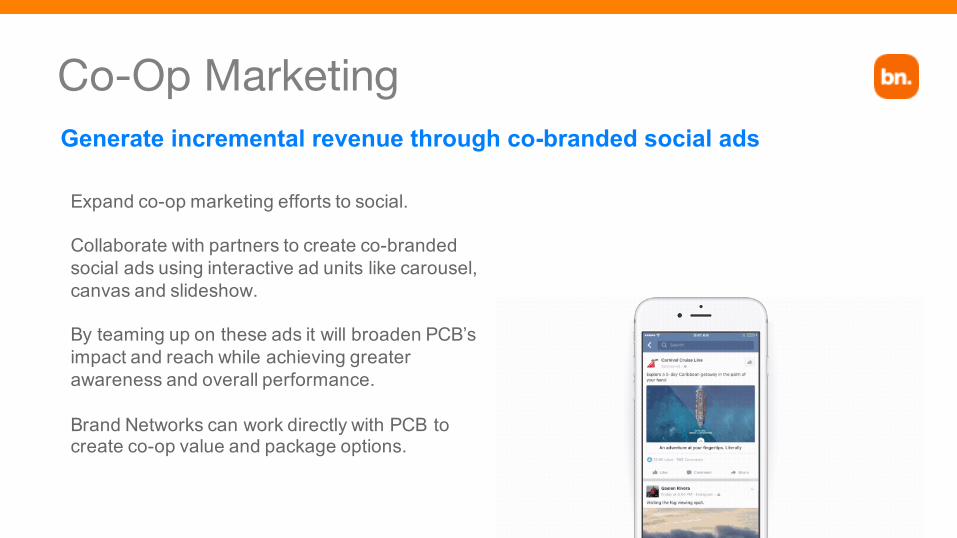
Co-Op MarketingGenerate incremental revenue through co-branded social ads
Expand co-op marketing efforts to social.
Collaborate with partners to create co-branded social ads using interactive ad units like carousel, canvas and slideshow.
By teaming up on these ads it will broaden PCB’s impact and reach while achieving greater awareness and overall performance.
Brand Networks can work directly with PCB to create co-op value and package options.

Snapchat Ads
Bring your brand to life with quick video storytelling
Deliver “commercial breaks” across the Snapchat app experience to drive toward brand awareness objectives.
Reach users with run-of-app placement, finding them where they are and where their attention is high.
Deploy vertical, full screen video ads with a choice to view, listen and engage.
Vertical video required in lengths up to 10 seconds
Video Between Snap Stories

Promoted PinsHome Feed
A personalized feed unique to each Pinner
Categories Topic-based locations
where Pinners can discover
Search Contextually relevant
places where people search
Related Pins Show up while Pinnerslook for similar items

Industry Updates & Social Trends

Key Trends Impacting Social for 2017
Mobile Video Messaging Purchasing Tech
TV ad budgets will move more steadily toward social due to rapid growth of social
networks as video platforms.
Time spent with digital video will trend
upward, while TV time will decline.
Live streaming will continue to gain
traction.Video audiences will
gravitate toward connected TVs and
smartphones.
Messaging apps will see double-digit user growth next
year, and break the 50% barrier among US mobile phone
users. The lines will blur
between messaging and social networks
as mobile activity shifts towards
messaging.
Buy buttons in social will continue to
increase in usage as consumers and
retailers get used to buying on platforms like Facebook and
Pinterest.Social platforms will continue to develop
solutions for bridging the gap between online and offline.
Ad blocking may begin to impact social as the
technology behind blockers get smarter.Identity targeting is the
new cookie.Viewability and time-in-view have shown a
positive impact on engagement, so the viewability issue isn’t
going away soon.
Authentically mobile experiences will
continue to emerge and evolve.
Mobile payments and commerce will increase across all age groups.Augmented reality, AI, messaging apps and chatbots will offer new
ways for brands to interact with
consumers on mobile.Mobile ad spend will soon be larger than
print and OOH combined.

The Impact of Mobile
Authentically mobile: New digital product decisions at technology companies driven by mobile-first
thinking.
Mobile usage contributing to emergence and growth of visual
platforms and multimedia content.
Livestream being pushed into the mainstream, made possible
by mobile.
Consumers more comfortable than ever making purchases on
mobile devices.
Nothing else can provide immediacy quite like mobile…yet.

Consumers Shifting to Mobile • One in five total mobile minutes are spent on Facebook and Instagram • 20% of mobile time is currently spent watching video, which is rapidly growing• 75% of all mobile data projected to be video by 2020• Facebook video posts and shares have increased 3x YoY, driven mainly by mobile
where users can take and share videos more easily• Users spend 1.7 seconds per piece of content on mobile vs. 2.5 seconds of content
on desktop
Key areas to improve the mobile experience:• 26% of consumers say it’s difficult to compare products on mobile, including
comparing different retailers (Overstock vs. Target)• 40% of consumers abandon a site that takes longer than 4 seconds to load• 60%+ lower conversion rate on mobile website than desktop
Source: Facebook Hand to Heart IQ Presentation, May 2016

Upgrades to Facebook VideoPeople are watching and sharing more video on Facebook than ever, and Facebook is rolling out new products and features that make videos in the News Feed more rich and engaging
An enhanced vertical video experience:• Tests have shown that vertical video ads drive an incremental
increase in brand lift• Vertical ratios allow greater ownership of the real estate, especially
on mobile
Bringing stories to life with more sound in News Feed:• Historically, videos in News Feed have played silently by default,
however after testing sound controls in News Feed and hearing positive feedback, Facebook is slowly bringing this experience to more people
• With this update, sound fades in and out as people scroll through videos in News Feed if the volume on their phone is turned on.

Social Platform Growth
Snap is projected to see the highest rate of growth by 2020 of any social platform, by over 40%
The average Snap user:✓ Watches 100 videos per day✓ Spends 25-30 min. per day
✓ Visits the app 20-30x per day
Source: eMarketer Snapchat Advertising: A Roadmap for US Brand Marketers and Digital Agency Executives. August 2016
Percent US Population to Use Platform

Brand Networks Platform Updates & New Features

Driving Efficiencies in Media Buying
Technology that monitors delivery, cost, and
performance, algorithmically optimizing ads in real time
Turns data into signals that trigger rules-based ad synchronization and
optimization
Optimize Now Open Signals Custom Dashboards
Award-winning, innovative technology differentiates Brand Networks from the pack
Quickly display data that is important to you and other
stakeholders

Optimize NowAutomated Ad Management Apply algorithmic ad optimization that monitors cost and performance in real time, and spends budgets in full.
Benefits:
● Can assign multiple campaign goals and weight the value of each
● 14% better delivery. Optimize Now campaigns have an 84% likelihood of spending in full versus a 70% likelihood for campaigns operated manually.

Open Signals
Leverage sports scores, TV commercials, weather and more,
automatically turning offline event data into real-time ads.
Create triggers to spread engaging content, automatically turning organic
posts into winning ads.
Open Signals lets users create simple rules based on real-world events, triggering social advertising to coincide with key moments in real time.
Promote sale items and excess inventory by automatically turning proprietary product
data into custom ads.
44

Open Signals List of Integrations
INVENTORY LEVELS SMS/MMS RSS FEED UGC CUSTOM
TELEVISIONWEATHERSOCIAL CHANNELS FLU & ALLERGY* SPORTS*
Create ads from organic content based on performance metrics.
Trigger ads, optimize budgets & schedules based on paid ad
statistics.
Trigger ads based on flu prevalence and allergy/pollen alerts. Updates on zip codes.
Data Source: IMS Health
Trigger ads based on temperature and many other current or forecasted weather
conditions like snow & humidity.
Data Source: Aeris Weather
Use current game scores, game stats, wins/losses and game
location/stadium info to create ads.
Data Source: SportsRadar
Sync your social ads with your existing TV campaigns, relevant
TV shows or against your competitors’ commercials.
Data Source: TVTY
Create ads based on your inventory levels and sales to
move product & drive customers in-store.
Scans for text messages sent to a specific number that then
triggers ad creative & creation. Ideal for live events.
Tap into RSS feeds to create ads based on the latest news stories.
Automatically create ads from selected, pre-approved user-
generated content. Data Source: Stackla
(must be a Stackla customer)
CSV data also can be integrated to our tool via FTP or Dropbox. ie: flight/train schedules, stock market, subscription renewals.
*Signal requires a setup fee of $2K. May vary based on usage

Brand Networks TechnologyOpen Signals & TVTY Integration
The integration with BN’s platform via Open Signals would give Visit Panama City Beac the ability to sync social campaigns to television broadcasts and advertising automatically.
With these capabilities, brands can launch campaigns across Facebook, Instagram, Pinterest, Twitter, LinkedIn, or Snapchat when triggered by specific moments on TV.
The technology behind TVTY allows brands to react to aired ads instantly, rather than an approximation. Their listening technology is in real-time (500ms), levering fingerprinting algorithms that are executed on servers that are directly plugged into set-top boxes. TVTY monitors every TV ad, in real-time, across over 400 TV channels in 25 countries.
Note: Additional set-up fees and monthly minimum media spends may be applicable.

Brand Networks TechnologyOpen Signals & TVTY Integration: Triggers

Data Integrations: Tracking and Targeting
Create tracked campaigns quickly by letting the Brand Networks Platform automatically add tags for Google DoubleClick
BETA: Simplify Tracking Setup
Measure and Optimize Campaigns
Use a single, trusted system to monitor all performance metrics. Connect your third party tracking data to the Brand Networks Platform
Target Specialized Audiences
Advertise to audiences from your chosen data provider to Brand Networks campaigns, making it easy to execute ROI-driven social initiatives

Appendix

BRAND AWARENESS STUDIES
Opt-inpollsonFacebook’shomepagemeasureimpactofdisplayadsAwareness,message association,brandfavorability,purchaseintent
• Brandeffectmetricsassociatedwithatargetaudience• Granularaudiencedemographicandpsychographicsegmentation• Comparisonofstudyresultstonormsdatabasebycategory• Resultsforuptofourstandardbrandattitudeandusagequestionsvia
single-questionsurveysandtwocustomsingleand/ordualquestionsurveys
BrandAwareness campaignofatleast$175k20MMimpressionsfordurationofcampaign*withholdoutgroupforcontrol
Measure theeffectiveness ofbrandawareness campaignsthroughbrandeffectmetricswithinatargetaudience
OBJECTIVE
REQUIREMENTS
APPROACH
BENEFITS

BrandAwareness&Consideration DirectResponseVideo
BestPractice
sKPIs
CastaWideNet:Testavarietyofrelevantaudiencestoseewhichgroupsengage.ThesegroupscanpotentiallybeusedlaterforDirectResponse.
Retarget,retarget,retarget:Retargetcurrentcustomerswithmessagesaboutnewproduct lines,newoffers,additionalmessagingtofurtherengagethemwiththebrand
Birds ofaFeatherFlockTogether:Prospectsimilaraudiences tothoselikelytoengage
Platform Evaluation:UseindustrybenchmarksandKPIstodecide ifaplatformisrightfordirectresponse
UtilizeandbalancebudgetacrossplatformsthatwillnotonlydriveROI,butbeefficientfrom aCPMperspective
Targeting:StarttotargetapplicablecustomaudiencesProspecton similaraudiencestothoselikelytoconvert
Findtherightaudienceattherighttimebyevaluatingtheendgoalofacquisitionandreachingtheconsumerwheresheisintheconsumerfunnel andinthesocialuniverse
Focus on Storytelling:Focus on the story the video will tell, but be mindful of length
Sound on vs. off:Design the video with sound-off in mind
3 Second Audition:Make the first frames of the video catch users attention
Callstoaction:BeexplicitwiththeCTAforusersinvideopostcopyandatendofvideoclickableframebasedon initiativegoal
AdRecallEngagementRate(andCPE)ClickThruRate(andCPC)CPMImpressions(Secondary)
EngagementRateViewsCostPerViewCompletion RateClickThroughRate(ifapplicable)
PurchaseCostPerPurchaseROASClick-Thru Rate(secondary)
MEDIA BEST PRACTICES

The Difference in Facebook Post TypesOrganic
✓ Content that has been posted to brand Facebook or Instagram page. Brand can engage directly with fans with or without amplification.
✓ Can be boosted from brand page to reach target audience(s) at scale. These ads will have the same reach and scale as dark posts.
✓ These posts live on the page forever.
Focus on engaging ads on your page: the more engaged your fans are with content, the higher organic reach all
page posts will achieve
Dark
✓ Ads created specifically for Facebook, which live in the Ad Manager section of the platform.
✓ Dark posts are used solely for advertising campaigns: they allow multiple creatives to launch and run at the same time.
✓ Dark posts never appear on brand Facebook page.
Utilize dark posts for acquisition campaigns, where multiple iterations of ads can run, optimizations implemented and
learnings gleaned
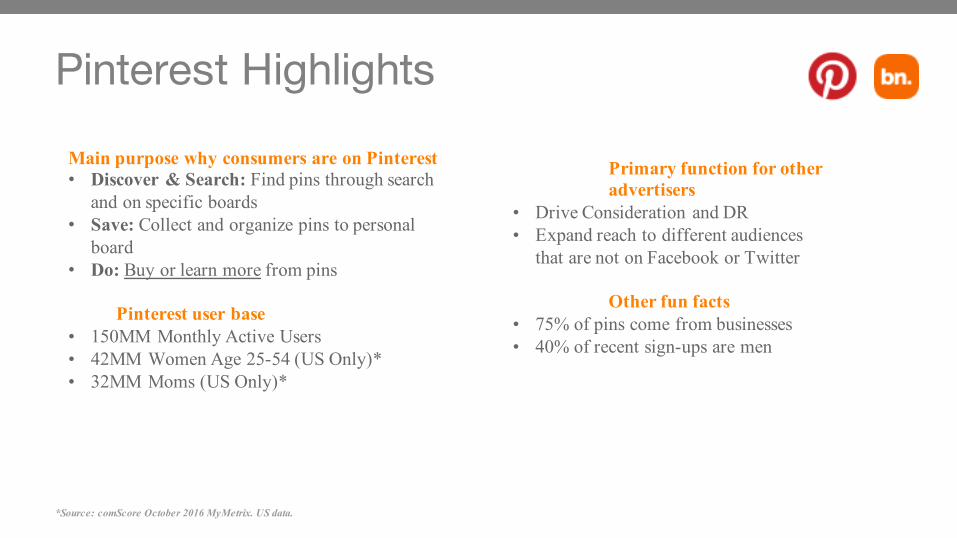
Pinterest Highlights
Main purpose why consumers are on Pinterest• Discover & Search: Find pins through search
and on specific boards• Save: Collect and organize pins to personal
board• Do: Buy or learn more from pins
Pinterest user base• 150MM Monthly Active Users• 42MM Women Age 25-54 (US Only)*• 32MM Moms (US Only)*
*Source: comScore October 2016 MyMetrix. US data.
Primary function for other advertisers
• Drive Consideration and DR• Expand reach to different audiences
that are not on Facebook or Twitter
Other fun facts• 75% of pins come from businesses• 40% of recent sign-ups are men
Video Best Practices Capture attention and feature your brand in the first 3 seconds
• Value is created very early in a feed environment, so to maximize the value of paid media, Facebook recommends building video ads that are fifteen seconds or less
Build for sound on, plan for sound off• An effective message can still be conveyed in feed videos
without sound and a number of users will not experience videos with sound if their volume is set to off. Using captions is a great way to drive longer view times and ensure your full message gets across even when the sound is off.
If possible, plan for 4:5 vertical content• Ensure your brand campaigns have maximum impact by
shooting video for vertical and mobile from the start, instead of modifying existing horizontal creative. If you're considering vertical for your brand campaign, leverage the 4:5 ratio as this can run across both FB and IG.
Defining Good Social Creative
Well Branded✓ Visually reflect brand identity and what your brand stands for
Concept Driven✓ Say what you want consumer to think and align creative with business objectives
Well Crafted✓ Be deliberate and thoughtful about how your brand presents itself and center creative
around what you’re trying to achieve

Facebook Carousel Ad Best Practices Part 1

Facebook Carousel Ad Best Practices Part 2

Facebook Carousel Ad Best Practices Part 3

Anatomy of Facebook Link Post
Copy line highlights the key points and entices the audience. Keep it short, clear, and catchy.
Image highlights the key messaging and attracts click throughs. What’s the story your image(s) is trying to tell?
Headline calls out the opportunity for the user, in a concise form.
The link description briefly names the benefits of the offer.
Social media marketing offers large scale via an engaged and ever-growing user base
Mobile devices are continuously changing the way people and brands are communicating with one another, usage driven mainly by social
Social media platforms allow brands to connect and converse with customers on a one to one level, where two-way communication is encouraged
Social advertising can be hyper-targeted to the same user across multiple devices and platforms, making storytelling and full-funnel messaging a reality
Social ads are shown in a native and viewable environment: the feed
Why Social?


Digital Ad Spending is on the Rise
Digital ad spend in the US Travel industry is predicted to reach $6.32
billion in 2017 and $8.28 billion by 2020