PALESTINE RUSSIA TRADE
73
1 ENHANCING PALESTINE - RUSSIA TRADE RELATIONS Assessing Palestine – Russia trade relations using Sussex Framework DECEMBER 2014 Prepared by PalTrade – Palestine Trade Center This assessment was made possible through the Canadian Department of Foreign Affairs, Trade and Development (DFATD). The contents of the document are the sole responsibility of PalTrade and do not necessarily reflect the view of DFATD. © PalTrade: Palestine, 2014
Transcript of PALESTINE RUSSIA TRADE

1
ENHANCING
PALESTINE - RUSSIA TRADE
RELATIONS
Assessing Palestine – Russia trade relations using
Sussex Framework
DECEMBER 2014
Prepared by
PalTrade – Palestine Trade Center
This assessment was made possible through the Canadian
Department of Foreign Affairs, Trade and Development (DFATD).
The contents of the document are the sole responsibility of
PalTrade and do not necessarily reflect the view of DFATD.
© PalTrade: Palestine, 2014

2
Executive summary
The present assessment aims at providing an overview of Palestine’s trade with Russia between
1996 and 2013, evaluating the impact of the Russia-Palestine Agreement on Commercial and
Economic Cooperation (the “1998 Agreement”), which was signed in 1998 and provides for the
application of the most favored nation (MFN) status to each other and other fields of economic
cooperation. The assessment is based on key features of Sussex Framework, a methodology
developed by researchers at the University of Sussex.
The first part of our assessment is therefore dedicated to providing an overview of
Palestine’s trade with Russia. As we shall see, trade relations between the two countries have not
improved by much ever since signing the 1998 Agreement. Palestinian exports have started to
increase only in 2011, reaching more than a half million USD in 2012, before dropping to 150
thousand USD in 2013. 80% of Palestine’s exports after 2007 were plants & parts thereof (incl.
fresh herbs) and spices.
Imports, on the other hand, were relatively high, but unstable throughout the years. Recently,
imports have decreased from 16.2 million USD in 2008 to 6.2 million USD in 2013. Major import
products were aluminium products, iron or non-alloy steel in ingots, which together account for
88% of Palestine’s imports from Russia between 2007 and 2013.
The second part of the assessment addresses shallow integration, i.e. the potential impact of
tariff measures taken under the 1998 Agreement. For this purpose, the present assessment compiles
tariff data for Russia and Israel, illustrates Russia’s applied tariff peaks vis-à-vis Palestine’s
exports to the world, Palestine’s revealed comparative advantage (RCA) with the world and
relative to Russia and Israel, and the potential demand in the Russian market. As we shall see,
there is high potential for Palestine to create trade through tariff measures, including for dairy
products, processed meat, processed food, tobacco, sacks & bags, stone & marble, footwear etc.
Because Russia has recently announced to include Palestine in the list of beneficiaries under the
Generalized System of Preferences (GSP) of the Customs Union between Russia, Belarus and
Kazakhstan, the assessment takes into consideration the potential impact of tariff measures taken
under the GSP. In doing so, we find that the majority of products with identified export
potential are not covered by tariff measures under the GSP. At the same time, as we shall see
in Table 1 below, MFN duties applied on imports from Palestine are very high, ranging between
17% and 22%.

3
Table 1: Palestinian products with export potential and their coverage under the GSP
Product Product Name Product coverage under
GSP
MFN duties applied by
Russia
040221 Milk in powder/granules/other solid form, unsweete... Yes 18.30%
040310 Yogurt Yes 15.61%
160100 Sausages, similar products of meat, meat offal & blood Yes 19.53%
170490 Sugar confectionery not chewing gum, no cocoa content No 18.00%
240220 Cigarettes containing tobacco No 23.30%
392321 Sacks & bags (incl. cones), of polymers of ethylen... Yes 17.30%
392510 Reservoirs, tanks, vats & similar containters, of ... No 17.30%
441820 Doors & their frames & thresholds, of wood, incl. ... No 18.40%
481810 Toilet paper, in rolls of a width not >36cm/cut to... No 17.50%
640199 Waterproof footwear(Wellington) no toe cap, nes No 21.64%
680221 Cut or sawn slabs of marble, travertine or alabaster Yes 13.30%
680229 Cut or sawn slabs of stone nes Yes 14.00%
690810 Glazed ceramic mosaic tiles, cubes & similar <7cm wide No 13.00%
691110 Tableware & kitchenware, of porcelain/china No 18.40%
831110 Coated electrodes of base metal, for electric arc-... No 17.30%
940429 Mattresses, stuffed, spring interior, etc No 19.00%
In a nutshell, there is considerable potential for shallow integration induced trade effects for
Palestine, if tariff measures are taken in the above mentioned sectors. Therefore, tariff measures
under the GSP may enhance trade in sectors such as stone & marble, sacks & bags, sausages &
other processed meat and certain dairy products. However, for the majority of products with export
potential in Russia, Palestinian exporters will continue facing significant tariff barriers.
For this reason, the Russian-Palestinian High Level Commission, whose establishment was
confirmed by both Parties but is yet pending, must place emphasis on covering these products
under a bilateral Russian-Palestinian FTA, in addition to considering the services sector.
Furthermore, in order to create trade, tariff measures must go along with behind-the-border
measures, i.e. “deep integration” measures. Therefore, the work of the Russian-Palestinian High
Level Commission must take into account the significance of deep integration measures, including
customs cooperation and rules of origin, trade remedies (safeguards, subsidies and anti-dumping
measures), technical regulations, standards and conformity assessment procedures, sanitary and
phytosanitary measures and technical and technological cooperation. It is strongly recommended
to establish a framework for cooperation in the form of a bilateral FTA, in order to ensure the
proper implementation of such measures.

4
Table of Contents
Executive summary ................................................................................................................ 2
List of Abbreviations .............................................................................................................. 6
Background ............................................................................................................................. 7
A snapshot of Palestinian economic performance.................................................................. 9
Palestine-Russia trade relations ............................................................................................ 11
Trade Shares ...................................................................................................................... 13
Trade Structure .................................................................................................................. 20
Shallow integration effects ................................................................................................... 23
Deep integration ................................................................................................................... 30
Summary and Conclusions ................................................................................................... 32
Appendices ........................................................................................................................... 34

5
List of Figures
Figure 1: Palestinian GDP per capita at constant prices .................................................................... 9
Figure 2: Sectorial distribution of GDP at constant prices .............................................................. 10
Figure 3: Breakdown of services contribution to GDP at constant prices 1994-2012 ..................... 10
Figure 4: Palestinian total trade with the world 1996-2013 ............................................................. 11
Figure 5: Palestinian total trade with Russia 1996-2013 ................................................................. 12
Figure 6: Top trade partners for Russia’s imports 1996-2013 (details in Annex IV) ...................... 15
Figure 7: Top trade partners for Russia’s exports 1996-2013 (details in Annex IV) ...................... 16
Figure 8: Top trade partners for Palestine’s imports 1996-2013 (details in Annex V) ................... 19
Figure 9: Top trade partners for Palestine’s exports 1996-2013 (details in Annex V) .................... 19
Figure 10: Palestinian exports to Russia 1996-2006 (Annex VI) .................................................... 20
Figure 11: Palestinian exports to Russia 2007-2013 (Annex VI) .................................................... 21
Figure 12: Top 5 Palestinian imports from Russia 1996-2006 (Annex VII) ................................... 21
Figure 13: Top 5 Palestinian imports from Russia 2007-2013 (Annex VII) ................................... 22
Figure 14: Evolution of tariffs in Israel and Russia over time (Simple average AHS in %) ........... 23
List of Tables
Table 1: Palestinian products with export potential and their coverage under the GSP .................... 3
Table 2: Palestinian total trade with Russia 1996-2013................................................................... 12
Table 3: Geographical distribution of Russia’s imports in 2013 ..................................................... 13
Table 4: Geographical distribution of Russia’s exports in 2013...................................................... 14
Table 5: Geographical distribution of Palestine’s imports in 2013 ................................................. 16
Table 6: Geographical distribution of Palestine’s exports in 2013 .................................................. 17
Table 7: Comparative tariff profiles of Israel and Russia on world imports ................................... 24
Table 8: Israel’s applied tariffs on imports from Russia (total trade) .............................................. 25
Table 9: Palestinian top world exports between 2007-2013 and Russia’s applied tariffs ............... 26
Table 10: Russia’s applied tariff peaks for Palestine’s exports to the world (2013) ....................... 27
Table 11: RCAs for Palestine’s world exports (2013) ..................................................................... 28
Table 12: Products with export potential and coverage under the GSP .......................................... 29
Table 13: Palestinian products with export potential and their coverage under the GSP ................ 32
List of Appendices
Annex I: The Russia-Palestine Agreement on Commercial and Economic Cooperation ............... 34
Annex II: List of preferential goods covered under GSP of the Customs Union between Russia,
Belarus and Kazakhstan ................................................................................................................... 38
Annex III: The Sussex Framework .................................................................................................. 40
Annex IV: Russia’s top trade partners 1996-2013 ........................................................................... 42
Annex V: Palestine’s top trade partners 1996-2013 ........................................................................ 58
Annex VI: Palestinian exports to Russia (by product and year) ...................................................... 64
Annex VII: Palestinian imports from Russia (by product and year) ............................................... 65

6
List of Abbreviations
1998 Agreement: The Russia-Palestine Agreement on Commercial and Economic Cooperation
AHS Tariff: Effectively Applied Tariff
AVE Tariff: Ad Valorem Equivalent Tariff
EFTA: European Free Trade Association
EU: European Union
FKI: Finger-Kreinin-Index
FTA: Free Trade Agreement
GAFTA: Greater Arab Free Trade Area
GLI: Grubel-Lloyd-Index
GSP: Generalized System of Preferences (under the Customs Union between Russia, Belarus,
Kazakhstan)
HS: Harmonized System
IIT: Intra-Industry Index
MERCOSUR: Common Market of the South
MFN: Most Favored Nation (tariff)
PCBS: Palestinian Central Bureau of Statistics
RCA: Revealed Comparative Advantage
SF: Sussex Framework
SITC: Standard International Trade Classification

7
Background
Since the foundation of the Palestinian National Authority (PNA), the Israeli-Palestinian Interim
Agreement (hereby referred to as “Paris Protocol”) has been the only basis to regulate economic
relations between Israel and Palestine. Although it was designated for an interim period only
(1994-1999), the Paris Protocol is still in force till date. The Oslo Agreement, of which Paris
Protocol forms an integral part, gives Palestine the right to negotiate and conclude agreements as
long as the same import policy is applied in Israel and the Palestine. Therefore, Palestine signed
several trade agreements in an attempt to improve and flourish the Palestinian economy, the
ultimate objective of which was to reduce dependence on a single market and create an enabling
business environment.
The Paris Protocol created a quasi-customs union between Israel and Palestine formulated on the
free movement of goods between the two markets without any type of tariff and non-tariff barriers;
and the adoption of a joint/unified tariff list while giving the Palestine the right to determine duties
and standards requirements for a list of basic or strategic commodities known as lists A1, A2, and
B. List A1 refers to locally produced goods originating in Arab countries and Jordan and Egypt
particularly, whereas List A2 applies to goods from Arab, Islamic and other countries. Goods in
List B are basic food items and other goods for the Palestinian economic development program.
However, as for the goods specified in these lists, tariffs are till date the same as those applied by
Israel. For imports from Israel, Palestinian applied tariffs are zero.
With respect to goods not specified in these lists, Israeli customs duties serve as the minimum
basis for Palestinian applied tariffs. Based thereupon, in an attempt to protect local industries, the
Palestinian Customs Authority collects (additional) duties for imported items in the sectors shoes
and leather, textiles, furniture and aluminium. These duties are applied irrespective the country of
origin, except for countries that Palestine has concluded trade agreements/arrangements with.
Furthermore, the Paris Protocol gives Palestine the right to determine duties for imports of cars and
petroleum. Based thereupon, the Palestinian Customs Authority filed a request to reduce the
purchase tax on car imports to 50% (for cars < 2000 cc) and 75% (for cars > 2000 cc), which was
approved by Israeli authorities and has been in place since mid-2013.
Strategically, Palestine prioritized signing agreements with countries that had Free Trade
Agreements (FTAs) with Israel. The underlying logic was to grant Palestinian exports preferential
treatment since imports from these countries entered the Palestinian market duty free based on
their trade agreements with Israel and the “quasi” customs union between Palestine and Israel
under the Paris Protocol. The agreements signed by Palestine include the Interim Association
Agreements (IAA) with the European Union (EU) and European Free Trade Association (EFTA),
Greater Arab Free Trade Area (GAFTA), a Free Trade Agreement with Turkey, a Framework
Agreement with Canada, a Trade Arrangement with the USA and an FTA with the Common
Market of the South (MERCOSUR), last of which to date has not entered into force yet.

8
Further, especially with respect to products on lists A1, A2, and B, Palestine signed preferential
trade agreements with both Jordan and Egypt to strengthen and flourish the Palestinian economy
by exercising rights granted under the Paris Protocol. Israeli Customs, while still in control of
external borders for Palestine, would clear goods imported by Palestinian traders on behalf of
Palestinian Customs and then transfer this money to Palestine; 3% of the total transfers is taken by
Israel as administrative expenses.
In 1998, Palestine signed the Agreement on Commercial and Economic Cooperation (the “1998
Agreement”) with Russia1, providing for the application of the most favored nation status to each
other, in addition to economic cooperation through
- information exchange on all economic and trade matters;
- assistance in order to organize and hold conferences, advertisement actions, exhibitions,
fairs and others;
- consultancy and other services;
- the encouragement of cooperation between chambers of commerce and other business
associations in the two countries;
- mutual assistance in order to encourage the participation of SMEs in trade activities;
- the establishment of principles regarding a favorable investment environment and joint
investment activities.
After two Russian-Palestinian working group meetings held in June and December 2014, the
Parties agreed to establish a High Level Commission dedicated to enhancing trade and investment
cooperation. An initial agreement was signed in this regard but has not entered into force yet.
During these meetings, Russia further expressed its willingness to include Palestine as a least
developed country under the Generalized System of Preferences (GSP), leading to duty-free
access of certain products to the Customs Union between Belarus, Kazakhstan and Russia2. This
step requires the implementation of compatibility and formal procedures among and within the
Members of the Customs Union.
Lastly, Russia announced to increasingly support Palestine’s export of agricultural and food
produce to Russia, by ways of supporting the establishment of a canning factory in Palestine.
With this background, the objective of this study is to evaluate the potential impact of Palestine
being included in the GSP on the one hand, and the potential benefit of a bilateral Russian-
Palestinian FTA on the other hand. The methodology used for this study is developed by
researchers at the University of Sussex, known as the Sussex Framework (SF)3.
We divide the report into different sections which revolve around key features of the SF. First, we
identify key aspects of the Palestinian economy. Secondly, we look at the evolution of trade
between Palestine and Russia. Thirdly, in considering Palestinian products with export potential,
we use selected SF indicators to identify the likelihood for shallow integration induced trade
1 The 1998 Agreement is attached as Annex I.
2 List of products exempted from tariffs under GSP is attached as Annex II.
3 Details about Sussex Framework are attached as Annex III.

9
effects under GSP or a future Russia-Palestine FTA. Lastly, we turn to the issue of deep
integration and consider qualitative and quantitative evidence which can shed light on the potential
welfare gains which could arise from deeper integration under the 1998 and 2014 signed
Agreements.
A snapshot of Palestinian economic performance
Palestine had a GDP of 7.5 billion USD in 2013 at constant prices (base year 2004) and the
economy grew by 1.9% over 2012-2013. As illustrated in Figure 1, Palestinian GDP per capita has
seen an average annual growth rate of 1.5% throughout the years 1994-2013.
Figure 1: Palestinian GDP per capita at constant prices
Source: PCBS (base year 2004; data for 2013 preliminary and based on predictions)
Furthermore, Figure 2 shows that the Palestinian economy is predominantly services-based; the
sector has accounted for more than 70% of GDP and total employment over time. Within services,
other services constitute the largest share (20% of GDP in 2013), followed by construction
(14.1%) and wholesale and retail trade (14%) (Figure 3). In view of this sectorial distribution, any
agreement involving the Palestine should cover services. Having said this, the majority of
Palestinian trade is in merchandise goods. In 2013, Palestinian net imports of services were 2.6%
of total net imports of goods and services, and net exports of services contributed 20.6% to
Palestinian exports, compared to 17% in 2012. Palestinian total exports have contributed roughly
12.8% to the Palestinian GDP of 2013.4
4 PCBS 2014, “Palestine in Figures 2013”, URL: http://www.pcbs.gov.ps/Portals/_PCBS/Downloads/book2040.pdf (last access: 15.09.2014)

10
Figure 2: Sectorial distribution of GDP at constant prices
Note: Others include ‘Households with employed persons’, ‘Public owned employed persons’, FISIM, Customs
duties, Net VAT on Imports (Source: PCBS)
Figure 3: Breakdown of services contribution to GDP at constant prices 1994-2012
Note: Other services include accommodation and food service activities (hotel & restaurants); real estate activities;
professional, scientific and technical activities; administrative and support service activities; education, health and
social work; and arts, entertainment and recreation. (Source: PCBS)

11
Figure 4 below illustrates the value of Palestinian exports/imports between 1996 and 2013.
Throughout the years, Israel has been Palestine’s major trade partner. In 2013, it has accounted for
71.6% of Palestine’s imports and more than 87% of Palestinian exports. Other important trade
partners are the EU, GAFTA, Turkey, China, USA, South Korea, MERCOSUR, India, Thailand,
Japan, EFTA, Canada and Indonesia. Palestine’s trade relations with the world and Russia will be
highlighted in more detail in the following chapters.
Figure 4: Palestinian total trade with the world 1996-2013
Palestine-Russia trade relations
The Russian-Palestinian Agreement on Commercial and Economic Cooperation (the “1998
Agreement”) was signed in 1998, providing for the application of the most favored nation status to
each other, in addition to issues related to deep integration, i.e. economic cooperation through
information exchange and mutual assistance in trade related matters, the encouragement of
investment etc. The Agreement however, did not provide with the establishment of a Russian-
Palestinian Joint Committee, to lay out and observe the application of cooperation mechanisms,
identify obstacles to trade and opportunities and discuss them on a regular basis. It is expected that
the Russian-Palestinian High Level Commission is going to perform these tasks upon entry into
force of the respective Agreement, which was signed in December 2014.

12
Furthermore, the planned treatment of Palestine as a least developed country under GSP and
subsequent zero tariff treatment for a specific list of products, may considerably boost Palestine’s
exports to the Customs Union Belarus, Kazakhstan and Russia.
Looking at Palestinian trade figures with Russia, it seems that an upgrade of trade ties is overdue
since many years. As illustrated in Figure 5 and Table 2, Palestine’s exported value to Russia
between 1996 and 2010 was, in total, as low as 142 thousand USD. Only after 2010, exports have
increased, reaching 290 thousand USD in 2011, 576 thousand USD in 2012, before dropping to
150 thousand USD in 2013.
On the other hand, we find that Palestine’s imports from Russia have been relatively high. The
average annual value of imports between 1996 and 2013 was 7.5 million USD. However, we find
that imports have been very unstable, considerably increasing and dropping over time. In recent
years, imports have decreased from 16.2 million USD in 2008 to 6.2 million USD in 2013.
Figure 5: Palestinian total trade with Russia 1996-2013
Table 2: Palestinian total trade with Russia 1996-2013
Year Imports value (‘000s USD) Exports value (‘000s USD) Imports share Exports share
1996 284.83 0.92 0.01% 0.00%
1997 1,036.40 71.08 0.05% 0.02%
1998 4,700.89 0.00 0.20% 0.00%

13
1999 12,302.69 0.00 0.41% 0.00%
2000 17,534.55 0.00 0.74% 0.00%
2001 11,846.92 0.05 0.58% 0.00%
2002 3,611.81 0.00 0.24% 0.00%
2003 6,715.92 1.97 0.37% 0.00%
2004 2,592.91 0.11 0.11% 0.00%
2005 7,071.04 0.00 0.27% 0.00%
2006 11,868.19 25.50 0.43% 0.01%
2007 7,988.44 10.59 0.25% 0.00%
2008 16,187.68 1.25 0.45% 0.00%
2009 2,512.46 7.20 0.07% 0.00%
2010 10,262.54 23.57 0.26% 0.00%
2011 8,548.02 291.52 0.20% 0.04%
2012 3,963.46 576.22 0.08% 0.07%
2013 6,185.30 150.30 0.12% 0.02%
Source: PCBS
Trade Shares
Tables 3 and 4 below illustrate Russia’s trade with its most important trade partners in 2013. Table
3 shows that the EU has been Russia’s most important partner for imports, accounting for more
than 42% of its imports, followed by China, the USA, Ukraine, Belarus, Japan, South Korea
(“Rep. of Korea”), Turkey, MERCOSUR, Kazakhstan, EFTA, India, Vietnam, Thailand, GAFTA
and Taiwan-China (“Other Asia nes”).
Similarly, Russia’s most important partner for exports was the EU, followed by Areas not
elsewhere specified, China, Japan, Kazakhstan, Belarus, Ukraine, Turkey, South Korea, USA,
GAFTA, EFTA, India, MERCOSUR and Taiwan-China. We find similar trade shares when we
look at Russia’s trade during the period 1996-2013 (Figures 6 and 7, Annex IV).
As mentioned above, Palestinian exports to Russia were very low at 150 thousand USD, which
accounts for a mere 0.00005% of Russia’s total imported value in 2013. On the other hand, Russia
exported around 6.2 million USD to Palestine, contributing only 0.001% to Russia’s total exported
value in 2013.
Table 3: Geographical distribution of Russia’s imports in 2013
Partner Imports Value ('000s USD) Imports share
World 314,945,094.99 100.00%
EU 134,138,588.40 42.59%
China 53,173,086.21 16.88%
Germany 37,904,568.53 12.04%
USA 16,717,711.02 5.31%
Ukraine 15,790,890.01 5.01%
Italy 14,553,947.80 4.62%
Belarus 13,959,261.78 4.43%
Japan 13,560,499.94 4.31%
France 13,021,467.98 4.13%

14
Rep. of Korea 10,305,436.13 3.27%
Poland 8,321,276.52 2.64%
United Kingdom 8,106,431.07 2.57%
Turkey 7,272,773.49 2.31%
MERCOSUR 6,040,408.38 1.92%
Netherlands 5,837,158.21 1.85%
Kazakhstan 5,664,930.62 1.80%
Finland 5,395,510.73 1.71%
Czech Rep. 5,317,724.13 1.69%
EFTA 4,957,737.89 1.57%
Spain 4,914,629.60 1.56%
Belgium 4,034,002.20 1.28%
Sweden 3,916,608.83 1.24%
Austria 3,845,967.18 1.22%
Slovakia 3,533,690.44 1.12%
Brazil 3,492,845.08 1.11%
India 3,091,180.11 0.98%
Switzerland 3,009,409.04 0.96%
Hungary 3,007,131.25 0.95%
Viet Nam 2,596,994.75 0.82%
Denmark 2,178,374.66 0.69%
Thailand 2,084,099.80 0.66%
Romania 2,046,592.18 0.65%
GAFTA 1,938,980.84 0.62%
Other Asia, nes 1,915,059.73 0.61%
Palestine* 150.30 0.00005%
Source: Comtrade via TradeSift (HS 1996 Total Trade)
*Note: Data for trade between Russia and Palestine originates from PCBS (with Palestine as reporter country)
Table 4: Geographical distribution of Russia’s exports in 2013
Partner Exports Value (‘000s USD) Exports share
World 527,265,918.85 100.00%
EU 241,237,216.00 45.75%
Netherlands 69,259,511.32 13.14%
Areas, nes 67,282,795.22 12.76%
China 35,625,419.98 6.76%
Italy 29,156,005.75 5.53%
Germany 22,962,139.22 4.35%
Japan 19,667,507.62 3.73%
Poland 19,408,183.62 3.68%
Kazakhstan 17,218,175.41 3.27%
Belarus 16,870,227.72 3.20%
Ukraine 15,215,254.51 2.89%
Turkey 15,122,092.26 2.87%
Rep. of Korea 14,867,070.24 2.82%
United Kingdom 12,354,671.52 2.34%
Finland 12,014,042.11 2.28%
USA 11,177,056.15 2.12%

15
GAFTA 10,327,351.83 1.96%
Latvia 9,836,415.93 1.87%
EFTA 9,481,358.23 1.80%
Switzerland 8,656,011.79 1.64%
Belgium 7,726,441.25 1.47%
India 6,982,660.21 1.32%
Spain 6,027,059.44 1.14%
France 5,928,165.59 1.12%
Hungary 5,461,146.27 1.04%
Slovakia 5,166,048.79 0.98%
Greece 5,014,364.87 0.95%
MERCOSUR 4,932,561.88 0.94%
Lithuania 4,878,831.22 0.93%
Sweden 4,475,629.31 0.85%
Other Asia, nes 4,443,361.79 0.84%
Czech Rep. 4,320,995.75 0.82%
Malta 4,084,461.11 0.77%
Estonia 3,747,109.74 0.71%
Palestine* 6,185.30 0.001%
Source: Comtrade via TradeSift (HS 1996 Total Trade)
*Note: Data for trade between Russia and Palestine originates from PCBS (with Palestine as reporter country)
Figure 6: Top trade partners for Russia’s imports 1996-2013 (details in Annex IV)
Note: Most important partners for imports from EU: Germany, Italy, France, UK, Poland, Finland, Netherlands, Sweden, Belgium, Spain, Czech
Republic, Hungary, Austria, Slovakia, Denmark; from MERCOSUR: Brazil; from EFTA: Switzerland.

16
Figure 7: Top trade partners for Russia’s exports 1996-2013 (details in Annex IV)
Note: Most important partners for imports from EU: Netherlands, Italy, Germany, Poland, UK, Finland, France, Hungary, Slovakia, Latvia, Czech
Republic, Belgium, Lithuania, Spain, Sweden; from GAFTA: Egypt; from EFTA: Switzerland.
Turning now to Palestine’s geographical distribution of trade, Tables 6 and 7 show that Palestine’s
most important trade partner in 2013 was Israel, accounting for 71.6% of its imports and 87.2% of
its exports. Other significant partners in trade were the EU, GAFTA, Turkey, China, USA, South
Korea, MERCOSUR, India, Thailand, Ukraine, Japan and EFTA. This hasn’t changed by much if
we look at Palestinian trade shares since 1996 (Figures 8 and 9, Annex V). Looking at Palestinian
trade with Russia throughout time (Table 2) we find that Russia’s share of Palestinian imports and
exports has barely increased throughout time.
Table 5: Geographical distribution of Palestine’s imports in 2013
Partner Imports Value ('000s USD) Imports Share
World 5,163,897.46 100.00%
Israel 3,694,820.63 71.55%
EU28 455,472.53 8.82%
Turkey 289,169.86 5.60%
China 236,601.08 4.58%
GAFTA 214,774.86 4.16%
Germany 124,152.70 2.40%
Jordan 91,504.33 1.77%
Italy 61,155.12 1.18%

17
Spain 60,607.62 1.17%
France 51,629.67 1.00%
Saudi Arabia 43,997.36 0.85%
Egypt 43,501.32 0.84%
USA 42,397.06 0.82%
Rep. of Korea 38,352.45 0.74%
MERCOSUR 26,395.85 0.51%
Sweden 26,068.82 0.50%
India 23,506.68 0.46%
Thailand 23,353.78 0.45%
United Kingdom 22,921.07 0.44%
Netherlands 22,825.21 0.44%
Ukraine 22,177.82 0.43%
Brazil 20,035.29 0.39%
Poland 17,492.71 0.34%
Belgium 15,989.37 0.31%
United Arab Emirates 15,834.77 0.31%
Japan 12,485.66 0.24%
Ireland 12,129.26 0.23%
Qatar 11,426.78 0.22%
EFTA 10,139.09 0.20%
Switzerland 10,016.59 0.19%
Czech Rep. 8,995.68 0.17%
Malaysia 6,546.10 0.13%
Russian Federation 6,185.30 0.12%
Bahrain 5,977.86 0.12%
Viet Nam 5,883.31 0.11%
Hungary 5,763.31 0.11%
Denmark 5,697.10 0.11%
Guatemala 5,255.56 0.10%
Australia 4,834.92 0.09%
Source: PCBS (total trade aggregated from HS 1996 6-digit level)
Table 6: Geographical distribution of Palestine’s exports in 2013
Partner Exports Value ('000s USD) Exports Share
World 900,617.86 100.00%
Israel 785,110.86 87.17%
GAFTA 86,549.39 9.61%
Jordan 55,389.85 6.15%
EU28 13,155.64 1.46%
USA 10,294.21 1.14%
Saudi Arabia 8,421.49 0.94%
United Arab Emirates 7,366.87 0.82%
Qatar 4,812.23 0.53%
Kuwait 3,923.57 0.44%
Netherlands 2,991.95 0.33%
Turkey 2,987.65 0.33%
United Kingdom 2,928.70 0.33%
Germany 1,750.10 0.19%

18
Algeria 1,723.77 0.19%
Italy 1,154.70 0.13%
Poland 1,102.39 0.12%
Slovakia 1,053.32 0.12%
Canada 908.04 0.10%
Yemen 854.27 0.09%
Belgium 718.06 0.08%
Libya 598.10 0.07%
France 549.94 0.06%
Japan 476.10 0.05%
EFTA 382.82 0.04%
Dem. People's Rep. of Korea 325.32 0.04%
Switzerland 311.99 0.03%
Indonesia 305.20 0.03%
Rep. of Korea 299.48 0.03%
Iraq 282.95 0.03%
Oman 230.07 0.03%
Egypt 204.13 0.02%
Cyprus 195.96 0.02%
Sweden 181.43 0.02%
Malta 158.33 0.02%
Austria 154.01 0.02%
Morocco 151.04 0.02%
Russian Federation 150.30 0.02%
New Zealand 149.30 0.02%
Sudan 139.60 0.02%
Source: PCBS (total trade aggregated from HS 1996 6-digit level)

19
Figure 8: Top trade partners for Palestine’s imports 1996-2013 (details in Annex V)
Note: Most important partners for imports from the EU: Italy, Germany, Spain, France, United Kingdom, The Netherlands,
Sweden; from GAFTA: Jordan, Egypt; from EFTA: Switzerland, from MERCOSUR: Brazil
Figure 9: Top trade partners for Palestine’s exports 1996-2013 (details in Annex V)
Note: Most important partners for exports to the EU: The Netherlands, Italy, United Kingdom, France, Belgium, Germany, Poland,
Malta, Slovakia; to GAFTA: Jordan, Saudi Arabia, United Arab Emirates, Algeria, Kuwait, Qatar, Egypt, Yemen, Iraq, Oman; to
EFTA: Switzerland.

20
Trade Structure
As we shall see in the following section, trade with Russia was fairly concentrated throughout the
years, especially for exports. Looking first at Palestinian exports to Russia between 1996 and
20065, Figure 10 illustrates that Palestine exported mainly medicaments, grapes and food
preparations. None of the remaining products was exported at a value higher than 6 thousand USD.
Exports between 2007 and 2013 (Figure 11) are concentrated with plants & parts thereof (incl.
fresh herbs) and spices, which together account for more than 80% (or 860 thousand USD) of
Palestine’s exported value to Russia during that period.
Considering next Palestinian imports from Russia between 1996 and 2006 (Figure 12), we find that
ingots of iron and semi-finalized products of iron account for over 55% (44.1 million USD) of
Palestine’s imports, followed by bars & rods and glazed ceramic flags, which contributed 16% (13
million USD) and 13.56% (10.8 million USD) to Palestine’s imported value.
Between 2007 and 2013 (Figure 13), 60% (33.6 million USD) of Palestine’s imports are
concentrated with aluminium products, followed by iron or non-alloy steel in ingots, which
account for 28% (15.5 million USD) of Palestine’s imports.
Figure 10: Palestinian exports to Russia 1996-2006 (Annex VI)
5 Because trade data for the years 1999-2006 is only available at the SITC Rev.3 level, we consider the periods 1999-
2006 and 2007-2013 separately in our analysis.

21
Figure 11: Palestinian exports to Russia 2007-2013 (Annex VI)
Figure 12: Top 5 Palestinian imports from Russia 1996-2006 (Annex VII)

22
Figure 13: Top 5 Palestinian imports from Russia 2007-2013 (Annex VII)
23
Shallow integration effects
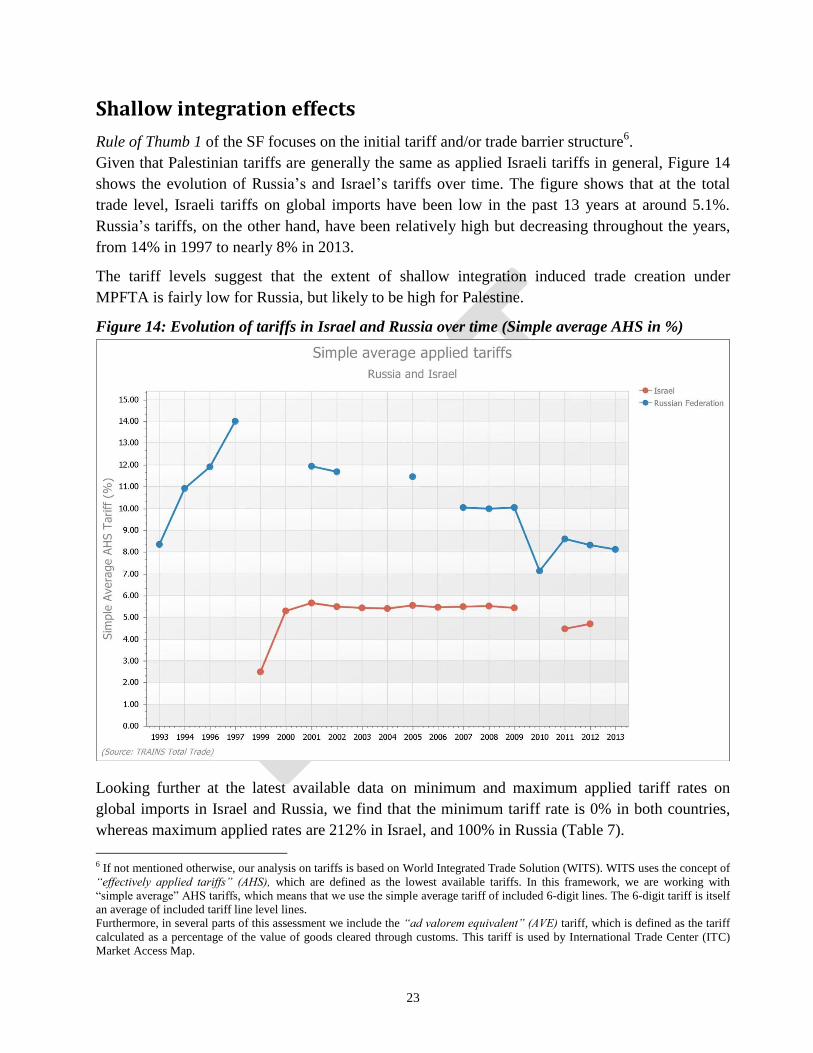
Rule of Thumb 1 of the SF focuses on the initial tariff and/or trade barrier structure6.
Given that Palestinian tariffs are generally the same as applied Israeli tariffs in general, Figure 14
shows the evolution of Russia’s and Israel’s tariffs over time. The figure shows that at the total
trade level, Israeli tariffs on global imports have been low in the past 13 years at around 5.1%.
Russia’s tariffs, on the other hand, have been relatively high but decreasing throughout the years,
from 14% in 1997 to nearly 8% in 2013.
The tariff levels suggest that the extent of shallow integration induced trade creation under
MPFTA is fairly low for Russia, but likely to be high for Palestine.
Figure 14: Evolution of tariffs in Israel and Russia over time (Simple average AHS in %)
Looking further at the latest available data on minimum and maximum applied tariff rates on
global imports in Israel and Russia, we find that the minimum tariff rate is 0% in both countries,
whereas maximum applied rates are 212% in Israel, and 100% in Russia (Table 7).
6 If not mentioned otherwise, our analysis on tariffs is based on World Integrated Trade Solution (WITS). WITS uses the concept of
“effectively applied tariffs” (AHS), which are defined as the lowest available tariffs. In this framework, we are working with
“simple average” AHS tariffs, which means that we use the simple average tariff of included 6-digit lines. The 6-digit tariff is itself
an average of included tariff line level lines.
Furthermore, in several parts of this assessment we include the “ad valorem equivalent” (AVE) tariff, which is defined as the tariff
calculated as a percentage of the value of goods cleared through customs. This tariff is used by International Trade Center (ITC)
Market Access Map.

24
As a share of total tariff lines in each case, we further look at domestic7 and international tariff
peaks8 applied by Israel and Russia. Looking first at Israel’s applied tariff peaks in 2012, we find
that both domestic and international tariff peaks are low (1.1%). For Russia, on the other hand,
domestic peaks are low (0.33%), while international peaks are very high (24.3%) in 2013.
These figures suggest that due to the high number of international tariff peaks in Russia, it
appears that there is considerable scope for Palestine to create trade in certain sectors.
Table 7: Comparative tariff profiles of Israel and Russia on world imports
Importer Year Simple Average
AHS Tariff
Imports Value
(‘000s USD)
Minimum
Rate
Maximum
Rate
Total
Lines
Dom.
Peaks
Intern.
Peaks
Israel
1999 2.50% 31,085,575.00 0.00% 250.00% 129,325 0.61% 0.83%
2000 5.30% 35,742,024.00 0.00% 250.00% 130,930 0.65% 0.94%
2001 5.65% 33,303,113.00 0.00% 250.00% 121,533 0.53% 0.63%
2002 5.50% 33,105,904.00 0.00% 250.00% 120,414 0.49% 0.58%
2003 5.43% 34,210,938.00 0.00% 250.00% 118,681 0.45% 0.51%
2004 5.40% 40,969,518.00 0.00% 230.00% 123,450 0.44% 0.47%
2005 5.55% 45,032,350.00 0.00% 230.00% 122,163 1.09% 1.14%
2006 5.47% 47,834,446.00 0.00% 230.00% 122,200 1.10% 1.15%
2007 5.49% 56,619,379.00 0.00% 230.00% 125,236 1.22% 1.27%
2008 5.51% 65,170,546.00 0.00% 230.00% 124,544 1.27% 1.33%
2009 5.43% 47,362,724.00 0.00% 230.00% 122,054 1.11% 1.17%
2011 4.47% 73,526,105.00 0.00% 212.00% 126,242 0.77% 0.77%
2012 4.70% 73,112,080.00 0.00% 212.00% 126,948 1.05% 1.09%
Russia
1993 8.34% n.a. 0.00% 150.00% 198,985 2.80% 3.27%
1994 10.93% n.a. 0.00% 100.00% 198,985 1.79% 26.75%
1996 11.92% n.a. 0.00% 100.00% 195,984 0.13% 26.14%
1997 13.99% 66,326,577.15 0.00% 100.00% 231,751 0.01% 34.75%
2001 11.93% 41,865,361.96 0.00% 100.00% 230,453 0.00% 19.73%
2002 11.67% 46,176,985.04 0.00% 40.00% 233,217 0.07% 18.59%
2005 11.46% 98,707,255.77 0.00% 80.00% 241,297 0.17% 17.39%
2007 10.03% 199,725,954.51 0.00% 100.00% 263,122 0.28% 35.00%
2008 10.00% 267,051,243.55 0.00% 100.00% 268,698 0.28% 35.00%
2009 10.03% 170,826,590.31 0.00% 100.00% 254,110 0.25% 35.24%
2010 7.13% 228,911,658.15 0.00% 100.00% 255,881 0.34% 21.03%
2011 8.61% 306,091,490.31 0.00% 100.00% 268,712 0.37% 24.84%
2012 8.31% 316,192,918.04 0.00% 100.00% 275,580 0.37% 8.94%
2013 8.12% 314,945,094.99 0.00% 100.00% 284,504 0.33% 24.26%
Source: WTO IDB via WITS (tariff data) and Comtrade via TradeSift (trade data).
7 Domestic tariff peaks are the number of tariff lines exceeding three times the overall simple average applied rate. 8 International peaks are the number of tariff lines exceeding the overall average applied rate by 15% or more.

25
Looking further at Israeli applied tariffs on imports from Russia throughout the years (Table 8), we
can confirm the story of Russia’s low likelihood to create trade through shallow integration:
Israel’s average AHS tariff applied on imports from Russia is with 3.9% even lower than for the
world. In addition, the maximum applied rate stands at 136%, and there are no domestic and
international tariff peaks.
Table 8: Israel’s applied tariffs on imports from Russia (total trade)
Year Simple Average
AHS Tariff
Imp. value
(‘000s USD)
Minimum
Rate
Maximum
Rate Total Lines
Domestic
Peaks
International
Peaks
2004 4.47% 688,156.00 0.00% 100.00% 711 0.00% 0.00%
2005 4.40% 1,055,730.00 0.00% 100.00% 692 0.00% 0.00%
2006 4.55% 1,141,588.00 0.00% 100.00% 739 0.00% 0.00%
2007 4.64% 1,398,901.00 0.00% 136.00% 1,045 0.00% 0.00%
2008 4.89% 1,046,890.00 0.00% 136.00% 1,227 0.00% 0.00%
2009 4.74% 488,787.00 0.00% 100.00% 1,175 0.00% 0.00%
2012 3.86% 819,527.00 0.00% 136.00% 1,173 0.00% 0.00%
Source: WTO IDB via WITS (tariff data), Comtrade via TradeSift (trade data)
Exploring now Russia’s tariff profile further at the 6-digit level, Table 9 illustrates Palestine’s
top 25 world exports between 2007 and 2013 and Russia’s applied MFN duties in 2014, revealing
that Russia applies tariffs on nearly all of Palestine’s top exports to the world between 2007 and
2013.
Particularly high tariffs (>20%) are in place for
- Cigarettes (23.3%),
- Waterproof footwear (21.6%),
Furthermore, applied MFN duties by Russia are relatively high (10%-20%) for
- Sausages (19.5%)
- Mattresses (19%)
- Sugar confectionary (18%)
- Sacks & bags (17.3%)
- Yogurt (15.6%)
- Seats with wooden frames (15%)
- Slabs of stone (14%) and marble (13.3%)
- Ceramic mosaic tiles (13%)
In these sectors, there is very high likelihood to create trade for Palestine through tariff
exemption/reduction under the GSP or a bilateral FTA between Russia and Palestine.

26
Table 9: Palestinian top world exports between 2007-2013 and Russia’s applied tariffs
Palestine's top exports 2007-2013
Product Product Name PSE>WLD
('000s USD) Exports share
RUS applied
MFN duties
680229 Cut or sawn slabs of stone nes 527,616.91 11.46% 14.00%
680221 Cut or sawn slabs of marble, travertine or alabaster 215,008.53 4.67% 13.30%
392321 Sacks & bags (including cones) of polymers of ethylene 171,907.24 3.73% 17.30%
240220 Cigarettes containing tobacco 148,129.52 3.22% 23.30%
720450 Remelting scrap ingots, of iron or steel 143,953.26 3.13% 0.00%
640199 Waterproof footwear(Wellington) no toe cap, nes 132,297.09 2.87% 21.64%
720430 Waste or scrap, of tinned iron or steel 114,905.04 2.50% 0.00%
940350 Bedroom furniture, wooden, nes 93,605.90 2.03% 0.71%
150910 Olive oil, virgin 92,639.79 2.01% 5.00%
441520 Wooden pallets, box pallets and load boards 91,270.17 1.98% 5.00%
760429 Bars, rods and other profiles, aluminium alloyed 77,715.66 1.69% 0.00%
300490 Medicaments nes, in dosage 76,601.56 1.66% 8.30%
940429 Mattresses, stuffed, spring interior, etc 75,088.50 1.63% 19.00%
121190 Plants & parts, pharmacy, perfume, insecticide use nes 66,930.33 1.45% 5.00%
940161 Seats with wooden frames, upholstered nes 59,597.25 1.29% 15.00%
390190 Polymers of ethylene nes, in primary forms 59,433.33 1.29% 9.10%
040310 Yogurt 56,796.69 1.23% 15.61%
721399 Bars&rods,iron/na st irr 54,654.68 1.19% 5.00%
740400 Copper/copper alloy waste or scrap 53,468.89 1.16% 0.00%
690810 Glazed ceramic mosaic tiles, cubes & similar <7cm wide 45,655.55 0.99% 13.00%
100890 Cereals unmilled nes 42,888.58 0.93% 5.00%
170490 Sugar confectionery not chewing gum, no cocoa content 39,408.11 0.86% 18.00%
251611 Granite, crude or roughly trimmed 37,498.61 0.81% 3.00%
340290 Organic surfactant washing, cleaning preparations nes 37,075.55 0.81% 5.00%
160100 Sausages, similar products of meat, meat offal & blood 35,407.86 0.77% 19.53%
Total 2,549,554.61 55.38% -
Source: ITC Market Access Map (tariff data), Comtrade via TradeSift (trade data)
We can further identify Palestine’s potential for trade creation by looking at Russia’s applied
tariff peaks for products exported by Palestine in 2013. Considering products exported at a
minimum value of 100 thousand USD, Table 10 reveals that the vast majority of the 34 listed
products are industrial products, with high applied MFN tariff rates at 17-19% (except for
chandeliers and articles of funfair, where the tariff rate is 5%). This analysis indicates
considerable likelihood for shallow integration induced trade creation for Palestine, especially in
the industrial sectors.
Among the strongest exports (exported value >1 million USD), we can identify the following
products:
- Sacks & bags;
- Milk in powder/granules;
- Reservoirs, tanks, vats etc.;
- Doors & frames;
- Toilet paper;
- Porcelain/china table- & kitchenware
- Coated electrodes

27
Table 10: Russia’s applied tariff peaks for Palestine’s exports to the world (2013)
Product Product Name
Palestine's exports Russia's applied tariffs
Exp. Value
('000s USD)
Exp.
Share
Simple
Av. AHS
Tariff
Total
Lines
Dom.
Peaks
Internat.
Peaks
Applied
MFN
duties
040221 Milk in powder/granules/other sol.. 1,891.91 0.21% 18.75% 85 70.59% 76.47% 18.30%
220429 Wine other than sparkling wine of .. 378.81 0.04% 13.55% 1430 0.00% 39.23% 18.10%
392310 Boxes, cases, crates & similar article.. 651.12 0.07% 17.21% 61 0.00% 63.93% 6.50%
392321 Sacks & bags (incl. cones), of poly.. 38,941.56 4.32% 16.81% 72 0.00% 56.94% 17.30%
392330 Carboys, bottles, flasks & similar .. 113.74 0.01% 12.54% 232 0.00% 32.76% 8.80%
392390 Articles for the conveyance/packing .. 328.79 0.04% 16.69% 59 0.00% 59.32% 16.60%
392490 Household articles & toilet articles.. 346.85 0.04% 18.18% 132 0.00% 45.45% 17.30%
392510 Reservoirs, tanks, vats & similar .. 1,148.96 0.13% 17.58% 33 0.00% 87.88% 17.30%
392690 Articles of plastics&articles of othe.. 707.12 0.08% 9.12% 791 0.00% 13.02% 17.30%
441011 Particle board of wood, whether/not.. 226.17 0.03% 14.68% 124 0.00% 22.58% 17.60%
441820 Doors & their frames & thresholds, .. 1,067.60 0.12% 16.96% 138 0.00% 84.78% 18.40%
441850 Shingles & shakes of wood, incl. .. 239.70 0.03% 20.00% 1 0.00% 100.00% 17.50%
441879 Assembled flooring panels (excl. o.. 244.31 0.03% 18.57% 28 0.00% 92.86% 17.00%
441890 Builders' joinery&carpentry of woo.. 576.84 0.06% 17.82% 110 0.00% 89.09% 17.00%
481810 Toilet paper, in rolls of a width not .. 5,631.91 0.63% 18.46% 52 0.00% 92.31% 17.50%
690510 Roofing tiles, ceramic 340.04 0.04% 18.40% 25 0.00% 92.00% 19.00%
690600 Ceramic pipes, conduits, guttering .. 214.31 0.02% 20.00% 14 0.00% 100.00% 19.00%
691110 Tableware & kitchenware, of porcel.. 1,497.18 0.17% 18.40% 50 0.00% 92.00% 18.40%
691190 Household articles & toilet article.. 194.72 0.02% 18.57% 28 0.00% 92.86% 18.10%
691310 Statuettes & other ornamental .. 215.23 0.02% 16.55% 42 0.00% 59.52% 18.10%
691390 Statuettes & other ornamental .. 487.72 0.05% 16.25% 168 0.00% 51.79% 17.30%
691490 Ceramic articles n.e.s. in Ch.69 273.53 0.03% 16.86% 51 0.00% 60.78% 18.30%
730300 Tubes, pipes & hollow profiles of .. 348.88 0.04% 15.83% 42 0.00% 45.24% 15.00%
760719 Aluminium foil, whether/not printe.. 771.86 0.09% 18.79% 66 0.00% 93.94% 18.00%
760810 Tubes & pipes of aluminium, not .. 353.27 0.04% 19.39% 33 0.00% 96.97% 17.00%
761090 Aluminium Structures (excld.pref.. 119.25 0.01% 17.87% 94 0.00% 89.36% 18.40%
830150 Clasps & frames with clasps.. 100.73 0.01% 19.05% 21 0.00% 95.24% 19.00%
830300 Armoured/reinforcededed safes, .. 115.54 0.01% 17.86% 56 0.00% 89.29% 17.60%
831000 Sign-plates, name-plates, addres.. 160.48 0.02% 19.26% 54 0.00% 96.30% 19.00%
831110 Coated electrodes of base metal, fo.. 1,099.10 0.12% 18.86% 35 0.00% 94.29% 17.30%
841850 Refrigerating/freezing chests, .. 354.49 0.04% 18.05% 123 0.00% 90.24% 18.40%
854460 Electric conductors (excl. of 8544… 233.88 0.03% 15.94% 138 0.00% 63.77% 17.30%
940510 Chandeliers & other electric .. 200.51 0.02% 11.62% 570 0.00% 46.49% 5.00%
950490 Articles for funfair/table/parlou… 571.93 0.06% 13.75% 144 0.00% 61.11% 5.00%
Source: WTO IDB via WITS (AHS tariff data), PCBS (trade data)
To explore further the export potential of the products which we have previously discussed, we
look at their revealed comparative advantage (RCA)9. Table 12 illustrates Palestine’s RCAs on
9 It is the essence of Rule of Thumb 3 of SF to which extent Palestine and Russia differ in comparative advantage, which can be estimated by
calculating the RCA. The RCA measures a country’s exports of a commodity relative to its total exports and compares this to the world exports of a commodity relative to total world exports. A comparative advantage is “revealed” if RCA > 1. This is because the index shows that the country is
exporting a higher share of the good than the share of the good in world exports – hence the country has a comparatively higher share for that good,
implying a comparative advantage. Analogously, if the RCA is less then unity, the country is said to have comparative disadvantage in that commodity.
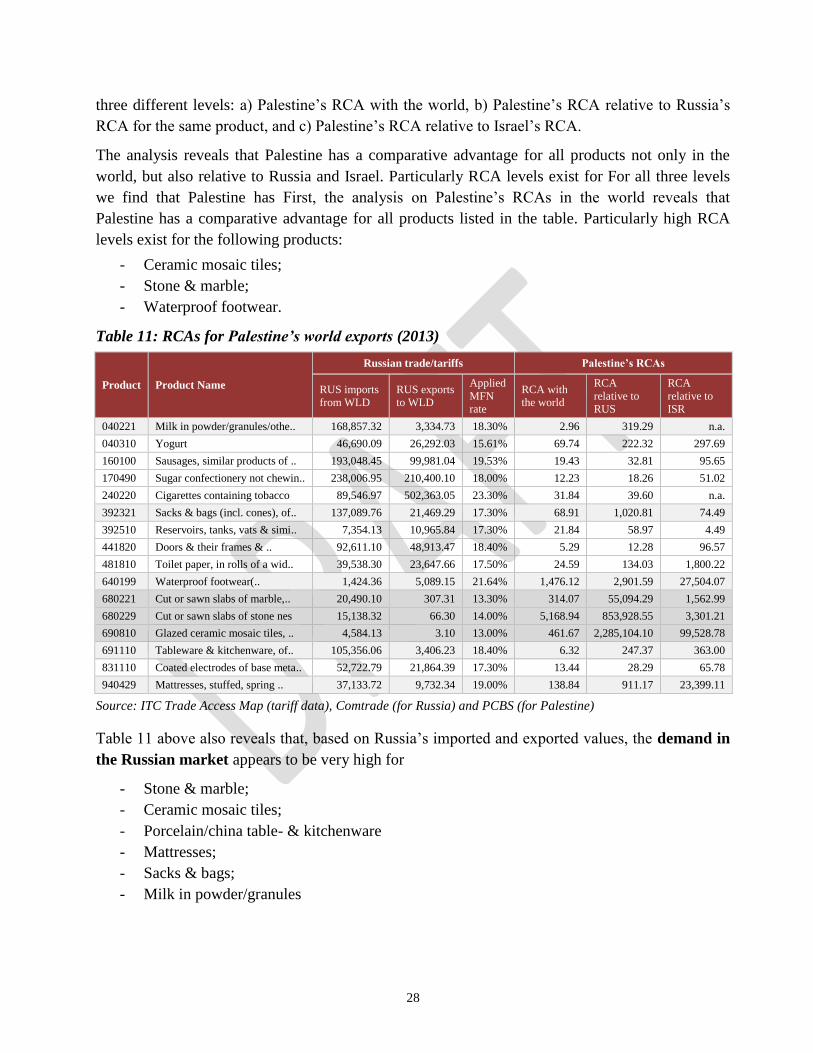
28
three different levels: a) Palestine’s RCA with the world, b) Palestine’s RCA relative to Russia’s
RCA for the same product, and c) Palestine’s RCA relative to Israel’s RCA.
The analysis reveals that Palestine has a comparative advantage for all products not only in the
world, but also relative to Russia and Israel. Particularly RCA levels exist for For all three levels
we find that Palestine has First, the analysis on Palestine’s RCAs in the world reveals that
Palestine has a comparative advantage for all products listed in the table. Particularly high RCA
levels exist for the following products:
- Ceramic mosaic tiles;
- Stone & marble;
- Waterproof footwear.
Table 11: RCAs for Palestine’s world exports (2013)
Product Product Name
Russian trade/tariffs Palestine’s RCAs
RUS imports
from WLD
RUS exports
to WLD
Applied
MFN
rate
RCA with
the world
RCA
relative to
RUS
RCA
relative to
ISR
040221 Milk in powder/granules/othe.. 168,857.32 3,334.73 18.30% 2.96 319.29 n.a.
040310 Yogurt 46,690.09 26,292.03 15.61% 69.74 222.32 297.69
160100 Sausages, similar products of .. 193,048.45 99,981.04 19.53% 19.43 32.81 95.65
170490 Sugar confectionery not chewin.. 238,006.95 210,400.10 18.00% 12.23 18.26 51.02
240220 Cigarettes containing tobacco 89,546.97 502,363.05 23.30% 31.84 39.60 n.a.
392321 Sacks & bags (incl. cones), of.. 137,089.76 21,469.29 17.30% 68.91 1,020.81 74.49
392510 Reservoirs, tanks, vats & simi.. 7,354.13 10,965.84 17.30% 21.84 58.97 4.49
441820 Doors & their frames & .. 92,611.10 48,913.47 18.40% 5.29 12.28 96.57
481810 Toilet paper, in rolls of a wid.. 39,538.30 23,647.66 17.50% 24.59 134.03 1,800.22
640199 Waterproof footwear(.. 1,424.36 5,089.15 21.64% 1,476.12 2,901.59 27,504.07
680221 Cut or sawn slabs of marble,.. 20,490.10 307.31 13.30% 314.07 55,094.29 1,562.99
680229 Cut or sawn slabs of stone nes 15,138.32 66.30 14.00% 5,168.94 853,928.55 3,301.21
690810 Glazed ceramic mosaic tiles, .. 4,584.13 3.10 13.00% 461.67 2,285,104.10 99,528.78
691110 Tableware & kitchenware, of.. 105,356.06 3,406.23 18.40% 6.32 247.37 363.00
831110 Coated electrodes of base meta.. 52,722.79 21,864.39 17.30% 13.44 28.29 65.78
940429 Mattresses, stuffed, spring .. 37,133.72 9,732.34 19.00% 138.84 911.17 23,399.11
Source: ITC Trade Access Map (tariff data), Comtrade (for Russia) and PCBS (for Palestine)
Table 11 above also reveals that, based on Russia’s imported and exported values, the demand in
the Russian market appears to be very high for
- Stone & marble;
- Ceramic mosaic tiles;
- Porcelain/china table- & kitchenware
- Mattresses;
- Sacks & bags;
- Milk in powder/granules

29
Having identified a list of products with considerable export potential for Palestine, we now
examine their coverage under the GSP, i.e. the products for which Palestine would receive zero
tariff treatment, if treated as “least developed country” under the GPS between Russia, Belarus and
Kazakhstan.
Table 12 reveals that only few of Palestine’s export products are covered under the GSP,
including:
- Stone & marble;
- Sacks & bags;
- Sausages/other products of processed meat
- Yogurt
- Milk in powder/granules
On the other hand, some of Palestine’s most significant export products are not considered under
the GSP, most notably, waterproof footwear, ceramic mosaic tiles, porcelain/china table- and
kitchenware and mattresses. Coverage under a bilateral Russian-Palestinian FTA is crucial to
enhance trade for Palestine’s exports in these sectors.
Table 12: Products with export potential and coverage under the GSP
Product Product Name Product coverage
under GSP Notes
040221 Milk in powder/granules/othe.. Yes Coverage for all products under product code 04
040310 Yogurt Yes Coverage for all products under product code 04
160100 Sausages, similar products of .. Yes Coverage for all products under product code 16
170490 Sugar confectionery not chewin.. No
240220 Cigarettes containing tobacco No Coverage only under product code 2401 (unmanufactured
tobacco)
392321 Sacks & bags (incl. cones), of.. Yes Coverage for all products under product code 3923
392510 Reservoirs, tanks, vats & simi.. No
441820 Doors & their frames & .. No
481810 Toilet paper, in rolls of a wid.. No
640199 Waterproof footwear(.. No
680221 Cut or sawn slabs of marble,.. Yes Coverage for all products under product code 68
680229 Cut or sawn slabs of stone nes Yes Coverage for all products under product code 68
690810 Glazed ceramic mosaic tiles, .. No
691110 Tableware & kitchenware, of.. No
831110 Coated electrodes of base meta.. No
940429 Mattresses, stuffed, spring .. No

30
Deep integration
In analysing the potential impact of MPFTA, it is important to consider not just the implications of
the removal of tariff barriers, but also the implications of the removal of non-tariff barriers and the
opportunities for positive or deeper integration. These may deal, for example, with regulatory
harmonisation, with investment rules, with liberalisation of services, and with measures of trade
defence. The welfare gains from a process of deeper integration are likely to be considerably
higher than those derived simply from a process of shallow integration. The possible range of
further gains often associated with deeper integration include: technology transfer and diffusion
both through trade and foreign direct investment (FDI); pro-competitive gains from increasing
import competition in an environment of imperfect competition, which may also allow greater
exploitation of economies of scale in production; the increased geographical dispersion of
production through trade that supports (i) exploitation of different factor proportions for different
parts of the production process (Ricardian efficiency gains) and/or (ii) local economies of scale
through finer specialization and division of labour in production (Smithian efficiency gains); and
externalities arising from institutional changes that lead to wide increases in productivity.10
It is more likely that the potential for deeper integration gains will be achieved the greater is the
realisation of a “common economic space” as a result of an FTA. This common economic space
requires both removal of barriers to trade that operate beyond borders (e.g. discriminatory taxes
and regulations) and action to undertake common policies needed for dealing with the existence of
public goods and externalities. Of course, the impact of deep integration will clearly depend on
whether the norms adopted are appropriate — i.e., generate positive externalities and promote
trade. Broadly speaking, adopting appropriate standards is synonymous with finding the
appropriate intuitional framework for dealing with externalities.11
As discussed previously, the 1998 Agreement includes such instruments for deep integration,
most notably:
- Information exchange on all economic and trade matters;
- Assistance in order to organize and hold conferences, advertisement actions, exhibitions,
fairs and others;
- Consultancy and other services;
- The encouragement of cooperation between chambers of commerce and other business
associations in the two countries;
- Mutual assistance in order to encourage the participation of SMEs in trade activities;
- The establishment of principles regarding a favorable investment environment and joint
investment activities.
Unfortunately, these instruments were provided in theory rather than on the ground, as the 1998
Agreement has not taken into consideration mechanisms for their implementation.
10
CARIS (2007), Qualitative Analysis of a Potential Free Trade Agreement between the European Union and India. 11
Ibid.

31
Although the Russian-Palestinian High Level Commission may finally provide with a framework
for cooperation, the development of mechanisms for cooperation and their establishment, the 1998
yet lacks specificity in terms of sectorial cooperation, technical and technological cooperation,
services, intellectual property rights, etc. - and detailed intervention mechanisms in all fields
mentioned above.

32
Summary and Conclusions
Ever since signing the 1998 Agreement between Russia and Palestine, trade relations between the
two countries have not improved by much. Palestinian exports have started to increase only in
2011, reaching more than a half million USD in 2012, before dropping to 150 thousand USD in
2013. 80% of Palestine’s exports after 2007 were plants & parts thereof (incl. fresh herbs) and
spices.
Imports, on the other hand, were relatively high, but unstable throughout the years. Recently,
imports have decreased from 16.2 million USD in 2008 to 6.2 million USD in 2013. Major import
products were aluminium products, iron or non-alloy steel in ingots, together accounting for 88%
of Palestine’s imports from Russia between 2007 and 2013.
In examining the potential impact of tariff measures to be taken as Palestine may become a
beneficiary under the GSP, we have compiled tariff data and illustrated Russia’s tariff peaks
vis-à-vis Palestine’s exports to the world, Palestinian RCAs with the world and relative to
Russia and Israel, and identified the potential demand in the Russian market.
According to this analysis, we find that for certain products, there is considerable scope for trade
creation for Palestine. However, we have revealed that the majority of these products are not
considered under the GSP12
. At the same time, as we shall see in Table 13 below, MFN duties
applied on imports from Palestine are very high.
Table 13: Palestinian products with export potential and their coverage under the GSP
Product Product Name Product coverage under
GSP
MFN duties applied by
Russia
040221 Milk in powder/granules/other solid form, unsweete... Yes 18.30%
040310 Yogurt Yes 15.61%
160100 Sausages, similar products of meat, meat offal & blood Yes 19.53%
170490 Sugar confectionery not chewing gum, no cocoa content No 18.00%
240220 Cigarettes containing tobacco No 23.30%
392321 Sacks & bags (incl. cones), of polymers of ethylen... Yes 17.30%
392510 Reservoirs, tanks, vats & similar containters, of ... No 17.30%
441820 Doors & their frames & thresholds, of wood, incl. ... No 18.40%
481810 Toilet paper, in rolls of a width not >36cm/cut to... No 17.50%
640199 Waterproof footwear(Wellington) no toe cap, nes No 21.64%
680221 Cut or sawn slabs of marble, travertine or alabaster Yes 13.30%
680229 Cut or sawn slabs of stone nes Yes 14.00%
690810 Glazed ceramic mosaic tiles, cubes & similar <7cm wide No 13.00%
691110 Tableware & kitchenware, of porcelain/china No 18.40%
831110 Coated electrodes of base metal, for electric arc-... No 17.30%
940429 Mattresses, stuffed, spring interior, etc No 19.00%
12
The entire list of products exempted from tariffs under GSP is attached as Annex II.

33
In a nutshell, there is considerable potential for shallow integration induced trade effects for
Palestine, if tariff measures are taken in the above mentioned sectors. Therefore, tariff measures
under the GSP may enhance trade in sectors such as stone & marble, sacks & bags, sausages &
other processed meat and certain dairy products. However, for the majority of products with export
potential in Russia, Palestinian exporters will continue facing significant tariff barriers.
For this reason, the Russian-Palestinian High Level Commission, which will be established
under the recently signed Agreement, must place emphasis on covering these products under a
bilateral Russian-Palestinian FTA, in addition to considering the services sector and
mechanisms of deeper integration.

34
Appendices
Annex I: The Russia-Palestine Agreement on Commercial and Economic Cooperation

35

36

37

38
Annex II: List of preferential goods covered under GSP of the Customs Union between Russia,
Belarus and Kazakhstan
02 MEAT AND EDIBLE MEAT OFFAL
03 (except
0305)
FISH AND CRUSTACEANS, MOLLUSCS AND OTHER AQUATIC INVERTEBRATES (EXCEPT
STURGEON AND SALMON AND THE HARD ROES THEREOF)
04 DAIRY PRODUCE; BIRDS' EGGS; NATURAL HONEY; EDIBLE PRODUCTS OF ANIMAL ORIGIN, NOT
ELSEWHERE SPECIFIED OR INCLUDED
05 PRODUCTS OF ANIMAL ORIGIN, NOT ELSEWHERE SPECIFIED OR INCLUDED
06 LIVE TREES AND OTHER PLANTS; BULBS, ROOTS AND THE LIKE; CUT FLOWERS AND
ORNAMENTAL FOLIAGE
07 EDIBLE VEGETABLES AND CERTAIN ROOTS AND TUBERS
08 EDIBLE FRUIT AND NUTS; PEEL OF CITRUS FRUIT OR MELONS
09 COFFEE, TEA, MATÉ AND SPICES
1006 RICE
11 PRODUCTS OF THE MILLING INDUSTRY; MALT; STARCHES; INULIN; WHEAT GLUTEN
12 OIL SEEDS AND OLEAGINOUS FRUITS; MISCELLANEOUS GRAINS, SEEDS AND FRUIT; INDUSTRIAL
OR MEDICINAL PLANTS; STRAW AND FODDER
13 LAC; GUMS; RESINS AND OTHER VEGETABLE SAPS AND EXTRACTS
14 VEGETABLE PLAITING MATERIALS; VEGETABLE PRODUCTS NOT ELSEWHERE SPECIFIED OR
INCLUDED
15
(except 1509,
1517-1522)
ANIMAL OR VEGETABLE FATS AND OILS
16 PREPARATIONS OF MEAT, OF FISH OR OF CRUSTACEANS, MOLLUSCS OR OTHER AQUATIC
INVERTEBRATES
1801 00 COCOA BEANS, WHOLE OR BROKEN, RAW OR ROASTED
1802 00 COCOA SHELLS, HUSKS, SKINS AND OTHER COCOA WASTE
20 (except
2001 10 000 0,
2009 50,
2009 71,
2009 79)
PREPARATIONS OF VEGETABLES, FRUIT, NUTS OR OTHER PARTS OF PLANTS
2103
SAUCES AND PREPARATIONS THEREFOR; MIXED CONDIMENTS AND MIXED SEASONINGS;
MUSTARD FLOUR AND MEAL AND PREPARED
MUSTARD
2104 SOUPS AND BROTHS AND PREPARATIONS THEREFOR; HOMOGENIZED COMPOSITE FOOD
PREPARATIONS
2401 UNMANUFACTURED TOBACCO (WHETHER OR NOT THRESHED OR SIMILARLY PROCESSED);
TOBACCO REFUSE
25 (except
2501 00 91,
2529 21 000 0,
2529 22 000 0)
SALT; SULFUR; EARTHS AND STONE; PLASTERING MATERIALS, LIME AND CEMENT
26 ORES, SLAG AND ASH
3003
MEDICAMENTS (EXCLUDING GOODS OF HEADING 3002, 3005 OR 3006) CONSISTING OF TWO OR
MORE CONSTITUENTS WHICH HAVE BEEN MIXED TOGETHER FOR THERAPEUTIC OR
PROPHYLACTIC USES, NOT PUT UP IN MEASURED DOSES OR IN FORMS OR PACKINGS FOR RETAIL
SALE
32 TANNING OR DYEING EXTRACTS; TANNINS AND THEIR DERIVATIVES; DYES, PIGMENTS AND
OTHER COLORING MATTER; PAINTS AND VARNISHES; PUTTY AND OTHER MASTICS; INKS
3301,
3302 ESSENTIAL OILS; RESINOIDS; MIXTURES OF ODORIFEROUS SUBSTANCES
3402
ORGANIC SURFACE-ACTIVE AGENTS (OTHER THAN SOAP); SURFACE-ACTIVE PREPARATIONS,
WASHING PREPARATIONS (INCLUDING AUXILIARY WASHING PREPARATIONS) AND CLEANING
PREPARATIONS, WHETHER OR NOT CONTAINING SOAP, OTHER THAN THOSE OF HEADING 3401
35 ALBUMINOIDAL SUBSTANCES; MODIFIED STARCHES; GLUES; ENZYMES
3923 ARTICLES FOR THE CONVEYANCE OR PACKING OF GOODS, OF PLASTICS; STOPPERS, LIDS, CAPS
AND OTHER CLOSURES, OF PLASTICS
4001 NATURAL RUBBER, BALATA, GUTTA-PERCHA, GUAYULE, CHICLE AND SIMILAR NATURAL GUMS,
IN PRIMARY FORMS OR IN PLATES, SHEETS OR STRIP
4403 41 000 0,
4403 49 OTHER WOOD IN THE ROUGH, OF TROPICAL WOOD

39
4407 21 –
4407 29
WOOD SAWN OR CHIPPED LENGTHWISE, SLICED OR PEELED, WHETHER OR NOT PLANED, SANDED
OR END-JOINTED, OF TROPICAL WOOD
4420
WOOD MARQUETRY AND INLAID WOOD; CASKETS AND CASES FOR JEWELRY OR CUTLERY AND
SIMILAR ARTICLES, OF WOOD; STATUETTES AND OTHER ORNAMENTS, OF WOOD; WOODEN
ARTICLES OF FURNITURE NOT FALLING WITHIN CHAPTER 94
4421 OTHER ARTICLES OF WOOD
45 CORK AND ARTICLES OF CORK
46 MANUFACTURES OF STRAW, OF ESPARTO OR OF OTHER PLAITING MATERIALS; BASKETWARE
AND WICKERWORK
50 SILK
5101 WOOL, NOT CARDED OR COMBED
5201 00 COTTON, NOT CARDED OR COMBED
53 OTHER VEGETABLE TEXTILE FIBERS; PAPER YARN AND WOVEN FABRICS OF PAPER YARN
56 WADDING, FELT AND NONWOVENS; SPECIAL YARNS; TWINE, CORDAGE, ROPES AND CABLES AND
ARTICLES THEREOF
5701 CARPETS AND OTHER TEXTILE FLOOR COVERINGS, KNOTTED, WHETHER OR NOT MADE UP
5702 10 000 0 "KELEM", "SCHUMACKS", "KARAMANIE" AND SIMILAR HANDWOVEN RUGS
5705 00 100 0 OTHER CARPETS AND OTHER TEXTILE FLOOR COVERINGS OF COIR, WHETHER OR NOT MADE UP,
OF WOOL OR FINE ANIMAL HAIR
5808 BRAIDS IN THE PIECE; ORNAMENTAL TRIMMINGS IN THE PIECE, WITHOUT EMBROIDERY, OTHER
THAN KNITTED OR CROCHETED; TASSELS, POMPONS AND SIMILAR ARTICLES:
6702 90 000 0
ARTIFICIAL FLOWERS, FOLIAGE AND FRUIT AND PARTS THEREOF; ARTICLES MADE OF
ARTIFICIAL FLOWERS, FOLIAGE OR FRUIT OF OTHER MATERIALS (EXCLUDING POLYMER
MATERIALS)
68 ARTICLES OF STONE, PLASTER, CEMENT, ASBESTOS, MICA OR SIMILAR MATERIALS
6913 STATUETTES AND OTHER ORNAMENTAL CERAMIC ARTICLES
6914 OTHER CERAMIC ARTICLES
7018 10 GLASS BEADS, IMITATION PEARLS, IMITATION PRECIOUS OR SEMIPRECIOUS STONES AND
SIMILAR GLASS SMALLWARES
7117 IMITATION JEWELRY: OF BASE METAL, WHETHER OR NOT PLATED WITH PRECIOUS METAL
9401 51 000 0,
9401 59 000 0 SEATS OF CANE, OSIER, BAMBOO OR SIMILAR MATERIALS
9403 81 000 0,
9403 89 000 0 FURNITURE OF OTHER MATERIALS, INCLUDING CANE, OSIER, BAMBOO OR SIMILAR MATERIALS
9403 90 900 0 PARTS OF FURNITURE
9601
WORKED IVORY, BONE, TORTOISE-SHELL, HORN, ANTLERS, CORAL, MOTHER-OF-PEARL AND
OTHER ANIMAL CARVING MATERIAL, AND ARTICLES OF THESE MATERIALS (INCLUDING
ARTICLES OBTAINED BY MOLDING)
9602 00 000 0
WORKED VEGETABLE OR MINERAL CARVING MATERIAL AND ARTICLES OF THESE MATERIALS;
MOLDED OR CARVED ARTICLES OF WAX, OF STEARIN, OF NATURAL GUMS OR NATURAL RESINS,
OF MODELING PASTES, AND OTHER MOLDED OR CARVED ARTICLES, NOT ELSEWHERE SPECIFIED
OR INCLUDED; WORKED, UNHARDENED GELATIN (EXCEPT GELATIN OF HEADING 3503) AND
ARTICLES OF UNHARDENED GELATIN
9603
BROOMS, BRUSHES (INCLUDING BRUSHES CONSTITUTING PARTS OF MACHINES, APPLIANCES OR
VEHICLES), HAND-OPERATED MECHANICAL FLOOR SWEEPERS, NOT MOTORIZED, MOPS AND
FEATHER DUSTERS; PREPARED KNOTS AND TUFTS FOR BROOM OR BRUSH MAKING; PAINT PADS
AND ROLLERS; SQUEEGEES (OTHER THAN ROLLER SQUEEGEES
9604 00 000 0 HAND SIEVES AND HAND RIDDLES
9606 BUTTONS, PRESS-FASTENERS, SNAP-FASTENERS AND PRESS-STUDS, BUTTON MOLDS AND OTHER
PARTS OF THESE ARTICLES; BUTTON BLANKS
9609 PENCILS (OTHER THAN THOSE PENCILS OF HEADING 9608), CRAYONS, PENCIL LEADS, PASTELS,
DRAWING CHARCOALS, WRITING OR DRAWING CHALKS AND TAILORS' CHALKS
9614 00 SMOKING PIPES (INCLUDING PIPE BOWLS) AND CIGAR OR CIGARETTE HOLDERS, AND PARTS
THEREOF
9615 11 000 0 COMBS, HAIR-SLIDES AND THE LIKE OF HARD RUBBER OR PLASTICS
9617 00 VACUUM FLASKS AND OTHER VACUUM VESSELS, COMPLETE WITH CASES; PARTS THEREOF
OTHER THAN GLASS INNERS
97 WORKS OF ART, COLLECTORS' PIECES AND ANTIQUES

40
Annex III: The Sussex Framework
The Sussex Framework13
The Sussex Framework (SF) involves focussing on selected descriptive statistical indicators from which one can draw
analytical conclusions well-grounded in economic theory to evaluate the likely effects of a FTA.
Shallow integration
Preferential trade liberalization involves a process of shallow integration, defined as the removal of border barriers to
trade, typically tariffs and quotas. The potential net benefits from shallow integration are inherently ambiguous
because of the likelihood of both trade creation (which is welfare increasing) and trade diversion (which is welfare
reducing). The net welfare impact of a FTA depends on the relative size of these two effects.
There are two possible channels of trade creation: First, this can arise when more efficiently produced imported
goods replace less efficient domestically produced goods. Thus, trade is “created” and yields welfare gains on the
production side. Secondly, a reduction in tariffs that leads to a reduction in prices will increase the demand for goods
which were already previously imported from the partner country. This leads to trade creation and welfare gains on the
consumption side as consumers have access to cheaper goods than previously.
Trade diversion occurs when sources of supply switch away from more efficient non-partner countries to less
efficient partner countries. If, prior to the FTA, a country chose to import from a non-FTA supplier, this would have
occurred because that supplier was more efficient (cheaper) than the alternatives. If, because of tariff reduction, a
country moves the source of supply away from the more efficient (cheaper) supplier and towards the less efficient
FTA partner country, then trade diversion is considered to result in a welfare loss. On the other hand, there is a
potential welfare gain to the exporting FTA partner country, depending on whether the country was at full employment
prior to the FTA. If the partner country was previously at full employment, the FTA results in a reallocation of
resources from one sector to another, where demand has increased after the formation of the FTA.
The conclusion is that preferential liberalization in the framework of the FTA will have an impact on trade flows
through trade creation and trade diversion, but the net welfare effect from that reallocation of trade flows is inherently
ambiguous.
The SF identifies the following rules of thumb, which are used to shed light on the likely shallow integration impact of
a trade agreement:
1. The higher are the initial tariffs/barriers, the greater are the likely effects on both trade creation and trade
diversion. With high initial (MFN) tariffs, the initial distortion is great. This in turn means that in principle there is
greater scope for both trade creation and trade diversion as the high tariffs are preferentially removed. Thus if the pre-
FTA tariffs were very high, as these are removed it is more likely that the new partner country may be able to supply
the good more efficiently than the domestic economy. The higher the pre-FTA tariffs, the more likely it is that this will
be the case and consequently, the greater the possibility for such trade to be created. Moreover, the higher the pre-FTA
tariffs, the greater the price reduction arising from their removal, which in turn increases the demand for the good and
creates more trade. Each of these processes of trade creation are welfare increasing. However, it is also the case that if
pre-FTA tariffs were high, then as they are removed there is a greater possibility of the new FTA partner countries
supplying the (tariff free) good cheaper than the excluded countries (on whose exports tariffs are levied). Hence, even
though these excluded countries may produce the good more efficiently and cheaply, the good will be supplied by the
FTA partner who has preferential access to the market. The higher the pre-FTA tariffs, the more likely it is that this
form of welfare reducing trade diversion will occur.
13 This section draws heavily on CARIS (2007), ‘Qualitative Analysis of a Potential Free Trade Agreement between the European
Union and India’, and CARIS (2007), ‘Assessing Preferential Trading Agreements Using the Sussex Framework’.

41
2. The greater the number of FTA partners, the more likely it is that there will be trade creation as opposed to trade
diversion, because of the increased likelihood of including more efficient suppliers. As an illustration, suppose that a
given trade agreement were to include the maximum number of possible countries. At the limit this would include all
the countries in the world, and hence by definition the most efficient countries will have been included. Therefore,
including a greater number of countries in a FTA minimizes the extent of trade diversion, and simultaneously
maximizes the likelihood of trade creation.
3. Wide differences in comparative advantage between partner countries are likely to lead to a welfare improving
FTA. Trade creation occurs when there are differences in efficiency and costs across partner countries – hence the
FTA enables the partners to source the goods from the most efficient FTA partner. The greater those differences in
comparative advantage (and hence in costs across the countries) the greater is the likely gain from trade creation. If
Palestine is only marginally more efficient than the USA in producing a given good, then the gain to the USA from
importing the good from Palestine as opposed to producing it itself is relatively small. However, if Palestine is
significantly more efficient than the potential gains are that much higher. It is worth noting, however, that if the initial
tariffs are high then, as detailed in the first rule of thumb, there is also greater likelihood of trade diversion which
diminishes the trade creation gains.
4. The more similar the product mix in the economies concerned and the higher the elasticities of supply, the greater
the possibility of trade creation. Recall that trade creation occurs when the importing country produces less of the good
itself and instead imports the good from its FTA partner. Suppose that prior to the FTA there was no overlap
whatsoever between the two countries’ production bundles. If that were the case then the only possibilities for trade
creation would arise on the demand side. Conversely, if there is a significant overlap in the goods produced by the
partner countries, there is much more scope for switching sources of supply to the more efficient country. Note also
that assuming a given degree of overlap in the production structures, the more responsive supply is to the tariff
reduction-induced changes in prices, the greater the extent of trade creation.
5. The higher the percentage of trade with potential partners, the greater the possibility of the FTA enhancing
welfare. Consider an initial situation where there was very little trade with the potential partner country. This would
suggest that in the initial situation, third countries were more efficient suppliers. A FTA is therefore more likely to
result in trade diversion under these circumstances. Conversely, if in the initial situation the countries traded
significantly with each other, it is more likely that they are each respectively importing from the more efficient
supplier, and the chances of trade diversion occurring are lessened.
6. Trade diversion is more likely when partners and excluded countries are close competitors. If it is the case that the
partner exports a similar range of products as the excluded countries, then it is clearly more likely that a FTA may
result in the partner displacing the exports of one of the excluded countries.
7. The greater the possibilities for supply chain integration the greater the likely gains: Following from RT4,
specialization and supply chain integration greatly increases the chances of welfare gains, which are characteristic of
deep integration.
8. Greater share of trade in GDP suggests that larger gains are likely: A low trade share in GDP suggests a high
degree of protection, which thus points to greater distortions. Thus, a boost in trade to a closed economy will constitute
a welfare gain, and the less trade there is, the lesser is the risk of trade diversion.
Deep integration
In addition to shallow integration effects, there are further welfare gains arising from the induced growth effects
stimulated by, for example, productivity growth, positive externalities between firms, sectors or across sectors (e.g.
between manufacturing and services), technology transfer and diffusion both through trade and FDI, pro-competitive

42
gains from increasing import competition in an environment of imperfect competition, the increased geographical
dispersion of production through trade that supports the exploitation of different factor proportions for different parts
of the production process and/or local economies of scale through increased specialization and division of labor in
production. These gains are more likely to arise in the presence of deeper integration.
In contrast to shallow integration, deep integration involves policies and institutions that facilitate trade by reducing or
eliminating regulatory and behind-the-border impediments to trade, where such impediments may or may not be
intentional. These can include issues such as customs procedures, regulation of domestic services production that
discriminate against foreigners, product standards that differ from international norms or where testing and
certification of foreign goods is complex and perhaps exclusionary, regulation of inward investments, competition
policy, intellectual property protection and rules surrounding access to government procurement.
There is a contrast between shallow and deep integration: For shallow there is wealth of data and comprehensive and
sophisticated analytical methods for analysis of welfare effects, but usually the estimated welfare benefits are relative
small. Deep integration, in contrast, is likely to result in the creation of large welfare gains. However, there is a
relatively low availability of data and analytical methods for the analysis of deep integration.
In assessing a FTA it is therefore crucial to first identify the implications arising from the implied shallow integration
using the above-mentioned Rules of Thumb and then build upon this to consider the possible role and importance of
measures of deeper integration.
Annex IV: Russia’s top trade partners 1996-2013
Partner Year Imports Value
('000s USD)
Exports Value
('000s USD) Imports share Exports share
World 1997 66,326,577.15 85,889,245.18 100.00% 100.00%
World 1998 43,711,339.49 72,275,585.47 100.00% 100.00%
World 1999 30,291,545.55 72,884,999.95 100.00% 100.00%
World 2000 33,880,091.84 103,092,748.42 100.00% 100.00%
World 2001 41,865,361.96 99,868,397.03 100.00% 100.00%
World 2002 46,176,985.04 106,691,997.87 100.00% 100.00%
World 2003 57,345,988.01 133,655,685.16 100.00% 100.00%
World 2004 75,569,014.53 181,600,379.15 100.00% 100.00%
World 2005 98,707,255.77 241,451,656.88 100.00% 100.00%
World 2006 137,811,059.90 301,550,665.54 100.00% 100.00%
World 2007 199,725,954.51 352,266,398.77 100.00% 100.00%
World 2008 267,051,243.55 467,993,954.58 100.00% 100.00%
World 2009 170,826,590.31 301,796,058.82 100.00% 100.00%
World 2010 228,911,658.15 397,067,521.00 100.00% 100.00%
World 2011 306,091,490.31 516,992,618.22 100.00% 100.00%
World 2012 316,192,918.04 524,766,420.61 100.00% 100.00%
World 2013 314,945,094.99 527,265,918.85 100.00% 100.00%
EU 1997 24,807,308.07 41,977,472.98 37.40% 48.87%
EU 1998 19,559,673.65 34,529,935.66 44.75% 47.78%
EU 1999 13,226,968.52 35,971,795.37 43.67% 49.35%
EU 2000 13,525,378.04 56,252,090.25 39.92% 54.56%
EU 2001 18,464,074.66 54,383,644.32 44.10% 54.46%
EU 2002 21,965,952.15 55,210,818.96 47.57% 51.75%
EU 2003 26,819,407.84 70,316,221.71 46.77% 52.61%
EU 2004 34,403,633.43 94,916,434.40 45.53% 52.27%
EU 2005 44,096,727.90 139,148,971.50 44.67% 57.63%
EU 2006 61,585,139.05 177,816,305.90 44.69% 58.97%
EU 2007 87,151,190.67 168,731,947.90 43.64% 47.90%
EU 2008 116,464,574.00 267,462,895.80 43.61% 57.15%

43
EU 2009 78,644,323.78 159,781,722.00 46.04% 52.94%
EU 2010 93,434,903.53 184,669,479.90 40.82% 46.51%
EU 2011 123,632,473.90 230,540,421.60 40.39% 44.59%
EU 2012 132,712,532.70 245,699,138.60 41.97% 46.82%
EU 2013 134,138,588.40 241,237,216.00 42.59% 45.75%
Germany 1997 6,643,310.08 6,531,072.00 10.02% 7.60%
Germany 1998 5,508,571.72 5,720,608.23 12.60% 7.91%
Germany 1999 4,201,556.00 6,202,244.50 13.87% 8.51%
Germany 2000 3,898,067.85 9,231,828.80 11.51% 8.95%
Germany 2001 5,807,733.06 9,194,175.84 13.87% 9.21%
Germany 2002 6,598,481.28 8,059,298.78 14.29% 7.55%
Germany 2003 8,112,127.09 10,419,865.75 14.15% 7.80%
Germany 2004 10,555,675.33 13,302,044.43 13.97% 7.32%
Germany 2005 13,272,376.92 19,735,912.58 13.45% 8.17%
Germany 2006 18,456,673.22 24,499,816.13 13.39% 8.12%
Germany 2007 26,549,268.50 18,604,905.58 13.29% 5.28%
Germany 2008 34,075,574.75 33,187,251.59 12.76% 7.09%
Germany 2009 21,221,887.01 18,708,181.98 12.42% 6.20%
Germany 2010 26,601,382.39 15,862,274.79 11.62% 3.99%
Germany 2011 37,436,682.17 22,766,472.11 12.23% 4.40%
Germany 2012 38,289,660.35 24,039,165.63 12.11% 4.58%
Germany 2013 37,904,568.53 22,962,139.22 12.04% 4.35%
China 1997 1,261,321.86 3,981,393.92 1.90% 4.64%
China 1998 1,159,940.99 3,199,632.29 2.65% 4.43%
China 1999 893,441.56 3,526,768.14 2.95% 4.84%
China 2000 948,951.49 5,247,619.97 2.80% 5.09%
China 2001 1,646,500.68 5,596,012.92 3.93% 5.60%
China 2002 2,401,128.47 6,836,946.64 5.20% 6.41%
China 2003 3,308,670.79 8,257,599.17 5.77% 6.18%
China 2004 4,746,229.49 10,105,068.54 6.28% 5.56%
China 2005 7,264,582.91 13,047,744.85 7.36% 5.40%
China 2006 12,911,747.27 15,757,053.28 9.37% 5.23%
China 2007 24,406,609.58 15,166,641.40 12.22% 4.31%
China 2008 34,768,715.53 21,147,334.47 13.02% 4.52%
China 2009 22,859,880.13 16,669,000.00 13.38% 5.52%
China 2010 38,960,930.03 19,783,043.49 17.02% 4.98%
China 2011 48,038,378.33 34,692,362.00 15.69% 6.71%
China 2012 51,767,694.48 35,766,829.50 16.37% 6.82%
China 2013 53,173,086.21 35,625,419.98 16.88% 6.76%
Netherlands 1997 1,205,779.58 4,553,088.51 1.82% 5.30%
Netherlands 1998 916,992.78 3,993,948.60 2.10% 5.53%
Netherlands 1999 688,503.51 3,673,257.83 2.27% 5.04%
Netherlands 2000 739,664.19 4,349,439.03 2.18% 4.22%
Netherlands 2001 846,217.12 4,695,281.68 2.02% 4.70%
Netherlands 2002 1,060,264.41 7,529,092.36 2.30% 7.06%
Netherlands 2003 1,257,813.30 8,673,741.87 2.19% 6.49%
Netherlands 2004 1,375,007.65 15,272,233.82 1.82% 8.41%
Netherlands 2005 1,941,381.90 24,614,011.04 1.97% 10.19%
Netherlands 2006 2,682,356.99 35,895,848.49 1.95% 11.90%
Netherlands 2007 3,851,392.88 41,840,676.10 1.93% 11.88%
Netherlands 2008 4,814,063.44 56,944,281.21 1.80% 12.17%
Netherlands 2009 3,585,005.46 36,289,884.16 2.10% 12.02%
Netherlands 2010 4,438,054.99 53,240,893.69 1.94% 13.41%
Netherlands 2011 5,921,156.03 61,240,029.03 1.93% 11.85%
Netherlands 2012 5,979,837.97 76,036,013.74 1.89% 14.49%

44
Netherlands 2013 5,837,158.21 69,259,511.32 1.85% 13.14%
Italy 1997 2,640,128.77 3,564,252.42 3.98% 4.15%
Italy 1998 1,820,716.31 3,221,706.98 4.17% 4.46%
Italy 1999 1,160,005.56 3,754,984.81 3.83% 5.15%
Italy 2000 1,212,447.46 7,254,325.41 3.58% 7.04%
Italy 2001 1,714,898.55 7,401,528.16 4.10% 7.41%
Italy 2002 2,228,759.95 7,442,132.96 4.83% 6.98%
Italy 2003 2,406,764.77 8,514,861.01 4.20% 6.37%
Italy 2004 3,199,437.64 12,087,832.27 4.23% 6.66%
Italy 2005 4,416,276.22 19,055,788.02 4.47% 7.89%
Italy 2006 5,726,240.44 25,102,839.31 4.16% 8.32%
Italy 2007 8,524,063.98 22,631,148.55 4.27% 6.42%
Italy 2008 10,995,286.12 41,955,811.39 4.12% 8.97%
Italy 2009 7,884,000.00 25,060,000.00 4.62% 8.30%
Italy 2010 10,024,387.99 24,375,011.48 4.38% 6.14%
Italy 2011 13,292,795.46 27,898,665.54 4.34% 5.40%
Italy 2012 13,426,404.13 28,007,565.32 4.25% 5.34%
Italy 2013 14,553,947.80 29,156,005.75 4.62% 5.53%
Ukraine 1997 3,982,112.51 7,239,638.53 6.00% 8.43%
Ukraine 1998 3,282,198.26 5,563,407.92 7.51% 7.70%
Ukraine 1999 2,528,356.27 4,792,376.30 8.35% 6.58%
Ukraine 2000 3,650,926.74 5,024,485.13 10.78% 4.87%
Ukraine 2001 3,846,461.46 5,282,364.48 9.19% 5.29%
Ukraine 2002 3,230,018.64 5,885,284.42 6.99% 5.52%
Ukraine 2003 4,437,624.00 7,597,637.05 7.74% 5.68%
Ukraine 2004 6,100,483.65 10,770,221.89 8.07% 5.93%
Ukraine 2005 7,819,251.29 12,401,617.63 7.92% 5.14%
Ukraine 2006 9,235,408.79 14,986,605.61 6.70% 4.97%
Ukraine 2007 13,310,452.41 15,928,664.53 6.66% 4.52%
Ukraine 2008 16,246,435.45 23,567,676.52 6.08% 5.04%
Ukraine 2009 9,121,000.00 13,780,000.00 5.34% 4.57%
Ukraine 2010 14,002,410.23 13,608,727.74 6.12% 3.43%
Ukraine 2011 20,000,465.96 18,064,358.06 6.53% 3.49%
Ukraine 2012 17,955,443.33 14,815,773.79 5.68% 2.82%
Ukraine 2013 15,790,890.01 15,215,254.51 5.01% 2.89%
Belarus 1997 3,333,831.94 3,152,572.93 5.03% 3.67%
Belarus 1998 4,593,681.55 4,622,600.00 10.51% 6.40%
Belarus 1999 3,222,000.00 3,767,000.00 10.64% 5.17%
Belarus 2000 3,710,139.00 5,572,101.00 10.95% 5.40%
Belarus 2001 3,940,953.00 5,249,372.00 9.41% 5.26%
Belarus 2002 3,977,107.00 5,922,296.00 8.61% 5.55%
Belarus 2003 4,879,858.00 7,601,917.00 8.51% 5.69%
Belarus 2004 6,484,977.00 11,219,191.00 8.58% 6.18%
Belarus 2005 5,715,788.00 10,118,151.00 5.79% 4.19%
Belarus 2006 6,849,619.00 13,084,338.00 4.97% 4.34%
Belarus 2007 8,887,000.00 17,187,000.00 4.45% 4.88%
Belarus 2008 10,599,884.67 23,696,967.66 3.97% 5.06%
Belarus 2009 6,714,000.00 16,717,000.00 3.93% 5.54%
Belarus 2010 9,953,647.90 18,080,614.50 4.35% 4.55%
Belarus 2011 14,508,643.10 24,930,203.40 4.74% 4.82%
Belarus 2012 12,991,857.14 21,380,404.71 4.11% 4.07%
Belarus 2013 13,959,261.78 16,870,227.72 4.43% 3.20%
Areas, nes 1997 172,587.26 56,879.72 0.26% 0.07%
Areas, nes 1998 92,662.27 14,932.12 0.21% 0.02%
Areas, nes 1999 82,825.77 243,122.25 0.27% 0.33%

45
Areas, nes 2000 2,682.51 326.14 0.01% 0.00%
Areas, nes 2001 2,160.74 31,028.20 0.01% 0.03%
Areas, nes 2002 5,801.53 43,397.76 0.01% 0.04%
Areas, nes 2003 31,538.87 44,305.92 0.05% 0.03%
Areas, nes 2004 133,291.39 48,397.41 0.18% 0.03%
Areas, nes 2005 143,418.45 29,084.40 0.15% 0.01%
Areas, nes 2006 194,142.08 24,775.96 0.14% 0.01%
Areas, nes 2007 335,212.33 43,292,834.98 0.17% 12.29%
Areas, nes 2008 43,712.71 20,075.40 0.02% 0.00%
Areas, nes 2009 0.00 3,450,918.82 0.00% 1.14%
Areas, nes 2010 4,263,206.15 50,147,062.80 1.86% 12.63%
Areas, nes 2011 6,866,136.57 72,567,733.24 2.24% 14.04%
Areas, nes 2012 226,185.17 62,436,753.92 0.07% 11.90%
Areas, nes 2013 221,870.02 67,282,795.22 0.07% 12.76%
USA 1997 4,059,974.40 4,486,022.66 6.12% 5.22%
USA 1998 4,123,354.93 5,137,922.71 9.43% 7.11%
USA 1999 2,389,411.14 4,713,984.21 7.89% 6.47%
USA 2000 2,703,404.20 4,648,015.62 7.98% 4.51%
USA 2001 3,260,386.24 4,198,804.99 7.79% 4.20%
USA 2002 2,983,348.98 4,019,994.41 6.46% 3.77%
USA 2003 2,966,879.39 4,274,224.34 5.17% 3.20%
USA 2004 3,207,211.79 6,625,955.25 4.24% 3.65%
USA 2005 4,573,114.21 6,366,077.22 4.63% 2.64%
USA 2006 6,425,595.55 8,851,517.43 4.66% 2.94%
USA 2007 9,407,733.15 7,311,805.14 4.71% 2.08%
USA 2008 13,818,227.93 13,752,790.09 5.17% 2.94%
USA 2009 9,203,767.22 9,286,430.54 5.39% 3.08%
USA 2010 9,833,583.09 11,933,019.99 4.30% 3.01%
USA 2011 12,881,409.59 15,626,334.64 4.21% 3.02%
USA 2012 15,505,297.69 13,022,324.31 4.90% 2.48%
USA 2013 16,717,711.02 11,177,056.15 5.31% 2.12%
Japan 1997 985,093.38 2,935,047.94 1.49% 3.42%
Japan 1998 819,228.93 2,193,669.74 1.87% 3.04%
Japan 1999 455,688.49 2,124,691.12 1.50% 2.92%
Japan 2000 571,858.52 2,764,309.17 1.69% 2.68%
Japan 2001 870,781.52 2,426,637.15 2.08% 2.43%
Japan 2002 980,278.60 1,803,313.22 2.12% 1.69%
Japan 2003 1,882,938.77 2,421,423.40 3.28% 1.81%
Japan 2004 3,940,935.84 3,403,887.82 5.22% 1.87%
Japan 2005 5,833,520.65 3,740,270.35 5.91% 1.55%
Japan 2006 7,788,760.11 4,624,672.47 5.65% 1.53%
Japan 2007 12,715,798.18 7,490,642.84 6.37% 2.13%
Japan 2008 18,589,772.25 10,429,042.54 6.96% 2.23%
Japan 2009 7,255,705.81 7,262,992.72 4.25% 2.41%
Japan 2010 10,259,743.28 12,493,561.58 4.48% 3.15%
Japan 2011 15,012,610.61 14,234,690.26 4.90% 2.75%
Japan 2012 15,676,090.03 15,588,026.76 4.96% 2.97%
Japan 2013 13,560,499.94 19,667,507.62 4.31% 3.73%
Poland 1997 1,354,327.42 2,514,539.52 2.04% 2.93%
Poland 1998 1,047,847.96 2,780,162.91 2.40% 3.85%
Poland 1999 602,626.35 2,607,752.64 1.99% 3.58%
Poland 2000 716,266.82 4,452,274.28 2.11% 4.32%
Poland 2001 961,665.67 4,199,671.46 2.30% 4.21%
Poland 2002 1,299,765.72 3,720,168.98 2.81% 3.49%
Poland 2003 1,714,584.30 4,619,330.71 2.99% 3.46%

46
Poland 2004 2,310,201.34 5,699,624.93 3.06% 3.14%
Poland 2005 2,746,862.56 8,622,933.81 2.78% 3.57%
Poland 2006 3,407,530.66 11,479,852.60 2.47% 3.81%
Poland 2007 4,628,093.63 11,784,548.42 2.32% 3.35%
Poland 2008 7,030,995.02 20,192,712.54 2.63% 4.31%
Poland 2009 4,199,526.88 12,500,000.00 2.46% 4.14%
Poland 2010 5,825,082.96 14,215,842.07 2.54% 3.58%
Poland 2011 6,644,348.73 21,194,164.33 2.17% 4.10%
Poland 2012 7,467,130.89 19,753,359.07 2.36% 3.76%
Poland 2013 8,321,276.52 19,408,183.62 2.64% 3.68%
Turkey 1997 794,484.42 1,983,288.45 1.20% 2.31%
Turkey 1998 519,218.27 1,936,733.67 1.19% 2.68%
Turkey 1999 312,552.60 1,630,799.36 1.03% 2.24%
Turkey 2000 349,478.82 3,098,321.96 1.03% 3.01%
Turkey 2001 521,011.60 3,246,301.02 1.24% 3.25%
Turkey 2002 728,857.07 3,358,368.35 1.58% 3.15%
Turkey 2003 927,987.90 4,807,462.25 1.62% 3.60%
Turkey 2004 1,231,148.64 7,440,237.95 1.63% 4.10%
Turkey 2005 1,732,114.13 10,841,448.82 1.75% 4.49%
Turkey 2006 2,722,646.48 14,320,660.06 1.98% 4.75%
Turkey 2007 4,171,918.19 13,392,644.60 2.09% 3.80%
Turkey 2008 6,141,304.99 27,663,409.67 2.30% 5.91%
Turkey 2009 3,221,933.17 16,385,000.00 1.89% 5.43%
Turkey 2010 4,865,990.17 13,958,616.96 2.13% 3.52%
Turkey 2011 6,352,529.75 15,086,787.70 2.08% 2.92%
Turkey 2012 6,839,999.60 16,103,172.98 2.16% 3.07%
Turkey 2013 7,272,773.49 15,122,092.26 2.31% 2.87%
United Kingdom 1997 1,505,382.91 3,054,527.49 2.27% 3.56%
United Kingdom 1998 1,229,004.63 3,024,791.30 2.81% 4.19%
United Kingdom 1999 676,118.91 2,885,675.86 2.23% 3.96%
United Kingdom 2000 860,907.97 4,670,041.64 2.54% 4.53%
United Kingdom 2001 1,003,218.24 4,282,863.49 2.40% 4.29%
United Kingdom 2002 1,119,708.02 3,802,771.21 2.42% 3.56%
United Kingdom 2003 1,442,900.48 4,918,643.58 2.52% 3.68%
United Kingdom 2004 2,067,337.02 5,640,218.15 2.74% 3.11%
United Kingdom 2005 2,775,930.12 8,280,330.77 2.81% 3.43%
United Kingdom 2006 3,674,397.87 10,391,216.59 2.67% 3.45%
United Kingdom 2007 5,639,568.54 9,902,298.28 2.82% 2.81%
United Kingdom 2008 7,622,204.65 14,904,714.35 2.85% 3.18%
United Kingdom 2009 7,057,329.68 9,073,000.00 4.13% 3.01%
United Kingdom 2010 4,567,404.70 9,695,647.36 2.00% 2.44%
United Kingdom 2011 7,162,774.78 10,349,918.50 2.34% 2.00%
United Kingdom 2012 8,191,608.07 12,561,812.84 2.59% 2.39%
United Kingdom 2013 8,106,431.07 12,354,671.52 2.57% 2.34%
Kazakhstan 1997 2,743,425.28 2,471,911.17 4.14% 2.88%
Kazakhstan 1998 1,884,997.96 1,967,193.99 4.31% 2.72%
Kazakhstan 1999 1,397,504.05 1,225,554.73 4.61% 1.68%
Kazakhstan 2000 2,199,983.80 2,247,380.40 6.49% 2.18%
Kazakhstan 2001 2,017,737.96 2,778,015.49 4.82% 2.78%
Kazakhstan 2002 1,945,732.08 2,403,035.02 4.21% 2.25%
Kazakhstan 2003 2,473,843.64 3,280,689.15 4.31% 2.45%
Kazakhstan 2004 3,428,692.19 4,664,062.74 4.54% 2.57%
Kazakhstan 2005 3,224,708.69 6,533,853.09 3.27% 2.71%
Kazakhstan 2006 3,838,489.19 8,983,405.88 2.79% 2.98%
Kazakhstan 2007 4,600,518.67 11,548,752.71 2.30% 3.28%
47
Kazakhstan 2008 6,371,116.13 13,300,634.75 2.39% 2.84%
Kazakhstan 2009 3,685,000.00 9,147,000.00 2.16% 3.03%
Kazakhstan 2010 4,449,350.97 10,690,357.83 1.94% 2.69%
Kazakhstan 2011 6,912,746.13 14,173,690.41 2.26% 2.74%
Kazakhstan 2012 9,409,255.58 14,892,490.01 2.98% 2.84%
Kazakhstan 2013 5,664,930.62 17,218,175.41 1.80% 3.27%
France 1997 1,594,651.26 1,626,104.58 2.40% 1.89%
France 1998 1,597,736.32 1,456,016.25 3.66% 2.01%
France 1999 1,233,194.32 1,218,030.61 4.07% 1.67%
France 2000 1,187,780.61 1,913,696.88 3.51% 1.86%
France 2001 1,538,613.82 2,250,075.21 3.68% 2.25%
France 2002 1,897,097.36 2,658,767.17 4.11% 2.49%
France 2003 2,347,631.26 3,490,965.85 4.09% 2.61%
France 2004 3,073,356.14 4,424,658.28 4.07% 2.44%
France 2005 3,676,554.98 6,127,752.21 3.72% 2.54%
France 2006 5,866,449.31 7,623,848.66 4.26% 2.53%
France 2007 7,700,160.28 6,222,011.59 3.86% 1.77%
France 2008 10,066,091.52 12,282,139.22 3.77% 2.62%
France 2009 8,430,082.79 8,750,918.23 4.93% 2.90%
France 2010 8,206,799.87 9,321,757.86 3.59% 2.35%
France 2011 9,825,079.33 10,852,219.95 3.21% 2.10%
France 2012 13,806,116.30 7,420,066.39 4.37% 1.41%
France 2013 13,021,467.98 5,928,165.59 4.13% 1.12%
Finland 1997 1,873,650.94 2,774,004.22 2.82% 3.23%
Finland 1998 1,446,832.06 2,076,245.40 3.31% 2.87%
Finland 1999 947,424.07 2,413,977.77 3.13% 3.31%
Finland 2000 957,849.11 3,104,090.16 2.83% 3.01%
Finland 2001 1,284,863.97 3,113,236.69 3.07% 3.12%
Finland 2002 1,519,264.93 2,935,420.82 3.29% 2.75%
Finland 2003 1,853,956.79 4,319,457.28 3.23% 3.23%
Finland 2004 2,336,300.58 5,827,712.73 3.09% 3.21%
Finland 2005 3,099,845.07 7,651,056.23 3.14% 3.17%
Finland 2006 4,002,556.96 9,205,323.39 2.90% 3.05%
Finland 2007 5,025,128.49 9,997,260.31 2.52% 2.84%
Finland 2008 6,634,855.42 15,780,558.89 2.48% 3.37%
Finland 2009 3,953,175.76 9,159,000.00 2.31% 3.03%
Finland 2010 4,583,708.77 10,754,345.77 2.00% 2.71%
Finland 2011 5,670,314.05 11,700,751.52 1.85% 2.26%
Finland 2012 5,002,348.95 10,606,116.65 1.58% 2.02%
Finland 2013 5,395,510.73 12,014,042.11 1.71% 2.28%
EFTA 1997 938,447.16 3,956,739.28 1.41% 4.61%
EFTA 1998 628,757.44 3,400,005.09 1.44% 4.70%
EFTA 1999 437,555.35 3,613,670.66 1.44% 4.96%
EFTA 2000 440,538.63 4,106,795.37 1.30% 3.98%
EFTA 2001 604,152.61 2,563,427.10 1.44% 2.57%
EFTA 2002 720,110.14 5,646,242.10 1.56% 5.29%
EFTA 2003 869,957.94 6,138,083.73 1.52% 4.59%
EFTA 2004 1,143,463.57 8,127,994.82 1.51% 4.48%
EFTA 2005 1,667,791.46 11,473,538.38 1.69% 4.75%
EFTA 2006 2,486,557.49 12,816,159.85 1.80% 4.25%
EFTA 2007 2,787,016.09 14,514,916.24 1.40% 4.12%
EFTA 2008 3,656,123.90 11,440,134.05 1.37% 2.44%
EFTA 2009 3,142,986.98 7,275,482.25 1.84% 2.41%
EFTA 2010 3,965,340.55 9,363,601.52 1.73% 2.36%
EFTA 2011 5,068,358.78 10,011,149.17 1.66% 1.94%
48
EFTA 2012 5,010,395.68 11,399,049.85 1.58% 2.17%
EFTA 2013 4,957,737.89 9,481,358.23 1.57% 1.80%
Rep. of Korea 1997 837,051.14 835,342.59 1.26% 0.97%
Rep. of Korea 1998 1,009,600.70 508,127.19 2.31% 0.70%
Rep. of Korea 1999 316,624.21 826,176.77 1.05% 1.13%
Rep. of Korea 2000 358,825.23 972,070.62 1.06% 0.94%
Rep. of Korea 2001 726,497.77 1,108,094.72 1.74% 1.11%
Rep. of Korea 2002 930,045.75 1,271,152.33 2.01% 1.19%
Rep. of Korea 2003 1,330,636.01 1,323,617.51 2.32% 0.99%
Rep. of Korea 2004 2,026,251.43 1,963,345.00 2.68% 1.08%
Rep. of Korea 2005 4,005,290.30 2,359,156.33 4.06% 0.98%
Rep. of Korea 2006 6,780,459.30 2,606,727.43 4.92% 0.86%
Rep. of Korea 2007 8,838,285.74 6,089,829.83 4.43% 1.73%
Rep. of Korea 2008 10,521,138.82 7,787,222.93 3.94% 1.66%
Rep. of Korea 2009 4,867,899.48 5,689,000.00 2.85% 1.89%
Rep. of Korea 2010 7,281,531.77 10,407,938.18 3.18% 2.62%
Rep. of Korea 2011 11,575,681.80 13,329,720.58 3.78% 2.58%
Rep. of Korea 2012 10,976,879.22 13,865,478.84 3.47% 2.64%
Rep. of Korea 2013 10,305,436.13 14,867,070.24 3.27% 2.82%
Switzerland 1997 535,188.67 3,752,065.28 0.81% 4.37%
Switzerland 1998 442,044.23 3,256,026.53 1.01% 4.51%
Switzerland 1999 314,856.70 3,479,034.11 1.04% 4.77%
Switzerland 2000 279,634.41 3,976,663.64 0.83% 3.86%
Switzerland 2001 397,097.61 2,350,142.50 0.95% 2.35%
Switzerland 2002 421,817.94 5,362,494.39 0.91% 5.03%
Switzerland 2003 536,068.29 5,825,308.10 0.93% 4.36%
Switzerland 2004 651,326.12 7,724,118.72 0.86% 4.25%
Switzerland 2005 878,489.44 10,781,703.40 0.89% 4.47%
Switzerland 2006 1,296,741.71 12,093,012.19 0.94% 4.01%
Switzerland 2007 1,743,169.19 13,857,539.79 0.87% 3.93%
Switzerland 2008 2,392,119.23 10,302,830.26 0.90% 2.20%
Switzerland 2009 1,968,438.88 6,515,230.75 1.15% 2.16%
Switzerland 2010 2,426,513.10 8,596,660.10 1.06% 2.17%
Switzerland 2011 2,966,267.39 8,928,667.11 0.97% 1.73%
Switzerland 2012 3,039,163.43 10,457,368.80 0.96% 1.99%
Switzerland 2013 3,009,409.04 8,656,011.79 0.96% 1.64%
Hungary 1997 920,539.26 1,853,670.02 1.39% 2.16%
Hungary 1998 607,772.50 1,485,866.39 1.39% 2.06%
Hungary 1999 313,244.72 1,548,994.11 1.03% 2.13%
Hungary 2000 403,904.31 2,405,784.74 1.19% 2.33%
Hungary 2001 447,477.57 2,379,001.05 1.07% 2.38%
Hungary 2002 512,968.51 2,167,350.41 1.11% 2.03%
Hungary 2003 599,593.88 2,821,026.60 1.05% 2.11%
Hungary 2004 739,881.26 3,253,784.33 0.98% 1.79%
Hungary 2005 1,100,158.18 5,003,859.99 1.11% 2.07%
Hungary 2006 1,867,672.77 6,245,504.74 1.36% 2.07%
Hungary 2007 2,601,426.26 4,932,551.69 1.30% 1.40%
Hungary 2008 3,684,926.62 9,147,636.77 1.38% 1.95%
Hungary 2009 2,631,121.31 3,831,000.00 1.54% 1.27%
Hungary 2010 3,141,424.59 5,132,189.52 1.37% 1.29%
Hungary 2011 3,332,863.79 6,606,780.49 1.09% 1.28%
Hungary 2012 3,103,472.04 5,902,694.60 0.98% 1.12%
Hungary 2013 3,007,131.25 5,461,146.27 0.95% 1.04%
GAFTA 1997 130,370.11 1,112,198.09 0.20% 1.29%
GAFTA 1998 209,583.75 1,350,484.02 0.48% 1.87%

49
GAFTA 1999 152,091.55 1,471,978.05 0.50% 2.02%
GAFTA 2000 116,129.36 1,436,119.25 0.34% 1.39%
GAFTA 2001 101,916.65 1,852,370.64 0.24% 1.85%
GAFTA 2002 121,987.42 2,455,509.06 0.26% 2.30%
GAFTA 2003 164,166.05 2,058,608.36 0.29% 1.54%
GAFTA 2004 200,337.87 3,259,734.78 0.27% 1.80%
GAFTA 2005 373,066.08 4,079,477.93 0.38% 1.69%
GAFTA 2006 616,748.32 4,291,055.13 0.45% 1.42%
GAFTA 2007 680,958.92 6,083,903.35 0.34% 1.73%
GAFTA 2008 1,104,822.10 9,138,568.21 0.41% 1.95%
GAFTA 2009 772,137.82 7,056,832.23 0.45% 2.34%
GAFTA 2010 946,169.97 7,263,000.16 0.41% 1.83%
GAFTA 2011 1,574,178.63 11,175,484.82 0.51% 2.16%
GAFTA 2012 1,630,712.38 12,395,374.14 0.52% 2.36%
GAFTA 2013 1,938,980.84 10,327,351.83 0.62% 1.96%
MERCOSUR 1997 740,641.36 173,945.60 1.12% 0.20%
MERCOSUR 1998 833,440.13 257,978.37 1.91% 0.36%
MERCOSUR 1999 860,655.32 275,103.57 2.84% 0.38%
MERCOSUR 2000 537,461.69 320,905.69 1.59% 0.31%
MERCOSUR 2001 1,077,844.77 217,979.11 2.57% 0.22%
MERCOSUR 2002 1,558,409.99 316,389.82 3.37% 0.30%
MERCOSUR 2003 1,766,183.21 463,208.24 3.08% 0.35%
MERCOSUR 2004 1,810,542.42 522,845.41 2.40% 0.29%
MERCOSUR 2005 3,125,679.87 846,093.01 3.17% 0.35%
MERCOSUR 2006 4,452,508.73 1,357,812.31 3.23% 0.45%
MERCOSUR 2007 5,522,599.98 1,844,365.07 2.77% 0.52%
MERCOSUR 2008 6,584,656.76 3,820,649.49 2.47% 0.82%
MERCOSUR 2009 5,323,598.24 1,572,984.45 3.12% 0.52%
MERCOSUR 2010 5,765,885.70 2,102,210.21 2.52% 0.53%
MERCOSUR 2011 6,282,053.97 4,630,277.23 2.05% 0.90%
MERCOSUR 2012 5,895,389.75 4,770,757.80 1.86% 0.91%
MERCOSUR 2013 6,040,408.38 4,932,561.88 1.92% 0.94%
Belgium 1997 815,036.29 860,401.09 1.23% 1.00%
Belgium 1998 689,418.17 679,581.34 1.58% 0.94%
Belgium 1999 447,642.34 876,969.32 1.48% 1.20%
Belgium 2000 481,081.92 757,269.65 1.42% 0.73%
Belgium 2001 648,218.06 854,383.03 1.55% 0.86%
Belgium 2002 764,559.13 800,576.03 1.66% 0.75%
Belgium 2003 891,347.87 1,127,871.00 1.55% 0.84%
Belgium 2004 1,176,178.10 1,819,863.90 1.56% 1.00%
Belgium 2005 1,475,805.65 2,463,806.84 1.50% 1.02%
Belgium 2006 2,177,334.65 2,694,499.26 1.58% 0.89%
Belgium 2007 3,184,226.28 2,570,849.79 1.59% 0.73%
Belgium 2008 4,058,249.94 4,618,511.50 1.52% 0.99%
Belgium 2009 2,540,144.90 4,044,456.41 1.49% 1.34%
Belgium 2010 3,264,755.28 4,924,300.62 1.43% 1.24%
Belgium 2011 4,121,074.71 7,063,427.00 1.35% 1.37%
Belgium 2012 4,490,432.28 6,799,323.54 1.42% 1.30%
Belgium 2013 4,034,002.20 7,726,441.25 1.28% 1.47%
Czech Rep. 1997 585,761.60 1,822,214.78 0.88% 2.12%
Czech Rep. 1998 531,138.46 1,396,630.82 1.22% 1.93%
Czech Rep. 1999 343,491.79 1,324,945.03 1.13% 1.82%
Czech Rep. 2000 367,437.98 1,744,530.00 1.08% 1.69%
Czech Rep. 2001 467,200.12 1,669,481.12 1.12% 1.67%
Czech Rep. 2002 564,071.73 1,511,453.93 1.22% 1.42%

50
Czech Rep. 2003 712,468.90 1,941,232.15 1.24% 1.45%
Czech Rep. 2004 834,635.83 2,280,246.11 1.10% 1.26%
Czech Rep. 2005 988,668.88 3,817,197.05 1.00% 1.58%
Czech Rep. 2006 1,529,253.99 4,665,311.31 1.11% 1.55%
Czech Rep. 2007 2,449,692.25 3,209,233.47 1.23% 0.91%
Czech Rep. 2008 3,612,470.63 7,250,891.59 1.35% 1.55%
Czech Rep. 2009 2,317,000.00 4,435,000.00 1.36% 1.47%
Czech Rep. 2010 2,904,572.54 3,497,307.60 1.27% 0.88%
Czech Rep. 2011 4,472,913.99 4,113,938.18 1.46% 0.80%
Czech Rep. 2012 5,363,255.53 3,452,225.59 1.70% 0.66%
Czech Rep. 2013 5,317,724.13 4,320,995.75 1.69% 0.82%
Spain 1997 528,071.10 630,198.21 0.80% 0.73%
Spain 1998 411,986.67 553,063.76 0.94% 0.77%
Spain 1999 246,585.11 501,433.32 0.81% 0.69%
Spain 2000 313,148.99 1,067,622.93 0.92% 1.04%
Spain 2001 493,031.55 893,844.66 1.18% 0.90%
Spain 2002 578,320.36 1,099,054.57 1.25% 1.03%
Spain 2003 761,929.91 1,308,017.45 1.33% 0.98%
Spain 2004 878,979.63 1,747,874.32 1.16% 0.96%
Spain 2005 1,226,958.59 2,823,376.48 1.24% 1.17%
Spain 2006 1,951,518.08 3,344,844.35 1.42% 1.11%
Spain 2007 3,196,421.16 4,314,069.31 1.60% 1.22%
Spain 2008 4,242,984.57 5,060,891.80 1.59% 1.08%
Spain 2009 2,276,937.59 2,892,000.00 1.33% 0.96%
Spain 2010 3,040,630.83 4,047,244.78 1.33% 1.02%
Spain 2011 4,294,419.94 6,115,511.74 1.40% 1.18%
Spain 2012 4,913,996.53 5,721,424.80 1.55% 1.09%
Spain 2013 4,914,629.60 6,027,059.44 1.56% 1.14%
Sweden 1997 874,461.70 984,507.33 1.32% 1.15%
Sweden 1998 704,040.27 853,141.63 1.61% 1.18%
Sweden 1999 477,126.94 1,190,337.98 1.58% 1.63%
Sweden 2000 465,468.81 1,732,796.17 1.37% 1.68%
Sweden 2001 721,443.89 1,631,678.44 1.72% 1.63%
Sweden 2002 1,024,878.93 1,000,762.84 2.22% 0.94%
Sweden 2003 1,221,261.61 931,002.39 2.13% 0.70%
Sweden 2004 1,611,742.60 1,564,737.88 2.13% 0.86%
Sweden 2005 1,860,575.30 2,320,018.62 1.88% 0.96%
Sweden 2006 2,143,690.57 2,197,692.16 1.56% 0.73%
Sweden 2007 3,122,802.98 2,871,714.78 1.56% 0.82%
Sweden 2008 4,528,766.38 4,117,366.44 1.70% 0.88%
Sweden 2009 2,036,000.00 3,200,000.00 1.19% 1.06%
Sweden 2010 2,849,090.57 3,589,402.67 1.24% 0.90%
Sweden 2011 4,034,913.09 5,126,889.42 1.32% 0.99%
Sweden 2012 3,940,540.22 6,186,506.78 1.25% 1.18%
Sweden 2013 3,916,608.83 4,475,629.31 1.24% 0.85%
India 1997 801,217.22 917,651.97 1.21% 1.07%
India 1998 668,229.96 585,127.26 1.53% 0.81%
India 1999 677,188.84 1,177,240.40 2.24% 1.62%
India 2000 556,505.49 1,081,683.95 1.64% 1.05%
India 2001 545,528.70 1,120,423.43 1.30% 1.12%
India 2002 516,920.72 1,610,551.67 1.12% 1.51%
India 2003 584,718.03 2,735,372.66 1.02% 2.05%
India 2004 651,248.83 2,502,042.82 0.86% 1.38%
India 2005 784,394.11 2,314,004.31 0.79% 0.96%
India 2006 967,493.85 2,925,514.39 0.70% 0.97%

51
India 2007 1,309,034.65 3,033,605.64 0.66% 0.86%
India 2008 1,714,050.90 5,231,012.02 0.64% 1.12%
India 2009 1,524,454.88 5,937,000.00 0.89% 1.97%
India 2010 2,143,334.81 5,406,299.08 0.94% 1.36%
India 2011 2,760,554.17 4,665,703.62 0.90% 0.90%
India 2012 3,041,318.03 7,566,692.51 0.96% 1.44%
India 2013 3,091,180.11 6,982,660.21 0.98% 1.32%
Slovakia 1997 284,781.60 1,741,214.85 0.43% 2.03%
Slovakia 1998 193,279.92 1,373,279.73 0.44% 1.90%
Slovakia 1999 106,279.96 1,428,258.04 0.35% 1.96%
Slovakia 2000 104,752.04 2,121,980.57 0.31% 2.06%
Slovakia 2001 132,264.76 2,205,366.65 0.32% 2.21%
Slovakia 2002 158,802.12 2,032,192.22 0.34% 1.90%
Slovakia 2003 301,371.24 2,296,985.30 0.53% 1.72%
Slovakia 2004 404,999.15 2,422,761.73 0.54% 1.33%
Slovakia 2005 502,461.84 3,189,616.64 0.51% 1.32%
Slovakia 2006 769,613.44 4,586,653.47 0.56% 1.52%
Slovakia 2007 1,410,709.58 3,892,861.50 0.71% 1.11%
Slovakia 2008 2,994,856.37 6,466,687.78 1.12% 1.38%
Slovakia 2009 1,808,297.65 2,981,000.00 1.06% 0.99%
Slovakia 2010 2,492,253.48 3,493,948.01 1.09% 0.88%
Slovakia 2011 2,958,022.69 5,655,092.83 0.97% 1.09%
Slovakia 2012 3,714,942.12 5,101,258.26 1.17% 0.97%
Slovakia 2013 3,533,690.44 5,166,048.79 1.12% 0.98%
Latvia 1997 308,107.68 1,228,508.03 0.46% 1.43%
Latvia 1998 232,661.78 681,890.41 0.53% 0.94%
Latvia 1999 97,560.16 981,389.45 0.32% 1.35%
Latvia 2000 90,662.65 1,625,736.92 0.27% 1.58%
Latvia 2001 121,261.18 918,289.21 0.29% 0.92%
Latvia 2002 151,333.80 698,710.50 0.33% 0.65%
Latvia 2003 181,426.47 1,058,987.30 0.32% 0.79%
Latvia 2004 212,404.55 1,352,766.59 0.28% 0.74%
Latvia 2005 340,239.27 1,188,327.81 0.34% 0.49%
Latvia 2006 387,381.77 1,698,423.75 0.28% 0.56%
Latvia 2007 505,540.43 2,395,356.78 0.25% 0.68%
Latvia 2008 593,361.17 7,896,595.29 0.22% 1.69%
Latvia 2009 396,693.34 3,642,123.05 0.23% 1.21%
Latvia 2010 666,789.06 5,536,945.46 0.29% 1.39%
Latvia 2011 675,399.67 6,811,112.87 0.22% 1.32%
Latvia 2012 711,400.06 8,242,025.29 0.22% 1.57%
Latvia 2013 802,769.73 9,836,415.93 0.25% 1.87%
Lithuania 1997 459,932.48 1,337,220.74 0.69% 1.56%
Lithuania 1998 326,284.83 1,053,569.18 0.75% 1.46%
Lithuania 1999 126,262.22 1,162,912.21 0.42% 1.60%
Lithuania 2000 149,239.81 2,067,917.70 0.44% 2.01%
Lithuania 2001 211,357.96 1,694,753.10 0.50% 1.70%
Lithuania 2002 311,234.27 1,695,388.24 0.67% 1.59%
Lithuania 2003 409,077.43 2,165,280.59 0.71% 1.62%
Lithuania 2004 459,539.89 2,926,123.26 0.61% 1.61%
Lithuania 2005 568,940.28 4,002,378.64 0.58% 1.66%
Lithuania 2006 702,890.00 4,209,561.91 0.51% 1.40%
Lithuania 2007 848,939.34 3,372,443.65 0.43% 0.96%
Lithuania 2008 940,684.39 4,540,150.75 0.35% 0.97%
Lithuania 2009 841,261.67 2,609,649.01 0.49% 0.86%
Lithuania 2010 956,102.44 2,256,180.16 0.42% 0.57%
52
Lithuania 2011 1,208,133.57 5,798,687.00 0.39% 1.12%
Lithuania 2012 1,250,012.97 3,870,997.37 0.40% 0.74%
Lithuania 2013 1,117,294.59 4,878,831.22 0.35% 0.93%
Brazil 1997 466,613.57 146,329.76 0.70% 0.17%
Brazil 1998 654,355.83 177,189.92 1.50% 0.25%
Brazil 1999 717,344.04 194,267.99 2.37% 0.27%
Brazil 2000 387,584.49 258,559.74 1.14% 0.25%
Brazil 2001 923,148.36 191,162.30 2.21% 0.19%
Brazil 2002 1,304,093.05 229,980.37 2.82% 0.22%
Brazil 2003 1,478,927.68 256,847.66 2.58% 0.19%
Brazil 2004 1,369,507.66 368,603.16 1.81% 0.20%
Brazil 2005 2,345,735.09 605,633.98 2.38% 0.25%
Brazil 2006 2,986,578.64 725,851.58 2.17% 0.24%
Brazil 2007 4,107,829.11 1,129,761.15 2.06% 0.32%
Brazil 2008 4,670,669.65 2,040,699.23 1.75% 0.44%
Brazil 2009 3,510,000.00 1,083,000.00 2.05% 0.36%
Brazil 2010 4,067,239.40 1,722,940.97 1.78% 0.43%
Brazil 2011 4,377,977.65 2,102,530.02 1.43% 0.41%
Brazil 2012 3,358,765.13 2,304,866.50 1.06% 0.44%
Brazil 2013 3,492,845.08 1,984,660.46 1.11% 0.38%
Austria 1997 708,283.65 734,790.46 1.07% 0.86%
Austria 1998 511,654.02 584,015.36 1.17% 0.81%
Austria 1999 402,376.60 583,100.01 1.33% 0.80%
Austria 2000 419,366.86 758,237.71 1.24% 0.74%
Austria 2001 542,997.25 722,030.66 1.30% 0.72%
Austria 2002 607,214.48 728,405.93 1.31% 0.68%
Austria 2003 790,403.30 1,030,360.11 1.38% 0.77%
Austria 2004 918,482.35 1,114,683.97 1.22% 0.61%
Austria 2005 1,210,479.33 2,352,749.87 1.23% 0.97%
Austria 2006 1,844,177.37 3,352,462.55 1.34% 1.11%
Austria 2007 2,457,135.88 1,567,119.21 1.23% 0.44%
Austria 2008 3,114,553.32 2,304,031.19 1.17% 0.49%
Austria 2009 2,058,876.51 1,624,647.99 1.21% 0.54%
Austria 2010 2,459,699.77 158,284.56 1.07% 0.04%
Austria 2011 3,092,502.90 276,780.12 1.01% 0.05%
Austria 2012 3,392,993.52 307,475.66 1.07% 0.06%
Austria 2013 3,845,967.18 278,775.08 1.22% 0.05%
Cyprus 1997 67,713.38 630,908.29 0.10% 0.73%
Cyprus 1998 27,081.63 379,803.52 0.06% 0.53%
Cyprus 1999 15,168.64 170,493.51 0.05% 0.23%
Cyprus 2000 35,454.89 1,722,390.40 0.10% 1.67%
Cyprus 2001 28,713.29 1,515,460.00 0.07% 1.52%
Cyprus 2002 13,878.35 1,564,022.40 0.03% 1.47%
Cyprus 2003 13,913.72 4,491,124.18 0.02% 3.36%
Cyprus 2004 22,363.13 5,710,312.84 0.03% 3.14%
Cyprus 2005 47,454.56 5,095,328.77 0.05% 2.11%
Cyprus 2006 42,886.32 4,530,580.27 0.03% 1.50%
Cyprus 2007 34,446.04 4,836,471.96 0.02% 1.37%
Cyprus 2008 52,237.33 1,253,745.08 0.02% 0.27%
Cyprus 2009 22,800.00 792,000.00 0.01% 0.26%
Cyprus 2010 27,020.95 1,640,681.83 0.01% 0.41%
Cyprus 2011 37,035.83 1,375,255.62 0.01% 0.27%
Cyprus 2012 32,682.07 2,067,068.07 0.01% 0.39%
Cyprus 2013 42,672.63 1,923,269.31 0.01% 0.36%
Greece 1997 183,801.36 201,536.05 0.28% 0.23%

53
Greece 1998 126,814.58 365,286.66 0.29% 0.51%
Greece 1999 121,686.01 613,546.24 0.40% 0.84%
Greece 2000 124,988.58 1,272,945.88 0.37% 1.23%
Greece 2001 144,174.40 1,041,317.36 0.34% 1.04%
Greece 2002 170,864.73 957,009.12 0.37% 0.90%
Greece 2003 142,067.94 948,050.56 0.25% 0.71%
Greece 2004 167,198.38 1,262,167.56 0.22% 0.70%
Greece 2005 188,276.23 1,929,944.70 0.19% 0.80%
Greece 2006 239,208.33 2,756,742.37 0.17% 0.91%
Greece 2007 311,369.49 1,947,989.32 0.16% 0.55%
Greece 2008 438,945.94 4,325,743.54 0.16% 0.92%
Greece 2009 342,000.00 2,290,000.00 0.20% 0.76%
Greece 2010 421,158.85 2,097,816.54 0.18% 0.53%
Greece 2011 583,587.91 3,485,643.66 0.19% 0.67%
Greece 2012 632,992.84 4,744,170.26 0.20% 0.90%
Greece 2013 611,301.29 5,014,364.87 0.19% 0.95%
Romania 1997 202,021.15 739,596.80 0.30% 0.86%
Romania 1998 91,562.98 565,554.25 0.21% 0.78%
Romania 1999 48,585.85 403,678.23 0.16% 0.55%
Romania 2000 79,386.97 921,058.46 0.23% 0.89%
Romania 2001 90,955.19 795,690.24 0.22% 0.80%
Romania 2002 61,847.72 987,909.73 0.13% 0.93%
Romania 2003 68,707.83 1,292,805.39 0.12% 0.97%
Romania 2004 130,987.74 1,818,627.84 0.17% 1.00%
Romania 2005 255,347.08 3,043,065.61 0.26% 1.26%
Romania 2006 540,415.22 3,271,814.67 0.39% 1.08%
Romania 2007 730,806.03 2,366,864.64 0.37% 0.67%
Romania 2008 1,018,552.56 4,165,270.98 0.38% 0.89%
Romania 2009 876,251.93 1,558,000.00 0.51% 0.52%
Romania 2010 1,345,405.71 1,754,187.05 0.59% 0.44%
Romania 2011 1,724,185.74 1,406,971.97 0.56% 0.27%
Romania 2012 1,735,738.78 1,832,512.96 0.55% 0.35%
Romania 2013 2,046,592.18 1,602,940.13 0.65% 0.30%
Bulgaria 1997 260,592.03 914,037.57 0.39% 1.06%
Bulgaria 1998 165,634.29 598,242.73 0.38% 0.83%
Bulgaria 1999 108,113.05 478,992.16 0.36% 0.66%
Bulgaria 2000 115,790.11 584,603.68 0.34% 0.57%
Bulgaria 2001 138,982.96 511,829.79 0.33% 0.51%
Bulgaria 2002 135,839.44 532,509.70 0.29% 0.50%
Bulgaria 2003 162,330.89 619,011.66 0.28% 0.46%
Bulgaria 2004 201,093.34 1,062,011.53 0.27% 0.58%
Bulgaria 2005 241,065.23 1,900,136.61 0.24% 0.79%
Bulgaria 2006 331,655.29 2,966,047.16 0.24% 0.98%
Bulgaria 2007 414,791.82 3,279,469.64 0.21% 0.93%
Bulgaria 2008 639,297.36 4,778,784.84 0.24% 1.02%
Bulgaria 2009 423,645.06 2,188,000.00 0.25% 0.72%
Bulgaria 2010 539,885.87 3,301,818.86 0.24% 0.83%
Bulgaria 2011 689,049.90 3,311,320.14 0.23% 0.64%
Bulgaria 2012 694,030.64 4,228,620.85 0.22% 0.81%
Bulgaria 2013 702,197.27 1,774,528.53 0.22% 0.34%
Uzbekistan 1997 1,015,250.82 874,548.35 1.53% 1.02%
Uzbekistan 1998 537,392.29 563,831.80 1.23% 0.78%
Uzbekistan 1999 467,571.01 240,281.18 1.54% 0.33%
Uzbekistan 2000 663,395.66 274,418.85 1.96% 0.27%
Uzbekistan 2001 584,169.42 409,102.73 1.40% 0.41%

54
Uzbekistan 2002 344,167.66 453,420.79 0.75% 0.42%
Uzbekistan 2003 485,042.51 511,982.42 0.85% 0.38%
Uzbekistan 2004 613,352.41 766,636.71 0.81% 0.42%
Uzbekistan 2005 904,022.95 860,872.37 0.92% 0.36%
Uzbekistan 2006 1,290,420.31 1,086,946.32 0.94% 0.36%
Uzbekistan 2007 1,459,557.05 1,722,262.57 0.73% 0.49%
Uzbekistan 2008 1,298,016.85 2,066,915.64 0.49% 0.44%
Uzbekistan 2009 846,344.21 1,697,000.00 0.50% 0.56%
Uzbekistan 2010 1,513,472.15 1,663,521.40 0.66% 0.42%
Uzbekistan 2011 1,756,215.45 1,983,084.30 0.57% 0.38%
Uzbekistan 2012 1,390,799.23 2,324,711.20 0.44% 0.44%
Uzbekistan 2013 1,256,885.43 2,803,910.15 0.40% 0.53%
Other Asia, nes 1997 121,880.10 289,114.27 0.18% 0.34%
Other Asia, nes 1998 74,996.20 142,653.74 0.17% 0.20%
Other Asia, nes 1999 52,566.06 273,154.82 0.17% 0.37%
Other Asia, nes 2000 88,778.25 403,803.55 0.26% 0.39%
Other Asia, nes 2001 165,531.28 257,927.81 0.40% 0.26%
Other Asia, nes 2002 208,680.51 463,428.47 0.45% 0.43%
Other Asia, nes 2003 261,999.10 836,559.80 0.46% 0.63%
Other Asia, nes 2004 343,054.53 1,986,822.96 0.45% 1.09%
Other Asia, nes 2005 492,369.47 1,437,660.99 0.50% 0.60%
Other Asia, nes 2006 757,070.47 931,105.46 0.55% 0.31%
Other Asia, nes 2007 1,215,274.85 897,038.61 0.61% 0.25%
Other Asia, nes 2008 1,824,831.02 1,036,535.31 0.68% 0.22%
Other Asia, nes 2009 921,489.74 792,000.00 0.54% 0.26%
Other Asia, nes 2010 1,532,099.77 1,796,255.18 0.67% 0.45%
Other Asia, nes 2011 2,037,103.84 2,077,055.57 0.67% 0.40%
Other Asia, nes 2012 2,007,817.99 3,326,933.79 0.63% 0.63%
Other Asia, nes 2013 1,915,059.73 4,443,361.79 0.61% 0.84%
Estonia 1997 259,654.26 559,366.46 0.39% 0.65%
Estonia 1998 152,455.94 516,265.96 0.35% 0.71%
Estonia 1999 75,873.38 691,623.30 0.25% 0.95%
Estonia 2000 96,776.30 1,237,409.26 0.29% 1.20%
Estonia 2001 104,414.48 1,210,464.00 0.25% 1.21%
Estonia 2002 104,213.10 1,689,957.92 0.23% 1.58%
Estonia 2003 129,998.69 1,404,962.10 0.23% 1.05%
Estonia 2004 180,635.84 1,571,550.51 0.24% 0.87%
Estonia 2005 245,302.40 2,114,335.01 0.25% 0.88%
Estonia 2006 325,615.47 2,707,551.41 0.24% 0.90%
Estonia 2007 376,899.09 1,469,001.04 0.19% 0.42%
Estonia 2008 521,452.51 954,484.94 0.20% 0.20%
Estonia 2009 387,663.41 890,383.23 0.23% 0.30%
Estonia 2010 555,092.42 1,543,179.25 0.24% 0.39%
Estonia 2011 990,378.04 2,611,710.39 0.32% 0.51%
Estonia 2012 771,681.32 3,473,698.21 0.24% 0.66%
Estonia 2013 788,005.48 3,747,109.74 0.25% 0.71%
Denmark 1997 584,748.29 166,556.03 0.88% 0.19%
Denmark 1998 510,895.02 132,036.41 1.17% 0.18%
Denmark 1999 359,064.36 219,053.29 1.19% 0.30%
Denmark 2000 346,098.23 424,168.45 1.02% 0.41%
Denmark 2001 500,101.38 272,745.55 1.19% 0.27%
Denmark 2002 513,721.69 416,639.47 1.11% 0.39%
Denmark 2003 611,375.11 217,249.17 1.07% 0.16%
Denmark 2004 716,928.39 517,393.13 0.95% 0.28%
Denmark 2005 921,190.52 724,855.84 0.93% 0.30%

55
Denmark 2006 1,346,961.40 932,010.37 0.98% 0.31%
Denmark 2007 1,595,375.28 1,082,932.70 0.80% 0.31%
Denmark 2008 1,826,545.64 1,851,963.47 0.68% 0.40%
Denmark 2009 1,373,199.23 1,796,000.00 0.80% 0.60%
Denmark 2010 1,702,731.75 1,564,331.07 0.74% 0.39%
Denmark 2011 2,053,342.08 1,871,480.58 0.67% 0.36%
Denmark 2012 2,043,026.87 1,714,776.55 0.65% 0.33%
Denmark 2013 2,178,374.66 1,351,822.53 0.69% 0.26%
Iran 1997 71,420.90 461,419.87 0.11% 0.54%
Iran 1998 28,200.71 518,746.89 0.06% 0.72%
Iran 1999 69,578.42 416,675.52 0.23% 0.57%
Iran 2000 53,632.70 633,289.87 0.16% 0.61%
Iran 2001 34,514.74 903,970.24 0.08% 0.91%
Iran 2002 50,885.46 757,053.96 0.11% 0.71%
Iran 2003 63,005.90 1,312,556.46 0.11% 0.98%
Iran 2004 103,181.58 1,911,503.80 0.14% 1.05%
Iran 2005 124,836.07 1,921,625.33 0.13% 0.80%
Iran 2006 238,045.39 1,903,647.29 0.17% 0.63%
Iran 2007 348,912.83 2,924,443.54 0.17% 0.83%
Iran 2008 401,465.98 3,291,208.97 0.15% 0.70%
Iran 2009 214,000.00 2,846,000.00 0.13% 0.94%
Iran 2010 271,637.13 3,359,045.63 0.12% 0.85%
Iran 2011 351,439.42 3,277,139.82 0.11% 0.63%
Iran 2012 428,460.45 1,900,386.60 0.14% 0.36%
Iran 2013 432,920.97 1,168,616.10 0.14% 0.22%
Israel 1997 183,718.93 426,747.10 0.28% 0.50%
Israel 1998 144,969.49 493,919.95 0.33% 0.68%
Israel 1999 70,912.95 556,429.42 0.23% 0.76%
Israel 2000 109,213.70 1,045,018.65 0.32% 1.01%
Israel 2001 131,328.49 945,246.16 0.31% 0.95%
Israel 2002 159,808.92 1,095,293.84 0.35% 1.03%
Israel 2003 207,221.57 1,454,073.00 0.36% 1.09%
Israel 2004 208,799.49 1,437,284.78 0.28% 0.79%
Israel 2005 331,876.16 1,537,637.36 0.34% 0.64%
Israel 2006 408,151.81 1,551,272.75 0.30% 0.51%
Israel 2007 529,804.76 1,512,354.01 0.27% 0.43%
Israel 2008 734,448.41 2,034,068.06 0.28% 0.43%
Israel 2009 636,251.78 1,047,000.00 0.37% 0.35%
Israel 2010 773,457.16 1,683,038.85 0.34% 0.42%
Israel 2011 1,083,962.52 1,307,388.45 0.35% 0.25%
Israel 2012 1,285,593.45 1,631,093.53 0.41% 0.31%
Israel 2013 1,492,853.63 2,084,818.13 0.47% 0.40%
Br. Virgin Isds 1997 18,412.75 789,260.67 0.03% 0.92%
Br. Virgin Isds 1998 4,045.49 1,131,652.48 0.01% 1.57%
Br. Virgin Isds 1999 144.47 1,751,800.98 0.00% 2.40%
Br. Virgin Isds 2000 318.73 3,326,115.38 0.00% 3.23%
Br. Virgin Isds 2001 830.35 3,006,386.92 0.00% 3.01%
Br. Virgin Isds 2002 1,066.76 2,552,826.36 0.00% 2.39%
Br. Virgin Isds 2003 1,089.27 2,512,335.03 0.00% 1.88%
Br. Virgin Isds 2004 58.57 1,800,275.73 0.00% 0.99%
Br. Virgin Isds 2005 3.69 2,778,281.35 0.00% 1.15%
Br. Virgin Isds 2006 1,483.92 2,116,220.77 0.00% 0.70%
Br. Virgin Isds 2007 3,529.10 1,678,991.12 0.00% 0.48%
Br. Virgin Isds 2008 242.38 391,632.79 0.00% 0.08%
Br. Virgin Isds 2009 2,091.64 80,319.92 0.00% 0.03%

56
Br. Virgin Isds 2010 2,531.56 95,851.64 0.00% 0.02%
Br. Virgin Isds 2011 42.46 219,549.96 0.00% 0.04%
Br. Virgin Isds 2012 773.68 206,319.04 0.00% 0.04%
Br. Virgin Isds 2013 1,906.59 134,211.38 0.00% 0.03%
Egypt 1997 34,177.46 438,800.99 0.05% 0.51%
Egypt 1998 16,460.56 399,793.55 0.04% 0.55%
Egypt 1999 69,303.62 482,177.35 0.23% 0.66%
Egypt 2000 4,910.28 449,086.86 0.01% 0.44%
Egypt 2001 12,019.15 446,705.83 0.03% 0.45%
Egypt 2002 21,513.32 492,255.13 0.05% 0.46%
Egypt 2003 38,682.32 376,152.40 0.07% 0.28%
Egypt 2004 59,995.71 774,178.51 0.08% 0.43%
Egypt 2005 77,352.10 1,048,474.79 0.08% 0.43%
Egypt 2006 131,721.75 1,241,411.11 0.10% 0.41%
Egypt 2007 173,167.64 1,860,503.90 0.09% 0.53%
Egypt 2008 208,244.08 1,922,689.76 0.08% 0.41%
Egypt 2009 212,201.16 1,824,000.00 0.12% 0.60%
Egypt 2010 271,228.61 1,757,762.53 0.12% 0.44%
Egypt 2011 483,192.97 2,335,342.68 0.16% 0.45%
Egypt 2012 342,730.69 3,212,235.90 0.11% 0.61%
Egypt 2013 442,100.09 2,503,412.47 0.14% 0.47%
Thailand 1997 105,112.73 148,408.24 0.16% 0.17%
Thailand 1998 61,211.24 31,888.10 0.14% 0.04%
Thailand 1999 97,996.02 65,101.28 0.32% 0.09%
Thailand 2000 89,793.65 80,221.74 0.27% 0.08%
Thailand 2001 107,109.17 71,378.32 0.26% 0.07%
Thailand 2002 227,300.90 96,020.89 0.49% 0.09%
Thailand 2003 301,735.09 130,412.92 0.53% 0.10%
Thailand 2004 355,260.41 372,490.97 0.47% 0.21%
Thailand 2005 451,830.93 546,673.52 0.46% 0.23%
Thailand 2006 559,605.16 347,109.25 0.41% 0.12%
Thailand 2007 1,004,303.57 327,110.32 0.50% 0.09%
Thailand 2008 1,497,094.45 1,232,191.81 0.56% 0.26%
Thailand 2009 931,949.06 439,244.60 0.55% 0.15%
Thailand 2010 1,370,021.51 1,536,093.59 0.60% 0.39%
Thailand 2011 1,937,489.54 2,097,781.88 0.63% 0.41%
Thailand 2012 1,970,951.24 1,411,425.54 0.62% 0.27%
Thailand 2013 2,084,099.80 1,272,942.93 0.66% 0.24%
Azerbaijan 1997 260,219.10 219,571.47 0.39% 0.26%
Azerbaijan 1998 173,183.15 149,479.64 0.40% 0.21%
Azerbaijan 1999 99,681.09 114,751.90 0.33% 0.16%
Azerbaijan 2000 135,392.43 136,160.53 0.40% 0.13%
Azerbaijan 2001 81,081.38 133,296.27 0.19% 0.13%
Azerbaijan 2002 86,767.30 277,305.37 0.19% 0.26%
Azerbaijan 2003 93,146.97 409,558.81 0.16% 0.31%
Azerbaijan 2004 139,355.41 621,119.66 0.18% 0.34%
Azerbaijan 2005 206,407.81 857,775.35 0.21% 0.36%
Azerbaijan 2006 259,591.44 1,380,585.68 0.19% 0.46%
Azerbaijan 2007 325,902.49 1,371,252.86 0.16% 0.39%
Azerbaijan 2008 411,501.81 1,987,534.27 0.15% 0.42%
Azerbaijan 2009 311,000.00 1,468,000.00 0.18% 0.49%
Azerbaijan 2010 385,864.64 1,476,944.26 0.17% 0.37%
Azerbaijan 2011 571,131.66 2,196,399.42 0.19% 0.42%
Azerbaijan 2012 563,599.97 2,845,713.04 0.18% 0.54%
Azerbaijan 2013 635,868.93 2,942,532.16 0.20% 0.56%

57
Norway 1997 374,829.86 191,711.33 0.57% 0.22%
Norway 1998 164,153.56 135,333.40 0.38% 0.19%
Norway 1999 118,002.41 131,803.29 0.39% 0.18%
Norway 2000 154,418.09 126,656.69 0.46% 0.12%
Norway 2001 199,502.62 205,571.96 0.48% 0.21%
Norway 2002 289,194.30 282,980.28 0.63% 0.27%
Norway 2003 323,300.99 309,564.10 0.56% 0.23%
Norway 2004 464,388.29 401,556.85 0.61% 0.22%
Norway 2005 749,636.16 684,041.23 0.76% 0.28%
Norway 2006 1,112,357.61 715,114.76 0.81% 0.24%
Norway 2007 977,101.63 611,272.80 0.49% 0.17%
Norway 2008 1,183,289.75 1,122,004.65 0.44% 0.24%
Norway 2009 1,120,608.54 756,370.25 0.66% 0.25%
Norway 2010 1,416,246.90 754,909.02 0.62% 0.19%
Norway 2011 1,904,801.49 1,071,698.33 0.62% 0.21%
Norway 2012 1,790,569.34 910,414.30 0.57% 0.17%
Norway 2013 1,753,351.19 809,300.38 0.56% 0.15%
Viet Nam 1997 39,102.60 314,936.61 0.06% 0.37%
Viet Nam 1998 56,907.25 253,179.20 0.13% 0.35%
Viet Nam 1999 20,030.06 163,757.10 0.07% 0.22%
Viet Nam 2000 36,759.49 167,963.35 0.11% 0.16%
Viet Nam 2001 80,017.88 162,847.11 0.19% 0.16%
Viet Nam 2002 81,415.73 321,411.26 0.18% 0.30%
Viet Nam 2003 77,089.61 357,198.09 0.13% 0.27%
Viet Nam 2004 100,536.55 707,485.54 0.13% 0.39%
Viet Nam 2005 174,080.68 738,799.92 0.18% 0.31%
Viet Nam 2006 349,745.77 303,629.92 0.25% 0.10%
Viet Nam 2007 522,146.34 484,773.94 0.26% 0.14%
Viet Nam 2008 851,020.52 580,913.77 0.32% 0.12%
Viet Nam 2009 693,461.73 869,000.00 0.41% 0.29%
Viet Nam 2010 1,110,810.58 1,120,828.30 0.49% 0.28%
Viet Nam 2011 1,722,183.03 1,010,145.95 0.56% 0.20%
Viet Nam 2012 2,273,413.06 1,388,592.01 0.72% 0.26%
Viet Nam 2013 2,596,994.75 1,373,461.30 0.82% 0.26%
Canada 1997 333,826.72 134,939.90 0.50% 0.16%
Canada 1998 212,775.69 140,317.06 0.49% 0.19%
Canada 1999 166,233.49 115,546.10 0.55% 0.16%
Canada 2000 192,811.16 88,904.77 0.57% 0.09%
Canada 2001 236,590.83 59,740.03 0.57% 0.06%
Canada 2002 224,260.84 85,032.61 0.49% 0.08%
Canada 2003 300,502.18 265,724.92 0.52% 0.20%
Canada 2004 334,581.17 500,445.92 0.44% 0.28%
Canada 2005 516,482.20 200,426.52 0.52% 0.08%
Canada 2006 902,373.01 362,344.84 0.65% 0.12%
Canada 2007 1,220,170.60 332,389.55 0.61% 0.09%
Canada 2008 1,630,472.50 939,836.08 0.61% 0.20%
Canada 2009 1,215,141.34 489,000.00 0.71% 0.16%
Canada 2010 1,212,589.27 768,957.24 0.53% 0.19%
Canada 2011 1,683,606.92 536,750.67 0.55% 0.10%
Canada 2012 2,473,199.71 345,254.97 0.78% 0.07%
Canada 2013 1,795,854.68 471,420.57 0.57% 0.09%
Source: Comtrade via TradeSift (HS 1996 Total Trade)

58
Annex V: Palestine’s top trade partners 1996-2013
Partner Year Imports Value
(‘000s USD)
Exports Value
(‘000s USD) Imports share Exports share
World 1996 2,016,279.00 339,467.00 100.00% 100.00%
World 1997 2,238,560.00 380,423.00 100.00% 100.00%
World 1998 2,375,102.00 394,846.00 100.00% 100.00%
World 1999 3,007,227.00 372,148.00 100.00% 100.00%
World 2000 2,382,807.00 400,857.00 100.00% 100.00%
World 2001 2,033,647.00 290,349.00 100.00% 100.00%
World 2002 1,515,608.00 240,867.00 100.00% 100.00%
World 2003 1,800,268.00 279,680.00 100.00% 100.00%
World 2004 2,373,248.00 312,688.00 100.00% 100.00%
World 2005 2,667,592.00 335,443.00 100.00% 100.00%
World 2006 2,758,726.00 366,706.00 100.00% 100.00%
World 2007 3,141,279.29 512,982.82 100.00% 100.00%
World 2008 3,568,673.59 558,446.00 100.00% 100.00%
World 2009 3,600,785.37 518,355.48 100.00% 100.00%
World 2010 3,958,511.52 575,512.92 100.00% 100.00%
World 2011 4,221,105.70 719,588.97 100.00% 100.00%
World 2012 4,697,355.94 782,368.75 100.00% 100.00%
World 2013 5,163,897.46 900,617.86 100.00% 100.00%
Israel 1996 1,743,190.13 319,247.24 86.46% 94.04%
Israel 1997 1,852,943.48 360,250.78 82.77% 94.70%
Israel 1998 1,833,651.79 381,443.35 77.20% 96.61%
Israel 1999 1,857,229.43 360,426.99 61.76% 96.85%
Israel 2000 1,740,704.61 369,680.10 73.05% 92.22%
Israel 2001 1,352,896.73 273,109.09 66.53% 94.06%
Israel 2002 1,118,157.71 216,325.73 73.78% 89.81%
Israel 2003 1,309,641.90 256,018.62 72.75% 91.54%
Israel 2004 1,747,850.12 281,148.77 73.65% 89.91%
Israel 2005 1,873,700.41 290,558.19 70.24% 86.62%
Israel 2006 2,002,150.28 326,567.64 72.58% 89.05%
Israel 2007 2,307,935.29 455,231.68 73.47% 88.74%
Israel 2008 2,767,714.18 499,422.97 77.56% 89.43%
Israel 2009 2,651,128.87 453,494.35 73.63% 87.49%
Israel 2010 2,873,497.68 488,395.42 72.59% 84.86%
Israel 2011 2,938,379.64 617,781.53 69.61% 85.85%
Israel 2012 3,350,424.82 639,180.36 71.33% 81.70%
Israel 2013 3,694,820.63 785,110.86 71.55% 87.17%
EU 1996 155,743.94 244.14 7.72% 0.07%
EU 1997 188,825.10 915.15 8.44% 0.24%
EU 1998 233,608.42 1,649.95 9.84% 0.42%
EU 1999 498,001.40 1,526.16 16.56% 0.41%
EU 2000 272,589.97 1,708.87 11.44% 0.43%
EU 2001 374,485.22 2,480.65 18.41% 0.85%
EU 2002 179,737.18 8,921.95 11.86% 3.70%
EU 2003 161,285.31 7,073.67 8.96% 2.53%
EU 2004 215,814.95 7,058.54 9.09% 2.26%
EU 2005 252,291.91 11,556.07 9.46% 3.45%
EU 2006 227,589.51 2,640.60 8.25% 0.72%
EU 2007 250,863.57 18,078.26 7.99% 3.52%
EU 2008 289,237.77 8,121.22 8.10% 1.45%
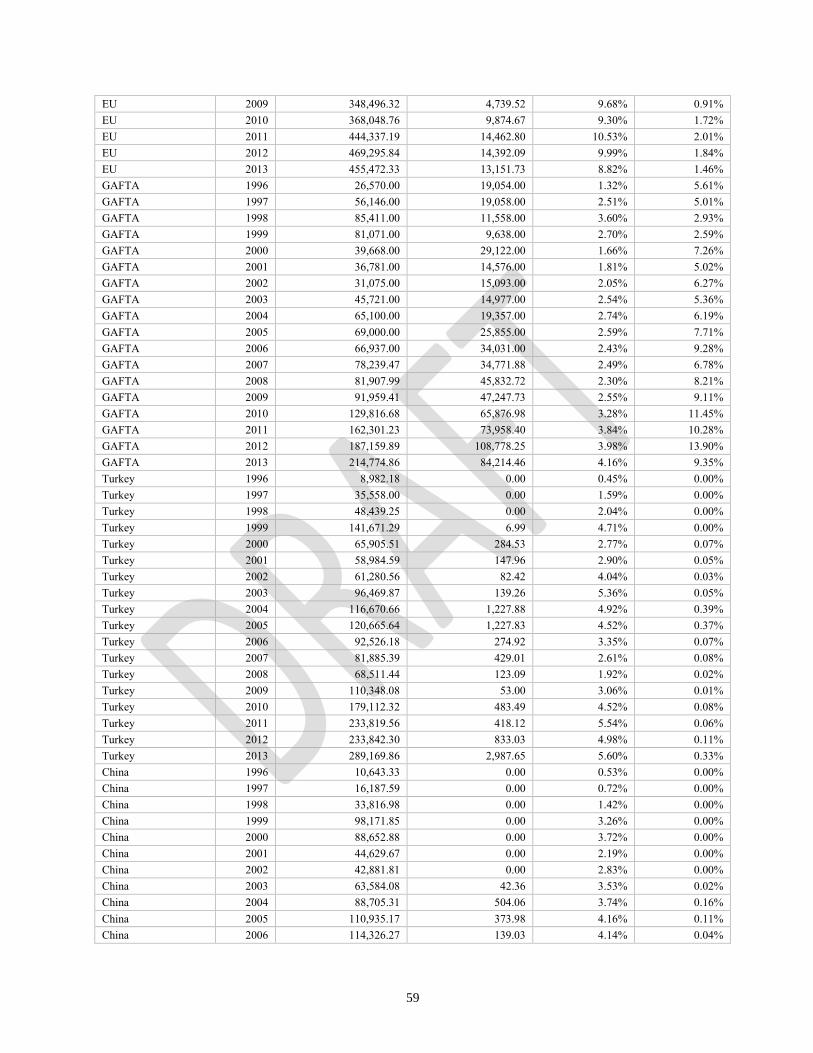
59
EU 2009 348,496.32 4,739.52 9.68% 0.91%
EU 2010 368,048.76 9,874.67 9.30% 1.72%
EU 2011 444,337.19 14,462.80 10.53% 2.01%
EU 2012 469,295.84 14,392.09 9.99% 1.84%
EU 2013 455,472.33 13,151.73 8.82% 1.46%
GAFTA 1996 26,570.00 19,054.00 1.32% 5.61%
GAFTA 1997 56,146.00 19,058.00 2.51% 5.01%
GAFTA 1998 85,411.00 11,558.00 3.60% 2.93%
GAFTA 1999 81,071.00 9,638.00 2.70% 2.59%
GAFTA 2000 39,668.00 29,122.00 1.66% 7.26%
GAFTA 2001 36,781.00 14,576.00 1.81% 5.02%
GAFTA 2002 31,075.00 15,093.00 2.05% 6.27%
GAFTA 2003 45,721.00 14,977.00 2.54% 5.36%
GAFTA 2004 65,100.00 19,357.00 2.74% 6.19%
GAFTA 2005 69,000.00 25,855.00 2.59% 7.71%
GAFTA 2006 66,937.00 34,031.00 2.43% 9.28%
GAFTA 2007 78,239.47 34,771.88 2.49% 6.78%
GAFTA 2008 81,907.99 45,832.72 2.30% 8.21%
GAFTA 2009 91,959.41 47,247.73 2.55% 9.11%
GAFTA 2010 129,816.68 65,876.98 3.28% 11.45%
GAFTA 2011 162,301.23 73,958.40 3.84% 10.28%
GAFTA 2012 187,159.89 108,778.25 3.98% 13.90%
GAFTA 2013 214,774.86 84,214.46 4.16% 9.35%
Turkey 1996 8,982.18 0.00 0.45% 0.00%
Turkey 1997 35,558.00 0.00 1.59% 0.00%
Turkey 1998 48,439.25 0.00 2.04% 0.00%
Turkey 1999 141,671.29 6.99 4.71% 0.00%
Turkey 2000 65,905.51 284.53 2.77% 0.07%
Turkey 2001 58,984.59 147.96 2.90% 0.05%
Turkey 2002 61,280.56 82.42 4.04% 0.03%
Turkey 2003 96,469.87 139.26 5.36% 0.05%
Turkey 2004 116,670.66 1,227.88 4.92% 0.39%
Turkey 2005 120,665.64 1,227.83 4.52% 0.37%
Turkey 2006 92,526.18 274.92 3.35% 0.07%
Turkey 2007 81,885.39 429.01 2.61% 0.08%
Turkey 2008 68,511.44 123.09 1.92% 0.02%
Turkey 2009 110,348.08 53.00 3.06% 0.01%
Turkey 2010 179,112.32 483.49 4.52% 0.08%
Turkey 2011 233,819.56 418.12 5.54% 0.06%
Turkey 2012 233,842.30 833.03 4.98% 0.11%
Turkey 2013 289,169.86 2,987.65 5.60% 0.33%
China 1996 10,643.33 0.00 0.53% 0.00%
China 1997 16,187.59 0.00 0.72% 0.00%
China 1998 33,816.98 0.00 1.42% 0.00%
China 1999 98,171.85 0.00 3.26% 0.00%
China 2000 88,652.88 0.00 3.72% 0.00%
China 2001 44,629.67 0.00 2.19% 0.00%
China 2002 42,881.81 0.00 2.83% 0.00%
China 2003 63,584.08 42.36 3.53% 0.02%
China 2004 88,705.31 504.06 3.74% 0.16%
China 2005 110,935.17 373.98 4.16% 0.11%
China 2006 114,326.27 139.03 4.14% 0.04%
60
China 2007 143,834.33 113.06 4.58% 0.02%
China 2008 125,963.10 46.94 3.53% 0.01%
China 2009 161,815.70 11.71 4.49% 0.00%
China 2010 181,261.40 20.30 4.58% 0.00%
China 2011 194,118.01 0.00 4.60% 0.00%
China 2012 197,319.71 0.00 4.20% 0.00%
China 2013 236,601.08 0.00 4.58% 0.00%
USA 1996 24,765.52 671.94 1.23% 0.20%
USA 1997 24,002.38 2.01 1.07% 0.00%
USA 1998 33,382.85 75.17 1.41% 0.02%
USA 1999 87,186.94 291.90 2.90% 0.08%
USA 2000 56,690.50 70.03 2.38% 0.02%
USA 2001 40,293.32 123.13 1.98% 0.04%
USA 2002 190.36 203.30 0.01% 0.08%
USA 2003 31,021.99 668.01 1.72% 0.24%
USA 2004 39,475.27 1,649.29 1.66% 0.53%
USA 2005 31,908.00 4,136.35 1.20% 1.23%
USA 2006 21,644.29 2,389.47 0.78% 0.65%
USA 2007 24,303.50 3,358.52 0.77% 0.65%
USA 2008 37,680.28 3,559.10 1.06% 0.64%
USA 2009 40,356.03 6,131.72 1.12% 1.18%
USA 2010 41,919.49 7,273.01 1.06% 1.26%
USA 2011 39,900.89 8,702.17 0.95% 1.21%
USA 2012 43,899.90 13,576.83 0.93% 1.74%
USA 2013 41,750.41 11,616.49 0.81% 1.29%
Japan 1996 3,901.21 0.00 0.19% 0.00%
Japan 1997 6,031.64 0.00 0.27% 0.00%
Japan 1998 6,710.43 0.00 0.28% 0.00%
Japan 1999 29,438.69 0.00 0.98% 0.00%
Japan 2000 8,761.94 23.85 0.37% 0.01%
Japan 2001 35,820.81 0.06 1.76% 0.00%
Japan 2002 22,749.31 0.45 1.50% 0.00%
Japan 2003 13,634.65 0.00 0.76% 0.00%
Japan 2004 11,950.29 56.01 0.50% 0.02%
Japan 2005 46,970.11 187.79 1.76% 0.06%
Japan 2006 87,082.27 169.10 3.16% 0.05%
Japan 2007 103,109.41 101.17 3.28% 0.02%
Japan 2008 17,011.99 192.81 0.48% 0.03%
Japan 2009 18,712.35 460.13 0.52% 0.09%
Japan 2010 20,327.73 372.84 0.51% 0.06%
Japan 2011 17,013.07 256.78 0.40% 0.04%
Japan 2012 14,836.89 87.98 0.32% 0.01%
Japan 2013 12,485.66 476.10 0.24% 0.05%
South Korea 1996 8,349.55 0.00 0.41% 0.00%
South Korea 1997 9,750.32 0.00 0.44% 0.00%
South Korea 1998 17,174.59 0.00 0.72% 0.00%
South Korea 1999 46,702.77 0.00 1.55% 0.00%
South Korea 2000 15,448.18 0.00 0.65% 0.00%
South Korea 2001 8,292.93 0.13 0.41% 0.00%
South Korea 2002 5,010.45 0.00 0.33% 0.00%
South Korea 2004 3,261.40 15.31 0.14% 0.00%
South Korea 2005 10,788.38 0.00 0.40% 0.00%

61
South Korea 2006 2,492.50 0.00 0.09% 0.00%
South Korea 2007 12,872.51 0.00 0.41% 0.00%
South Korea 2008 27,696.97 0.00 0.78% 0.00%
South Korea 2009 50,511.95 0.00 1.40% 0.00%
South Korea 2010 29,654.56 258.94 0.75% 0.04%
South Korea 2011 46,900.96 697.18 1.11% 0.10%
South Korea 2012 42,403.61 231.45 0.90% 0.03%
South Korea 2013 38,352.45 299.48 0.74% 0.03%
EFTA 1996 5,497.21 0.00 0.27% 0.00%
EFTA 1997 7,525.45 6.74 0.34% 0.00%
EFTA 1998 14,151.69 3.06 0.60% 0.00%
EFTA 1999 11,810.72 0.00 0.39% 0.00%
EFTA 2000 8,334.63 0.00 0.35% 0.00%
EFTA 2001 5,748.72 0.01 0.28% 0.00%
EFTA 2002 5,187.06 239.72 0.34% 0.10%
EFTA 2003 7,250.37 318.23 0.40% 0.11%
EFTA 2004 9,181.94 77.73 0.39% 0.02%
EFTA 2005 15,947.90 172.72 0.60% 0.05%
EFTA 2006 16,125.39 273.97 0.58% 0.07%
EFTA 2007 35,462.09 116.02 1.13% 0.02%
EFTA 2008 53,901.76 168.25 1.51% 0.03%
EFTA 2009 4,670.74 173.21 0.13% 0.03%
EFTA 2010 37,348.82 453.67 0.94% 0.08%
EFTA 2011 40,756.83 461.06 0.97% 0.06%
EFTA 2012 14,162.91 378.65 0.30% 0.05%
EFTA 2013 10,139.09 382.82 0.20% 0.04%
MERCOSUR 1996 2,702.00 0.00 0.13% 0.00%
MERCOSUR 1997 3,796.19 0.00 0.17% 0.00%
MERCOSUR 1998 4,361.45 0.00 0.18% 0.00%
MERCOSUR 1999 4,052.02 0.00 0.13% 0.00%
MERCOSUR 2000 5,879.33 0.00 0.25% 0.00%
MERCOSUR 2001 8,550.60 0.14 0.42% 0.00%
MERCOSUR 2002 5,908.25 0.00 0.39% 0.00%
MERCOSUR 2003 8,546.22 0.00 0.47% 0.00%
MERCOSUR 2004 12,986.71 0.00 0.55% 0.00%
MERCOSUR 2005 14,642.75 0.00 0.55% 0.00%
MERCOSUR 2006 19,673.31 0.00 0.71% 0.00%
MERCOSUR 2007 13,087.38 2.31 0.42% 0.00%
MERCOSUR 2008 21,090.17 0.00 0.59% 0.00%
MERCOSUR 2009 20,481.50 0.00 0.57% 0.00%
MERCOSUR 2010 11,734.16 204.99 0.30% 0.04%
MERCOSUR 2011 21,886.26 65.33 0.52% 0.01%
MERCOSUR 2012 24,073.00 72.00 0.51% 0.01%
MERCOSUR 2013 26,395.85 0.00 0.51% 0.00%
Thailand 1996 507.11 0.00 0.03% 0.00%
Thailand 1997 1,030.86 0.00 0.05% 0.00%
Thailand 1998 5,926.49 0.00 0.25% 0.00%
Thailand 1999 21,088.13 0.00 0.70% 0.00%
Thailand 2000 5,690.57 0.00 0.24% 0.00%
Thailand 2001 9,992.86 0.00 0.49% 0.00%
Thailand 2002 4,169.09 0.00 0.28% 0.00%
Thailand 2003 3,604.88 0.00 0.20% 0.00%

62
Thailand 2004 4,912.80 0.00 0.21% 0.00%
Thailand 2005 49,096.46 0.00 1.84% 0.00%
Thailand 2006 9,389.69 0.00 0.34% 0.00%
Thailand 2007 25,460.43 0.00 0.81% 0.00%
Thailand 2008 8,316.52 0.00 0.23% 0.00%
Thailand 2009 14,263.41 0.00 0.40% 0.00%
Thailand 2010 9,089.27 3.72 0.23% 0.00%
Thailand 2011 12,872.63 0.00 0.30% 0.00%
Thailand 2012 16,875.37 0.00 0.36% 0.00%
Thailand 2013 23,353.78 0.00 0.45% 0.00%
India 1996 2,661.78 0.00 0.13% 0.00%
India 1997 3,201.33 0.00 0.14% 0.00%
India 1998 7,456.72 0.00 0.31% 0.00%
India 1999 14,005.29 0.00 0.47% 0.00%
India 2000 7,674.28 0.00 0.32% 0.00%
India 2001 5,796.61 0.00 0.29% 0.00%
India 2002 6,659.79 0.00 0.44% 0.00%
India 2003 7,566.68 0.00 0.42% 0.00%
India 2004 9,613.26 0.00 0.41% 0.00%
India 2005 12,375.11 0.00 0.46% 0.00%
India 2006 10,969.03 0.00 0.40% 0.00%
India 2007 12,560.24 0.00 0.40% 0.00%
India 2008 12,352.33 0.00 0.35% 0.00%
India 2009 15,112.18 0.00 0.42% 0.00%
India 2010 17,084.51 0.02 0.43% 0.00%
India 2011 21,465.90 462.81 0.51% 0.06%
India 2012 22,670.83 33.59 0.48% 0.00%
India 2013 23,506.68 0.00 0.46% 0.00%
Russia 1996 284.83 0.92 0.01% 0.00%
Russia 1997 1,036.40 71.08 0.05% 0.02%
Russia 1998 4,700.89 0.00 0.20% 0.00%
Russia 1999 12,302.69 0.00 0.41% 0.00%
Russia 2000 17,534.55 0.00 0.74% 0.00%
Russia 2001 11,846.92 0.05 0.58% 0.00%
Russia 2002 3,611.81 0.00 0.24% 0.00%
Russia 2003 6,715.92 1.97 0.37% 0.00%
Russia 2004 2,592.91 0.11 0.11% 0.00%
Russia 2005 7,071.04 0.00 0.27% 0.00%
Russia 2006 11,868.19 25.50 0.43% 0.01%
Russia 2007 7,988.44 10.59 0.25% 0.00%
Russia 2008 16,187.68 1.25 0.45% 0.00%
Russia 2009 2,512.46 7.20 0.07% 0.00%
Russia 2010 10,262.54 23.57 0.26% 0.00%
Russia 2011 8,548.02 291.52 0.20% 0.04%
Russia 2012 3,963.46 576.22 0.08% 0.07%
Russia 2013 6,185.30 150.30 0.12% 0.02%
Australia 1996 2,216.72 0.00 0.11% 0.00%
Australia 1997 4,839.20 0.00 0.22% 0.00%
Australia 1998 7,276.75 0.00 0.31% 0.00%
Australia 1999 5,148.84 0.00 0.17% 0.00%
Australia 2000 15,063.36 0.00 0.63% 0.00%
Australia 2001 12,824.81 1.00 0.63% 0.00%

63
Australia 2002 9,506.96 0.00 0.63% 0.00%
Australia 2003 9,601.35 18.11 0.53% 0.01%
Australia 2004 8,754.18 0.00 0.37% 0.00%
Australia 2005 7,693.68 0.00 0.29% 0.00%
Australia 2006 14,642.84 6.60 0.53% 0.00%
Australia 2007 1,968.46 94.16 0.06% 0.02%
Australia 2008 4,034.44 110.05 0.11% 0.02%
Australia 2009 2,171.15 62.29 0.06% 0.01%
Australia 2010 3,743.75 11.79 0.09% 0.00%
Australia 2011 3,299.44 35.61 0.08% 0.00%
Australia 2012 12,480.95 17.34 0.27% 0.00%
Australia 2013 4,834.92 20.98 0.09% 0.00%
Ukraine 1996 157.30 0.00 0.01% 0.00%
Ukraine 1997 301.51 2,002.97 0.01% 0.53%
Ukraine 1998 358.37 4.01 0.02% 0.00%
Ukraine 1999 4,213.21 0.00 0.14% 0.00%
Ukraine 2000 548.57 0.00 0.02% 0.00%
Ukraine 2001 515.06 1.42 0.03% 0.00%
Ukraine 2002 884.92 0.00 0.06% 0.00%
Ukraine 2003 6,106.57 0.00 0.34% 0.00%
Ukraine 2004 3,803.01 0.00 0.16% 0.00%
Ukraine 2005 553.78 0.00 0.02% 0.00%
Ukraine 2006 7,402.62 0.00 0.27% 0.00%
Ukraine 2007 4,828.88 0.00 0.15% 0.00%
Ukraine 2008 7,174.28 32.77 0.20% 0.01%
Ukraine 2009 6,303.45 14.44 0.18% 0.00%
Ukraine 2010 3,460.75 33.31 0.09% 0.01%
Ukraine 2011 3,022.29 25.66 0.07% 0.00%
Ukraine 2012 8,663.97 67.47 0.18% 0.01%
Ukraine 2013 22,177.82 11.92 0.43% 0.00%
Canada 1996 684.31 133.85 0.03% 0.04%
Canada 1997 582.49 15.29 0.03% 0.00%
Canada 1998 598.41 0.00 0.03% 0.00%
Canada 1999 3,285.66 0.00 0.11% 0.00%
Canada 2000 1,382.87 1.20 0.06% 0.00%
Canada 2001 768.57 4.46 0.04% 0.00%
Canada 2002 458.71 0.00 0.03% 0.00%
Canada 2003 568.54 134.35 0.03% 0.05%
Canada 2004 1,283.66 50.94 0.05% 0.02%
Canada 2005 1,405.40 82.16 0.05% 0.02%
Canada 2006 2,603.92 164.06 0.09% 0.04%
Canada 2007 5,151.99 242.57 0.16% 0.05%
Canada 2008 1,767.88 267.73 0.05% 0.05%
Canada 2009 2,649.62 2,664.82 0.07% 0.51%
Canada 2010 8,168.77 2,028.70 0.21% 0.35%
Canada 2011 2,394.00 1,788.69 0.06% 0.25%
Canada 2012 2,872.00 3,259.00 0.06% 0.42%
Canada 2013 2,686.51 908.04 0.05% 0.10%
Swaziland 2005 1.54 0.00 0.00% 0.00%
Swaziland 2008 3.17 0.00 0.00% 0.00%
Swaziland 2009 23,070.28 3,079.18 0.64% 0.59%
Swaziland 2010 102.40 0.00 0.00% 0.00%

64
Swaziland 2012 0.35 0.00 0.00% 0.00%
Swaziland 2013 1,407.07 0.00 0.03% 0.00%
Source: PCBS (HS 1996 Total Trade)
Annex VI: Palestinian exports to Russia (by product and year)
Palestinian exports to Russia between 1996 and 2006
SITC Rev.3 5-digit, Source: PCBS
Year Product Product Name Exports Value
(‘000s USD) Exports Share
1996
01721 Sausages and similar products of meat meat offals or blood 0.35 38.45%
04843 Stuffed biscuits with essence and coated with chocolate 0.14 15.12%
11103 Mineral beverages (pepsi coca cola) 0.14 14.92%
04811 Prepared foods obtained by the swelling or roasting of ce... 0.09 9.72%
04813 Other rolled or flaked cereal grains, except rice of subg... 0.08 9.27%
04831 Macaroni whether or not cut 0.07 7.66%
07321 Other food preparations containing cocoa in blocks slabs .. 0.04 4.86%
Total 0.92 100.00%
1997
54293 Medicaments, n.e.s., put up in measured doses or in forms... 44.12 62.07%
07321 Other food preparations containing cocoa in blocks slabs .. 15.92 22.40%
55419 Soap in other forms 5.81 8.17%
55421 Organic surface-active agents (other than soap), whether ... 5.23 7.36%
Total 71.08 100.00%
2001
91101 Postal packages not classifid to kind 0.04 85.00%
12221 Cigarettes 0.01 15.00%
Total 0.05 100.00%
2003
05753 Strawberry and berry fresh or chilled 1.43 72.42%
05441 Tomatoes fresh or chilled 0.54 27.58%
Total 1.97 100.00%
2004 05441 Tomatoes fresh or chilled 0.11 100.00%
Total 0.11 100.00%
2006 05751 Grapes, fresh 25.50 100.00%
Total 25.50 100.00%
Palestinian exports to Russia between 2007 and 2013
HS 1996 6-digit, Source: PCBS
Year Product Product Name Exports Value
(‘000s USD) Exports Share
2007 200290 Tomatoes nes, prepared or preserved, not in vinega... 10.59 100.00%
Total 10.59 100.00%
2008 340290 Organic surfactant washing, cleaning preparations ... 1.25 100.00%
Total 1.25 100.00%
2009
680229 Cut or sawn slabs of stone nes 4.80 66.65%
070200 Tomatoes, fresh or chilled 2.40 33.35%
Total 7.20 100.00%
2010 121190 Plants & parts, pharmacy, perfume, insecticide use... 23.57 100.00%
Total 23.57 100.00%
2011
121190 Plants & parts, pharmacy, perfume, insecticide use... 187.29 64.24%
060390 Cut flowers and flower buds for bouquets, dried, e... 41.39 14.20%
091010 Ginger 13.62 4.67%
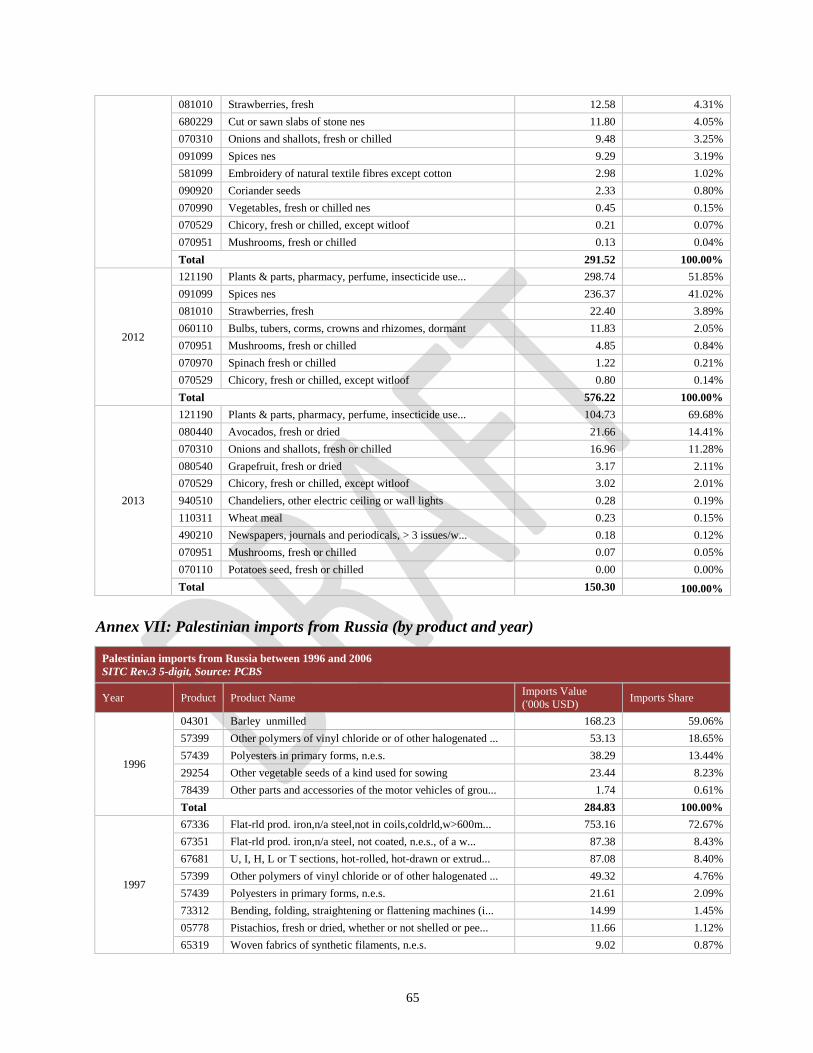
65
081010 Strawberries, fresh 12.58 4.31%
680229 Cut or sawn slabs of stone nes 11.80 4.05%
070310 Onions and shallots, fresh or chilled 9.48 3.25%
091099 Spices nes 9.29 3.19%
581099 Embroidery of natural textile fibres except cotton 2.98 1.02%
090920 Coriander seeds 2.33 0.80%
070990 Vegetables, fresh or chilled nes 0.45 0.15%
070529 Chicory, fresh or chilled, except witloof 0.21 0.07%
070951 Mushrooms, fresh or chilled 0.13 0.04%
Total 291.52 100.00%
2012
121190 Plants & parts, pharmacy, perfume, insecticide use... 298.74 51.85%
091099 Spices nes 236.37 41.02%
081010 Strawberries, fresh 22.40 3.89%
060110 Bulbs, tubers, corms, crowns and rhizomes, dormant 11.83 2.05%
070951 Mushrooms, fresh or chilled 4.85 0.84%
070970 Spinach fresh or chilled 1.22 0.21%
070529 Chicory, fresh or chilled, except witloof 0.80 0.14%
Total 576.22 100.00%
2013
121190 Plants & parts, pharmacy, perfume, insecticide use... 104.73 69.68%
080440 Avocados, fresh or dried 21.66 14.41%
070310 Onions and shallots, fresh or chilled 16.96 11.28%
080540 Grapefruit, fresh or dried 3.17 2.11%
070529 Chicory, fresh or chilled, except witloof 3.02 2.01%
940510 Chandeliers, other electric ceiling or wall lights 0.28 0.19%
110311 Wheat meal 0.23 0.15%
490210 Newspapers, journals and periodicals, > 3 issues/w... 0.18 0.12%
070951 Mushrooms, fresh or chilled 0.07 0.05%
070110 Potatoes seed, fresh or chilled 0.00 0.00%
Total 150.30 100.00%
Annex VII: Palestinian imports from Russia (by product and year)
Palestinian imports from Russia between 1996 and 2006
SITC Rev.3 5-digit, Source: PCBS
Year Product Product Name Imports Value
('000s USD) Imports Share
1996
04301 Barley unmilled 168.23 59.06%
57399 Other polymers of vinyl chloride or of other halogenated ... 53.13 18.65%
57439 Polyesters in primary forms, n.e.s. 38.29 13.44%
29254 Other vegetable seeds of a kind used for sowing 23.44 8.23%
78439 Other parts and accessories of the motor vehicles of grou... 1.74 0.61%
Total 284.83 100.00%
1997
67336 Flat-rld prod. iron,n/a steel,not in coils,coldrld,w>600m... 753.16 72.67%
67351 Flat-rld prod. iron,n/a steel, not coated, n.e.s., of a w... 87.38 8.43%
67681 U, I, H, L or T sections, hot-rolled, hot-drawn or extrud... 87.08 8.40%
57399 Other polymers of vinyl chloride or of other halogenated ... 49.32 4.76%
57439 Polyesters in primary forms, n.e.s. 21.61 2.09%
73312 Bending, folding, straightening or flattening machines (i... 14.99 1.45%
05778 Pistachios, fresh or dried, whether or not shelled or pee... 11.66 1.12%
65319 Woven fabrics of synthetic filaments, n.e.s. 9.02 0.87%

66
65343 Fabrics, woven, <85% of synthetic fibres, mixed with othe... 2.19 0.21%
Total 1,036.40 100.00%
1998
67632 Bars and rods (not of 676.1) iron,n/a steel, coldrld 3,050.88 64.90%
67245 Other primary forms of iron (other than iron of heading 6... 761.08 16.19%
67269 Semi-fin. prod. of iron or n/a steel< 0.25% of carbon, of... 726.03 15.44%
64141 Kraft paper, uncoated, in rolls or sheets 70.31 1.50%
67681 U, I, H, L or T sections, hot-rolled, hot-drawn or extrud... 49.80 1.06%
67811 Wire of iron or n/a steel, containing by weight less than... 18.02 0.38%
69543 Planes, chisels, gouges and similar cutting tools for wor... 11.53 0.25%
66522 Drinking glasses other than of glass-ceramics 7.56 0.16%
75131 Electrostatic photocopying apparatus operating by reprodu... 5.68 0.12%
Total 4,700.89 100.00%
1999
66245 Glazed ceramic flags and paving, hearth or wall tiles; gl... 10,831.00 88.04%
74341 Table, floor, wall, window, ceiling or roof fans, with a ... 407.60 3.31%
59224 Gelatin (including gelatin in rectangular sheets, whether... 218.74 1.78%
84599 Garments, knitted or crocheted, n.e.s. 179.73 1.46%
05996 Mixtures of fruit or vegetable juices 125.28 1.02%
04842 Sweet biscuits, waffles and wafers, gingerbread and the l... 122.77 1.00%
78122 Pick-ups vehicles 71.14 0.58%
77312 Co-axial cable and other co-axial conductors 48.72 0.40%
74999 Other machinery parts, not containing electrical connecto... 44.76 0.36%
71631 AC motors (including universal (AC/DC) motors, but
exclud... 43.48 0.35%
82179 Furniture, n.e.s., of other materials (including bamboo) 33.11 0.27%
89997 Vacuum flasks and other vacuum vessels, complete with
cas... 28.87 0.23%
74261 Centrifugal pumps for disposable water distillation plants 20.19 0.16%
66522 Drinking glasses other than of glass-ceramics 17.82 0.14%
24821 Wood of coniferous species sawn or chipped 17.19 0.14%
11101 Waters, including natural or artificial mineral waters an... 16.93 0.14%
76221 Radio-broadcast receivers capable of operating without an... 16.73 0.14%
89841 Magnetic tapes for sound recording or similar recording o... 9.26 0.08%
65316 Other woven fabrics, containing 85% or more by weight of
... 9.26 0.08%
89332 Tableware, kitchenware, other household articles and toil... 7.71 0.06%
66529 Other glassware, other than of glass-ceramics 7.47 0.06%
55431 Polishes, creams and similar preparations, for footwear o... 4.26 0.03%
62921 Conveyor or transmission belts, of vulcanized rubber, V-b... 2.87 0.02%
77261 Boards, panels (including numerical control panels), cons... 2.58 0.02%
77315 Other electric conductors, for a voltage exceeding 80 V b... 2.57 0.02%
89933 Cigarette lighters and other lighters, whether or not mec... 2.31 0.02%
89972 Brooms, brushes (including brushes constituting parts of ... 2.16 0.02%
76222 Radio-broadcast receivers capable of operating without an... 1.96 0.02%
74359 Other centrifuges 1.85 0.02%
76111 Television receivers coloured incorporating video and vid.. 1.46 0.01%
74291 Parts of the pumps of group 742 1.17 0.01%
77571 Vacuum cleaners and floor-polishers, electromechanical, d... 0.40 0.00%
72849 Machinery having individual functions, n.e.s. 0.37 0.00%
74183 Medical, surgical or laboratory sterilizers 0.31 0.00%
58211 Plates, sheets,etc,self-adhesive, of plastics, in rolls o... 0.16 0.00%
77586 Microwave ovens; other ovens; cookers, cooking plates, bo... 0.15 0.00%
76114 Coloured TV receivers 0.14 0.00%
84271 Blouses shirts and shirt blouses 0.08 0.00%

67
84511 Babies' garments and clothing accessories, not knitted or... 0.05 0.00%
91101 Postal packages not classifid to kind 0.04 0.00%
65319 Woven fabrics of synthetic filaments, n.e.s. 0.01 0.00%
05471 Olives pickled 0.01 0.00%
42169 Maize (corn) oil, refined, and its fractions 0.01 0.00%
07121 Coffee roasted beans not ground 0.01 0.00%
89399 Other articles of plastics 0.01 0.00%
07321 Other food preparations containing cocoa in blocks slabs.. 0.00 0.00%
Total 12,302.69 100.00%
2000
67269 Semi-fin. prod. of iron or n/a steel< 0.25% of carbon, of... 8,174.43 46.62%
67241 Ingots of iron (other than iron of heading 671.33) or n/a... 5,937.20 33.86%
67643 Other bars and rods of iron and steel, iron,n/a steel, fo... 1,981.75 11.30%
67262 Semi-fin. prod. of iron or n/a steel< 0.25% of carbon, ot... 516.99 2.95%
64111 Newsprint in rolls or sheets 289.83 1.65%
57112 Polyethylene having a specific gravity of 0.94 or more 142.34 0.81%
64142 Sack kraft paper, uncoated, in rolls or sheets 97.10 0.55%
64126 Other paper and paperboard, weighing 40 g/m2 or more but
... 88.30 0.50%
66522 Drinking glasses other than of glass-ceramics 75.34 0.43%
29254 Other vegetable seeds of a kind used for sowing 66.91 0.38%
67612 Bars and rods, hot-rolled, in ir. wound coils, of n/a fre... 64.44 0.37%
24841 Wood of non-coniferous species sawn or chipped
lengthwise 63.29 0.36%
66529 Other glassware, other than of glass-ceramics 10.41 0.06%
66521 Glassware of glass-ceramics 7.74 0.04%
52264 Potassium hydroxide (caustic potash); peroxides of sodium... 5.40 0.03%
69741 Household articles and parts thereof, n.e.s., of iron or ... 4.10 0.02%
66312 Other millstones, grindstones, grinding wheels and the li... 1.28 0.01%
66611 Tableware and kitchenware of porcelain or china 0.91 0.01%
89332 Tableware, kitchenware, other household articles and toil... 0.82 0.00%
76114 Coloured TV receivers 0.59 0.00%
54293 Medicaments, n.e.s., put up in measured doses or in forms... 0.49 0.00%
54295 Unknown 0.44 0.00%
83112 Handbags, whether or not with shoulder-strap (including t... 0.42 0.00%
89813 Pianos (including automatic pianos); harpsichords and oth... 0.38 0.00%
69669 Other articles of kitchen and tableware, not in sets 0.35 0.00%
76381 Video-recording or reproducing apparatus, whether or not ... 0.29 0.00%
76484 Other receivers, satellite, .. 0.29 0.00%
76211 Radio-broadcast receivers not capable of operating withou... 0.26 0.00%
77584 Electric smoothing-irons 0.24 0.00%
77583 Electrothermic hairdressing or hand-drying apparatus 0.24 0.00%
77581 Electric instantaneous or storage water heaters and immer... 0.22 0.00%
62999 Articles of unhardened non-cellular vulcanized rubber, n.... 0.21 0.00%
63542 Tableware and kitchenware, of wood 0.20 0.00%
63599 Other articles of wood 0.14 0.00%
77572 Food grinders and mixers; fruit or vegetable juice extrac... 0.12 0.00%
12221 Cigarettes 0.12 0.00%
89422 Dolls representing only human beings, whether or not dres... 0.10 0.00%
64231 Registers, account books, notebooks, order books, receipt... 0.08 0.00%
89425 Toys representing animals or non-human creatures 0.08 0.00%
64211 Cartons, boxes and cases, of corrugated paper or paperboa... 0.08 0.00%
89979 Plaiting materials, plaits and similar products of plaiti... 0.07 0.00%

68
89215 Printed books, brochures, leaflets and similar printed ma... 0.07 0.00%
66629 Statuettes and other ornamental ceramic articles, other t... 0.06 0.00%
89394 Office or school supplies of plastics 0.06 0.00%
63549 Wood marquetry and inlaid wood; caskets and cases for
jew... 0.06 0.00%
66612 Other household or toilet articles of porcelain or china 0.06 0.00%
89521 Ball-point pens; felt-tipped or other porous-tipped pens ... 0.05 0.00%
76411 Telephone sets 0.05 0.00%
89399 Other articles of plastics 0.03 0.00%
85159 Footwear with uppers of textile materials, n.e.s. 0.03 0.00%
85125 Tennis shoes, basketball shoes, gym shoes, training shoes... 0.02 0.00%
69241 Tanks, casks, drums, cans, boxes and similar containers, ... 0.02 0.00%
77541 Shavers with self-contained electric motor 0.02 0.00%
87423 Instruments for measuring length, for use in the hand (e.... 0.01 0.00%
75121 Electronic calculators capable of operation without an ex... 0.01 0.00%
84849 Headgear, n.e.s., of materials other than rubber or plast... 0.01 0.00%
91101 Postal packages not classifid to kind 0.00 0.00%
Total 17,534.55 100.00%
2001
67241 Ingots of iron (other than iron of heading 671.33) or n/a... 10,723.95 90.52%
67613 Bars and rods, hot-rolled, in ir. wound coils, other, iro... 409.02 3.45%
28233 Remelting scrap ingots of iron or steel 260.92 2.20%
64141 Kraft paper, uncoated, in rolls or sheets 187.01 1.58%
67347 Flat-rld prod. iron,n/a steel,not in coils,coldrld,w>600m... 103.85 0.88%
64111 Newsprint in rolls or sheets 70.84 0.60%
24821 Wood of coniferous species sawn or chipped 37.03 0.31%
67348 Flat-rld prod. iron,n/a steel,not in coils,coldrld,w>600m... 11.88 0.10%
24841 Wood of non-coniferous species sawn or chipped
lengthwise 9.58 0.08%
66522 Drinking glasses other than of glass-ceramics 8.26 0.07%
78439 Other parts and accessories of the motor vehicles of grou... 7.19 0.06%
29254 Other vegetable seeds of a kind used for sowing 5.66 0.05%
52264 Potassium hydroxide (caustic potash); peroxides of sodium... 5.44 0.05%
66523 Glassware of a kind used for table (other than drinking g... 3.10 0.03%
66611 Tableware and kitchenware of porcelain or china 2.62 0.02%
12221 Cigarettes 0.24 0.00%
74822 Bearing housings, not incorporating ball- or roller beari... 0.23 0.00%
84221 Suits, women's or girls', of textile materials, not knitt... 0.10 0.00%
Total 11,846.92 100.00%
2002
67241 Ingots of iron (other than iron of heading 671.33) or n/a... 2,728.26 75.54%
67613 Bars and rods, hot-rolled, in ir. wound coils, other, iro... 736.30 20.39%
24821 Wood of coniferous species sawn or chipped 103.02 2.85%
24841 Wood of non-coniferous species sawn or chipped
lengthwise 23.69 0.66%
64141 Kraft paper, uncoated, in rolls or sheets 19.05 0.53%
63412 Veneer sheets and other wood sawn lengthwise of
thickness... 1.43 0.04%
12221 Cigarettes 0.07 0.00%
Total 3,611.81 100.00%
2003
67241 Ingots of iron (other than iron of heading 671.33) or n/a... 4,664.59 69.46%
67613 Bars and rods, hot-rolled, in ir. wound coils, other, iro... 1,266.96 18.87%
68411 Aluminium, not alloyed 402.55 5.99%
04111 Wheat unmilled 326.91 4.87%
24821 Wood of coniferous species sawn or chipped 29.20 0.43%
24841 Wood of non-coniferous species sawn or chipped
lengthwise 10.38 0.15%

69
05776 Walnuts, fresh or dried, whether or not shelled or peeled 7.51 0.11%
66522 Drinking glasses other than of glass-ceramics 3.89 0.06%
69741 Household articles and parts thereof, n.e.s., of iron or ... 3.82 0.06%
66529 Other glassware, other than of glass-ceramics 0.06 0.00%
69562 Plates, sticks, tips and the like for tools, unmounted, o... 0.03 0.00%
12221 Cigarettes 0.01 0.00%
Total 6,715.92 100.00%
2004
67613 Bars and rods, hot-rolled, in ir. wound coils, other, iro... 1,715.41 66.16%
68411 Aluminium, not alloyed 436.37 16.83%
24821 Wood of coniferous species sawn or chipped 212.11 8.18%
67624 Bars and rods (not of 676.1) iron,n/a steel, containing b... 108.50 4.18%
67681 U, I, H, L or T sections, hot-rolled, hot-drawn or extrud... 76.45 2.95%
72399 Other parts for the machinery of group 723 (excluding hea... 16.77 0.65%
24841 Wood of non-coniferous species sawn or chipped
lengthwise 14.24 0.55%
69781 Mechanical appliances, hand-operated, weighing 10 kg or l... 9.74 0.38%
67633 Bars and rods (not of 676.1) iron,n/a steel, coldrld 2.37 0.09%
69421 Screws, bolts, nuts, coach screws, screw hooks, rivets an... 0.43 0.02%
69561 Knives and cutting blades, for machines or for mechanical... 0.43 0.02%
12221 Cigarettes 0.08 0.00%
93101 Special transactions and commodities not classified to kind 0.01 0.00%
Total 2,592.91 100.00%
2005
67613 Bars and rods, hot-rolled, in ir. wound coils, other, iro... 2,224.86 31.46%
67241 Ingots of iron (other than iron of heading 671.33) or n/a... 1,784.22 25.23%
04111 Wheat unmilled 1,700.17 24.04%
24841 Wood of non-coniferous species sawn or chipped
lengthwise 489.51 6.92%
67541 Flat-rld prod. of other alloy steel, hotrld, of a width o... 332.76 4.71%
67612 Bars and rods, hot-rolled, in ir. wound coils, of n/a fre... 326.95 4.62%
24821 Wood of coniferous species sawn or chipped .. 124.92 1.77%
05452 Garlic, leeks and other alliaceous vegetables 23.81 0.34%
51215 Undenatured ethyl alcohol of an alcoholic strength by vol... 20.08 0.28%
28783 Titanium ores and concentrates 12.28 0.17%
67633 Bars and rods (not of 676.1) iron,n/a steel, coldrld 12.06 0.17%
69563 Rock-drilling or earth-boring tools 11.16 0.16%
27899 Mineral substances, n.e.s. 6.91 0.10%
69969 Articles of iron or steel, n.e.s. 0.98 0.01%
52256 Titanium oxides 0.24 0.00%
87479 Parts and accessories for the instruments and apparatus o... 0.08 0.00%
05822 Peel of citrus fruit or melons, fresh, frozen, dried or p... 0.01 0.00%
93101 Special transactions and commodities not classified to kind 0.01 0.00%
Total 7,071.04 100.00%
2006
67241 Ingots of iron (other than iron of heading 671.33) or n/a... 8,665.52 73.01%
67613 Bars and rods, hot-rolled, in ir. wound coils, other, iro... 1,106.75 9.33%
24821 Wood of coniferous species sawn or chipped 646.45 5.45%
93101 Special transactions and commodities not classified to kind 521.96 4.40%
68411 Aluminium, not alloyed 516.83 4.35%
24841 Wood of non-coniferous species sawn or chipped
lengthwise 219.72 1.85%
57112 Polyethylene having a specific gravity of 0.94 or more 185.18 1.56%
89841 Magnetic tapes for sound recording or similar recording o... 4.41 0.04%
69969 Articles of iron or steel, n.e.s. 1.38 0.01%
Total 11,868.19 100.00%

70
Palestinian imports from Russia between 2007 and 2013
HS 1996 6-digit, Source: PCBS
Year Product Product Name Imports Value
('000s USD) Imports Share
2007
760120 Aluminium unwrought, alloyed 3,088.11 38.66%
720610 Iron or non-alloy steel in ingots, <99.94% iron 2,345.55 29.36%
721391 Bars&rods,circular cross 1,145.68 14.34%
440799 Lumber, non-coniferous nes 1,026.34 12.85%
760110 Aluminium unwrought, not alloyed 268.16 3.36%
843149 Parts of cranes, work-trucks, shovels, constr mach... 53.11 0.66%
340399 Lubricating preparations, zero petroleum content, ... 25.77 0.32%
680293 Worked granite 19.02 0.24%
294190 Antibiotics nes, in bulk 16.20 0.20%
842139 Filtering or purifying machinery for gases nes 0.21 0.00%
321490 Non-refractory surfacing preparations nes 0.15 0.00%
852520 Transmit-receive apparatus for radio, TV, etc. 0.06 0.00%
851220 Lighting/visual signalling equipment nes 0.04 0.00%
950490 Articles for funfair, table and parlour games, nes 0.04 0.00%
Total 7,988.44 100.00%
2008
720610 Iron or non-alloy steel in ingots, <99.94% iron 11,689.27 72.21%
760120 Aluminium unwrought, alloyed 3,623.97 22.39%
760110 Aluminium unwrought, not alloyed 381.14 2.35%
440799 Lumber, non-coniferous nes 267.10 1.65%
440710 Lumber, coniferous (softwood) thickness < 6 mm 198.63 1.23%
391732 Flexible plastic tube/hose not reinforced, no fitt... 21.42 0.13%
902290 Parts and accessories for radiation apparatus 3.52 0.02%
321410 Mastics, painters' fillings 1.69 0.01%
851220 Lighting/visual signalling equipment nes 0.28 0.00%
711411 Silver wares, silver ware plated with precious met... 0.20 0.00%
830629 Statuettes and other ornaments, base metal, unplat... 0.16 0.00%
620343 Mens, boys trousers shorts, synthetic fibre, not k... 0.13 0.00%
620530 Mens, boys shirts, of manmade fibres, not knit 0.11 0.00%
640199 Waterproof footwear(Wellington) no toe cap, nes 0.07 0.00%
Total 16,187.68 100.00%
2009
720610 Iron or non-alloy steel in ingots, <99.94% iron 1,488.73 59.25%
760120 Aluminium unwrought, alloyed 878.79 34.98%
440799 Lumber, non-coniferous nes 43.60 1.74%
722830 Bar/rod, alloy steel nes,nfw hot rolled/drawn/extr... 43.00 1.71%
390210 Polypropylene in primary forms 13.40 0.53%
480560 Paper, weighing 150 g/m2 or less, uncoated, nes 11.36 0.45%
480439 Paper, kraft, <150g/m2, uncoated, nes 8.71 0.35%
110100 Wheat or meslin flour 7.83 0.31%
380400 Residual lyes from the manufacture of wood pulp 6.40 0.25%
902290 Parts and accessories for radiation apparatus 6.31 0.25%
721632 Sections, I, i/nas, nfw hot-roll/drawn/extruded > ... 2.44 0.10%
901890 Instruments, appliances for medical, etc science, ... 1.07 0.04%
853710 Electrical control and distribution boards, < 1kV 0.43 0.02%
853650 Electrical switches for < 1,000 volts, nes 0.41 0.02%
Total 2,512.46 100.00%
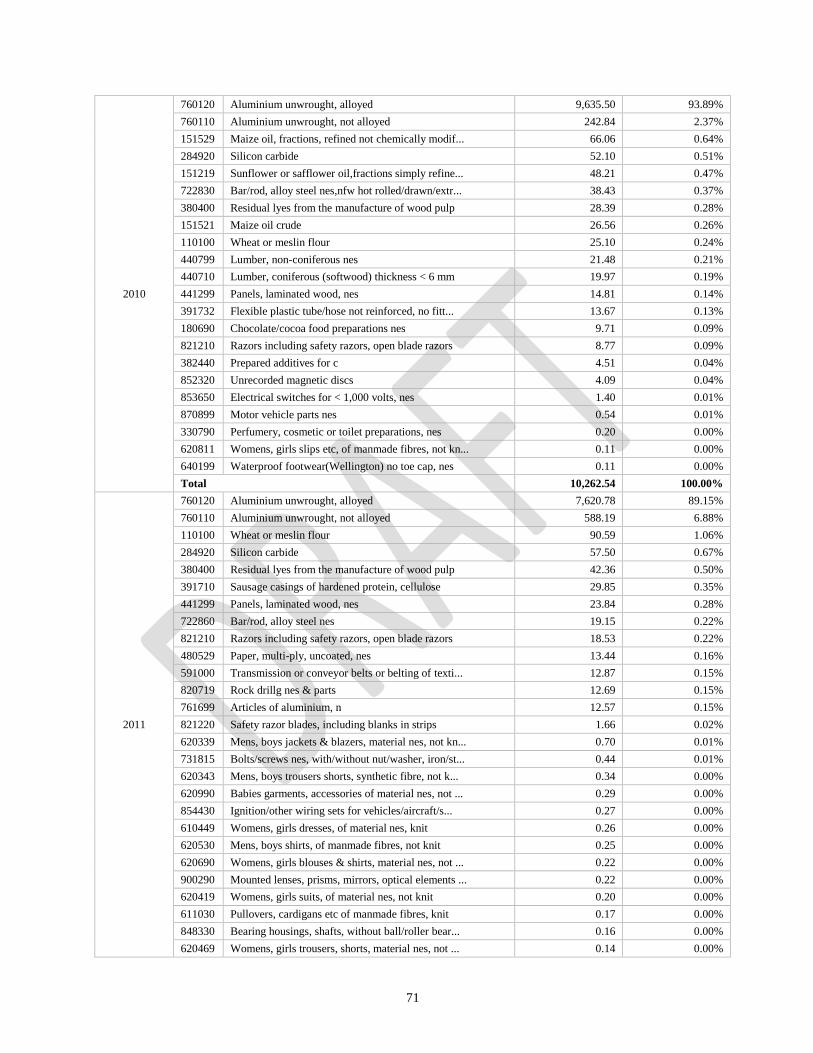
71
2010
760120 Aluminium unwrought, alloyed 9,635.50 93.89%
760110 Aluminium unwrought, not alloyed 242.84 2.37%
151529 Maize oil, fractions, refined not chemically modif... 66.06 0.64%
284920 Silicon carbide 52.10 0.51%
151219 Sunflower or safflower oil,fractions simply refine... 48.21 0.47%
722830 Bar/rod, alloy steel nes,nfw hot rolled/drawn/extr... 38.43 0.37%
380400 Residual lyes from the manufacture of wood pulp 28.39 0.28%
151521 Maize oil crude 26.56 0.26%
110100 Wheat or meslin flour 25.10 0.24%
440799 Lumber, non-coniferous nes 21.48 0.21%
440710 Lumber, coniferous (softwood) thickness < 6 mm 19.97 0.19%
441299 Panels, laminated wood, nes 14.81 0.14%
391732 Flexible plastic tube/hose not reinforced, no fitt... 13.67 0.13%
180690 Chocolate/cocoa food preparations nes 9.71 0.09%
821210 Razors including safety razors, open blade razors 8.77 0.09%
382440 Prepared additives for c 4.51 0.04%
852320 Unrecorded magnetic discs 4.09 0.04%
853650 Electrical switches for < 1,000 volts, nes 1.40 0.01%
870899 Motor vehicle parts nes 0.54 0.01%
330790 Perfumery, cosmetic or toilet preparations, nes 0.20 0.00%
620811 Womens, girls slips etc, of manmade fibres, not kn... 0.11 0.00%
640199 Waterproof footwear(Wellington) no toe cap, nes 0.11 0.00%
Total 10,262.54 100.00%
2011
760120 Aluminium unwrought, alloyed 7,620.78 89.15%
760110 Aluminium unwrought, not alloyed 588.19 6.88%
110100 Wheat or meslin flour 90.59 1.06%
284920 Silicon carbide 57.50 0.67%
380400 Residual lyes from the manufacture of wood pulp 42.36 0.50%
391710 Sausage casings of hardened protein, cellulose 29.85 0.35%
441299 Panels, laminated wood, nes 23.84 0.28%
722860 Bar/rod, alloy steel nes 19.15 0.22%
821210 Razors including safety razors, open blade razors 18.53 0.22%
480529 Paper, multi-ply, uncoated, nes 13.44 0.16%
591000 Transmission or conveyor belts or belting of texti... 12.87 0.15%
820719 Rock drillg nes & parts 12.69 0.15%
761699 Articles of aluminium, n 12.57 0.15%
821220 Safety razor blades, including blanks in strips 1.66 0.02%
620339 Mens, boys jackets & blazers, material nes, not kn... 0.70 0.01%
731815 Bolts/screws nes, with/without nut/washer, iron/st... 0.44 0.01%
620343 Mens, boys trousers shorts, synthetic fibre, not k... 0.34 0.00%
620990 Babies garments, accessories of material nes, not ... 0.29 0.00%
854430 Ignition/other wiring sets for vehicles/aircraft/s... 0.27 0.00%
610449 Womens, girls dresses, of material nes, knit 0.26 0.00%
620530 Mens, boys shirts, of manmade fibres, not knit 0.25 0.00%
620690 Womens, girls blouses & shirts, material nes, not ... 0.22 0.00%
900290 Mounted lenses, prisms, mirrors, optical elements ... 0.22 0.00%
620419 Womens, girls suits, of material nes, not knit 0.20 0.00%
611030 Pullovers, cardigans etc of manmade fibres, knit 0.17 0.00%
848330 Bearing housings, shafts, without ball/roller bear... 0.16 0.00%
620469 Womens, girls trousers, shorts, material nes, not ... 0.14 0.00%

72
940490 Articles of bedding nes 0.12 0.00%
621210 Brassieres and parts thereof 0.11 0.00%
294190 Antibiotics nes, in bulk 0.06 0.00%
620811 Womens, girls slips etc, of manmade fibres, not kn... 0.06 0.00%
Total 8,548.01 100.00%
2012
760120 Aluminium unwrought, alloyed 2,543.33 64.17%
760110 Aluminium unwrought, not alloyed 465.85 11.75%
110100 Wheat or meslin flour 286.77 7.24%
380400 Residual lyes from the manufacture of wood pulp 170.13 4.29%
844359 Printing machinery nes 96.26 2.43%
441219 Plywood, all softwood, each ply < 6mm thick 77.68 1.96%
071320 Chickpeas, dried, shelled 73.85 1.86%
151529 Maize oil, fractions, refined not chemically modif... 40.00 1.01%
284920 Silicon carbide 34.09 0.86%
441214 Plywood, outer ply of no 23.84 0.60%
440710 Lumber, coniferous (softwood) thickness < 6 mm 23.36 0.59%
440799 Lumber, non-coniferous nes 21.01 0.53%
761699 Articles of aluminium, n 17.38 0.44%
560790 Twine, cordage, ropes and cables, of other materia... 14.92 0.38%
271000 Petroleum oils&oils obta 13.01 0.33%
722850 Bar/rod nes, alloy steel nes, nfw cold formed/fini... 11.49 0.29%
844390 Parts of printing machinery and ancillary equipmen... 9.93 0.25%
821210 Razors including safety razors, open blade razors 8.05 0.20%
392329 Plastic sacks, bags, cone except of ethylene polym... 5.15 0.13%
294190 Antibiotics nes, in bulk 4.89 0.12%
854430 Ignition/other wiring sets for vehicles/aircraft/s... 2.80 0.07%
321590 Ink, other than printing ink 2.59 0.07%
940510 Chandeliers, other electric ceiling or wall lights 2.32 0.06%
320990 Polymer based paints & varnishes nes, aqueous medi... 2.15 0.05%
321519 Printing ink, other than black 1.85 0.05%
853949 Ultra-violet or infra-re 1.29 0.03%
620530 Mens, boys shirts, of manmade fibres, not knit 1.19 0.03%
870899 Motor vehicle parts nes 1.01 0.03%
620930 Babies garments, accessories synthetic fibre, not ... 0.99 0.02%
620213 Womens, girls overcoats etc manmade fibre, not kni... 0.85 0.02%
330790 Perfumery, cosmetic or toilet preparations, nes 0.63 0.02%
381400 Organic composite solvents, paint, varnish remover... 0.58 0.01%
620339 Mens, boys jackets & blazers, material nes, not kn... 0.50 0.01%
380992 Finishing agents & dye carriers - paper industry 0.48 0.01%
620343 Mens, boys trousers shorts, synthetic fibre, not k... 0.45 0.01%
401693 Gaskets, washers and other seals of vulcanised rub... 0.45 0.01%
491191 Pictures, designs and photographs 0.40 0.01%
620463 Womens, girls trousers, shorts, synth fibres, not ... 0.24 0.01%
392099 Sheet/film not cellular/reinf plastics nes 0.23 0.01%
853650 Electrical switches for < 1,000 volts, nes 0.23 0.01%
420221 Handbags with outer surface of leather 0.18 0.00%
620990 Babies garments, accessories of material nes, not ... 0.16 0.00%
950490 Articles for funfair, table and parlour games, nes 0.16 0.00%
620799 Mens, boys dressing gowns, material nes, not knit 0.13 0.00%
391732 Flexible plastic tube/hose not reinforced, no fitt... 0.12 0.00%

73
620719 Mens, boys underpants, briefs, material nes, not k... 0.11 0.00%
854441 Electric conductors, nes < 80 volts, with connecto... 0.10 0.00%
848190 Parts of taps, cocks, valves or similar appliances 0.10 0.00%
851220 Lighting/visual signalling equipment nes 0.06 0.00%
630140 Blankets (except electric) & travel rugs, synth fi... 0.04 0.00%
999999 Commodities not specified according to kind 0.03 0.00%
731029 Cans, iron or steel, capacity <50 litres nes 0.03 0.00%
611593 Hosiery nes, synthetic fibres, knit 0.02 0.00%
848180 Taps, cocks, valves and similar appliances, nes 0.02 0.00%
853890 Parts, electric switches, protectors & connectors ... 0.02 0.00%
Total 3,963.46 100.00%
2013
760120 Aluminium unwrought, alloyed 4,183.16 67.63%
110100 Wheat or meslin flour 1,042.49 16.85%
151529 Maize oil, fractions, refined not chemically modif... 305.80 4.94%
151521 Maize oil crude 217.42 3.52%
071320 Chickpeas, dried, shelled 146.78 2.37%
380400 Residual lyes from the manufacture of wood pulp 53.64 0.87%
821210 Razors including safety razors, open blade razors 53.63 0.87%
440799 Lumber, non-coniferous nes 35.35 0.57%
761699 Articles of aluminium, n 27.08 0.44%
310221 Ammonium sulphate, in packs >10 kg 23.60 0.38%
391710 Sausage casings of hardened protein, cellulose 20.80 0.34%
853690 Electrical switch, protector, connecter for < 1kV ... 15.04 0.24%
110311 Wheat meal 14.74 0.24%
441219 Plywood, all softwood, each ply < 6mm thick 13.47 0.22%
854430 Ignition/other wiring sets for vehicles/aircraft/s... 11.73 0.19%
440710 Lumber, coniferous (softwood) thickness < 6 mm 5.26 0.09%
392690 Plastic articles nes 3.72 0.06%
294190 Antibiotics nes, in bulk 2.42 0.04%
842833 Continuous action goods conveyor or elevator belt ... 1.67 0.03%
842290 Parts of wash, filling, closing, aerating machiner... 1.31 0.02%
851780 Elect apparatus for line 1.27 0.02%
380992 Finishing agents & dye carriers - paper industry 1.05 0.02%
848330 Bearing housings, shafts, without ball/roller bear... 0.88 0.01%
321519 Printing ink, other than black 0.86 0.01%
848310 Transmission shafts and cranks, cam and crank shaf... 0.66 0.01%
901780 Instruments for measuring length, hand use, nes 0.35 0.01%
870899 Motor vehicle parts nes 0.25 0.00%
610449 Womens, girls dresses, of material nes, knit 0.22 0.00%
320890 Polymer based paint, varnish in non-aqueous medium... 0.21 0.00%
848590 Machinery parts, non-electrical, nes 0.19 0.00%
731815 Bolts/screws nes, with/without nut/washer, iron/st... 0.12 0.00%
847890 Parts of machinery for preparing tobacco 0.08 0.00%
732020 Springs, helical, iron or steel 0.02 0.00%
731816 Nuts, iron or steel 0.02 0.00%
Total 6,185.30 100.00%