PAINT ON POWER: ENHANCED DURABILITY AND PROCESSABILITY
15
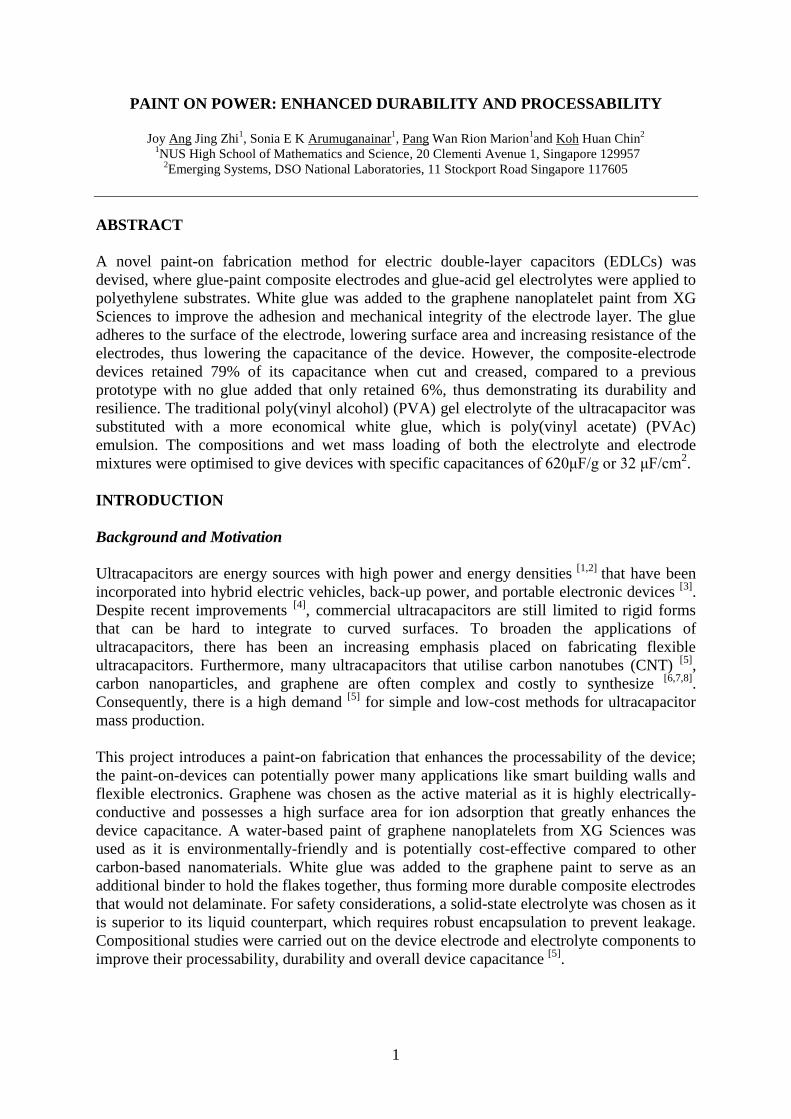
1 PAINT ON POWER: ENHANCED DURABILITY AND PROCESSABILITY Joy Ang Jing Zhi 1 , Sonia E K Arumuganainar 1 , Pang Wan Rion Marion 1 and Koh Huan Chin 2 1 NUS High School of Mathematics and Science, 20 Clementi Avenue 1, Singapore 129957 2 Emerging Systems, DSO National Laboratories, 11 Stockport Road Singapore 117605 ABSTRACT A novel paint-on fabrication method for electric double-layer capacitors (EDLCs) was devised, where glue-paint composite electrodes and glue-acid gel electrolytes were applied to polyethylene substrates. White glue was added to the graphene nanoplatelet paint from XG Sciences to improve the adhesion and mechanical integrity of the electrode layer. The glue adheres to the surface of the electrode, lowering surface area and increasing resistance of the electrodes, thus lowering the capacitance of the device. However, the composite-electrode devices retained 79% of its capacitance when cut and creased, compared to a previous prototype with no glue added that only retained 6%, thus demonstrating its durability and resilience. The traditional poly(vinyl alcohol) (PVA) gel electrolyte of the ultracapacitor was substituted with a more economical white glue, which is poly(vinyl acetate) (PVAc) emulsion. The compositions and wet mass loading of both the electrolyte and electrode mixtures were optimised to give devices with specific capacitances of 620μF/g or 32 μF/cm 2 . INTRODUCTION Background and Motivation Ultracapacitors are energy sources with high power and energy densities [1,2] that have been incorporated into hybrid electric vehicles, back-up power, and portable electronic devices [3] . Despite recent improvements [4] , commercial ultracapacitors are still limited to rigid forms that can be hard to integrate to curved surfaces. To broaden the applications of ultracapacitors, there has been an increasing emphasis placed on fabricating flexible ultracapacitors. Furthermore, many ultracapacitors that utilise carbon nanotubes (CNT) [5] , carbon nanoparticles, and graphene are often complex and costly to synthesize [6,7,8] . Consequently, there is a high demand [5] for simple and low-cost methods for ultracapacitor mass production. This project introduces a paint-on fabrication that enhances the processability of the device; the paint-on-devices can potentially power many applications like smart building walls and flexible electronics. Graphene was chosen as the active material as it is highly electrically- conductive and possesses a high surface area for ion adsorption that greatly enhances the device capacitance. A water-based paint of graphene nanoplatelets from XG Sciences was used as it is environmentally-friendly and is potentially cost-effective compared to other carbon-based nanomaterials. White glue was added to the graphene paint to serve as an additional binder to hold the flakes together, thus forming more durable composite electrodes that would not delaminate. For safety considerations, a solid-state electrolyte was chosen as it is superior to its liquid counterpart, which requires robust encapsulation to prevent leakage. Compositional studies were carried out on the device electrode and electrolyte components to improve their processability, durability and overall device capacitance [5] .
Transcript of PAINT ON POWER: ENHANCED DURABILITY AND PROCESSABILITY
1
PAINT ON POWER: ENHANCED DURABILITY AND PROCESSABILITY
Joy Ang Jing Zhi1, Sonia E K Arumuganainar
1, Pang Wan Rion Marion
1and Koh Huan Chin
2
1NUS High School of Mathematics and Science, 20 Clementi Avenue 1, Singapore 129957
2Emerging Systems, DSO National Laboratories, 11 Stockport Road Singapore 117605
ABSTRACT
A novel paint-on fabrication method for electric double-layer capacitors (EDLCs) was
devised, where glue-paint composite electrodes and glue-acid gel electrolytes were applied to
polyethylene substrates. White glue was added to the graphene nanoplatelet paint from XG
Sciences to improve the adhesion and mechanical integrity of the electrode layer. The glue
adheres to the surface of the electrode, lowering surface area and increasing resistance of the
electrodes, thus lowering the capacitance of the device. However, the composite-electrode
devices retained 79% of its capacitance when cut and creased, compared to a previous
prototype with no glue added that only retained 6%, thus demonstrating its durability and
resilience. The traditional poly(vinyl alcohol) (PVA) gel electrolyte of the ultracapacitor was
substituted with a more economical white glue, which is poly(vinyl acetate) (PVAc)
emulsion. The compositions and wet mass loading of both the electrolyte and electrode
mixtures were optimised to give devices with specific capacitances of 620μF/g or 32 μF/cm2.
INTRODUCTION
Background and Motivation
Ultracapacitors are energy sources with high power and energy densities [1,2]
that have been
incorporated into hybrid electric vehicles, back-up power, and portable electronic devices [3]
.
Despite recent improvements [4]
, commercial ultracapacitors are still limited to rigid forms
that can be hard to integrate to curved surfaces. To broaden the applications of
ultracapacitors, there has been an increasing emphasis placed on fabricating flexible
ultracapacitors. Furthermore, many ultracapacitors that utilise carbon nanotubes (CNT) [5]
,
carbon nanoparticles, and graphene are often complex and costly to synthesize [6,7,8]
.
Consequently, there is a high demand [5]
for simple and low-cost methods for ultracapacitor
mass production.
This project introduces a paint-on fabrication that enhances the processability of the device;
the paint-on-devices can potentially power many applications like smart building walls and
flexible electronics. Graphene was chosen as the active material as it is highly electrically-
conductive and possesses a high surface area for ion adsorption that greatly enhances the
device capacitance. A water-based paint of graphene nanoplatelets from XG Sciences was
used as it is environmentally-friendly and is potentially cost-effective compared to other
carbon-based nanomaterials. White glue was added to the graphene paint to serve as an
additional binder to hold the flakes together, thus forming more durable composite electrodes
that would not delaminate. For safety considerations, a solid-state electrolyte was chosen as it
is superior to its liquid counterpart, which requires robust encapsulation to prevent leakage.
Compositional studies were carried out on the device electrode and electrolyte components to
improve their processability, durability and overall device capacitance [5]
.
2
Electric Double-Layer Capacitor Model
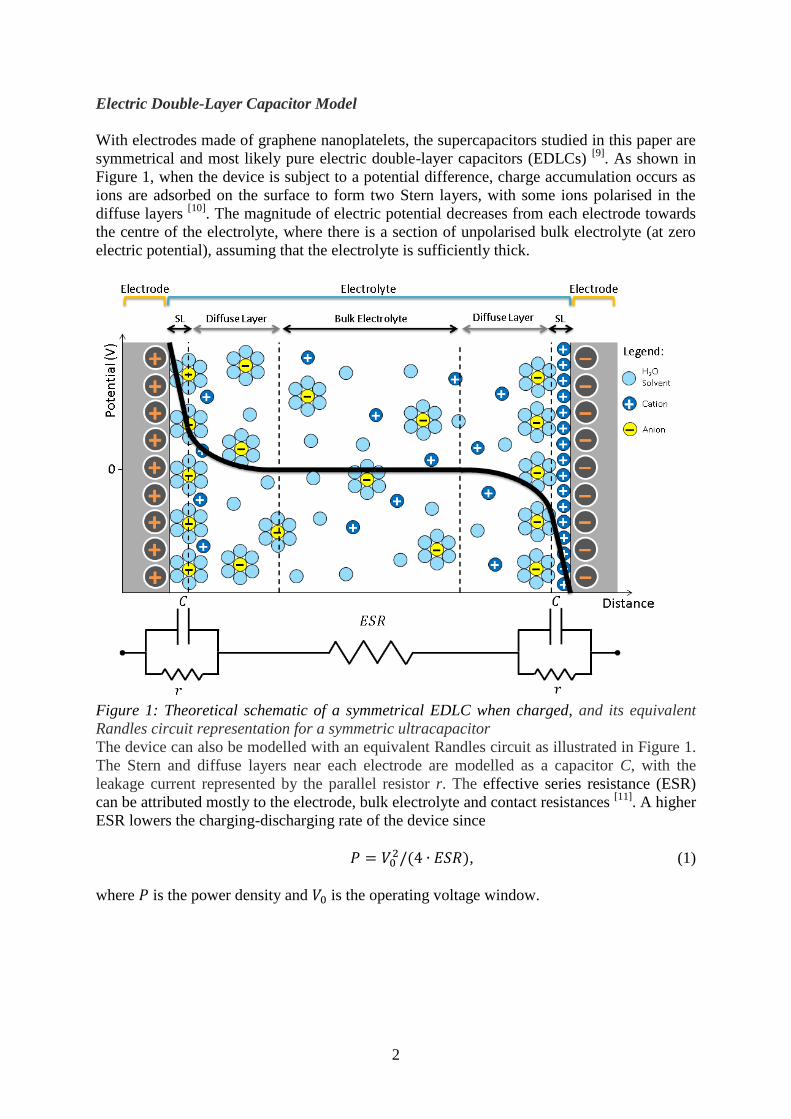
With electrodes made of graphene nanoplatelets, the supercapacitors studied in this paper are
symmetrical and most likely pure electric double-layer capacitors (EDLCs) [9]
. As shown in
Figure 1, when the device is subject to a potential difference, charge accumulation occurs as
ions are adsorbed on the surface to form two Stern layers, with some ions polarised in the
diffuse layers [10]
. The magnitude of electric potential decreases from each electrode towards
the centre of the electrolyte, where there is a section of unpolarised bulk electrolyte (at zero
electric potential), assuming that the electrolyte is sufficiently thick.
Figure 1: Theoretical schematic of a symmetrical EDLC when charged, and its equivalent
Randles circuit representation for a symmetric ultracapacitor
The device can also be modelled with an equivalent Randles circuit as illustrated in Figure 1.
The Stern and diffuse layers near each electrode are modelled as a capacitor C, with the
leakage current represented by the parallel resistor r. The effective series resistance (ESR)
can be attributed mostly to the electrode, bulk electrolyte and contact resistances [11]
. A higher
ESR lowers the charging-discharging rate of the device since
, (1)
where is the power density and is the operating voltage window.
3
MATERIALS AND METHODS
Design of Ultracapacitors
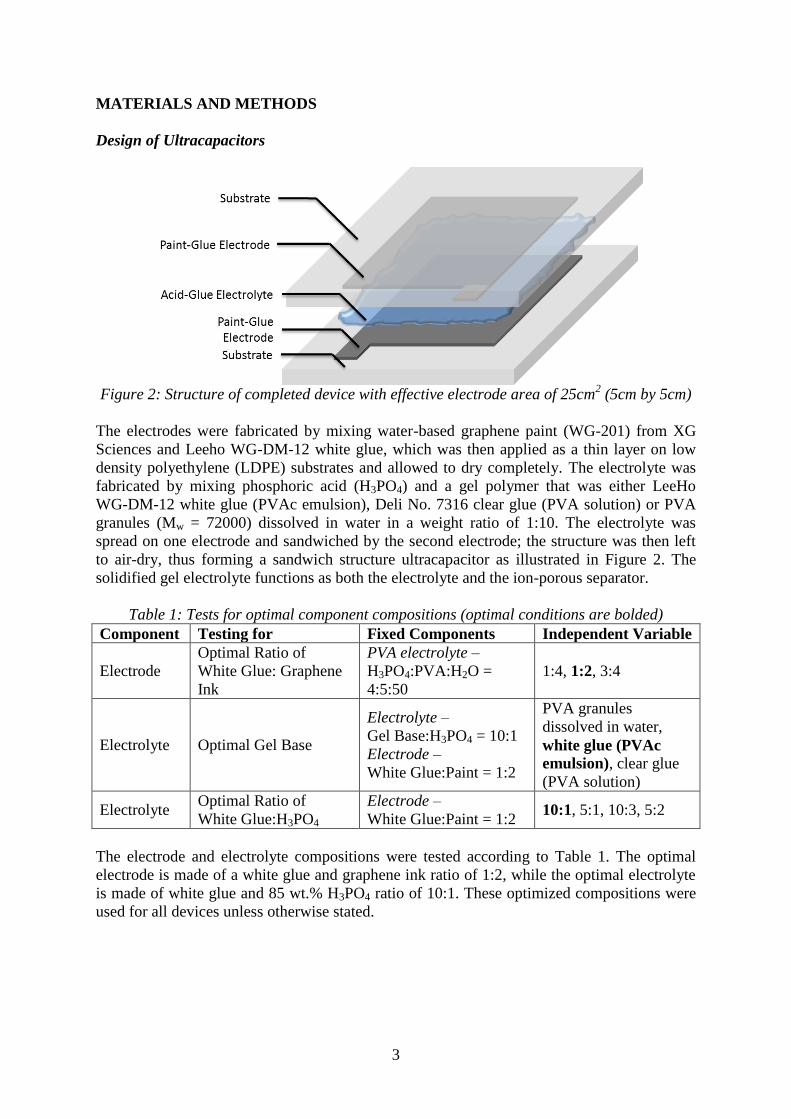
Figure 2: Structure of completed device with effective electrode area of 25cm
2 (5cm by 5cm)
The electrodes were fabricated by mixing water-based graphene paint (WG-201) from XG
Sciences and Leeho WG-DM-12 white glue, which was then applied as a thin layer on low
density polyethylene (LDPE) substrates and allowed to dry completely. The electrolyte was
fabricated by mixing phosphoric acid (H3PO4) and a gel polymer that was either LeeHo
WG-DM-12 white glue (PVAc emulsion), Deli No. 7316 clear glue (PVA solution) or PVA
granules (Mw = 72000) dissolved in water in a weight ratio of 1:10. The electrolyte was
spread on one electrode and sandwiched by the second electrode; the structure was then left
to air-dry, thus forming a sandwich structure ultracapacitor as illustrated in Figure 2. The
solidified gel electrolyte functions as both the electrolyte and the ion-porous separator.
Table 1: Tests for optimal component compositions (optimal conditions are bolded)
Component Testing for Fixed Components Independent Variable
Electrode
Optimal Ratio of
White Glue: Graphene
Ink
PVA electrolyte –
H3PO4:PVA:H2O =
4:5:50
1:4, 1:2, 3:4
Electrolyte Optimal Gel Base
Electrolyte –
Gel Base:H3PO4 = 10:1
Electrode –
White Glue:Paint = 1:2
PVA granules
dissolved in water,
white glue (PVAc
emulsion), clear glue
(PVA solution)
Electrolyte Optimal Ratio of
White Glue:H3PO4
Electrode –
White Glue:Paint = 1:2 10:1, 5:1, 10:3, 5:2
The electrode and electrolyte compositions were tested according to Table 1. The optimal
electrode is made of a white glue and graphene ink ratio of 1:2, while the optimal electrolyte
is made of white glue and 85 wt.% H3PO4 ratio of 10:1. These optimized compositions were
used for all devices unless otherwise stated.
4
Testing of Ultracapacitors
The performances of the ultracapacitor devices were measured using Autolab PGSTAT302N
with General Purpose Electrochemical Software (GPES) version 4.9 software in a two-
electrode setup. Cyclic voltammetry (CV) was used to estimate the specific capacitances of
the fabricated ultracapacitors. Due to the 1.23V stability range of water-based electrolytes,
the potential window was set to 0–1V. The CV test was carried out using a scan rate ( )
of 0.1V/s for 10 cycles. To study the effects of scan rate on device performance, the scan
rates of specific samples were varied to 0.05V/s and 0.01V/s in addition to the previous
0.1V/s for one sample. The current values measured were converted to capacitance using
. (2)
With the potential window of 1V, the average capacitance was found via
∫
∫
. (3)
Analysis of Components
Fourier Transform Infrared (FTIR) Spectroscopy was performed on white glue dried on a
potassium bromide (KBr) disk using Shimadzu IR Presige-21 to ascertain the white glue used
was a PVAc emulsion. This was done in transmission mode against a KBr reference. The
morphology and sheet resistance of the composite electrodes with varying white glue content
(glue to paint ratio of 1:4, 1:2, and 3:4) were studied using Zeiss EVO scanning electron
microscope (SEM) and a four-point probe respectively.
Testing of Damage Resistance of Devices
To test the damage resistance of the devices, the devices were then creased 180° vertically
and cut halfway horizontally, after which CV testing was carried out.
Optimisation of Component Masses
To ensure consistency of the fabrication process, the component masses was optimized. The
electrode mixture was applied in varying amounts of 1.0 g, 1.5g and 2.0g while the
electrolyte mixture was applied in varying amounts of 1.0g, 1.5g and 2.0g on a 5cm×5cm
area. The masses of the layers were recorded after drying, and the specific capacitances were
calculated by dividing the measured capacitances by the combined dried electrode masses.
5
RESULTS AND DISCUSSION
Characterisation of White Glue
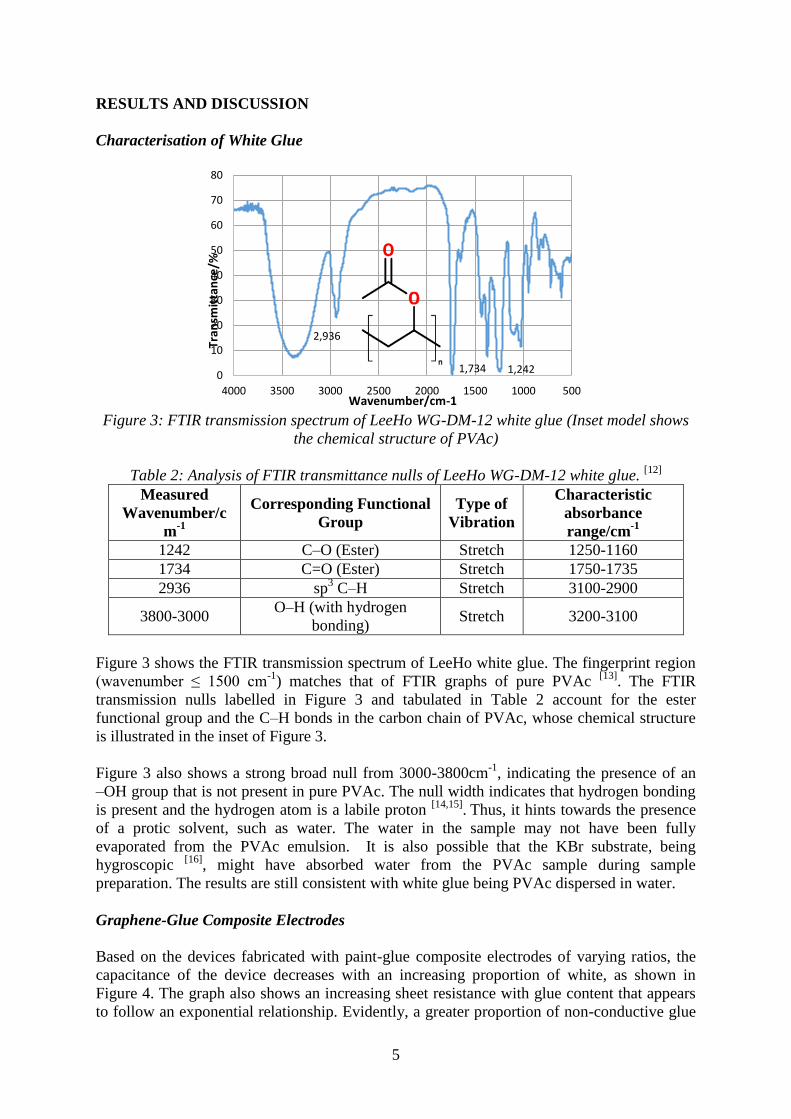
Figure 3: FTIR transmission spectrum of LeeHo WG-DM-12 white glue (Inset model shows
the chemical structure of PVAc)
Table 2: Analysis of FTIR transmittance nulls of LeeHo WG-DM-12 white glue. [12]
Measured
Wavenumber/c
m-1
Corresponding Functional
Group
Type of
Vibration
Characteristic
absorbance
range/cm-1
1242 C–O (Ester) Stretch 1250-1160
1734 C=O (Ester) Stretch 1750-1735
2936 sp3 C–H Stretch 3100-2900
3800-3000 O–H (with hydrogen
bonding) Stretch 3200-3100
Figure 3 shows the FTIR transmission spectrum of LeeHo white glue. The fingerprint region
(wavenumber ≤ 1500 cm-1
) matches that of FTIR graphs of pure PVAc [13]
. The FTIR
transmission nulls labelled in Figure 3 and tabulated in Table 2 account for the ester
functional group and the C–H bonds in the carbon chain of PVAc, whose chemical structure
is illustrated in the inset of Figure 3.
Figure 3 also shows a strong broad null from 3000-3800cm-1
, indicating the presence of an
–OH group that is not present in pure PVAc. The null width indicates that hydrogen bonding
is present and the hydrogen atom is a labile proton [14,15]
. Thus, it hints towards the presence
of a protic solvent, such as water. The water in the sample may not have been fully
evaporated from the PVAc emulsion. It is also possible that the KBr substrate, being
hygroscopic [16]
, might have absorbed water from the PVAc sample during sample
preparation. The results are still consistent with white glue being PVAc dispersed in water.
Graphene-Glue Composite Electrodes
Based on the devices fabricated with paint-glue composite electrodes of varying ratios, the
capacitance of the device decreases with an increasing proportion of white, as shown in
Figure 4. The graph also shows an increasing sheet resistance with glue content that appears
to follow an exponential relationship. Evidently, a greater proportion of non-conductive glue
1,242 1,734
2,936
0
10
20
30
40
50
60
70
80
5001000150020002500300035004000
Tran
smit
tan
ce/%
Wavenumber/cm-1

6
in the composite results in a more resistive and less conductive layer. The increase in
resistance of electrodes causes the ESR of the device to increase, which leads to a lower
power density as shown in Equation (1). This implies that the charging time would be longer
and less energy would be stored within a fixed short time interval, thus the resultant
capacitance of the device calculated from the CV curves would be smaller.
Figure 4: Graph of graphene paint-glue composite electrode sheet resistance (log scale) and
capacitance (linear scale) of corresponding devices against ratio of glue to graphene paint.
Figure 5: (a) Overview of paint electrode surface showing ridges and protrusions from
graphene flakes. (b) Overview of paint-glue composite electrode surface (1:2 ratio) glue coat.
Figure 6: A close-up view of a protruding stack of graphene flakes on the paint surface.
The SEM image of the paint electrode surface in Figure 5(a) depicts many ridges and
graphene flakes protruding from the surface of the paint. From Figure 6, the stack of
0
0.0005
0.001
0.0015
0.002
0.0025
0.003
1
10
100
1000
10000
0 0.2 0.4 0.6 0.8 1 1.2 1.4 1.6
Cap
acit
ance
/F
Re
stiv
ity
/Ω
Ratio of Glue:Paint
Resistivity
Capacitance
(a) (b)
7
graphene flakes have a thicknesses of about 100nm; the thin microstructures implies that the
electrode has a large surface area. In contrast, the paint-glue composite surface in Figure 5(b)
is coated with glue that obscures the graphene surface features. This would increase the
separation distance between the ions in the electrolyte and the electrode, implying a longer
distance and time for ions to diffuse to the active graphene surfaces. Furthermore, it lowers
the active surface area and less ions will be able to adsorb onto the surface to form the Stern
layer. On the whole, the effective surface area of the electrode is reduced, thus lowering the
capacitance and power density of the device.
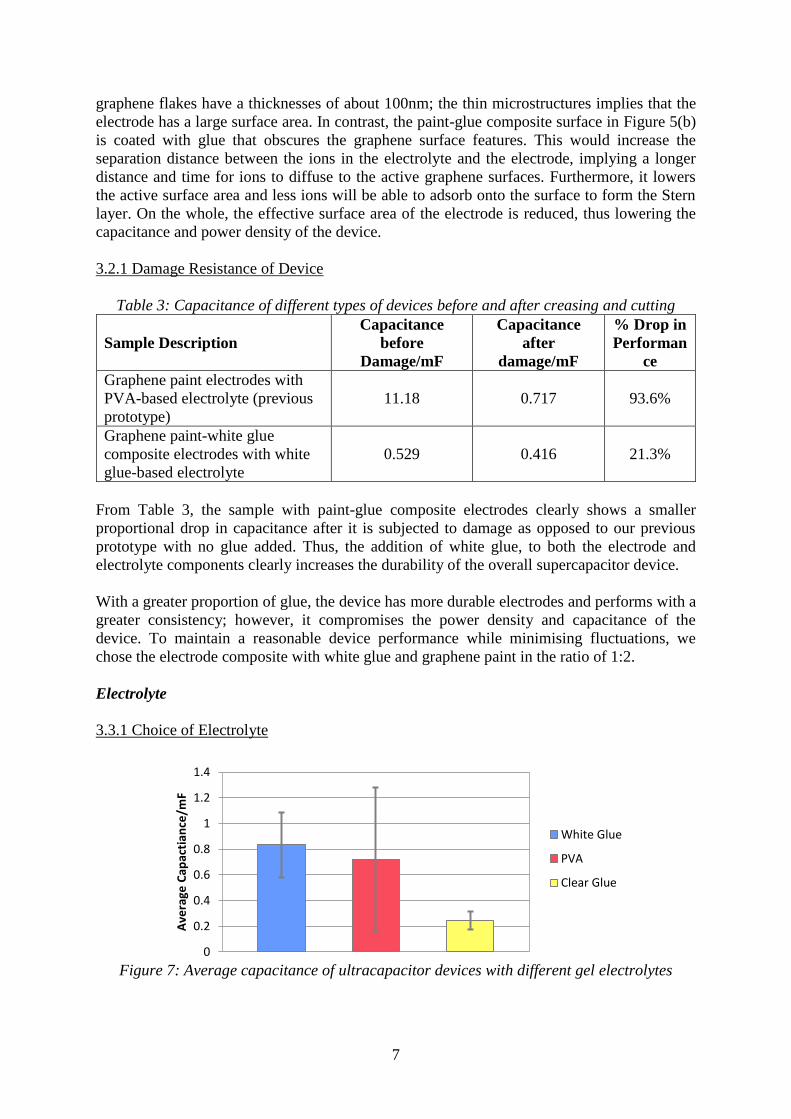
3.2.1 Damage Resistance of Device
Table 3: Capacitance of different types of devices before and after creasing and cutting
Sample Description
Capacitance
before
Damage/mF
Capacitance
after
damage/mF
% Drop in
Performan
ce
Graphene paint electrodes with
PVA-based electrolyte (previous
prototype)
11.18 0.717 93.6%
Graphene paint-white glue
composite electrodes with white
glue-based electrolyte
0.529 0.416 21.3%
From Table 3, the sample with paint-glue composite electrodes clearly shows a smaller
proportional drop in capacitance after it is subjected to damage as opposed to our previous
prototype with no glue added. Thus, the addition of white glue, to both the electrode and
electrolyte components clearly increases the durability of the overall supercapacitor device.
With a greater proportion of glue, the device has more durable electrodes and performs with a
greater consistency; however, it compromises the power density and capacitance of the
device. To maintain a reasonable device performance while minimising fluctuations, we
chose the electrode composite with white glue and graphene paint in the ratio of 1:2.
Electrolyte
3.3.1 Choice of Electrolyte
Figure 7: Average capacitance of ultracapacitor devices with different gel electrolytes
0
0.2
0.4
0.6
0.8
1
1.2
1.4
Ave
rage
Cap
acti
ance
/mF
White Glue
PVA
Clear Glue
8
Figure 7 presents the performance of the devices with different polymer gel electrolytes.
White glue devices gave the highest average capacitance reading. While the average
capacitance reading for PVA is comparable to that of white glue, the variance in performance
is the highest, indicating poor consistency. Thus, white glue is the optimal polymer gel
electrolyte.
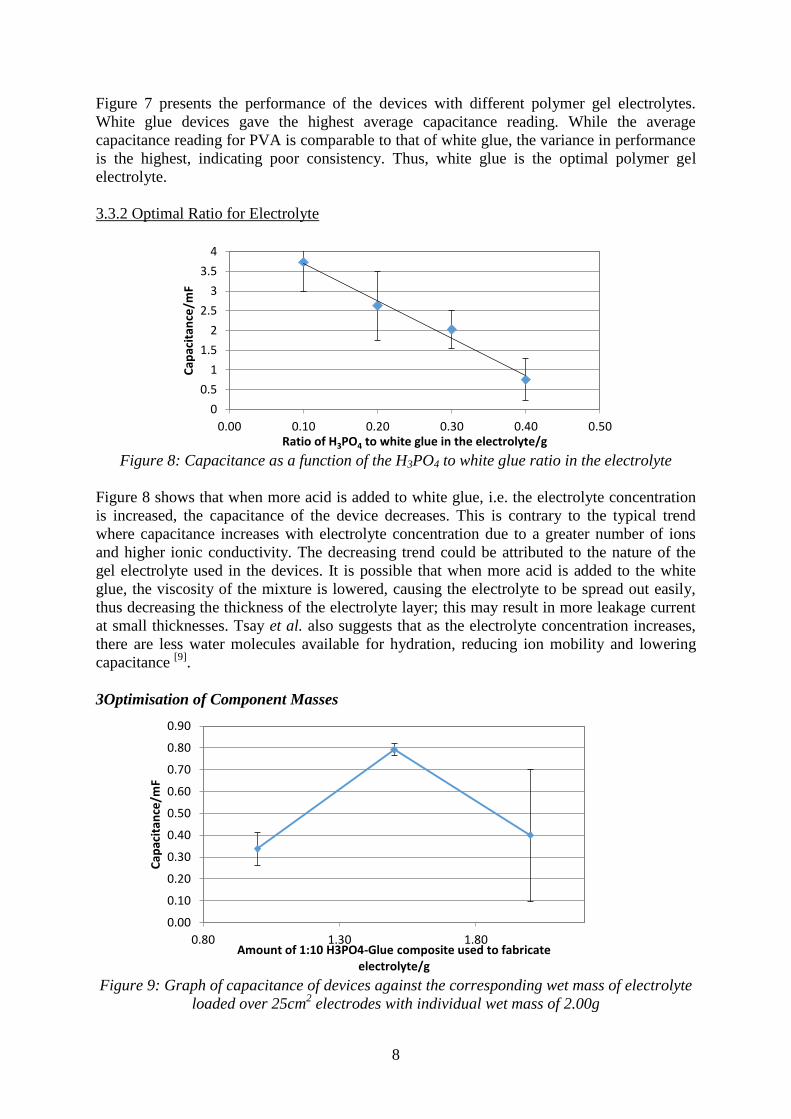
3.3.2 Optimal Ratio for Electrolyte
Figure 8: Capacitance as a function of the H3PO4 to white glue ratio in the electrolyte
Figure 8 shows that when more acid is added to white glue, i.e. the electrolyte concentration
is increased, the capacitance of the device decreases. This is contrary to the typical trend
where capacitance increases with electrolyte concentration due to a greater number of ions
and higher ionic conductivity. The decreasing trend could be attributed to the nature of the
gel electrolyte used in the devices. It is possible that when more acid is added to the white
glue, the viscosity of the mixture is lowered, causing the electrolyte to be spread out easily,
thus decreasing the thickness of the electrolyte layer; this may result in more leakage current
at small thicknesses. Tsay et al. also suggests that as the electrolyte concentration increases,
there are less water molecules available for hydration, reducing ion mobility and lowering
capacitance [9]
.
3Optimisation of Component Masses
Figure 9: Graph of capacitance of devices against the corresponding wet mass of electrolyte
loaded over 25cm2 electrodes with individual wet mass of 2.00g
0
0.5
1
1.5
2
2.5
3
3.5
4
0.00 0.10 0.20 0.30 0.40 0.50
Cap
acit
ance
/mF
Ratio of H3PO4 to white glue in the electrolyte/g
0.00
0.10
0.20
0.30
0.40
0.50
0.60
0.70
0.80
0.90
0.80 1.30 1.80
Cap
acit
ance
/mF
Amount of 1:10 H3PO4-Glue composite used to fabricate electrolyte/g
9
From Figure 9, the device capacitance initially increases with increased electrolyte loading,
but subsequently decreases. At low electrolyte loading (1.00g), the electrolyte layer is most
likely extremely thin, with little total ions for charge accumulation. The diffuse layer on both
sides would likely overlap [17]
and the limited amount of charges would be shared between
the two regions; it is possible the Stern layer does not form completely. Current may also be
able to flow through the thin electrolyte in the form of self-discharge, as the gel electrolyte
functions poorly as a separator. The overall lower charge accumulation thus leads to a lower
capacitance.
At an electrolyte loading of 1.50g, the increase in electrolyte allows for the formation of a
more complete Stern layer, thus driving up capacitance. However, when excess electrolyte is
loaded (2.00g), the Stern layer is most likely saturated. The bulk electrolyte in between the
two charged regions behaves as an Ohmic resistor [18]
and the additional thickness increases
the ESR of the device, thus the device capacitance decreases as explained previously.
The large variance in the device capacitance with 2.00g of electrolyte could be due to sample
preparation. The electrolyte layer was sandwiched between the two electrode layers while it
was still wet, and any excess electrolyte was not necessarily evenly distributed. The greater
the amount of excess electrolyte present, the more thickness variations in the sample, thus
leading to a spread in the measured capacitances. From Figure 9, it is evident samples
fabricated with 1.50g of electrolyte over an area of 25cm2 had the highest capacitance and the
lowest variation amongst all the samples, thus 0.06g/cm2 of electrolyte was optimal.
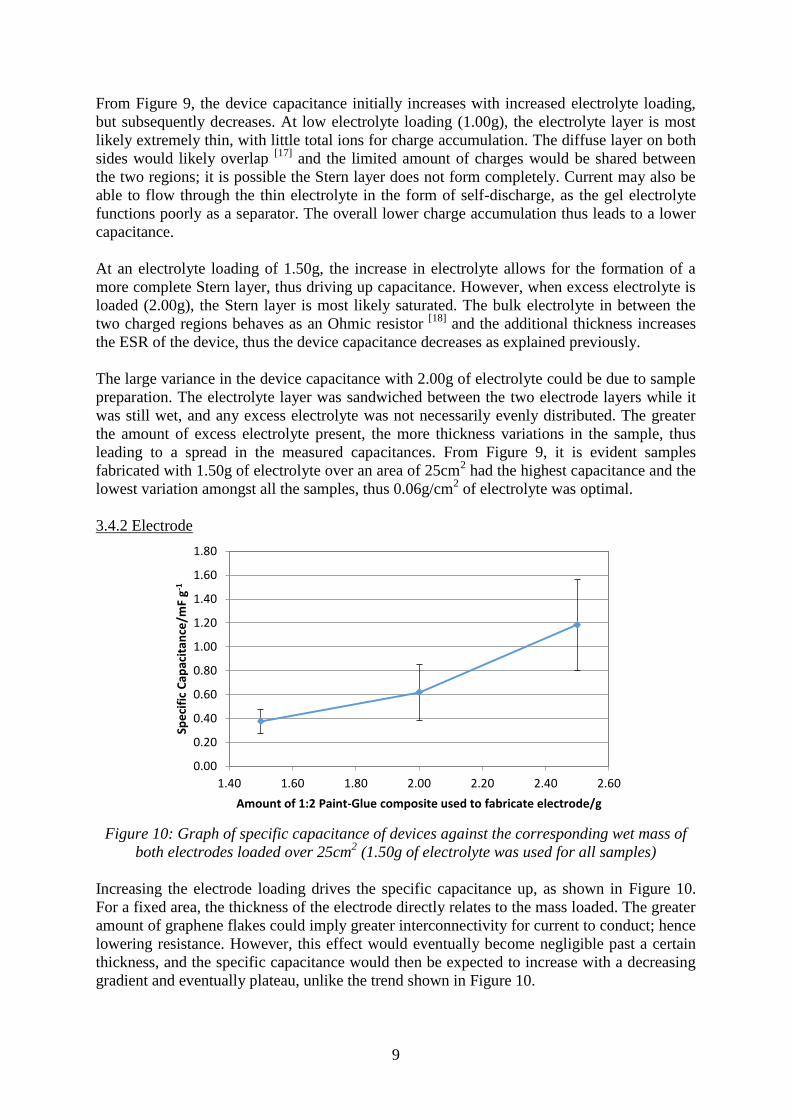
3.4.2 Electrode
Figure 10: Graph of specific capacitance of devices against the corresponding wet mass of
both electrodes loaded over 25cm2 (1.50g of electrolyte was used for all samples)
Increasing the electrode loading drives the specific capacitance up, as shown in Figure 10.
For a fixed area, the thickness of the electrode directly relates to the mass loaded. The greater
amount of graphene flakes could imply greater interconnectivity for current to conduct; hence
lowering resistance. However, this effect would eventually become negligible past a certain
thickness, and the specific capacitance would then be expected to increase with a decreasing
gradient and eventually plateau, unlike the trend shown in Figure 10.
0.00
0.20
0.40
0.60
0.80
1.00
1.20
1.40
1.60
1.80
1.40 1.60 1.80 2.00 2.20 2.40 2.60
Spe
cifi
c C
apac
itan
ce/m
F g-1
Amount of 1:2 Paint-Glue composite used to fabricate electrode/g
10
Another mechanism is needed to account for the increasing gradient. A thicker coat of
graphene paint experiences greater surface stresses as it dries, and the thickest electrode
layers (2.50g load) were observed to curl up. The curled electrodes were then flattened when
the whole device was made into the sandwich structure. This implies that in the device, the
electrode regions nearer to the electrolyte are in tension, while the regions nearer to the
substrate are in compression. The stresses are likely mostly borne by the glue binder, rather
than by the graphene fillers in the electrode. It is possible that due to the stretching of the
electrodes at the surfaces adjacent to the electrolyte, the separation between the graphene
flakes near the surfaces increases, hence exposing more of the graphene surfaces beneath that
are available for charge accumulation. The stretching of the glue binder on the electrode
surface may have also caused it to thin due to a positive Poisson’s ratio. Assuming the glue
coats the graphene surfaces, a thinner glue coating implies easier diffusion and polarization of
the ions in the electrolyte at the electrode-electrolyte interface. The tensile stresses near the
electrode-electrolyte surface could thus result in a higher specific capacitance observed in
Figure 10. An increase in capacitance with tensile stress has been reported by Chen et al. in
their solid-state supercapacitors fabricated with CNT. [19]
However, more studies are required
to confirm this mechanism.
The stresses in the electrode could also introduce fluctuations in our results due to different
amounts of stretching in the samples; this is likely why a greater electrode mass loading
shows greater variation in performance in Figure 10. Using 2.0g electrode load over an area
of 25cm2 achieves a high specific capacitance while maintaining relatively consistent
performance, thus 0.08g/cm2 of electrode composite was found to be optimal. The resultant
specific capacitances with 0.08g/cm2 of electrode and 0.06g/cm
2 of electrolyte are 620μF/g or
32 μF/cm2.
Effect of Scan Rate on Capacitance
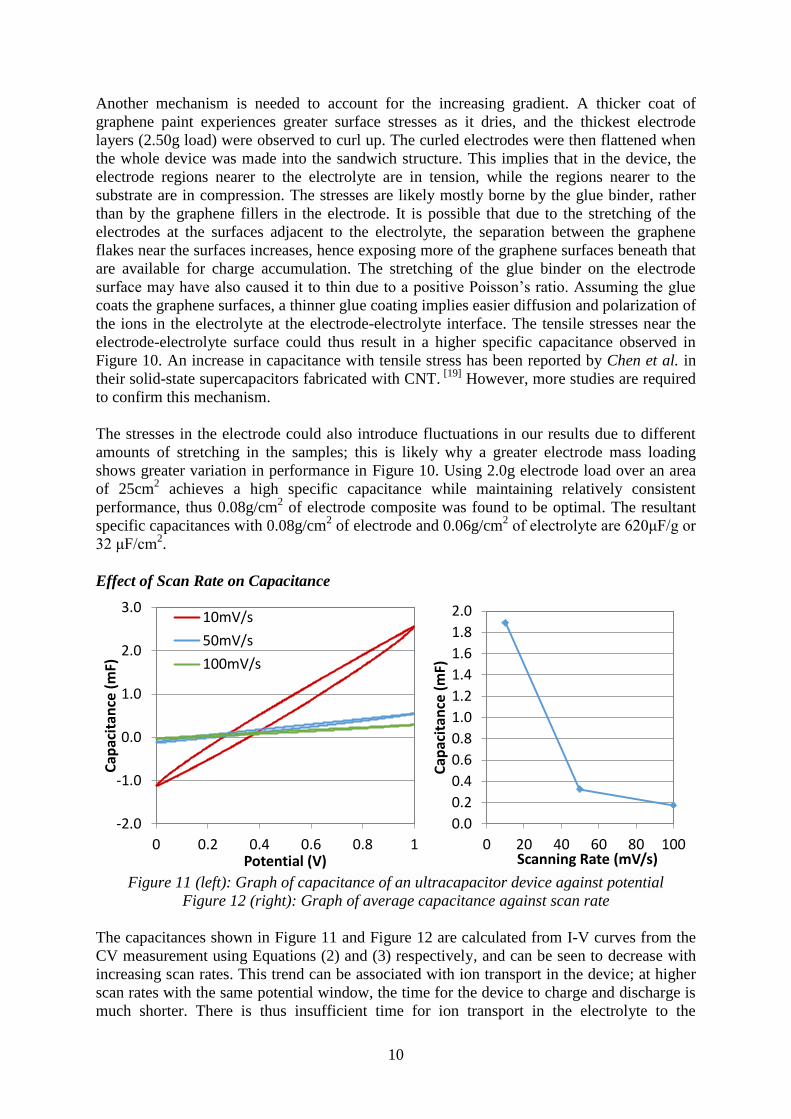
Figure 11 (left): Graph of capacitance of an ultracapacitor device against potential
Figure 12 (right): Graph of average capacitance against scan rate
The capacitances shown in Figure 11 and Figure 12 are calculated from I-V curves from the
CV measurement using Equations (2) and (3) respectively, and can be seen to decrease with
increasing scan rates. This trend can be associated with ion transport in the device; at higher
scan rates with the same potential window, the time for the device to charge and discharge is
much shorter. There is thus insufficient time for ion transport in the electrolyte to the
-2.0
-1.0
0.0
1.0
2.0
3.0
0 0.2 0.4 0.6 0.8 1
Cap
acit
ance
(m
F)
Potential (V)
10mV/s
50mV/s
100mV/s
0.0
0.2
0.4
0.6
0.8
1.0
1.2
1.4
1.6
1.8
2.0
0 20 40 60 80 100
Cap
acit
ance
(m
F)
Scanning Rate (mV/s)
11
electrode layer as the device is charging before the voltage is reversed. This implies that less
ions accumulate at the electrode and that the Stern layers cannot form completely at high scan
rates, leading to a reduction in capacitance and causing the EDLC to function more like a
resistor [20]
. Furthermore, for mesoporous materials, such as the layers of graphene embedded
beneath each other, the effective surface area of the electrode is greatly reduced at high scan
rates [21]
, as there is insufficient time for ions to diffuse and access underlying surfaces,
resulting in the reduced capacitance measured.
CONCLUSION
A paint-on scheme was developed to enhance the processability and flexibility of EDLC.
Polymer composite electrodes were incorporated to enhance the durability of the device, with
some trade-off in capacitance. A mixture of glue and graphene ink in the ratio of 1:2 provided
a relatively high capacitance with low variation. The device with composite electrode
retained much more of its capacitance (79%) when subjected to bending and creasing as
opposed to prior devices with pure graphene paint electrodes (6%).
White glue (PVAc emulsion) was found to provide the highest and most consistent
capacitance. The optimal electrode and electrolyte wet mass loadings were found to be
0.08g/cm2 and 0.06g/cm
2 respectively. The resultant specific capacitances are 620μF/g or 32
μF/cm2.
Our devices can be peeled off from the LDPE substrates, and through the use of adhesives,
these devices could be manufactured in the form of portable stickers, thus expanding the
applications of EDLCs on a multitude of surfaces.
Further analysis of the device architecture could be done in relation to an equivalent circuit
model representative of our device. Self-discharge in the device can also be studied to better
understand the capacitive mechanism in the device and better optimise the components. In
addition, the devices can be further improved by incorporating organic electrolytes that can
function over a much larger potential window, which could help boost the device
performance.
ACKNOWLEDGEMENTS
We are greatly indebted to our research mentor, Ms Koh Huan Chin, for patiently introducing
us to the subject matter and providing insights throughout the course of this project. Our
teacher mentors, Dr Chiam Sher Yi and Mr Poh Boon Hor, helped out tremendously with
administrative matters. We would also like to express our heartfelt gratitude to DSO National
Laboratories for allowing us to use their facilities. Lastly, we would like to thank our family
and friends for their support throughout the course of this project.
12
REFERENCES
[1] Aricò, A. S., Bruce, P., Scrosati, B., Tarascon, J.-M. & van Schalkwijk, W.
Nanostructured materials for advanced energy conversion and storage devices. Nat
Mater 4,366–377 (2005).
[2] A G Pandolfo, A. F. H. Carbon properties and their role in supercapacitors. Journal of
Power Sources 157, 11–27 (2006).
[3] Chu, A. & Braatz, P. Comparison of commercial supercapacitors and high-power
lithium-ion batteries for power-assist applications in hybrid electric vehicles: I. Initial
characterization. Journal of Power Sources 112, 236–246 (2002).
[4] Chen, S.-M., Ramachandran, R., Mani, V., & Saraswathi, R. (2014). Recent
Advancements in Electrode Materials for the High- performance Electrochemical
Supercapacitors: A Review. Int. J. Electrochem. Sci, 9, 4072–4085.
[5] Yuan, L., Lu, X.-H., Xiao, X., Zhai, T., Dai, J., Zhang, F., … Wang, Z. L. (2012).
Flexible Solid-State Supercapacitors Based on Carbon Nanoparticles/MnO 2 Nanorods
Hybrid Structure. ACS Nano, 6(1), 656–661.
[6] Wang, Y.; Shi,Z.;Huang, Y.; Ma, Y.; Wang, C.; Chen,M.; Chen, Y. Supercapacitor
Devices Based on Graphene Materials. J. Phys. Chem. (2009), 113, 13103– 13107.
[7] Wu, Q.; Xu, Y.; Yao, Z.; Liu, A.; Shi, G. Supercapacitors Based on Flexible
Graphene/Polyaniline Nanofi ber Composite Films. ACS Nano (2010), 4, 1963– 1970.
[8] Wang, D. W.; Li, F.; Zhao, J.; Ren, W.; Chen, Z. G.; Tan, J.; Wu, Z. S.; Gentle, I.; Lu,
G. Q.; Cheng, H. M. Fabrication of Graphene/Polyaniline Composite Papervia in situ
Anodic Electropolymerization for High-Performance Flexible Elec-trode. ACS Nano
(2009), 3, 1745– 1752
[9] Tsay, K.-C., Zhang, L., & Zhang, J. (2011). Effects of electrode layer
composition/thickness and electrolyte concentration on both specific capacitance and
energy density of supercapacitor. Electrochimica Acta, 60, 428–436.
[10] Conway, B. E., Bockris, J. O'M. & Ammar, I. A. (1951). The dielectric constant of the
solution in the diffuse and Helmholtz double layers at a charged interface in aqueous
solution. Transactions of the Faraday Society, 47, 756-766.
[11] Bottelberghs, P.H. (1979). Low-Frequency Measurements on Solid Electrolytes and
Their Intepretations. In Hagenmuller, P & Van Gool, W (Eds), Solid Electrolytes:
General Principles, Characterization, Materials, Applications (pp. 146). : Elsevier.
[12] Field, L.D. (c2013). IMPORTANT IR CHROMOPHORES. Organic Structures from
Spectra (pp. 17). : Wiley-Blackwell.
[13] SDBSWeb: http://sdbs.db.aist.go.jp (National Institute of Advanced Industrial Science
and Technology,1 Dec 2015)
13
[14] Han, K.L. (2010). IR Spectra of 2-Naphthol and Its H-Bonded Clusters in S1 State.
Hydrogen Bonding and Transfer in the Excited State (pp. 30). : Wiley-Blackwell.
[15] Field, L.D. (c2013). IMPORTANT IR CHROMOPHORES. Organic Structures from
Spectra (pp. 19). : Wiley-Blackwell.
[16] Smith, B.C. (c1996). How an FTIR works. Fundamentals of Fourier Transform
Infrared Spectroscopy (pp. 44). : CRC Press.
[17] Gogotsi, Y. & Presser, V. (2013). Carbon Nanomaterials for Water Desalination by
Capacitive Deionization. Carbon Nanomaterials (pp. 430-431). : CRC Press.
[18] Bottelberghs, P.H. (1979). Low-Frequency Measurements on Solid Electrolytes and
Their Intepretations. In Hagenmuller, P & Van gool, W (Eds), Solid Electrolytes:
General Principles, Characterization, Materials, Applications (pp. 156). : Elsevier.
[19] Chen, T., Peng, H., Durstock, M., & Dai, L. (2013). High-performance transparent and
stretchable all-solid supercapacitors based on highly aligned carbon nanotube
sheets. Scientific Reports, 4(3612).
[20] Wang, H., & Pilon, L. (2012). Physical interpretation of cyclic voltammetry for
measuring electric double layer capacitances. Electrochimica Acta, 130–139.
[21] Huang, J. (2013). Modern Theories of Carbon-Based Electrochemical
Capacitors. In Béguin, F & Frąckowiak, E (Eds), Supercapacitors: Materials, Systems,
and Applications: Wiley-Blackwell.
14
APPENDIX
A1 Materials and Methods
Composition of Device Components
The optimal electrode composition was found by varying the white glue to paint ratio [1:4,
1:2, 3:4] and studying the resistivity, morphology and mechanical integrity of the electrode
layers; this was done using a four-point probe, scanning electron microscope (SEM) and
visual inspection for flaking on bending. The respective ultracapacitors were then fabricated
with an electrolyte (white glue: H3PO4 = 10:1) and measured using CV.
Electrolyte Composition: Determination of Optimal Material
The electrolyte mixture was made up of varying types of glue, namely PVA, white glue or
clear glue mixed with H3PO4, in the ratio 10:1. The electrode used had a white glue to
graphene paint ratio of 1:2. The CV performance was then measured.
Electrolyte Composition: Determination of Optimal Ratio
The electrode was made up of white glue and graphene paint in the ratio of 1:2. The
electrolyte was made up of white glue and acid is varying ratios of 10:1, 10:2, 10:3, 10:4,
10:5.
Fabrication of Hybrid Samples with Optimal Electrode and Electrolyte Composition
The optimal electrode was made up of graphene paint and white glue in the ratio of 2:1,
while the optimal electrolyte was made up of white glue and phosphoric acid in the ratio of
10:1. These compositions were used for subsequent ultracapacitor prototypes.
A2 Results
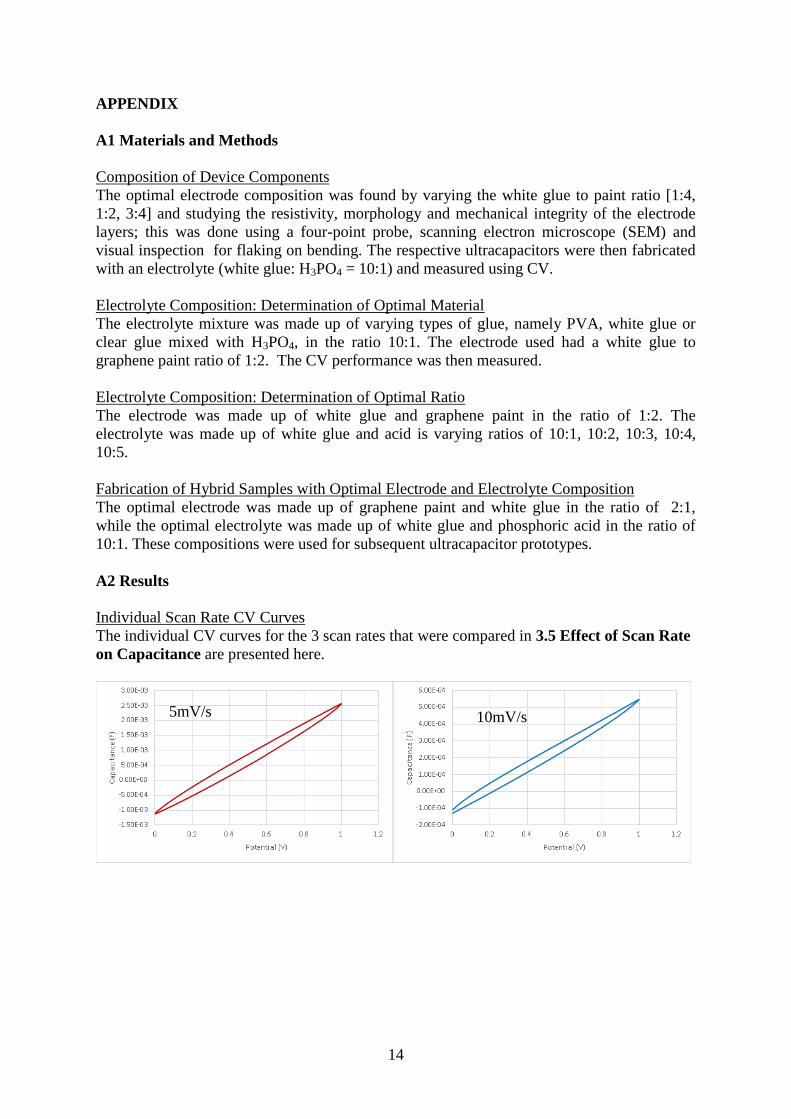
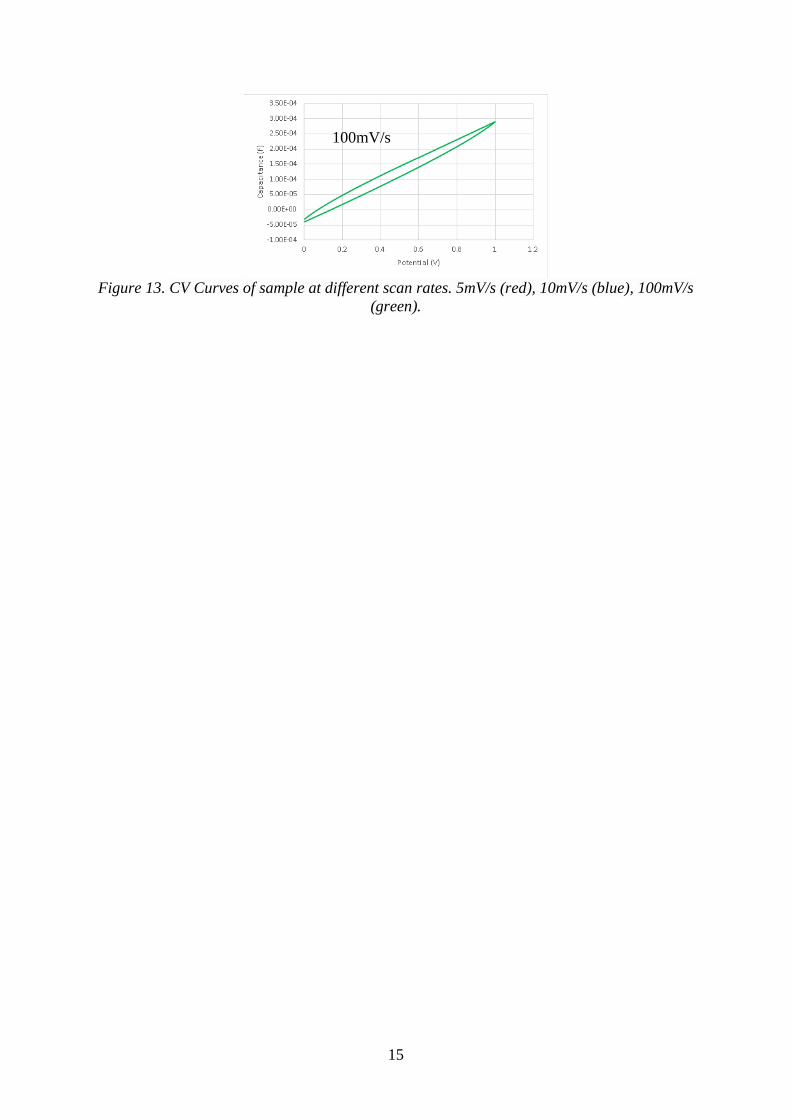
Individual Scan Rate CV Curves
The individual CV curves for the 3 scan rates that were compared in 3.5 Effect of Scan Rate
on Capacitance are presented here.
5mV/s 10mV/s
15
Figure 13. CV Curves of sample at different scan rates. 5mV/s (red), 10mV/s (blue), 100mV/s
(green).
100mV/s