Paine Schwartz Food Chain Fund V, L.P.data.treasury.ri.gov/dataset/c54b9360-1488-4dae-aad8-e... ·...
21
Paine Schwartz Food Chain Fund V, L.P. Presentation to the Rhode Island State Investment Commission May 23, 2018
Transcript of Paine Schwartz Food Chain Fund V, L.P.data.treasury.ri.gov/dataset/c54b9360-1488-4dae-aad8-e... ·...
Paine Schwartz Food Chain Fund V, L.P. Presentation to the Rhode Island State Investment Commission
May 23, 2018
2 PAINE SCHWARTZ PARTNERS
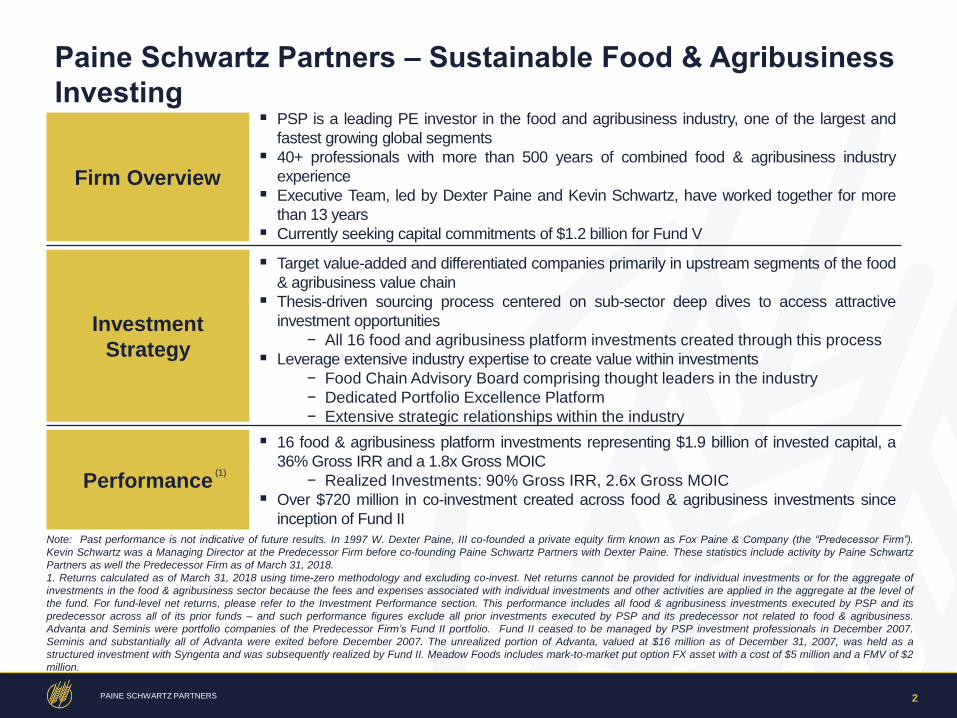
Paine Schwartz Partners – Sustainable Food & Agribusiness
Investing
Firm Overview
Investment
Strategy
Performance
PSP is a leading PE investor in the food and agribusiness industry, one of the largest and
fastest growing global segments
40+ professionals with more than 500 years of combined food & agribusiness industry
experience
Executive Team, led by Dexter Paine and Kevin Schwartz, have worked together for more
than 13 years
Currently seeking capital commitments of $1.2 billion for Fund V
Target value-added and differentiated companies primarily in upstream segments of the food
& agribusiness value chain
Thesis-driven sourcing process centered on sub-sector deep dives to access attractive
investment opportunities
− All 16 food and agribusiness platform investments created through this process
Leverage extensive industry expertise to create value within investments
− Food Chain Advisory Board comprising thought leaders in the industry
− Dedicated Portfolio Excellence Platform
− Extensive strategic relationships within the industry
16 food & agribusiness platform investments representing $1.9 billion of invested capital, a
36% Gross IRR and a 1.8x Gross MOIC
− Realized Investments: 90% Gross IRR, 2.6x Gross MOIC
Over $720 million in co-investment created across food & agribusiness investments since
inception of Fund II
Note: Past performance is not indicative of future results. In 1997 W. Dexter Paine, III co-founded a private equity firm known as Fox Paine & Company (the “Predecessor Firm”).
Kevin Schwartz was a Managing Director at the Predecessor Firm before co-founding Paine Schwartz Partners with Dexter Paine. These statistics include activity by Paine Schwartz
Partners as well the Predecessor Firm as of March 31, 2018.
1. Returns calculated as of March 31, 2018 using time-zero methodology and excluding co-invest. Net returns cannot be provided for individual investments or for the aggregate of
investments in the food & agribusiness sector because the fees and expenses associated with individual investments and other activities are applied in the aggregate at the level of
the fund. For fund-level net returns, please refer to the Investment Performance section. This performance includes all food & agribusiness investments executed by PSP and its
predecessor across all of its prior funds – and such performance figures exclude all prior investments executed by PSP and its predecessor not related to food & agribusiness.
Advanta and Seminis were portfolio companies of the Predecessor Firm’s Fund II portfolio. Fund II ceased to be managed by PSP investment professionals in December 2007.
Seminis and substantially all of Advanta were exited before December 2007. The unrealized portion of Advanta, valued at $16 million as of December 31, 2007, was held as a
structured investment with Syngenta and was subsequently realized by Fund II. Meadow Foods includes mark-to-market put option FX asset with a cost of $5 million and a FMV of $2
million.
(1)
3 PAINE SCHWARTZ PARTNERS
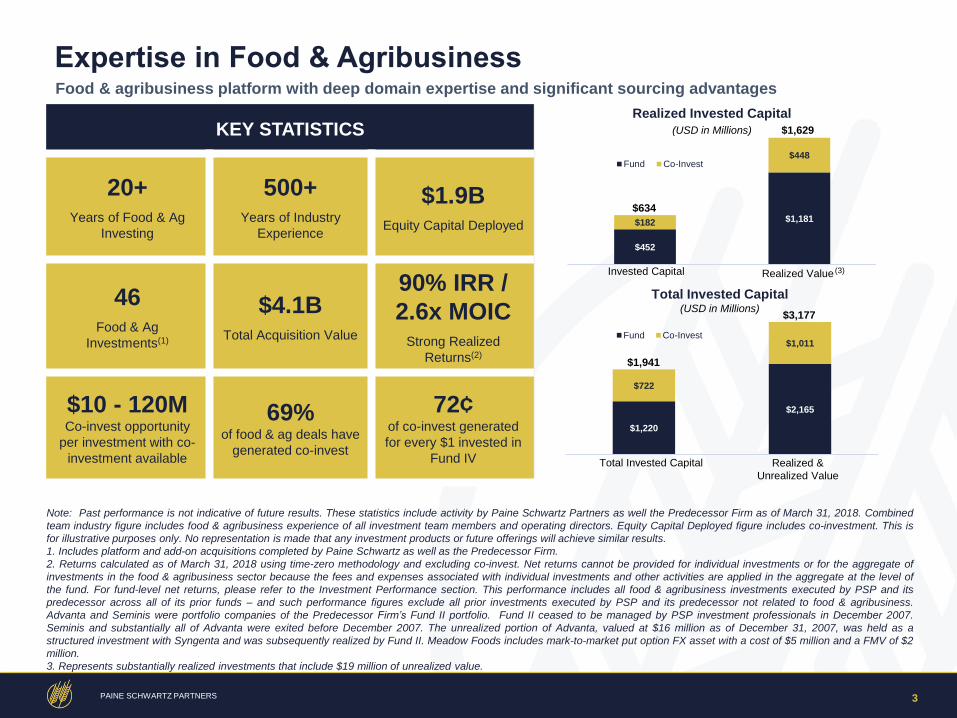
Expertise in Food & Agribusiness
KEY STATISTICS
20+ Years of Food & Ag
Investing
500+ Years of Industry
Experience
$1.9B Equity Capital Deployed
46 Food & Ag
Investments(1)
$4.1B Total Acquisition Value
90% IRR /
2.6x MOIC Strong Realized
Returns(2)
$10 - 120M Co-invest opportunity
per investment with co-
investment available
69% of food & ag deals have
generated co-invest
72¢ of co-invest generated
for every $1 invested in
Fund IV
Note: Past performance is not indicative of future results. These statistics include activity by Paine Schwartz Partners as well the Predecessor Firm as of March 31, 2018. Combined
team industry figure includes food & agribusiness experience of all investment team members and operating directors. Equity Capital Deployed figure includes co-investment. This is
for illustrative purposes only. No representation is made that any investment products or future offerings will achieve similar results.
1. Includes platform and add-on acquisitions completed by Paine Schwartz as well as the Predecessor Firm.
2. Returns calculated as of March 31, 2018 using time-zero methodology and excluding co-invest. Net returns cannot be provided for individual investments or for the aggregate of
investments in the food & agribusiness sector because the fees and expenses associated with individual investments and other activities are applied in the aggregate at the level of
the fund. For fund-level net returns, please refer to the Investment Performance section. This performance includes all food & agribusiness investments executed by PSP and its
predecessor across all of its prior funds – and such performance figures exclude all prior investments executed by PSP and its predecessor not related to food & agribusiness.
Advanta and Seminis were portfolio companies of the Predecessor Firm’s Fund II portfolio. Fund II ceased to be managed by PSP investment professionals in December 2007.
Seminis and substantially all of Advanta were exited before December 2007. The unrealized portion of Advanta, valued at $16 million as of December 31, 2007, was held as a
structured investment with Syngenta and was subsequently realized by Fund II. Meadow Foods includes mark-to-market put option FX asset with a cost of $5 million and a FMV of $2
million.
3. Represents substantially realized investments that include $19 million of unrealized value.
Food & agribusiness platform with deep domain expertise and significant sourcing advantages
$452
$1,181 $182
$448 Fund Co-Invest
Realized Invested Capital
(USD in Millions)
$634
Invested Capital Realized Value
$1,629
(3)
$1,220
$2,165
$722
$1,011 Fund Co-Invest
$1,941
Total Invested Capital Realized &
Unrealized Value
$3,177 (USD in Millions)
Total Invested Capital
4 PAINE SCHWARTZ PARTNERS
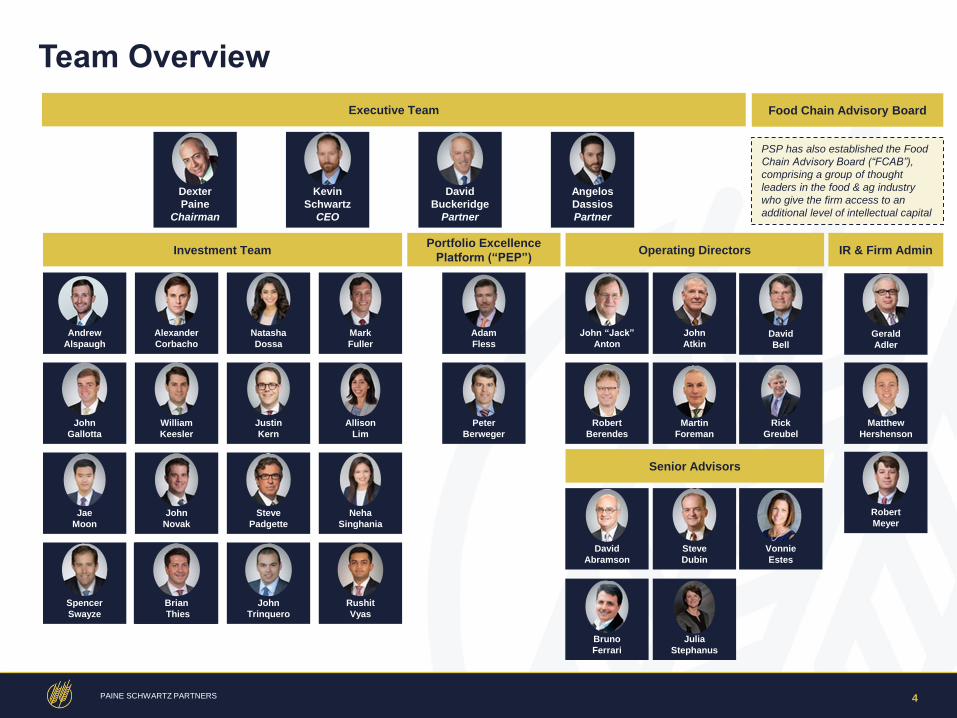
Team Overview
Executive Team
Operating Directors
Investment Team
Portfolio Excellence
Platform (“PEP”) IR & Firm Admin
Adam
Fless
John “Jack”
Anton
John
Atkin David
Bell
Steve
Padgette
Neha
Singhania
Spencer
Swayze
John
Novak
Rick
Greubel
Alexander
Corbacho
Natasha
Dossa
Mark
Fuller
John
Gallotta
Allison
Lim
Jae
Moon
William
Keesler
Justin
Kern
Peter
Berweger
Robert
Berendes
Martin
Foreman
David
Abramson
Steve
Dubin
Bruno
Ferrari
Gerald
Adler
Robert
Meyer
Dexter
Paine
Chairman
Kevin
Schwartz
CEO
David
Buckeridge
Partner
Angelos
Dassios
Partner
Vonnie
Estes
Julia
Stephanus
Matthew
Hershenson
Food Chain Advisory Board
PSP has also established the Food
Chain Advisory Board (“FCAB”),
comprising a group of thought
leaders in the food & ag industry
who give the firm access to an
additional level of intellectual capital
John
Trinquero
Rushit
Vyas
Brian
Thies
Brian
Thies
Andrew
Alspaugh
Senior Advisors
5 PAINE SCHWARTZ PARTNERS
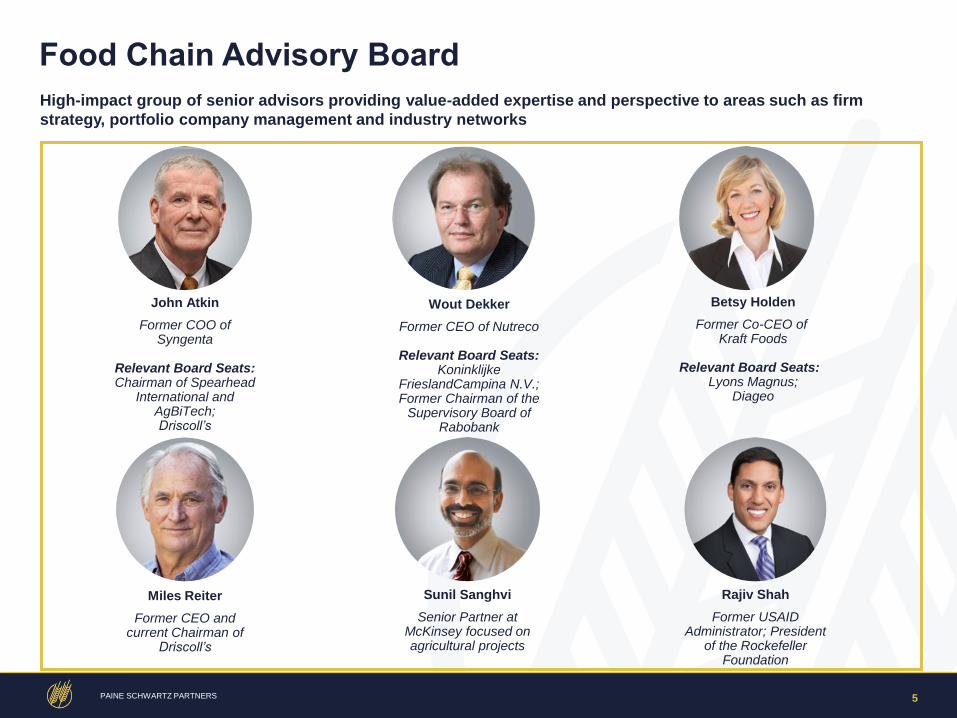
Food Chain Advisory Board
Sunil Sanghvi
Senior Partner at McKinsey focused on agricultural projects
Betsy Holden
Former Co-CEO of Kraft Foods
Relevant Board Seats:
Lyons Magnus; Diageo
Rajiv Shah
Former USAID Administrator; President
of the Rockefeller Foundation
Wout Dekker
Former CEO of Nutreco
Relevant Board Seats: Koninklijke
FrieslandCampina N.V.; Former Chairman of the
Supervisory Board of Rabobank
John Atkin
Former COO of Syngenta
Relevant Board Seats: Chairman of Spearhead
International and AgBiTech; Driscoll’s
Miles Reiter
Former CEO and current Chairman of
Driscoll’s
High-impact group of senior advisors providing value-added expertise and perspective to areas such as firm
strategy, portfolio company management and industry networks
6 PAINE SCHWARTZ PARTNERS
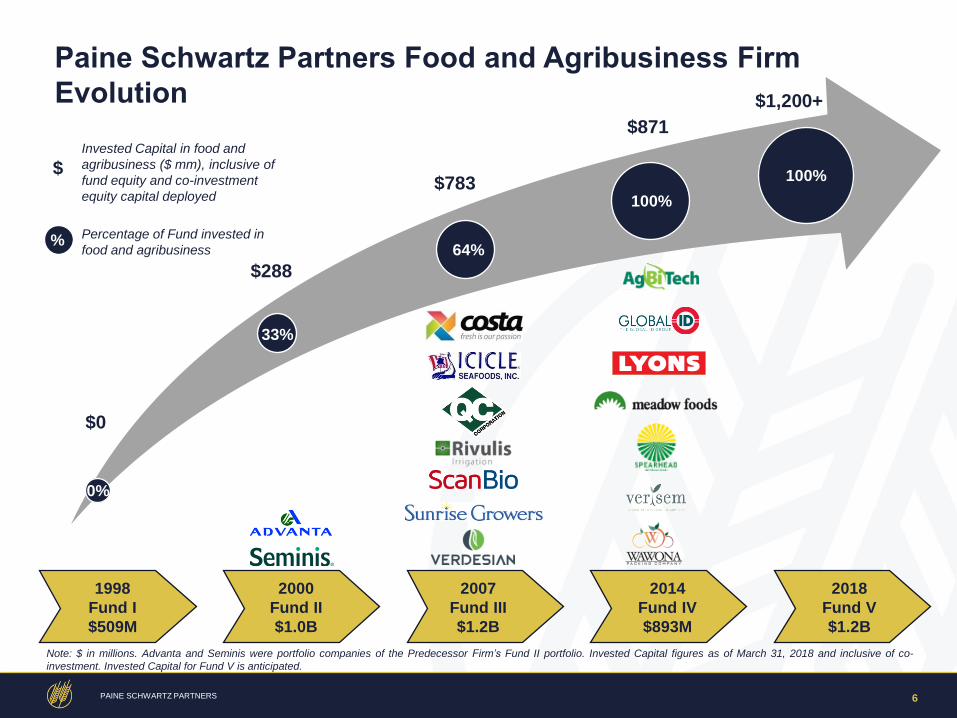
Paine Schwartz Partners Food and Agribusiness Firm
Evolution
Note: $ in millions. Advanta and Seminis were portfolio companies of the Predecessor Firm’s Fund II portfolio. Invested Capital figures as of March 31, 2018 and inclusive of co-
investment. Invested Capital for Fund V is anticipated.
100%
100%
64%
33%
0%
$0
$783
$288
$871
$1,200+
Invested Capital in food and
agribusiness ($ mm), inclusive of
fund equity and co-investment
equity capital deployed
% Percentage of Fund invested in
food and agribusiness
$
1998
Fund I
$509M
2000
Fund II
$1.0B
2007
Fund III
$1.2B
2014
Fund IV
$893M
2018
Fund V
$1.2B
7 PAINE SCHWARTZ PARTNERS
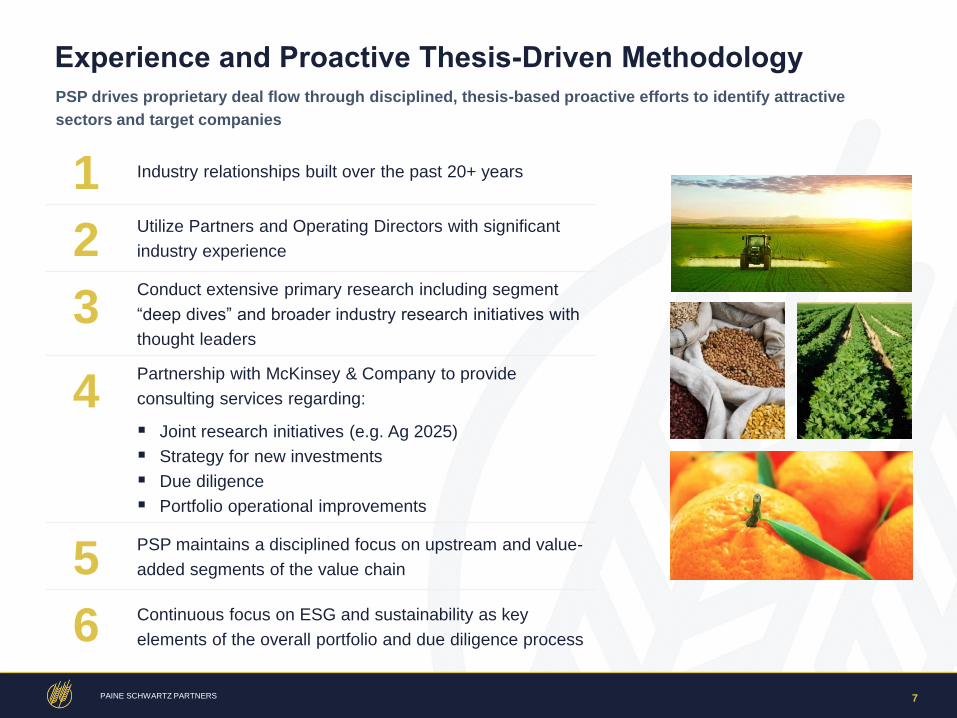
Experience and Proactive Thesis-Driven Methodology
1 Industry relationships built over the past 20+ years
2 Utilize Partners and Operating Directors with significant
industry experience
3 Conduct extensive primary research including segment
“deep dives” and broader industry research initiatives with
thought leaders
4 Partnership with McKinsey & Company to provide
consulting services regarding:
Joint research initiatives (e.g. Ag 2025)
Strategy for new investments
Due diligence
Portfolio operational improvements
5 PSP maintains a disciplined focus on upstream and value-
added segments of the value chain
6 Continuous focus on ESG and sustainability as key
elements of the overall portfolio and due diligence process
PSP drives proprietary deal flow through disciplined, thesis-based proactive efforts to identify attractive
sectors and target companies
8 PAINE SCHWARTZ PARTNERS
A
NIM
AL
PR
OT
EIN
S
Grains
IP / Genetics
Seed
Fertilizer
Water
Feed
Animal Health & Nutrition
Crop Production
Storage/
Handling
Packing
Commodity
Trading
Equipment
Food Ingredients
Contract
Manufacturing
Branded &
Private Label
Consumer
Products
Distribution
Retail
Foodservice
Fruits &
Vegetables
Dairy
Terrestrial
Livestock
Production
Livestock
Seafood
Aquaculture, Wild
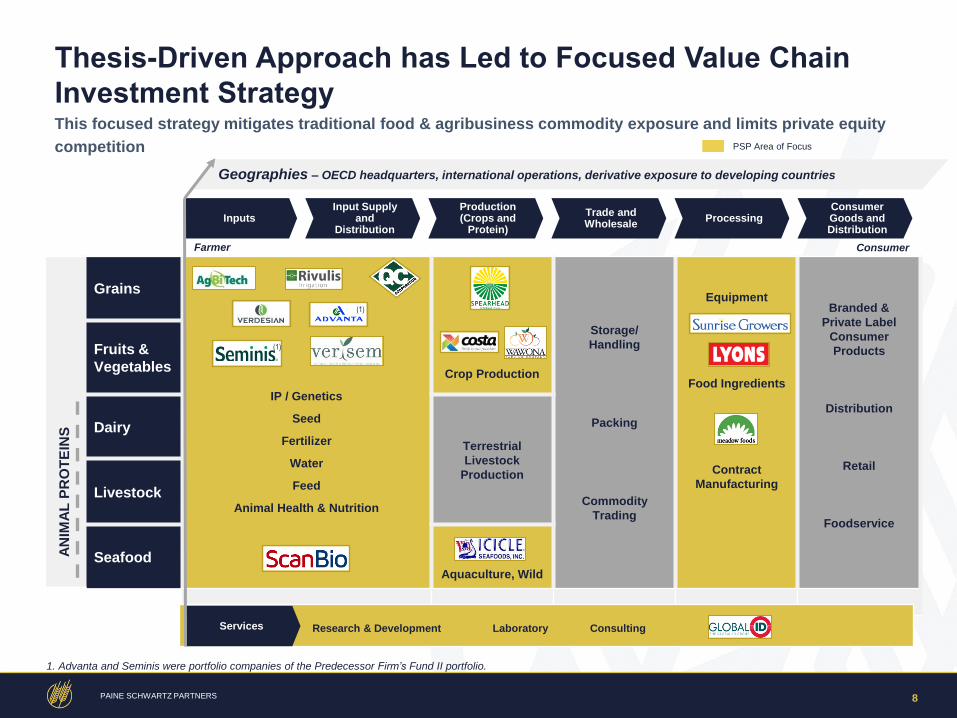
Thesis-Driven Approach has Led to Focused Value Chain
Investment Strategy
(1)
Geographies – OECD headquarters, international operations, derivative exposure to developing countries
Inputs Input Supply
and Distribution
Production (Crops and
Protein)
Trade and Wholesale
Processing Consumer Goods and Distribution
Farmer Consumer
PSP Area of Focus
(1)
Services
This focused strategy mitigates traditional food & agribusiness commodity exposure and limits private equity
competition
Research & Development
Laboratory Consulting
1. Advanta and Seminis were portfolio companies of the Predecessor Firm’s Fund II portfolio.
9 PAINE SCHWARTZ PARTNERS
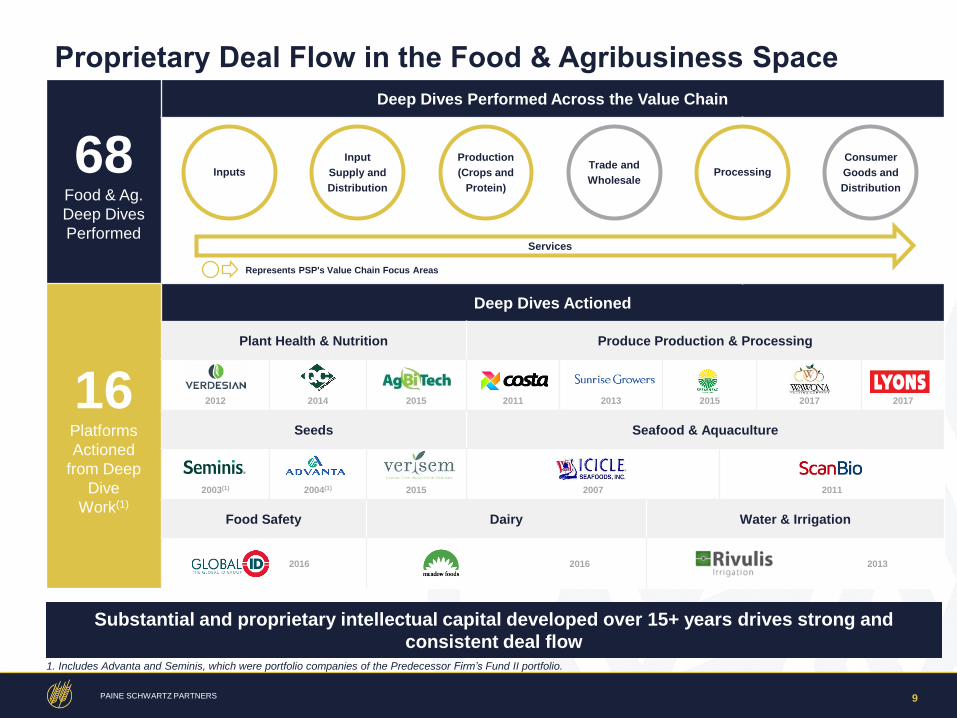
Proprietary Deal Flow in the Food & Agribusiness Space
68 Food & Ag.
Deep Dives
Performed
Deep Dives Performed Across the Value Chain
16 Platforms
Actioned
from Deep
Dive
Work(1)
Deep Dives Actioned
Plant Health & Nutrition Produce Production & Processing
2012 2014 2015 2011 2013 2015 2017 2017
Seeds Seafood & Aquaculture
2003(1) 2004(1) 2015 2007 2011
Food Safety Dairy Water & Irrigation
2016 2016 2013
Consumer
Goods and
Distribution
Processing Trade and
Wholesale
Production
(Crops and
Protein)
Input
Supply and
Distribution
Inputs
1. Includes Advanta and Seminis, which were portfolio companies of the Predecessor Firm’s Fund II portfolio.
Substantial and proprietary intellectual capital developed over 15+ years drives strong and
consistent deal flow
Services
Represents PSP's Value Chain Focus Areas
10 PAINE SCHWARTZ PARTNERS
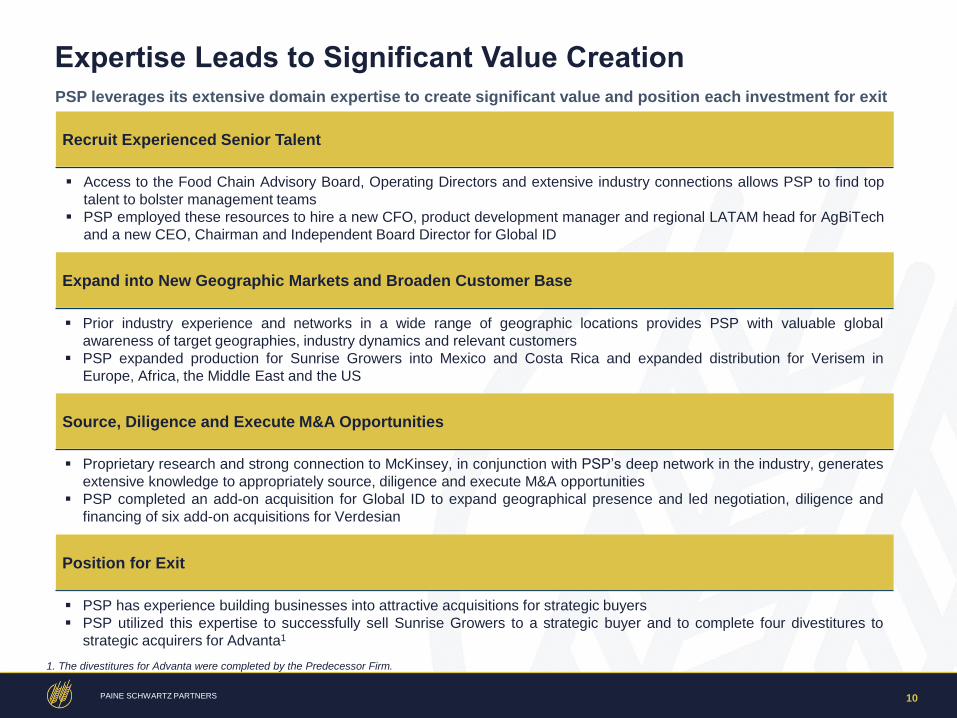
Expertise Leads to Significant Value Creation
Recruit Experienced Senior Talent
PSP leverages its extensive domain expertise to create significant value and position each investment for exit
Source, Diligence and Execute M&A Opportunities
Position for Exit
Expand into New Geographic Markets and Broaden Customer Base
Access to the Food Chain Advisory Board, Operating Directors and extensive industry connections allows PSP to find top
talent to bolster management teams
PSP employed these resources to hire a new CFO, product development manager and regional LATAM head for AgBiTech
and a new CEO, Chairman and Independent Board Director for Global ID
Prior industry experience and networks in a wide range of geographic locations provides PSP with valuable global
awareness of target geographies, industry dynamics and relevant customers
PSP expanded production for Sunrise Growers into Mexico and Costa Rica and expanded distribution for Verisem in
Europe, Africa, the Middle East and the US
PSP has experience building businesses into attractive acquisitions for strategic buyers
PSP utilized this expertise to successfully sell Sunrise Growers to a strategic buyer and to complete four divestitures to
strategic acquirers for Advanta1
Proprietary research and strong connection to McKinsey, in conjunction with PSP’s deep network in the industry, generates
extensive knowledge to appropriately source, diligence and execute M&A opportunities
PSP completed an add-on acquisition for Global ID to expand geographical presence and led negotiation, diligence and
financing of six add-on acquisitions for Verdesian
1. The divestitures for Advanta were completed by the Predecessor Firm.
11 PAINE SCHWARTZ PARTNERS
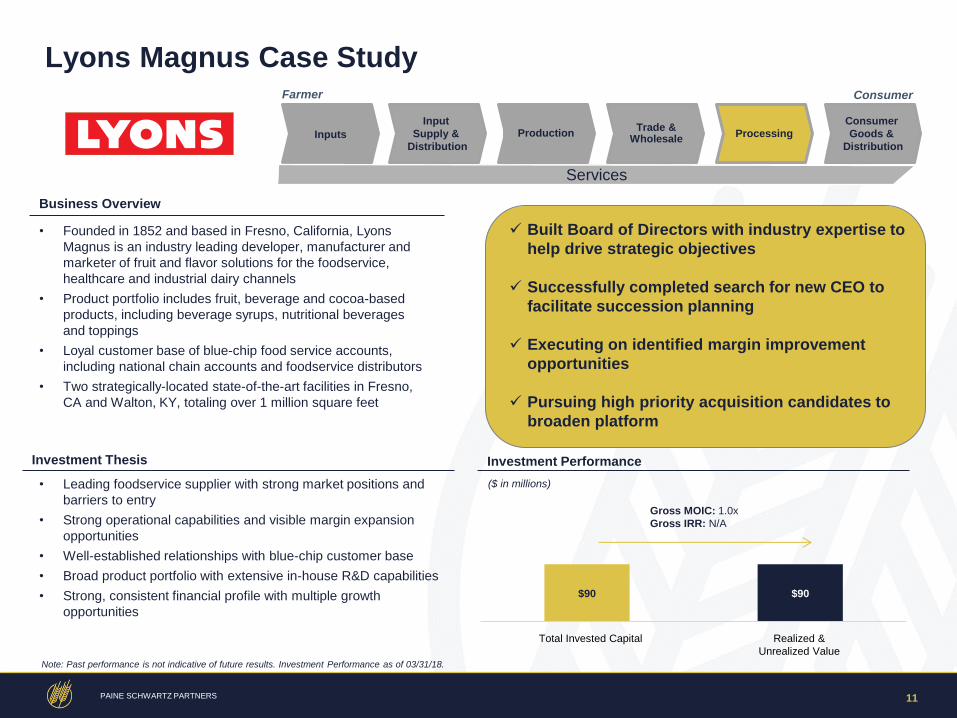
Lyons Magnus Case Study
Consumer
Goods &
Distribution Inputs
Input
Supply &
Distribution
Production Trade &
Wholesale
Investment Thesis
Business Overview
Built Board of Directors with industry expertise to
help drive strategic objectives
Successfully completed search for new CEO to
facilitate succession planning
Executing on identified margin improvement
opportunities
Pursuing high priority acquisition candidates to
broaden platform
Processing
• Founded in 1852 and based in Fresno, California, Lyons
Magnus is an industry leading developer, manufacturer and
marketer of fruit and flavor solutions for the foodservice,
healthcare and industrial dairy channels
• Product portfolio includes fruit, beverage and cocoa-based
products, including beverage syrups, nutritional beverages
and toppings
• Loyal customer base of blue-chip food service accounts,
including national chain accounts and foodservice distributors
• Two strategically-located state-of-the-art facilities in Fresno,
CA and Walton, KY, totaling over 1 million square feet
• Leading foodservice supplier with strong market positions and
barriers to entry
• Strong operational capabilities and visible margin expansion
opportunities
• Well-established relationships with blue-chip customer base
• Broad product portfolio with extensive in-house R&D capabilities
• Strong, consistent financial profile with multiple growth
opportunities
Note: Past performance is not indicative of future results. Investment Performance as of 03/31/18.
($ in millions)
Investment Performance
$90 $90
Total Invested Capital Realized &
Unrealized Value
Gross MOIC: 1.0x
Gross IRR: N/A
Farmer Consumer
Services
12 PAINE SCHWARTZ PARTNERS
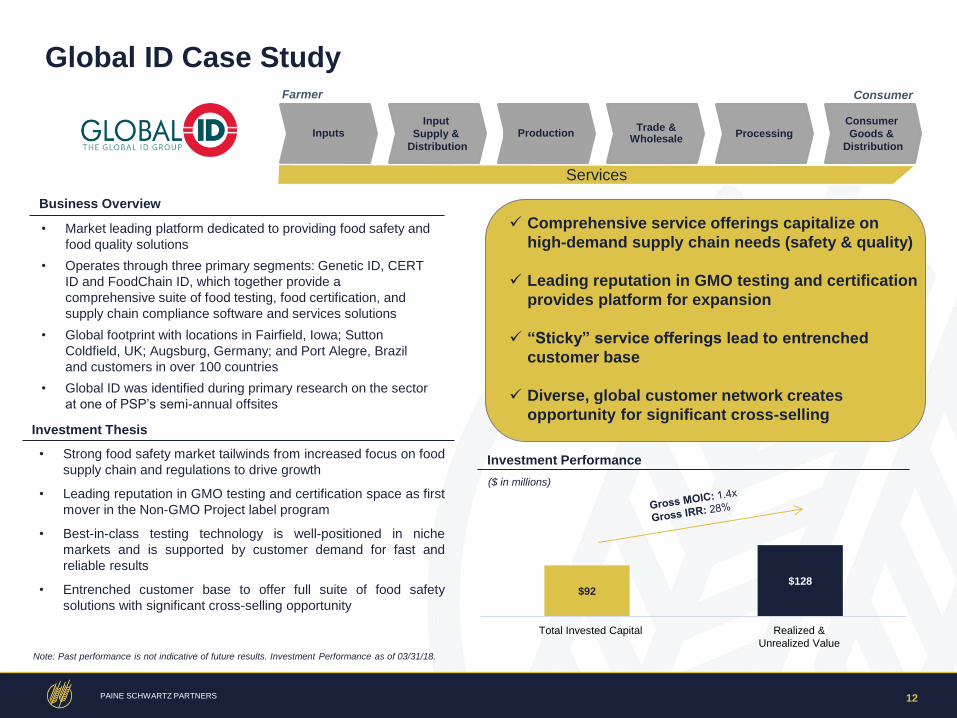
Global ID Case Study
Consumer
Goods &
Distribution
Input
Supply &
Distribution
Inputs Production Trade &
Wholesale
Farmer Consumer
Investment Thesis
Business Overview
Comprehensive service offerings capitalize on
high-demand supply chain needs (safety & quality)
Leading reputation in GMO testing and certification
provides platform for expansion
“Sticky” service offerings lead to entrenched
customer base
Diverse, global customer network creates
opportunity for significant cross-selling
Services
Processing
• Market leading platform dedicated to providing food safety and
food quality solutions
• Operates through three primary segments: Genetic ID, CERT
ID and FoodChain ID, which together provide a
comprehensive suite of food testing, food certification, and
supply chain compliance software and services solutions
• Global footprint with locations in Fairfield, Iowa; Sutton
Coldfield, UK; Augsburg, Germany; and Port Alegre, Brazil
and customers in over 100 countries
• Global ID was identified during primary research on the sector
at one of PSP’s semi-annual offsites
• Strong food safety market tailwinds from increased focus on food
supply chain and regulations to drive growth
• Leading reputation in GMO testing and certification space as first
mover in the Non-GMO Project label program
• Best-in-class testing technology is well-positioned in niche
markets and is supported by customer demand for fast and
reliable results
• Entrenched customer base to offer full suite of food safety
solutions with significant cross-selling opportunity
Note: Past performance is not indicative of future results. Investment Performance as of 03/31/18.
($ in millions)
Investment Performance
$92 $128
Total Invested Capital Realized &
Unrealized Value
13 PAINE SCHWARTZ PARTNERS
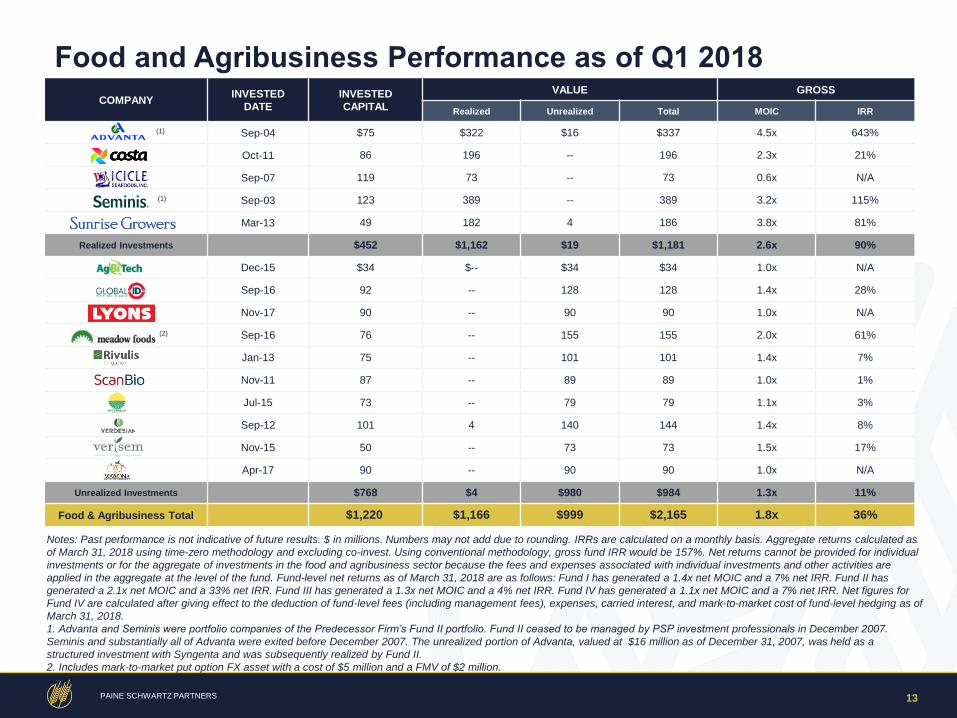
COMPANY INVESTED
DATE
INVESTED
CAPITAL
VALUE GROSS
Realized Unrealized Total MOIC IRR
(1) Sep-04 $75 $322 $16 $337 4.5x 643%
Oct-11 86 196 -- 196 2.3x 21%
Sep-07 119 73 -- 73 0.6x N/A
(1) Sep-03 123 389 -- 389 3.2x 115%
Mar-13 49 182 4 186 3.8x 81%
Realized Investments $452 $1,162 $19 $1,181 2.6x 90%
Dec-15 $34 $-- $34 $34 1.0x N/A
Sep-16 92 -- 128 128 1.4x 28%
Nov-17 90 -- 90 90 1.0x N/A
(2) Sep-16 76 -- 155 155 2.0x 61%
Jan-13 75 -- 101 101 1.4x 7%
Nov-11 87 -- 89 89 1.0x 1%
Jul-15 73 -- 79 79 1.1x 3%
Sep-12 101 4 140 144 1.4x 8%
Nov-15 50 -- 73 73 1.5x 17%
Apr-17 90 -- 90 90 1.0x N/A
Unrealized Investments $768 $4 $980 $984 1.3x 11%
Food & Agribusiness Total $1,220 $1,166 $999 $2,165 1.8x 36%
Notes: Past performance is not indicative of future results. $ in millions. Numbers may not add due to rounding. IRRs are calculated on a monthly basis. Aggregate returns calculated as
of March 31, 2018 using time-zero methodology and excluding co-invest. Using conventional methodology, gross fund IRR would be 157%. Net returns cannot be provided for individual
investments or for the aggregate of investments in the food and agribusiness sector because the fees and expenses associated with individual investments and other activities are
applied in the aggregate at the level of the fund. Fund-level net returns as of March 31, 2018 are as follows: Fund I has generated a 1.4x net MOIC and a 7% net IRR. Fund II has
generated a 2.1x net MOIC and a 33% net IRR. Fund III has generated a 1.3x net MOIC and a 4% net IRR. Fund IV has generated a 1.1x net MOIC and a 7% net IRR. Net figures for
Fund IV are calculated after giving effect to the deduction of fund-level fees (including management fees), expenses, carried interest, and mark-to-market cost of fund-level hedging as of
March 31, 2018.
1. Advanta and Seminis were portfolio companies of the Predecessor Firm’s Fund II portfolio. Fund II ceased to be managed by PSP investment professionals in December 2007.
Seminis and substantially all of Advanta were exited before December 2007. The unrealized portion of Advanta, valued at $16 million as of December 31, 2007, was held as a
structured investment with Syngenta and was subsequently realized by Fund II.
2. Includes mark-to-market put option FX asset with a cost of $5 million and a FMV of $2 million.
Food and Agribusiness Performance as of Q1 2018
14 PAINE SCHWARTZ PARTNERS
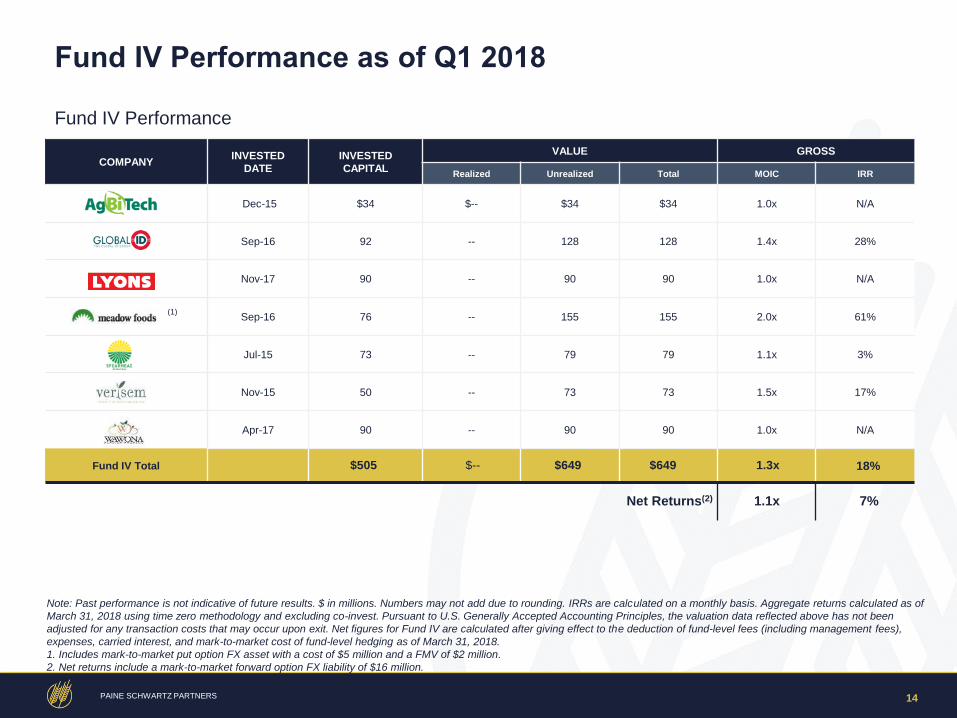
Note: Past performance is not indicative of future results. $ in millions. Numbers may not add due to rounding. IRRs are calculated on a monthly basis. Aggregate returns calculated as of
March 31, 2018 using time zero methodology and excluding co-invest. Pursuant to U.S. Generally Accepted Accounting Principles, the valuation data reflected above has not been
adjusted for any transaction costs that may occur upon exit. Net figures for Fund IV are calculated after giving effect to the deduction of fund-level fees (including management fees),
expenses, carried interest, and mark-to-market cost of fund-level hedging as of March 31, 2018.
1. Includes mark-to-market put option FX asset with a cost of $5 million and a FMV of $2 million.
2. Net returns include a mark-to-market forward option FX liability of $16 million.
Fund IV Performance as of Q1 2018
Fund IV Performance
COMPANY INVESTED
DATE
INVESTED
CAPITAL
VALUE GROSS
Realized Unrealized Total MOIC IRR
Dec-15 $34 $-- $34 $34 1.0x N/A
Sep-16 92 -- 128 128 1.4x 28%
Nov-17 90 -- 90 90 1.0x N/A
Sep-16 76 -- 155 155 2.0x 61%
Jul-15 73 -- 79 79 1.1x 3%
Nov-15 50 -- 73 73 1.5x 17%
Apr-17 90 -- 90 90 1.0x N/A
Fund IV Total $505 $-- $649 $649 1.3x 18%
Net Returns(2) 1.1x 7%
(1)
15 PAINE SCHWARTZ PARTNERS
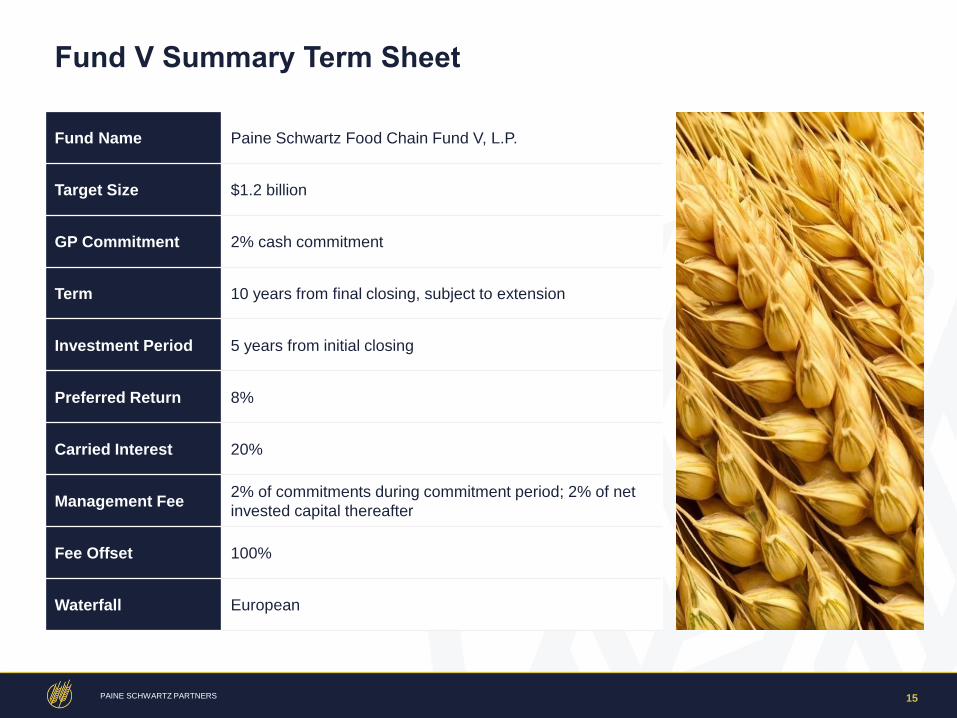
Fund Name Paine Schwartz Food Chain Fund V, L.P.
Target Size $1.2 billion
GP Commitment 2% cash commitment
Term 10 years from final closing, subject to extension
Investment Period 5 years from initial closing
Preferred Return 8%
Carried Interest 20%
Management Fee 2% of commitments during commitment period; 2% of net
invested capital thereafter
Fee Offset 100%
Waterfall European
Fund V Summary Term Sheet
16 PAINE SCHWARTZ PARTNERS
Appendix
17 PAINE SCHWARTZ PARTNERS
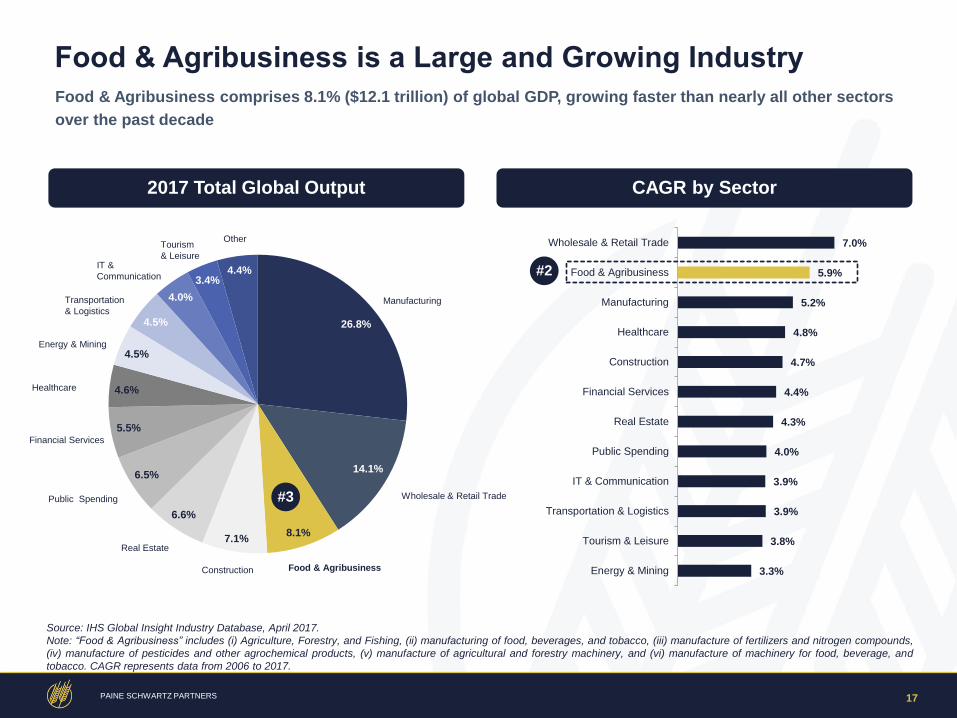
Food & Agribusiness is a Large and Growing Industry
26.8%
14.1%
8.1% 7.1%
6.6%
6.5%
5.5%
4.6%
4.5%
4.5%
4.0%
3.4% 4.4%
7.0%
5.9%
5.2%
4.8%
4.7%
4.4%
4.3%
4.0%
3.9%
3.9%
3.8%
3.3%
Wholesale & Retail Trade
Food & Agribusiness
Manufacturing
Healthcare
Construction
Financial Services
Real Estate
Public Spending
IT & Communication
Transportation & Logistics
Tourism & Leisure
Energy & Mining
2017 Total Global Output
#3
#2
Food & Agribusiness comprises 8.1% ($12.1 trillion) of global GDP, growing faster than nearly all other sectors
over the past decade
CAGR by Sector
Source: IHS Global Insight Industry Database, April 2017.
Note: “Food & Agribusiness” includes (i) Agriculture, Forestry, and Fishing, (ii) manufacturing of food, beverages, and tobacco, (iii) manufacture of fertilizers and nitrogen compounds,
(iv) manufacture of pesticides and other agrochemical products, (v) manufacture of agricultural and forestry machinery, and (vi) manufacture of machinery for food, beverage, and
tobacco. CAGR represents data from 2006 to 2017.
Wholesale & Retail Trade
Manufacturing
Food & Agribusiness Construction
Public Spending
Energy & Mining
Healthcare
Financial Services
Real Estate
Transportation
& Logistics
IT &
Communication
Other Tourism
& Leisure
18 PAINE SCHWARTZ PARTNERS
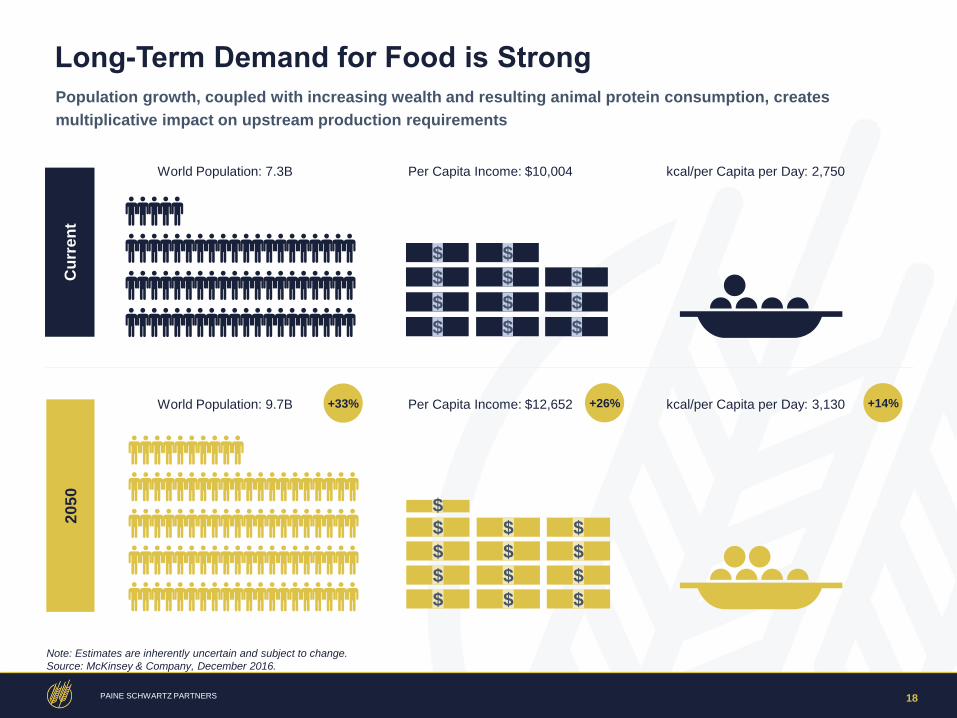
Long-Term Demand for Food is Strong
Population growth, coupled with increasing wealth and resulting animal protein consumption, creates
multiplicative impact on upstream production requirements
Cu
rre
nt
20
50
World Population: 7.3B Per Capita Income: $10,004 kcal/per Capita per Day: 2,750
World Population: 9.7B Per Capita Income: $12,652 kcal/per Capita per Day: 3,130
$
$
$
+33% +26% +14%
Note: Estimates are inherently uncertain and subject to change.
Source: McKinsey & Company, December 2016.
$ $
$ $ $
$ $ $
$ $ $
$
$ $ $
$ $ $
$ $ $
19 PAINE SCHWARTZ PARTNERS
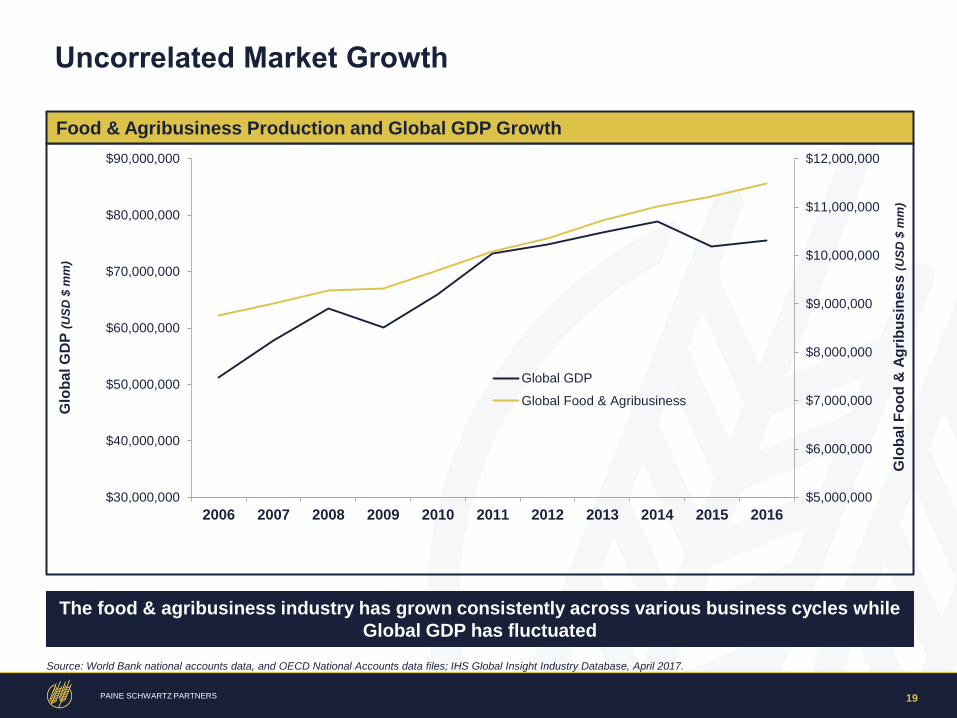
Uncorrelated Market Growth
Source: World Bank national accounts data, and OECD National Accounts data files; IHS Global Insight Industry Database, April 2017.
$5,000,000
$6,000,000
$7,000,000
$8,000,000
$9,000,000
$10,000,000
$11,000,000
$12,000,000
$30,000,000
$40,000,000
$50,000,000
$60,000,000
$70,000,000
$80,000,000
$90,000,000
2006 2007 2008 2009 2010 2011 2012 2013 2014 2015 2016
Glo
ba
l F
oo
d &
Ag
rib
us
ine
ss (
US
D $
mm
)
Glo
ba
l G
DP
(U
SD
$ m
m)
Global GDP
Global Food & Agribusiness
Food & Agribusiness Production and Global GDP Growth
The food & agribusiness industry has grown consistently across various business cycles while
Global GDP has fluctuated
20 PAINE SCHWARTZ PARTNERS
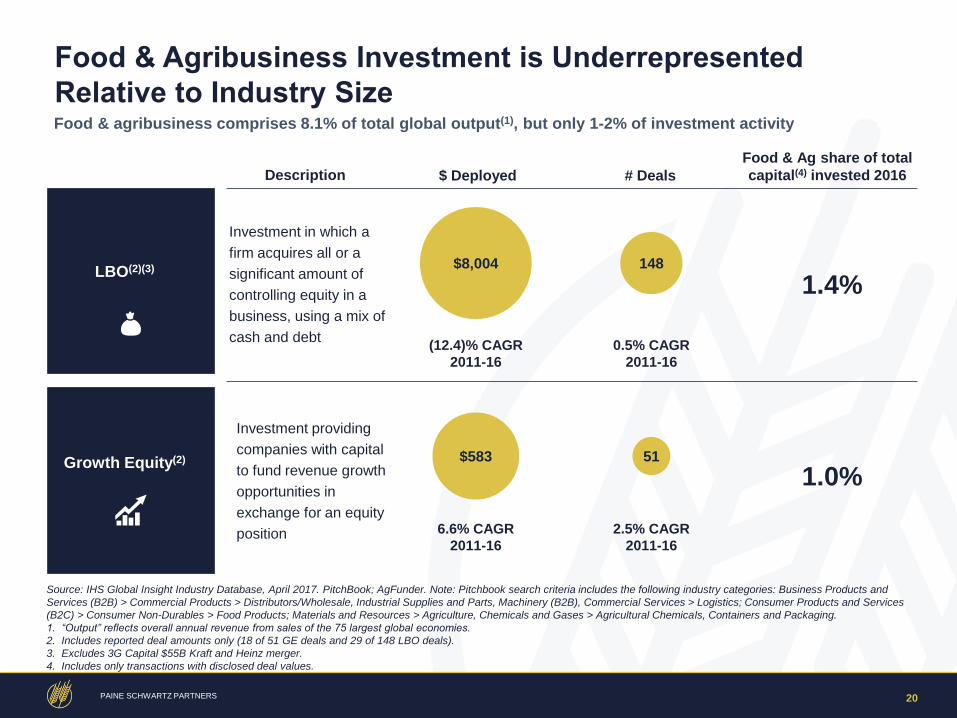
Food & agribusiness comprises 8.1% of total global output(1), but only 1-2% of investment activity
Food & Agribusiness Investment is Underrepresented
Relative to Industry Size
Growth Equity(2)
LBO(2)(3)
Source: IHS Global Insight Industry Database, April 2017. PitchBook; AgFunder. Note: Pitchbook search criteria includes the following industry categories: Business Products and
Services (B2B) > Commercial Products > Distributors/Wholesale, Industrial Supplies and Parts, Machinery (B2B), Commercial Services > Logistics; Consumer Products and Services
(B2C) > Consumer Non-Durables > Food Products; Materials and Resources > Agriculture, Chemicals and Gases > Agricultural Chemicals, Containers and Packaging.
1. “Output” reflects overall annual revenue from sales of the 75 largest global economies.
2. Includes reported deal amounts only (18 of 51 GE deals and 29 of 148 LBO deals).
3. Excludes 3G Capital $55B Kraft and Heinz merger.
4. Includes only transactions with disclosed deal values.
Investment providing
companies with capital
to fund revenue growth
opportunities in
exchange for an equity
position
Investment in which a
firm acquires all or a
significant amount of
controlling equity in a
business, using a mix of
cash and debt
Description $ Deployed # Deals
Food & Ag share of total
capital(4) invested 2016
$8,004 148
$583 51
(12.4)% CAGR
2011-16
6.6% CAGR
2011-16
0.5% CAGR
2011-16
2.5% CAGR
2011-16
1.4%
1.0%
21 PAINE SCHWARTZ PARTNERS
General Notes
In considering any performance information contained herein, prospective investors should bear in mind that past or projected performance is not necessarily indicative of future
results, and there can be no assurance that any Paine Schwartz fund will achieve comparable results or that target returns, if any, will be met. Unrealized Value, Total Value,
Gross IRR and Gross MOIC (as defined below) are for illustrative purposes only. Performance information is presented on a combined basis for the applicable fund and its
parallel investment vehicles.
Terminology and Definitions
References in this Pitchbook to (A) “Invested Capital” mean, with respect to a fund, the cash invested by the fund in its portfolio companies (co-investment is excluded unless
otherwise noted); (B) “Realized Value” includes interest and distributions, if any, as well as equity realizations, but does not give effect to fees (including management fees),
expenses and carried interest paid or to be paid by the funds; (C) “Unrealized Value” means the fair value, consistent with valuations determined in accordance with U.S.
GAAP (see “Valuation of Unrealized Investments” below); (D) “Total Value” means, with respect to a portfolio company, the sum of its Realized Value and Unrealized Value;
and (E) “Gross MOIC” means, with respect to a portfolio company a group of companies or a fund, the ratio of Total Value to Invested Capital.
Co-investment is defined as additional capital raised and invested through Fund I, Fund II, Fund III, and Fund IV affiliated vehicles. Coinvestment financial information is
determined based on the date of the co-investment and the fund in which the investment was made. Coinvestment returns are determined based on the Realized Value and
Unrealized Value of the applicable portfolio investments of the applicable fund as of the applicable valuation dates set forth above. Co-investment Unrealized Values are
determined based on the fair value of the applicable portfolio investment of the applicable fund. Co-investment IRRs are determined based on the date of the co-investment and
the fund in which the investment was made.
IRR Calculations
All IRRs include Realized Values and Unrealized Values, as applicable (see below, “Valuation Methodology” and “Valuation of Unrealized Investments”). All IRR and other
return or performance information calculations are unaudited and include all returns generated by reinvested capital and proceeds. Where used in this Offering Memorandum,
unless otherwise indicated, “Gross IRR” is the IRR before the deduction of fees (including management fees), expenses and carried interest to be borne by investors (which
amounts are expected to be substantial and, if reflected, would reduce returns). For Gross IRR calculations, “N/A” means not applicable and denotes a Gross IRR that cannot
be calculated due to negative performance (as illustrated by the respective MOIC figures) and the limitation of the XIRR function in Excel. Unless otherwise indicated, all IRRs
and other return or performance information are presented on a “Gross” basis.
Individual investment IRRs are calculated on a daily basis; all other IRRs are calculated on a monthly basis.
Paine Schwartz Partners uses the “time-zero” IRR calculation methodology to calculate returns for the food and agribusiness portfolio. Using conventional methodology, Gross
IRR would be 157%. Net figures for food and agribusiness sector investments are not available because the fees and expenses associated with individual investments and
other activities are applied in the aggregate at the level of the fund.
“Time-zero” IRR calculation methodology treats all investments as occurring at a common point in time, “time-zero.” Important characteristics of the “time-zero” methodology
are: (i) the IRR is calculated by weighting size of investment, capital returned and length of time investments are held; and (ii) the IRR calculation yields the same results
independent of the order in which the investments were made.
For example, assume that two investments of $10 are made, with the first investment made today and the second investment made one year from today. The investments are
held three years each and yield IRRs of 25% and 75%, respectively. The “time-zero” IRR of the two investments combined is 54%, regardless of which investment was
completed first. In contrast to the “time-zero” method, an IRR calculation based on the order investments were made attributes to earlier investments a higher weighting than
later investments. Continuing the above example, assuming an “order-dependent” IRR, if the 25% IRR investment is made one year prior to the 75% IRR investment, the
combined “order-dependent” IRR is 49%. Alternatively, if the 75% IRR investment is made one year prior to the 25% IRR investment, the combined “order-dependent” IRR is
59%. This methodology yields different combined IRRs despite the identical performance of the two investments.
Investment Performance Notes